THIRD POINT OFFSHORE FUND, LTD. · 2018-09-20 · Year ended December 31, 2016 1. Organization...
67
THIRD POINT OFFSHORE FUND, LTD. FINANCIAL STATEMENTS As of and for the Year Ended December 31, 2016 With Report of Independent Auditors
Transcript of THIRD POINT OFFSHORE FUND, LTD. · 2018-09-20 · Year ended December 31, 2016 1. Organization...
THIRD POINT OFFSHORE FUND, LTD.
FINANCIAL STATEMENTSAs of and for the Year Ended December 31, 2016
With Report of Independent Auditors
Contents
01 Report of Independent Auditors02 Statement of Assets and Liabilities03 Condensed Schedule of Investments04 Statement of Operations06 Statement of Changes in Net Assets07 Statement of Cash Flows08 Notes to Financial Statements
Financial Statements of Third Point Offshore Master Fund L.P.
REPORT OF INDEPENDENT AUDITORSTHIRD POINT OFFSHORE FUND, LTD.
FINANCIAL STATEMENTS 2016 1
Ernst & Young Ltd. 62 Forum Lane Camana BayP.O. Box 510Grand Cayman KY1-1106CAYMAN ISLANDS
Tel: +1 345 949 8444 Fax: +1 345 949 8529 ey.com
Report of Independent Auditors
The Board of DirectorsThird Point Offshore Fund, Ltd.
We have audited the accompanying financial statements of Third Point Offshore Fund, Ltd. whichcomprise the statement of assets and liabilities, including the condensed schedule of investments, as ofDecember 31, 2016, and the related statements of operations, changes in net assets and cash flows forthe year then ended, and the related notes to the financial statements.
Management’s Responsibility for the Financial StatementsManagement is responsible for the preparation and fair presentation of these financial statements inconformity with U.S. generally accepted accounting principles; this includes the design, implementationand maintenance of internal control relevant to the preparation and fair presentation of financialstatements that are free of material misstatement, whether due to fraud or error.
Auditor’s ResponsibilityOur responsibility is to express an opinion on these financial statements based on our audit. Weconducted our audit in accordance with auditing standards generally accepted in the United States. Thosestandards require that we plan and perform the audit to obtain reasonable assurance about whether thefinancial statements are free of material misstatement.
An audit involves performing procedures to obtain audit evidence about the amounts and disclosures inthe financial statements. The procedures selected depend on the auditor’s judgment, including theassessment of the risks of material misstatement of the financial statements, whether due to fraud orerror. In making those risk assessments, the auditor considers internal control relevant to the entity’spreparation and fair presentation of the financial statements in order to design audit procedures that areappropriate in the circumstances, but not for the purpose of expressing an opinion on the effectiveness ofthe entity’s internal control. Accordingly, we express no such opinion. An audit also includes evaluatingthe appropriateness of accounting policies used and the reasonableness of significant accountingestimates made by management, as well as evaluating the overall presentation of the financial statements.
We believe that the audit evidence we have obtained is sufficient and appropriate to provide a basis forour audit opinion.
OpinionIn our opinion, the financial statements referred to above present fairly, in all material respects, thefinancial position of Third Point Offshore Fund, Ltd. at December 31, 2016, and the results of itsoperations, changes in its net assets and its cash flows for the year then ended in conformity with U.S.generally accepted accounting principles.
March 17, 2017
A member firm of Ernst & Young Global Limited
2THIRD POINT OFFSHORE FUND, LTD.FINANCIAL STATEMENTS 2016 STATEMENT OF ASSETS AND LIABILITIES
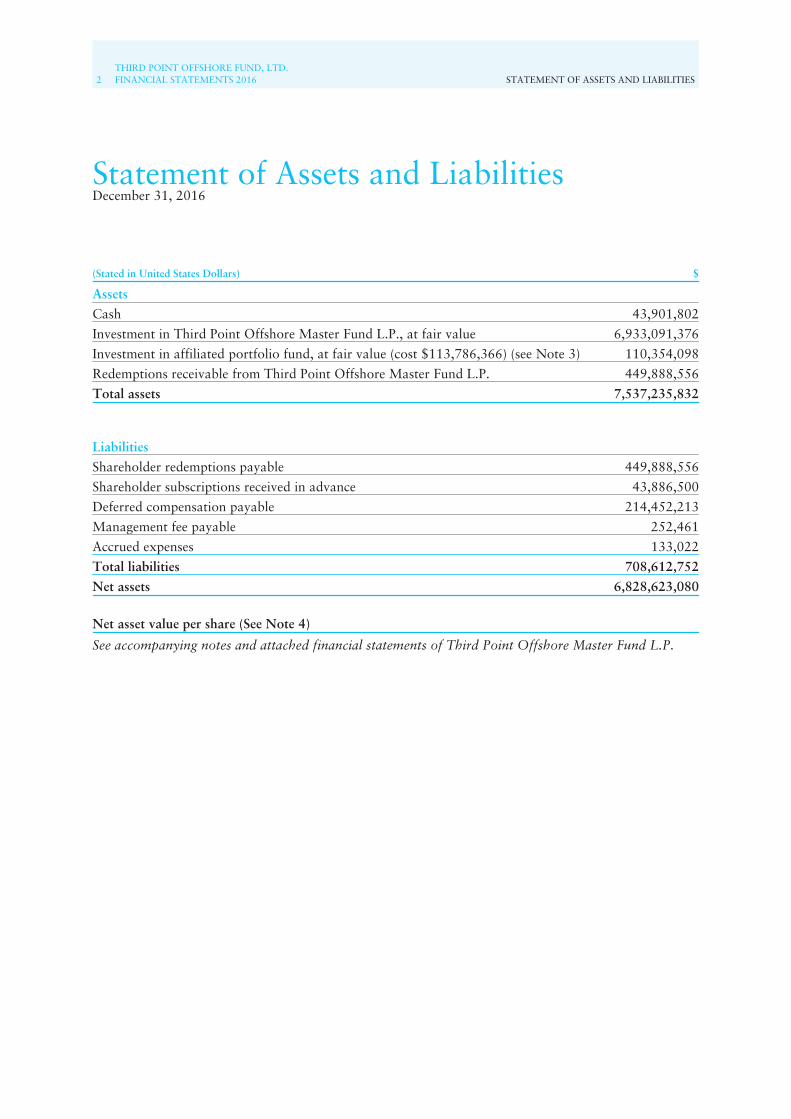
Statement of Assets and LiabilitiesDecember 31, 2016
(Stated in United States Dollars) $
Assets
Cash 43,901,802
Investment in Third Point Offshore Master Fund L.P., at fair value 6,933,091,376
Investment in affiliated portfolio fund, at fair value (cost $113,786,366) (see Note 3) 110,354,098
Redemptions receivable from Third Point Offshore Master Fund L.P. 449,888,556
Total assets 7,537,235,832
Liabilities
Shareholder redemptions payable 449,888,556
Shareholder subscriptions received in advance 43,886,500
Deferred compensation payable 214,452,213
Management fee payable 252,461
Accrued expenses 133,022
Total liabilities 708,612,752
Net assets 6,828,623,080
Net asset value per share (See Note 4)
See accompanying notes and attached financial statements of Third Point Offshore Master Fund L.P.

CONDENSED SCHEDULE OF INVESTMENTSTHIRD POINT OFFSHORE FUND, LTD.
FINANCIAL STATEMENTS 2016 3
Condensed Schedule of InvestmentsDecember 31, 2016
(Stated in United States Dollars)Description
Fair Value$
Percentage ofNet Assets
%
Investment in Third Point Offshore Master Fund L.P. 6,933,091,376 101.53
Investment in Affiliated Portfolio Fund
Latin America and the Caribbean:
Multi-Strategy 110,354,098 1.62
Total Investment in Affiliated Portfolio Fund (cost $113,786,366) 110,354,098 1.62
See accompanying notes and attached financial statements of Third Point Offshore Master Fund L.P.

4THIRD POINT OFFSHORE FUND, LTD.FINANCIAL STATEMENTS 2016 STATEMENT OF OPERATIONS
Statement of OperationsYear ended December 31, 2016
(Stated in United States Dollars) $
Realized and unrealized gain/(loss) on investment transactions allocated from Third PointOffshore Master Fund L.P.
Net realized gain from securities, affiliated funds, derivative contracts and foreigncurrency translations 222,084,997
Net change in unrealized gain on securities and foreign currency translations 283,517,319
Net change in unrealized gain on affiliated funds and foreign currency translations 2,976,578
Net change in unrealized gain on derivative contracts and foreign currency translations (22,133,392)
Net gain from currencies 7,458,468
Net realized and unrealized gain from investment transactions allocated fromThird Point Offshore Master Fund L.P. 493,903,970
Fund realized and unrealized gain/(loss) on investment
Net change in unrealized gain on affiliated portfolio fund (77,647,012)
Net realized and unrealized loss from investment (77,647,012)
Investment income allocated from Third Point Offshore Master Fund L.P.
Interest 166,232,574
Dividends, net of withholding taxes of $20,687,201 54,613,314
Stock loan fees 237,968
Other 2,630,555
Total investment income allocated from Third Point Offshore Master Fund L.P. 223,714,411
Investment expenses allocated from Third Point Offshore Master Fund L.P.
Incentive fee 79,033,970
Interest 21,833,899
Dividends on securities sold, not yet purchased 6,657,515
Stock borrow fees 3,695,562
Administrative and professional fees 9,111,464
Research fees 6,492,544
Other 5,596,039
Total investment expenses allocated from Third Point Offshore Master Fund L.P. 132,420,993
Net investment income allocated from Third Point Offshore Master Fund L.P. 91,293,418

STATEMENT OF OPERATIONSTHIRD POINT OFFSHORE FUND, LTD.
FINANCIAL STATEMENTS 2016 5
(Stated in United States Dollars) $
Fund income
Depreciation of deferred compensation 67,739,092
Total Fund income 67,739,092
Fund expenses
Management fee 145,378,094
Administrative and professional fees 200,335
Other 95,673
Total Fund expenses 145,674,102
Net fund expense (77,935,010)
Net investment income 13,358,408
Net increase in net assets resulting from operations 429,615,366
See accompanying notes and attached financial statements of Third Point Offshore Master Fund L.P.
6THIRD POINT OFFSHORE FUND, LTD.FINANCIAL STATEMENTS 2016 STATEMENT OF CHANGES IN NET ASSETS
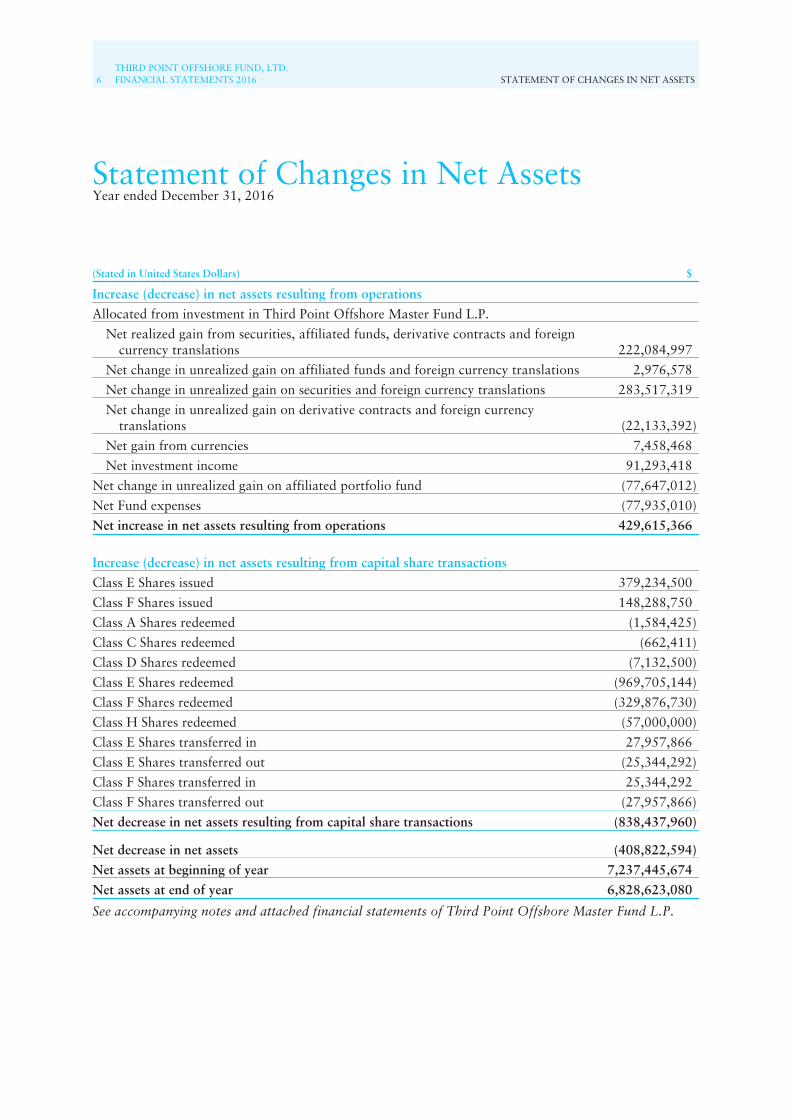
Statement of Changes in Net AssetsYear ended December 31, 2016
(Stated in United States Dollars) $
Increase (decrease) in net assets resulting from operations
Allocated from investment in Third Point Offshore Master Fund L.P.
Net realized gain from securities, affiliated funds, derivative contracts and foreigncurrency translations 222,084,997
Net change in unrealized gain on affiliated funds and foreign currency translations 2,976,578
Net change in unrealized gain on securities and foreign currency translations 283,517,319
Net change in unrealized gain on derivative contracts and foreign currencytranslations (22,133,392)
Net gain from currencies 7,458,468
Net investment income 91,293,418
Net change in unrealized gain on affiliated portfolio fund (77,647,012)
Net Fund expenses (77,935,010)
Net increase in net assets resulting from operations 429,615,366
Increase (decrease) in net assets resulting from capital share transactions
Class E Shares issued 379,234,500
Class F Shares issued 148,288,750
Class A Shares redeemed (1,584,425)
Class C Shares redeemed (662,411)
Class D Shares redeemed (7,132,500)
Class E Shares redeemed (969,705,144)
Class F Shares redeemed (329,876,730)
Class H Shares redeemed (57,000,000)
Class E Shares transferred in 27,957,866
Class E Shares transferred out (25,344,292)
Class F Shares transferred in 25,344,292
Class F Shares transferred out (27,957,866)
Net decrease in net assets resulting from capital share transactions (838,437,960)
Net decrease in net assets (408,822,594)
Net assets at beginning of year 7,237,445,674
Net assets at end of year 6,828,623,080
See accompanying notes and attached financial statements of Third Point Offshore Master Fund L.P.
STATEMENT OF CASH FLOWSTHIRD POINT OFFSHORE FUND, LTD.
FINANCIAL STATEMENTS 2016 7
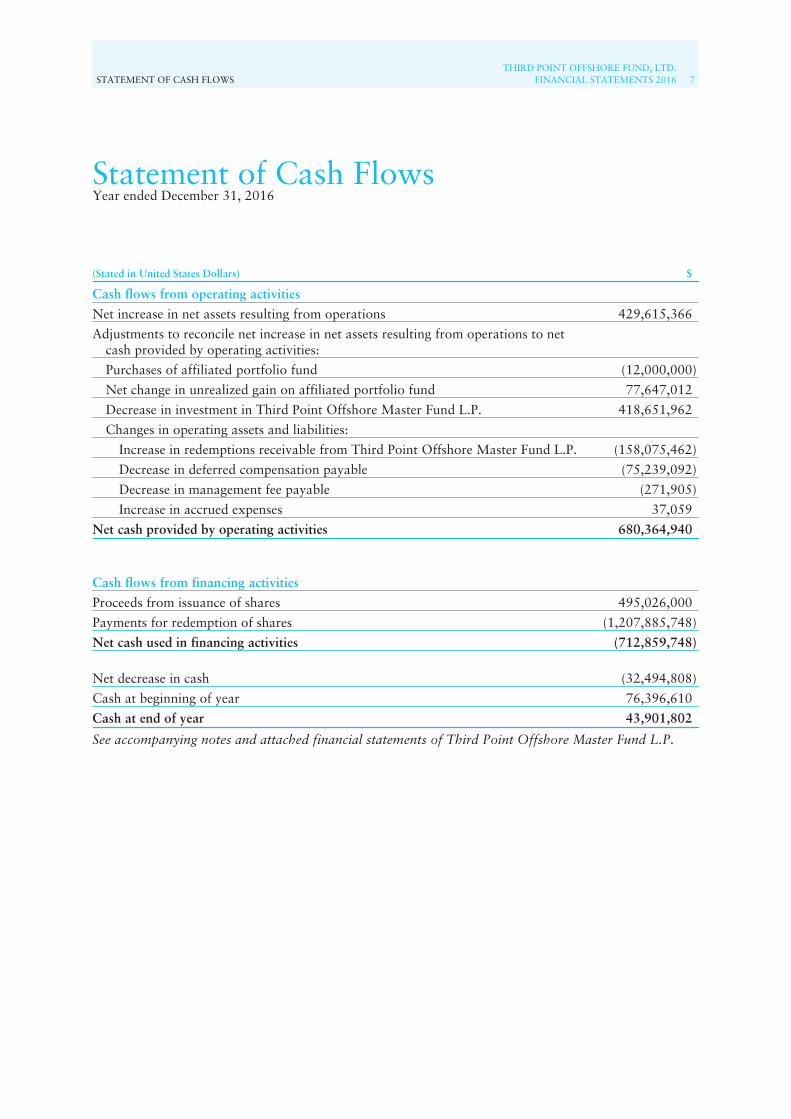
Statement of Cash FlowsYear ended December 31, 2016
(Stated in United States Dollars) $
Cash flows from operating activities
Net increase in net assets resulting from operations 429,615,366
Adjustments to reconcile net increase in net assets resulting from operations to netcash provided by operating activities:
Purchases of affiliated portfolio fund (12,000,000)
Net change in unrealized gain on affiliated portfolio fund 77,647,012
Decrease in investment in Third Point Offshore Master Fund L.P. 418,651,962
Changes in operating assets and liabilities:
Increase in redemptions receivable from Third Point Offshore Master Fund L.P. (158,075,462)
Decrease in deferred compensation payable (75,239,092)
Decrease in management fee payable (271,905)
Increase in accrued expenses 37,059
Net cash provided by operating activities 680,364,940
Cash flows from financing activities
Proceeds from issuance of shares 495,026,000
Payments for redemption of shares (1,207,885,748)
Net cash used in financing activities (712,859,748)
Net decrease in cash (32,494,808)
Cash at beginning of year 76,396,610
Cash at end of year 43,901,802
See accompanying notes and attached financial statements of Third Point Offshore Master Fund L.P.
8THIRD POINT OFFSHORE FUND, LTD.FINANCIAL STATEMENTS 2016 NOTES TO FINANCIAL STATEMENTS
Notes to Financial StatementsYear ended December 31, 2016
1. OrganizationThird Point Offshore Fund, Ltd. (the “Fund”) was incorporated under the laws of the Cayman Islandson October 21, 1996, commenced operations on December 1, 1996 and is registered under the CaymanIslands Mutual Funds Law and with the Cayman Islands Monetary Authority. The Fund’s objective is toseek to generate consistent long-term capital appreciation.
The Fund invests substantially all of its net assets in Third Point Offshore Master Fund L.P., anexempted limited partnership formed under the laws of the Cayman Islands (the “Master Partnership”),which, in turn conducts substantially all investment and trading activities on behalf of the Fund. ThirdPoint Advisors II L.L.C. (the “General Partner”), a limited liability company formed under the laws ofthe State of Delaware and an affiliate of Third Point LLC, serves as the general partner of the MasterPartnership.
Third Point LLC (the “Investment Manager”) is the Investment Manager of the Fund and the MasterPartnership. The Investment Manager is registered with the Securities and Exchange Commission as anInvestment Adviser under the Investment Advisers Act of 1940. The Investment Manager is responsiblefor the operation and management of the Fund.
The Fund is an investment company and applies specialized accounting guidance as outlined in FinancialServices – Investment Companies (Topic 946). The Investment Manager evaluated this guidance anddetermined that the Fund meets the criteria to be classified as an investment company. Accordingly, theFund reflects its investments in the Statement of Assets and Liabilities at their estimated fair value, withunrealized gains and losses resulting from changes in fair value, if any, reflected in net change inunrealized gain/loss on securities, affiliated portfolio fund, affiliated funds, derivative contracts andforeign currency translations in the Statement of Operations.
International Fund Services (Ireland) Limited serves as the administrator (the “Administrator”) andtransfer agent to the Fund.
2. Significant Accounting PoliciesThe Fund’s financial statements have been prepared in accordance with U.S. generally acceptedaccounting principles (“U.S. GAAP”) and are expressed in United States dollars. The following is asummary of the significant accounting and reporting policies:
The Fund is exempt from all forms of taxation in the Cayman Islands, including income, capital gainsand withholding taxes. In jurisdictions other than the Cayman Islands, in some cases foreign taxes will bewithheld at source on dividends and certain interest received by the Fund. Capital gains derived by theFund in such jurisdictions generally will be exempt from foreign income or withholding taxes at thesource.
The Investment Manager has reviewed the Fund’s tax positions in accordance with Accounting forUncertainty in Income Taxes and has concluded that no material provision for income tax is required inthe Fund’s financial statements. Generally, the Fund is subject to income tax examinations by majortaxing authorities including United States and other authorities for open tax years since inception.
The Fund would recognize interest and penalties, if any, related to unrecognized tax positions as incometax expense in the Statement of Operations. During the year ended December 31, 2016, the Fund did notincur any interest or penalties.
See attached financial statements of Third Point Offshore Master Fund L.P.
NOTES TO FINANCIAL STATEMENTSTHIRD POINT OFFSHORE FUND, LTD.
FINANCIAL STATEMENTS 2016 9
2. Significant Accounting Policies (continued)The Fund records securities transactions and related income and expense on a trade-date basis. Realizedgains and losses are determined using cost calculated on a specific identification basis. Dividends arerecorded on the ex-dividend date. Income and expenses, including interest income and expenses, arerecorded on the accrual basis.
The fair value of the Fund’s assets and liabilities, which qualify as financial instruments, approximatesthe carrying amounts presented in the Statement of Assets and Liabilities.
The preparation of financial statements in conformity with U.S. GAAP requires management to makeestimates and assumptions that affect the amounts and disclosures in the financial statements andaccompanying notes. Actual results could differ from these estimates.
The Fund’s investment in the Master Partnership is valued at fair value, which is represented by theFund’s proportionate interest in the Partners’ Capital of the Master Partnership, which was$6,933,091,376 at December 31, 2016. The fair value represents the amount the Fund would expect toreceive at December 31, 2016 if it were to liquidate its investment in the Master Partnership. The percentof the Master Partnership owned by the Fund at December 31, 2016 was approximately 99.45%. TheFund’s allocated share of each item of the Master Partnership’s income and expense is reflected in theaccompanying Statement of Operations. The performance of the Fund is directly affected by theperformance of the Master Partnership and is subject to the same risks to which the Master Partnershipis subject. Attached are the audited financial statements of the Master Partnership.
Valuation of investments held by the Master Partnership is discussed in the notes to the MasterPartnership’s audited financial statements. The Fund records monthly its proportionate share of theMaster Partnership’s income, expenses, and realized and unrealized gains and losses. In addition, theFund accrues its own income and expenses. The Fund records subscriptions and redemptions related toits investment in the Master Partnership on the transaction date.
The investment in affiliated portfolio fund is valued at fair value. Fair value is defined as the price thatthe Fund would receive to sell an asset or pay to transfer a liability in an orderly transaction betweenmarket participants at the measurement date. The disclosure requirements also establish a framework formeasuring fair value, and a three-level hierarchy for fair value measurements based upon thetransparency of inputs to the valuation of an asset or liability. The three-tier hierarchy of inputs issummarized below:
• Level 1 – Quoted prices available in active markets/exchanges for identical investments as of thereporting date. The types of assets and liabilities that are classified at this level generally include listedinvestment funds.
• Level 2 – Pricing inputs other than observable inputs including but not limited to prices quoted forsimilar assets or liabilities in active markets/exchanges or prices quoted for identical or similar assets orliabilities in markets that are not active, and fair value is determined through the use of models or othervaluation methodologies. The types of assets and liabilities that are classified at this level generallyinclude non-exchange listed investment funds with immediate liquidity.
• Level 3 – Pricing inputs are unobservable due to little, if any, market activity for the investment. Theinputs into determination of fair value require significant management judgment and estimation. Thetypes of assets and liabilities that are classified at this level generally include non-exchange traded illiquidinvestment funds.
See attached financial statements of Third Point Offshore Master Fund L.P.
10THIRD POINT OFFSHORE FUND, LTD.FINANCIAL STATEMENTS 2016 NOTES TO FINANCIAL STATEMENTS
Notes to Financial Statements continuedYear ended December 31, 2016
2. Significant Accounting Policies (continued)Inputs refer broadly to the assumptions that market participants would use in pricing the asset orliability, including assumptions about risk, for example, the risk inherent in a particular valuationtechnique used to measure fair value including such a pricing model and/or the risk inherent in the inputsto the valuation technique. Inputs may be observable or unobservable.
Observable inputs are inputs that reflect the assumptions market participants would use in pricing theasset or liability based on market data obtained from sources independent of the reporting entity.Unobservable inputs are inputs that reflect the reporting entity’s own assumptions about the assumptionsmarket participants would use in pricing the asset or liability developed based on the best informationavailable in the circumstances.
In certain cases, the inputs used to measure fair value may fall into different levels of the fair valuehierarchy. In such cases, an investment’s level within the fair value hierarchy is based on the lowest levelof input that is significant to the fair value measurement. The Investment Manager’s assessment of thesignificance of a particular input to the fair value measurement in its entirety requires judgment, andconsiders factors specific to the investment.
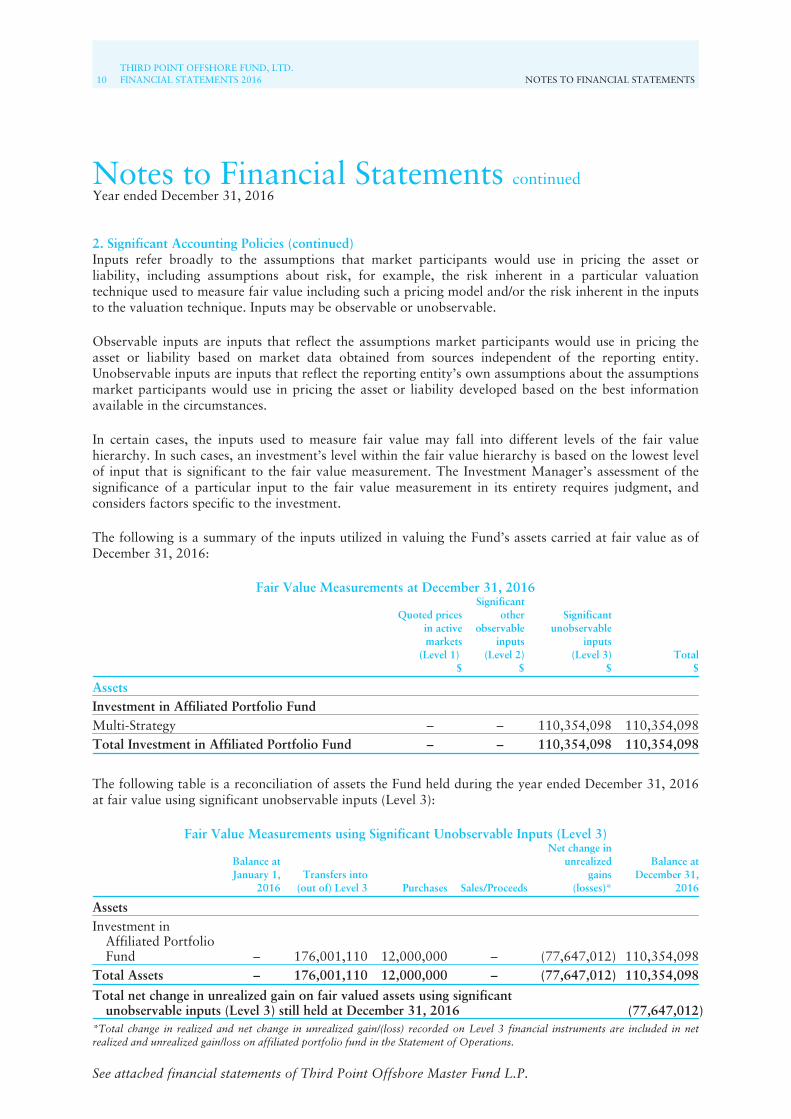
The following is a summary of the inputs utilized in valuing the Fund’s assets carried at fair value as ofDecember 31, 2016:
Fair Value Measurements at December 31, 2016
Quoted pricesin activemarkets
(Level 1)$
Significantother
observableinputs
(Level 2)$
Significantunobservable
inputs(Level 3)
$Total
$
AssetsInvestment in Affiliated Portfolio FundMulti-Strategy – – 110,354,098 110,354,098Total Investment in Affiliated Portfolio Fund – – 110,354,098 110,354,098
The following table is a reconciliation of assets the Fund held during the year ended December 31, 2016at fair value using significant unobservable inputs (Level 3):
Fair Value Measurements using Significant Unobservable Inputs (Level 3)
Balance atJanuary 1,
2016Transfers into
(out of) Level 3 Purchases Sales/Proceeds
Net change inunrealized
gains(losses)*
Balance atDecember 31,
2016
AssetsInvestment in
Affiliated PortfolioFund – 176,001,110 12,000,000 – (77,647,012) 110,354,098
Total Assets – 176,001,110 12,000,000 – (77,647,012) 110,354,098
Total net change in unrealized gain on fair valued assets using significantunobservable inputs (Level 3) still held at December 31, 2016 (77,647,012)
*Total change in realized and net change in unrealized gain/(loss) recorded on Level 3 financial instruments are included in netrealized and unrealized gain/loss on affiliated portfolio fund in the Statement of Operations.
See attached financial statements of Third Point Offshore Master Fund L.P.
NOTES TO FINANCIAL STATEMENTSTHIRD POINT OFFSHORE FUND, LTD.
FINANCIAL STATEMENTS 2016 11
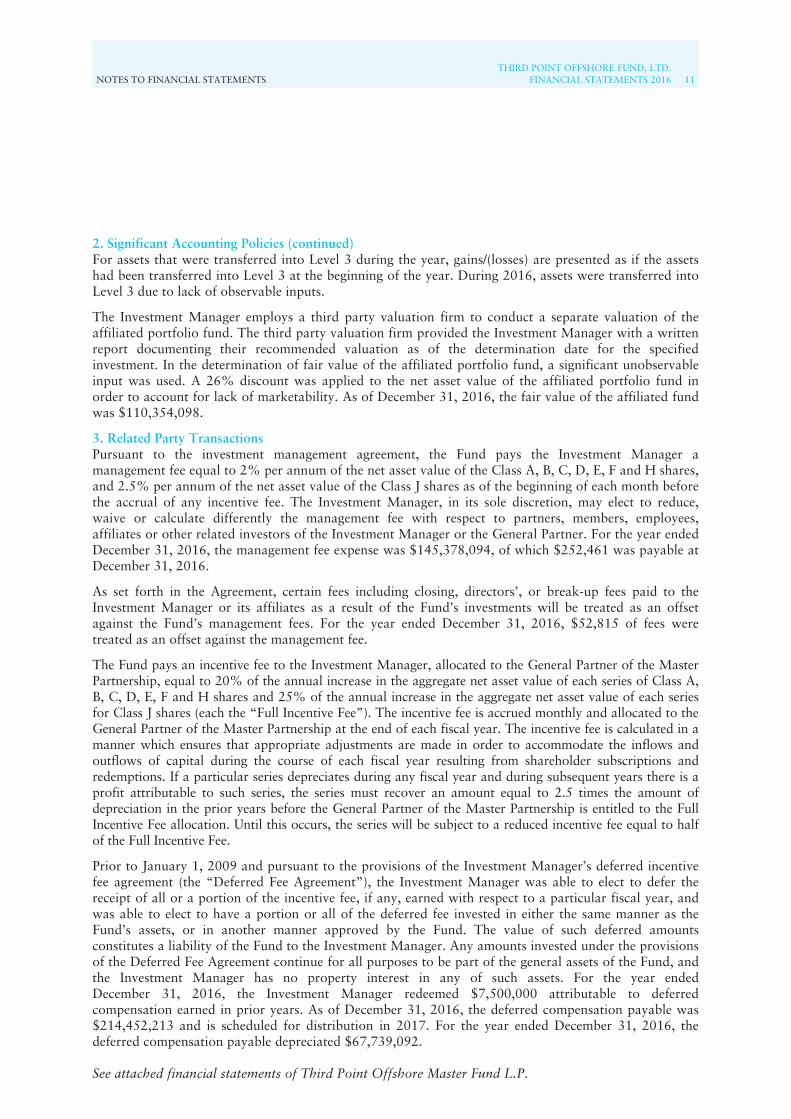
2. Significant Accounting Policies (continued)For assets that were transferred into Level 3 during the year, gains/(losses) are presented as if the assetshad been transferred into Level 3 at the beginning of the year. During 2016, assets were transferred intoLevel 3 due to lack of observable inputs.
The Investment Manager employs a third party valuation firm to conduct a separate valuation of theaffiliated portfolio fund. The third party valuation firm provided the Investment Manager with a writtenreport documenting their recommended valuation as of the determination date for the specifiedinvestment. In the determination of fair value of the affiliated portfolio fund, a significant unobservableinput was used. A 26% discount was applied to the net asset value of the affiliated portfolio fund inorder to account for lack of marketability. As of December 31, 2016, the fair value of the affiliated fundwas $110,354,098.
3. Related Party TransactionsPursuant to the investment management agreement, the Fund pays the Investment Manager amanagement fee equal to 2% per annum of the net asset value of the Class A, B, C, D, E, F and H shares,and 2.5% per annum of the net asset value of the Class J shares as of the beginning of each month beforethe accrual of any incentive fee. The Investment Manager, in its sole discretion, may elect to reduce,waive or calculate differently the management fee with respect to partners, members, employees,affiliates or other related investors of the Investment Manager or the General Partner. For the year endedDecember 31, 2016, the management fee expense was $145,378,094, of which $252,461 was payable atDecember 31, 2016.
As set forth in the Agreement, certain fees including closing, directors’, or break-up fees paid to theInvestment Manager or its affiliates as a result of the Fund’s investments will be treated as an offsetagainst the Fund’s management fees. For the year ended December 31, 2016, $52,815 of fees weretreated as an offset against the management fee.
The Fund pays an incentive fee to the Investment Manager, allocated to the General Partner of the MasterPartnership, equal to 20% of the annual increase in the aggregate net asset value of each series of Class A,B, C, D, E, F and H shares and 25% of the annual increase in the aggregate net asset value of each seriesfor Class J shares (each the “Full Incentive Fee”). The incentive fee is accrued monthly and allocated to theGeneral Partner of the Master Partnership at the end of each fiscal year. The incentive fee is calculated in amanner which ensures that appropriate adjustments are made in order to accommodate the inflows andoutflows of capital during the course of each fiscal year resulting from shareholder subscriptions andredemptions. If a particular series depreciates during any fiscal year and during subsequent years there is aprofit attributable to such series, the series must recover an amount equal to 2.5 times the amount ofdepreciation in the prior years before the General Partner of the Master Partnership is entitled to the FullIncentive Fee allocation. Until this occurs, the series will be subject to a reduced incentive fee equal to halfof the Full Incentive Fee.
Prior to January 1, 2009 and pursuant to the provisions of the Investment Manager’s deferred incentivefee agreement (the “Deferred Fee Agreement”), the Investment Manager was able to elect to defer thereceipt of all or a portion of the incentive fee, if any, earned with respect to a particular fiscal year, andwas able to elect to have a portion or all of the deferred fee invested in either the same manner as theFund’s assets, or in another manner approved by the Fund. The value of such deferred amountsconstitutes a liability of the Fund to the Investment Manager. Any amounts invested under the provisionsof the Deferred Fee Agreement continue for all purposes to be part of the general assets of the Fund, andthe Investment Manager has no property interest in any of such assets. For the year endedDecember 31, 2016, the Investment Manager redeemed $7,500,000 attributable to deferredcompensation earned in prior years. As of December 31, 2016, the deferred compensation payable was$214,452,213 and is scheduled for distribution in 2017. For the year ended December 31, 2016, thedeferred compensation payable depreciated $67,739,092.
See attached financial statements of Third Point Offshore Master Fund L.P.
12THIRD POINT OFFSHORE FUND, LTD.FINANCIAL STATEMENTS 2016 NOTES TO FINANCIAL STATEMENTS
Notes to Financial Statements continuedYear ended December 31, 2016
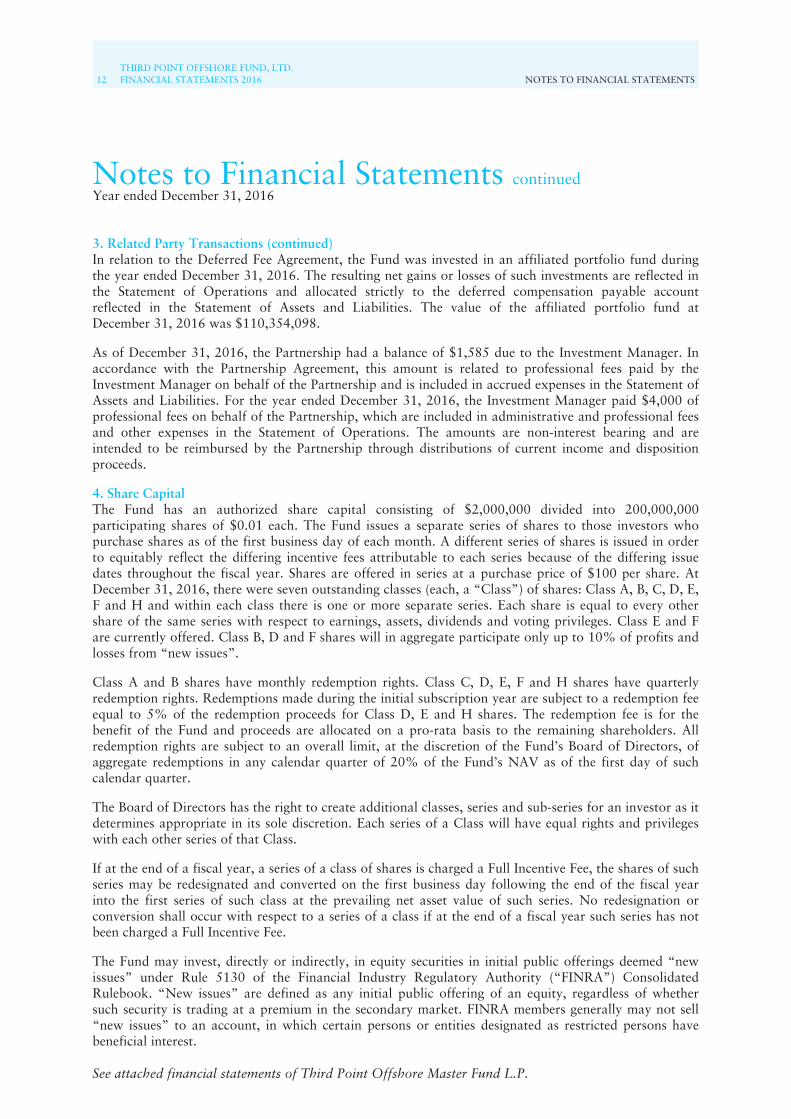
3. Related Party Transactions (continued)In relation to the Deferred Fee Agreement, the Fund was invested in an affiliated portfolio fund duringthe year ended December 31, 2016. The resulting net gains or losses of such investments are reflected inthe Statement of Operations and allocated strictly to the deferred compensation payable accountreflected in the Statement of Assets and Liabilities. The value of the affiliated portfolio fund atDecember 31, 2016 was $110,354,098.
As of December 31, 2016, the Partnership had a balance of $1,585 due to the Investment Manager. Inaccordance with the Partnership Agreement, this amount is related to professional fees paid by theInvestment Manager on behalf of the Partnership and is included in accrued expenses in the Statement ofAssets and Liabilities. For the year ended December 31, 2016, the Investment Manager paid $4,000 ofprofessional fees on behalf of the Partnership, which are included in administrative and professional feesand other expenses in the Statement of Operations. The amounts are non-interest bearing and areintended to be reimbursed by the Partnership through distributions of current income and dispositionproceeds.
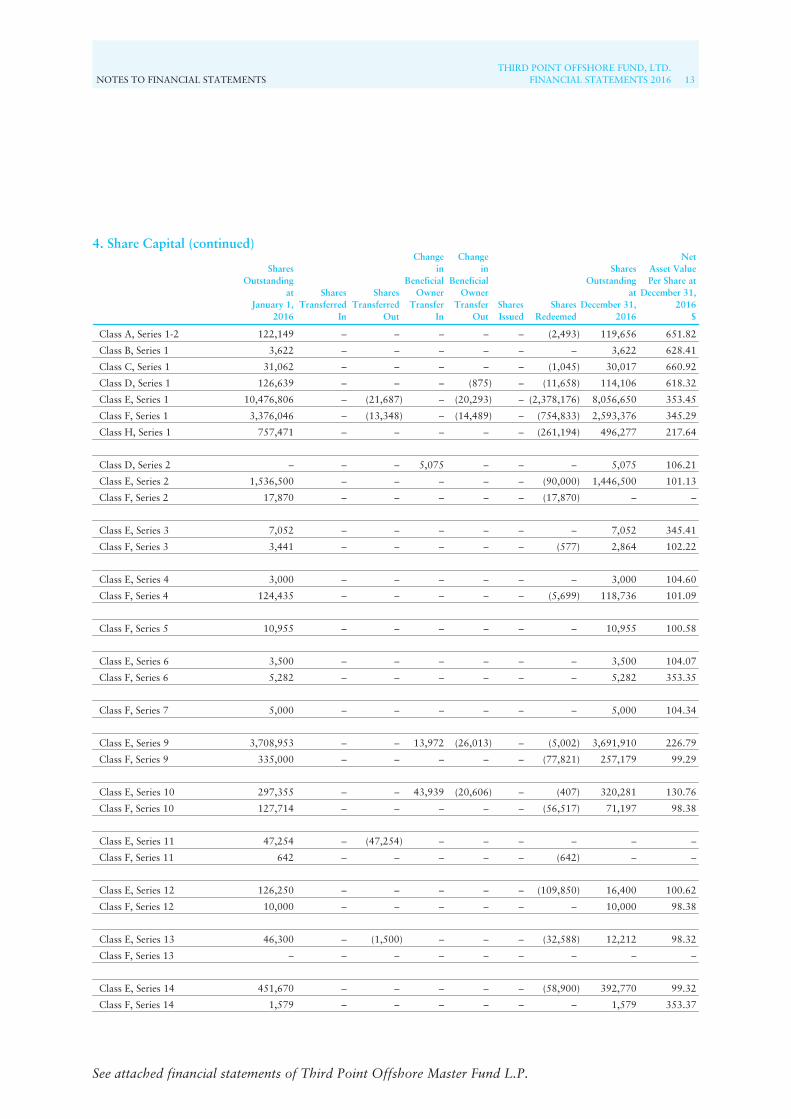
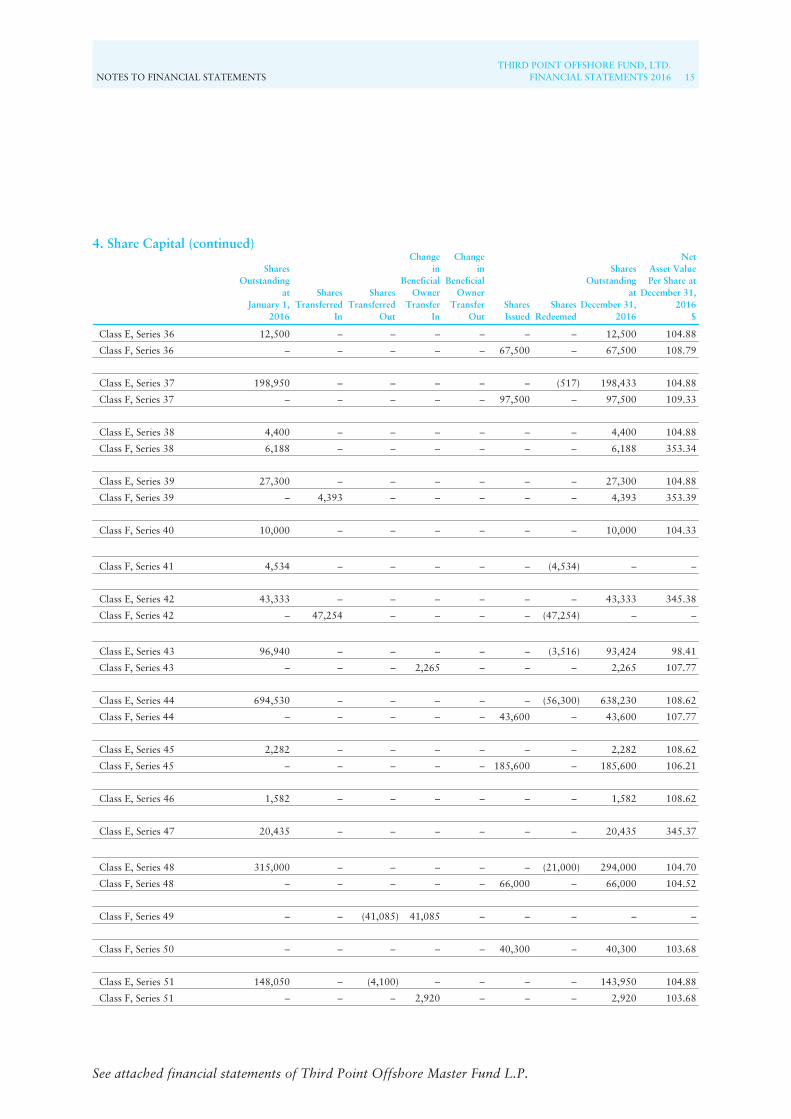
4. Share CapitalThe Fund has an authorized share capital consisting of $2,000,000 divided into 200,000,000participating shares of $0.01 each. The Fund issues a separate series of shares to those investors whopurchase shares as of the first business day of each month. A different series of shares is issued in orderto equitably reflect the differing incentive fees attributable to each series because of the differing issuedates throughout the fiscal year. Shares are offered in series at a purchase price of $100 per share. AtDecember 31, 2016, there were seven outstanding classes (each, a “Class”) of shares: Class A, B, C, D, E,F and H and within each class there is one or more separate series. Each share is equal to every othershare of the same series with respect to earnings, assets, dividends and voting privileges. Class E and Fare currently offered. Class B, D and F shares will in aggregate participate only up to 10% of profits andlosses from “new issues”.
Class A and B shares have monthly redemption rights. Class C, D, E, F and H shares have quarterlyredemption rights. Redemptions made during the initial subscription year are subject to a redemption feeequal to 5% of the redemption proceeds for Class D, E and H shares. The redemption fee is for thebenefit of the Fund and proceeds are allocated on a pro-rata basis to the remaining shareholders. Allredemption rights are subject to an overall limit, at the discretion of the Fund’s Board of Directors, ofaggregate redemptions in any calendar quarter of 20% of the Fund’s NAV as of the first day of suchcalendar quarter.
The Board of Directors has the right to create additional classes, series and sub-series for an investor as itdetermines appropriate in its sole discretion. Each series of a Class will have equal rights and privilegeswith each other series of that Class.
If at the end of a fiscal year, a series of a class of shares is charged a Full Incentive Fee, the shares of suchseries may be redesignated and converted on the first business day following the end of the fiscal yearinto the first series of such class at the prevailing net asset value of such series. No redesignation orconversion shall occur with respect to a series of a class if at the end of a fiscal year such series has notbeen charged a Full Incentive Fee.
The Fund may invest, directly or indirectly, in equity securities in initial public offerings deemed “newissues” under Rule 5130 of the Financial Industry Regulatory Authority (“FINRA”) ConsolidatedRulebook. “New issues” are defined as any initial public offering of an equity, regardless of whethersuch security is trading at a premium in the secondary market. FINRA members generally may not sell“new issues” to an account, in which certain persons or entities designated as restricted persons havebeneficial interest.
See attached financial statements of Third Point Offshore Master Fund L.P.
NOTES TO FINANCIAL STATEMENTSTHIRD POINT OFFSHORE FUND, LTD.
FINANCIAL STATEMENTS 2016 13
See attached financial statements of Third Point Offshore Master Fund L.P.
SharesOutstanding
atJanuary 1,
2016
SharesTransferred
In
SharesTransferred
Out
Changein
BeneficialOwner
TransferIn
Changein
BeneficialOwner
TransferOut
SharesIssued
SharesRedeemed
SharesOutstanding
atDecember 31,
2016
NetAsset ValuePer Share at
December 31,2016
$
Class A, Series 1-2 122,149 – – – – – (2,493) 119,656 651.82
Class B, Series 1 3,622 – – – – – – 3,622 628.41
Class C, Series 1 31,062 – – – – – (1,045) 30,017 660.92
Class D, Series 1 126,639 – – – (875) – (11,658) 114,106 618.32
Class E, Series 1 10,476,806 – (21,687) – (20,293) – (2,378,176) 8,056,650 353.45
Class F, Series 1 3,376,046 – (13,348) – (14,489) – (754,833) 2,593,376 345.29
Class H, Series 1 757,471 – – – – – (261,194) 496,277 217.64
Class D, Series 2 – – – 5,075 – – – 5,075 106.21
Class E, Series 2 1,536,500 – – – – – (90,000) 1,446,500 101.13
Class F, Series 2 17,870 – – – – – (17,870) – –
Class E, Series 3 7,052 – – – – – – 7,052 345.41
Class F, Series 3 3,441 – – – – – (577) 2,864 102.22
Class E, Series 4 3,000 – – – – – – 3,000 104.60
Class F, Series 4 124,435 – – – – – (5,699) 118,736 101.09
Class F, Series 5 10,955 – – – – – – 10,955 100.58
Class E, Series 6 3,500 – – – – – – 3,500 104.07
Class F, Series 6 5,282 – – – – – – 5,282 353.35
Class F, Series 7 5,000 – – – – – – 5,000 104.34
Class E, Series 9 3,708,953 – – 13,972 (26,013) – (5,002) 3,691,910 226.79
Class F, Series 9 335,000 – – – – – (77,821) 257,179 99.29
Class E, Series 10 297,355 – – 43,939 (20,606) – (407) 320,281 130.76
Class F, Series 10 127,714 – – – – – (56,517) 71,197 98.38
Class E, Series 11 47,254 – (47,254) – – – – – –
Class F, Series 11 642 – – – – – (642) – –
Class E, Series 12 126,250 – – – – – (109,850) 16,400 100.62
Class F, Series 12 10,000 – – – – – – 10,000 98.38
Class E, Series 13 46,300 – (1,500) – – – (32,588) 12,212 98.32
Class F, Series 13 – – – – – – – – –
Class E, Series 14 451,670 – – – – – (58,900) 392,770 99.32
Class F, Series 14 1,579 – – – – – – 1,579 353.37
4. Share Capital (continued)
14THIRD POINT OFFSHORE FUND, LTD.FINANCIAL STATEMENTS 2016 NOTES TO FINANCIAL STATEMENTS
Notes to Financial Statements continuedYear ended December 31, 2016
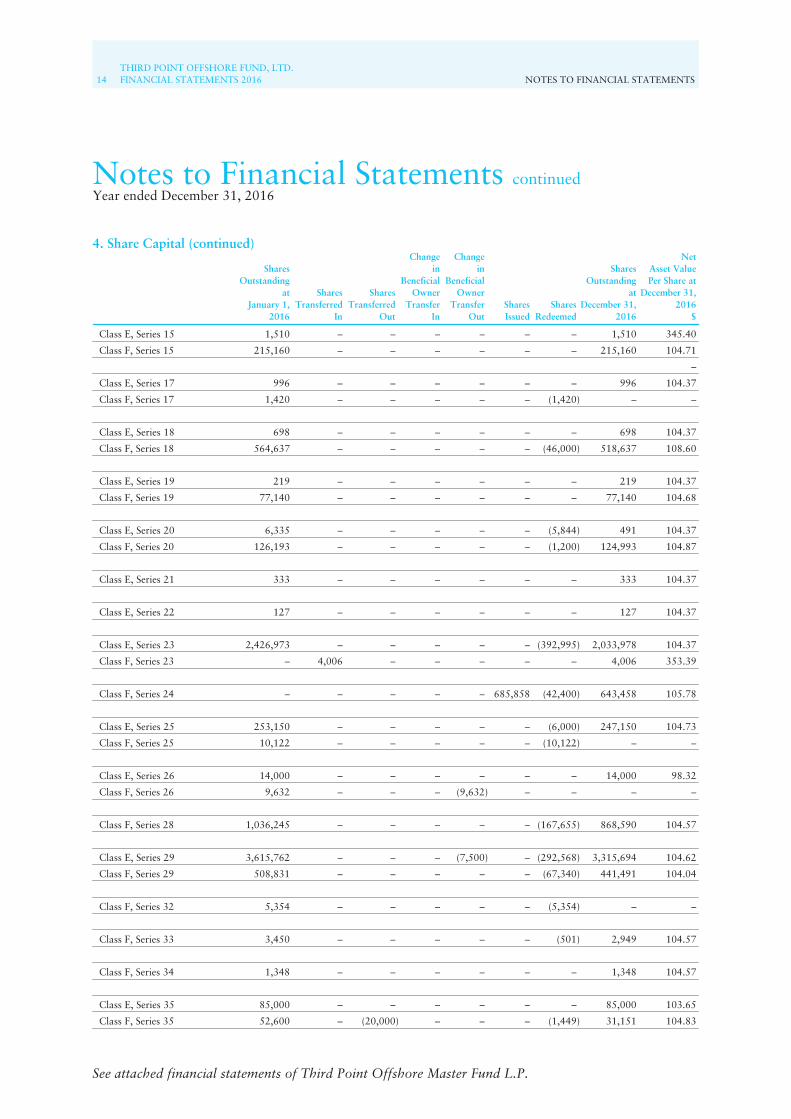
4. Share Capital (continued)
SharesOutstanding
atJanuary 1,
2016
SharesTransferred
In
SharesTransferred
Out
Changein
BeneficialOwner
TransferIn
Changein
BeneficialOwner
TransferOut
SharesIssued
SharesRedeemed
SharesOutstanding
atDecember 31,
2016
NetAsset ValuePer Share at
December 31,2016
$
Class E, Series 15 1,510 – – – – – – 1,510 345.40
Class F, Series 15 215,160 – – – – – – 215,160 104.71
–
Class E, Series 17 996 – – – – – – 996 104.37
Class F, Series 17 1,420 – – – – – (1,420) – –
Class E, Series 18 698 – – – – – – 698 104.37
Class F, Series 18 564,637 – – – – – (46,000) 518,637 108.60
Class E, Series 19 219 – – – – – – 219 104.37
Class F, Series 19 77,140 – – – – – – 77,140 104.68
Class E, Series 20 6,335 – – – – – (5,844) 491 104.37
Class F, Series 20 126,193 – – – – – (1,200) 124,993 104.87
Class E, Series 21 333 – – – – – – 333 104.37
Class E, Series 22 127 – – – – – – 127 104.37
Class E, Series 23 2,426,973 – – – – – (392,995) 2,033,978 104.37
Class F, Series 23 – 4,006 – – – – – 4,006 353.39
Class F, Series 24 – – – – – 685,858 (42,400) 643,458 105.78
Class E, Series 25 253,150 – – – – – (6,000) 247,150 104.73
Class F, Series 25 10,122 – – – – – (10,122) – –
Class E, Series 26 14,000 – – – – – – 14,000 98.32
Class F, Series 26 9,632 – – – (9,632) – – – –
Class F, Series 28 1,036,245 – – – – – (167,655) 868,590 104.57
Class E, Series 29 3,615,762 – – – (7,500) – (292,568) 3,315,694 104.62
Class F, Series 29 508,831 – – – – – (67,340) 441,491 104.04
Class F, Series 32 5,354 – – – – – (5,354) – –
Class F, Series 33 3,450 – – – – – (501) 2,949 104.57
Class F, Series 34 1,348 – – – – – – 1,348 104.57
Class E, Series 35 85,000 – – – – – – 85,000 103.65
Class F, Series 35 52,600 – (20,000) – – – (1,449) 31,151 104.83
See attached financial statements of Third Point Offshore Master Fund L.P.
NOTES TO FINANCIAL STATEMENTSTHIRD POINT OFFSHORE FUND, LTD.
FINANCIAL STATEMENTS 2016 15
4. Share Capital (continued)
SharesOutstanding
atJanuary 1,
2016
SharesTransferred
In
SharesTransferred
Out
Changein
BeneficialOwner
TransferIn
Changein
BeneficialOwner
TransferOut
SharesIssued
SharesRedeemed
SharesOutstanding
atDecember 31,
2016
NetAsset ValuePer Share at
December 31,2016
$
Class E, Series 36 12,500 – – – – – – 12,500 104.88
Class F, Series 36 – – – – – 67,500 – 67,500 108.79
Class E, Series 37 198,950 – – – – – (517) 198,433 104.88
Class F, Series 37 – – – – – 97,500 – 97,500 109.33
Class E, Series 38 4,400 – – – – – – 4,400 104.88
Class F, Series 38 6,188 – – – – – – 6,188 353.34
Class E, Series 39 27,300 – – – – – – 27,300 104.88
Class F, Series 39 – 4,393 – – – – – 4,393 353.39
Class F, Series 40 10,000 – – – – – – 10,000 104.33
Class F, Series 41 4,534 – – – – – (4,534) – –
Class E, Series 42 43,333 – – – – – – 43,333 345.38
Class F, Series 42 – 47,254 – – – – (47,254) – –
Class E, Series 43 96,940 – – – – – (3,516) 93,424 98.41
Class F, Series 43 – – – 2,265 – – – 2,265 107.77
Class E, Series 44 694,530 – – – – – (56,300) 638,230 108.62
Class F, Series 44 – – – – – 43,600 – 43,600 107.77
Class E, Series 45 2,282 – – – – – – 2,282 108.62
Class F, Series 45 – – – – – 185,600 – 185,600 106.21
Class E, Series 46 1,582 – – – – – – 1,582 108.62
Class E, Series 47 20,435 – – – – – – 20,435 345.37
Class E, Series 48 315,000 – – – – – (21,000) 294,000 104.70
Class F, Series 48 – – – – – 66,000 – 66,000 104.52
Class F, Series 49 – – (41,085) 41,085 – – – – –
Class F, Series 50 – – – – – 40,300 – 40,300 103.68
Class E, Series 51 148,050 – (4,100) – – – – 143,950 104.88
Class F, Series 51 – – – 2,920 – – – 2,920 103.68
See attached financial statements of Third Point Offshore Master Fund L.P.
16THIRD POINT OFFSHORE FUND, LTD.FINANCIAL STATEMENTS 2016 NOTES TO FINANCIAL STATEMENTS
Notes to Financial Statements continuedYear ended December 31, 2016
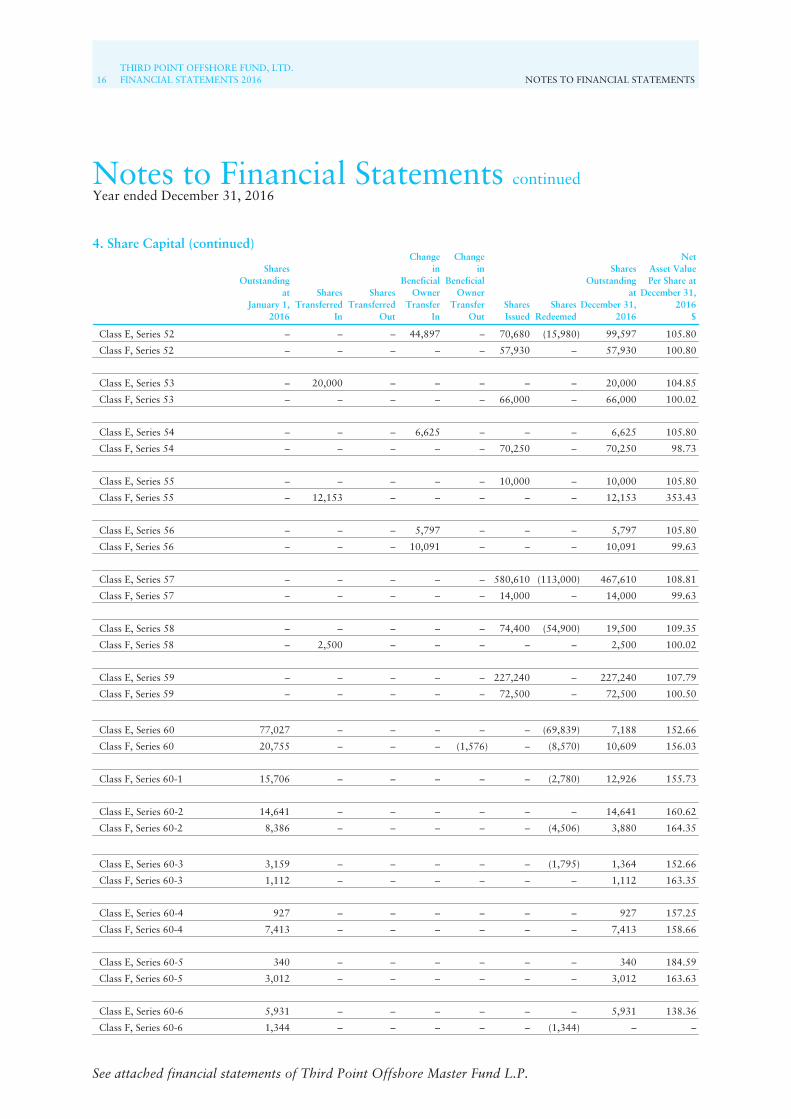
4. Share Capital (continued)
See attached financial statements of Third Point Offshore Master Fund L.P.
SharesOutstanding
atJanuary 1,
2016
SharesTransferred
In
SharesTransferred
Out
Changein
BeneficialOwner
TransferIn
Changein
BeneficialOwner
TransferOut
SharesIssued
SharesRedeemed
SharesOutstanding
atDecember 31,
2016
NetAsset ValuePer Share at
December 31,2016
$
Class E, Series 52 – – – 44,897 – 70,680 (15,980) 99,597 105.80
Class F, Series 52 – – – – – 57,930 – 57,930 100.80
Class E, Series 53 – 20,000 – – – – – 20,000 104.85
Class F, Series 53 – – – – – 66,000 – 66,000 100.02
Class E, Series 54 – – – 6,625 – – – 6,625 105.80
Class F, Series 54 – – – – – 70,250 – 70,250 98.73
Class E, Series 55 – – – – – 10,000 – 10,000 105.80
Class F, Series 55 – 12,153 – – – – – 12,153 353.43
Class E, Series 56 – – – 5,797 – – – 5,797 105.80
Class F, Series 56 – – – 10,091 – – – 10,091 99.63
Class E, Series 57 – – – – – 580,610 (113,000) 467,610 108.81
Class F, Series 57 – – – – – 14,000 – 14,000 99.63
Class E, Series 58 – – – – – 74,400 (54,900) 19,500 109.35
Class F, Series 58 – 2,500 – – – – – 2,500 100.02
Class E, Series 59 – – – – – 227,240 – 227,240 107.79
Class F, Series 59 – – – – – 72,500 – 72,500 100.50
Class E, Series 60 77,027 – – – – – (69,839) 7,188 152.66
Class F, Series 60 20,755 – – – (1,576) – (8,570) 10,609 156.03
Class F, Series 60-1 15,706 – – – – – (2,780) 12,926 155.73
Class E, Series 60-2 14,641 – – – – – – 14,641 160.62
Class F, Series 60-2 8,386 – – – – – (4,506) 3,880 164.35
Class E, Series 60-3 3,159 – – – – – (1,795) 1,364 152.66
Class F, Series 60-3 1,112 – – – – – – 1,112 163.35
Class E, Series 60-4 927 – – – – – – 927 157.25
Class F, Series 60-4 7,413 – – – – – – 7,413 158.66
Class E, Series 60-5 340 – – – – – – 340 184.59
Class F, Series 60-5 3,012 – – – – – – 3,012 163.63
Class E, Series 60-6 5,931 – – – – – – 5,931 138.36
Class F, Series 60-6 1,344 – – – – – (1,344) – –

NOTES TO FINANCIAL STATEMENTSTHIRD POINT OFFSHORE FUND, LTD.
FINANCIAL STATEMENTS 2016 17
4. Share Capital (continued)
SharesOutstanding
atJanuary 1,
2016
SharesTransferred
In
SharesTransferred
Out
Changein
BeneficialOwner
TransferIn
Changein
BeneficialOwner
TransferOut
SharesIssued
SharesRedeemed
SharesOutstanding
atDecember 31,
2016
NetAsset ValuePer Share at
December 31,2016
$
Class F, Series 60-7 2,150 – – – – – (375) 1,775 156.40
Class E, Series 60-8 4,139 – – – – – (745) 3,394 353.45
Class F, Series 60-8 5,884 – – – – – (1,310) 4,574 153.94
Class E, Series 60-9 884 – – – – – (649) 235 152.66
Class F, Series 60-9 2,780 – – – – – (1,853) 927 149.22
Class E, Series 60-10 2,041 – – – – – – 2,041 353.45
Class F, Series 60-10 927 – – – – – – 927 145.94
Class E, Series 60-11 479 – – – – – (479) – –
Class F, Series 60-11 2,131 – – – (2,131) – – – –
Class E, Series 60-12 100,000 – – – – – – 100,000 104.78
Class F, Series 60-12 2,872 – – – – – (1,389) 1,483 126.19
Class E, Series 60-13 50,000 – – – – – – 50,000 104.37
Class F, Series 60-13 50,650 – – – – – (15,299) 35,351 104.04
Class E, Series 60-14 1,924 – – – – – (646) 1,278 353.45
Class F, Series 60-14 125,840 – – – – – (125,440) 400 104.57
Class E, Series 60-15 64,243 – – – – – (3,000) 61,243 353.45
Class F, Series 60-15 30,150 – – – – – (12,698) 17,452 101.09
Class E, Series 60-16 – – – – – 12,000 – 12,000 109.35
Class F, Series 60-16 5,579 – – – – – – 5,579 99.30
Class E, Series 60-17 – 1,134 – – – – – 1,134 353.45
Class F, Series 60-17 1,457 – – – – – – 1,457 98.29
Class E, Series 60-18 – 4,100 – – – – – 4,100 104.88
Class F, Series 60-18 20,750 – – – – – (5,939) 14,811 108.60
Class E, Series 60-19 – – – – – 600 – 600 104.53
Class F, Series 60-19 – – – – – 7,300 – 7,300 105.78
Class E, Series 60-20 – 1,500 – – – – – 1,500 98.32
Class F, Series 60-20 – – – – – 1,450 – 1,450 108.79
Class F, Series 60-21 – – – – – 2,000 – 2,000 109.33
See attached financial statements of Third Point Offshore Master Fund L.P.
18THIRD POINT OFFSHORE FUND, LTD.FINANCIAL STATEMENTS 2016 NOTES TO FINANCIAL STATEMENTS
Notes to Financial Statements continuedYear ended December 31, 2016
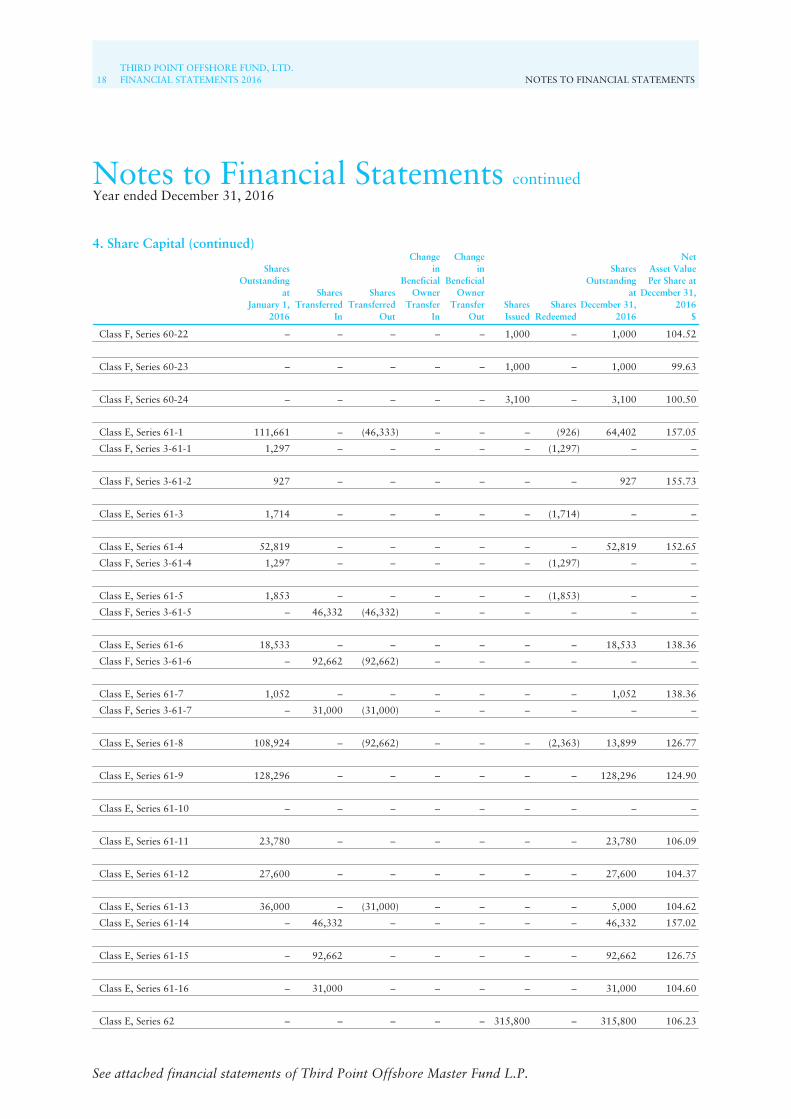
4. Share Capital (continued)
See attached financial statements of Third Point Offshore Master Fund L.P.
SharesOutstanding
atJanuary 1,
2016
SharesTransferred
In
SharesTransferred
Out
Changein
BeneficialOwner
TransferIn
Changein
BeneficialOwner
TransferOut
SharesIssued
SharesRedeemed
SharesOutstanding
atDecember 31,
2016
NetAsset ValuePer Share at
December 31,2016
$
Class F, Series 60-22 – – – – – 1,000 – 1,000 104.52
Class F, Series 60-23 – – – – – 1,000 – 1,000 99.63
Class F, Series 60-24 – – – – – 3,100 – 3,100 100.50
Class E, Series 61-1 111,661 – (46,333) – – – (926) 64,402 157.05
Class F, Series 3-61-1 1,297 – – – – – (1,297) – –
Class F, Series 3-61-2 927 – – – – – – 927 155.73
Class E, Series 61-3 1,714 – – – – – (1,714) – –
Class E, Series 61-4 52,819 – – – – – – 52,819 152.65
Class F, Series 3-61-4 1,297 – – – – – (1,297) – –
Class E, Series 61-5 1,853 – – – – – (1,853) – –
Class F, Series 3-61-5 – 46,332 (46,332) – – – – – –
Class E, Series 61-6 18,533 – – – – – – 18,533 138.36
Class F, Series 3-61-6 – 92,662 (92,662) – – – – – –
Class E, Series 61-7 1,052 – – – – – – 1,052 138.36
Class F, Series 3-61-7 – 31,000 (31,000) – – – – – –
Class E, Series 61-8 108,924 – (92,662) – – – (2,363) 13,899 126.77
Class E, Series 61-9 128,296 – – – – – – 128,296 124.90
Class E, Series 61-10 – – – – – – – – –
Class E, Series 61-11 23,780 – – – – – – 23,780 106.09
Class E, Series 61-12 27,600 – – – – – – 27,600 104.37
Class E, Series 61-13 36,000 – (31,000) – – – – 5,000 104.62
Class E, Series 61-14 – 46,332 – – – – – 46,332 157.02
Class E, Series 61-15 – 92,662 – – – – – 92,662 126.75
Class E, Series 61-16 – 31,000 – – – – – 31,000 104.60
Class E, Series 62 – – – – – 315,800 – 315,800 106.23
NOTES TO FINANCIAL STATEMENTSTHIRD POINT OFFSHORE FUND, LTD.
FINANCIAL STATEMENTS 2016 19
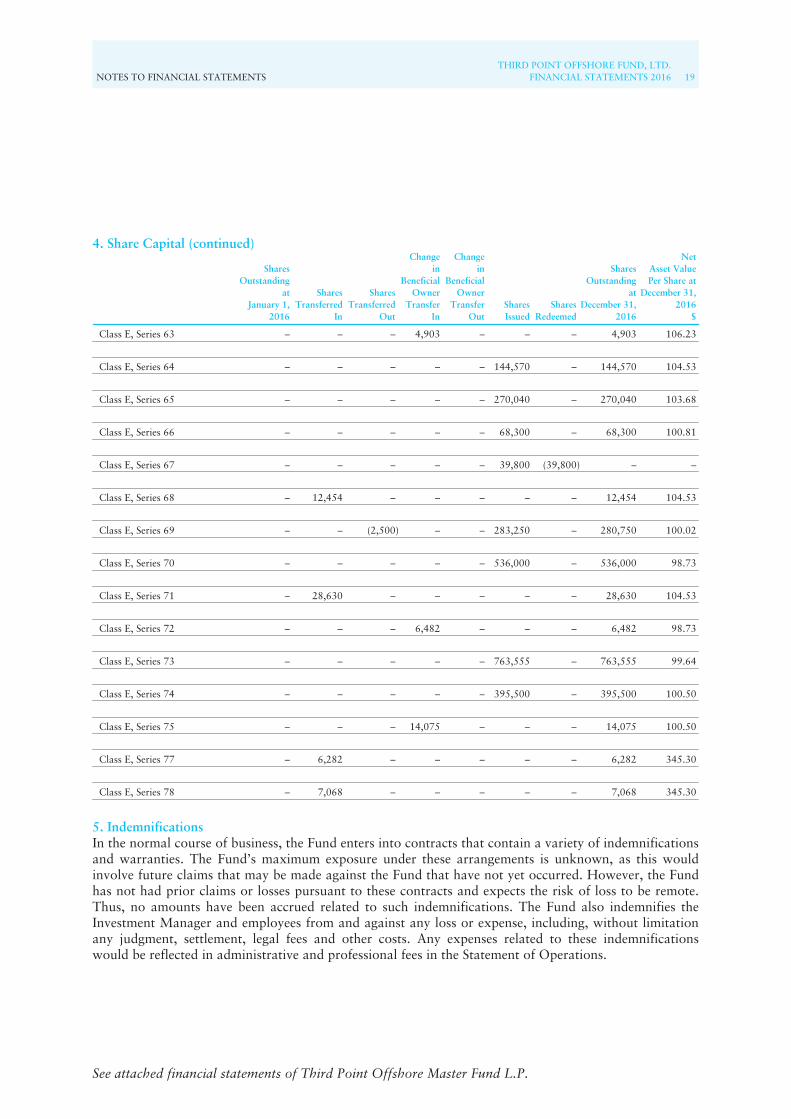
4. Share Capital (continued)
SharesOutstanding
atJanuary 1,
2016
SharesTransferred
In
SharesTransferred
Out
Changein
BeneficialOwner
TransferIn
Changein
BeneficialOwner
TransferOut
SharesIssued
SharesRedeemed
SharesOutstanding
atDecember 31,
2016
NetAsset ValuePer Share at
December 31,2016
$
Class E, Series 63 – – – 4,903 – – – 4,903 106.23
Class E, Series 64 – – – – – 144,570 – 144,570 104.53
Class E, Series 65 – – – – – 270,040 – 270,040 103.68
Class E, Series 66 – – – – – 68,300 – 68,300 100.81
Class E, Series 67 – – – – – 39,800 (39,800) – –
Class E, Series 68 – 12,454 – – – – – 12,454 104.53
Class E, Series 69 – – (2,500) – – 283,250 – 280,750 100.02
Class E, Series 70 – – – – – 536,000 – 536,000 98.73
Class E, Series 71 – 28,630 – – – – – 28,630 104.53
Class E, Series 72 – – – 6,482 – – – 6,482 98.73
Class E, Series 73 – – – – – 763,555 – 763,555 99.64
Class E, Series 74 – – – – – 395,500 – 395,500 100.50
Class E, Series 75 – – – 14,075 – – – 14,075 100.50
Class E, Series 77 – 6,282 – – – – – 6,282 345.30
Class E, Series 78 – 7,068 – – – – – 7,068 345.30
5. IndemnificationsIn the normal course of business, the Fund enters into contracts that contain a variety of indemnificationsand warranties. The Fund’s maximum exposure under these arrangements is unknown, as this wouldinvolve future claims that may be made against the Fund that have not yet occurred. However, the Fundhas not had prior claims or losses pursuant to these contracts and expects the risk of loss to be remote.Thus, no amounts have been accrued related to such indemnifications. The Fund also indemnifies theInvestment Manager and employees from and against any loss or expense, including, without limitationany judgment, settlement, legal fees and other costs. Any expenses related to these indemnificationswould be reflected in administrative and professional fees in the Statement of Operations.
See attached financial statements of Third Point Offshore Master Fund L.P.

20THIRD POINT OFFSHORE FUND, LTD.FINANCIAL STATEMENTS 2016 NOTES TO FINANCIAL STATEMENTS
Notes to Financial Statements continuedYear ended December 31, 2016
See attached financial statements of Third Point Offshore Master Fund L.P.
6. Financial HighlightsThe following table represents the per share operating performance, ratios to average net assets and totalreturn information for the year ended December 31, 2016.
Class A,Series 1-2
Class B,Series 1
Class C,Series 1
Class D,Series 1
Class E,Series 1
Class F,Series 1
Class H,Series 1
Per share operating performance
Net asset value at beginning of year $614.42 $592.41 $622.99 $582.90 $333.17 $325.51 $199.82
Income from investment operations:
Net realized and unrealized gain on investments 36.65 35.26 37.16 34.62 19.87 19.34 17.94
Net investment income/(loss) 0.75 0.74 0.77 0.80 0.41 0.44 (0.12)
Total from investment operations 37.40 36.00 37.93 35.42 20.28 19.78 17.82
Net asset value at the end of the year $651.82 $628.41 $660.92 $618.32 $353.45 $345.29 $217.64
Total return before incentive fee 7.25% 7.23% 7.25% 7.23% 7.25% 7.23% 10.28%
Incentive fee (1.16) (1.15) (1.16) (1.15) (1.16) (1.15) (1.37)
Total return after incentive fee 6.09% 6.08% 6.09% 6.08% 6.09% 6.08% 8.91%
Ratios to average net assets
Total expenses before incentive fee anddepreciation of deferred compensation 2.73% 2.73% 2.73% 2.75% 2.77% 2.77% 2.80%
Incentive fee 1.13 1.12 1.13 1.13 1.14 1.12 1.50
Total expenses before depreciation of deferredcompensation 3.86% 3.85% 3.86% 3.88% 3.91% 3.89% 4.30%
Depreciation of deferred compensation (0.94) (0.93) (0.94) (0.94) (0.92) (0.91) (0.84)
Net expenses 2.92% 2.92% 2.92% 2.94% 2.99% 2.98% 3.46%
Net investment income/(loss) 0.13% 0.12% 0.12% 0.12% 0.09% 0.09% (0.36%)
The total return and ratios to average net assets of other series in the same share class may vary based onparticipation in “new issues” and the timing of capital subscriptions and redemptions. The per shareinformation, total return and ratios to average net assets information include the proportionate share ofthe Master Partnership’s income and expenses.
7. Subsequent EventsSubsequent to December 31, 2016, the Fund received approximately $235 million in capitalsubscriptions, of which approximately $44 million was received in advance, and recorded redemptions ofapproximately $208 million. Subsequent events were evaluated by the Fund’s management untilMarch 17, 2017, which is the date the financial statements were issued.
On January 3, 2017, the Investment Manager received the full balance of deferred compensation fromthe Fund. The deferred compensation invested in the affiliated portfolio fund of $110,354,098 wasdistributed in-kind to the Investment Manager. As per the Deferred Fee Agreement, the remainingamount of $104,098,115 was redeemed in cash and simultaneously fully reinvested in the Fund throughan affiliate of the Investment Manager.

NOTES TO FINANCIAL STATEMENTSTHIRD POINT OFFSHORE FUND, LTD.
FINANCIAL STATEMENTS 2016 21
This page has been left intentionally blank


THIRD POINT OFFSHORE MASTERFUND L.P.
FINANCIAL STATEMENTSAs of and for the Year Ended December 31, 2016
With Report of Independent Auditors
Contents
01 Report of Independent Auditors02 Statement of Financial Condition03 Condensed Schedule of Investments11 Statement of Income12 Statement of Changes in Partners’ Capital13 Statement of Cash Flows14 Notes to Financial Statements

REPORT OF INDEPENDENT AUDITORSTHIRD POINT OFFSHORE MASTER FUND L.P.
FINANCIAL STATEMENTS 2016 1
Ernst & Young LLP 5 Times Square New York, NY 10036-6530
Tel: +1 212 773 3000 Fax: +1 212 773 6350 ey.com
Report of Independent Auditors
To the General Partner ofThird Point Offshore Master Fund L.P.
We have audited the accompanying financial statements of Third Point Offshore Master Fund L.P.,which comprise the statement of financial condition, including the condensed schedule of investments, asof December 31, 2016, and the related statements of income, changes in partners’ capital and cash flowsfor the year then ended, and the related notes to the financial statements.
Management’s Responsibility for the Financial StatementsManagement is responsible for the preparation and fair presentation of these financial statements inconformity with U.S. generally accepted accounting principles; this includes the design, implementation,and maintenance of internal control relevant to the preparation and fair presentation of financialstatements that are free of material misstatement, whether due to fraud or error.
Auditor’s ResponsibilityOur responsibility is to express an opinion on these financial statements based on our audit. Weconducted our audit in accordance with auditing standards generally accepted in the United States. Thosestandards require that we plan and perform the audit to obtain reasonable assurance about whether thefinancial statements are free of material misstatement.
An audit involves performing procedures to obtain audit evidence about the amounts and disclosures inthe financial statements. The procedures selected depend on the auditor’s judgment, including theassessment of the risks of material misstatement of the financial statements, whether due to fraud orerror. In making those risk assessments, the auditor considers internal control relevant to the entity’spreparation and fair presentation of the financial statements in order to design audit procedures that areappropriate in the circumstances, but not for the purpose of expressing an opinion on the effectiveness ofthe entity’s internal control. Accordingly, we express no such opinion. An audit also includes evaluatingthe appropriateness of accounting policies used and the reasonableness of significant accountingestimates made by management, as well as evaluating the overall presentation of the financial statements.
We believe that the audit evidence we have obtained is sufficient and appropriate to provide a basis forour audit opinion.
OpinionIn our opinion, the financial statements referred to above present fairly, in all material respects, thefinancial position of Third Point Offshore Master Fund L.P. at December 31, 2016, and the results of itsoperations, the changes in its partners’ capital and its cash flows for the year then ended, in conformitywith U.S. generally accepted accounting principles.
March 17, 2017
A member firm of Ernst & Young Global Limited

2THIRD POINT OFFSHORE MASTER FUND L.P.FINANCIAL STATEMENTS 2016 STATEMENT OF FINANCIAL CONDITION
Statement of Financial ConditionDecember 31, 2016
(Stated in United States Dollars) $
Assets
Cash 4,440
Investments in securities, at fair value (cost $6,746,669,215) 7,334,544,527
Investments in affiliated funds, at fair value (cost $223,898,339) 253,406,493
Due from brokers 750,371,124
Derivative contracts, at fair value(net upfront fees paid and cost of $59,515,462) 93,070,077
Interest and dividends receivable 17,828,012
Other assets 139,202,173
Total assets 8,588,426,846
Liabilities and Partners’ Capital
Liabilities
Securities sold, not yet purchased, at fair value (proceeds $304,388,601) 299,139,655
Due to brokers 713,931,846
Derivative contracts, at fair value(net upfront fees received and proceeds of $21,858,351) 49,704,088
Withdrawals payable to General Partner 100,000,000
Withdrawals payable to Limited Partner 449,888,556
Interest and dividends payable 1,069,759
Accrued expenses 3,305,254
Total liabilities 1,617,039,158
Commitments (See Note 10)
Partners’ Capital
General Partner’s capital 38,296,312
Limited Partner’s capital 6,933,091,376
Total Partners’ capital 6,971,387,688
Total liabilities and partners’ capital 8,588,426,846
See accompanying notes.
CONDENSED SCHEDULE OF INVESTMENTSTHIRD POINT OFFSHORE MASTER FUND L.P.
FINANCIAL STATEMENTS 2016 3
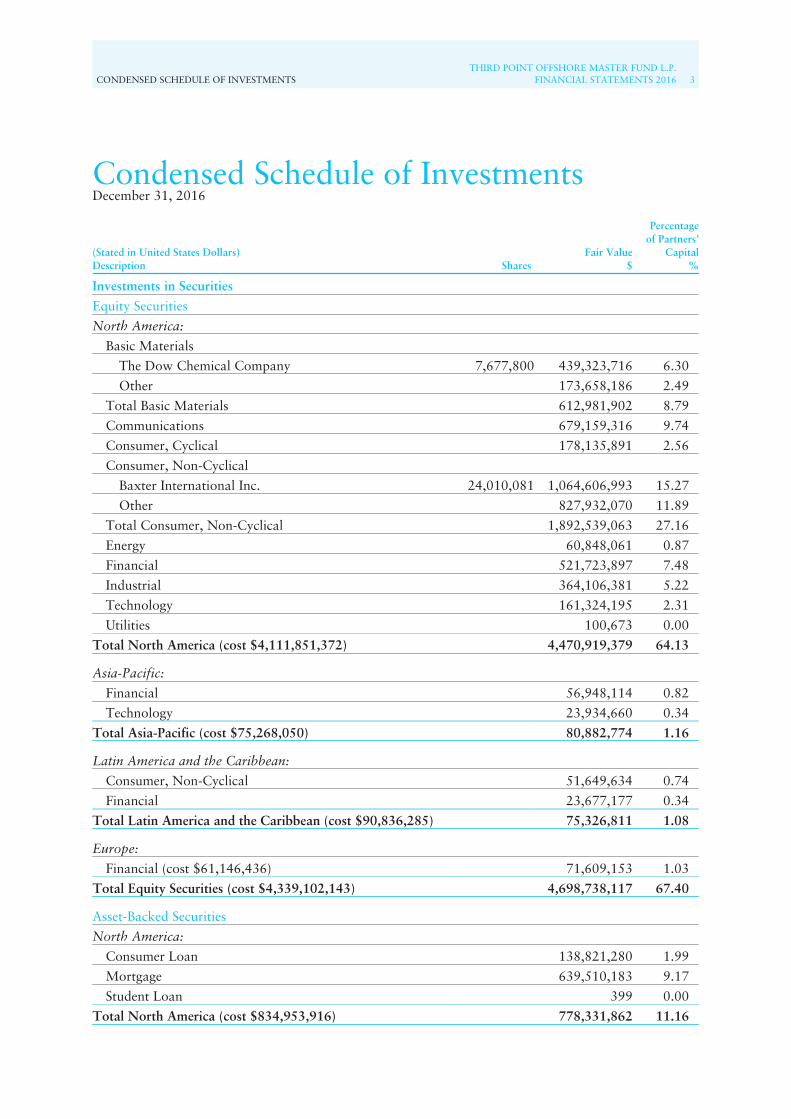
Condensed Schedule of InvestmentsDecember 31, 2016
(Stated in United States Dollars)Description Shares
Fair Value$
Percentageof Partners’
Capital%
Investments in Securities
Equity Securities
North America:
Basic Materials
The Dow Chemical Company 7,677,800 439,323,716 6.30
Other 173,658,186 2.49
Total Basic Materials 612,981,902 8.79
Communications 679,159,316 9.74
Consumer, Cyclical 178,135,891 2.56
Consumer, Non-Cyclical
Baxter International Inc. 24,010,081 1,064,606,993 15.27
Other 827,932,070 11.89
Total Consumer, Non-Cyclical 1,892,539,063 27.16
Energy 60,848,061 0.87
Financial 521,723,897 7.48
Industrial 364,106,381 5.22
Technology 161,324,195 2.31
Utilities 100,673 0.00
Total North America (cost $4,111,851,372) 4,470,919,379 64.13
Asia-Pacific:
Financial 56,948,114 0.82
Technology 23,934,660 0.34
Total Asia-Pacific (cost $75,268,050) 80,882,774 1.16
Latin America and the Caribbean:
Consumer, Non-Cyclical 51,649,634 0.74
Financial 23,677,177 0.34
Total Latin America and the Caribbean (cost $90,836,285) 75,326,811 1.08
Europe:
Financial (cost $61,146,436) 71,609,153 1.03
Total Equity Securities (cost $4,339,102,143) 4,698,738,117 67.40
Asset-Backed Securities
North America:
Consumer Loan 138,821,280 1.99
Mortgage 639,510,183 9.17
Student Loan 399 0.00
Total North America (cost $834,953,916) 778,331,862 11.16

4THIRD POINT OFFSHORE MASTER FUND L.P.FINANCIAL STATEMENTS 2016 CONDENSED SCHEDULE OF INVESTMENTS
Condensed Schedule of Investments continuedDecember 31, 2016
(Stated in United States Dollars)Description
Fair Value$
Percentageof Partners’
Capital%
Investments in Securities (continued)
Asset-Backed Securities (continued)
Europe:
Mortgage (cost $100,590,919) 76,420,379 1.10
Latin America and the Caribbean:
Mortgage (cost $14,978,779) 11,583,980 0.17
Total Asset-Backed Securities (cost $950,523,614) 866,336,221 12.43
Corporate Bonds
North America:
Communications 179,420,003 2.57
Energy 273,682,166 3.93
Financial 14,814,528 0.21
Technology 98,174,136 1.41
Utilities 1,728 0.00
Total North America (cost $399,322,764) 566,092,561 8.12
Latin America and the Caribbean:
Communications 3,303,095 0.05
Energy 79,021,530 1.13
Real Estate 27,464,435 0.39
Total Latin America and the Caribbean: (cost $98,993,995) 109,789,060 1.57
Europe:
Communications 14,840,566 0.21
Financial 42,835,069 0.62
Utilities 80,990 0.00
Total Europe (cost $81,756,673) 57,756,625 0.83
Total Corporate Bonds (cost $580,073,432) 733,638,246 10.52
Private Preferred Equity Securities
North America:
Communications 29,262,861 0.42
Consumer, Cyclical 1,194,300 0.02
Consumer, Non-Cyclical 28,202,645 0.41
Energy 4,838,935 0.07
Financial 152,239,910 2.18
Technology 119,951,625 1.72
Total North America (cost $286,971,135) 335,690,276 4.82
CONDENSED SCHEDULE OF INVESTMENTSTHIRD POINT OFFSHORE MASTER FUND L.P.
FINANCIAL STATEMENTS 2016 5
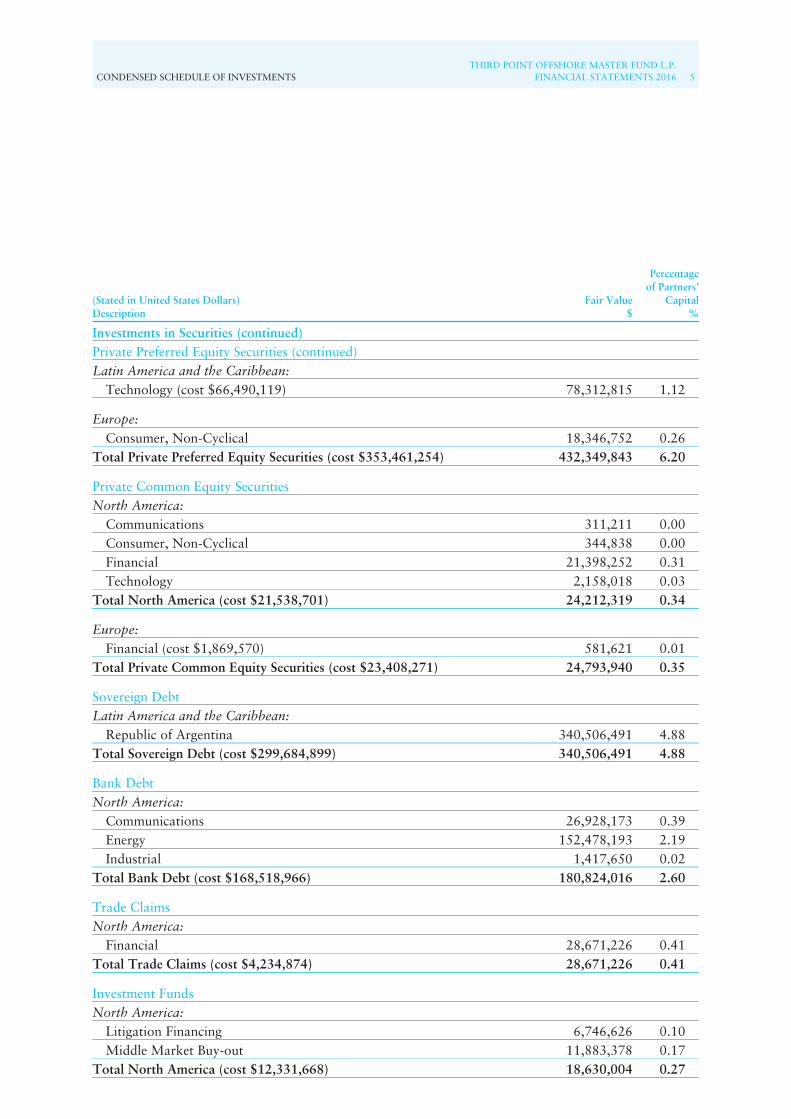
(Stated in United States Dollars)Description
Fair Value$
Percentageof Partners’
Capital%
Investments in Securities (continued)Private Preferred Equity Securities (continued)Latin America and the Caribbean:
Technology (cost $66,490,119) 78,312,815 1.12
Europe:Consumer, Non-Cyclical 18,346,752 0.26
Total Private Preferred Equity Securities (cost $353,461,254) 432,349,843 6.20
Private Common Equity SecuritiesNorth America:
Communications 311,211 0.00Consumer, Non-Cyclical 344,838 0.00Financial 21,398,252 0.31Technology 2,158,018 0.03
Total North America (cost $21,538,701) 24,212,319 0.34
Europe:Financial (cost $1,869,570) 581,621 0.01
Total Private Common Equity Securities (cost $23,408,271) 24,793,940 0.35
Sovereign DebtLatin America and the Caribbean:
Republic of Argentina 340,506,491 4.88Total Sovereign Debt (cost $299,684,899) 340,506,491 4.88
Bank DebtNorth America:
Communications 26,928,173 0.39Energy 152,478,193 2.19Industrial 1,417,650 0.02
Total Bank Debt (cost $168,518,966) 180,824,016 2.60
Trade ClaimsNorth America:
Financial 28,671,226 0.41Total Trade Claims (cost $4,234,874) 28,671,226 0.41
Investment FundsNorth America:
Litigation Financing 6,746,626 0.10Middle Market Buy-out 11,883,378 0.17
Total North America (cost $12,331,668) 18,630,004 0.27
6THIRD POINT OFFSHORE MASTER FUND L.P.FINANCIAL STATEMENTS 2016 CONDENSED SCHEDULE OF INVESTMENTS
Condensed Schedule of Investments continuedDecember 31, 2016
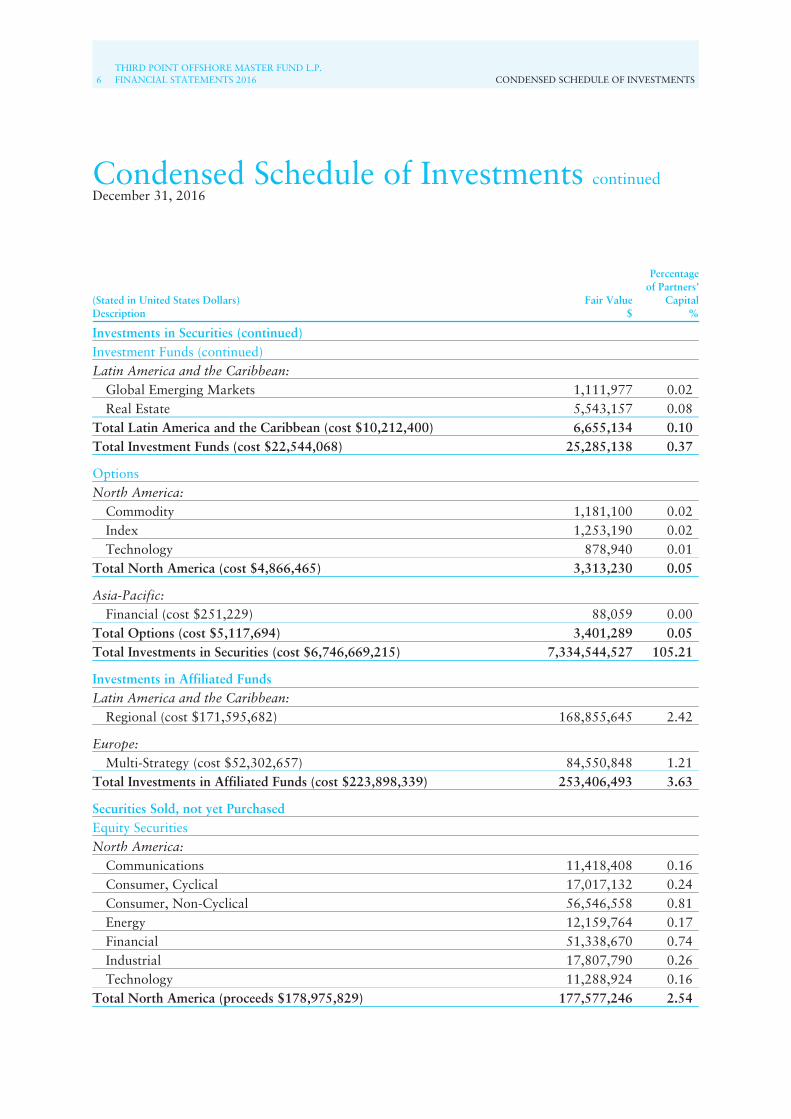
(Stated in United States Dollars)Description
Fair Value$
Percentageof Partners’
Capital%
Investments in Securities (continued)Investment Funds (continued)Latin America and the Caribbean:
Global Emerging Markets 1,111,977 0.02Real Estate 5,543,157 0.08
Total Latin America and the Caribbean (cost $10,212,400) 6,655,134 0.10Total Investment Funds (cost $22,544,068) 25,285,138 0.37
OptionsNorth America:
Commodity 1,181,100 0.02Index 1,253,190 0.02Technology 878,940 0.01
Total North America (cost $4,866,465) 3,313,230 0.05
Asia-Pacific:Financial (cost $251,229) 88,059 0.00
Total Options (cost $5,117,694) 3,401,289 0.05Total Investments in Securities (cost $6,746,669,215) 7,334,544,527 105.21
Investments in Affiliated FundsLatin America and the Caribbean:
Regional (cost $171,595,682) 168,855,645 2.42
Europe:Multi-Strategy (cost $52,302,657) 84,550,848 1.21
Total Investments in Affiliated Funds (cost $223,898,339) 253,406,493 3.63
Securities Sold, not yet PurchasedEquity SecuritiesNorth America:
Communications 11,418,408 0.16Consumer, Cyclical 17,017,132 0.24Consumer, Non-Cyclical 56,546,558 0.81Energy 12,159,764 0.17Financial 51,338,670 0.74Industrial 17,807,790 0.26Technology 11,288,924 0.16
Total North America (proceeds $178,975,829) 177,577,246 2.54

CONDENSED SCHEDULE OF INVESTMENTSTHIRD POINT OFFSHORE MASTER FUND L.P.
FINANCIAL STATEMENTS 2016 7
(Stated in United States Dollars)Description
Fair Value$
Percentageof Partners’
Capital%
Securities Sold, not yet Purchased (continued)Equity Securities (continued)Europe:
Consumer, Non-Cyclical 13,496,238 0.19Industrial 30,753,419 0.45
Total Europe (proceeds $45,222,978) 44,249,657 0.64
Asia-Pacific:Industrial (proceeds $6,524,028) 6,180,223 0.09
Total Equity Securities (proceeds $230,722,835) 228,007,126 3.27
Corporate BondsNorth America:
Consumer, Non-Cyclical 41,736,562 0.60Utilities 17,599,883 0.25
Total Corporate Bonds (proceeds $59,924,454) 59,336,445 0.85
OptionsNorth America:
Basic Materials 664,956 0.01Communications 4,711,200 0.06Consumer, Non-Cyclical 617,472 0.01Financial 2,127,461 0.03Index 2,483,800 0.04Technology 1,191,195 0.02
Total Options (proceeds $13,741,312) 11,796,084 0.17Total Securities Sold, not yet Purchased (proceeds $304,388,601) 299,139,655 4.29
Derivative ContractsContracts for Differences – Long ContractsEurope:
Financial 2,862,208 0.04Industrial 3,107,756 0.05
Total Europe 5,969,964 0.09
Latin America and the Caribbean:Financial 5,009 0.00
Total Contracts for Differences – Long Contracts 5,974,973 0.09
8THIRD POINT OFFSHORE MASTER FUND L.P.FINANCIAL STATEMENTS 2016 CONDENSED SCHEDULE OF INVESTMENTS
Condensed Schedule of Investments continuedDecember 31, 2016
(Stated in United States Dollars)Description
Fair Value$
Percentageof Partners’
Capital%
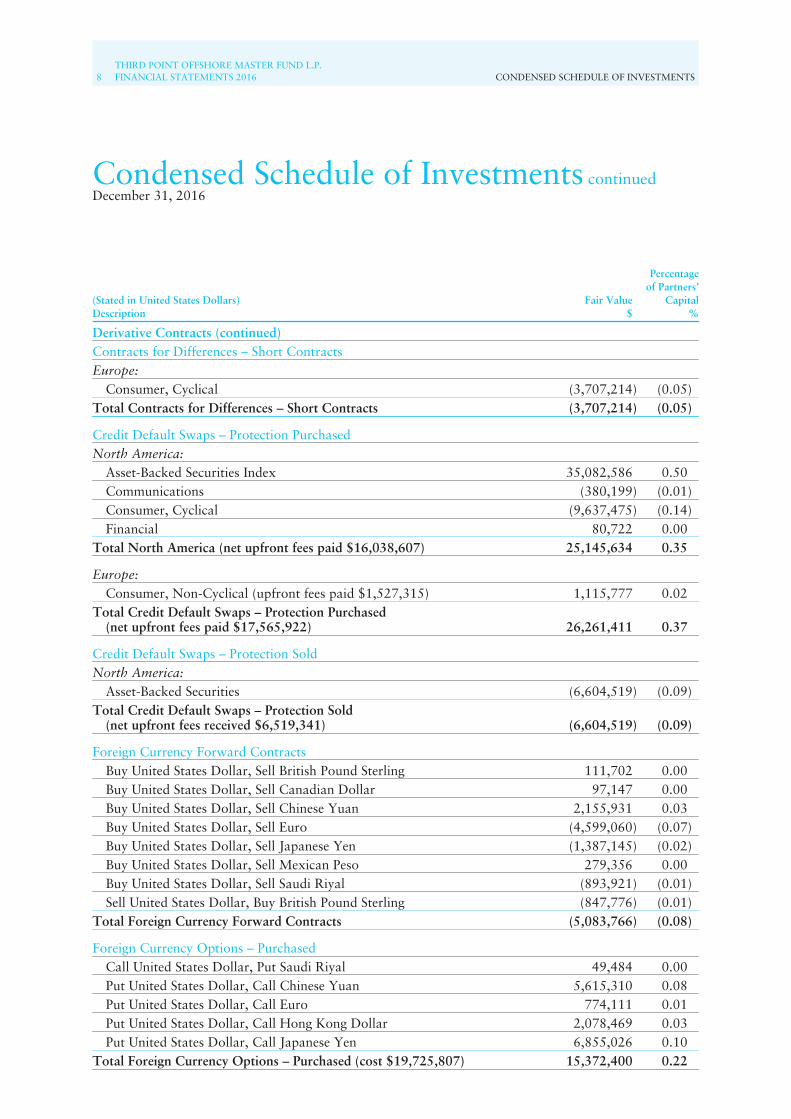
Derivative Contracts (continued)Contracts for Differences – Short ContractsEurope:
Consumer, Cyclical (3,707,214) (0.05)Total Contracts for Differences – Short Contracts (3,707,214) (0.05)
Credit Default Swaps – Protection PurchasedNorth America:
Asset-Backed Securities Index 35,082,586 0.50Communications (380,199) (0.01)Consumer, Cyclical (9,637,475) (0.14)Financial 80,722 0.00
Total North America (net upfront fees paid $16,038,607) 25,145,634 0.35
Europe:Consumer, Non-Cyclical (upfront fees paid $1,527,315) 1,115,777 0.02
Total Credit Default Swaps – Protection Purchased(net upfront fees paid $17,565,922) 26,261,411 0.37
Credit Default Swaps – Protection SoldNorth America:
Asset-Backed Securities (6,604,519) (0.09)Total Credit Default Swaps – Protection Sold
(net upfront fees received $6,519,341) (6,604,519) (0.09)
Foreign Currency Forward ContractsBuy United States Dollar, Sell British Pound Sterling 111,702 0.00Buy United States Dollar, Sell Canadian Dollar 97,147 0.00Buy United States Dollar, Sell Chinese Yuan 2,155,931 0.03Buy United States Dollar, Sell Euro (4,599,060) (0.07)Buy United States Dollar, Sell Japanese Yen (1,387,145) (0.02)Buy United States Dollar, Sell Mexican Peso 279,356 0.00Buy United States Dollar, Sell Saudi Riyal (893,921) (0.01)Sell United States Dollar, Buy British Pound Sterling (847,776) (0.01)
Total Foreign Currency Forward Contracts (5,083,766) (0.08)
Foreign Currency Options – PurchasedCall United States Dollar, Put Saudi Riyal 49,484 0.00Put United States Dollar, Call Chinese Yuan 5,615,310 0.08Put United States Dollar, Call Euro 774,111 0.01Put United States Dollar, Call Hong Kong Dollar 2,078,469 0.03Put United States Dollar, Call Japanese Yen 6,855,026 0.10
Total Foreign Currency Options – Purchased (cost $19,725,807) 15,372,400 0.22

CONDENSED SCHEDULE OF INVESTMENTSTHIRD POINT OFFSHORE MASTER FUND L.P.
FINANCIAL STATEMENTS 2016 9
(Stated in United States Dollars)Description
Fair Value$
Percentageof Partners’
Capital%
Derivative Contracts (continued)Foreign Currency Options – Sold
Put United States Dollar, Call Chinese Yuan (1,636,064) (0.02)Put United States Dollar, Call Japanese Yen (2,890,460) (0.04)
Total Foreign Currency Options – Sold (proceeds $4,806,047) (4,526,524) (0.06)
Interest Rate SwapsUnited States Dollar Libor 7,344,730 0.10British Pound Sterling Libor (1,482,572) (0.02)
Total Interest Rate Swaps 5,862,158 0.08
Interest Rate SwaptionsJapanese Yen Libor 7,682,479 0.11United States Dollar ICE Swap Rate 1,396,714 0.02United States Dollar Libor 5,421,184 0.08
Total Interest Rate Swaptions (cost $11,690,770) 14,500,377 0.21
Sovereign Futures – Short ContractsNorth America:
Financial 3,232,718 0.05
Europe:Financial (5,407,691) (0.08)
Total Sovereign Futures – Short Contracts (2,174,973) (0.03)
Total Return Swaps – Long ContractsLatin America and the Caribbean:
Utilities 1,548,597 0.02
North America:Energy 164,343 0.00Financial 65,899 0.00Industrial (135,540) (0.00)Technology (299,702) (0.00)
Total North America (205,000) (0.00)Total Total Return Swaps – Long Contracts 1,343,597 0.02

10THIRD POINT OFFSHORE MASTER FUND L.P.FINANCIAL STATEMENTS 2016 CONDENSED SCHEDULE OF INVESTMENTS
Condensed Schedule of Investments continuedDecember 31, 2016
(Stated in United States Dollars)Description
Fair Value$
Percentageof Partners’
Capital%
Derivative Contracts (continued)
Total Return Swaps – Short Contracts
Asia-Pacific:
Industrial (3,851,931) (0.06)
Total Total Return Swaps – Short Contracts (3,851,931) (0.06)
Net Derivative Contracts (including net upfront fees paid and costof $37,657,111) 43,365,989 0.62
See accompanying notes.
STATEMENT OF INCOMETHIRD POINT OFFSHORE MASTER FUND L.P.
FINANCIAL STATEMENTS 2016 11
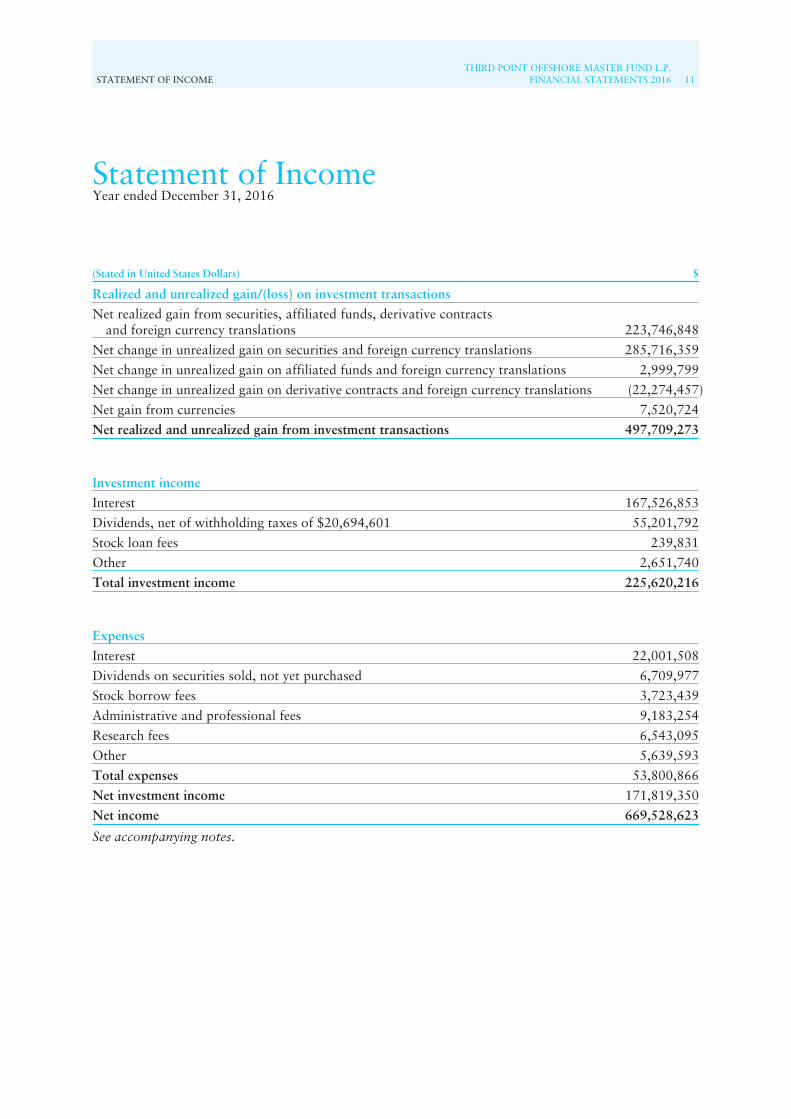
Statement of IncomeYear ended December 31, 2016
(Stated in United States Dollars) $
Realized and unrealized gain/(loss) on investment transactions
Net realized gain from securities, affiliated funds, derivative contractsand foreign currency translations 223,746,848
Net change in unrealized gain on securities and foreign currency translations 285,716,359
Net change in unrealized gain on affiliated funds and foreign currency translations 2,999,799
Net change in unrealized gain on derivative contracts and foreign currency translations (22,274,457)
Net gain from currencies 7,520,724
Net realized and unrealized gain from investment transactions 497,709,273
Investment income
Interest 167,526,853
Dividends, net of withholding taxes of $20,694,601 55,201,792
Stock loan fees 239,831
Other 2,651,740
Total investment income 225,620,216
Expenses
Interest 22,001,508
Dividends on securities sold, not yet purchased 6,709,977
Stock borrow fees 3,723,439
Administrative and professional fees 9,183,254
Research fees 6,543,095
Other 5,639,593
Total expenses 53,800,866
Net investment income 171,819,350
Net income 669,528,623
See accompanying notes.
12THIRD POINT OFFSHORE MASTER FUND L.P.FINANCIAL STATEMENTS 2016 STATEMENT OF CHANGES IN PARTNERS’ CAPITAL
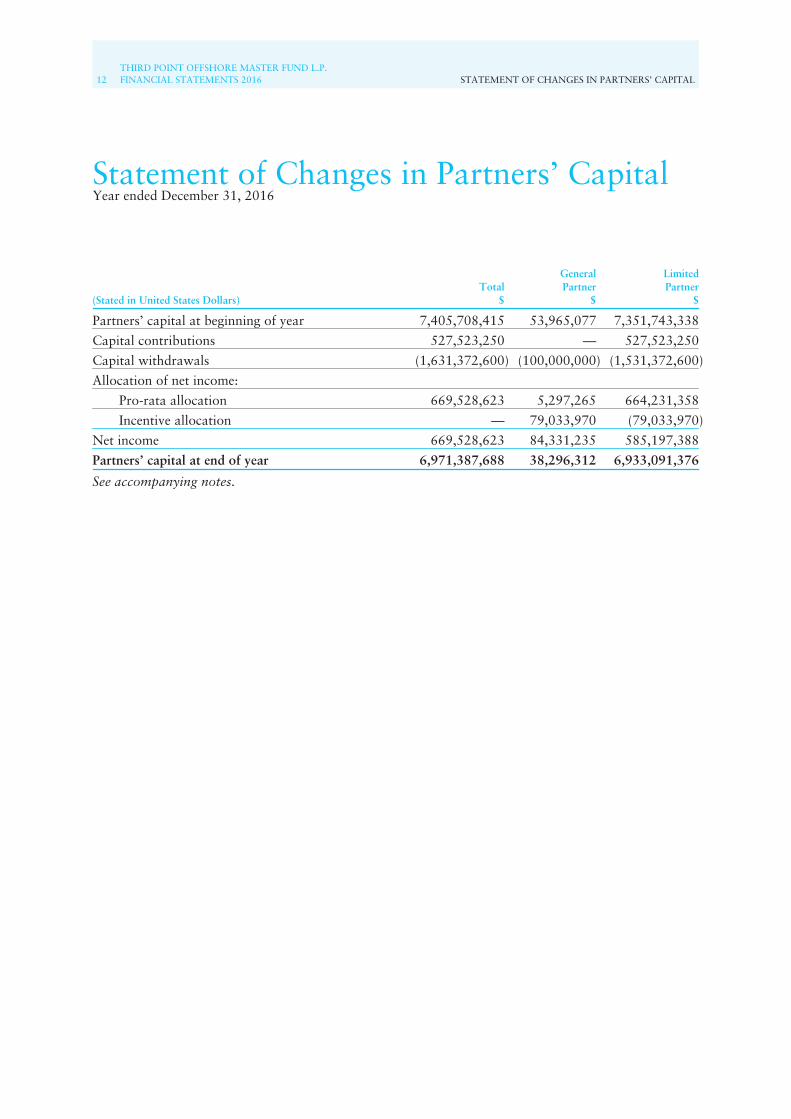
Statement of Changes in Partners’ CapitalYear ended December 31, 2016
(Stated in United States Dollars)Total
$
GeneralPartner
$
LimitedPartner
$
Partners’ capital at beginning of year 7,405,708,415 53,965,077 7,351,743,338
Capital contributions 527,523,250 — 527,523,250
Capital withdrawals (1,631,372,600) (100,000,000) (1,531,372,600)
Allocation of net income:
Pro-rata allocation 669,528,623 5,297,265 664,231,358
Incentive allocation — 79,033,970 (79,033,970)
Net income 669,528,623 84,331,235 585,197,388
Partners’ capital at end of year 6,971,387,688 38,296,312 6,933,091,376
See accompanying notes.
STATEMENT OF CASH FLOWSTHIRD POINT OFFSHORE MASTER FUND L.P.
FINANCIAL STATEMENTS 2016 13
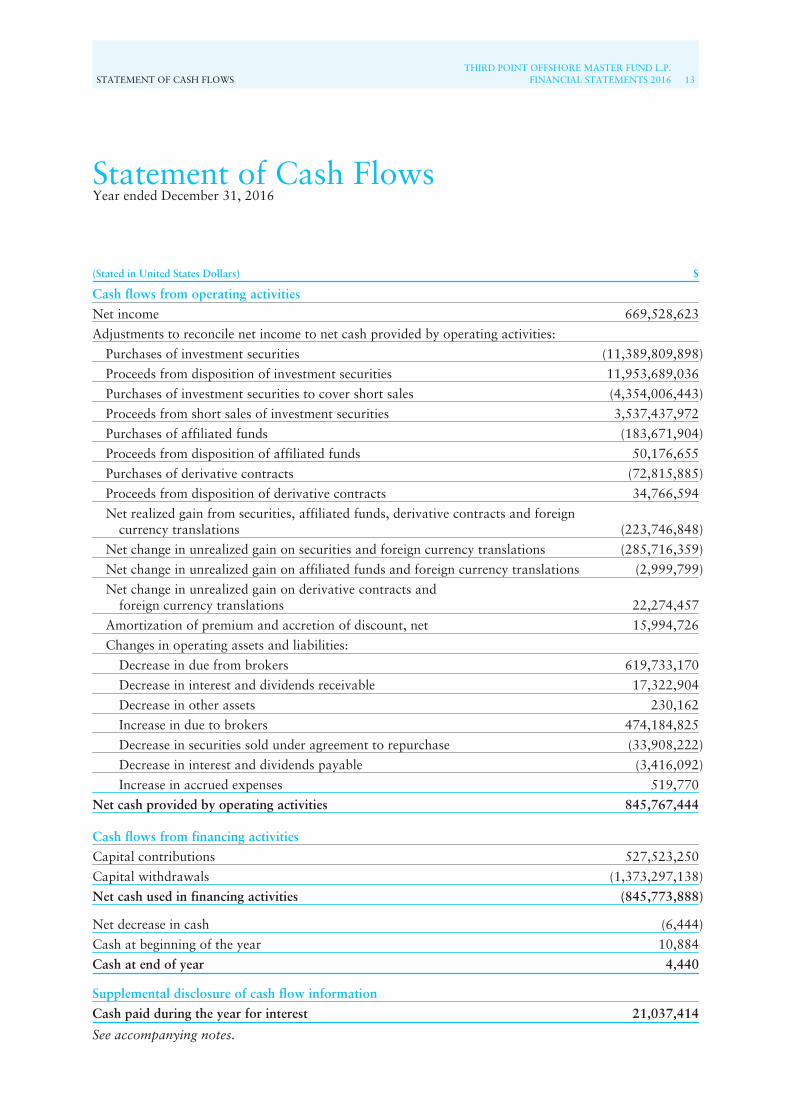
Statement of Cash FlowsYear ended December 31, 2016
(Stated in United States Dollars) $
Cash flows from operating activities
Net income 669,528,623
Adjustments to reconcile net income to net cash provided by operating activities:
Purchases of investment securities (11,389,809,898)
Proceeds from disposition of investment securities 11,953,689,036
Purchases of investment securities to cover short sales (4,354,006,443)
Proceeds from short sales of investment securities 3,537,437,972
Purchases of affiliated funds (183,671,904)
Proceeds from disposition of affiliated funds 50,176,655
Purchases of derivative contracts (72,815,885)
Proceeds from disposition of derivative contracts 34,766,594
Net realized gain from securities, affiliated funds, derivative contracts and foreigncurrency translations (223,746,848)
Net change in unrealized gain on securities and foreign currency translations (285,716,359)
Net change in unrealized gain on affiliated funds and foreign currency translations (2,999,799)
Net change in unrealized gain on derivative contracts andforeign currency translations 22,274,457
Amortization of premium and accretion of discount, net 15,994,726
Changes in operating assets and liabilities:
Decrease in due from brokers 619,733,170
Decrease in interest and dividends receivable 17,322,904
Decrease in other assets 230,162
Increase in due to brokers 474,184,825
Decrease in securities sold under agreement to repurchase (33,908,222)
Decrease in interest and dividends payable (3,416,092)
Increase in accrued expenses 519,770
Net cash provided by operating activities 845,767,444
Cash flows from financing activities
Capital contributions 527,523,250
Capital withdrawals (1,373,297,138)
Net cash used in financing activities (845,773,888)
Net decrease in cash (6,444)
Cash at beginning of the year 10,884
Cash at end of year 4,440
Supplemental disclosure of cash flow information
Cash paid during the year for interest 21,037,414
See accompanying notes.

14THIRD POINT OFFSHORE MASTER FUND L.P.FINANCIAL STATEMENTS 2016 NOTES TO FINANCIAL STATEMENTS
Notes to Financial StatementsYear ended December 31, 2016
1. OrganizationThird Point Offshore Master Fund L.P. (the “Partnership”) was organized as a limited partnership underthe laws of the Cayman Islands and commenced operations on January 1, 2009. The Partnership wasformed to trade and invest primarily in equity and debt securities of U.S. and foreign companies. Theinvestment objective of the Partnership is to achieve superior risk-adjusted returns by deploying capital ininvestments with a favorable risk/reward scenario across select asset classes, sectors, and geographies,both long and short. Third Point LLC (the “Investment Manager”) identifies these opportunities using acombination of top-down asset allocation decisions and a bottom-up, value-oriented approach to singlesecurity analysis. The Investment Manager supplements single security analysis with an approach toportfolio construction that includes sizing each investment based on upside/downside calculations, allwith a view towards appropriately positioning and managing overall exposures across specific assetclasses, sectors and geographies. The Partnership will continue until terminated as provided for in theThird Amended and Restated Exempted Limited Partnership Agreement (the “Agreement”).
The Partnership serves as the master fund in a “master-feeder” structure whereby Third Point OffshoreFund, Ltd. (the “Feeder”), a Cayman Islands exempted company, invests substantially all of its net assetsin the Partnership, which conducts all investment and trading activities on behalf of the Feeder fund. TheFeeder and the Partnership have the same investment objectives. At December 31, 2016, approximately99.45% of the Partnership’s capital was owned by the Feeder.
Third Point LLC is the Investment Manager of the Partnership. The General Partner of the Partnership isThird Point Advisors II L.L.C. The Investment Manager is registered with the Securities and ExchangeCommission as an Investment Adviser under the Investment Advisers Act of 1940. The InvestmentManager and the General Partner are responsible for the operation and management of the Partnership.
The Partnership is an investment company and applies specialized accounting guidance as outlined inFinancial Services – Investment Companies (Topic 946). The Investment Manager evaluated thisguidance and determined that the Partnership meets the criteria to be classified as an investmentcompany. Accordingly, the Partnership reflects its investments in the Statement of Financial Condition attheir estimated fair value, with unrealized gains and losses resulting from changes in fair value, if any,reflected in net change in unrealized gain/loss on securities, affiliated funds, derivative contracts andforeign currency translations in the Statement of Income.
International Fund Services (Ireland) Limited serves as the administrator (the “Administrator”) andtransfer agent to the Partnership.
2. Significant Accounting PoliciesThe Partnership’s financial statements have been prepared in accordance with U.S. generally acceptedaccounting principles (“U.S. GAAP”) and are expressed in United States dollars. The following is asummary of the significant accounting and reporting policies:
The Partnership is exempt from all forms of taxation in the Cayman Islands, including income, capitalgains and withholding taxes. In jurisdictions other than the Cayman Islands, in some cases foreign taxeswill be withheld at source on dividends and certain interest received by the Partnership. Capital gainsderived by the Partnership in such jurisdictions generally will be exempt from foreign income orwithholding taxes at the source. The Partnership will be treated as a partnership for federal income taxpurposes and each investor will be subject to taxation on its share of the Partnership’s ordinary incomeand capital gains.
NOTES TO FINANCIAL STATEMENTSTHIRD POINT OFFSHORE MASTER FUND L.P.
FINANCIAL STATEMENTS 2016 15
2. Significant Accounting Policies (continued)The Partnership evaluates tax positions taken or expected to be taken in the course of preparing thePartnership’s tax returns to determine whether the tax positions are “more-likely-than-not” of beingsustained by the applicable tax authority. Tax positions not deemed to meet a “more likely-than-not”threshold would be recorded as a tax expense in the current year. The General Partner has reviewed thePartnership’s tax positions and has concluded that no material provision for income tax is required in thePartnership’s financial statements. Generally, the Partnership is subject to income tax examinations bymajor taxing authorities including United States and other authorities for open tax years since inception.
The Partnership would recognize interest and penalties, if any, related to unrecognized tax positions asincome tax expense in the Statement of Income. During the year ended December 31, 2016, thePartnership did not incur any interest or penalties related to unrecognized tax positions.
The Partnership records security transactions and related income and expense on a trade-date basis.Realized gains and losses are determined using cost calculated on a specific identification basis.Dividends are recorded on the ex-dividend date. Income and expense are recorded on the accrual basisincluding interest and premiums amortized and discounts accreted.
The Partnership may enter into repurchase and reverse repurchase agreements with financial institutionsin which the financial institution agrees to resell or repurchase securities and the Partnership agrees torepurchase or resell such securities at a mutually agreed price upon maturity. These agreements arecollateralized primarily by debt securities. As of December 31, 2016, the Partnership did not hold anyrepurchase or reverse repurchase agreements. Interest expense and income related to repurchase andreverse repurchase agreements held during the year are included in interest and dividends payable andinterest and dividends receivable in the Statement of Financial Condition, respectively.
The Partnership may lend securities for securities lending transactions or pledge securities and/or cash forsecurities borrowed transactions. The value of any securities loaned is reflected in investments insecurities in the Statement of Financial Condition. As of December 31, 2016, the Partnership had$775,500 of securities loaned. Any collateral received is reflected in due to brokers in the Statement ofFinancial Condition.
The Partnership engages in securities lending transactions whereby upon the Partnership’s request, itsprime brokers, as lending agents, may loan securities of the Partnership as selected by the Partnership tocertain institutions. The securities loaned are generally collateralized in the form of cash or U.S. treasurysecurities in an amount typically at least equal to the fair value of the securities loaned. The fair value ofthe loaned securities is determined at the close of business on each business day and any additionalrequired collateral is delivered to the Partnership on the next business day. Risks may arise upon enteringinto securities lending transactions to the extent that the value of the collateral is less than the value ofthe securities loaned due to changes in the value of the securities loaned.
Changes in the value of the securities loaned that may occur during the course of the loan will berecognized by the Partnership. The Partnership has the right under the lending agreement to recover thesecurities from the borrower on demand. The Partnership receives interest based on the outstanding fairvalue of the loaned shares at a rate that is initially agreed with the prime broker prior to lending theshares and is subject to change by mutual agreement of the parties over the course of the transaction.
The Partnership’s repurchase and securities lending agreements may result in credit exposure in the eventthe counterparty to the transaction is unable to fulfill its contractual obligations. It is the Partnership’spolicy to monitor and control collateral under such agreements. Refer to Note 8 for additionaldisclosures regarding the Partnership’s collateral policy.
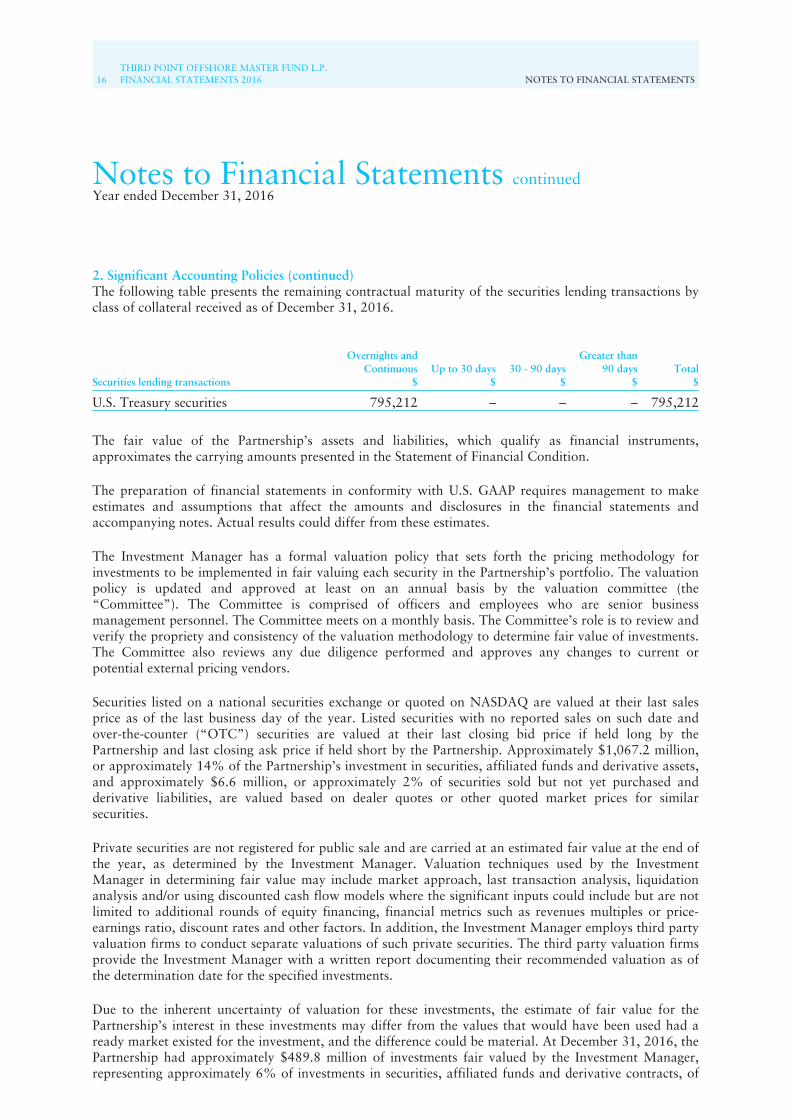
16THIRD POINT OFFSHORE MASTER FUND L.P.FINANCIAL STATEMENTS 2016 NOTES TO FINANCIAL STATEMENTS
Notes to Financial Statements continuedYear ended December 31, 2016
2. Significant Accounting Policies (continued)The following table presents the remaining contractual maturity of the securities lending transactions byclass of collateral received as of December 31, 2016.
Securities lending transactions
Overnights andContinuous
$Up to 30 days
$30 - 90 days
$
Greater than90 days
$Total
$
U.S. Treasury securities 795,212 – – – 795,212
The fair value of the Partnership’s assets and liabilities, which qualify as financial instruments,approximates the carrying amounts presented in the Statement of Financial Condition.
The preparation of financial statements in conformity with U.S. GAAP requires management to makeestimates and assumptions that affect the amounts and disclosures in the financial statements andaccompanying notes. Actual results could differ from these estimates.
The Investment Manager has a formal valuation policy that sets forth the pricing methodology forinvestments to be implemented in fair valuing each security in the Partnership’s portfolio. The valuationpolicy is updated and approved at least on an annual basis by the valuation committee (the“Committee”). The Committee is comprised of officers and employees who are senior businessmanagement personnel. The Committee meets on a monthly basis. The Committee’s role is to review andverify the propriety and consistency of the valuation methodology to determine fair value of investments.The Committee also reviews any due diligence performed and approves any changes to current orpotential external pricing vendors.
Securities listed on a national securities exchange or quoted on NASDAQ are valued at their last salesprice as of the last business day of the year. Listed securities with no reported sales on such date andover-the-counter (“OTC”) securities are valued at their last closing bid price if held long by thePartnership and last closing ask price if held short by the Partnership. Approximately $1,067.2 million,or approximately 14% of the Partnership’s investment in securities, affiliated funds and derivative assets,and approximately $6.6 million, or approximately 2% of securities sold but not yet purchased andderivative liabilities, are valued based on dealer quotes or other quoted market prices for similarsecurities.
Private securities are not registered for public sale and are carried at an estimated fair value at the end ofthe year, as determined by the Investment Manager. Valuation techniques used by the InvestmentManager in determining fair value may include market approach, last transaction analysis, liquidationanalysis and/or using discounted cash flow models where the significant inputs could include but are notlimited to additional rounds of equity financing, financial metrics such as revenues multiples or price-earnings ratio, discount rates and other factors. In addition, the Investment Manager employs third partyvaluation firms to conduct separate valuations of such private securities. The third party valuation firmsprovide the Investment Manager with a written report documenting their recommended valuation as ofthe determination date for the specified investments.
Due to the inherent uncertainty of valuation for these investments, the estimate of fair value for thePartnership’s interest in these investments may differ from the values that would have been used had aready market existed for the investment, and the difference could be material. At December 31, 2016, thePartnership had approximately $489.8 million of investments fair valued by the Investment Manager,representing approximately 6% of investments in securities, affiliated funds and derivative contracts, of
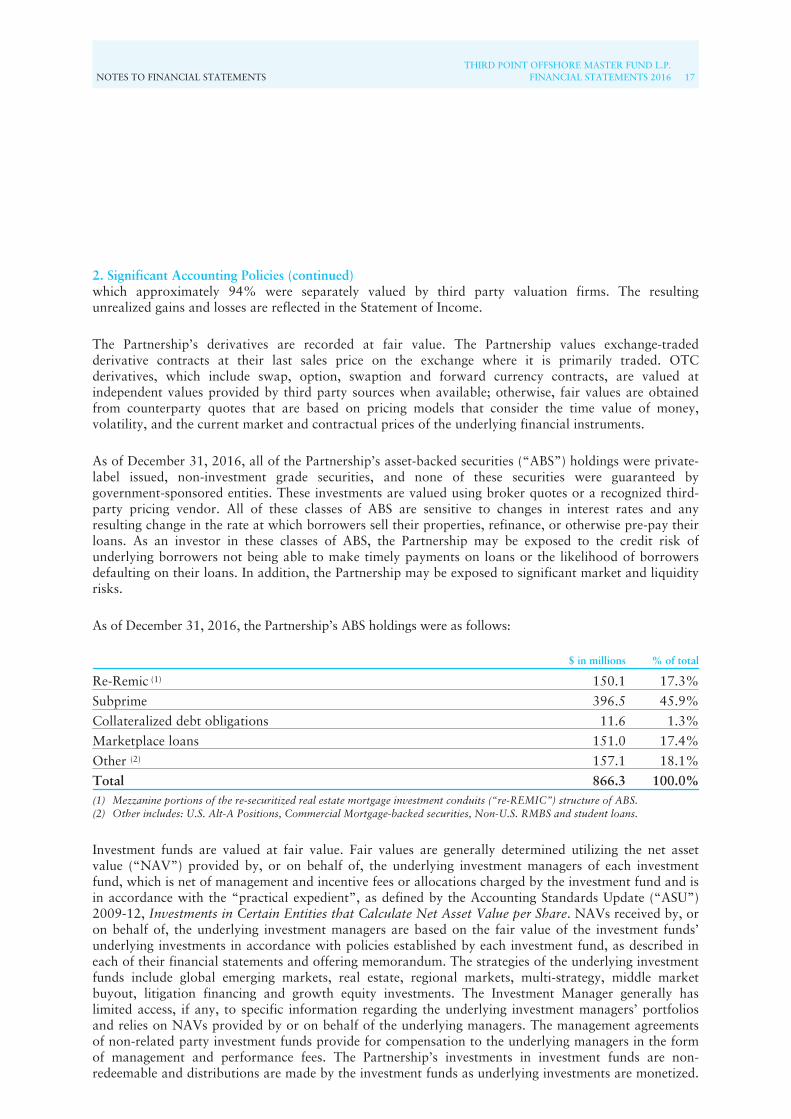
NOTES TO FINANCIAL STATEMENTSTHIRD POINT OFFSHORE MASTER FUND L.P.
FINANCIAL STATEMENTS 2016 17
2. Significant Accounting Policies (continued)which approximately 94% were separately valued by third party valuation firms. The resultingunrealized gains and losses are reflected in the Statement of Income.
The Partnership’s derivatives are recorded at fair value. The Partnership values exchange-tradedderivative contracts at their last sales price on the exchange where it is primarily traded. OTCderivatives, which include swap, option, swaption and forward currency contracts, are valued atindependent values provided by third party sources when available; otherwise, fair values are obtainedfrom counterparty quotes that are based on pricing models that consider the time value of money,volatility, and the current market and contractual prices of the underlying financial instruments.
As of December 31, 2016, all of the Partnership’s asset-backed securities (“ABS”) holdings were private-label issued, non-investment grade securities, and none of these securities were guaranteed bygovernment-sponsored entities. These investments are valued using broker quotes or a recognized third-party pricing vendor. All of these classes of ABS are sensitive to changes in interest rates and anyresulting change in the rate at which borrowers sell their properties, refinance, or otherwise pre-pay theirloans. As an investor in these classes of ABS, the Partnership may be exposed to the credit risk ofunderlying borrowers not being able to make timely payments on loans or the likelihood of borrowersdefaulting on their loans. In addition, the Partnership may be exposed to significant market and liquidityrisks.
As of December 31, 2016, the Partnership’s ABS holdings were as follows:
$ in millions % of total
Re-Remic (1) 150.1 17.3%
Subprime 396.5 45.9%
Collateralized debt obligations 11.6 1.3%
Marketplace loans 151.0 17.4%
Other (2) 157.1 18.1%
Total 866.3 100.0%(1) Mezzanine portions of the re-securitized real estate mortgage investment conduits (“re-REMIC”) structure of ABS.(2) Other includes: U.S. Alt-A Positions, Commercial Mortgage-backed securities, Non-U.S. RMBS and student loans.
Investment funds are valued at fair value. Fair values are generally determined utilizing the net assetvalue (“NAV”) provided by, or on behalf of, the underlying investment managers of each investmentfund, which is net of management and incentive fees or allocations charged by the investment fund and isin accordance with the “practical expedient”, as defined by the Accounting Standards Update (“ASU”)2009-12, Investments in Certain Entities that Calculate Net Asset Value per Share. NAVs received by, oron behalf of, the underlying investment managers are based on the fair value of the investment funds’underlying investments in accordance with policies established by each investment fund, as described ineach of their financial statements and offering memorandum. The strategies of the underlying investmentfunds include global emerging markets, real estate, regional markets, multi-strategy, middle marketbuyout, litigation financing and growth equity investments. The Investment Manager generally haslimited access, if any, to specific information regarding the underlying investment managers’ portfoliosand relies on NAVs provided by or on behalf of the underlying managers. The management agreementsof non-related party investment funds provide for compensation to the underlying managers in the formof management and performance fees. The Partnership’s investments in investment funds are non-redeemable and distributions are made by the investment funds as underlying investments are monetized.
18THIRD POINT OFFSHORE MASTER FUND L.P.FINANCIAL STATEMENTS 2016 NOTES TO FINANCIAL STATEMENTS
Notes to Financial Statements continuedYear ended December 31, 2016
2. Significant Accounting Policies (continued)It is expected that the underlying investments will be monetized over the next five years. During the yearended December 31, 2016, the Partnership received $20.8 million of distributions relating to theinvestment funds’ underlying investments.
Investments in affiliated funds are recorded at fair value in accordance with the valuation policiesdiscussed above. Investments in affiliated funds include the Partnership’s investments in the equity anddebt instruments of the special-purpose entities managed by the Investment Manager.
Certain of the Partnership’s investments are denominated in foreign currencies and thus, are subject to therisk associated with foreign currency fluctuations. These investments are translated into U.S. dollaramounts at the date of valuation. Purchases and sales of investments and income and expensesdenominated in foreign currencies are translated in U.S. dollar amounts on the respective dates of suchtransactions. The Partnership does not isolate the portion of the results of operations resulting from changein foreign exchange rates on investments, investments in affiliated funds and derivative contracts from thefluctuations arising from changes in market values of investments, investments in affiliated funds andderivative contracts. Such fluctuations are included within net realized gain/(loss) on securities, affiliatedfunds, derivative contracts and foreign currency translations and net change in unrealized gain/(loss) onsecurities, affiliated funds, derivative contracts, and foreign currency translations in the Statement ofIncome.
Fair value is defined as the price that the Partnership would receive to sell an asset or pay to transfer aliability in an orderly transaction between market participants at the measurement date. The disclosurerequirements also establish a framework for measuring fair value, and a three-level hierarchy for fairvalue measurements based upon the transparency of inputs to the valuation of an asset or liability. Thethree-tier hierarchy of inputs is summarized below:
• Level 1 – Quoted prices available in active markets/exchanges for identical investments as of thereporting date. The types of assets and liabilities that are classified at this level generally includeequity securities, futures and option contracts listed in active markets.
• Level 2 – Pricing inputs other than observable inputs including but not limited to prices quoted forsimilar assets or liabilities in active markets/exchanges or prices quoted for identical or similar assetsor liabilities in markets that are not active, and fair value is determined through the use of models orother valuation methodologies. The types of assets and liabilities that are classified at this levelgenerally include equity securities traded on non-active exchanges, corporate, sovereign, asset-backedand bank debt securities, forward contracts and certain derivatives.
• Level 3 – Pricing inputs are unobservable due to little, if any, market activity and data. The inputsinto determination of fair value require significant management judgment and estimation. The typesof assets and liabilities that are classified at this level generally include certain corporate and bankdebt, asset-backed securities, private investments, trade claims and certain derivatives.
Inputs refer broadly to the assumptions that market participants would use in pricing the asset orliability, including assumptions about risk, for example, the risk inherent in a particular valuationtechnique used to measure fair value including such a pricing model and/or the risk inherent in the inputsto the valuation technique. Inputs may be observable or unobservable.
Situations may arise when market quotations or valuations provided by external pricing vendors are availablebut the fair value may not represent current market conditions. In those cases, the Investment Manager maysubstitute valuations provided by external pricing vendors with multiple broker-dealer quotations.

NOTES TO FINANCIAL STATEMENTSTHIRD POINT OFFSHORE MASTER FUND L.P.
FINANCIAL STATEMENTS 2016 19
2. Significant Accounting Policies (continued)The Partnership has adopted ASU 2015-07, Disclosures for Investments in Certain Entities ThatCalculate Net Asset Value per Share (or Its Equivalent), and accordingly has not leveled positions valuedusing the practical expedient.
Observable inputs are inputs that reflect the assumptions market participants would use in pricing theasset or liability based on market data obtained from sources independent of the reporting entity.Unobservable inputs are inputs that reflect the reporting entity’s own assumptions about the assumptionsmarket participants would use in pricing the asset or liability developed based on the best informationavailable in the circumstances.
In certain cases, the inputs used to measure fair value may fall into different levels of the fair valuehierarchy. In such cases, an investment’s level within the fair value hierarchy is based on the lowest levelof input that is significant to the fair value measurement. The Investment Manager’s assessment of thesignificance of a particular input to the fair value measurement in its entirety requires judgment, andconsiders factors specific to the investment.
The key inputs for corporate, government and sovereign bonds valuation are coupon frequency, couponrate and underlying bond spread. The key inputs for asset-backed securities are yield, probability ofdefault, loss severity and prepayment.
Key inputs for OTC valuation vary based on the type of underlying on which the contract was written.Please see below discussion by OTC type:
• The key inputs for most OTC option contracts include notional, strike price, maturity, payoutstructure, current foreign exchange forward and spot rates, current market price of underlying andvolatility of underlying.
• The key inputs for most forward contracts include notional, maturity, forward rate, spot rate, variousinterest rate curves and discount factor.
• The key inputs for swap valuation will vary based on the type of underlying on which the contract waswritten. Generally, the key inputs for most swap contracts include notional, swap period, fixed rate, creditor interest rate curves, current market or spot price of the underlying and the volatility of the underlying.
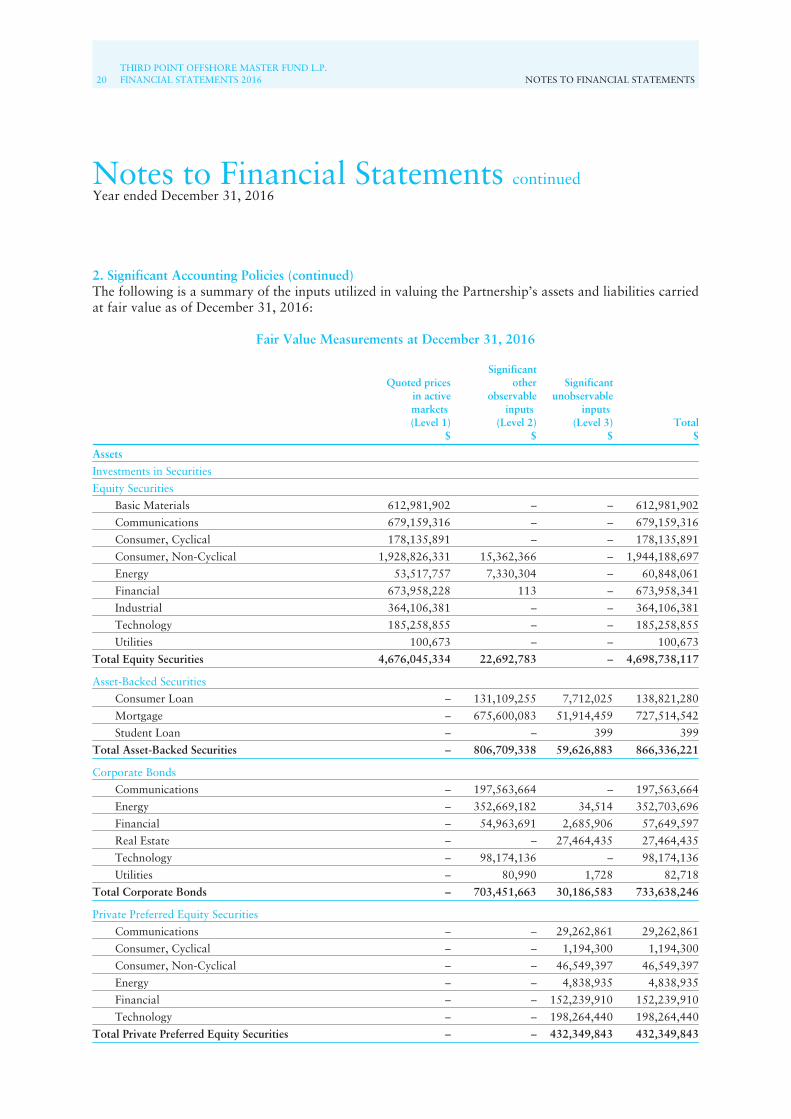
20THIRD POINT OFFSHORE MASTER FUND L.P.FINANCIAL STATEMENTS 2016 NOTES TO FINANCIAL STATEMENTS
Notes to Financial Statements continuedYear ended December 31, 2016
2. Significant Accounting Policies (continued)The following is a summary of the inputs utilized in valuing the Partnership’s assets and liabilities carriedat fair value as of December 31, 2016:
Fair Value Measurements at December 31, 2016
Quoted pricesin activemarkets(Level 1)
$
Significantother
observableinputs
(Level 2)$
Significantunobservable
inputs(Level 3)
$Total
$
Assets
Investments in Securities
Equity Securities
Basic Materials 612,981,902 – – 612,981,902
Communications 679,159,316 – – 679,159,316
Consumer, Cyclical 178,135,891 – – 178,135,891
Consumer, Non-Cyclical 1,928,826,331 15,362,366 – 1,944,188,697
Energy 53,517,757 7,330,304 – 60,848,061
Financial 673,958,228 113 – 673,958,341
Industrial 364,106,381 – – 364,106,381
Technology 185,258,855 – – 185,258,855
Utilities 100,673 – – 100,673
Total Equity Securities 4,676,045,334 22,692,783 – 4,698,738,117
Asset-Backed Securities
Consumer Loan – 131,109,255 7,712,025 138,821,280
Mortgage – 675,600,083 51,914,459 727,514,542
Student Loan – – 399 399
Total Asset-Backed Securities – 806,709,338 59,626,883 866,336,221
Corporate Bonds
Communications – 197,563,664 – 197,563,664
Energy – 352,669,182 34,514 352,703,696
Financial – 54,963,691 2,685,906 57,649,597
Real Estate – – 27,464,435 27,464,435
Technology – 98,174,136 – 98,174,136
Utilities – 80,990 1,728 82,718
Total Corporate Bonds – 703,451,663 30,186,583 733,638,246
Private Preferred Equity Securities
Communications – – 29,262,861 29,262,861
Consumer, Cyclical – – 1,194,300 1,194,300
Consumer, Non-Cyclical – – 46,549,397 46,549,397
Energy – – 4,838,935 4,838,935
Financial – – 152,239,910 152,239,910
Technology – – 198,264,440 198,264,440
Total Private Preferred Equity Securities – – 432,349,843 432,349,843
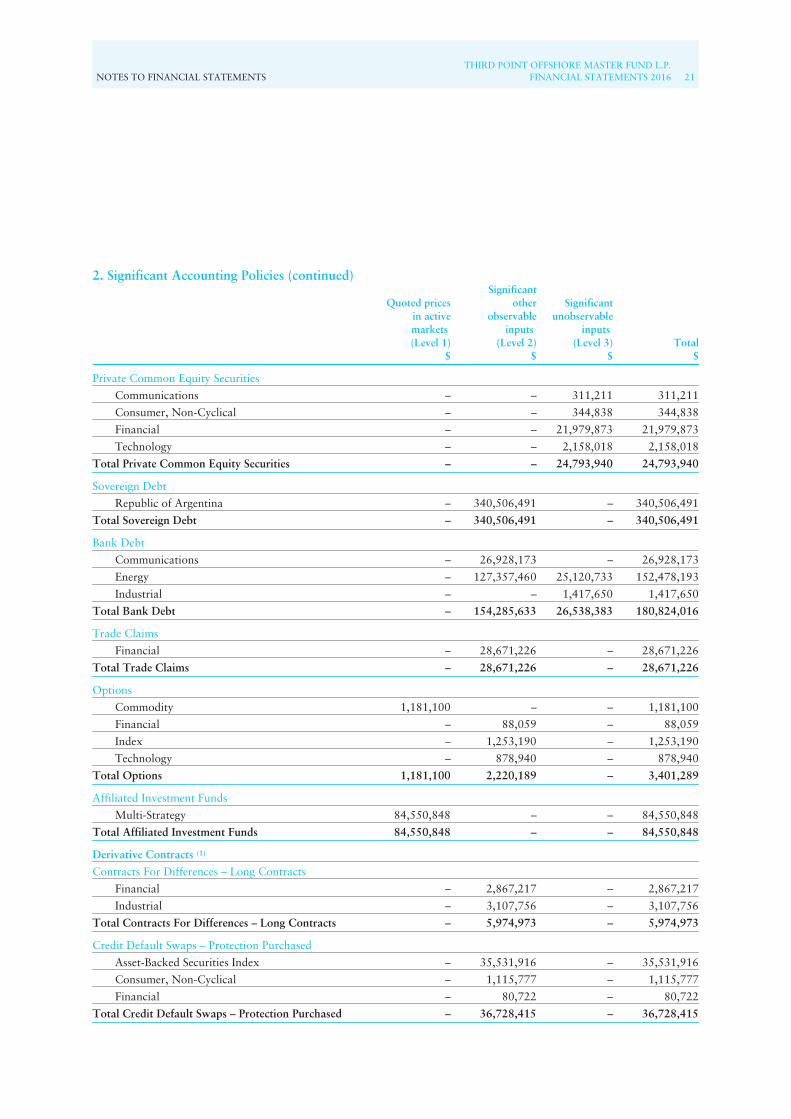
NOTES TO FINANCIAL STATEMENTSTHIRD POINT OFFSHORE MASTER FUND L.P.
FINANCIAL STATEMENTS 2016 21
2. Significant Accounting Policies (continued)
Quoted pricesin activemarkets(Level 1)
$
Significantother
observableinputs
(Level 2)$
Significantunobservable
inputs(Level 3)
$Total
$
Private Common Equity Securities
Communications – – 311,211 311,211
Consumer, Non-Cyclical – – 344,838 344,838
Financial – – 21,979,873 21,979,873
Technology – – 2,158,018 2,158,018
Total Private Common Equity Securities – – 24,793,940 24,793,940
Sovereign Debt
Republic of Argentina – 340,506,491 – 340,506,491
Total Sovereign Debt – 340,506,491 – 340,506,491
Bank Debt
Communications – 26,928,173 – 26,928,173
Energy – 127,357,460 25,120,733 152,478,193
Industrial – – 1,417,650 1,417,650
Total Bank Debt – 154,285,633 26,538,383 180,824,016
Trade Claims
Financial – 28,671,226 – 28,671,226
Total Trade Claims – 28,671,226 – 28,671,226
Options
Commodity 1,181,100 – – 1,181,100
Financial – 88,059 – 88,059
Index – 1,253,190 – 1,253,190
Technology – 878,940 – 878,940
Total Options 1,181,100 2,220,189 – 3,401,289
Affiliated Investment Funds
Multi-Strategy 84,550,848 – – 84,550,848
Total Affiliated Investment Funds 84,550,848 – – 84,550,848
Derivative Contracts (1)
Contracts For Differences – Long Contracts
Financial – 2,867,217 – 2,867,217
Industrial – 3,107,756 – 3,107,756
Total Contracts For Differences – Long Contracts – 5,974,973 – 5,974,973
Credit Default Swaps – Protection Purchased
Asset-Backed Securities Index – 35,531,916 – 35,531,916
Consumer, Non-Cyclical – 1,115,777 – 1,115,777
Financial – 80,722 – 80,722
Total Credit Default Swaps – Protection Purchased – 36,728,415 – 36,728,415
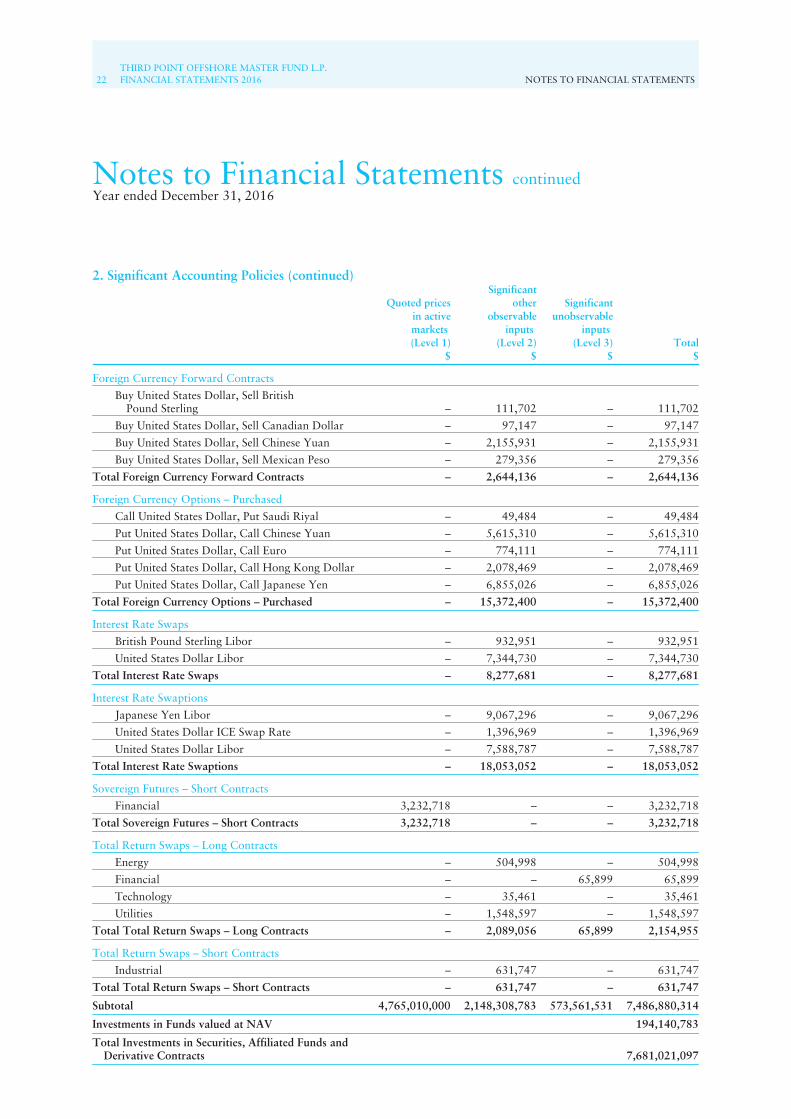
22THIRD POINT OFFSHORE MASTER FUND L.P.FINANCIAL STATEMENTS 2016 NOTES TO FINANCIAL STATEMENTS
Notes to Financial Statements continuedYear ended December 31, 2016
2. Significant Accounting Policies (continued)
Quoted pricesin activemarkets(Level 1)
$
Significantother
observableinputs
(Level 2)$
Significantunobservable
inputs(Level 3)
$Total
$
Foreign Currency Forward Contracts
Buy United States Dollar, Sell BritishPound Sterling – 111,702 – 111,702
Buy United States Dollar, Sell Canadian Dollar – 97,147 – 97,147
Buy United States Dollar, Sell Chinese Yuan – 2,155,931 – 2,155,931
Buy United States Dollar, Sell Mexican Peso – 279,356 – 279,356
Total Foreign Currency Forward Contracts – 2,644,136 – 2,644,136
Foreign Currency Options – Purchased
Call United States Dollar, Put Saudi Riyal – 49,484 – 49,484
Put United States Dollar, Call Chinese Yuan – 5,615,310 – 5,615,310
Put United States Dollar, Call Euro – 774,111 – 774,111
Put United States Dollar, Call Hong Kong Dollar – 2,078,469 – 2,078,469
Put United States Dollar, Call Japanese Yen – 6,855,026 – 6,855,026
Total Foreign Currency Options – Purchased – 15,372,400 – 15,372,400
Interest Rate Swaps
British Pound Sterling Libor – 932,951 – 932,951
United States Dollar Libor – 7,344,730 – 7,344,730
Total Interest Rate Swaps – 8,277,681 – 8,277,681
Interest Rate Swaptions
Japanese Yen Libor – 9,067,296 – 9,067,296
United States Dollar ICE Swap Rate – 1,396,969 – 1,396,969
United States Dollar Libor – 7,588,787 – 7,588,787
Total Interest Rate Swaptions – 18,053,052 – 18,053,052
Sovereign Futures – Short Contracts
Financial 3,232,718 – – 3,232,718
Total Sovereign Futures – Short Contracts 3,232,718 – – 3,232,718
Total Return Swaps – Long Contracts
Energy – 504,998 – 504,998
Financial – – 65,899 65,899
Technology – 35,461 – 35,461
Utilities – 1,548,597 – 1,548,597
Total Total Return Swaps – Long Contracts – 2,089,056 65,899 2,154,955
Total Return Swaps – Short Contracts
Industrial – 631,747 – 631,747
Total Total Return Swaps – Short Contracts – 631,747 – 631,747
Subtotal 4,765,010,000 2,148,308,783 573,561,531 7,486,880,314
Investments in Funds valued at NAV 194,140,783
Total Investments in Securities, Affiliated Funds andDerivative Contracts 7,681,021,097

NOTES TO FINANCIAL STATEMENTSTHIRD POINT OFFSHORE MASTER FUND L.P.
FINANCIAL STATEMENTS 2016 23
2. Significant Accounting Policies (continued)
Quoted pricesin activemarkets(Level 1)
$
Significantother
observableinputs
(Level 2)$
Significantunobservable
inputs(Level 3)
$Total
$
Liabilities
Equity Securities
Communications 11,418,408 – – 11,418,408
Consumer, Cyclical 17,017,132 – – 17,017,132
Consumer, Non-Cyclical 70,042,796 – – 70,042,796
Energy 12,159,764 – – 12,159,764
Financial 51,338,670 – – 51,338,670
Industrial 54,741,432 – – 54,741,432
Technology 11,288,924 – – 11,288,924
Total Equity Securities 228,007,126 – – 228,007,126
Corporate Bonds
Consumer, Non-Cyclical – 41,736,562 – 41,736,562
Utilities – 17,599,883 – 17,599,883
Total Corporate Bonds – 59,336,445 – 59,336,445
Options
Basic Materials – 664,956 – 664,956
Communications – 4,711,200 – 4,711,200
Consumer, Non-Cyclical – 617,472 – 617,472
Financial – 2,127,461 – 2,127,461
Index – 2,483,800 – 2,483,800
Technology – 1,191,195 – 1,191,195
Total Options – 11,796,084 – 11,796,084
Derivative Contracts(1)
Contracts For Differences – Short Contracts
Consumer, Cyclical – 3,707,214 – 3,707,214
Total Contracts For Differences – Short Contracts – 3,707,214 – 3,707,214
Credit Default Swaps – Protection Purchased
Asset-Backed Securities Index – 449,330 – 449,330
Communications – 380,199 – 380,199
Consumer, Cyclical – 9,637,475 – 9,637,475
Total Credit Default Swaps – Protection Purchased – 10,467,004 – 10,467,004
Credit Default Swaps – Protection Sold
Asset-Backed Securities – 2,116,813 4,487,706 6,604,519
Total Credit Default Swaps – Protection Sold – 2,116,813 4,487,706 6,604,519

24THIRD POINT OFFSHORE MASTER FUND L.P.FINANCIAL STATEMENTS 2016 NOTES TO FINANCIAL STATEMENTS
Notes to Financial Statements continuedYear ended December 31, 2016
2. Significant Accounting Policies (continued)
Quoted pricesin activemarkets(Level 1)
$
Significantother
observableinputs
(Level 2)$
Significantunobservable
inputs(Level 3)
$Total
$
Foreign Currency Forward Contracts
Buy United States Dollar, Sell Euro – 4,599,060 – 4,599,060
Buy United States Dollar, Sell Japanese Yen – 1,387,145 – 1,387,145
Buy United States Dollar, Sell Saudi Riyal – 893,921 – 893,921
Sell United States Dollar, Buy BritishPound Sterling – 847,776 – 847,776
Total Foreign Currency Forward Contracts – 7,727,902 – 7,727,902
Foreign Currency Options – Sold
Put United States Dollar, Call Japanese Yen – 2,890,460 – 2,890,460
Put United States Dollar, Call Chinese Yuan – 1,636,064 – 1,636,064
Total Foreign Currency Options – Sold – 4,526,524 – 4,526,524
Interest Rate Swaps
British Pound Sterling Libor – 2,415,523 – 2,415,523
Total Interest Rate Swaps – 2,415,523 – 2,415,523
Interest Rate Swaptions
Japanese Yen Libor – 1,384,817 – 1,384,817
United States Dollar ICE Swap Rate – 255 – 255
United States Dollar Libor – 2,167,603 – 2,167,603
Total Interest Rate Swaptions – 3,552,675 – 3,552,675
Sovereign Futures – Short Contracts
Financial 5,407,691 – – 5,407,691
Total Sovereign Futures – Short Contracts 5,407,691 – – 5,407,691
Total Return Swaps – Long Contracts
Energy – 340,655 – 340,655
Industrial – 135,540 – 135,540
Technology – 335,163 – 335,163
Total Total Return Swaps – Long Contracts – 811,358 – 811,358
Total Return Swaps - Short Contracts
Industrial – 4,483,678 – 4,483,678
Total Total Return Swaps – Short Contracts – 4,483,678 – 4,483,678
Total Securities Sold, not yet Purchased andDerivative Contracts 233,414,817 110,941,220 4,487,706 348,843,743
(1) Derivative instruments are shown gross of any offsetting permitted under U.S. GAAP.
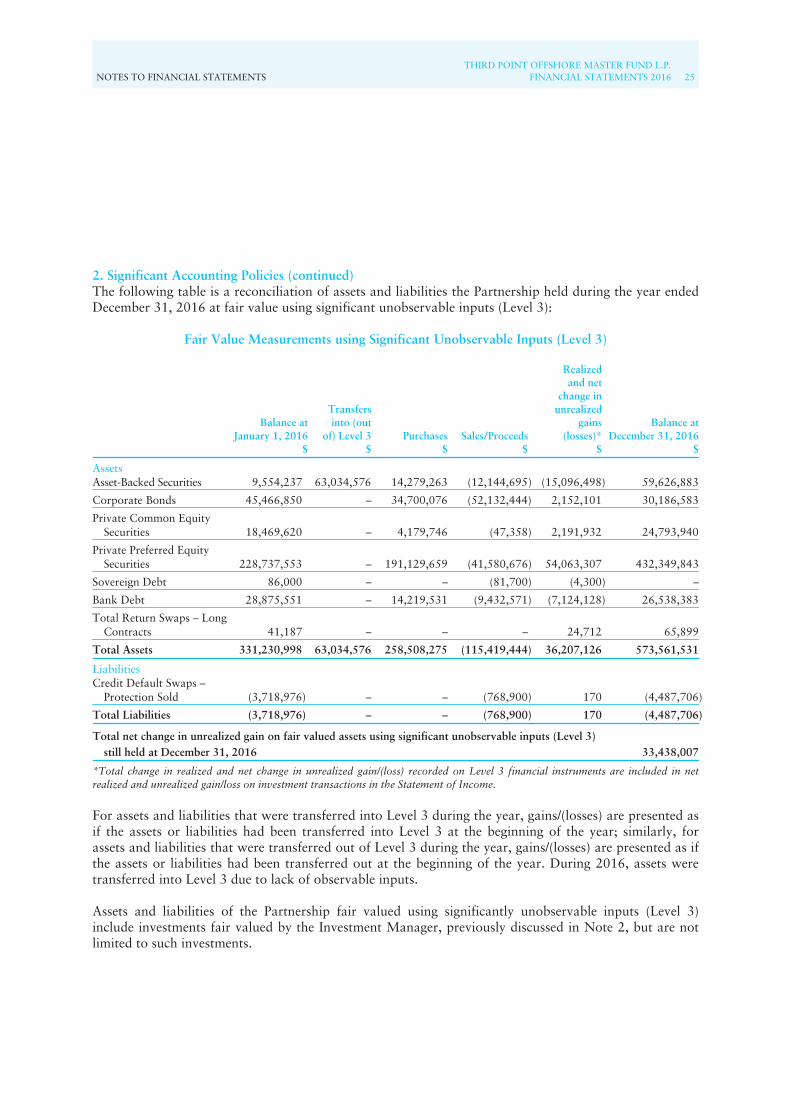
NOTES TO FINANCIAL STATEMENTSTHIRD POINT OFFSHORE MASTER FUND L.P.
FINANCIAL STATEMENTS 2016 25
2. Significant Accounting Policies (continued)The following table is a reconciliation of assets and liabilities the Partnership held during the year endedDecember 31, 2016 at fair value using significant unobservable inputs (Level 3):
Fair Value Measurements using Significant Unobservable Inputs (Level 3)
Balance atJanuary 1, 2016
$
Transfersinto (out
of) Level 3$
Purchases$
Sales/Proceeds$
Realizedand net
change inunrealized
gains(losses)*
$
Balance atDecember 31, 2016
$
AssetsAsset-Backed Securities 9,554,237 63,034,576 14,279,263 (12,144,695) (15,096,498) 59,626,883
Corporate Bonds 45,466,850 – 34,700,076 (52,132,444) 2,152,101 30,186,583
Private Common EquitySecurities 18,469,620 – 4,179,746 (47,358) 2,191,932 24,793,940
Private Preferred EquitySecurities 228,737,553 – 191,129,659 (41,580,676) 54,063,307 432,349,843
Sovereign Debt 86,000 – – (81,700) (4,300) –
Bank Debt 28,875,551 – 14,219,531 (9,432,571) (7,124,128) 26,538,383
Total Return Swaps – LongContracts 41,187 – – – 24,712 65,899
Total Assets 331,230,998 63,034,576 258,508,275 (115,419,444) 36,207,126 573,561,531
LiabilitiesCredit Default Swaps –
Protection Sold (3,718,976) – – (768,900) 170 (4,487,706)
Total Liabilities (3,718,976) – – (768,900) 170 (4,487,706)
Total net change in unrealized gain on fair valued assets using significant unobservable inputs (Level 3)still held at December 31, 2016 33,438,007
*Total change in realized and net change in unrealized gain/(loss) recorded on Level 3 financial instruments are included in netrealized and unrealized gain/loss on investment transactions in the Statement of Income.
For assets and liabilities that were transferred into Level 3 during the year, gains/(losses) are presented asif the assets or liabilities had been transferred into Level 3 at the beginning of the year; similarly, forassets and liabilities that were transferred out of Level 3 during the year, gains/(losses) are presented as ifthe assets or liabilities had been transferred out at the beginning of the year. During 2016, assets weretransferred into Level 3 due to lack of observable inputs.
Assets and liabilities of the Partnership fair valued using significantly unobservable inputs (Level 3)include investments fair valued by the Investment Manager, previously discussed in Note 2, but are notlimited to such investments.
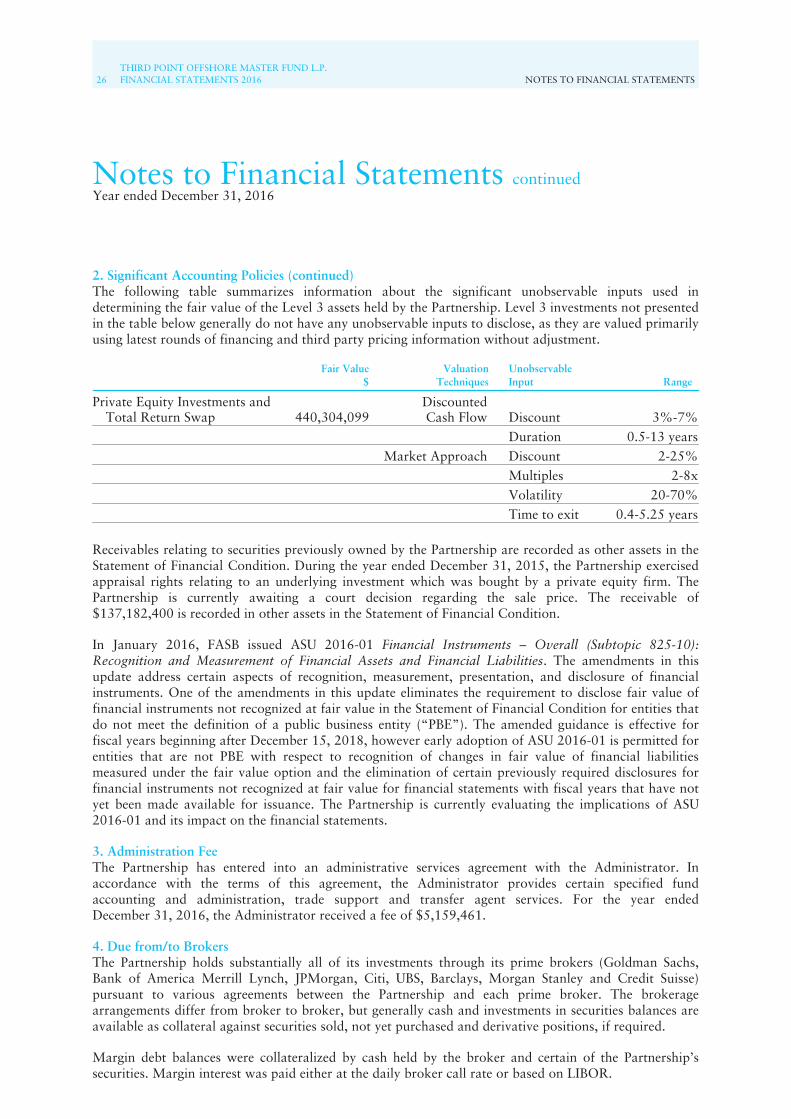
26THIRD POINT OFFSHORE MASTER FUND L.P.FINANCIAL STATEMENTS 2016 NOTES TO FINANCIAL STATEMENTS
Notes to Financial Statements continuedYear ended December 31, 2016
2. Significant Accounting Policies (continued)The following table summarizes information about the significant unobservable inputs used indetermining the fair value of the Level 3 assets held by the Partnership. Level 3 investments not presentedin the table below generally do not have any unobservable inputs to disclose, as they are valued primarilyusing latest rounds of financing and third party pricing information without adjustment.
Fair Value$
ValuationTechniques
UnobservableInput Range
Private Equity Investments andTotal Return Swap 440,304,099
DiscountedCash Flow Discount 3%-7%
Duration 0.5-13 yearsMarket Approach Discount 2-25%
Multiples 2-8xVolatility 20-70%Time to exit 0.4-5.25 years
Receivables relating to securities previously owned by the Partnership are recorded as other assets in theStatement of Financial Condition. During the year ended December 31, 2015, the Partnership exercisedappraisal rights relating to an underlying investment which was bought by a private equity firm. ThePartnership is currently awaiting a court decision regarding the sale price. The receivable of$137,182,400 is recorded in other assets in the Statement of Financial Condition.
In January 2016, FASB issued ASU 2016-01 Financial Instruments – Overall (Subtopic 825-10):Recognition and Measurement of Financial Assets and Financial Liabilities. The amendments in thisupdate address certain aspects of recognition, measurement, presentation, and disclosure of financialinstruments. One of the amendments in this update eliminates the requirement to disclose fair value offinancial instruments not recognized at fair value in the Statement of Financial Condition for entities thatdo not meet the definition of a public business entity (“PBE”). The amended guidance is effective forfiscal years beginning after December 15, 2018, however early adoption of ASU 2016-01 is permitted forentities that are not PBE with respect to recognition of changes in fair value of financial liabilitiesmeasured under the fair value option and the elimination of certain previously required disclosures forfinancial instruments not recognized at fair value for financial statements with fiscal years that have notyet been made available for issuance. The Partnership is currently evaluating the implications of ASU2016-01 and its impact on the financial statements.
3. Administration FeeThe Partnership has entered into an administrative services agreement with the Administrator. Inaccordance with the terms of this agreement, the Administrator provides certain specified fundaccounting and administration, trade support and transfer agent services. For the year endedDecember 31, 2016, the Administrator received a fee of $5,159,461.
4. Due from/to BrokersThe Partnership holds substantially all of its investments through its prime brokers (Goldman Sachs,Bank of America Merrill Lynch, JPMorgan, Citi, UBS, Barclays, Morgan Stanley and Credit Suisse)pursuant to various agreements between the Partnership and each prime broker. The brokeragearrangements differ from broker to broker, but generally cash and investments in securities balances areavailable as collateral against securities sold, not yet purchased and derivative positions, if required.
Margin debt balances were collateralized by cash held by the broker and certain of the Partnership’ssecurities. Margin interest was paid either at the daily broker call rate or based on LIBOR.
NOTES TO FINANCIAL STATEMENTSTHIRD POINT OFFSHORE MASTER FUND L.P.
FINANCIAL STATEMENTS 2016 27
4. Due from/to Brokers (continued)Due from/to brokers include cash balances maintained with the Partnership’s prime brokers, receivablesand payables from unsettled trades and proceeds from securities sold, not yet purchased. In addition, duefrom/to brokers includes cash collateral received and posted from OTC and repurchase agreementcounterparties. At December 31, 2016, the Partnership’s due from/to brokers includes a total non-U.S.currency balance of $86,891,368.
5. Allocation of Net Income or Net LossIn accordance with the provisions of the Agreement, net income or net loss of the Partnership is allocatedto the general capital account of the Feeder and General Partner in proportion to their respective generalcapital accounts.
Net income or net loss is allocated each fiscal period, as defined in the Agreement, or at other times duringthe fiscal year when capital contributions and withdrawals are made by the Feeder or General Partner. TheFeeder’s percentage ownership of the Partnership will increase when the General Partner withdraws capitalor decrease when the General Partner contributes additional capital. Therefore, the allocation of net incomeand net loss may vary, between the Feeder and the General Partner, based upon the timing of capitaltransactions throughout the year.
The Partnership may invest, directly or indirectly, in equity securities in initial public offerings deemed“new issues” under Rule 5130 of the Financial Industry Regulatory Authority (“FINRA”) ConsolidatedRulebook. “New issues” are defined as any initial public offering of an equity, regardless of whethersuch security is trading at a premium in the secondary market. FINRA members generally may not sell“new issues” to an account, in which certain persons or entities designated as restricted persons havebeneficial interest. Gains and losses from “new issues” are allocated primarily to the Feeder and up to10% can be allocated to the General Partner.
The General Partner receives an incentive allocation equal to 20% of the net profit allocated to eachshareholder invested in each series of Class A, B, C, D, E, F and H shares of the Feeder and 25% of thenet profit allocated to each shareholder invested in each series of Class J of the Feeder, as defined in theAgreement (the “Full Incentive Allocation”). If a shareholder invested in the Feeder has a net loss duringany fiscal year and, during subsequent years, there is a net profit attributable to such shareholder, theshareholder must recover an amount equal to 2.5 times the amount of the net loss chargeable in the prioryears before the General Partner is entitled to the Full Incentive Allocation. Until this occurs, theshareholder invested in the Feeder will be subject to a reduced incentive allocation equal to half of theFull Incentive Allocation. The General Partner, in its sole discretion, may elect to reduce, waive orcalculate differently the Full Incentive Allocation of the Feeder and its underlying investors that arepartners, members, employees, affiliates or other related investors of the Investment Manager or theGeneral Partner. For the year ended December 31, 2016, the General Partner received an incentiveallocation of $79,033,970.
6. Related Party TransactionsThe Investment Manager does not charge the Partnership a management fee. Management fees arecharged to the Feeder. No additional fees are charged to the Partnership by the Investment Manager orits affiliates for related entities discussed below.
As of December 31, 2016, the Partnership had a balance of $209,362 due to the Investment Manager. Inaccordance with the Partnership Agreement, this amount is related to professional fees paid by theInvestment Manager on behalf of the Partnership and is included in accrued expenses in the Statement ofFinancial Condition. For the year ended December 31, 2016, the Investment Manager paid $937,526 ofprofessional fees on behalf of the Partnership, which are included in administrative and professional feesand other expenses in the Statement of Income. The amounts are non-interest bearing and are intendedto be reimbursed by the Partnership through distributions of current income and disposition proceeds.
28THIRD POINT OFFSHORE MASTER FUND L.P.FINANCIAL STATEMENTS 2016 NOTES TO FINANCIAL STATEMENTS
Notes to Financial Statements continuedYear ended December 31, 2016
6. Related Party Transactions (continued)The Partnership has entered into a limited partnership agreement, as a limited partner, with TP LuxHoldco LP (“Cayman HoldCo”), an affiliate of the Investment Manager. Cayman HoldCo wasorganized as a limited partnership under the laws of the Cayman Islands and will invest and hold debtand equity interests in TP Lux HoldCo S.a.r.l, a Luxembourg private limited liability company(“LuxCo”), also an affiliate of the Investment Manager. LuxCo was established under the laws of theGrand-Duchy of Luxembourg and its principle objective is to act as a collective investment vehiclethrough which purchases of certain European debt and equity investments will be pooled. Certain debtand equity instruments will be purchased by LuxCo and will be financed through the issuance of the debtand equity instruments purchased by Cayman HoldCo. As of December 31, 2016, the estimated fairvalue of the investment in the limited partnership was $126,485,985. The Partnership made netcontributions of $118,660,720 to Cayman Holdco and realized losses of $1,276,282 during the yearended December 31, 2016 due to the disposition of underlying investments. The Partnership’s pro ratainterest in the investments of LuxCo and the related income and expense are reflected accordingly on theaccompanying Statement of Financial Condition, the underlying Condensed Schedule of Investments andthe Statement of Income. The valuation policy with respect to these investments is the same as thePartnership’s valuation policy as described in Note 2. The Partnership invests in Cayman HoldCoalongside other affiliated entities.
At December 31, 2016, the Partnership held five affiliated special purpose vehicles (the “SPVs”), which is acompany organized for the purpose of achieving certain tax, regulatory or administrative efficiencies. ThePartnership’s pro rata interest in the underlying assets and liabilities of the SPVs and the related income andexpense are reflected accordingly on the accompanying Statement of Financial Condition, the underlyingCondensed Schedule of Investments and the Statement of Income. As of December 31, 2016, the total fairvalue of the SPVs was $70,383,440. The valuation policy with respect to investments held by the SPVs isthe same as the Partnership’s valuation policy as described in Note 2. The Partnership invests in the SPVsalongside other affiliated entities.
Third Point Loan LLC (“Loan LLC”) and Third Point Ventures LLC (“Ventures LLC”), (collectively the“Nominees”), serve as nominees of the Partnership and other affiliated investment management clients ofthe Investment Manager for certain investments. The Nominees have appointed the Investment Manageras their true and lawful agent and attorney. At December 31, 2016, Loan LLC held $532,228,879 andVentures LLC held $200,866,587 of the Partnership’s investments which are included in investments insecurities in the Statement of Financial Condition. The Partnership’s pro rata interest in the underlyinginvestments registered in the name of the Nominees and the related income and expense are reflectedaccordingly in the accompanying Statement of Financial Condition, Condensed Schedule of Investments,and the Statement of Income. The valuation policy with respect to investments held by the Nominees isthe same as the Partnership’s valuation policy as described in Note 2.
At December 31, 2016, the Partnership held shares of Third Point Offshore Investors Limited(“ListCo”), a London Stock Exchange listed entity that is managed by the Investment Manager. As partof ListCo’s share buy-back program, the Partnership has the ability to purchase shares in theafter-market or as part of other corporate actions. At December 31, 2016, the Partnership owned5,879,753 U.S. Dollar Shares of ListCo with a total market value of $84,550,848 and an unrealized gainof $32,248,191 related to the share buy-back program. All gains or losses and implied financing costs areallocated entirely to ListCo’s shares in the Feeder.
The Partnership is a limited partner in Third Point Hellenic Recovery U.S. Feeder Fund, L.P. (the “HellenicFund”), which is an affiliate of the Investment Manager. The Hellenic Fund was formed as a limitedpartnership under the laws of the Cayman Islands and invests in and holds debt and equity interests in

NOTES TO FINANCIAL STATEMENTSTHIRD POINT OFFSHORE MASTER FUND L.P.
FINANCIAL STATEMENTS 2016 29
6. Related Party Transactions (continued)Greek and Cypriot companies. The Partnership’s interest in the Hellenic Fund is highly illiquid due to thenature of underlying investments. The Partnership committed $82,016,449 to the Hellenic Fund, of which$71,142 was called and $1,158,354 was distributed during the year ended December 31, 2016. Thedistributions received by the Partnership during the year were treated as a return of capital and included innet change in unrealized loss on affiliated funds and foreign currency translations in the Statement ofIncome. As of December 31, 2016, the Partnership’s remaining unfunded commitment to the Hellenic Fundwas $24,674,919. As of December 31, 2016, the estimated fair value of the investment in the Hellenic Fundwas $42,369,660. The valuation policy with respect to this investment in a limited partnership is furtherdescribed in Note 2.
7. Financial Instruments with Off-Balance Sheet Risk or Concentrations of Credit RiskIn the normal course of its business, the Partnership trades various financial instruments and engages invarious investment activities with off-balance sheet risk. These financial instruments include securities sold,not yet purchased, forwards, futures, options, swaptions, swaps and contracts for differences. Generally,these financial instruments represent future commitments to purchase or sell other financial instruments atspecific terms at specified future dates. Each of these financial instruments contains varying degrees of off-balance sheet risk whereby changes in the fair values of the securities underlying the financial instrumentsor fluctuations in interest rates and index values may exceed the amounts recognized in the Statement ofFinancial Condition.
Securities sold, not yet purchased are recorded as liabilities in the Statement of Financial Condition andhave market risk to the extent that the Partnership, in satisfying its obligations, may have to purchasesecurities at a higher value than that recorded in the Statement of Financial Condition. The Partnership’sinvestments in securities and amounts due from brokers are partially restricted until the Partnership satisfiesthe obligation to deliver securities sold, not yet purchased.
Forward and future contracts are a commitment to purchase or sell financial instruments, currencies orcommodities at a future date at a negotiated rate. Forward and future contracts expose the Partnership tomarket risks to the extent that adverse changes occur to the underlying financial instruments such ascurrency rates or equity index fluctuations.
Option contracts give the purchaser the right but not the obligation to purchase or sell to the optionwriter financial instruments, or currencies within a defined time period for a specified price. Thepremium received by the Partnership upon writing an option contract is recorded as a liability, marked tomarket on a daily basis and is included in securities sold, not yet purchased in the Statement of FinancialCondition. In writing an option, the Partnership bears the market risk of an unfavorable change in thefinancial instrument underlying the written option. Exercise of an option written by the Partnershipcould result in the Partnership selling or buying a financial instrument at a price different from thecurrent fair value.
In the normal course of trading activities, the Partnership trades and holds certain fair value derivativecontracts, such as written options, which constitute guarantees. The maximum payout for written putoptions is limited to the number of contracts written and the related strike prices and the maximumpayout for written call options is contingent upon the market price of the underlying security at the dateof a payout event. At December 31, 2016, the portfolio had a maximum payout amount of$280,225,500 relating to written put equity and index option contracts and $1,235,240,891 of foreigncurrency options option contracts with expiration 6 months from the Statement of Financial Conditiondate. The maximum payout amount could be offset by the subsequent sale, if any, of assets obtained viathe settlement of a payout event. The fair value of the written put equity and index options as ofDecember 31, 2016 is $4,292,467 and is included in securities sold, not yet purchased in the Statement
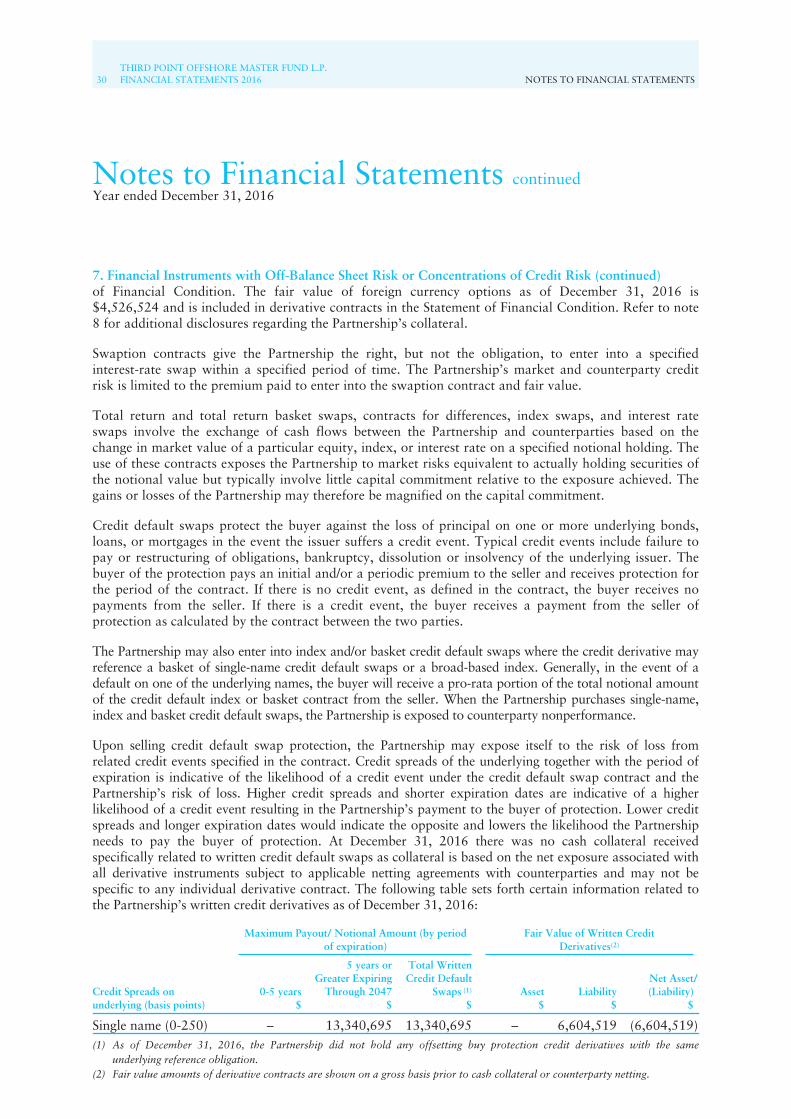
30THIRD POINT OFFSHORE MASTER FUND L.P.FINANCIAL STATEMENTS 2016 NOTES TO FINANCIAL STATEMENTS
Notes to Financial Statements continuedYear ended December 31, 2016
7. Financial Instruments with Off-Balance Sheet Risk or Concentrations of Credit Risk (continued)of Financial Condition. The fair value of foreign currency options as of December 31, 2016 is$4,526,524 and is included in derivative contracts in the Statement of Financial Condition. Refer to note8 for additional disclosures regarding the Partnership’s collateral.
Swaption contracts give the Partnership the right, but not the obligation, to enter into a specifiedinterest-rate swap within a specified period of time. The Partnership’s market and counterparty creditrisk is limited to the premium paid to enter into the swaption contract and fair value.
Total return and total return basket swaps, contracts for differences, index swaps, and interest rateswaps involve the exchange of cash flows between the Partnership and counterparties based on thechange in market value of a particular equity, index, or interest rate on a specified notional holding. Theuse of these contracts exposes the Partnership to market risks equivalent to actually holding securities ofthe notional value but typically involve little capital commitment relative to the exposure achieved. Thegains or losses of the Partnership may therefore be magnified on the capital commitment.
Credit default swaps protect the buyer against the loss of principal on one or more underlying bonds,loans, or mortgages in the event the issuer suffers a credit event. Typical credit events include failure topay or restructuring of obligations, bankruptcy, dissolution or insolvency of the underlying issuer. Thebuyer of the protection pays an initial and/or a periodic premium to the seller and receives protection forthe period of the contract. If there is no credit event, as defined in the contract, the buyer receives nopayments from the seller. If there is a credit event, the buyer receives a payment from the seller ofprotection as calculated by the contract between the two parties.
The Partnership may also enter into index and/or basket credit default swaps where the credit derivative mayreference a basket of single-name credit default swaps or a broad-based index. Generally, in the event of adefault on one of the underlying names, the buyer will receive a pro-rata portion of the total notional amountof the credit default index or basket contract from the seller. When the Partnership purchases single-name,index and basket credit default swaps, the Partnership is exposed to counterparty nonperformance.
Upon selling credit default swap protection, the Partnership may expose itself to the risk of loss fromrelated credit events specified in the contract. Credit spreads of the underlying together with the period ofexpiration is indicative of the likelihood of a credit event under the credit default swap contract and thePartnership’s risk of loss. Higher credit spreads and shorter expiration dates are indicative of a higherlikelihood of a credit event resulting in the Partnership’s payment to the buyer of protection. Lower creditspreads and longer expiration dates would indicate the opposite and lowers the likelihood the Partnershipneeds to pay the buyer of protection. At December 31, 2016 there was no cash collateral receivedspecifically related to written credit default swaps as collateral is based on the net exposure associated withall derivative instruments subject to applicable netting agreements with counterparties and may not bespecific to any individual derivative contract. The following table sets forth certain information related tothe Partnership’s written credit derivatives as of December 31, 2016:
Maximum Payout/ Notional Amount (by periodof expiration)
Fair Value of Written CreditDerivatives(2)
Credit Spreads onunderlying (basis points)
0-5 years$
5 years orGreater Expiring
Through 2047$
Total WrittenCredit Default
Swaps (1)
$Asset
$Liability
$
Net Asset/(Liability)
$
Single name (0-250) – 13,340,695 13,340,695 – 6,604,519 (6,604,519)(1) As of December 31, 2016, the Partnership did not hold any offsetting buy protection credit derivatives with the same
underlying reference obligation.(2) Fair value amounts of derivative contracts are shown on a gross basis prior to cash collateral or counterparty netting.

NOTES TO FINANCIAL STATEMENTSTHIRD POINT OFFSHORE MASTER FUND L.P.
FINANCIAL STATEMENTS 2016 31
7. Financial Instruments with Off-Balance Sheet Risk or Concentrations of Credit Risk (continued)In addition to off-balance sheet risks related to specific financial instruments, the Partnership may besubject to concentration of credit risk with particular counterparties. Substantially all securitiestransactions of the Partnership are cleared by several major securities firms. The Partnership hadsubstantially all such individual counterparty concentration with these brokers or their affiliates as ofDecember 31, 2016. However, the Partnership reduces its credit risk with counterparties by entering intomaster netting agreements.
The Partnership’s maximum exposure to credit risk associated with counterparty nonperformance onderivative contracts is limited to the net unrealized gains by counterparty inherent in such contractswhich are recognized in the Statement of Financial Condition. At December 31, 2016, the Partnership’smaximum counterparty credit risk exposure was $95,290,266.
8. Derivative ContractsThe Partnership enters into derivative contracts to manage credit risk, interest rate risk, currencyexchange risk, and other exposure risks. The Partnership uses derivatives in connection with its risk-management activities to hedge certain risks and to gain exposure to certain investments. The utilizationof derivative contracts also allows for an efficient means in which to trade certain asset classes. Thederivatives that the Partnership invests in are primarily swaps, forwards, options, futures, swaptions andcontracts for differences. Typically, derivatives serve as a component of the Partnership’s investmentstrategy and are utilized primarily to structure the portfolio, or individual investments, to economicallymatch the investment objective of the Partnership. Fair values of derivatives are determined by usingquoted market prices and counterparty quotes when available; otherwise fair values are based on pricingmodels that consider the time value of money, volatility, and the current market and contractual prices ofunderlying financial instruments.
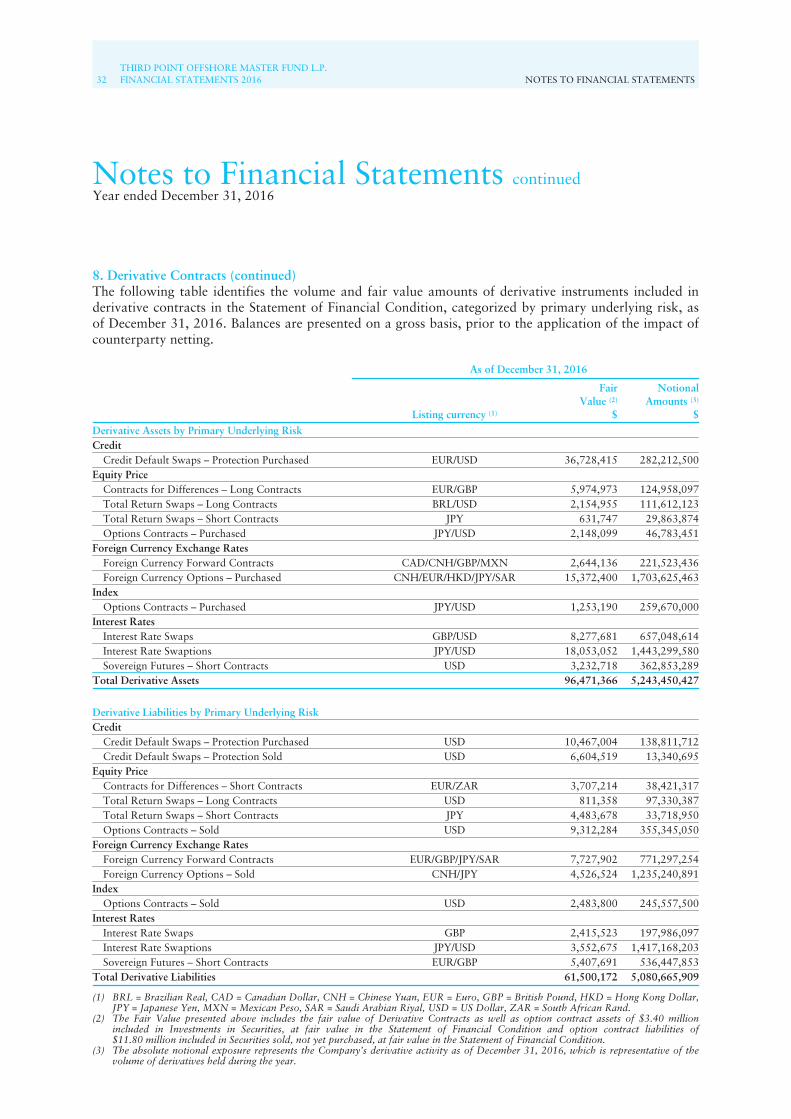
32THIRD POINT OFFSHORE MASTER FUND L.P.FINANCIAL STATEMENTS 2016 NOTES TO FINANCIAL STATEMENTS
Notes to Financial Statements continuedYear ended December 31, 2016
8. Derivative Contracts (continued)The following table identifies the volume and fair value amounts of derivative instruments included inderivative contracts in the Statement of Financial Condition, categorized by primary underlying risk, asof December 31, 2016. Balances are presented on a gross basis, prior to the application of the impact ofcounterparty netting.
As of December 31, 2016
Listing currency (1)
FairValue (2)
$
NotionalAmounts (3)
$
Derivative Assets by Primary Underlying RiskCredit
Credit Default Swaps – Protection Purchased EUR/USD 36,728,415 282,212,500Equity Price
Contracts for Differences – Long Contracts EUR/GBP 5,974,973 124,958,097Total Return Swaps – Long Contracts BRL/USD 2,154,955 111,612,123Total Return Swaps – Short Contracts JPY 631,747 29,863,874Options Contracts – Purchased JPY/USD 2,148,099 46,783,451
Foreign Currency Exchange RatesForeign Currency Forward Contracts CAD/CNH/GBP/MXN 2,644,136 221,523,436Foreign Currency Options – Purchased CNH/EUR/HKD/JPY/SAR 15,372,400 1,703,625,463
IndexOptions Contracts – Purchased JPY/USD 1,253,190 259,670,000
Interest RatesInterest Rate Swaps GBP/USD 8,277,681 657,048,614Interest Rate Swaptions JPY/USD 18,053,052 1,443,299,580Sovereign Futures – Short Contracts USD 3,232,718 362,853,289
Total Derivative Assets 96,471,366 5,243,450,427
Derivative Liabilities by Primary Underlying RiskCredit
Credit Default Swaps – Protection Purchased USD 10,467,004 138,811,712Credit Default Swaps – Protection Sold USD 6,604,519 13,340,695
Equity PriceContracts for Differences – Short Contracts EUR/ZAR 3,707,214 38,421,317Total Return Swaps – Long Contracts USD 811,358 97,330,387Total Return Swaps – Short Contracts JPY 4,483,678 33,718,950Options Contracts – Sold USD 9,312,284 355,345,050
Foreign Currency Exchange RatesForeign Currency Forward Contracts EUR/GBP/JPY/SAR 7,727,902 771,297,254Foreign Currency Options – Sold CNH/JPY 4,526,524 1,235,240,891
IndexOptions Contracts – Sold USD 2,483,800 245,557,500
Interest RatesInterest Rate Swaps GBP 2,415,523 197,986,097Interest Rate Swaptions JPY/USD 3,552,675 1,417,168,203Sovereign Futures – Short Contracts EUR/GBP 5,407,691 536,447,853
Total Derivative Liabilities 61,500,172 5,080,665,909
(1) BRL = Brazilian Real, CAD = Canadian Dollar, CNH = Chinese Yuan, EUR = Euro, GBP = British Pound, HKD = Hong Kong Dollar,JPY = Japanese Yen, MXN = Mexican Peso, SAR = Saudi Arabian Riyal, USD = US Dollar, ZAR = South African Rand.
(2) The Fair Value presented above includes the fair value of Derivative Contracts as well as option contract assets of $3.40 millionincluded in Investments in Securities, at fair value in the Statement of Financial Condition and option contract liabilities of$11.80 million included in Securities sold, not yet purchased, at fair value in the Statement of Financial Condition.
(3) The absolute notional exposure represents the Company’s derivative activity as of December 31, 2016, which is representative of thevolume of derivatives held during the year.
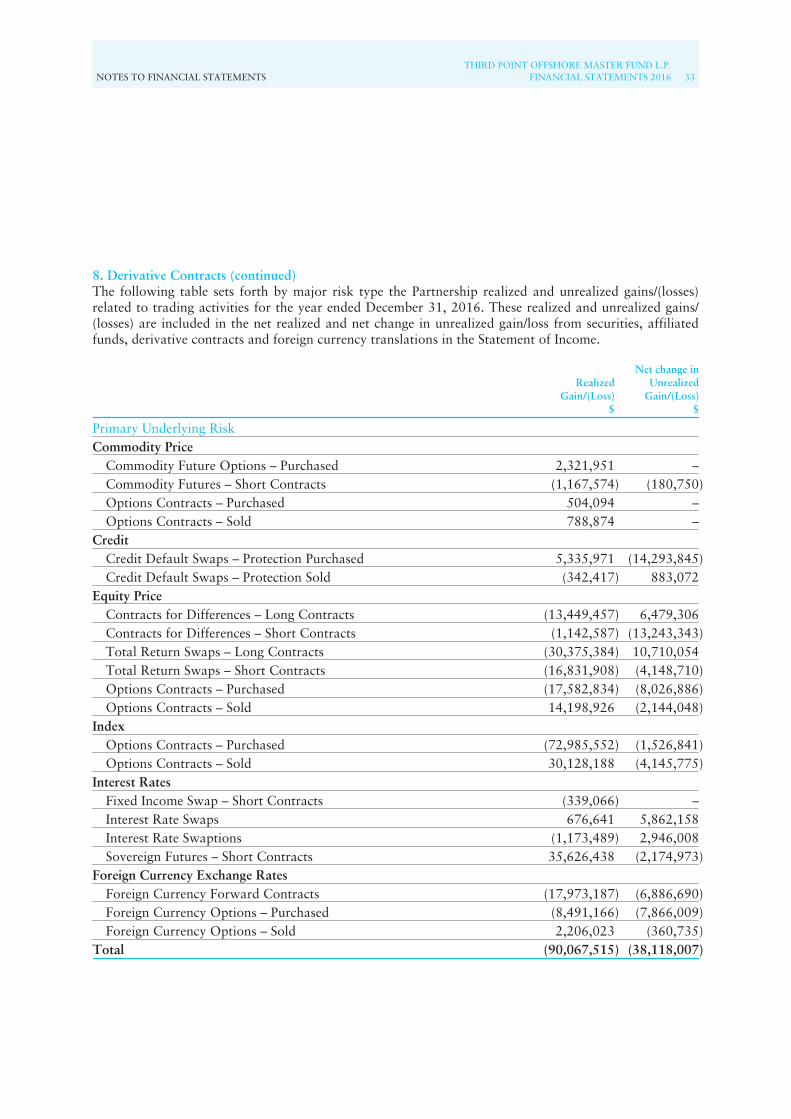
NOTES TO FINANCIAL STATEMENTSTHIRD POINT OFFSHORE MASTER FUND L.P.
FINANCIAL STATEMENTS 2016 33
8. Derivative Contracts (continued)The following table sets forth by major risk type the Partnership realized and unrealized gains/(losses)related to trading activities for the year ended December 31, 2016. These realized and unrealized gains/(losses) are included in the net realized and net change in unrealized gain/loss from securities, affiliatedfunds, derivative contracts and foreign currency translations in the Statement of Income.
RealizedGain/(Loss)
$
Net change inUnrealized
Gain/(Loss)$
Primary Underlying RiskCommodity Price
Commodity Future Options – Purchased 2,321,951 –Commodity Futures – Short Contracts (1,167,574) (180,750)Options Contracts – Purchased 504,094 –Options Contracts – Sold 788,874 –
CreditCredit Default Swaps – Protection Purchased 5,335,971 (14,293,845)Credit Default Swaps – Protection Sold (342,417) 883,072
Equity PriceContracts for Differences – Long Contracts (13,449,457) 6,479,306Contracts for Differences – Short Contracts (1,142,587) (13,243,343)Total Return Swaps – Long Contracts (30,375,384) 10,710,054Total Return Swaps – Short Contracts (16,831,908) (4,148,710)Options Contracts – Purchased (17,582,834) (8,026,886)Options Contracts – Sold 14,198,926 (2,144,048)
IndexOptions Contracts – Purchased (72,985,552) (1,526,841)Options Contracts – Sold 30,128,188 (4,145,775)
Interest RatesFixed Income Swap – Short Contracts (339,066) –Interest Rate Swaps 676,641 5,862,158Interest Rate Swaptions (1,173,489) 2,946,008Sovereign Futures – Short Contracts 35,626,438 (2,174,973)
Foreign Currency Exchange RatesForeign Currency Forward Contracts (17,973,187) (6,886,690)Foreign Currency Options – Purchased (8,491,166) (7,866,009)Foreign Currency Options – Sold 2,206,023 (360,735)
Total (90,067,515) (38,118,007)
34THIRD POINT OFFSHORE MASTER FUND L.P.FINANCIAL STATEMENTS 2016 NOTES TO FINANCIAL STATEMENTS
Notes to Financial Statements continuedYear ended December 31, 2016
8. Derivative Contracts (continued)The Partnership’s derivative contracts are generally subject to the International Swaps and DerivativesAssociation (“ISDA”) Master Agreements or other similar agreements which contain provisions settingforth events of default and/or termination events (“credit-risk-related contingent features”), including butnot limited to provisions setting forth maximum permissible declines in the Partnership’s net asset value.Upon the occurrence of a termination event with respect to an ISDA Agreement, the Partnership’scounterparty could elect to terminate the derivative contracts governed by such agreement, resulting inthe realization of any net gains or losses with respect to such derivative contracts and the return ofcollateral held by such party. During the year ended December 31, 2016, no termination events weretriggered under the ISDA Master Agreements. As of December 31, 2016, the aggregate fair value of allderivative instruments with credit-risk-related contingent features that are in a net liability position is$20,116,957, for which the Partnership has posted $139,908,173 collateral in the normal course ofbusiness. Similarly the Partnership obtains/provides collateral from/to various counterparties for OTCderivative contracts in accordance with bilateral collateral agreements. Similarly, the Partnership heldcollateral of $14,997,877 in the form of cash from certain counterparties as of December 31, 2016. If thecredit-risk-related contingent features underlying these instruments had been triggered as ofDecember 31, 2016 and the Partnership had to settle these instruments immediately, no additionalamounts would be required to be posted by the Partnership since the aggregate fair value of the requiredcollateral posted exceeded the settlement amounts of open derivative contracts or in the case of crossmargining relationships, the assets in the Partnership’s prime brokerage accounts are sufficient to offsetderivative liabilities.
The Partnership’s derivatives do not qualify as hedges for financial reporting purposes and are recordedin the Statement of Financial Condition on a gross basis and not offset against any collateral pledged orreceived. Pursuant to the ISDA master agreements, securities lending agreements, repurchase agreementsand other counterparty agreements, the Partnership and its counterparties typically have the ability to netcertain payments owed to each other in specified circumstances. In addition, in the event a party to oneof the ISDA master agreements, securities lending agreements, repurchase agreements or other derivativesagreements defaults, or a transaction is otherwise subject to termination, the non-defaulting partygenerally has the right to set off against payments owed to the defaulting party or collateral held by thenon-defaulting party.
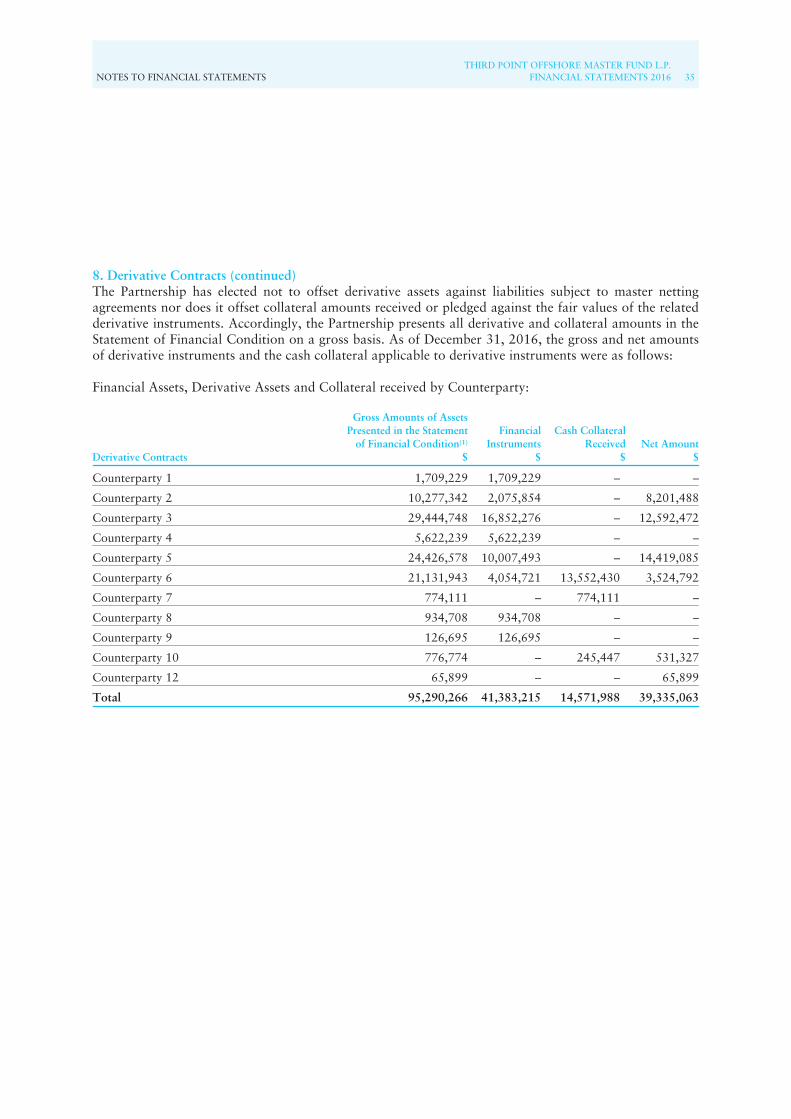
NOTES TO FINANCIAL STATEMENTSTHIRD POINT OFFSHORE MASTER FUND L.P.
FINANCIAL STATEMENTS 2016 35
8. Derivative Contracts (continued)The Partnership has elected not to offset derivative assets against liabilities subject to master nettingagreements nor does it offset collateral amounts received or pledged against the fair values of the relatedderivative instruments. Accordingly, the Partnership presents all derivative and collateral amounts in theStatement of Financial Condition on a gross basis. As of December 31, 2016, the gross and net amountsof derivative instruments and the cash collateral applicable to derivative instruments were as follows:
Financial Assets, Derivative Assets and Collateral received by Counterparty:
Derivative Contracts
Gross Amounts of AssetsPresented in the Statement
of Financial Condition(1)
$
FinancialInstruments
$
Cash CollateralReceived
$Net Amount
$
Counterparty 1 1,709,229 1,709,229 – –
Counterparty 2 10,277,342 2,075,854 – 8,201,488
Counterparty 3 29,444,748 16,852,276 – 12,592,472
Counterparty 4 5,622,239 5,622,239 – –
Counterparty 5 24,426,578 10,007,493 – 14,419,085
Counterparty 6 21,131,943 4,054,721 13,552,430 3,524,792
Counterparty 7 774,111 – 774,111 –
Counterparty 8 934,708 934,708 – –
Counterparty 9 126,695 126,695 – –
Counterparty 10 776,774 – 245,447 531,327
Counterparty 12 65,899 – – 65,899
Total 95,290,266 41,383,215 14,571,988 39,335,063
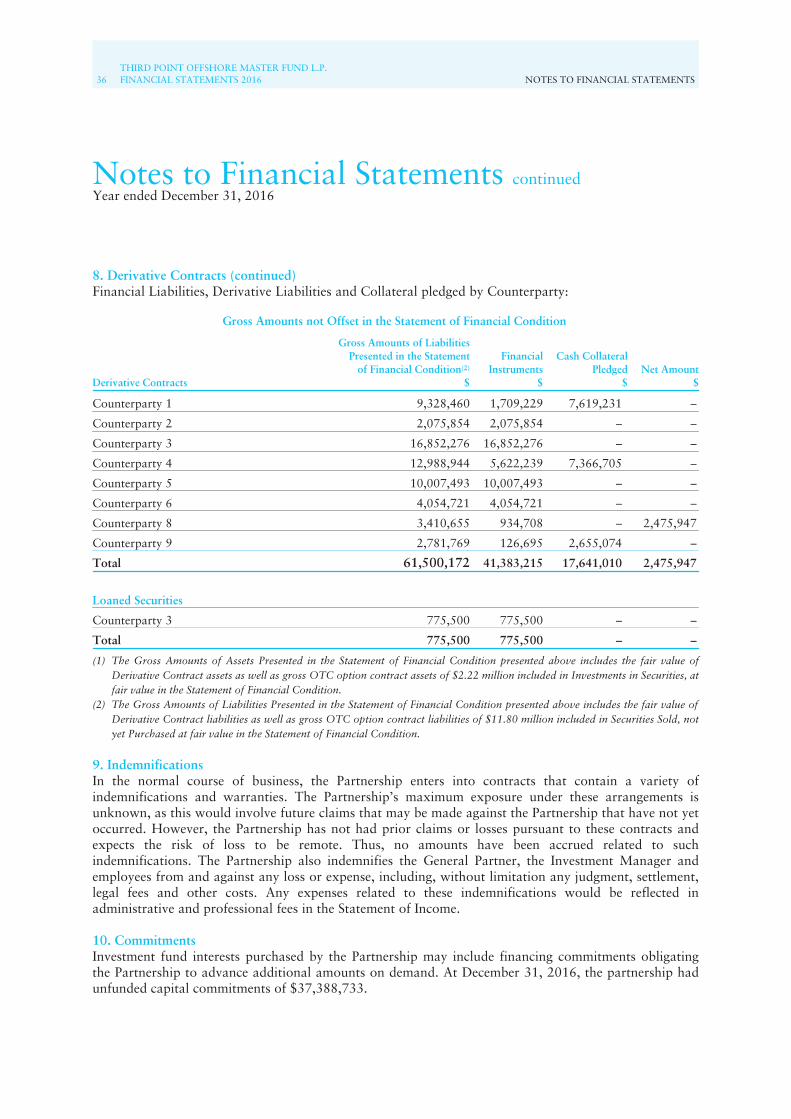
36THIRD POINT OFFSHORE MASTER FUND L.P.FINANCIAL STATEMENTS 2016 NOTES TO FINANCIAL STATEMENTS
Notes to Financial Statements continuedYear ended December 31, 2016
8. Derivative Contracts (continued)Financial Liabilities, Derivative Liabilities and Collateral pledged by Counterparty:
Gross Amounts not Offset in the Statement of Financial Condition
Derivative Contracts
Gross Amounts of LiabilitiesPresented in the Statement
of Financial Condition(2)
$
FinancialInstruments
$
Cash CollateralPledged
$Net Amount
$
Counterparty 1 9,328,460 1,709,229 7,619,231 –
Counterparty 2 2,075,854 2,075,854 – –
Counterparty 3 16,852,276 16,852,276 – –
Counterparty 4 12,988,944 5,622,239 7,366,705 –
Counterparty 5 10,007,493 10,007,493 – –
Counterparty 6 4,054,721 4,054,721 – –
Counterparty 8 3,410,655 934,708 – 2,475,947
Counterparty 9 2,781,769 126,695 2,655,074 –
Total 61,500,172 41,383,215 17,641,010 2,475,947
Loaned Securities
Counterparty 3 775,500 775,500 – –
Total 775,500 775,500 – –
(1) The Gross Amounts of Assets Presented in the Statement of Financial Condition presented above includes the fair value ofDerivative Contract assets as well as gross OTC option contract assets of $2.22 million included in Investments in Securities, atfair value in the Statement of Financial Condition.
(2) The Gross Amounts of Liabilities Presented in the Statement of Financial Condition presented above includes the fair value ofDerivative Contract liabilities as well as gross OTC option contract liabilities of $11.80 million included in Securities Sold, notyet Purchased at fair value in the Statement of Financial Condition.
9. IndemnificationsIn the normal course of business, the Partnership enters into contracts that contain a variety ofindemnifications and warranties. The Partnership’s maximum exposure under these arrangements isunknown, as this would involve future claims that may be made against the Partnership that have not yetoccurred. However, the Partnership has not had prior claims or losses pursuant to these contracts andexpects the risk of loss to be remote. Thus, no amounts have been accrued related to suchindemnifications. The Partnership also indemnifies the General Partner, the Investment Manager andemployees from and against any loss or expense, including, without limitation any judgment, settlement,legal fees and other costs. Any expenses related to these indemnifications would be reflected inadministrative and professional fees in the Statement of Income.
10. CommitmentsInvestment fund interests purchased by the Partnership may include financing commitments obligatingthe Partnership to advance additional amounts on demand. At December 31, 2016, the partnership hadunfunded capital commitments of $37,388,733.
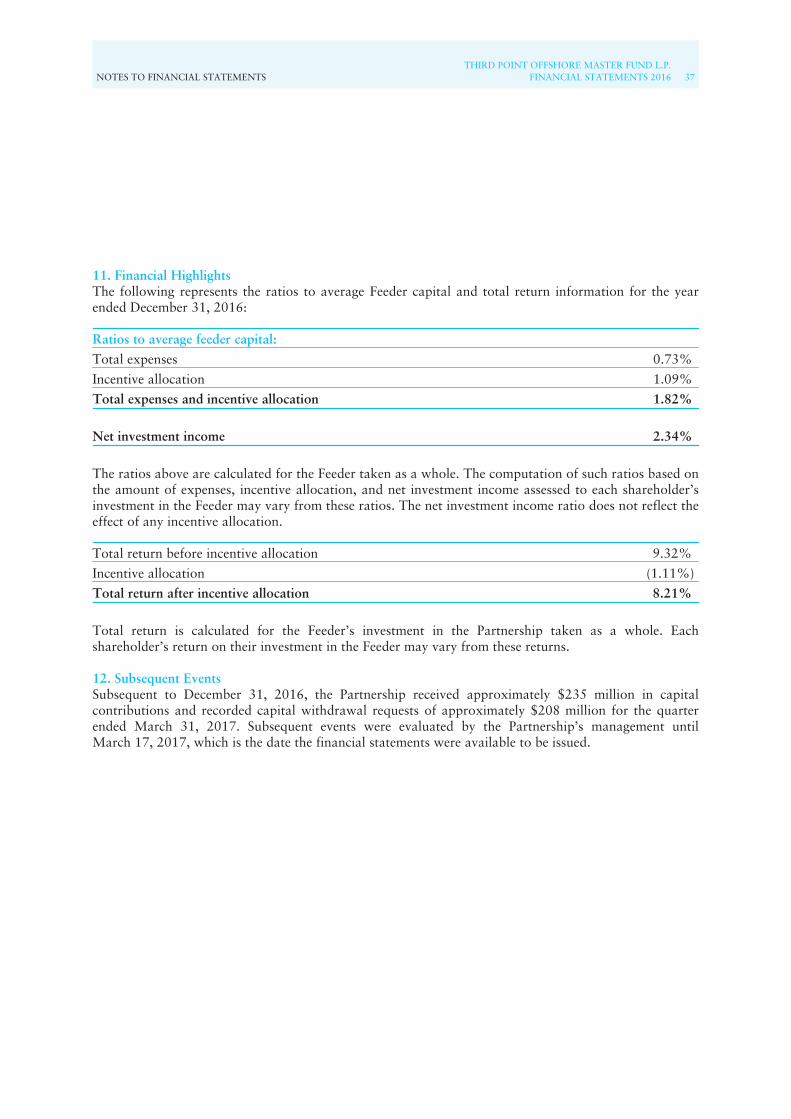
NOTES TO FINANCIAL STATEMENTSTHIRD POINT OFFSHORE MASTER FUND L.P.
FINANCIAL STATEMENTS 2016 37
11. Financial HighlightsThe following represents the ratios to average Feeder capital and total return information for the yearended December 31, 2016:
Ratios to average feeder capital:
Total expenses 0.73%
Incentive allocation 1.09%
Total expenses and incentive allocation 1.82%
Net investment income 2.34%
The ratios above are calculated for the Feeder taken as a whole. The computation of such ratios based onthe amount of expenses, incentive allocation, and net investment income assessed to each shareholder’sinvestment in the Feeder may vary from these ratios. The net investment income ratio does not reflect theeffect of any incentive allocation.
Total return before incentive allocation 9.32%
Incentive allocation (1.11%)
Total return after incentive allocation 8.21%
Total return is calculated for the Feeder’s investment in the Partnership taken as a whole. Eachshareholder’s return on their investment in the Feeder may vary from these returns.
12. Subsequent EventsSubsequent to December 31, 2016, the Partnership received approximately $235 million in capitalcontributions and recorded capital withdrawal requests of approximately $208 million for the quarterended March 31, 2017. Subsequent events were evaluated by the Partnership’s management untilMarch 17, 2017, which is the date the financial statements were available to be issued.

38THIRD POINT OFFSHORE MASTER FUND L.P.FINANCIAL STATEMENTS 2016 NOTES TO FINANCIAL STATEMENTS
Notes to Financial Statements continuedYear ended December 31, 2016
This page has been left intentionally blank