Third Edition GDP and the Measurement of Progress · Outline What Is GDP? Growth Rates Nominal vs....
54
MODERN PRINCIPLES OF ECONOMICS Third Edition GDP and the Measurement of Progress GDP and the Measurement of Progress Chapter 6 (Chapter 26)
Transcript of Third Edition GDP and the Measurement of Progress · Outline What Is GDP? Growth Rates Nominal vs....
MODERN PRINCIPLES OF ECONOMICSThird Edition
GDP and the Measurement of Progress
GDP and the Measurement of Progress
Chapter 6 (Chapter 26)
Outline
� What Is GDP?
� Growth Rates
� Nominal vs. Real GDP
� Cyclical and Short-Run Changes in GDP
� The Many Ways of Splitting GDP
� Problems with GDP as a Measure of Output and Welfare
2
Introduction
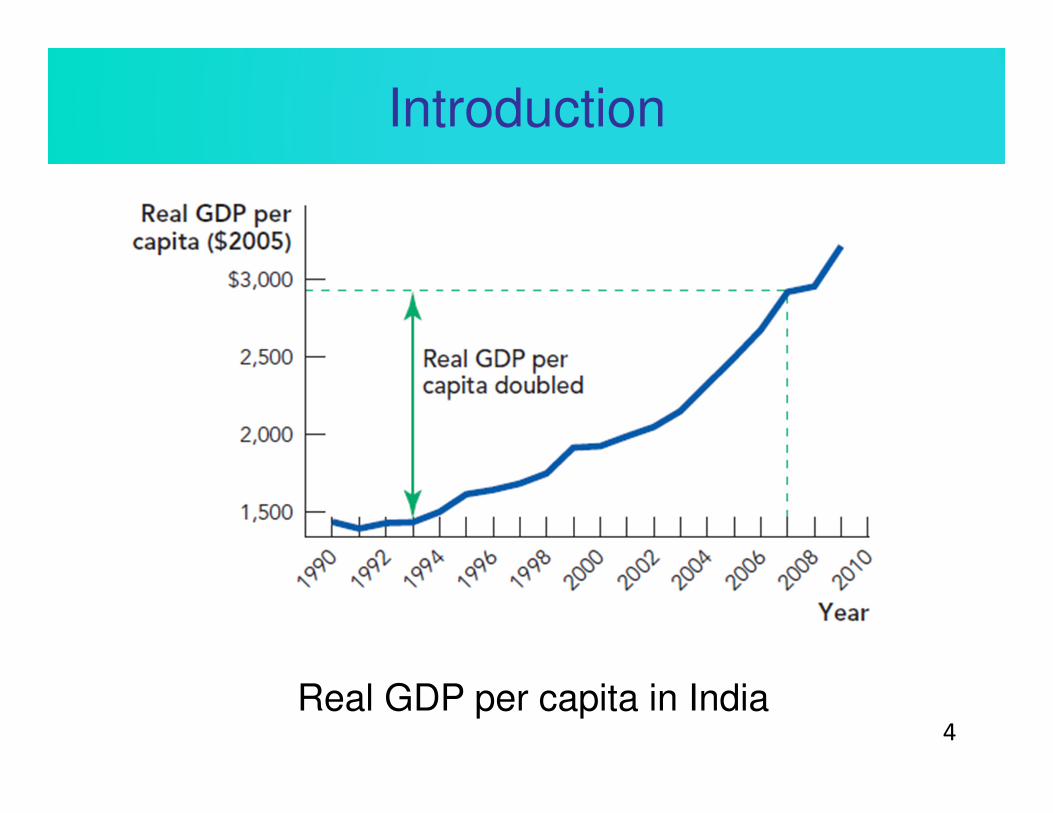
� India has both extreme poverty and rapid
economic growth:
• Two-thirds of India’s population lives on less than $2 a day.
• At the same time, at least 100 million people are at an American standard of living.
� a remarkable increase from just a few decades ago.
� Gross Domestic Product (GDP) and GDP per capita gives us a way to measure changes in economic output and the standard of living.
3
Introduction
Real GDP per capita in India4
Definition
Gross Domestic Product (GDP):
the market value of all final goods and services produced within a country in a year.
5
GDP per capita:
GDP divided by population.
Introduction
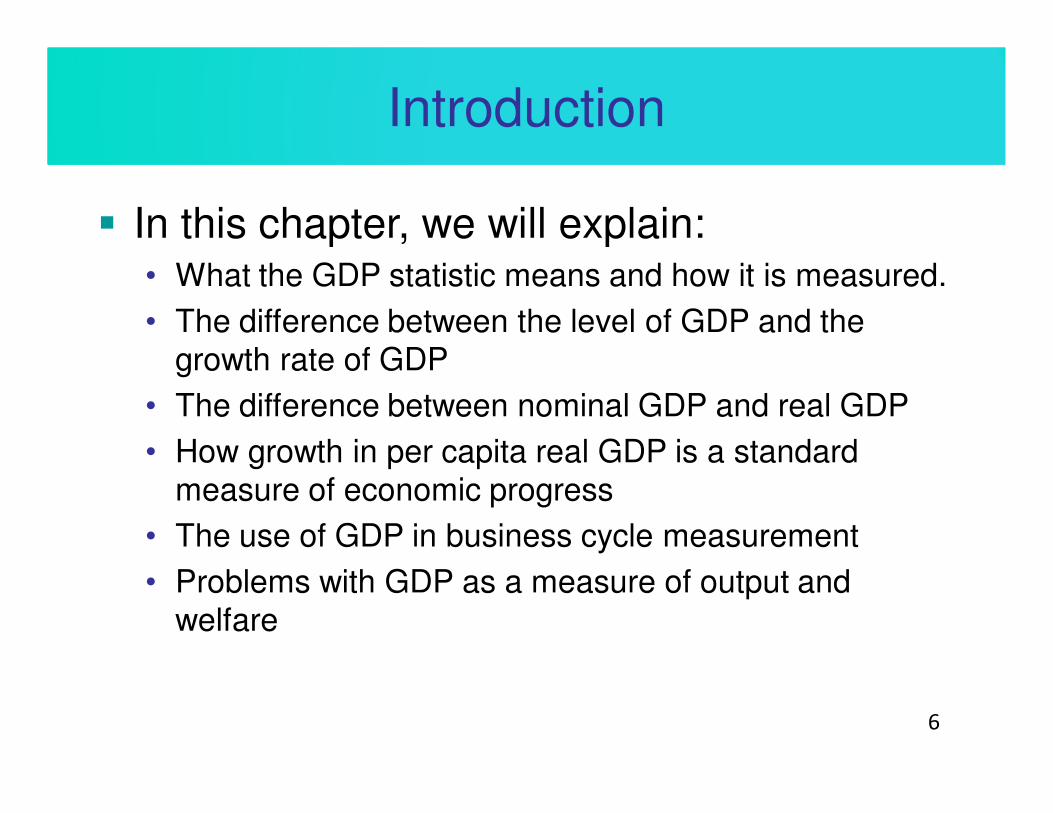
� In this chapter, we will explain:• What the GDP statistic means and how it is measured.
• The difference between the level of GDP and the growth rate of GDP
• The difference between nominal GDP and real GDP
• How growth in per capita real GDP is a standard measure of economic progress
• The use of GDP in business cycle measurement
• Problems with GDP as a measure of output and welfare
6
Introduction
7
GDP
� GDP is the market value of all final goods and services produced within a country in a year.
� An economy’s total output includes millions of different goods and services.
� Some goods are more valuable than others, so we can’t just add up quantities.
� GDP uses market values to determine how much each good or service is worth and then sums the total.
8
GDP
� Final goods and services are sold to final users and then consumed or held in personal inventories.
� Intermediate goods are sold to firms and then bundled or processed with other goods or services for sale at a later stage.
� To avoid double counting, only final goods are included in GDP.
� However, machinery and equipment used to produce other goods are included in GDP.
9
GDP
� GDP measures production, so sales of old houses, used goods, and financial assets do not add to GDP.
� Sales of used goods: NOT included
� Sale of financial assets: NOT included
� Services of stockbrokers, realtors, used car salesmen ARE included
� Products produced by not sold in same year are included as “inventory”
10
Self-Check
11
Which of the following is a final good:
a. A book in Amazon’s inventory.
b. Tires purchased by a Toyota plant.
c. Tires purchased by you for your car.
Answer: c – tires purchased by you are a final good because they are for your own use (consumption), not for resale.
GDP
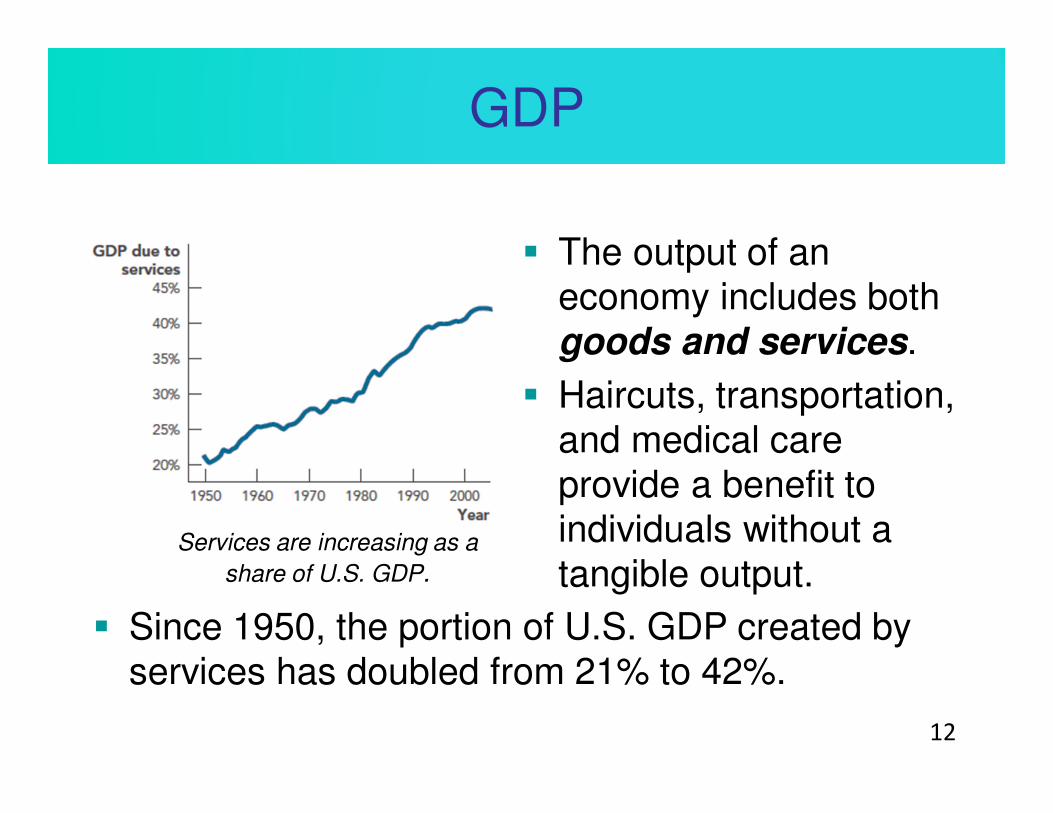
� The output of an economy includes both goods and services.
� Haircuts, transportation, and medical care provide a benefit to individuals without a tangible output.
12
Services are increasing as a
share of U.S. GDP.
� Since 1950, the portion of U.S. GDP created by services has doubled from 21% to 42%.
GDP
� U.S. GDP includes goods and services produced by labor and capital located in the United States, regardless of the nationality of the workers or property owners.
� Gross national product (GNP) is similar to GDP but measures what is produced by the labor and property supplied by U.S. permanent residents.
13

Definition
Gross National Produce (GNP):
the market value of all final goods and services produced by a country’s permanent residents, wherever located, within a year.
14

GDP
� GDP tells us how much the nation produced in a year, not how much it has accumulated in its entire history.
� GDP is like annual income, not wealth
� National wealth refers to the value of a nation’s entire stock of assets.
� GDP is calculated by the Bureau of Economic Analysis (BEA), which is part of the Department of Commerce and based in Washington, D.C.
15
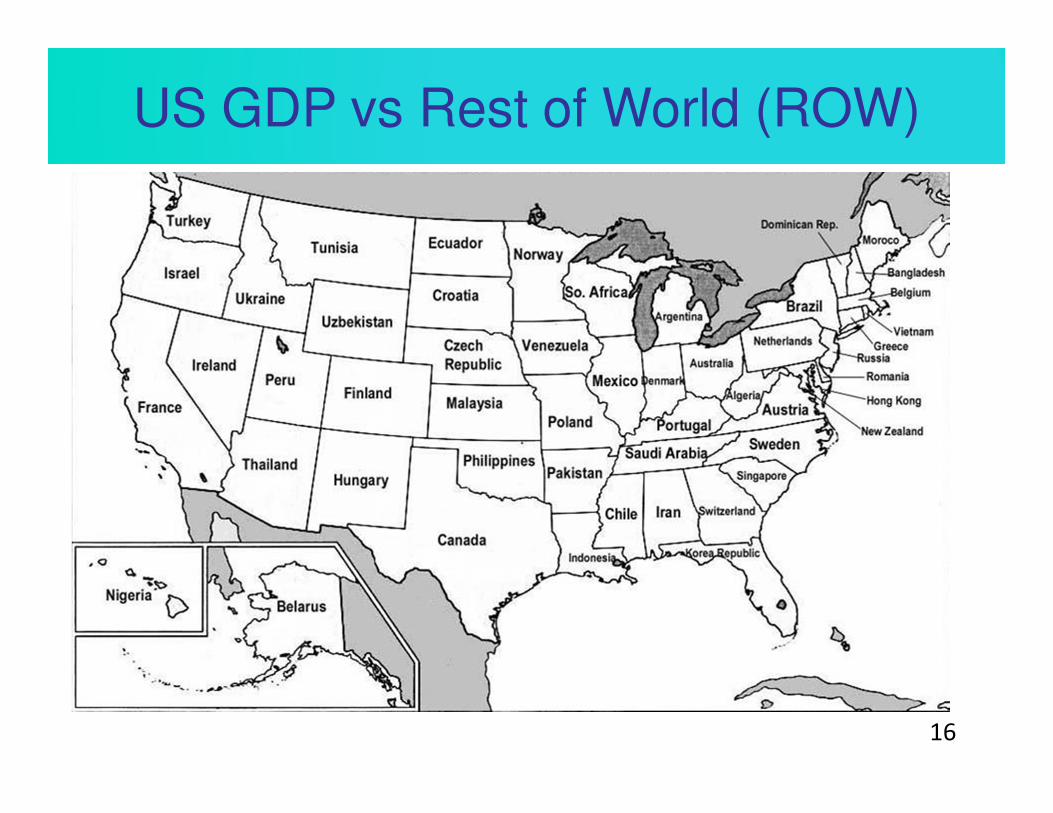
US GDP vs Rest of World (ROW)
16
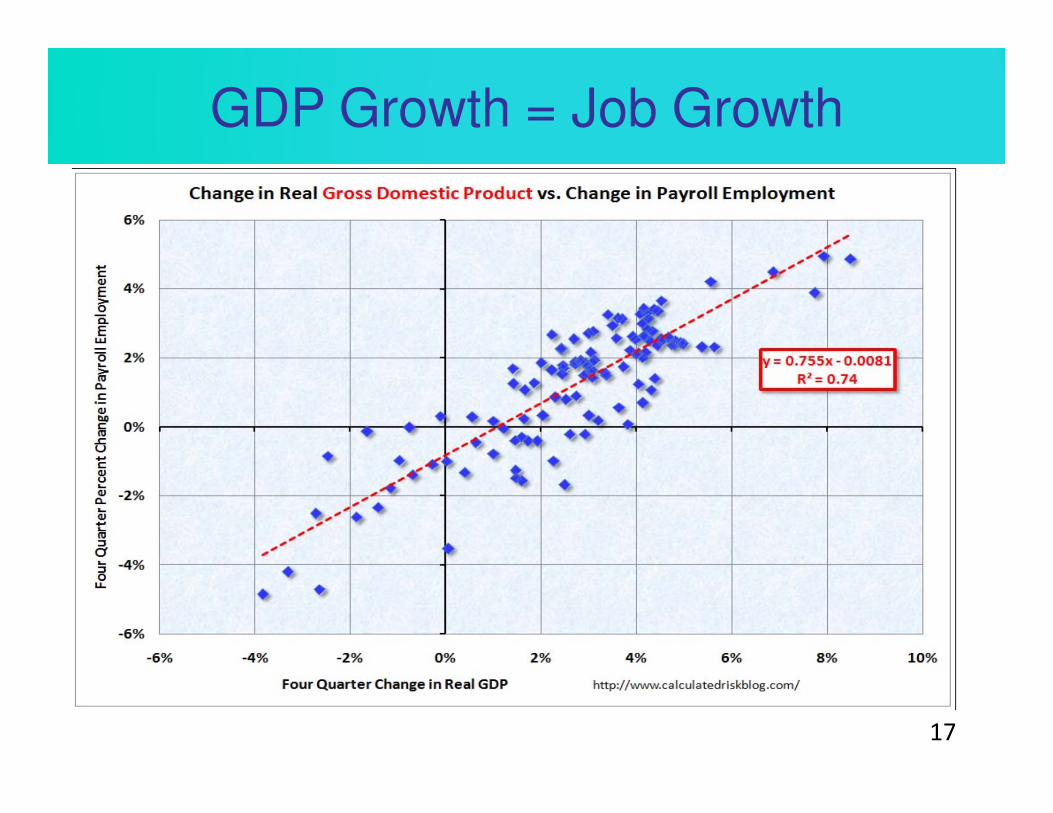
GDP Growth = Job Growth
17

Growth Rates
� GDP tells us how much a country produced.
� The growth rate of GDP tells us how rapidly the country’s production is rising or falling.
� Using actual numbers (in billions):
18
2013for rate growth GDP100GDP
GDPGDP
2012
20122013=×
−
%4.3100245,16$
245,16$798,16$=×
−
Self-Check
19
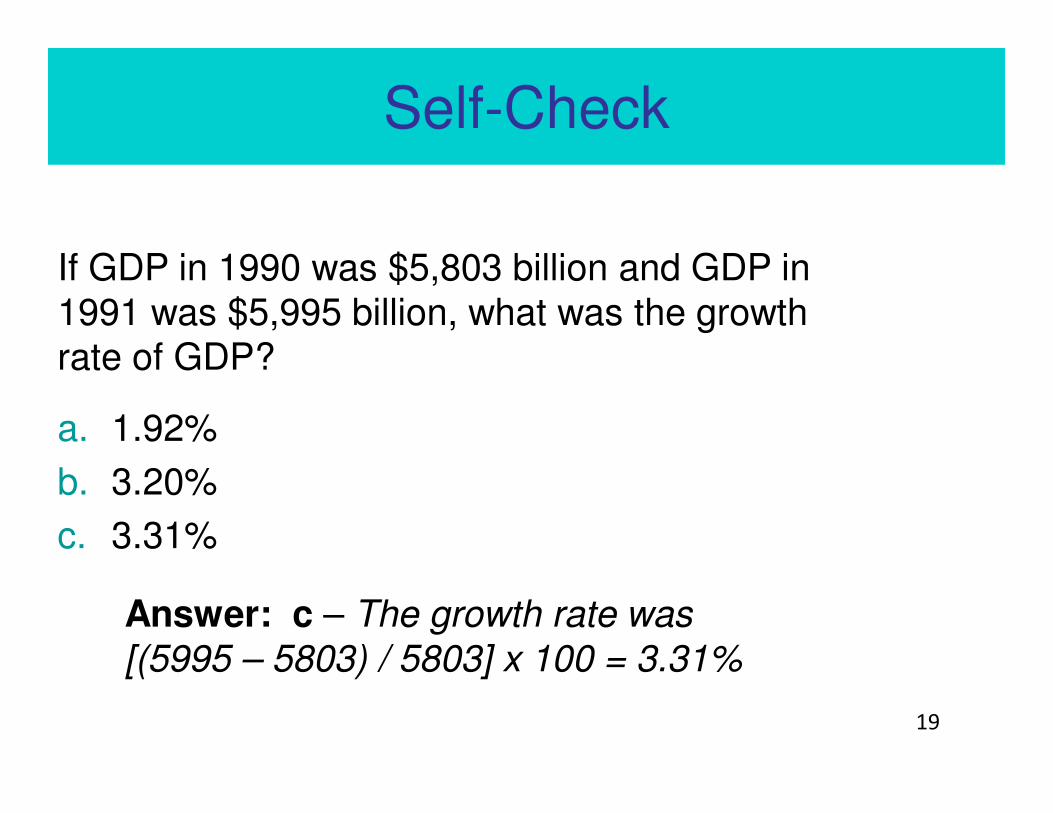
If GDP in 1990 was $5,803 billion and GDP in 1991 was $5,995 billion, what was the growth rate of GDP?
a. 1.92%
b. 3.20%
c. 3.31%
Answer: c – The growth rate was [(5995 – 5803) / 5803] x 100 = 3.31%
Nominal vs. Real GDP
� Nominal Growth Rate is the rate of growth just calculated did not adjust for price changes and is called the “nominal growth rate.”
� Nominal GDP is calculated using prices at the time of sale.
• GDP in 2013 is calculated using 2013 prices.
• GDP in 2000 is calculated using 2000 prices.
� If there is an increase in nominal GDP, we can’t tell if it was due to greater production or increased prices.
� It is increases in production, not increases in prices, that improve the standard of living. 20
Definition
Nominal variables:
variables such as GDP that have not been adjusted for changes in price.
21

Nominal vs. Real GDP
� To remove the effect of price changes, we can calculate GDP in constant prices.
2013 GDP in 2013 dollars:
2013 prices × 2013 quantities = $16.8 trillion
2000 GDP in 2013 dollars:
2013 prices × 2000 quantities = $13.8 trillion
� We can now find the increase in real GDP.
22
Definition
Real variables:
variables such as GDP that have been adjusted for changes in prices by using the same set of prices in all time periods.
23
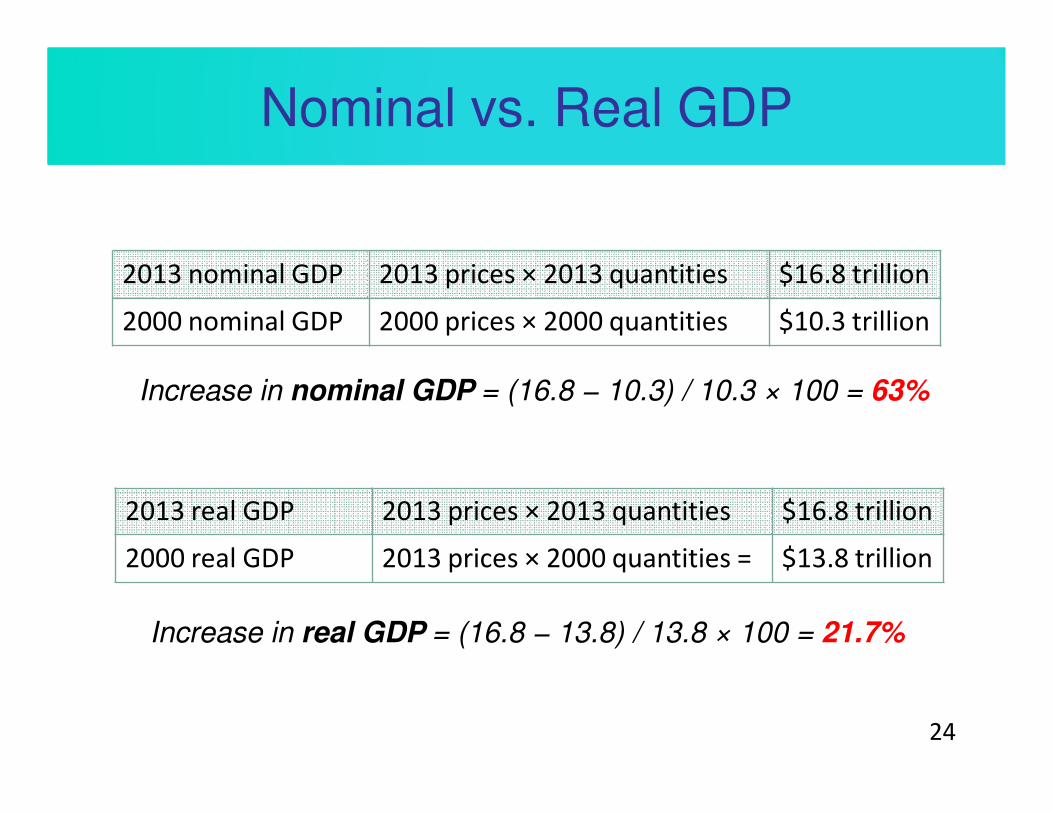
Nominal vs. Real GDP
Increase in real GDP = (16.8 − 13.8) / 13.8 × 100 = 21.7%
24
2013 nominal GDP 2013 prices × 2013 quantities $16.8 trillion
2000 nominal GDP 2000 prices × 2000 quantities $10.3 trillion
2013 real GDP 2013 prices × 2013 quantities $16.8 trillion
2000 real GDP 2013 prices × 2000 quantities = $13.8 trillion
Increase in nominal GDP = (16.8 − 10.3) / 10.3 × 100 = 63%

Real GDP Growth per Capita
Growth Rate in Nominal GDP =
• Inflation Rate (change in price level) + Growth Rate in Real GDP
• Real GDP growth = (Nominal GDP growth
rate) – (Inflation rate)
� where the growth rate in nominal GDP is the
growth rate in spending (C + I + G + NX)
So if Nominal GDP growth is 5%, it could be:
1% inflation + 4% growth in Real GDP or
2% inflation + 3% growth in Real GDP or
5% inflation + 0% growth in Real GDP
25

Real GDP Growth per Capita
26

Self-Check
27
Real GDP is:
a. Adjusted for changes in the price level.
b. Not adjusted for changes in the price level.
c. Adjusted for price increases but not decreases.
Answer: a – Real GDP is adjusted for changes in the price level.
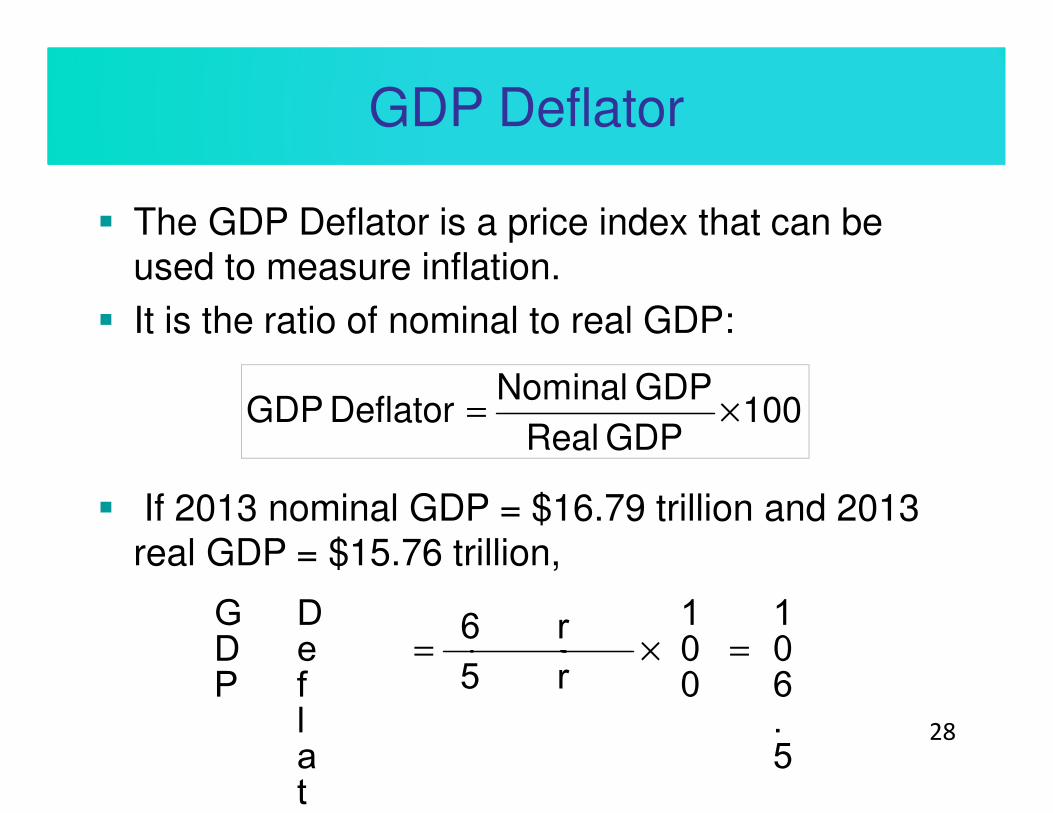
GDP Deflator
� The GDP Deflator is a price index that can be used to measure inflation.
� It is the ratio of nominal to real GDP:
� If 2013 nominal GDP = $16.79 trillion and 2013 real GDP = $15.76 trillion,
28
100GDP Real
GDP NominalDeflator GDP ×=
106.5
100
trillion
15.76
trillion
16.79
Deflator
GDP
=×=

Real GDP Growth
The Growth Rate of Real GDP in the U.S.29
Real GDP Growth per Capita
� Growth in real GDP does not account for changes in population.
� Growth in real GDP per capita is usually the best reflection of changing living standards.
� There can be large differences for countries with rapidly growing populations.
30

Real GDP Growth per Capita
Even though the U.S. and Guatemala had the same
growth rate of real GDP, the standard of living in the
U.S. grew much faster.
31
Country
% annual
growth
real GDP
1993-2003
% annual
growth
population
1993-2003
% annual
growth
real GDP
per capita
Guatemala 3.6% 2.8% 0.8%
United States 3.6% 1.2% 2.1%
Source: Bureau of Economic Analysis, and the U.S. Census Bureau
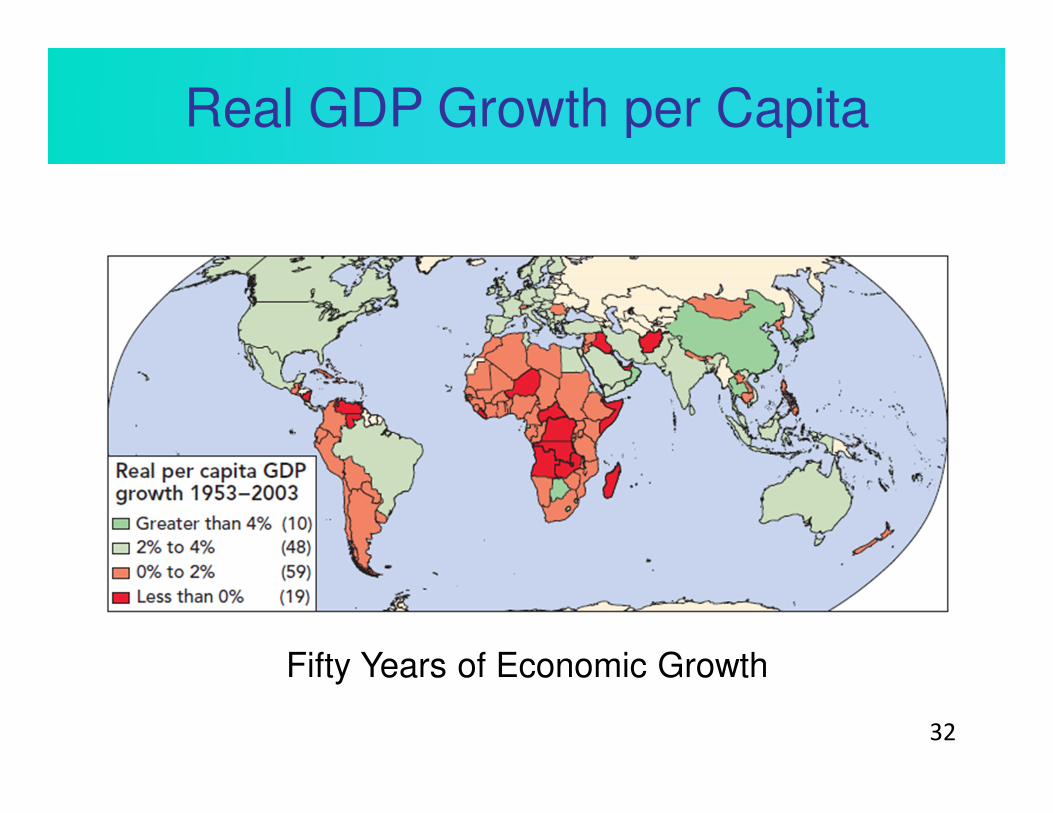
Real GDP Growth per Capita
Fifty Years of Economic Growth
32

Cyclical and Short-run Changes
� GDP is used to compare economic output across countries and over long periods.
� GDP is also used to measure short-run fluctuations in an economy.
� According to the National Bureau of Economic Research (NBER), a recession is
“a significant decline in economic activity spread across
the economy, lasting more than a few months, normally
visible in real GDP, real income, employment, industrial
production, and wholesale–retail sales.”
33

Definition
Recession:
a significant, widespread decline in real GDP and employment.
(Unofficially – two quarter of negative real GDP growth)
34

Cyclical and Short-run Changes
U.S. Recessions Since 1948Quarterly Growth Rates Expressed as Annualized Rates
35
Cyclical and Short-run Changes
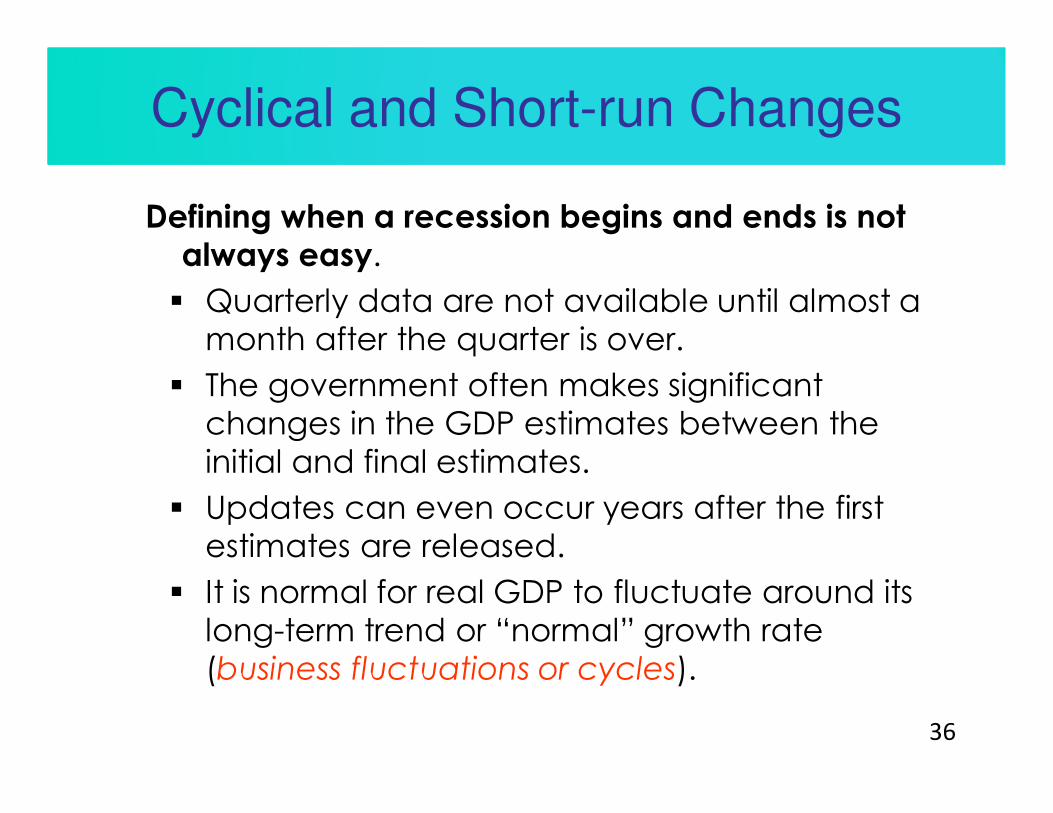
Defining when a recession begins and ends is not
always easy.
� Quarterly data are not available until almost a
month after the quarter is over.
� The government often makes significant
changes in the GDP estimates between the
initial and final estimates.
� Updates can even occur years after the first
estimates are released.
� It is normal for real GDP to fluctuate around its
long-term trend or “normal” growth rate
(business fluctuations or cycles).
36
Cyclical and Short-run Changes
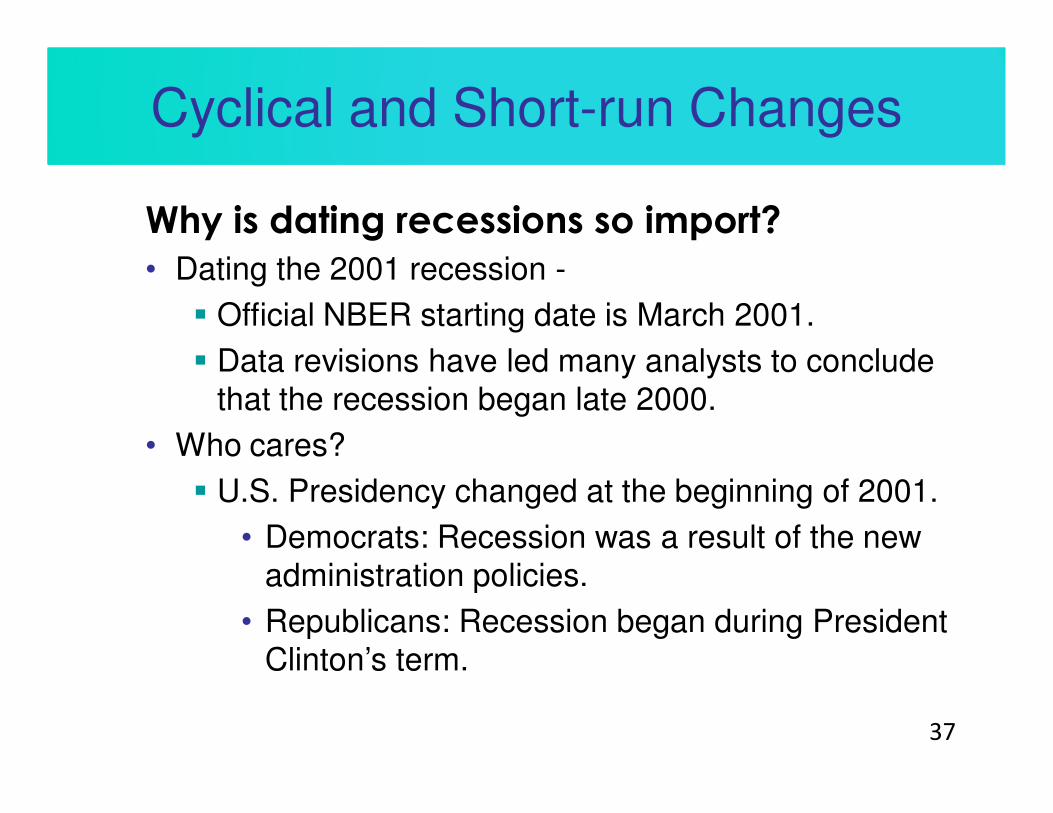
Why is dating recessions so import?
• Dating the 2001 recession -
� Official NBER starting date is March 2001.
� Data revisions have led many analysts to conclude that the recession began late 2000.
• Who cares?
� U.S. Presidency changed at the beginning of 2001.
• Democrats: Recession was a result of the new administration policies.
• Republicans: Recession began during President Clinton’s term.
37

Definition
Business cycles:
short-run movements in real GDP around its long-term trend.
38

Self-Check
39
A widespread decline in real GDP and employment is called:
a. Inflation.
b. Recession.
c. A business cycle.
Answer: b – a decline in real GDP and employment is called a recession.
Splitting GDP
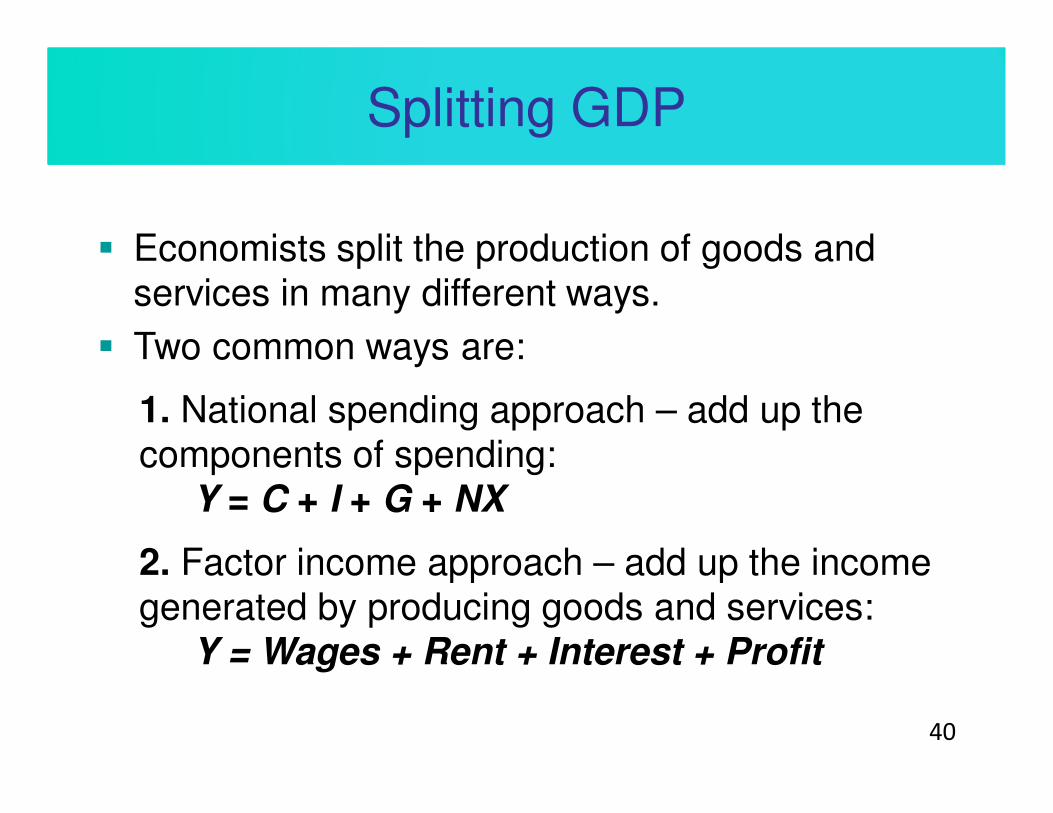
� Economists split the production of goods and services in many different ways.
� Two common ways are:
1. National spending approach – add up the components of spending:
Y = C + I + G + NX
2. Factor income approach – add up the income generated by producing goods and services:
Y = Wages + Rent + Interest + Profit
40

National Spending Approach
Y = C + I + G + NX
41
Y Nominal GDP The market value of all final goods and
services.
C Consumption Private spending on final goods and services.
I Investment Private spending on tools, plant, and
equipment used to produce future output.
GGovernment
purchases
Spending by all levels of government on final
goods and services. Transfers are not included
in government purchases.
NX Net exports The value of exports minus the value of
imports.

National Spending Approach
U.S. GDP and Its Components, 201342
Factor Income Approach
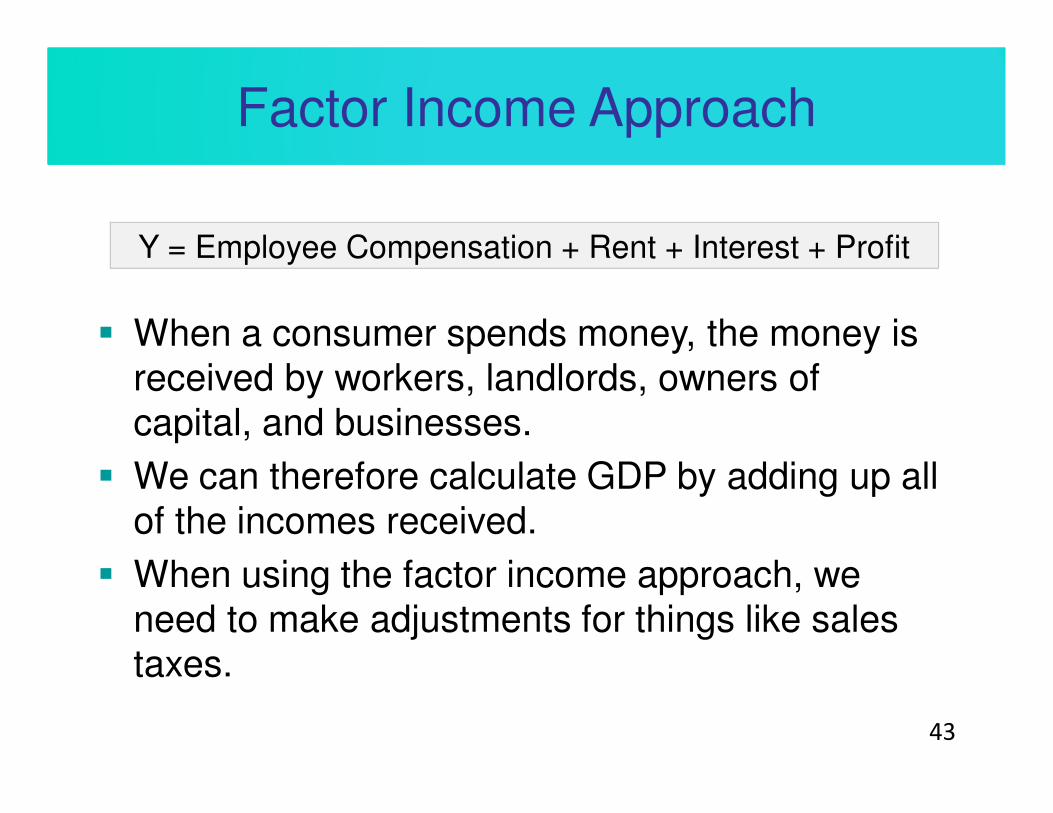
Y = Employee Compensation + Rent + Interest + Profit
43
� When a consumer spends money, the money is received by workers, landlords, owners of capital, and businesses.
� We can therefore calculate GDP by adding up all of the incomes received.
� When using the factor income approach, we need to make adjustments for things like sales taxes.
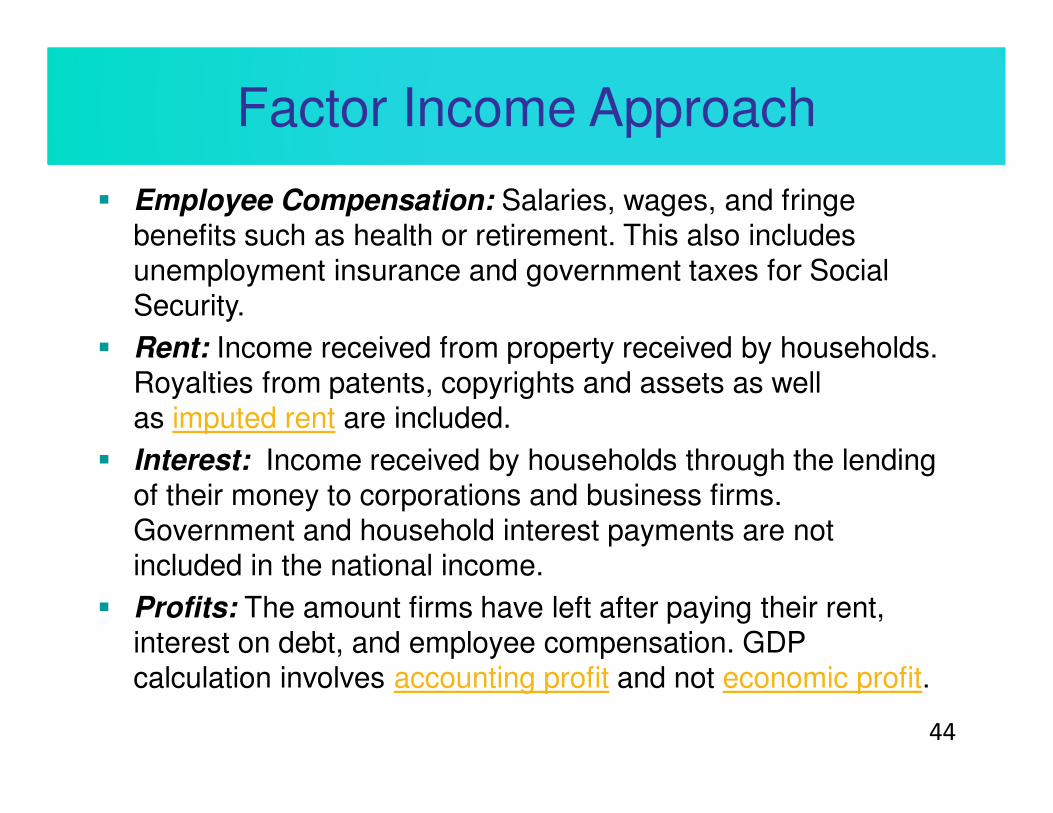
Factor Income Approach
44
� Employee Compensation: Salaries, wages, and fringe benefits such as health or retirement. This also includes unemployment insurance and government taxes for Social Security.
� Rent: Income received from property received by households. Royalties from patents, copyrights and assets as well as imputed rent are included.
� Interest: Income received by households through the lending of their money to corporations and business firms. Government and household interest payments are not included in the national income.
� Profits: The amount firms have left after paying their rent, interest on debt, and employee compensation. GDP calculation involves accounting profit and not economic profit.
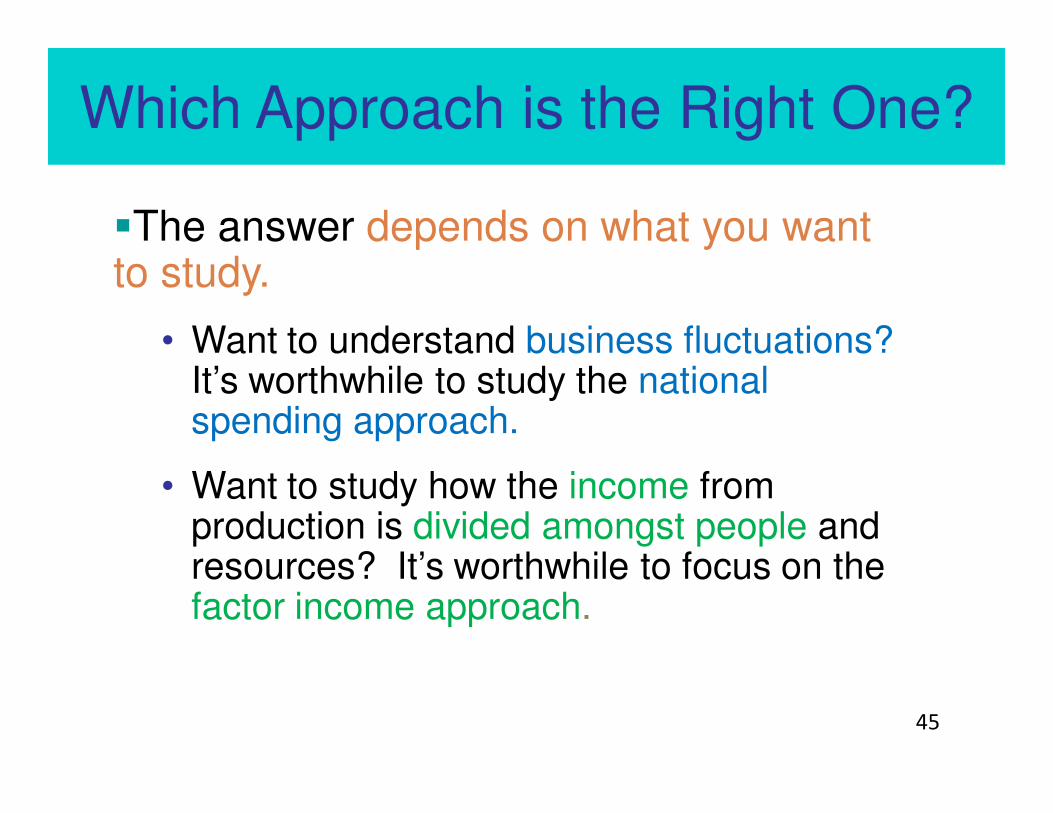
Which Approach is the Right One?
45
�The answer depends on what you want to study.
• Want to understand business fluctuations? It’s worthwhile to study the national spending approach.
• Want to study how the income from production is divided amongst people and resources? It’s worthwhile to focus on the factor income approach.

Self-Check
46
Which of the following splits GDP according to the national spending approach?
a. C + I + G + NX.
b. Revenues - expenses.
c. Employee compensation + rent + interest + profit.
Answer: a – C + I + G + NX.
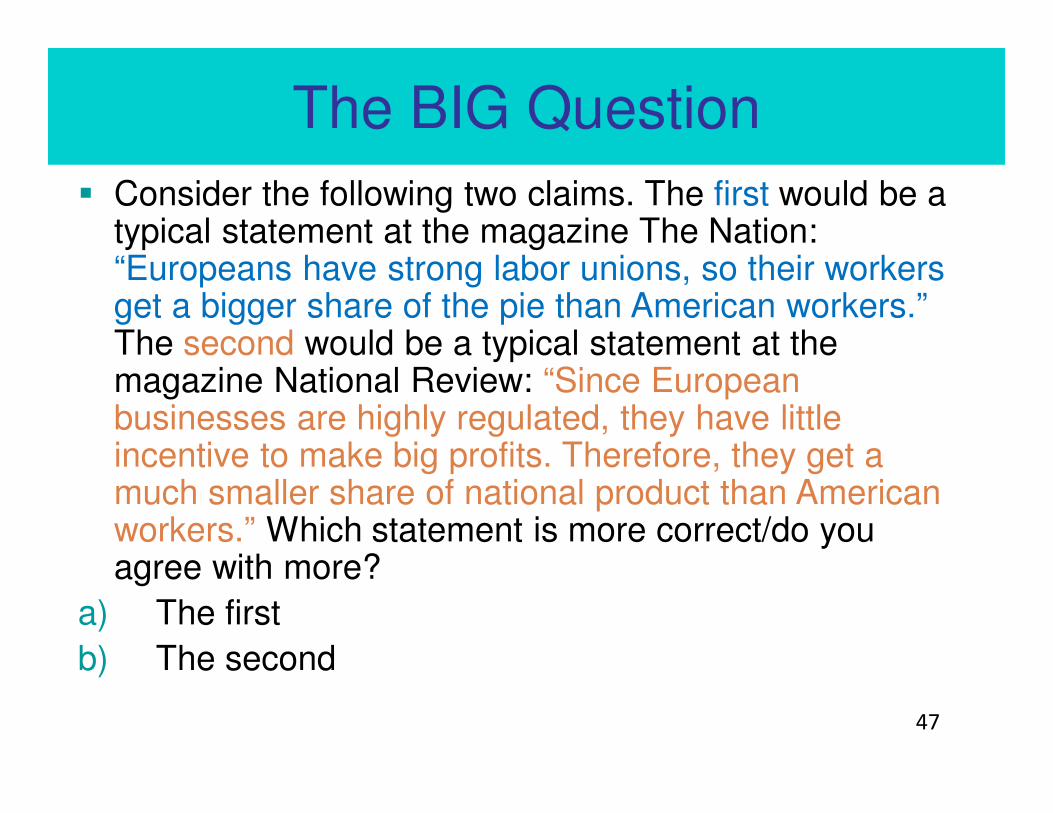
The BIG Question
47
� Consider the following two claims. The first would be a typical statement at the magazine The Nation: “Europeans have strong labor unions, so their workers get a bigger share of the pie than American workers.”The second would be a typical statement at the magazine National Review: “Since European businesses are highly regulated, they have little incentive to make big profits. Therefore, they get a much smaller share of national product than American workers.” Which statement is more correct/do you agree with more?
a) The first
b) The second

Problems With GDP
� Illegal or underground-market transactions are omitted from GDP.
� Underground transactions are especially significant in countries with higher levels of corruption and taxes.
� The informal sector in Latin America is estimated at 41% of officially measured GDP.
� In the U.S. or Western Europe, the underground economy is likely 10% - 20% of GDP.
48

Problems With GDP
� GDP does not count non priced production, when valuable goods and services are produced but no monetary payment is made.
• Housework, reading free blogs, volunteering
� This introduces two biases into GDP statistics: biases over time and biases across nations.
• As more women in the U.S. entered the workforce, housework shifted from unpaid to paid.
• Women’s participation in the workforce varies across countries, changing the proportion of work included in GDP.
49
Tyler Cowen and Alex TabarrokModern Principles: Macroeconomics, Third Edition / Modern Principles of Economics, Third Edition
Copyright © 2015 by Worth Publishers
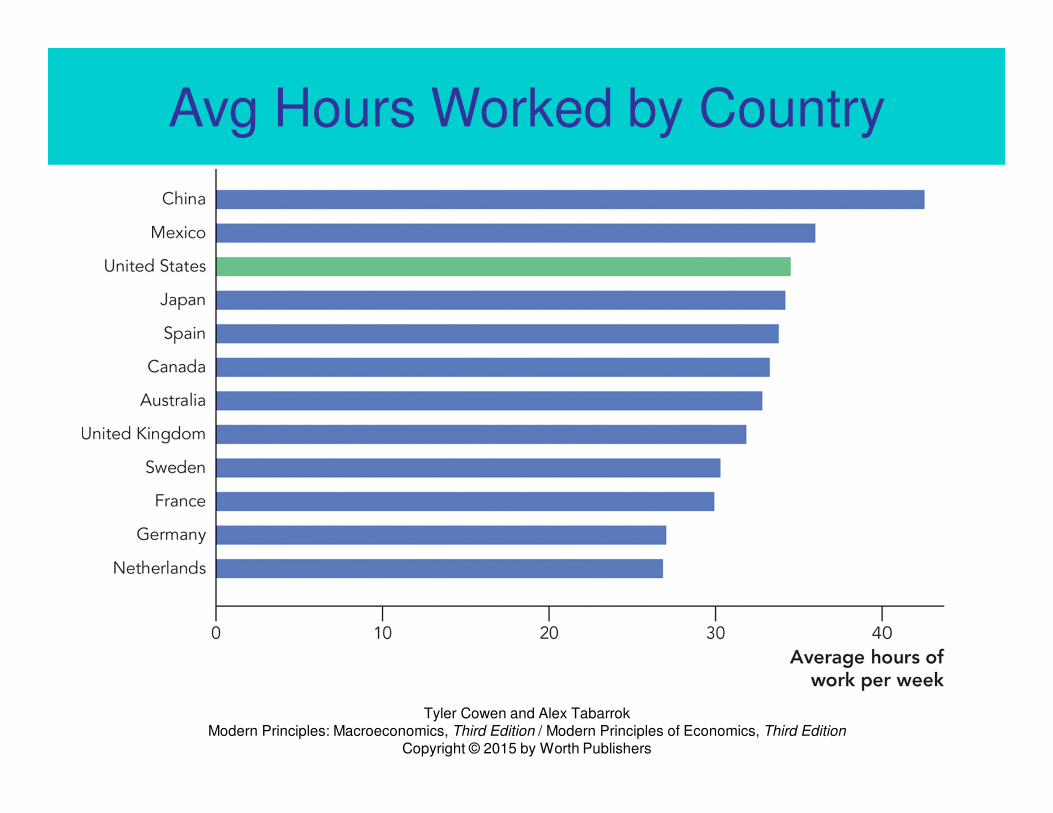
Avg Hours Worked by Country

Problems With GDP
� GDP does not count leisure, although people value it.
� GDP does not count economic “bads” such as pollution, crime, or the extinction of species.
• Cleaning up pollution ADDS to GDP
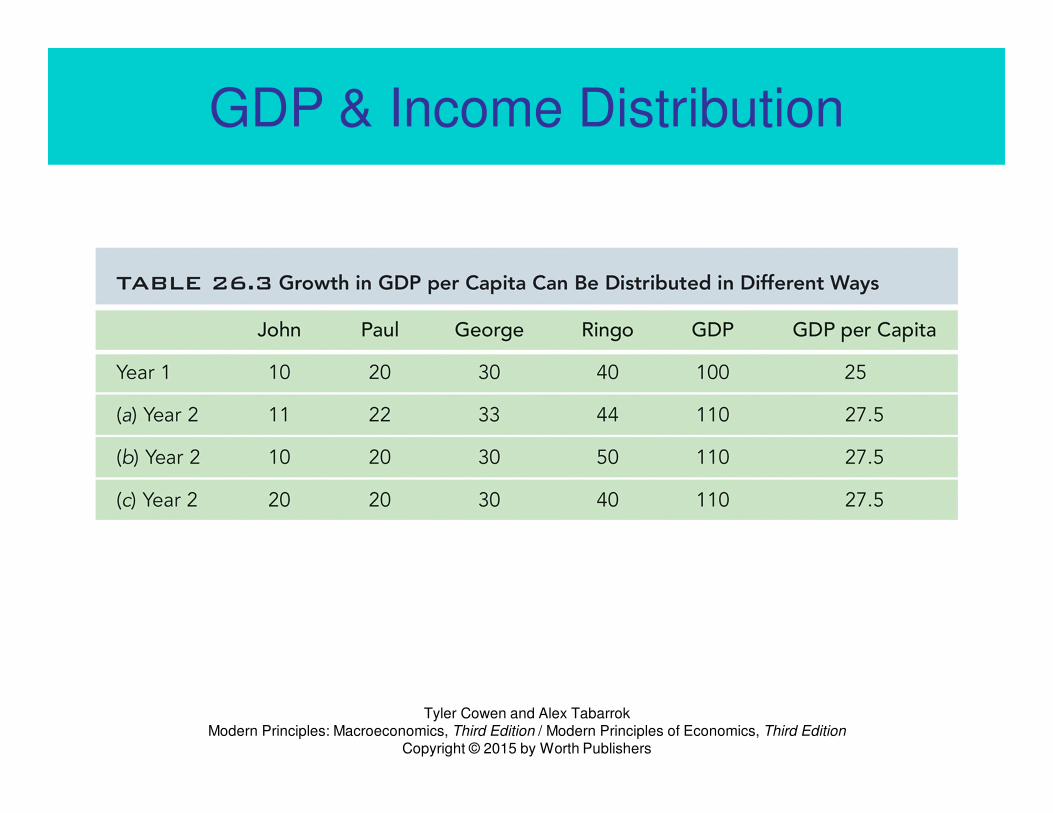
� GDP does not measure the distribution of income.
• Endless arguments can ensue
51
Tyler Cowen and Alex TabarrokModern Principles: Macroeconomics, Third Edition / Modern Principles of Economics, Third Edition
Copyright © 2015 by Worth Publishers
GDP & Income Distribution

Takeaway
� GDP is an estimate of the economic output of a nation over a year.
� GDP can be summed up in different ways.
� The national spending identity, Y = C + I + G + NX, splits GDP according to different classes of income spending.
� The factor income approach, Y = Employee compensation + Interest + Rent + Profit, splits GDP into different classes of income receiving.
53
Takeaway
� GDP per capita is a rough estimate of the standard of living in a nation.
� Real GDP is corrected for inflation by using the same set of prices in every year.
� GDP does not include:
• The value of leisure
• Goods in the underground economy
• The value of goods that are difficult to price.
• How equally income is distributed. 54