THINGS TO KNOW ABOUT STEM INDUSTRIES AND CAREERS …
9
“STEM” is the acronym for science, technology, engineering and mathematics. As Massachusetts celebrates its first annual statewide STEM Week, it’s an opportune time to take stock of what STEM means to the Commonwealth’s economy and future. Here are seven things to know about STEM industries and careers in Massachusetts—one for each day of STEM Week. THINGS TO KNOW ABOUT STEM INDUSTRIES AND CAREERS IN MASSACHUSETTS 7
Transcript of THINGS TO KNOW ABOUT STEM INDUSTRIES AND CAREERS …

“STEM” is the acronym for science, technology, engineering and mathematics.
As Massachusetts celebrates its first annual statewide STEM Week, it’s an opportune time to take stock of what STEM means to the Commonwealth’s economy and future. Here are seven things to know about STEM industries and careers in Massachusetts—one for each day of STEM Week.
THINGS TO KNOW ABOUT STEM INDUSTRIES
AND CAREERS IN MASSACHUSETTS
7

1 STEM Jobs and Industries are Vital to the Massachusetts Economy
States with the Highest Demand for STEM Occupations, Adjusted for Population
According to employment estimates conducted through the Occupational Employment Statistics (OES) program, about 600,000 people work in STEM occupations in Massachusetts. STEM workers represent 17% of the total workforce in Massachusetts—about one-third higher than the U.S. average of 13%. Adjusted for population size, Massachusetts has more demand for STEM jobs than almost every other state.
Jobs Massachusetts (# and %)
United States (# and %)
STEM 595,780 17%
18,385,25013%
Non-STEM 2,932,30083%
124,164,00087%
Totals: 3,528,080 142,549,250
Source: Commonwealth Corporation analysis of Massachusetts Department of Unemployment Assistance, Economic Research Department, accessed at http://lmi2.detma.org/lmi/lmi_oes_a.asp, and U.S. Department of Labor, Bureau of Labor Statistics, Occupational Employment Statistics (OES) 2017, accessed at https://www.bls.gov/oes/home.htm.
Source: Labor Insight Jobs, Burning Glass Technologies: Report on Job Postings (09/01/2017 - 08/31/2018).
State Job PostingsJob Postings
per 10,000 em-ployed
Level of STEM Job Demand
Alaska 27,494 821 Higher demand than average
Colorado 203,916 821 Higher demand than average
Massachusetts 272,165 799 Higher demand than average
Virginia 291,818 786 Higher demand than average
Delaware 33,049 766 Higher demand than average
Arizona 192,170 744 Higher demand than average
Connecticut 122,086 737 Higher demand than average
Maryland 182,504 708 Higher demand than average
Washington 217,002 695 Average demand
600,000
17%
people work in STEM occupations in Massachusetts
of the total workforce in Massachusetts

Industry Sector
STEM Employment
Total Sector
EmploymentSTEM Jobs as % of Sector
Health Care and Social Assistance 225,950 630,570 36%
Professional and Technical Services 131,450 308,710 43%
Manufacturing 51,120 243,660 21%
Educational Services 48,330 369,850 13%
Trade, Wholesale and Retail 32,860 481,020 7%
Information 31,760 91,730 35%
Public Administration 25,610 193,550 13%
Business and Administrative Services 21,940 252,110 9%
Finance, Insurance, Real Estate, Leasing 16,910 214,000 8%Construction 2,930 151,650 2%Leisure, Hospitality, Other Services 2,570 473,030 1%Transportation, Utilities, Natural Resources 1,810 117,540 2%
Total, All Industries: 595,780 3,528,070 17%
2 STEM Jobs are Everywhere—Including Some Places You Might Not Think
STEM Occupations by Industry Sector in Massachusetts
As you might expect, STEM occupations cover a wide range of positions in healthcare, computer and information technology, engineering, and the sciences. In Massachusetts, 43% of jobs in the professional and technical sectors are STEM jobs and 36% of healthcare jobs are STEM jobs, as are 36% of information industry jobs. In point of fact, STEM jobs are an important part of almost every industry in Massachusetts.For example:
• As technology continues to reshape the manufacturing sector, more than 20% of manufacturing jobs in Massachusetts have become STEM jobs.
• One out of every seven post-secondary teaching jobs in Massachusetts is a STEM job.
• In public administration, one out of every seven jobs is a STEM job.
• Business services, financial activities and the wholesale/retail sectors employ more than 70,000 workers in STEM occupations.
Source: Commonwealth Corporation analysis of Massachusetts Department of Unemployment Assistance, Economic Research Department, Occupational Employment Statistics, Industry Staffing Pattern, accessed at http://lmi2.detma.org/lmi/lmi_oes_a_all_ind_Occ2.asp.
43%
36%
of jobs in the professional and technical sectors are STEM jobs
of healthcare and information industry jobs are STEM jobs
In Massachusetts

3 STEM Jobs in Massachusetts are Good-Paying Jobs
Average Entry and Annual Wages for STEM Occupations
Not only are STEM jobs plentiful in the Commonwealth—they’re largely very good jobs as well. In Massachusetts, workers in STEM careers have an average annual wage of almost $98,500, compared to an average annual wage of about $62,000 for Massachusetts workers as a whole. Entry-level wages for STEM workers in Massachusetts are strong, too—about $54,000 on average, compared to $27,190 for Massachusetts workers as a whole. That works out to an hourly wage of $26.13, compared to just $13.07 for non-STEM entry-level workers.
Source: Commonwealth Corporation analysis of Massachusetts Department of Unemployment Assistance, Economic Research Department, Occupational Employment Statistics data, 2017.
$98,500
$54,000
average annual wage in STEM careers
average entry-level wage in STEM careers
In Massachusetts
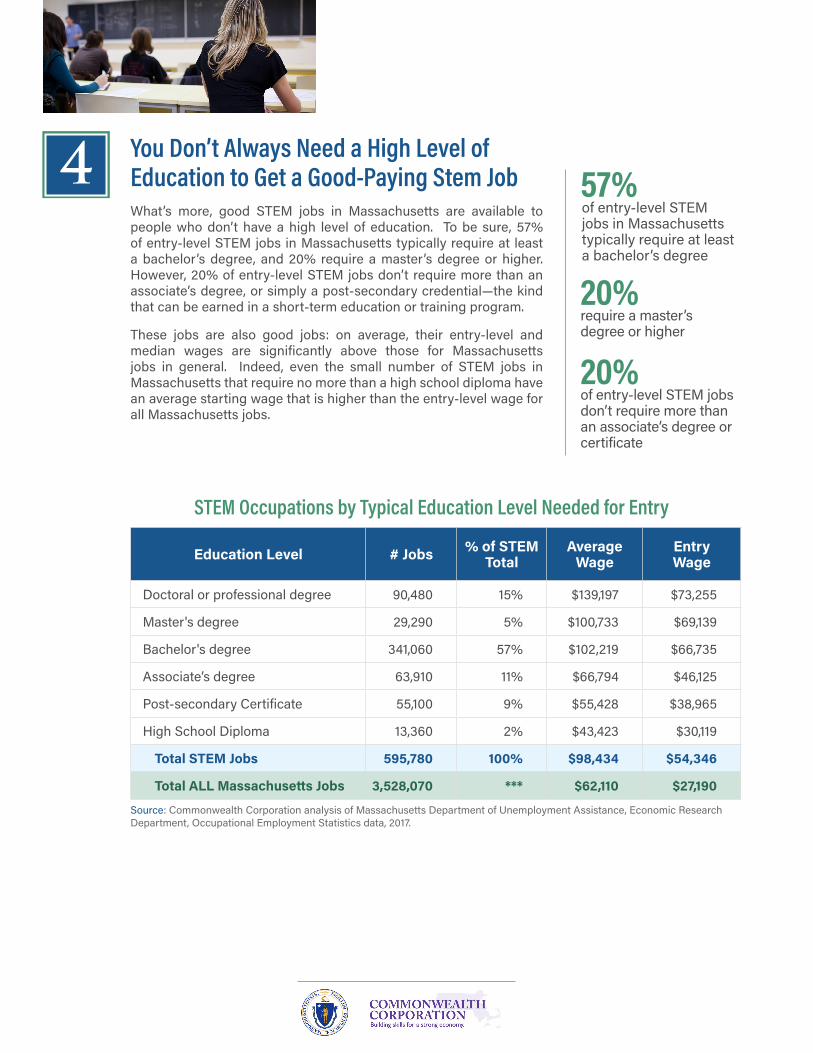
4 You Don’t Always Need a High Level of Education to Get a Good-Paying Stem Job
STEM Occupations by Typical Education Level Needed for Entry
What’s more, good STEM jobs in Massachusetts are available to people who don’t have a high level of education. To be sure, 57% of entry-level STEM jobs in Massachusetts typically require at least a bachelor’s degree, and 20% require a master’s degree or higher. However, 20% of entry-level STEM jobs don’t require more than an associate’s degree, or simply a post-secondary credential—the kind that can be earned in a short-term education or training program.
These jobs are also good jobs: on average, their entry-level and median wages are significantly above those for Massachusetts jobs in general. Indeed, even the small number of STEM jobs in Massachusetts that require no more than a high school diploma have an average starting wage that is higher than the entry-level wage for all Massachusetts jobs.
Source: Commonwealth Corporation analysis of Massachusetts Department of Unemployment Assistance, Economic Research Department, Occupational Employment Statistics data, 2017.
Education Level # Jobs % of STEM Total
Average Wage
Entry Wage
Doctoral or professional degree 90,480 15% $139,197 $73,255
Master's degree 29,290 5% $100,733 $69,139
Bachelor's degree 341,060 57% $102,219 $66,735
Associate’s degree 63,910 11% $66,794 $46,125
Post-secondary Certificate 55,100 9% $55,428 $38,965
High School Diploma 13,360 2% $43,423 $30,119
Total STEM Jobs 595,780 100% $98,434 $54,346
Total ALL Massachusetts Jobs 3,528,070 *** $62,110 $27,190
57%
20%
of entry-level STEM jobs in Massachusetts typically require at least a bachelor’s degree
20%require a master’s degree or higher
of entry-level STEM jobs don’t require more than an associate’s degree or certificate

5 Massachusetts is Investing Strongly in STEM Industries Today
Massachusetts Workforce Training Fund Investments by STEM Sector, 2015-Present
Public investment in STEM takes place in many areas: in our education system, through economic development initiatives, and through the workforce development system. While many states have episodic or small-scale initiatives, Massachusetts is one of just a handful of states that has long standing, statewide programs that help businesses meet their training needs, give un- and underemployed people pathways to employment, and help young people develop the hard and soft skills they need to become employed. These programs—the Workforce Training Fund, the Workforce Competitiveness Trust Fund, and YouthWorks—are key components of Massachusetts’ STEM investment strategy.
The Workforce Training Fund, for example, provides grants to Massachusetts businesses to upgrade the skills of their workers and support their competitiveness. To date, the Baker-Polito Administration has provided more than 380 grants totalling $37 million to companies in four industry sectors that have large shares of workers (more than 20%) employed in STEM occupations. These grants have supported training for more than 25,000 workers.
Similarly, Massachusetts is building stronger pipelines to increase the number of high school students, community college students, and out-of-school youth entering high-quality careers, including STEM careers. For example, YouthWorks, the state’s subsidized youth employment program, supports skills training that helps young people earn credentials in STEM fields such as health care, technology, and IT-related banking jobs. The Massachusetts Clean Energy Center and Commonwealth Corporation, the state’s workforce development authority, operate Learn and Earn, which has funded 25 partnerships between high schools, colleges, and employers to get high school students interested in—and excited about—STEM careers in clean energy.
Source: Commonwealth Corporation, Workforce Training Fund data.
Industry Sector Workforce Training Fund Investment
Planned # of Trainees
Manufacturing $27,558,403 18,203
Professional, Scientific and Technical Services $5,512,198 3,503
Healthcare & Social Assistance $3,425,433 3,208
Information $662,688 831
Totals: $37,158,721 25,745
$37Mto companies in four industry sectors that have large shares of workers in the STEM occupations
380provided by the Baker-Polito Administration
grants
totalling

6 While Massachusetts is Making Great Progress in STEM, there’s More to be Done
Average Days Needed to Fill High-Demand STEM Jobs in Massachusetts, 2017
This kind of sustained investment is important, because as much as Massachusetts leads in STEM, employers still have great unmet need for more STEM employees. For example, job openings in many high-demand STEM occupations—especially in the healthcare and computer/IT sectors—can take 40 to 70 days to fill. Figures like these shine a spotlight on the need for additional post-secondary education and training approaches to help Massachusetts residents gain the skills they need to obtain, or be promoted into, these good jobs.
Source: Labor Insight Jobs, Burning Glass Technologies: STEM Occupation Postings CY 2017.Note: Occupations are ranked by the average number of days a job was posted before being filled.
Occupation Sector Number of Job Postings Demand Days to
FillEstimated
Avg. Salary
Speech Pathologist Health Care 3,618 High 68 $72,392
Physician Health Care 14,701 Very High 64 $125,395
Nurse Practitioner Health Care 5,870 Very High 60 $114,567
Occupational Therapist Health Care 2,227 High 56 $81,973
Physical Therapist Health Care 5,584 Very High 54 $83,664
IT Project Manager Business Management 3,699 High 53 $117,421
Electrical Engineer Engineering 2,660 High 52 $103,675
Computer Systems Engineer
Information Technology 3,925 High 50 $122,027
Mechanical Engineer Engineering 3,000 High 50 $91,090
Network Engineer Information Technology 3,534 High 48 $115,102
40 to 70 high-demand STEM jobs
days to fill
In Massachusetts

6 Continued
Gender Gap in STEM Occupations (excluding Healthcare)
In addition, while Massachusetts was recently ranked second among all 50 states in terms of gender equity in STEM employment, the employment gap between women and men in STEM careers is still wide. While women hold more than half of healthcare jobs in Massachusetts, the state has only a modestly higher percentage of women in non-healthcare STEM occupations (29%), compared to the national average (25%). Overall, there are 2.5 men to every woman in STEM jobs, slightly better than the national rate of 3 men for every woman.
Source: https://justcapital.com/news/how-few-women-work-in-stem/
Location Total # STEM Jobs
# of Jobs Filled by Women % of Total
# of Jobs Filled by
Men% of Total
Massachusetts 267,005 77,028 29% 189,977 71%
United States 7,840,734 1,990,911 25% 5,849,823 75%
men2.5 to every woman in STEM jobs, slightly better than the national rate
In Massachusetts

11.2%
STEM jobs expected to increase in Massachusetts by
7.4%
total jobs expected to increase in Massachusetts by
2016 – 20267 STEM will be Even More Important to Massachusetts Going ForwardMassachusetts’ continued efforts to meet the needs of STEM employers, invest in STEM-related education and training initiatives for young people and adult workers, and to continue innovating in these areas is vital, because employment analyses uniformly predict that STEM will only become even more important to Massachusetts in the future. Between 2016 and 2026, the number of jobs in Massachusetts is expected to increase by about 271,000, or 7.4%, but STEM jobs are expected to increase by 11.2%. All told, STEM jobs are expected to account for 25% of the total employment growth in the Commonwealth over the next ten years.
Massachusetts Projections for STEM Occupations, 2016 - 2026
Source: Commonwealth Corporation analysis of Massachusetts Department of Unemployment Assistance, Eco-nomic Research Department, Occupational Projections 2016-2026Note*: Occupations are ranked by the average number of days a job was posted before being filled. Annual open-ings are the projected number of annual openings for workers entering occupation. The projected net increase in employment takes into account both projected openings and projected separations (transfers to another occupa-tion and exits from the labor force.)
STEM Occupational Groups
Jobs in 2016
Projected Jobs, 2026 Increase %
IncreaseAnnual
Openings*
Healthcare Practitioners 243,783 270,840 27,057 11% 15,750
Computer & Mathematical 146,847 165,803 18,956 13% 12,016
Architecture & Engineering 76,413 81,852 5,439 7% 6,026
Life, Physical, Social Sciences 50,845 56,705 5,860 12% 5,207
Managers, STEM Subset 41,623 46,410 4,787 12% 3,704
Sales Technical, STEM Subset 23,788 25,397 1,609 7% 2,621
Post-secondary Teachers, STEM Subset 19,881 23,696 3,815 19% 2,011
Total STEM Occupations 603,180 670,703 67,523 11% 47,335
So as the Commonwealth of Massachusetts marks STEM Week in 2018, let’s celebrate what we’ve done, take pride in where we are—and be mindful of where we need to go next.
This report was researched and written by Gene White and Raija Vaisanen of Commonwealth Corporation, with support from Rob Duncan, Stephen Lavery, Susan Lange, J.D. LaRock, Rebekah Lashman, John Niles and Theresa Rowland.