
Thickness determines microbial community structure and ...
10
1 SCIENTIFIC REPORTS | (2019) 9:5110 | https://doi.org/10.1038/s41598-019-41542-1 www.nature.com/scientificreports Thickness determines microbial community structure and function in nitrifying biofilms via deterministic assembly Carolina Suarez 1,2 , Maria Piculell 3 , Oskar Modin 2 , Silke Langenheder 4 , Frank Persson 2 & Malte Hermansson 1 Microbial biofilms are ubiquitous in aquatic environments where they provide important ecosystem functions. A key property believed to influence the community structure and function of biofilms is thickness. However, since biofilm thickness is inextricably linked to external factors such as water flow, temperature, development age and nutrient conditions, its importance is difficult to quantify. Here, we designed an experimental system in a wastewater treatment plant whereby nitrifying biofilms with different thicknesses (50 or 400 µm) were grown in a single reactor, and thus subjected to identical external conditions. The 50 and 400 µm biofilm communities were significantly different. This beta-diversity between biofilms of different thickness was primarily caused by deterministic factors. Turnover (species replacement) contributed more than nestedness (species loss) to the beta- diversity, i.e. the 50 µm communities were not simply a subset of the 400 µm communities. Moreover, the two communities differed in the composition of nitrogen-transforming bacteria and in nitrogen transformation rates. The study illustrates that biofilm thickness alone is a key driver for community composition and ecosystem function, which has implications for biotechnological applications and for our general understanding of biofilm ecology. Biofilms are dense communities, encased in a polymer matrix, attached to a surface and/or each other 1 with a high microbial diversity compared to the bulk water system 1–3 . Microbial biofilms are important in aquatic eco- systems and are useful in many biotechnological applications, such as wastewater- or drinking water treatment. In nitrogen removal from wastewater, moving bed biofilm reactors (MBBRs) are used at many wastewater treat- ment plants (WWTPs). Here biofilms grow on so-called carriers, which move freely in the bioreactor (Fig. 1c), where each free-floating biofilm carrier represents a local community and the reactor represents the regional community. e local communities have defined boundaries and are separate, but are linked by dispersal with all other biofilm carriers in the reactor, in this case fed with wastewater from a full-scale WWTP to form nitrifying biofilms. e mechanisms of community assembly are central in microbial ecology and in our understanding of for- mation of biodiversity in all ecosystems 4,5 , including microbial communities in biofilms 6 . ese mechanisms of community assembly include three major ecological processes: selection, driſt and dispersal 7 . Selection, i.e. the sorting of species by prevailing local abiotic and biotic conditions, is deterministic, while driſt results from stochastic birth and death events 5,7 . If local communities are further exposed to stochastic dispersal from the regional species pool (as we can assume to be the case of bioreactors in WWTPs), the expected result is that the abundance of a taxon in a local community can be predicted based on its respective abundance in the regional species pool and thereby follows neutral distribution patterns 8,9 . However, dispersal can also be deterministic if 1 Department of Chemistry and Molecular Biology/Microbiology, University of Gothenburg, SE-405 30, Gothenburg, Sweden. 2 Water Environment Technology, Department of Architecture and Civil Engineering, Chalmers University of Technology, SE-412 96, Gothenburg, Sweden. 3 Veolia Water Technologies AB – AnoxKaldnes, SE-226 47, Lund, Sweden. 4 Department of Ecology and Genetics/Limnology and Erken Laboratory, Uppsala University, SE-75 236, Uppsala, Sweden. Correspondence and requests for materials should be addressed to C.S. (email: carolina.suarez@ cmb.gu.se) Received: 26 October 2018 Accepted: 11 March 2019 Published: xx xx xxxx OPEN
Transcript of Thickness determines microbial community structure and ...
1Scientific RepoRts | (2019) 9:5110 | https://doi.org/10.1038/s41598-019-41542-1
www.nature.com/scientificreports
thickness determines microbial community structure and function in nitrifying biofilms via deterministic assemblyCarolina suarez 1,2, Maria piculell3, Oskar Modin 2, Silke Langenheder4, Frank persson2 & Malte Hermansson1
Microbial biofilms are ubiquitous in aquatic environments where they provide important ecosystem functions. A key property believed to influence the community structure and function of biofilms is thickness. However, since biofilm thickness is inextricably linked to external factors such as water flow, temperature, development age and nutrient conditions, its importance is difficult to quantify. Here, we designed an experimental system in a wastewater treatment plant whereby nitrifying biofilms with different thicknesses (50 or 400 µm) were grown in a single reactor, and thus subjected to identical external conditions. The 50 and 400 µm biofilm communities were significantly different. This beta-diversity between biofilms of different thickness was primarily caused by deterministic factors. Turnover (species replacement) contributed more than nestedness (species loss) to the beta-diversity, i.e. the 50 µm communities were not simply a subset of the 400 µm communities. Moreover, the two communities differed in the composition of nitrogen-transforming bacteria and in nitrogen transformation rates. The study illustrates that biofilm thickness alone is a key driver for community composition and ecosystem function, which has implications for biotechnological applications and for our general understanding of biofilm ecology.
Biofilms are dense communities, encased in a polymer matrix, attached to a surface and/or each other1 with a high microbial diversity compared to the bulk water system1–3. Microbial biofilms are important in aquatic eco-systems and are useful in many biotechnological applications, such as wastewater- or drinking water treatment. In nitrogen removal from wastewater, moving bed biofilm reactors (MBBRs) are used at many wastewater treat-ment plants (WWTPs). Here biofilms grow on so-called carriers, which move freely in the bioreactor (Fig. 1c), where each free-floating biofilm carrier represents a local community and the reactor represents the regional community. The local communities have defined boundaries and are separate, but are linked by dispersal with all other biofilm carriers in the reactor, in this case fed with wastewater from a full-scale WWTP to form nitrifying biofilms.
The mechanisms of community assembly are central in microbial ecology and in our understanding of for-mation of biodiversity in all ecosystems4,5, including microbial communities in biofilms6. These mechanisms of community assembly include three major ecological processes: selection, drift and dispersal7. Selection, i.e. the sorting of species by prevailing local abiotic and biotic conditions, is deterministic, while drift results from stochastic birth and death events5,7. If local communities are further exposed to stochastic dispersal from the regional species pool (as we can assume to be the case of bioreactors in WWTPs), the expected result is that the abundance of a taxon in a local community can be predicted based on its respective abundance in the regional species pool and thereby follows neutral distribution patterns8,9. However, dispersal can also be deterministic if
1Department of Chemistry and Molecular Biology/Microbiology, University of Gothenburg, SE-405 30, Gothenburg, Sweden. 2Water environment technology, Department of Architecture and civil engineering, chalmers University of Technology, SE-412 96, Gothenburg, Sweden. 3Veolia Water Technologies AB – AnoxKaldnes, SE-226 47, Lund, Sweden. 4Department of Ecology and Genetics/Limnology and Erken Laboratory, Uppsala University, SE-75 236, Uppsala, Sweden. correspondence and requests for materials should be addressed to c.S. (email: [email protected])
Received: 26 October 2018
Accepted: 11 March 2019
Published: xx xx xxxx
opeN
2Scientific RepoRts | (2019) 9:5110 | https://doi.org/10.1038/s41598-019-41542-1
www.nature.com/scientificreportswww.nature.com/scientificreports/
microorganisms differ in their ability to disperse within the complex spatial biofilm matrix or if their propagation is affected by interactions with species already present in the biofilm.
Selection has been suggested as the major mechanism for community assembly in stream biofilms10–12, and other biofilms13, while for biofilms within lakes linked by dispersal, both stochastic and deterministic factors were shown to be important14. The importance of both stochastic and deterministic factors was shown in an elegant study using parallel microbial electrolysis cells incubated with wastewater15. Other studies in wastewater activated sludge systems have also shown the importance of deterministic and stochastic factors16–19.
Deterministic assembly in biofilms could be due to specific mechanisms: Firstly, diffusion limitations form steep gradients of electron donors and acceptors in biofilms, which result in structured micro-environments. Examples are found in biofilms in WWTPs used for nitrification (i.e. the oxidation of ammonium to nitrate) during the nitrogen removal process20,21. Here population stratification typically occurs; ammonia oxidizing bac-teria (AOB) are found closest to the oxygenated water and nitrite oxidizing bacteria (NOB) below the AOB22–25. If oxygen is consumed, anaerobic ammonium oxidizing (anammox) bacteria can establish in the deeper parts of the biofilm22,26,27. Similarly, in other multispecies biofilms anaerobic sulfate reducing bacteria are found in the biofilm interior28. However, functions in microbial communities are not always sorted according to such a thermodynamic “redox tower” of electron acceptors29. This makes detailed a priori predictions of community structure in biofilms difficult. Secondly, in addition to gradients, it was realized early on that microbial biofilms are in fact complex structures and not homogenous layers of randomly distributed organisms3 and, ever since, architecture has been viewed as an important biofilm property. The intricate biofilm architecture consists of tow-ers, mushroom-like structures and water filled channels1,2,6,30. If biofilms differ in their architecture, dispersal effects could influence community assembly by changing the available colonization surface. Furthermore, micro-organism with deterministic dispersal might show preference towards different types of biofilms.
Thickness will likely influence several components of biofilm architecture, such as density, shape and porosity. It will also influence redox gradients and thus generally the local biofilm environment. However, the experimental evidence for effects of thickness on architecture, community structure and function has been difficult to obtain because biofilm thickness is the result of environmental conditions such as flow1,6,31–33, nutrient conditions23, development age of the biofilm33, carbon to nitrogen (C/N) ratios24 and temperature34. In most experimental systems, thickness cannot easily be isolated from these environmental factors that themselves can influence the community structure and functions.
Recently, a biofilm carrier with a defined grid wall height that defines the biofilm thickness was designed (Z-carriers, Veolia Water Technologies AB – AnoxKaldnes, Lund, Sweden)35–37. These carriers allow stringent experiments with different biofilm thicknesses, which have shown that thickness can affect some biofilm func-tions37,38, evenness38, biofilm architecture36, abundance of key organisms36,38 and functional stability after a dis-turbance36. Beside the opportunities to gain basic ecological knowledge by designing new experiments, the ability to control biofilm thickness opens for new process configurations in WWTPs. In this study, a pilot nitrifying bioreactor was filled with a mixture of Z-carriers with biofilm thicknesses of 50 and 400 µm. Thus, environmental conditions and history of the biofilms were the same. We ask if thickness, in itself or via diffusion effects or other mechanisms, is important for bacterial community structure, and if so, what the possible mechanisms of commu-nity assembly would be. The thicknesses we investigated are within the range commonly found in natural- as well as in man-made biofilms24,25,31,39,40.
Differences between communities, i.e. beta-diversity could arise due to (a) turnover (species replacement) and (b) nestedness (species-loss), the latter resulting from differences in richness41. Accordingly, beta-diversity between thin and thick biofilms could result from selection of different species due to different environmen-tal gradients42, or random drift or dispersal processes. Secondly, differences in species richness could also lead to a high between-group beta-diversity41–43. More specifically, because thicker biofilms have larger volume and
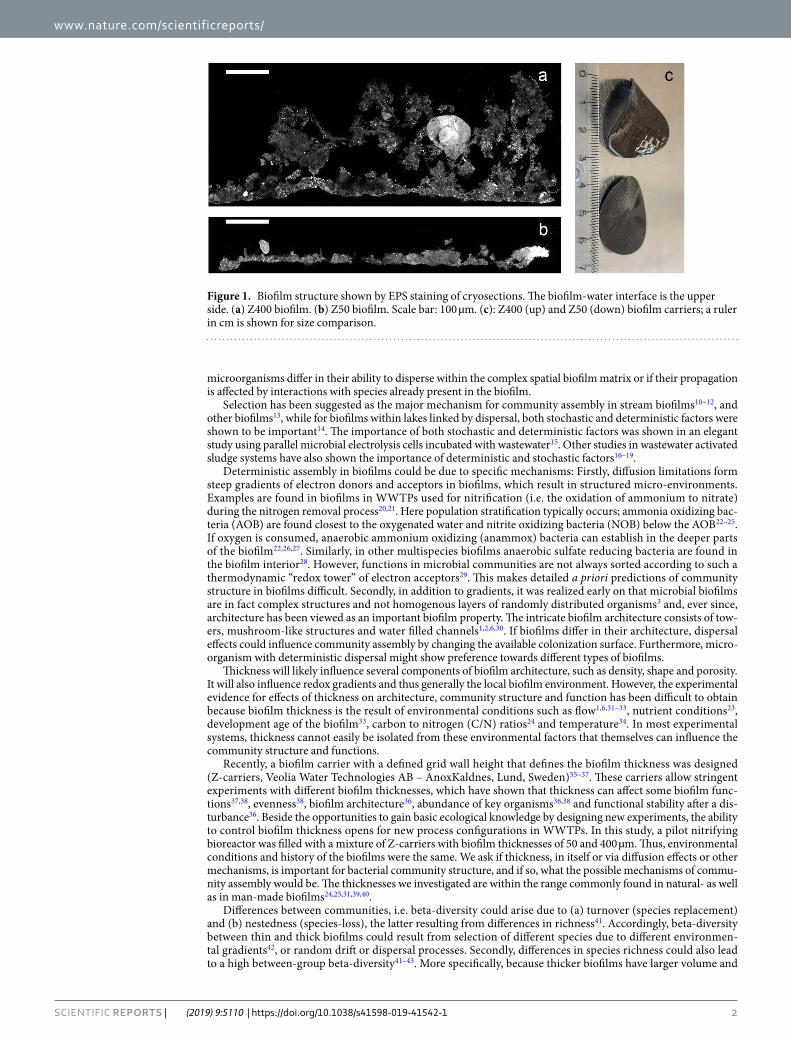
Figure 1. Biofilm structure shown by EPS staining of cryosections. The biofilm-water interface is the upper side. (a) Z400 biofilm. (b) Z50 biofilm. Scale bar: 100 µm. (c): Z400 (up) and Z50 (down) biofilm carriers; a ruler in cm is shown for size comparison.
3Scientific RepoRts | (2019) 9:5110 | https://doi.org/10.1038/s41598-019-41542-1
www.nature.com/scientificreportswww.nature.com/scientificreports/
surface-area36, they are expected to have higher species richness than thin biofilms, thus they are by chance expected to be colonized by more species; thicker biofilms would also have larger gradients of substrates and electron acceptors (e.g. due to anaerobic zones), that could allow the establishment of anaerobic taxa, increasing species richness compared to the thin biofilm.
We hypothesize that the 50 µm biofilm community would be a subset of the richer 400 µm biofilm commu-nity, due to anaerobic taxa being restricted to the thicker 400 µm biofilms, while the same aerobic taxa would occur in both the 50 and 400 µm biofilms. Alternatively, turnover, i.e. differences in species identity, could arise if biofilms of different thickness have different environmental conditions apart from gradients of substrates and electron acceptors, or due to ecological drift. We used the Baselga framework41 to estimate how much turnover and nestedness contributed to the observed beta-diversity, and a null model approach was used to determine the importance of deterministic versus stochastic assembly processes42. Finally, in order to link possible differences in taxa richness (i.e. nestedness) or identity (i.e. turnover) to functional differences between biofilms of distinct thicknesses, we also measured rates of nitrogen transformations, and discuss the implications of the results for wastewater treatment.
ResultsTwo different biofilms. We grew biofilm communities with a maximum thickness of 50 μm and 400 μm together in the same bioreactor; these communities are referred to as Z50 and Z400. CLSM images of EPS stained biofilm cryosections confirmed that carrier design limited biofilm thickness (Fig. 1a and b).
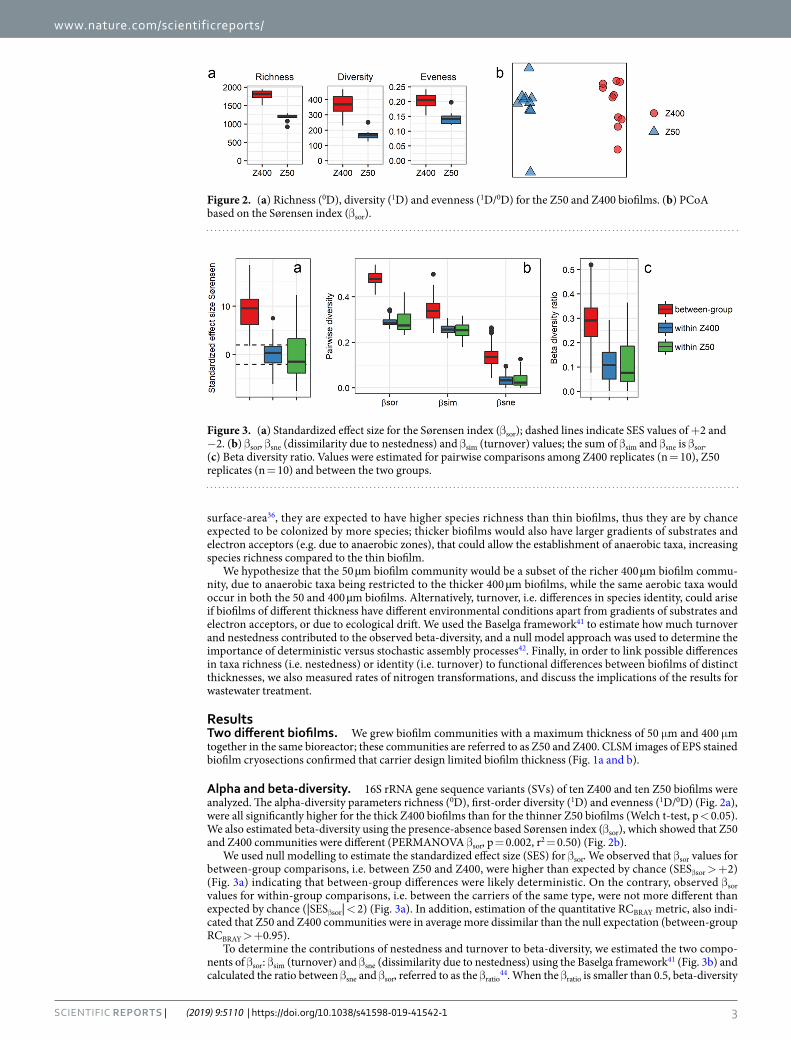
Alpha and beta-diversity. 16S rRNA gene sequence variants (SVs) of ten Z400 and ten Z50 biofilms were analyzed. The alpha-diversity parameters richness (0D), first-order diversity (1D) and evenness (1D/0D) (Fig. 2a), were all significantly higher for the thick Z400 biofilms than for the thinner Z50 biofilms (Welch t-test, p < 0.05). We also estimated beta-diversity using the presence-absence based Sørensen index (βsor), which showed that Z50 and Z400 communities were different (PERMANOVA βsor, p = 0.002, r2 = 0.50) (Fig. 2b).
We used null modelling to estimate the standardized effect size (SES) for βsor. We observed that βsor values for between-group comparisons, i.e. between Z50 and Z400, were higher than expected by chance (SESβsor > +2) (Fig. 3a) indicating that between-group differences were likely deterministic. On the contrary, observed βsor values for within-group comparisons, i.e. between the carriers of the same type, were not more different than expected by chance (|SESβsor| < 2) (Fig. 3a). In addition, estimation of the quantitative RCBRAY metric, also indi-cated that Z50 and Z400 communities were in average more dissimilar than the null expectation (between-group RCBRAY > +0.95).
To determine the contributions of nestedness and turnover to beta-diversity, we estimated the two compo-nents of βsor: βsim (turnover) and βsne (dissimilarity due to nestedness) using the Baselga framework41 (Fig. 3b) and calculated the ratio between βsne and βsor, referred to as the βratio
44. When the βratio is smaller than 0.5, beta-diversity
Figure 2. (a) Richness (0D), diversity (1D) and evenness (1D/0D) for the Z50 and Z400 biofilms. (b) PCoA based on the Sørensen index (βsor).
Figure 3. (a) Standardized effect size for the Sørensen index (βsor); dashed lines indicate SES values of +2 and −2. (b) βsor, βsne (dissimilarity due to nestedness) and βsim (turnover) values; the sum of βsim and βsne is βsor. (c) Beta diversity ratio. Values were estimated for pairwise comparisons among Z400 replicates (n = 10), Z50 replicates (n = 10) and between the two groups.
4Scientific RepoRts | (2019) 9:5110 | https://doi.org/10.1038/s41598-019-41542-1
www.nature.com/scientificreportswww.nature.com/scientificreports/
is dominated by turnover rather than nestedness44. We observed a between-group βratio lower than 0.5 (Fig. 3c). Thus, beta-diversity between the Z50 and Z400 communities was caused by both nestedness and turnover, with turnover being more important. In addition, both βsim and βsne were significantly different between the Z50 and Z400 communities (PERMANOVA βsim, p = 0.001, r2 = 0.34; PERMANOVA βsne, p = 0.001, r2 = 0.83).
To investigate which taxa were contributing to the differences in community composition between Z50 and Z400, differences in relative abundance of taxa between Z50 and Z400 were estimated using DESeq2. We found differential abundance (p(adj) < 0.01, DESeq2) for 45% of the sequence variants (SVs) analyzed with DESeq, while for the top 40 most abundant SVs, 32 had different abundance between Z50 and Z400 (Supplementary Fig. S1). Among the fraction with differential abundance, 26% of SVs were more abundant in Z50, and 74% were more abundant in Z400. The effect of thickness on relative abundance, if any, differed among taxa (for example Supplementary see Fig. S1).
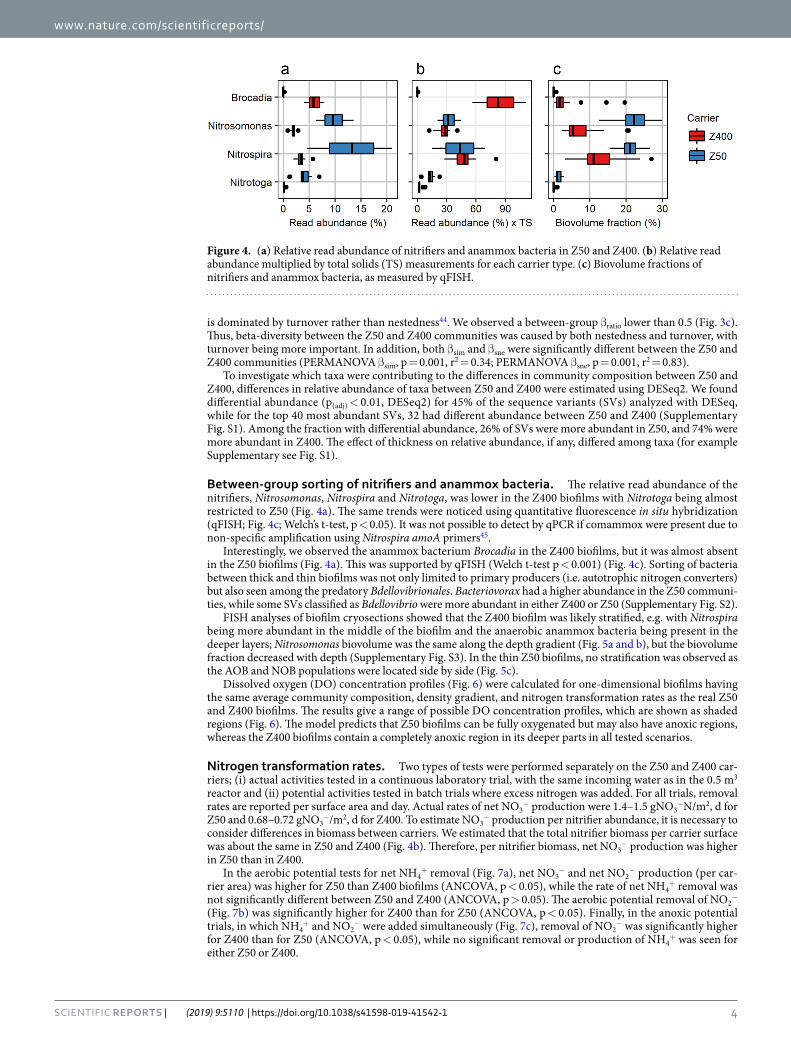
Between-group sorting of nitrifiers and anammox bacteria. The relative read abundance of the nitrifiers, Nitrosomonas, Nitrospira and Nitrotoga, was lower in the Z400 biofilms with Nitrotoga being almost restricted to Z50 (Fig. 4a). The same trends were noticed using quantitative fluorescence in situ hybridization (qFISH; Fig. 4c; Welch’s t-test, p < 0.05). It was not possible to detect by qPCR if comammox were present due to non-specific amplification using Nitrospira amoA primers45.
Interestingly, we observed the anammox bacterium Brocadia in the Z400 biofilms, but it was almost absent in the Z50 biofilms (Fig. 4a). This was supported by qFISH (Welch t-test p < 0.001) (Fig. 4c). Sorting of bacteria between thick and thin biofilms was not only limited to primary producers (i.e. autotrophic nitrogen converters) but also seen among the predatory Bdellovibrionales. Bacteriovorax had a higher abundance in the Z50 communi-ties, while some SVs classified as Bdellovibrio were more abundant in either Z400 or Z50 (Supplementary Fig. S2).
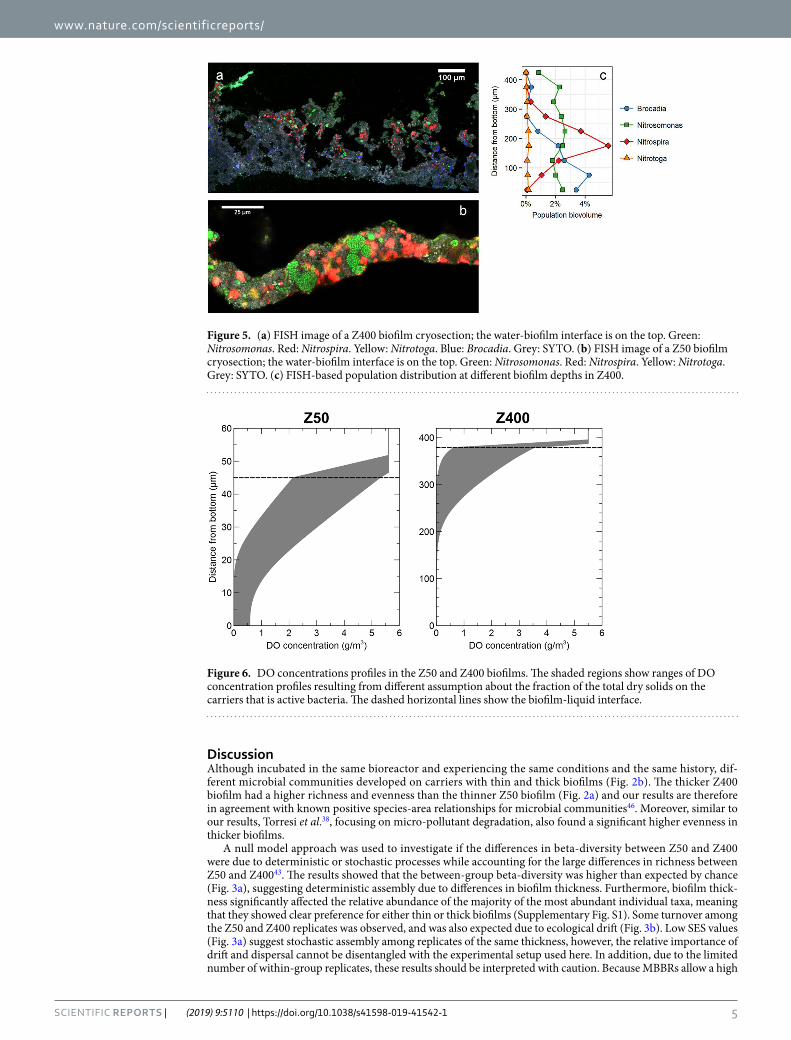
FISH analyses of biofilm cryosections showed that the Z400 biofilm was likely stratified, e.g. with Nitrospira being more abundant in the middle of the biofilm and the anaerobic anammox bacteria being present in the deeper layers; Nitrosomonas biovolume was the same along the depth gradient (Fig. 5a and b), but the biovolume fraction decreased with depth (Supplementary Fig. S3). In the thin Z50 biofilms, no stratification was observed as the AOB and NOB populations were located side by side (Fig. 5c).
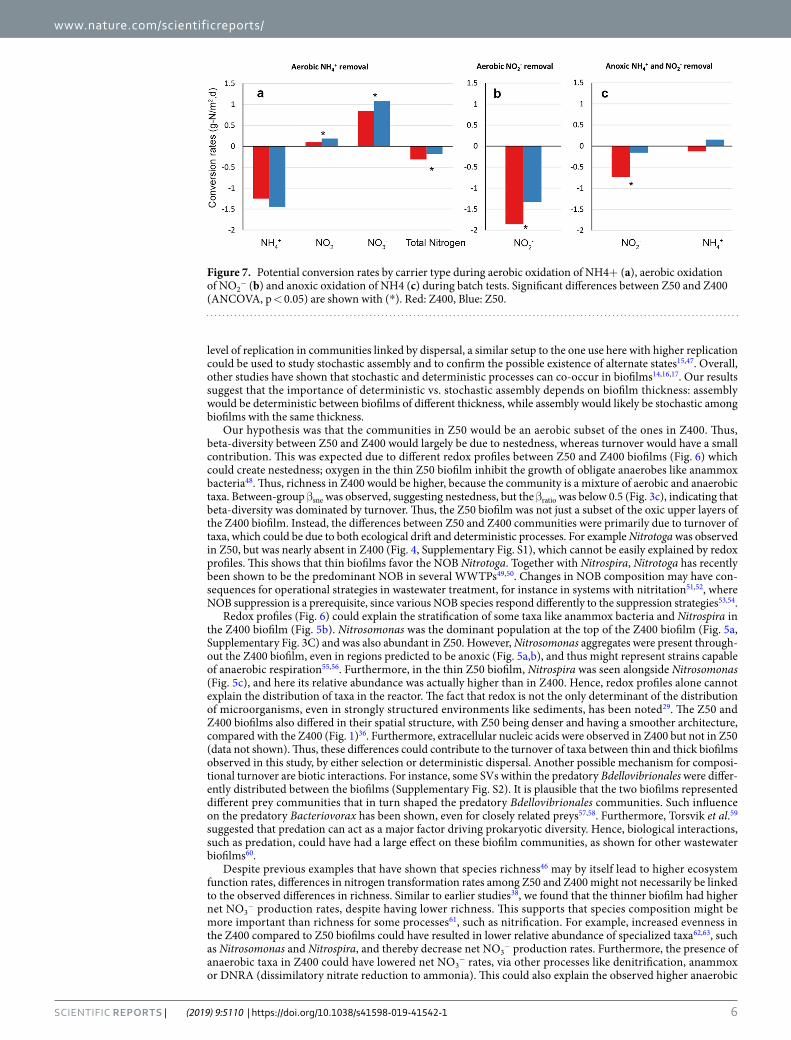
Dissolved oxygen (DO) concentration profiles (Fig. 6) were calculated for one-dimensional biofilms having the same average community composition, density gradient, and nitrogen transformation rates as the real Z50 and Z400 biofilms. The results give a range of possible DO concentration profiles, which are shown as shaded regions (Fig. 6). The model predicts that Z50 biofilms can be fully oxygenated but may also have anoxic regions, whereas the Z400 biofilms contain a completely anoxic region in its deeper parts in all tested scenarios.
Nitrogen transformation rates. Two types of tests were performed separately on the Z50 and Z400 car-riers; (i) actual activities tested in a continuous laboratory trial, with the same incoming water as in the 0.5 m3 reactor and (ii) potential activities tested in batch trials where excess nitrogen was added. For all trials, removal rates are reported per surface area and day. Actual rates of net NO3
− production were 1.4–1.5 gNO3−N/m2, d for
Z50 and 0.68–0.72 gNO3−/m2, d for Z400. To estimate NO3
− production per nitrifier abundance, it is necessary to consider differences in biomass between carriers. We estimated that the total nitrifier biomass per carrier surface was about the same in Z50 and Z400 (Fig. 4b). Therefore, per nitrifier biomass, net NO3
− production was higher in Z50 than in Z400.
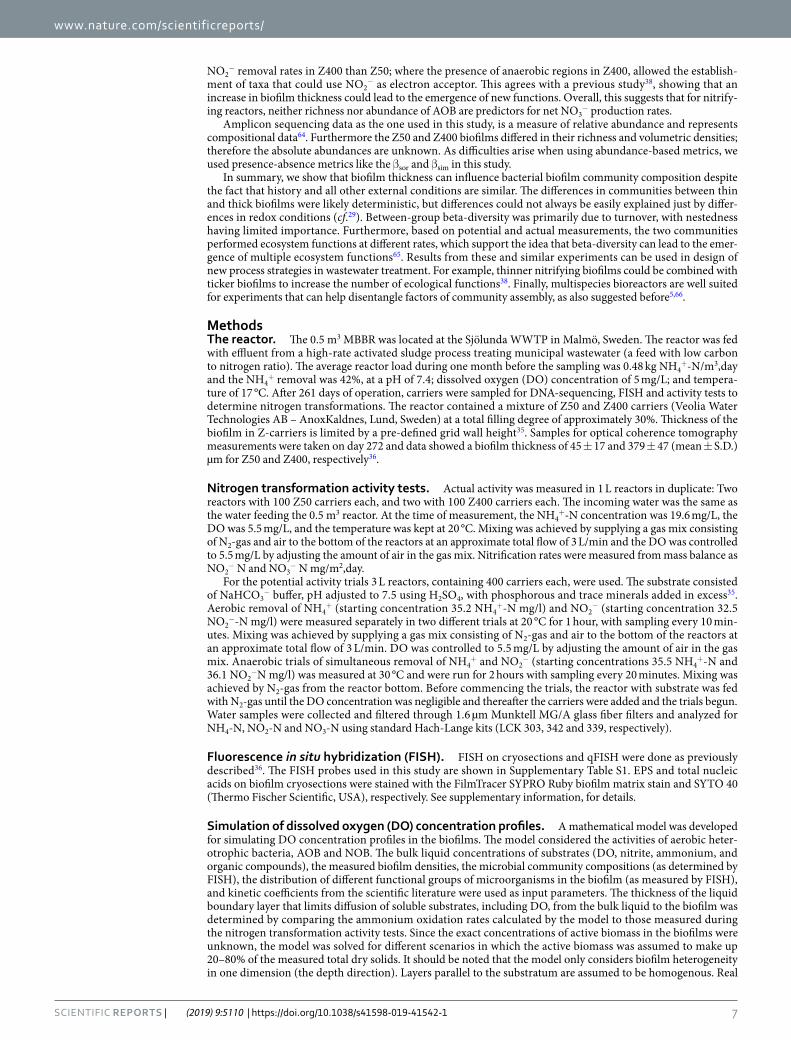
In the aerobic potential tests for net NH4+ removal (Fig. 7a), net NO3
− and net NO2− production (per car-
rier area) was higher for Z50 than Z400 biofilms (ANCOVA, p < 0.05), while the rate of net NH4+ removal was
not significantly different between Z50 and Z400 (ANCOVA, p > 0.05). The aerobic potential removal of NO2−
(Fig. 7b) was significantly higher for Z400 than for Z50 (ANCOVA, p < 0.05). Finally, in the anoxic potential trials, in which NH4
+ and NO2− were added simultaneously (Fig. 7c), removal of NO2
− was significantly higher for Z400 than for Z50 (ANCOVA, p < 0.05), while no significant removal or production of NH4
+ was seen for either Z50 or Z400.
Figure 4. (a) Relative read abundance of nitrifiers and anammox bacteria in Z50 and Z400. (b) Relative read abundance multiplied by total solids (TS) measurements for each carrier type. (c) Biovolume fractions of nitrifiers and anammox bacteria, as measured by qFISH.
5Scientific RepoRts | (2019) 9:5110 | https://doi.org/10.1038/s41598-019-41542-1
www.nature.com/scientificreportswww.nature.com/scientificreports/
DiscussionAlthough incubated in the same bioreactor and experiencing the same conditions and the same history, dif-ferent microbial communities developed on carriers with thin and thick biofilms (Fig. 2b). The thicker Z400 biofilm had a higher richness and evenness than the thinner Z50 biofilm (Fig. 2a) and our results are therefore in agreement with known positive species-area relationships for microbial communities46. Moreover, similar to our results, Torresi et al.38, focusing on micro-pollutant degradation, also found a significant higher evenness in thicker biofilms.
A null model approach was used to investigate if the differences in beta-diversity between Z50 and Z400 were due to deterministic or stochastic processes while accounting for the large differences in richness between Z50 and Z40043. The results showed that the between-group beta-diversity was higher than expected by chance (Fig. 3a), suggesting deterministic assembly due to differences in biofilm thickness. Furthermore, biofilm thick-ness significantly affected the relative abundance of the majority of the most abundant individual taxa, meaning that they showed clear preference for either thin or thick biofilms (Supplementary Fig. S1). Some turnover among the Z50 and Z400 replicates was observed, and was also expected due to ecological drift (Fig. 3b). Low SES values (Fig. 3a) suggest stochastic assembly among replicates of the same thickness, however, the relative importance of drift and dispersal cannot be disentangled with the experimental setup used here. In addition, due to the limited number of within-group replicates, these results should be interpreted with caution. Because MBBRs allow a high
Figure 5. (a) FISH image of a Z400 biofilm cryosection; the water-biofilm interface is on the top. Green: Nitrosomonas. Red: Nitrospira. Yellow: Nitrotoga. Blue: Brocadia. Grey: SYTO. (b) FISH image of a Z50 biofilm cryosection; the water-biofilm interface is on the top. Green: Nitrosomonas. Red: Nitrospira. Yellow: Nitrotoga. Grey: SYTO. (c) FISH-based population distribution at different biofilm depths in Z400.
Figure 6. DO concentrations profiles in the Z50 and Z400 biofilms. The shaded regions show ranges of DO concentration profiles resulting from different assumption about the fraction of the total dry solids on the carriers that is active bacteria. The dashed horizontal lines show the biofilm-liquid interface.
6Scientific RepoRts | (2019) 9:5110 | https://doi.org/10.1038/s41598-019-41542-1
www.nature.com/scientificreportswww.nature.com/scientificreports/
level of replication in communities linked by dispersal, a similar setup to the one use here with higher replication could be used to study stochastic assembly and to confirm the possible existence of alternate states15,47. Overall, other studies have shown that stochastic and deterministic processes can co-occur in biofilms14,16,17. Our results suggest that the importance of deterministic vs. stochastic assembly depends on biofilm thickness: assembly would be deterministic between biofilms of different thickness, while assembly would likely be stochastic among biofilms with the same thickness.
Our hypothesis was that the communities in Z50 would be an aerobic subset of the ones in Z400. Thus, beta-diversity between Z50 and Z400 would largely be due to nestedness, whereas turnover would have a small contribution. This was expected due to different redox profiles between Z50 and Z400 biofilms (Fig. 6) which could create nestedness; oxygen in the thin Z50 biofilm inhibit the growth of obligate anaerobes like anammox bacteria48. Thus, richness in Z400 would be higher, because the community is a mixture of aerobic and anaerobic taxa. Between-group βsne was observed, suggesting nestedness, but the βratio was below 0.5 (Fig. 3c), indicating that beta-diversity was dominated by turnover. Thus, the Z50 biofilm was not just a subset of the oxic upper layers of the Z400 biofilm. Instead, the differences between Z50 and Z400 communities were primarily due to turnover of taxa, which could be due to both ecological drift and deterministic processes. For example Nitrotoga was observed in Z50, but was nearly absent in Z400 (Fig. 4, Supplementary Fig. S1), which cannot be easily explained by redox profiles. This shows that thin biofilms favor the NOB Nitrotoga. Together with Nitrospira, Nitrotoga has recently been shown to be the predominant NOB in several WWTPs49,50. Changes in NOB composition may have con-sequences for operational strategies in wastewater treatment, for instance in systems with nitritation51,52, where NOB suppression is a prerequisite, since various NOB species respond differently to the suppression strategies53,54.
Redox profiles (Fig. 6) could explain the stratification of some taxa like anammox bacteria and Nitrospira in the Z400 biofilm (Fig. 5b). Nitrosomonas was the dominant population at the top of the Z400 biofilm (Fig. 5a, Supplementary Fig. 3C) and was also abundant in Z50. However, Nitrosomonas aggregates were present through-out the Z400 biofilm, even in regions predicted to be anoxic (Fig. 5a,b), and thus might represent strains capable of anaerobic respiration55,56. Furthermore, in the thin Z50 biofilm, Nitrospira was seen alongside Nitrosomonas (Fig. 5c), and here its relative abundance was actually higher than in Z400. Hence, redox profiles alone cannot explain the distribution of taxa in the reactor. The fact that redox is not the only determinant of the distribution of microorganisms, even in strongly structured environments like sediments, has been noted29. The Z50 and Z400 biofilms also differed in their spatial structure, with Z50 being denser and having a smoother architecture, compared with the Z400 (Fig. 1)36. Furthermore, extracellular nucleic acids were observed in Z400 but not in Z50 (data not shown). Thus, these differences could contribute to the turnover of taxa between thin and thick biofilms observed in this study, by either selection or deterministic dispersal. Another possible mechanism for composi-tional turnover are biotic interactions. For instance, some SVs within the predatory Bdellovibrionales were differ-ently distributed between the biofilms (Supplementary Fig. S2). It is plausible that the two biofilms represented different prey communities that in turn shaped the predatory Bdellovibrionales communities. Such influence on the predatory Bacteriovorax has been shown, even for closely related preys57,58. Furthermore, Torsvik et al.59 suggested that predation can act as a major factor driving prokaryotic diversity. Hence, biological interactions, such as predation, could have had a large effect on these biofilm communities, as shown for other wastewater biofilms60.
Despite previous examples that have shown that species richness46 may by itself lead to higher ecosystem function rates, differences in nitrogen transformation rates among Z50 and Z400 might not necessarily be linked to the observed differences in richness. Similar to earlier studies38, we found that the thinner biofilm had higher net NO3
− production rates, despite having lower richness. This supports that species composition might be more important than richness for some processes61, such as nitrification. For example, increased evenness in the Z400 compared to Z50 biofilms could have resulted in lower relative abundance of specialized taxa62,63, such as Nitrosomonas and Nitrospira, and thereby decrease net NO3
− production rates. Furthermore, the presence of anaerobic taxa in Z400 could have lowered net NO3
− rates, via other processes like denitrification, anammox or DNRA (dissimilatory nitrate reduction to ammonia). This could also explain the observed higher anaerobic
Figure 7. Potential conversion rates by carrier type during aerobic oxidation of NH4+ (a), aerobic oxidation of NO2
− (b) and anoxic oxidation of NH4 (c) during batch tests. Significant differences between Z50 and Z400 (ANCOVA, p < 0.05) are shown with (*). Red: Z400, Blue: Z50.
7Scientific RepoRts | (2019) 9:5110 | https://doi.org/10.1038/s41598-019-41542-1
www.nature.com/scientificreportswww.nature.com/scientificreports/
NO2− removal rates in Z400 than Z50; where the presence of anaerobic regions in Z400, allowed the establish-
ment of taxa that could use NO2− as electron acceptor. This agrees with a previous study38, showing that an
increase in biofilm thickness could lead to the emergence of new functions. Overall, this suggests that for nitrify-ing reactors, neither richness nor abundance of AOB are predictors for net NO3
− production rates.Amplicon sequencing data as the one used in this study, is a measure of relative abundance and represents
compositional data64. Furthermore the Z50 and Z400 biofilms differed in their richness and volumetric densities; therefore the absolute abundances are unknown. As difficulties arise when using abundance-based metrics, we used presence-absence metrics like the βsor and βsim in this study.
In summary, we show that biofilm thickness can influence bacterial biofilm community composition despite the fact that history and all other external conditions are similar. The differences in communities between thin and thick biofilms were likely deterministic, but differences could not always be easily explained just by differ-ences in redox conditions (cf.29). Between-group beta-diversity was primarily due to turnover, with nestedness having limited importance. Furthermore, based on potential and actual measurements, the two communities performed ecosystem functions at different rates, which support the idea that beta-diversity can lead to the emer-gence of multiple ecosystem functions65. Results from these and similar experiments can be used in design of new process strategies in wastewater treatment. For example, thinner nitrifying biofilms could be combined with ticker biofilms to increase the number of ecological functions38. Finally, multispecies bioreactors are well suited for experiments that can help disentangle factors of community assembly, as also suggested before5,66.
Methodsthe reactor. The 0.5 m3 MBBR was located at the Sjölunda WWTP in Malmö, Sweden. The reactor was fed with effluent from a high-rate activated sludge process treating municipal wastewater (a feed with low carbon to nitrogen ratio). The average reactor load during one month before the sampling was 0.48 kg NH4
+-N/m3,day and the NH4
+ removal was 42%, at a pH of 7.4; dissolved oxygen (DO) concentration of 5 mg/L; and tempera-ture of 17 °C. After 261 days of operation, carriers were sampled for DNA-sequencing, FISH and activity tests to determine nitrogen transformations. The reactor contained a mixture of Z50 and Z400 carriers (Veolia Water Technologies AB – AnoxKaldnes, Lund, Sweden) at a total filling degree of approximately 30%. Thickness of the biofilm in Z-carriers is limited by a pre-defined grid wall height35. Samples for optical coherence tomography measurements were taken on day 272 and data showed a biofilm thickness of 45 ± 17 and 379 ± 47 (mean ± S.D.) µm for Z50 and Z400, respectively36.
Nitrogen transformation activity tests. Actual activity was measured in 1 L reactors in duplicate: Two reactors with 100 Z50 carriers each, and two with 100 Z400 carriers each. The incoming water was the same as the water feeding the 0.5 m3 reactor. At the time of measurement, the NH4
+-N concentration was 19.6 mg/L, the DO was 5.5 mg/L, and the temperature was kept at 20 °C. Mixing was achieved by supplying a gas mix consisting of N2-gas and air to the bottom of the reactors at an approximate total flow of 3 L/min and the DO was controlled to 5.5 mg/L by adjusting the amount of air in the gas mix. Nitrification rates were measured from mass balance as NO2
− N and NO3− N mg/m2,day.
For the potential activity trials 3 L reactors, containing 400 carriers each, were used. The substrate consisted of NaHCO3
− buffer, pH adjusted to 7.5 using H2SO4, with phosphorous and trace minerals added in excess35. Aerobic removal of NH4
+ (starting concentration 35.2 NH4+-N mg/l) and NO2
− (starting concentration 32.5 NO2
−-N mg/l) were measured separately in two different trials at 20 °C for 1 hour, with sampling every 10 min-utes. Mixing was achieved by supplying a gas mix consisting of N2-gas and air to the bottom of the reactors at an approximate total flow of 3 L/min. DO was controlled to 5.5 mg/L by adjusting the amount of air in the gas mix. Anaerobic trials of simultaneous removal of NH4
+ and NO2− (starting concentrations 35.5 NH4
+-N and 36.1 NO2
−N mg/l) was measured at 30 °C and were run for 2 hours with sampling every 20 minutes. Mixing was achieved by N2-gas from the reactor bottom. Before commencing the trials, the reactor with substrate was fed with N2-gas until the DO concentration was negligible and thereafter the carriers were added and the trials begun. Water samples were collected and filtered through 1.6 µm Munktell MG/A glass fiber filters and analyzed for NH4-N, NO2-N and NO3-N using standard Hach-Lange kits (LCK 303, 342 and 339, respectively).
Fluorescence in situ hybridization (FISH). FISH on cryosections and qFISH were done as previously described36. The FISH probes used in this study are shown in Supplementary Table S1. EPS and total nucleic acids on biofilm cryosections were stained with the FilmTracer SYPRO Ruby biofilm matrix stain and SYTO 40 (Thermo Fischer Scientific, USA), respectively. See supplementary information, for details.
Simulation of dissolved oxygen (DO) concentration profiles. A mathematical model was developed for simulating DO concentration profiles in the biofilms. The model considered the activities of aerobic heter-otrophic bacteria, AOB and NOB. The bulk liquid concentrations of substrates (DO, nitrite, ammonium, and organic compounds), the measured biofilm densities, the microbial community compositions (as determined by FISH), the distribution of different functional groups of microorganisms in the biofilm (as measured by FISH), and kinetic coefficients from the scientific literature were used as input parameters. The thickness of the liquid boundary layer that limits diffusion of soluble substrates, including DO, from the bulk liquid to the biofilm was determined by comparing the ammonium oxidation rates calculated by the model to those measured during the nitrogen transformation activity tests. Since the exact concentrations of active biomass in the biofilms were unknown, the model was solved for different scenarios in which the active biomass was assumed to make up 20–80% of the measured total dry solids. It should be noted that the model only considers biofilm heterogeneity in one dimension (the depth direction). Layers parallel to the substratum are assumed to be homogenous. Real
8Scientific RepoRts | (2019) 9:5110 | https://doi.org/10.1038/s41598-019-41542-1
www.nature.com/scientificreportswww.nature.com/scientificreports/
biofilms are three-dimensional structures containing channels and voids, which may allow oxygen transport into deeper regions locally. See supplementary material for details.
DNA extraction and 16S rRNA gene sequencing. DNA was separately extracted from ten Z50 and ten Z400 carriers. DNA extraction, PCR and high throughput amplicon sequencing of 16S rRNA gene was done as previously described67 with some modifications. Sequence variants (SVs) were generated for finer resolution of taxa68,69. See supplementary information for details. Raw sequence reads were deposited at the NCBI Sequence Read Archive, no. SRP103666.
statistics. Data was analyzed in R (R Core Team 2018), using the packages Phyloseq70, Vegan71, DESeq272 and betapart41. Differential abundance of SVs was estimated with DESeq272,73, without random subsampling before the analysis. After independent filtering in DESeq2, 2578 of 3690 SVs were analyzed. A p(adj) < 0.01 value (DESeq2) was used as criterion for statistical significance. Subsampling to even depth was done prior to esti-mation of alpha-diversity and beta-diversity. Alpha-diversity was calculated as the first two Hill numbers74, 0D (richness) and 1D (exponential of Shannon-Wiener index). Evenness was estimated as (1D/0D). Beta-diversity was estimated as pairwise Sørensen (βsor) dissimilarities, a presence-absence metric. Principal coordinate analysis (PCoA) was used for ordination. Permutational multivariate analysis of variance (PERMANOVA)75 was used test for significant difference between group centroids. The components of βsor, turnover (βsim) and dissimilarity due to nestedness (βsne), were estimated as described by Baselga et al.41 and used to calculate the beta-diversity ratio (βratio) as the ratio between βsne and βsor
44. If the βratio is smaller than 0.5, beta-diversity is dominated by turnover rather than nestedness44.
To disentangle the contribution of stochastic and deterministic community assembly mechanisms while at the same time accounting for possible differences in richness between Z50 and Z400, a null model approach was used. Firstly, the standardized effect size (SES) for pairwise Sørensen (SESβsor) dissimilarities were estimated in vegan using the oecosimu function. 999 null communities for estimation of SESβsor were generated using the quasiswap algorithm76, which preserve species richness and species incidence. For within groups null model analyses of Z50 and Z400 communities, only the taxa present in Z50 or Z400 respectively were used as the regional species pool. |SESβsor| > 2 was used as criteria to estimate if βsor was different than expected by chance; a |SES| > 2 value is approximately a 95% confidence interval77. Secondly, the RCbray metric78, which is based on quantitative data, was estimated for between-group comparisons, using 999 simulated communities. |RCbray| > 0.95 values were interpreted as deviations from the random expectation43,78.
Data AvailabilityAll data generated or analyzed during this study will be available upon request to the corresponding author.
References 1. Flemming, H.-C. et al. Biofilms: An emergent form of bacterial life. Nat. Rev. Microbiol. 14, 563–575 (2016). 2. Battin, T. J., Besemer, K., Bengtsson, M. M., Romani, A. M. & Packmann, A. I. The ecology and biogeochemistry of stream biofilms.
Nat. Rev. Microbiol. 14, 251–263 (2016). 3. Costerton, J. W., Lewandowski, Z., Caldwell, D. E., Korber, D. R. & Lappin-Scott, H. M. Microbial biofilms. Annu. Rev. Microbiol. 49,
711–745 (1995). 4. Nemergut, D. R. et al. Patterns and processes of microbial community assembly. Microbiol Mol Biol Rev 77, 342–356 (2013). 5. Zhou, J. & Ning, D. Stochastic community assembly: Does it matter in microbial ecology. Microbiol. Mol. Biol. Rev. 81,
e00002-00017–00032 (2017). 6. Battin, T. J. et al. Microbial landscapes: new paths to biofilm research. Nat. Rev. Microbiol. 5, 76–81 (2007). 7. Vellend, M. Conceptual synthesis in community ecology. Q Rev Biol. 85, 183–206 (2010). 8. Hubbell, S. P. The Unified Neutral Theory of Biodiversity and Biogeography. (Princeton University Press, 2001). 9. Östman, Ö. et al. Regional invariance among microbial communities. Ecol. Lett. 13, 118–127 (2010). 10. Besemer, K. et al. Unraveling assembly of stream biofilm communities. ISME J. 6, 1459–1468 (2012). 11. Besemer, K., Singer, G., Hödl, I. & Battin, T. J. Bacterial community composition of stream biofilms in spatially variable-flow
environments. Appl. Environ. Microbiol. 75, 7189–7195 (2009). 12. Lyautey, E., Jackson, C. R., Cayrou, J., Rols, J.-L. & Garabétian, F. Bacterial community succession in natural river biofilm
assemblages. Microb. Ecol. 50, 589–601 (2005). 13. Jackson, C. R., Churchill, P. F. & Roden, E. E. Successional changes in bacterial assemblage structure during epilithic biofilm
development. Ecology. 82, 555–566 (2001). 14. Langenheder, S. et al. Bacterial metacommunity organization in a highly connected aquatic system. FEMS Microbiol Ecol 93, fiw225
(2017). 15. Zhou, J. et al. Stochastic Assembly Leads to Alternative Communities with Distinct Functions in a Bioreactor Microbial Community.
mBio. 4, e00584-00512–e00584-00512 (2013). 16. Ofiţeru, I. D., Lunn, M. & Curtis, T. P. Combined niche and neutral effects in a microbial wastewater treatment community. Proc Natl
Acad Sci USA 107, 15345–15350 (2010). 17. Ayarza, J. M. & Erijman, L. Balance of neutral and deterministic components in the dynamics of activated sludge floc assembly.
Microb. Ecol. 61, 486–495 (2010). 18. Griffin, J. S. & Wells, G. F. Regional synchrony in full-scale activated sludge bioreactors due to deterministic microbial community
assembly. ISME J. 11, 500–511 (2017). 19. Lee, S.-H., Kang, H.-J. & Park, H.-D. Influence of influent wastewater communities on temporal variation of activated sludge
communities. Water Res. 73, 132–144 (2015). 20. Schramm, A. et al. Structure and function of a nitrifying biofilm as determined by in situ hybridization and the use of
microelectrodes. Appl. Environ. Microbiol. 62, 4641–4647 (1996). 21. Okabe, S., Naitoh, H., Satoh, H. & Watanabe, Y. Structure and function of nitrifying biofilms as determined by molecular techniques
and the use of microelectrodes. Water Sci. Technol. 46, 233–241 (2002). 22. Almstrand, R., Persson, F. & Hermansson, M. In Metagenomics of the microbial nitrogen cycle: Theory, methods and applications (ed.
Marco, D.) (Caister Academic Press, 2014). 23. Lydmark, P., Lind, M., Sörensson, F. & Hermansson, M. Vertical distribution of nitrifying populations in bacterial biofilms from a
full-scale nitrifying trickling filter. Environ Microbiol. 8, 2036–2049 (2006).
9Scientific RepoRts | (2019) 9:5110 | https://doi.org/10.1038/s41598-019-41542-1
www.nature.com/scientificreportswww.nature.com/scientificreports/
24. Okabe, S., Hiratia, K., Ozawa, Y. & Watanabe, Y. Spatial microbial distributions of nitrifiers and heterotrophs in mixed-population biofilms. Biotechnol. Bioeng. 50, 24–35 (1996).
25. Persson, F., Wik, T., Sörensson, F. & Hermansson, M. Distribution and activity of ammonia oxidizing bacteria in a large full-scale trickling filter. Water Res. 36, 1439–1448 (2002).
26. Persson, F. et al. Structure and composition of biofilm communities in a moving bed biofilm reactor for nitritation-anammox at low temperatures. Bioresour. Technol. 154, 267–273 (2014).
27. Suarez, C., Persson, F. & Hermansson, M. Predation of nitritation–anammox biofilms used for nitrogen removal from wastewater. FEMS Microbiol Ecol 91, fiv124 (2015).
28. Ramsing, N. B., Kuhl, M. & Jørgensen, B. B. Distribution of sulfate-reducing bacteria, O2, and H2S in photosynthetic biofilms determined by oligonucleotide probes and microelectrodes. Appl. Environ. Microbiol. 59, 3840–3849 (1993).
29. Chen, J. et al. Impacts of chemical gradients on microbial community structure. ISME J. 11, 920–931 (2017). 30. Hall-Stoodley, L., Costerton, J. W. & Stoodley, P. Bacterial biofilms: from the Natural environment to infectious diseases. Nat. Rev.
Microbiol. 2, 95–108 (2004). 31. Battin, T. J., Kaplan, L. A., Newbold, J. D., Cheng, X. & Hansen, C. Effects of current velocity on the nascent architecture of stream
microbial biofilms. Appl. Environ. Microbiol. 69, 5443–5452 (2003). 32. Hödl, I. et al. Biophysical controls on cluster dynamics and architectural differentiation of microbial biofilms in contrasting flow
environments. Environ Microbiol. 16, 802–812 (2013). 33. Liu, T., Quan, X. & Li, D. Evaluations of biofilm thickness and dissolved oxygen on single stage anammox process in an up-flow
biological aerated filter. Biochem. Eng. J. 119, 20–26 (2017). 34. He, J. et al. Community diversity and biofilm characteristic response to low temperature and low C/N ratio in a suspended carrier
biofilm reactor. Desalin. Water. Treat. 57, 22212–22222 (2016). 35. Piculell, M., Christensson, M., Jönsson, K. & Welander, T. Partial nitrification in MBBRs for mainstream deammonification with
thin biofilms and alternating feed supply. Water Sci. Technol. 73, 1253–1260 (2016). 36. Piculell, M. et al. The inhibitory effects of reject water on nitrifying populations grown at different biofilm thickness. Water Res. 104,
292–302 (2016). 37. Piculell, M., Welander, P., Jönsson, K. & Welander, T. Evaluating the effect of biofilm thickness on nitrification in moving bed biofilm
reactors. Environ. Technol. 37, 732–743 (2016). 38. Torresi, E. et al. Biofilm thickness influences biodiversity in nitrifying mbbrs—implications on micropollutant removal. Environ. Sci.
Technol. 50, 9279–9288 (2016). 39. García, S., Trueba, A., Vega, L. M. & Madariaga, E. Impact of the surface roughness of AISI 316L stainless steel on biofilm adhesion
in a seawater- cooled tubular heat exchanger-condenser. Biofouling 32, 1185–1193 (2016). 40. Rao, T. S. Comparative effect of temperature on biofilm formation in natural and modified marine environment. Aquat. Ecol. 44,
463–478 (2009). 41. Baselga, A. Partitioning the turnover and nestedness components of beta diversity. Glob. Ecol. Biogeogr. 19, 134–143 (2010). 42. Chase, J. M. & Myers, J. A. Disentangling the importance of ecological niches from stochastic processes across scales. Philos. Trans.
Royal Soc. B. 366, 2351–2363 (2011). 43. Chase, J. M., Kraft, N. J. B., Smith, K. G., Vellend, M. & Inouye, B. D. Using null models to disentangle variation in community
dissimilarity from variation in α-diversity. Ecosphere. 2, art24–11 (2011). 44. Dobrovolski, R., Melo, A. S., Cassemiro, F. A. S. & Diniz-Filho, J. A. F. Climatic history and dispersal ability explain the relative
importance of turnover and nestedness components of beta diversity. Glob. Ecol. Biogeogr. 21, 191–197 (2011). 45. Pjevac, P. et al. AmoA-Targeted Polymerase Chain Reaction Primers for the Specific Detection and Quantification of Comammox
Nitrospira in the Environment. Front Microbiol. 8, 847–811 (2017). 46. Bell, T., Newman, J. A., Silverman, B. W., Turner, S. L. & Lilley, A. K. The contribution of species richness and composition to
bacterial services. Nature. 436, 1157–1160 (2005). 47. Pagaling, E. et al. Assembly of microbial communities in replicate nutrient-cycling model ecosystems follows divergent trajectories,
leading to alternate stable states. Environ Microbiol. 19, 3374–3386 (2017). 48. Strous, M., Van Gerven, E., Kuenen, J. & Jetten, M. Effects of aerobic and microaerobic conditions on anaerobic ammonium-
oxidizing (anammox) sludge. Appl. Environ. Microbiol. 63, 2446–2448 (1997). 49. Saunders, A. M., Albertsen, M., Vollertsen, J. & Nielsen, P. H. The activated sludge ecosystem contains a core community of
abundant organisms. ISME J. 10, 11 (2015). 50. Lücker, S. et al. Nitrotoga-like bacteria are previously unrecognized key nitrite oxidizers in full-scale wastewater treatment plants.
ISME J. 9, 708 (2014). 51. Agrawal, S., Seuntjens, D., Cocker, P. D., Lackner, S. & Vlaeminck, S. E. Success of mainstream partial nitritation/anammox demands
integration of engineering, microbiome and modeling insights. Curr. Opin. Biotechnol. 50, 214–221 (2018). 52. Peng, Y. & Zhu, G. Biological nitrogen removal with nitrification and denitrification via nitrite pathway. Appl. Microbiol. Biotechnol.
73, 15–26 (2006). 53. Bao, P., Wang, S., Ma, B., Zhang, Q. & Peng, Y. Achieving partial nitrification by inhibiting the activity of Nitrospira-like bacteria
under high-DO conditions in an intermittent aeration reactor. J. Environ. Sci. 56, 71–78 (2017). 54. Gilbert, E. M. et al. Response of Different Nitrospira Species To Anoxic Periods Depends on Operational DO. Environ. Sci. Technol.
48, 2934–2941 (2014). 55. Schmidt, I., van Spanning, R. J. M. & Jetten, M. S. M. Denitrification and ammonia oxidation by Nitrosomonas europaea wild-type,
and NirK- and NorB-deficient mutants. Microbiology. 150, 4107–4114 (2004). 56. Bock, E., Schmidt, I., Stüven, R. & Zart, D. Nitrogen loss caused by denitrifying Nitrosomonas cells using ammonium or hydrogen
as electron donors and nitrite as electron acceptor. Arch. Microbiol. 163, 16–20 (1995). 57. Chen, H., Athar, R., Zheng, G. & Williams, H. N. Prey bacteria shape the community structure of their predators. ISME J. 5,
1314–1322 (2011). 58. Chen, H., Young, S., Berhane, T.-K. & Williams, H. N. Predatory Bacteriovorax communities ordered by various prey species. PLoS
ONE. 7, e34174–34111 (2012). 59. Torsvik, V., Ovreas, L. & Thingstad, T. F. Prokaryotic diversity - Magnitude, dynamics, and controlling factors. Science. 296,
1064–1066 (2002). 60. Feng, S., Tan, C. H., Cohen, Y. & Rice, S. A. Isolation of Bdellovibrio bacteriovorus from a tropical wastewater treatment plant and
predation of mixed species biofilms assembled by the native community members. Environ Microbiol. 18, 3923–3931 (2016). 61. Peter, H. et al. Function-specific response to depletion of microbial diversity. ISME J. 5, 351–361 (2010). 62. Knelman, J. E. & Nemergut, D. R. Changes in community assembly may shift the relationship between biodiversity and ecosystem
function. Front Microbiol. 5(424), 421–424 (2014). 63. Hillebrand, H., Bennett, D. M. & Cadotte, M. W. Consequences of dominance: A review of evenness effects on local and regional
ecosystem processes. Ecology. 89, 1510–1520 (2008). 64. Gloor, G. B., Macklaim, J. M., Pawlowsky-Glahn, V. & Egozcue, J. J. Microbiome Datasets Are Compositional: And This Is Not
Optional. Front Microbiol. 8, 2224–2224 (2017). 65. Mori, A. S., Isbell, F. & Seidl, R. β-Diversity, Community Assembly, and Ecosystem Functioning. Trends Ecol. Evol. 33, 549–564
(2018).
1 0Scientific RepoRts | (2019) 9:5110 | https://doi.org/10.1038/s41598-019-41542-1
www.nature.com/scientificreportswww.nature.com/scientificreports/
66. Tan, C. H., Lee, K. W. K., Burmølle, M., Kjelleberg, S. & Rice, S. A. All together now: experimental multispecies biofilm model systems. Environ Microbiol. 19, 42–53 (2017).
67. Persson, F., Suarez, M., Hermansson, M., Plaza, E. & Wilén, B.-M. Community structure of partial nitritation-anammox biofilms at decreasing substrate concentrations and low temperature. Microb Biotechnol. 154, 267–273 (2016).
68. Callahan, B. J., McMurdie, P. J. & Holmes, S. P. Exact sequence variants should replace operational taxonomic units in marker-gene data analysis. ISME J. 11, 2639–2643 (2017).
69. Edgar, R. C. UNOISE2: improved error-correction for Illumina 16S and ITS amplicon sequencing. Preprint at, https://www.biorxiv.org/content/early/2016/10/15/081257 (2016).
70. McMurdie, P. J. & Holmes, S. phyloseq: An R Package for Reproducible Interactive Analysis and Graphics of Microbiome Census Data. PLoS ONE. 8, e61217 (2013).
71. vegan: Community Ecology Package (2018). 72. Love, M. I., Huber, W. & Anders, S. Moderated estimation of fold change and dispersion for RNA-seq data with DESeq2. Genome
Biol. 15, 550 (2014). 73. McMurdie, P. J. & Holmes, S. W. Not, Want Not: Why Rarefying Microbiome Data Is Inadmissible. PLoS Comput Biol. 10, e1003531
(2014). 74. Jost, L. Entropy and diversity. Oikos 113, 363–375 (2006). 75. Anderson, M. J. A new method for non-parametric multivariate analysis of variance. Austral. Ecol. 26, 32–46 (2001). 76. Miklós, I. & Podani, J. Randomization of presence‐absence matrices: comments and new algorithms. Ecology. 85, 86–92 (2004). 77. Gotelli, N. J. & McCabe, D. J. Species co-occurrence: a meta-analysis of j. M. Diamond’s assembly rules model. Ecology. 83,
2091–2096 (2002). 78. Stegen, J. C. et al. Quantifying community assembly processes and identifying features that impose them. ISME J. 7, 2069–2079
(2013).
AcknowledgementsWe thank Fred Sörensson for valuable discussions. The authors acknowledge the Genomics core facility at the University of Gothenburg, the Centre for Cellular Imaging at the University of Gothenburg and the National Microscopy Infrastructure, NMI (VR-RFI 2016-00968), for providing support and use of their equipment, and the colleagues at Veolia Water Technologies AB – AnoxKaldnes, Lund, Sweden, for monitoring the pilot reactor. This work was funded by the University of Gothenburg, FORMAS (Contract no, 245-2014-1528, 942-2015-683 and 2012-1433), the Foundations of Carl Trygger (CTS 12:374), Adlerbertska forskningsstiftelsen, Wilhelm & Martina Lundgrens Vetenskapsfond (2015-0317, 2015-0309) and the Swedish Water & Wastewater Association via the research cluster VA-teknik Södra.
Author ContributionsC.S., M.P., F.P. and M.H. designed the experiment. C.S. performed data analysis and confocal imaging. M.P. operated the reactor and did the activity tests. O.M. designed the DO model and processed the raw sequence reads. S.L contributed to the interpretation of the results. All authors contributed to the writing of the manuscript. All authors reviewed and approved the final manuscript.
Additional InformationSupplementary information accompanies this paper at https://doi.org/10.1038/s41598-019-41542-1.Competing Interests: The authors declare no competing interests.Publisher’s note: Springer Nature remains neutral with regard to jurisdictional claims in published maps and institutional affiliations.
Open Access This article is licensed under a Creative Commons Attribution 4.0 International License, which permits use, sharing, adaptation, distribution and reproduction in any medium or
format, as long as you give appropriate credit to the original author(s) and the source, provide a link to the Cre-ative Commons license, and indicate if changes were made. The images or other third party material in this article are included in the article’s Creative Commons license, unless indicated otherwise in a credit line to the material. If material is not included in the article’s Creative Commons license and your intended use is not per-mitted by statutory regulation or exceeds the permitted use, you will need to obtain permission directly from the copyright holder. To view a copy of this license, visit http://creativecommons.org/licenses/by/4.0/. © The Author(s) 2019


![REVIEW: Potential of Thermophile Inoculation and Substrate … · 2015. 4. 27. · Definably preparation of compost substrate determines the succession of microbial inoculation [14-16]](https://static.fdocuments.in/doc/165x107/61251958131a1c2ab80d976b/review-potential-of-thermophile-inoculation-and-substrate-2015-4-27-definably.jpg)


