Thickness Debit in Creep Properties of PWA 1484
8
THICKNESS DEBIT IN CREEP PROPERTIES OF PWA 1484 V. Seetharaman and A. D. Cetel Pratt & Whitney, 400 Main Street, East Hartford, CT 06108 Keywords: Single crystals, creep rupture, deformation constraints Abstract The effect of section thickness on the creep properties of a single crystal superalloy, PWA 1484 was investigated. For this purpose, a series of isothermal, constant load creep tests were conducted on uncoated sheet specimens in air at temperatures ranging from 760°C to 982°C and at stresses varying from 207 MPa to 758 MPa. The average time to reach 1% creep strain showed very weak dependence on specimen thickness at all test conditions. In contrast, the thickness debit associated with rupture life showed a complex dependence on test conditions. For example, creep rupture lives obtained at 760°C and 758 MPa decreased sharply (60%) with a reduction in specimen thickness from 3.18 mm to 0.38 mm. However, rupture lives of specimens tested at 871°C and 982°C exhibited a relatively modest dependence on specimen thickness. The results have been interpreted qualitatively in terms of the effect of plastic constraint on the deformation and fracture of ligaments between the interdendritic creep voids created during creep deformation. Introduction The effect of section thickness (thickness debit) on creep deformation and rupture properties of superalloy castings plays an important role in the design and durability analysis of turbine airfoils [1-10]. Past experience with conventionally cast (CC) superalloys suggests a substantial (~ five fold) reduction in the rupture life of thin wall castings compared with bulk castings. The magnitude of the thin wall debit is reduced in the directionally solidified, columnar-grain castings (CG) and is smallest for single crystal (SC) alloys. A qualitative comparison of the thickness debit in CC, CG, and SC alloys is provided in Figure 1 [1]. There are several possible explanations for the thickness debit observed in thin wall castings. They fall into the following categories: (1) Fracture : Intergranular creep fracture occurs in equiaxed alloys as a result of cavity nucleation, growth, and coalescence along grain boundaries. Under these conditions, the effect on load carrying capability is greater in material with fewer grains per unit cross-sectional area where each grain represents a large fraction of the cross section [4]. (2) Oxygen embrittlement : Stress-assisted diffusion of oxygen along the grain boundaries causes embrittlement (lowers rupture ductility and, in general, rupture life). This mechanism becomes very important for uncoated specimens with very low section thickness [7-9]. (3) Deformation : These include (a) a change in the degree of constraint on plastic deformation with a change in the section thickness and (b) change in the importance of deformation anisotropy with section thickness (fewer grains across the specimen thickness or diameter). While all three mechanisms may contribute to the thin wall debit in CC and CG alloys, the thickness debit in SC alloys is most likely caused by the differences in the deformation constraint and plastic anisotropy between thick and thin sections. Figure 1 Comparison of the thickness debit data for conventionally cast (CC), columnar-grain (CG) and single crystal (SC) alloys at 982°C [1]. In recent years, the importance of the thickness debit has increased dramatically. This is because of increasingly complex cooling passages in advanced turbine blades that, in turn, require a significant reduction in the casting wall thickness. Woodford [8] has recently shown that the creep strength of CMSX-4 alloy measured at 0.5 to 1% strain levels is unaffected by section thickness. However, the fracture resistance of the alloy evaluated from smooth or notched tensile tests was strongly dependent on the section thickness. Doner and Heckler [9,10] showed that the thickness debit in the stress rupture lives of uncoated CMSX-3 specimens was significant when the applied stress was below ~ 275 MPa (40 ksi). They also demonstrated that the rupture lives of coated specimens were essentially independent of section thickness suggesting that the observed thickness-debit was primarily due to environmental effects. In contrast, Soechting [11] reported a debit of 30-40% in creep rupture strength of coated PWA 1480 specimens when the section thickness was reduced from 1.52 mm (60 mils) to 0.25 mm (10 mils). Such conflicting results suggest that in spite of the large amount of research work on the creep properties of single crystal alloys, the nature and extent of thin wall debit are not well understood. 0 20 40 60 80 100 0.0 0.5 1.0 1.5 2.0 2.5 3.0 3.5 4.0 4.5 5.0 Specimen Thickness (mm) Thick Section Rupture Life (%) Conventionally cast (CC) Directionally Solidified Columnar-Grain (CG) Directionally Solidified Single Crystal (SC) T = 982 C 207 Superalloys 2004 Edited by K.A. Green, T.M. Pollock, H. Harada, TMS (The Minerals, Metals & Materials Society), 2004 T.E. Howson, R.C. Reed, J.J. Schirra, and S, Walston
Transcript of Thickness Debit in Creep Properties of PWA 1484

THICKNESS DEBIT IN CREEP PROPERTIES OF PWA 1484
V. Seetharaman and A. D. Cetel
Pratt & Whitney, 400 Main Street, East Hartford, CT 06108
Keywords: Single crystals, creep rupture, deformation constraints
Abstract
The effect of section thickness on the creep properties of a single
crystal superalloy, PWA 1484 was investigated. For this purpose,
a series of isothermal, constant load creep tests were conducted on
uncoated sheet specimens in air at temperatures ranging from
760°C to 982°C and at stresses varying from 207 MPa to 758
MPa. The average time to reach 1% creep strain showed very
weak dependence on specimen thickness at all test conditions. In
contrast, the thickness debit associated with rupture life showed a
complex dependence on test conditions. For example, creep
rupture lives obtained at 760°C and 758 MPa decreased sharply
(60%) with a reduction in specimen thickness from 3.18 mm to
0.38 mm. However, rupture lives of specimens tested at 871°C
and 982°C exhibited a relatively modest dependence on specimen
thickness. The results have been interpreted qualitatively in terms
of the effect of plastic constraint on the deformation and fracture
of ligaments between the interdendritic creep voids created during
creep deformation.
Introduction
The effect of section thickness (thickness debit) on creep
deformation and rupture properties of superalloy castings plays an
important role in the design and durability analysis of turbine
airfoils [1-10]. Past experience with conventionally cast (CC)
superalloys suggests a substantial (~ five fold) reduction in the
rupture life of thin wall castings compared with bulk castings. The
magnitude of the thin wall debit is reduced in the directionally
solidified, columnar-grain castings (CG) and is smallest for single
crystal (SC) alloys. A qualitative comparison of the thickness
debit in CC, CG, and SC alloys is provided in Figure 1 [1]. There
are several possible explanations for the thickness debit observed
in thin wall castings. They fall into the following categories:
(1) Fracture: Intergranular creep fracture occurs in equiaxed alloys
as a result of cavity nucleation, growth, and coalescence along
grain boundaries. Under these conditions, the effect on load
carrying capability is greater in material with fewer grains per unit
cross-sectional area where each grain represents a large fraction of
the cross section [4].
(2) Oxygen embrittlement: Stress-assisted diffusion of oxygen
along the grain boundaries causes embrittlement (lowers rupture
ductility and, in general, rupture life). This mechanism becomes
very important for uncoated specimens with very low section
thickness [7-9].
(3) Deformation: These include (a) a change in the degree of
constraint on plastic deformation with a change in the section
thickness and (b) change in the importance of deformation
anisotropy with section thickness (fewer grains across the
specimen thickness or diameter).
While all three mechanisms may contribute to the thin wall debit
in CC and CG alloys, the thickness debit in SC alloys is most
likely caused by the differences in the deformation constraint and
plastic anisotropy between thick and thin sections.
Figure 1 Comparison of the thickness debit data for
conventionally cast (CC), columnar-grain (CG) and
single crystal (SC) alloys at 982°C [1].
In recent years, the importance of the thickness debit has
increased dramatically. This is because of increasingly complex
cooling passages in advanced turbine blades that, in turn, require a
significant reduction in the casting wall thickness. Woodford [8]
has recently shown that the creep strength of CMSX-4 alloy
measured at 0.5 to 1% strain levels is unaffected by section
thickness. However, the fracture resistance of the alloy evaluated
from smooth or notched tensile tests was strongly dependent on
the section thickness. Doner and Heckler [9,10] showed that the
thickness debit in the stress rupture lives of uncoated CMSX-3
specimens was significant when the applied stress was below ~
275 MPa (40 ksi). They also demonstrated that the rupture lives of
coated specimens were essentially independent of section
thickness suggesting that the observed thickness-debit was
primarily due to environmental effects. In contrast, Soechting [11]
reported a debit of 30-40% in creep rupture strength of coated
PWA 1480 specimens when the section thickness was reduced
from 1.52 mm (60 mils) to 0.25 mm (10 mils). Such conflicting
results suggest that in spite of the large amount of research work
on the creep properties of single crystal alloys, the nature and
extent of thin wall debit are not well understood.
0
20
40
60
80
100
0.0 0.5 1.0 1.5 2.0 2.5 3.0 3.5 4.0 4.5 5.0
Specimen Thickness (mm)
Th
ick
Se
cti
on
Ru
ptu
re L
ife
(%
)
Conventionally cast (CC)
Directionally Solidified
Columnar-Grain (CG)
Directionally Solidified
Single Crystal (SC)
T = 982 C
207
Superalloys 2004Edited by K.A. Green, T.M. Pollock, H. Harada,
TMS (The Minerals, Metals & Materials Society), 2004T.E. Howson, R.C. Reed, J.J. Schirra, and S, Walston

The main objective of the current work was to establish the
magnitude of the thin wall debit in the creep rupture properties of
a second generation production single crystal alloy (PWA 1484).
Towards this objective, creep tests were performed on specimens
of PWA 1484 with varying section thicknesses, but identical
chemical composition, crystal orientation, and microstructure.
Because these specimens were machined from bulk single crystal
castings, it was possible to eliminate the influence of other
complicating factors such as variations in secondary dendrite arm
spacing, micro-segregation patterns, micro-shrinkage, and
porosity on the creep properties.
Figure 2 Microstructures of the fully heat treated PWA 1484
alloy showing coarse, blocky γ ′ precipitates as well as fine,
spherical γ ′ precipitates within γ channels.
Experimental Procedures
Rectangular bars (177.8 mm x 25.4 mm x 19.1 mm) of PWA 1484
[12,13] cast at Pratt & Whitney’s in-house Rapid Prototype
Casting Laboratory were used for this study. The nominal
chemical composition of the alloy (in weight percent) was Co
10.0%, Cr 5.0%, Al 5.6%, Ta 8.7%, W 6.0%, Mo 2.0%, Re 3.0%,
and Ni the balance. X-ray diffraction (Laue) analysis and macro-
etching were used to confirm that the bars were indeed single
crystals with primary orientation within 10° of [100] axis.
Because no seed crystals were used in the casting process, the bars
had nearly random secondary orientations. The bars were
subjected to a standard sequence of heat treatment cycles, viz.,
solution annealing at 1316°C (2400°F) for 2 hours in vacuum,
coating diffusion heat treatment at 1080°C (1975°F) for 4 hours in
a controlled atmosphere, and precipitation heat treatment at 704°C
(1300°F) for 24 hours in air. Figure 2 illustrates the typical
microstructures of the heat-treated bars. The microstructure
consisted of coarse, primary γ ′ precipitates (~ 0.45 µm) with a
blocky morphology, together with a distribution of fine (~ 30 nm),
spherical γ ′ precipitates within the narrow γ channels. These
observations are in general agreement with previous studies on
PWA 1484 [13].
Standard creep test specimens with cylindrical and rectangular
cross-sections were electro-discharge machined from the heat-
treated bars and ground to remove the recast layer. The thickness
of the sheet specimens was varied from 0.38 mm to 3.18 mm (15
mils to 125 mils). Moreover, the sheet specimens were machined
such that the orientation of the specimen width was within ± 2
degrees of <100> (Figure 3).
Figure 3 Schematic diagram of the sheet specimen used for creep
testing and its orientation in the cast single crystal bar.
All dimensions are in mm.
Isothermal, constant load creep tests were conducted on uncoated
specimens in air at four different conditions: 760°C/758MPa
(1400°F/110ksi), 871°C/413MPa (1600°F/60ksi), 982°C/207MPa
(1800°F/30ksi), and 982°C/248MPa (1800°F/36ksi). In addition,
baseline creep tests were performed on cylindrical specimens
(gage diameter = 3.18 mm) at 760°C/758MPa (1400°F/110 ksi)
and 982°C/248MPa (1800°F/36 ksi). Three specimens were tested
for each condition in order to insure a modicum of statistical
validity for the creep properties measured. Displacement vs. time
data logged during the creep tests were converted into creep strain
vs. time plots. Furthermore, creep data were analyzed in terms of
the primary strain (εp), the rupture strain (εr), the rupture life (tr),
as well as times required for attaining different strain values, e.g.,
1% (t1%). Microstructures and the fracture morphology of selected
specimens after rupture were characterized by optical microscopy
and scanning electron microscopy in order to understand and
rationalize the creep behavior of different specimens.
Results
Table I. Baseline creep data obtained from bulk specimens of
PWA 1484
T
(C)σ MPa
t1%
(hours)
tr
(hours)εr
(%)
760 758 1.8 729 16.4
982 248 102 218 26.6
Baseline creep data listed in Table I were obtained by testing
Growth Direction25.4
19.1
< 100 > < 001 >
t
0.381 ≤ t ≤ 3.175
Growth Direction25.425.4
19.1
< 100 >< 100 > < 001 >
< 001 >
t
0.381 ≤ t ≤ 3.175
208

cylindrical specimens at 760°C/758MPa (1400°F/110 ksi) and
982°C/248 MPa (1800°F/36 ksi). Typical creep curves
corresponding to these test conditions are shown in Figure 4.
These conditions represent two extremes of the deformation
behavior, i.e., the ratios of the applied stress to the yield strength
(σ/σy) for PWA 1484 at 760°C/758MPa (1400°F/110 ksi) and
982°C/248 MPa (1800°F/36 ksi) are 0.79 and 0.46, respectively.
Secondly, the creep curve obtained at 760°C/758MPa
(1400°F/110 ksi) exhibits a strong primary creep component:
Primary creep accounts for approximately 6% strain. In contrast,
primary creep is negligible in tests performed at 982°C/248 MPa
(1800°F/36 ksi). Furthermore, the former condition results in
steady state creep observed over much of the creep test and a
relatively short tertiary creep regime. On the other hand, creep
curves obtained at 982°C/248MPa (1800°F/36 ksi) show no
steady state creep at all; instead, the tertiary stage involving a
continuous increase in the creep rate represents the major portion
of the creep curve. It is important to note that the creep
deformation at 760°C (1400°F) is mainly controlled by thermally
activated cross slip of dislocation segments from octahedral-to-
cube planes, while the rate controlling mechanism for creep
deformation at 982°C (1800°F) is dislocation climb over γ ′precipitates [1, 5-7, 11-15].
Figure 4 Typical creep curves obtained from cylindrical
specimens tested at 760°C and 982°C.
Figure 5 Typical creep curves obtained from sheet specimens (t =
1.52 mm) tested at various test conditions from 760°C
to 982°C.
Figure 5 displays the creep curves obtained from 1.52 mm thick
sheet specimens tested at different conditions. A comparison of
these curves with those shown in Figure 4 suggests that the basic
nature of the creep curves is unaffected by the specimen
geometry. Figures 6 (a), (b), and (c) depict the influence of
specimen thickness on the creep curves obtained at
760°C/758MPa (1400°F/110ksi), 871°C/413MPa (1600°F/60ksi)
and 982°C/248MPa (1800°F/36ksi), respectively. It is clear that
the initial portions of the creep curves are very similar. Thereafter,
the curves corresponding to different thicknesses diverge
continuously until rupture.
(a)
(b)
(c)
Figure 6 Effect of specimen thickness on typical creep curves
from sheet specimens tested at (a) 760°C/758 MPa, (b)
871°C/413 MPa and (c) 982°C/248 MPa.
0
5
10
15
20
25
30
0 100 200 300 400 500 600 700 800
Time (hours)
Cre
ep
Str
ain
(%
)
982 C, 248 M Pa
760 C, 758 M Pa
Geometry: Round
Size: 3.18 m m dia.(σ /σy = 0.46)
(σ/σy = 0.79)
0
4
8
12
16
20
24
28
32
36
40
0 200 400 600 800 1000 1200
Time (hours)
Cre
ep
Str
ain
(%
)
t = 1.524 mm
982C, 248 MPa
982 C, 207 MPa 871C, 413 MPa
760 C, 758 MPa
0
5
10
15
20
25
0 100 200 300 400 500 600 700 800
Time (hours)
Cre
ep
Str
ain
(%
)
760 C/758 MPa
3.18 mm1.52 mm
0.76 mm
0.38 mm
0
5
10
15
20
25
30
0 200 400 600 800 1000 1200 1400 1600
Time (hours)
Cre
ep
Str
ain
(%
)
871 C, 413 MPa 3.18 mm1.52 mm
0.76 mm
0.38 mm
0
5
10
15
20
25
30
35
0 50 100 150 200 250 300
Time (hours)
Cre
ep
Str
ain
(%
)
982 C, 248 MPa
3.18 mm
1.52 mm
0.76 mm
209

Figure 7 Effect of specimen thickness on the time for 1% creep strain and the rupture life (a) 760°C/758 MPa, (b) 871°C/413 MPa, (c)
982°C/207 MPa, and (d) 982°C/248 MPa.
Figures 7(a)-(d) show the variation in time to reach 1% creep
strain as well as rupture life as functions of the specimen
thickness for different test conditions. It is important to note that
the figures include data obtained from multiple tests conducted at
each condition. The overall scatter in the rupture life data
increased with a decrease in specimen thickness. Two important
inferences can be drawn from the figures: (a) The time to 1%
creep strain shows a weak dependence on specimen thickness for
all test conditions and (b) the magnitude of the thickness debit on
rupture life is a strong function of the test condition. For example,
the influence of thickness on rupture life is fairly strong for tests
conducted at 760°C/758MPa (1400°F/110ksi) and 871°C/413MPa
(1600°F/60 ksi). The effect is weak-to-moderate for creep tests
performed at 982°C/207MPa (1800°F/30ksi) and at 982°C/
248MPa (1800°F/36ksi). These observations can be interpreted as
follows:
• Specimen thickness exerts a minimal influence on the
mechanisms and the kinetics of plastic deformation at small
strains (until the onset of cavitation or cracking). Thereafter, the
degree of plastic constraint in the ligament between cavities is
strongly influenced by the specimen thickness and leads to the
observed thickness debit in the rupture life.
• Rupture life at intermediate temperatures, 704°C - 815°C
(1300°F -1500°F) is very sensitive to small differences in crystal
orientation and microstructure. In contrast, creep deformation at
high temperatures (≥871°C) occurs by dislocation motion in
multiple slip systems and is controlled by dislocation climb.
Accordingly, the rupture life at high temperatures is much less
sensitive to small deviations in the crystal orientation [14-18].
These differences in the fundamental deformation mechanisms
may, in part, account for the observed thickness debit dependence
on test temperature.
Figures 8 (a) and (b) compare the typical microstructures of the
through-thickness (longitudinal) sections of specimens with
thicknesses equal to 3.18 mm and 1.52 mm, respectively. Both
micrographs were recorded at locations close to the fracture zone.
Cavities and cracks formed in the interdendritic regions and
oriented normal to the loading direction are clearly discernible.
Because interdendritic regions are relatively weak as a result of
having slightly coarser γ ′ microstructure than the dendrite cores,
they serve as preferred sites for cavity initiation.
-100
0
100
200
300
400
500
600
700
800
0.0 0.5 1.0 1.5 2.0 2.5 3.0 3.5
Thickness (mm)
Tim
e (
ho
urs
)
Rupture Life
Time to 1%
Poly. (Rupture Life)
Linear (Time to 1%)
(a)
0
50
100
150
200
250
300
350
400
0.0 0.5 1.0 1.5 2.0 2.5 3.0 3.5
Thickness (mm)
Tim
e (
ho
urs
)
Rupture Life
Time to 1%
Poly. (Rupture Life)
Poly. (Time to 1%)
(d)
0
200
400
600
800
1000
1200
1400
1600
1800
2000
0.0 0.5 1.0 1.5 2.0 2.5 3.0 3.5
Thickness (mm)
Tim
e (
ho
urs
)
Rupture Life
Time to 1%
Power (Rupture Life)
Power (Time to 1%)
(b)
0
100
200
300
400
500
600
700
800
900
1000
0.0 0.5 1.0 1.5 2.0 2.5 3.0 3.5
Thickness (mm)
Tim
e (
ho
urs
)
Rupture Life
Time to 1%
Power (Rupture Life)
Power (Time to 1%)
(c)
210

Figure 8 Longitudinal microstructures of specimens tested at
982°C/248 MPa (Loading direction is horizontal)
(a) t = 3.18 mm and (b) t = 1.52 mm.
Fracture surfaces obtained at low temperatures contain numerous
crystallographic facets indicative of planar, inhomogeneous
plastic deformation. Because the deformation process becomes
much more homogeneous at high test temperatures, the
crystallographic facets become less pronounced (Figure 9). The
fracture morphology shown in Figure 9 is found to be typical and
independent of specimen thickness or geometry.
Figure 10 compares the microstructures of the shoulder region
(strain ≈ 0 %) and the fracture zone (strain ≈ 36 %) from a
specimen creep tested at 982°C/248MPa (1800°F/36 ksi). It is
clear that the γ ′ microstructure of the deformed zone has
undergone extensive rafting in the direction normal to the tensile
axis. This finding is consistent with other observations on
superalloys characterized by a small negative misfit between the
lattices of γ and γ ′. Because of long thermal exposure at 982°C
(1800°F), the γ ′ precipitates in the shoulder zone have coarsened
substantially (average size of primary, blocky γ ′∼ 0.7µm),
without any concomitant change in the precipitate morphology.
Neither rafting nor coarsening of γ ′ was detected in specimens
tested at 760°C or 871°C.
Figure 9 Fracture morphologies of specimens with Φ = 3.18 mm
and t = 1.52 mm tested at 982°C/248 MPa (1800°F/36
ksi).
Discussion
Figures 11 (a) and (b) summarize the salient results of the current
work in the form of the effect of specimen thickness on the
average time to 1% strain and the average rupture life,
respectively. Since the effect of section thickness on time to 1%
strain is minimal, it requires no further discussion. The thickness
debit on rupture life can be understood better if the data are
normalized with respect to the rupture lives of the bulk material.
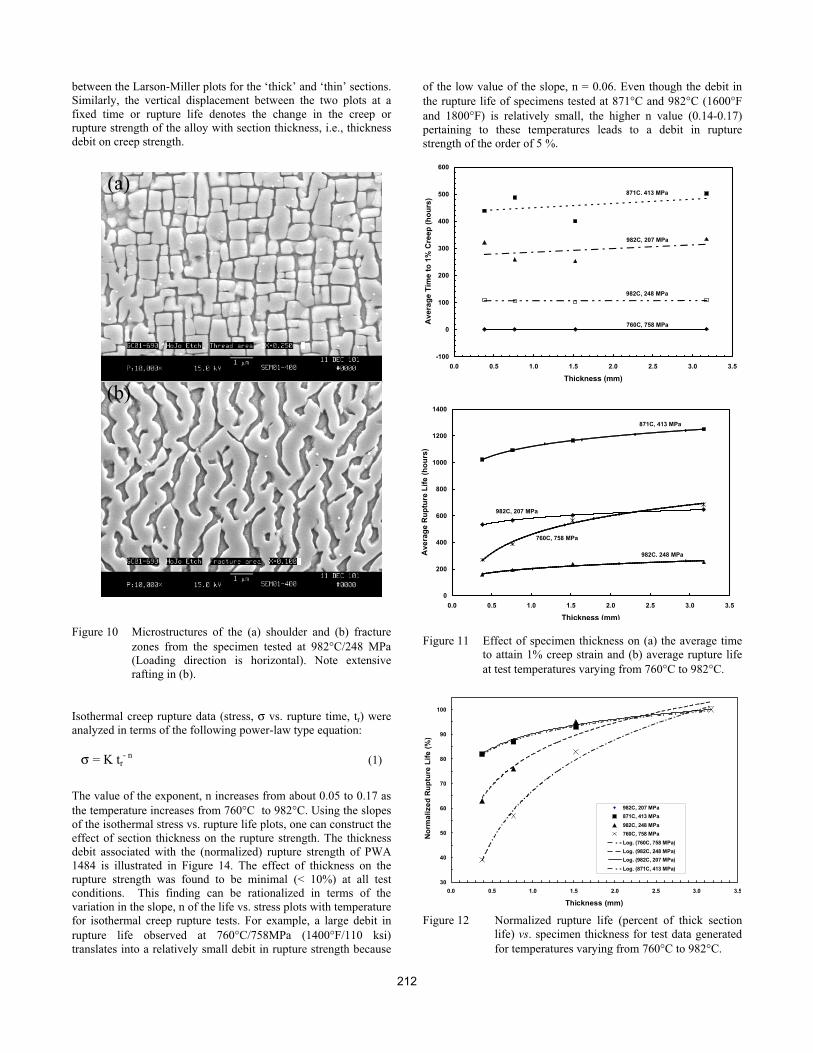
Figure 12 illustrates the variation in the normalized rupture life
for different test conditions. The maximum value of the thickness
debit (~ 60%) is observed at 760°C/758MPa (1400°F/110 ksi). In
contrast, the rupture lives at 871°C and 982°C (1600°F and
1800°F) exhibit a modest dependence on specimen thickness.
While the information shown in Figure 12 is very useful from a
scientific viewpoint, it cannot be used directly in the design of
airfoils. Instead, it is necessary to plot the thickness debit in terms
of rupture strength rather than rupture life. The relationship
between the debits on rupture strength and rupture life can be
understood with the aid of the schematic diagram shown in Figure
13. At any given temperature and stress, the debit in rupture life
can be represented in terms of the horizontal displacements
(a)
(b)
(a)
(b)
0.5 mm
1 mm
(b)
(a)
211
between the Larson-Miller plots for the ‘thick’ and ‘thin’ sections.
Similarly, the vertical displacement between the two plots at a
fixed time or rupture life denotes the change in the creep or
rupture strength of the alloy with section thickness, i.e., thickness
debit on creep strength.
Figure 10 Microstructures of the (a) shoulder and (b) fracture
zones from the specimen tested at 982°C/248 MPa
(Loading direction is horizontal). Note extensive
rafting in (b).
Isothermal creep rupture data (stress, σ vs. rupture time, tr) were
analyzed in terms of the following power-law type equation:
σ = K tr- n
(1)
The value of the exponent, n increases from about 0.05 to 0.17 as
the temperature increases from 760°C to 982°C. Using the slopes
of the isothermal stress vs. rupture life plots, one can construct the
effect of section thickness on the rupture strength. The thickness
debit associated with the (normalized) rupture strength of PWA
1484 is illustrated in Figure 14. The effect of thickness on the
rupture strength was found to be minimal (< 10%) at all test
conditions. This finding can be rationalized in terms of the
variation in the slope, n of the life vs. stress plots with temperature
for isothermal creep rupture tests. For example, a large debit in
rupture life observed at 760°C/758MPa (1400°F/110 ksi)
translates into a relatively small debit in rupture strength because
of the low value of the slope, n = 0.06. Even though the debit in
the rupture life of specimens tested at 871°C and 982°C (1600°F
and 1800°F) is relatively small, the higher n value (0.14-0.17)
pertaining to these temperatures leads to a debit in rupture
strength of the order of 5 %.
Figure 11 Effect of specimen thickness on (a) the average time
to attain 1% creep strain and (b) average rupture life
at test temperatures varying from 760°C to 982°C.
Figure 12 Normalized rupture life (percent of thick section
life) vs. specimen thickness for test data generated
for temperatures varying from 760°C to 982°C.
(a)
(b)
(a)
(b)
(a)
(b)
-100
0
100
200
300
400
500
600
0.0 0.5 1.0 1.5 2.0 2.5 3.0 3.5
Thickness (mm)
Av
era
ge
Tim
e t
o 1
% C
ree
p (
ho
urs
)
871C, 413 MPa
982C, 207 MPa
760C, 758 MPa
982C, 248 MPa
0
200
400
600
800
1000
1200
1400
0.0 0.5 1.0 1.5 2.0 2.5 3.0 3.5
Thickness (mm)
Av
era
ge
Ru
ptu
re L
ife
(h
ou
rs)
871C, 413 MPa
982C, 248 MPa
982C, 207 MPa
760C, 758 MPa
30
40
50
60
70
80
90
100
0.0 0.5 1.0 1.5 2.0 2.5 3.0 3.5
Thickness (mm)
No
rma
lize
d R
up
ture
Lif
e (
%)
982C, 207 MPa
871C, 413 MPa
982C, 248 MPa
760C, 758 MPa
Log. (760C, 758 MPa)
Log. (982C, 248 MPa)
Log. (982C, 207 MPa)
Log. (871C, 413 MPa)
212
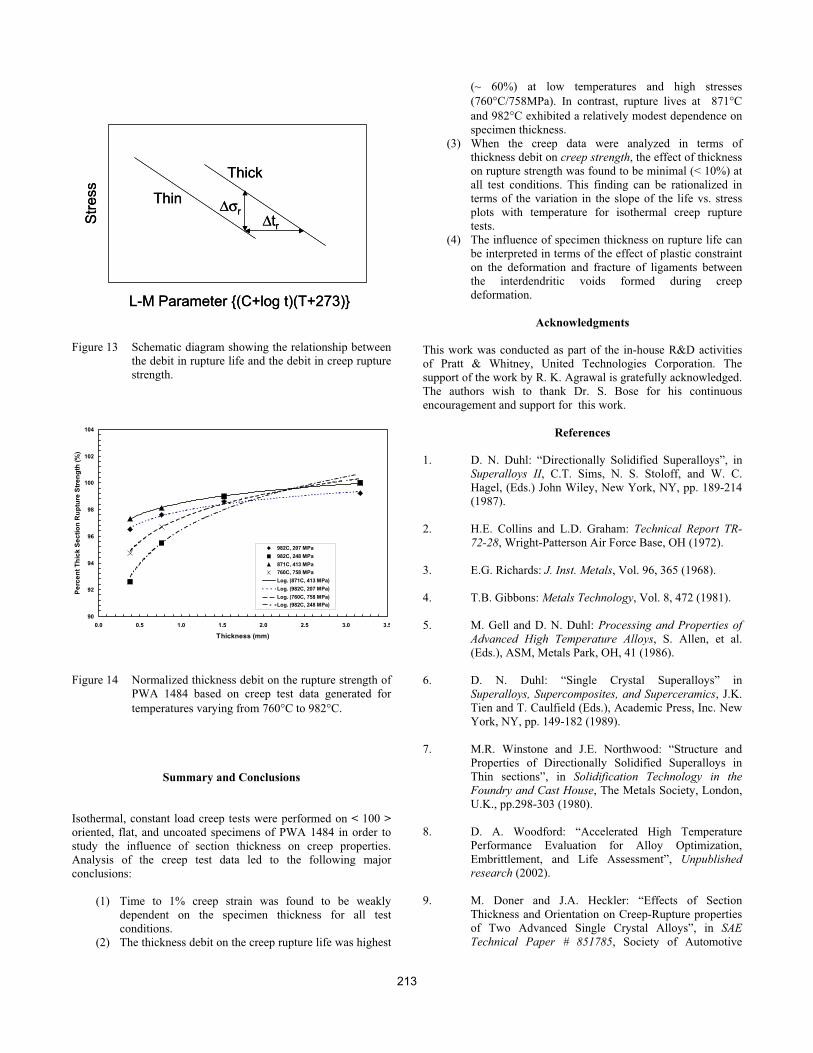
Figure 13 Schematic diagram showing the relationship between
the debit in rupture life and the debit in creep rupture
strength.
Figure 14 Normalized thickness debit on the rupture strength of
PWA 1484 based on creep test data generated for
temperatures varying from 760°C to 982°C.
Summary and Conclusions
Isothermal, constant load creep tests were performed on < 100 >
oriented, flat, and uncoated specimens of PWA 1484 in order to
study the influence of section thickness on creep properties.
Analysis of the creep test data led to the following major
conclusions:
(1) Time to 1% creep strain was found to be weakly
dependent on the specimen thickness for all test
conditions.
(2) The thickness debit on the creep rupture life was highest
(~ 60%) at low temperatures and high stresses
(760°C/758MPa). In contrast, rupture lives at 871°C
and 982°C exhibited a relatively modest dependence on
specimen thickness.
(3) When the creep data were analyzed in terms of
thickness debit on creep strength, the effect of thickness
on rupture strength was found to be minimal (< 10%) at
all test conditions. This finding can be rationalized in
terms of the variation in the slope of the life vs. stress
plots with temperature for isothermal creep rupture
tests.
(4) The influence of specimen thickness on rupture life can
be interpreted in terms of the effect of plastic constraint
on the deformation and fracture of ligaments between
the interdendritic voids formed during creep
deformation.
Acknowledgments
This work was conducted as part of the in-house R&D activities
of Pratt & Whitney, United Technologies Corporation. The
support of the work by R. K. Agrawal is gratefully acknowledged.
The authors wish to thank Dr. S. Bose for his continuous
encouragement and support for this work.
References
1. D. N. Duhl: “Directionally Solidified Superalloys”, in
Superalloys II, C.T. Sims, N. S. Stoloff, and W. C.
Hagel, (Eds.) John Wiley, New York, NY, pp. 189-214
(1987).
2. H.E. Collins and L.D. Graham: Technical Report TR-
72-28, Wright-Patterson Air Force Base, OH (1972).
3. E.G. Richards: J. Inst. Metals, Vol. 96, 365 (1968).
4. T.B. Gibbons: Metals Technology, Vol. 8, 472 (1981).
5. M. Gell and D. N. Duhl: Processing and Properties of
Advanced High Temperature Alloys, S. Allen, et al.
(Eds.), ASM, Metals Park, OH, 41 (1986).
6. D. N. Duhl: “Single Crystal Superalloys” in
Superalloys, Supercomposites, and Superceramics, J.K.
Tien and T. Caulfield (Eds.), Academic Press, Inc. New
York, NY, pp. 149-182 (1989).
7. M.R. Winstone and J.E. Northwood: “Structure and
Properties of Directionally Solidified Superalloys in
Thin sections”, in Solidification Technology in the
Foundry and Cast House, The Metals Society, London,
U.K., pp.298-303 (1980).
8. D. A. Woodford: “Accelerated High Temperature
Performance Evaluation for Alloy Optimization,
Embrittlement, and Life Assessment”, Unpublished
research (2002).
9. M. Doner and J.A. Heckler: “Effects of Section
Thickness and Orientation on Creep-Rupture properties
of Two Advanced Single Crystal Alloys”, in SAE
Technical Paper # 851785, Society of Automotive
L-M Parameter {(C+log t)(T+273)}
Str
ess
∆tr
∆σr
Thick
Thin
L-M Parameter {(C+log t)(T+273)}
Str
ess
∆tr
∆σr
Thick
Thin
90
92
94
96
98
100
102
104
0.0 0.5 1.0 1.5 2.0 2.5 3.0 3.5
Thickness (mm)
Pe
rce
nt
Th
ick
Se
cti
on
Ru
ptu
re S
tre
ng
th (
%)
982C, 207 MPa
982C, 248 MPa
871C, 413 MPa
760C, 758 MPa
Log. (871C, 413 MPa)
Log. (982C, 207 MPa)
Log. (760C, 758 MPa)
Log. (982C, 248 MPa)
213

Engineers, Inc. (1985).
10. M. Doner and J.A. Heckler: “Identification of
Mechanisms responsible for Degradation in Thin-wall
Stress Rupture Properties”, Superalloys 1988,
Proceedings of the 6th International Symposium on
Superalloys, The Metallurgical Society, Warrendale,
PA, pp.653-662, 1988.
11. F.O. Soechting: Pratt & Whitney, East Hartford, CT,
Unpublished work, 1982.
12. D. N. Duhl and A.D. Cetel: “Advanced High Strength
Single Crystal Superalloy Compositions”, U.S. Patent
4719080, January 12, 1988.
13. A.D. Cetel and D. N. Duhl: “Second Generation Nickel-
Base Single Crystal Superalloy”, Superalloys 1988,
Proceedings of the 6th International Symposium on
Superalloys, The Metallurgical Society, Warrendale,
PA, pp.235-244, 1988.
14. R. N. Ghosh, R.V. Curtis, and M. McLean: “Creep
Deformation of Single Crystal Superalloys - Modeling
the Crystallographic Anisotropy”, Acta Met. Mater.,
Vol. 38, 1977 (1990).
15. L.-M. Pan, B.A. Shollock, and M. McLean: “Modeling
of the High Temperature Mechanical Behavior of a
Single-Crystal Superalloy”, Proc. Royal Soc. London A,
Vol. 453, pp. 1689-1715 (1997).
16. C.M.F. Rae, N. Matan, D.C. Cox, M.A. Rist, and R.C.
Reed: “On the Primary Creep of CMSX-4 Superalloy
Single Crystal”, Metall. Mater. Trans. A, Vol. 31A, pp.
2219-2228 (2000).
17. D. W. MacLachlan, L.W. Wright, S.S.K. Gunturi, and
D.M. Knowles: “Modeling the Anisotropic and Biaxial
Creep Behavior of Ni-Base Single Crystal Superalloys
CMSX-4 and SRR99 at 1223 K”, Superalloys 2000,
Eds. T. M. Pollock, et al., TMS, Warrendale, PA, pp.
357-366 (2000).
18. D. W. MacLachlan and D.M. Knowles: “Creep
Behavior Modeling of the Single-Crystal Superalloy
CMSX-4”, Metall. Mater. Trans. A, Vol. 31A, pp. 1401-
1411 (2000).
214