THG microscopy: contrast mechanism - RESEAU...
9
Nonlinear microscopy 1 • Introduction • Wide-field and confocal (3D) microscopy • 2PEF microscopy • Applications: neurosciences, embryology • Imaging depth in scattering media • SHG microscopy • Endogenous bio SHG/2PEF contrast Emmanuel Beaurepaire Lab. for optics and biosciences - Ecole Polytechnique - Palaiseau www.lob.polytechnique.fr Impulsions femtosecondes: des concepts fondamentaux aux applications - Les Houches Janv 2009 Contributions: D Débarre, N Olivier, W Supatto, MC Schanne-Klein, JL Martin, M Joffre, M Strupler, T Boulesteix, AM Pena, G Labroille, R S.Pillai, C Boudoux, J Ogilvie, E Farge, N Desprat, PA Pouille, B Moulia, N Peyriéras, L Duloquin, PL Tharaux, B Crestani , R Legouis, T Tordjmann, L Combettes, S Charpak, L Moreaux, J Mertz Nonlinear microscopy 2 • THG microscopy • CARS microscopy • Epidetection of coherent signals • Microscopy with shaped broadband pulses • Coherent microscopy with shaped beams • 3D microdissection with fs pulses THG microscopy – mechanisms of contrast THG microscopy = relatively recent approach First demonstrations : Barad, Eisenberg, Horowitz, Silberberg. Appl. Phys. Lett. 70, 922 (1997) Müller, Squier, Wilson, Brakenhoff. J. Microsc. 191, 266 (1998) • characterized by χ (3) (-3ω; ω,ω,ω) • may be obtained from any medium Non-linear scattering (coherent) THG 400 600 800 1000 1200 (nm) THG Excitation (~1200 nm) Excitation TH signal buildup along z-axis Intensity near focus −π (Gouy shift) 0 Phase near focus No signal from a homogeneous medium (normally dispersive) (destructive interference between TH from the beginning and the end of the focal volume) Signal ∝ (Δχ (3) ) 2 at interface between 2 “different” bulk media. THG microscopy: contrast mechanism “coherence length” for theTHG Excitation volume THG χ (3) ( medium 2) χ (3) (medium 1) Signal depends on sample structure AND on focal field distribution Ward & New (1969); Boyd (2003) Barad et al (1997) App Phys Lett Using paraxial Gaussian beam model: ( )( ) 2 0 3 2 / 3 kw Z b n n c k R = = − = Δ ω ω ω z →∞ Constructive interference is possible only if sample is heterogeneous within the focal volume No signal from a homogeneous medium (Effect of Gouy phase + dispersion) 0.5 1.0 1.5 2.0 2.5 3.0 0.0 0.2 0.4 0.6 0.8 1.0 THG power (normalized) Bead diameter (μm) δ z = 2.0 μm Bead diameter (μm) 0.5 1.0 1.5 2.0 2.5 3.0 0.0 0.2 0.4 0.6 0.8 1.0 THG power (normalized) Experiment Theory ∝Ø 6 Débarre et al Opt. Lett. 30, 2134 (2005) Phase matching 0.6 μm bead 3.0 μm bead Detects: interfaces, inclusions Acts as a band-pass filter on sample spatial frequencies THG microscopy: contrast mechanism Signal at the center of a spherical object
Transcript of THG microscopy: contrast mechanism - RESEAU...

Nonlinear microscopy 1
• Introduction• Wide-field and confocal (3D) microscopy• 2PEF microscopy• Applications: neurosciences, embryology• Imaging depth in scattering media• SHG microscopy• Endogenous bio SHG/2PEF contrast
Emmanuel BeaurepaireLab. for optics and biosciences - Ecole Polytechnique - Palaiseau
www.lob.polytechnique.fr
Impulsions femtosecondes: des concepts fondamentaux aux applications - Les Houches Janv 2009
Contributions: D Débarre, N Olivier, W Supatto, MC Schanne-Klein, JL Martin, M Joffre, M Strupler, T Boulesteix, AM Pena, G Labroille, R S.Pillai, C Boudoux, J Ogilvie, E Farge, N Desprat, PA Pouille, B Moulia, N Peyriéras, L Duloquin, PL Tharaux, B
Crestani , R Legouis, T Tordjmann, L Combettes, S Charpak, L Moreaux, J Mertz
Nonlinear microscopy 2
• THG microscopy• CARS microscopy• Epidetection of coherent signals• Microscopy with shaped broadband pulses • Coherent microscopy with shaped beams• 3D microdissection with fs pulses
THG microscopy – mechanisms of contrast
THG microscopy = relatively recent approach
First demonstrations : Barad, Eisenberg, Horowitz, Silberberg. Appl. Phys. Lett. 70, 922 (1997)
Müller, Squier, Wilson, Brakenhoff. J. Microsc. 191, 266 (1998)
• characterized by χ(3)(-3ω; ω,ω,ω)• may be obtained from any medium
Non-linear scattering (coherent)
THG
400 600 800 1000 1200 (nm)
THG
Exci
tatio
n(~
1200
nm
)
Excitation
TH signal buildup along z-axis
Intensity near focus
−π (Gouy shift)
0Phase near focus
No signal from a homogeneous medium (normally dispersive) (destructive interference between TH from the beginning and the end of the focal volume)
Signal ∝ (Δχ(3) )2 at interface between 2 “different” bulk media.
THG microscopy: contrast mechanism
“coherence length” for theTHG
Excitation volume
THG
χ(3)(medium 2)
χ(3)(medium 1)
Signal depends on sample structure AND on focal field
distribution
Ward & New (1969); Boyd (2003) Barad et al (1997) App Phys Lett
Using paraxial Gaussian beam model:
( )( )2
0
32
/3kwZb
nnckR ==
−=Δ ωωω z →∞
Constructive interference is possible only if sample is heterogeneous within the focal volume
No signal from a homogeneous medium(Effect of Gouy phase + dispersion)
0.5 1.0 1.5 2.0 2.5 3.00.0
0.2
0.4
0.6
0.8
1.0
THG
pow
er (n
orm
aliz
ed)
Bead diameter (µm)
δz= 2.0 µm
Bead diameter (µm)0.5 1.0 1.5 2.0 2.5 3.0
0.0
0.2
0.4
0.6
0.8
1.0
THG
pow
er (n
orm
aliz
ed)Experiment Theory
∝Ø6
Déb
arre
et a
lOpt
. Let
t. 30
, 213
4 (2
005)
Pha
se m
atch
ing
0.6 µm bead 3.0 µm bead
Detects: interfaces, inclusions
Acts as a band-pass filter on sample spatial frequencies
THG microscopy: contrast mechanism
Signal at the center of a spherical object

CfD
ébar
re e
t al
Opt
. Let
t. 25
, 288
1 (2
004)
Tota
l dur
atio
n~
80 m
in
2s/image, 30s between imgsλ=1180nm
THG: Structural imaging of a developing embryo+ quantification of morphogenetic movements
2PEF THG
2PEF+THG
15µm
Polytechnique CNRS INSERM
Glass Glass
Liquid
Measuring nonlinear susceptibilities χ(3) of liquids
Confocal parameter b~300µm
Liquid sample
thickness (µm)
150
80
10
z (µm)050
-50
0
1
Lateral cell displacement
z
Period ∝ (λ/3)(nω-n3ω)liquid
Here: Maker fringes measurementCf Kajzar & Messier, Rev. Sci. Instr. (1987)
[+] Accurate[-] Less control over sample state
THG ratio method (Cf Barille et al, PRE 2002)[+] Fast[+] Control over sample state (oxygenation…)[-] Prone to artifacts (spherical aberration, surface defects)
Amplitude ∝ (α(glass)- α(liquid))α ≈ χ(3) / n3ω(n3ω -nω)
Déb
arre
& Be
aure
paire
Bio
phys
J. 9
2, 6
03 (2
007)
Cells and tissues are mostly made of water→ THG contrast comes from structures with optical properties (χ(3), dispersion, n) very different
from water.
Weak signal at the interface between 2 aqueous structures
A lipid inclusion inside an aqueous environment (cytoplasm) is an efficient contrast source
1.0 ×10-41.69 ± 0.12polypeptidetriglycine 1M
lipids
lipids
protein
Amino acid
sugar
ions
-
2.2 ×10-21.83 ± 0.08glucose 1M
4.9 ×10-31.75 ± 0.13BSA 1mM
1.0 ×10-41.69 ± 0.13glycine 1M
2.71 ± 0.5
2.58 ± 0.5
1.79 ± 0.09
1.68 ± 0.08
χ(3)
(×10-22m2 V-2)
1.06
0.81
1.2 ×10⁻²
0
| χ(3) − χ(3)water |2
NaCl 1M
oil
triglycerides
water
λ=1180nm
Optical properties of biological liquids
Biop
hys
J. 9
2, 6
03 (2
007)
glycerolwater
Epithelial cell
But: THG is less specific than labeling or spectroscopic techniquesOther contrast sources: - dense mineralized structures; - absorbing structures; - interface between cell and extracell. space
Contrast can depend on mounting medium
Lipid droplets as THG sources
Lipid droplets are efficient THG source in many cells and tissues
10 µm
hepatocytes
(P=9
0mW
, NA
=0.8
, 250
fs, 7
6MH
z)
0 1 0 2 0 3 00
1 0
2 0
THG
sign
al (a
.u.)
P o s itio n (µ m )
Déb
arre
et a
l, N
at. M
etho
ds 3
, 47
(200
6)
Biophys J. 92, 603 (2007)
Poly
tech
niqu
e C
NR
S IN
SER
M
Poly
tech
niqu
e C
NR
S IN
SER
M
50 µm
50 µm
2PEF (700/860 nm): elastin, NADH, flavins, vit-A…
THG (1180 nm): lipid bodies air bubbles
SHG (1180 nm):collagen
fibers
Multimodal imaging of intact tissueFresh mouse lung tissue
Excitation
400 600 800 1000 1200
2PEFSHG
(nm)
ExcitationSHGTHG
400 600 800 1000 1200(nm)
Polytechnique CNRS INSERM
Nat. Methods 3, 47 (2006)
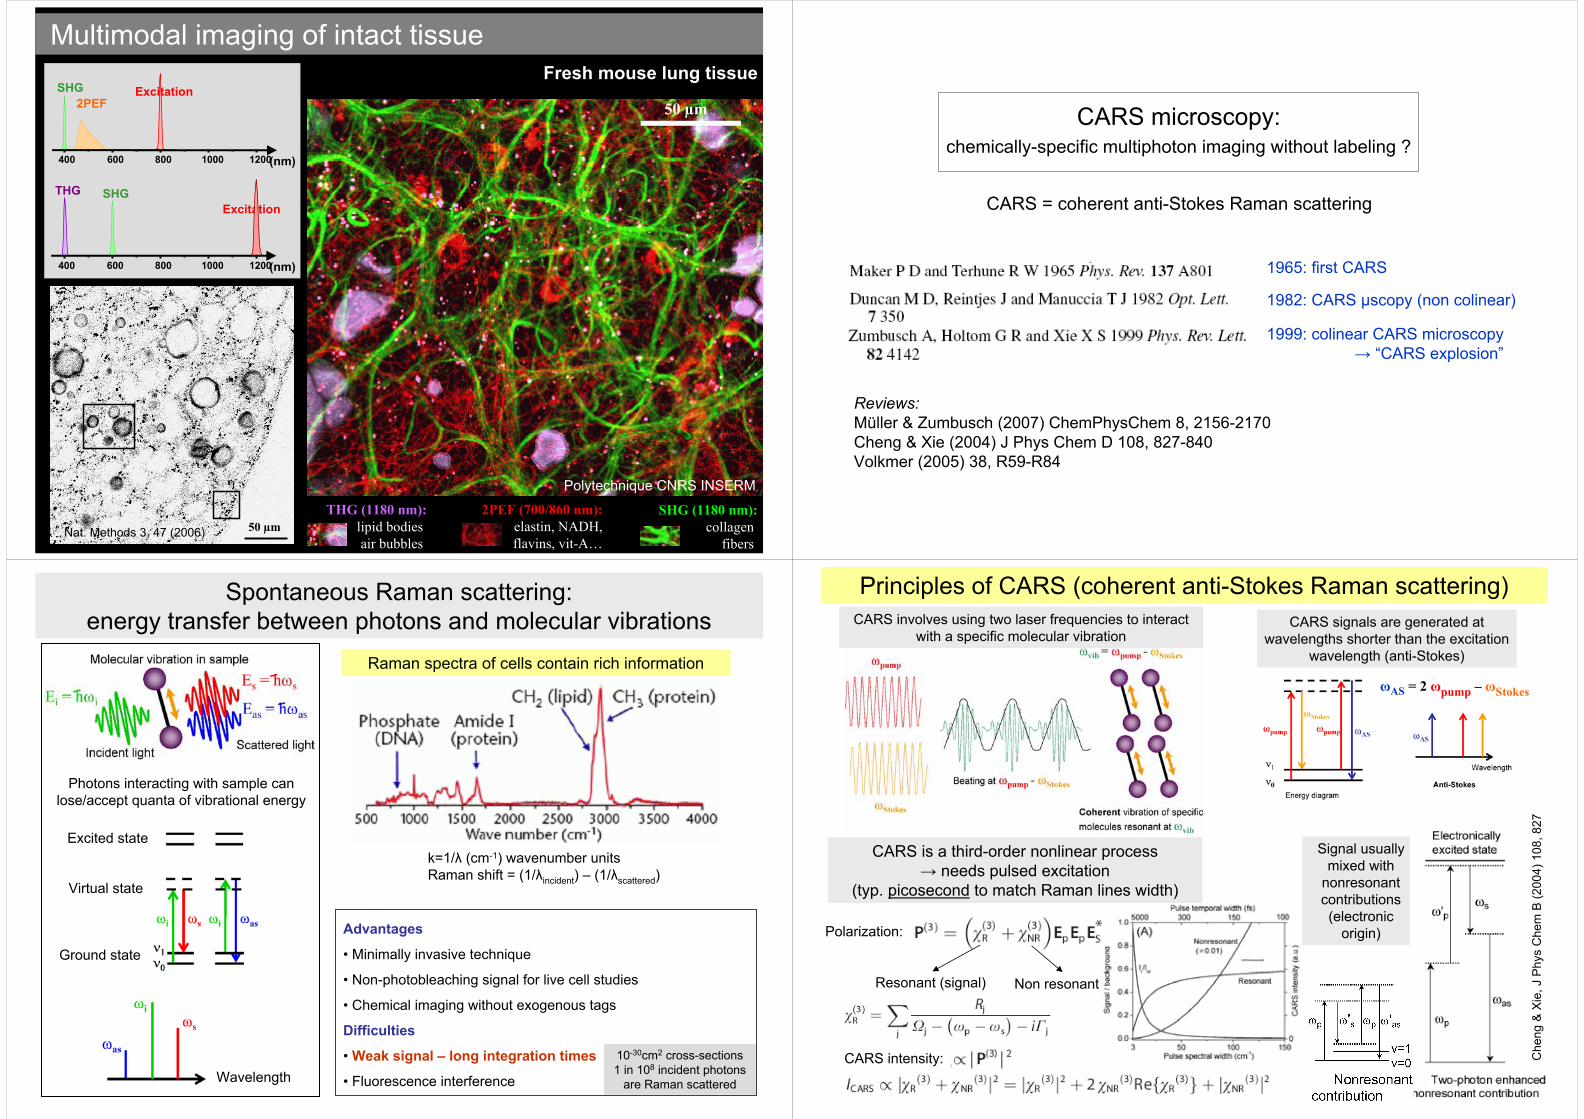
CARS microscopy:chemically-specific multiphoton imaging without labeling ?
CARS = coherent anti-Stokes Raman scattering
1965: first CARS
1982: CARS µscopy (non colinear)
1999: colinear CARS microscopy→ “CARS explosion”
Reviews:Müller & Zumbusch (2007) ChemPhysChem 8, 2156-2170Cheng & Xie (2004) J Phys Chem D 108, 827-840Volkmer (2005) 38, R59-R84
Excited state
Virtual state
Ground state
Wavelength
Spontaneous Raman scattering: energy transfer between photons and molecular vibrations
Raman spectra of cells contain rich information
k=1/λ (cm-1) wavenumber unitsRaman shift = (1/λincident) – (1/λscattered)
Advantages
• Minimally invasive technique
• Non-photobleaching signal for live cell studies
• Chemical imaging without exogenous tags
Difficulties
• Weak signal – long integration times
• Fluorescence interference
10-30cm2 cross-sections1 in 108 incident photons
are Raman scattered
Photons interacting with sample canlose/accept quanta of vibrational energy
CARS involves using two laser frequencies to interact with a specific molecular vibration
CARS signals are generated at wavelengths shorter than the excitation
wavelength (anti-Stokes)
Principles of CARS (coherent anti-Stokes Raman scattering)
CARS is a third-order nonlinear process → needs pulsed excitation
(typ. picosecond to match Raman lines width)
Signal usually mixed with
nonresonantcontributions (electronic
origin)Polarization:
CARS intensity:
Resonant (signal) Non resonant
ωAS = 2 ωpump – ωStokes
Che
ng &
Xie
, J P
hys
Che
mB
(200
4) 1
08, 8
27

Advantages of CARS imaging• Chemical specificity without staining (like spontaneous Raman imaging)
• Nonlinear: intrinsic 3D resolution, appropriate for tissue imaging
• Coherent signal buildup → strong signal if the density of oscillators is large enough
• Signal shifted to lower wavelengths → not polluted by fluorescence
(but presence of non-specific CARS background)
Coherence-enhanced signal (∝ N2)
A single DPPC bilayer contains 6×10⁶ CH2 groups in a 0.25µm2 area
Current limitations:• Sensibility ~106 oscillators• Residual unspecific background
(∝ N2)
(∝ N)
Ex: long-term imaging of lipid droplets
Nan
, Che
ng a
nd X
ie, J
. Lip
. Res
. 200
3
3T3-L1 cell culture with induction medium.
CH2 stretching freq. 2845 cm-1
Evans et al, PNAS 2005
Visualization of chromosomes
Che
ng, J
ia, Z
heng
& X
ie, B
ioph
ys. J
. 200
2
PO2- stretching frequency. (1090 cm-1)
CARS – Examples of applicationsin vivo imaging of
lipids
Stratum corneum
Adipocytes of the dermis
Adipocytes of subcutaneous
layer
Other possible applications: hydratation measurements, changes in packing or
nature of molecules in organelles, spectroscopic imaging…
(Sunney Xie group @ Harvard)
Directionality THG, SHG and CARS emission is mainly forward-directed
d
d = 1nm d = 100nm d = 10nm d = 150nm d = 50nm d = 200nm
P
d
laser
Bac
kwar
d Forward
Normalized emission diagrams(slab / sphere)
For small dielectric objects (<80nm for THG), emission
becomes isotropic
0.0 0.5 1.0 1.5 2.0 2.5 3.0 3.50.0
2.0x10⁻³
4.0x10⁻³
6.0x10⁻³
8.0x10⁻³
0.0
0.2
0.4
0.6
d
Slab thickness (µm)
B-T
HG
F-TH
G
…but vanishingly small(e.g. d6 dependence for spheres)
Distance of constructive interference:
λ / 4n>λCARS
λ / 8n>λSHG
λ / 12n0.7 λTHG
BackwardForward
Distance of constructive interference in the backward direction is small due to the large wave-vector mismatch.
and: signal ~ (emitters)2
Déb
arre
et a
l Opt
Exp
15, 8
913
(200
7)
→ convenient epi-detected imaging of collagen SHG in tissues
One remarkable exception:SHG from collagen is very efficient → detectable backward-emitted signals
SHG EpiSHG Trans
Human corneaN. Morishige, J. Jester et al, Invest. Ophtal. Vis. Sci (2007)
Zipfel et al PNAS (2003)
XY
XZ
Directionality
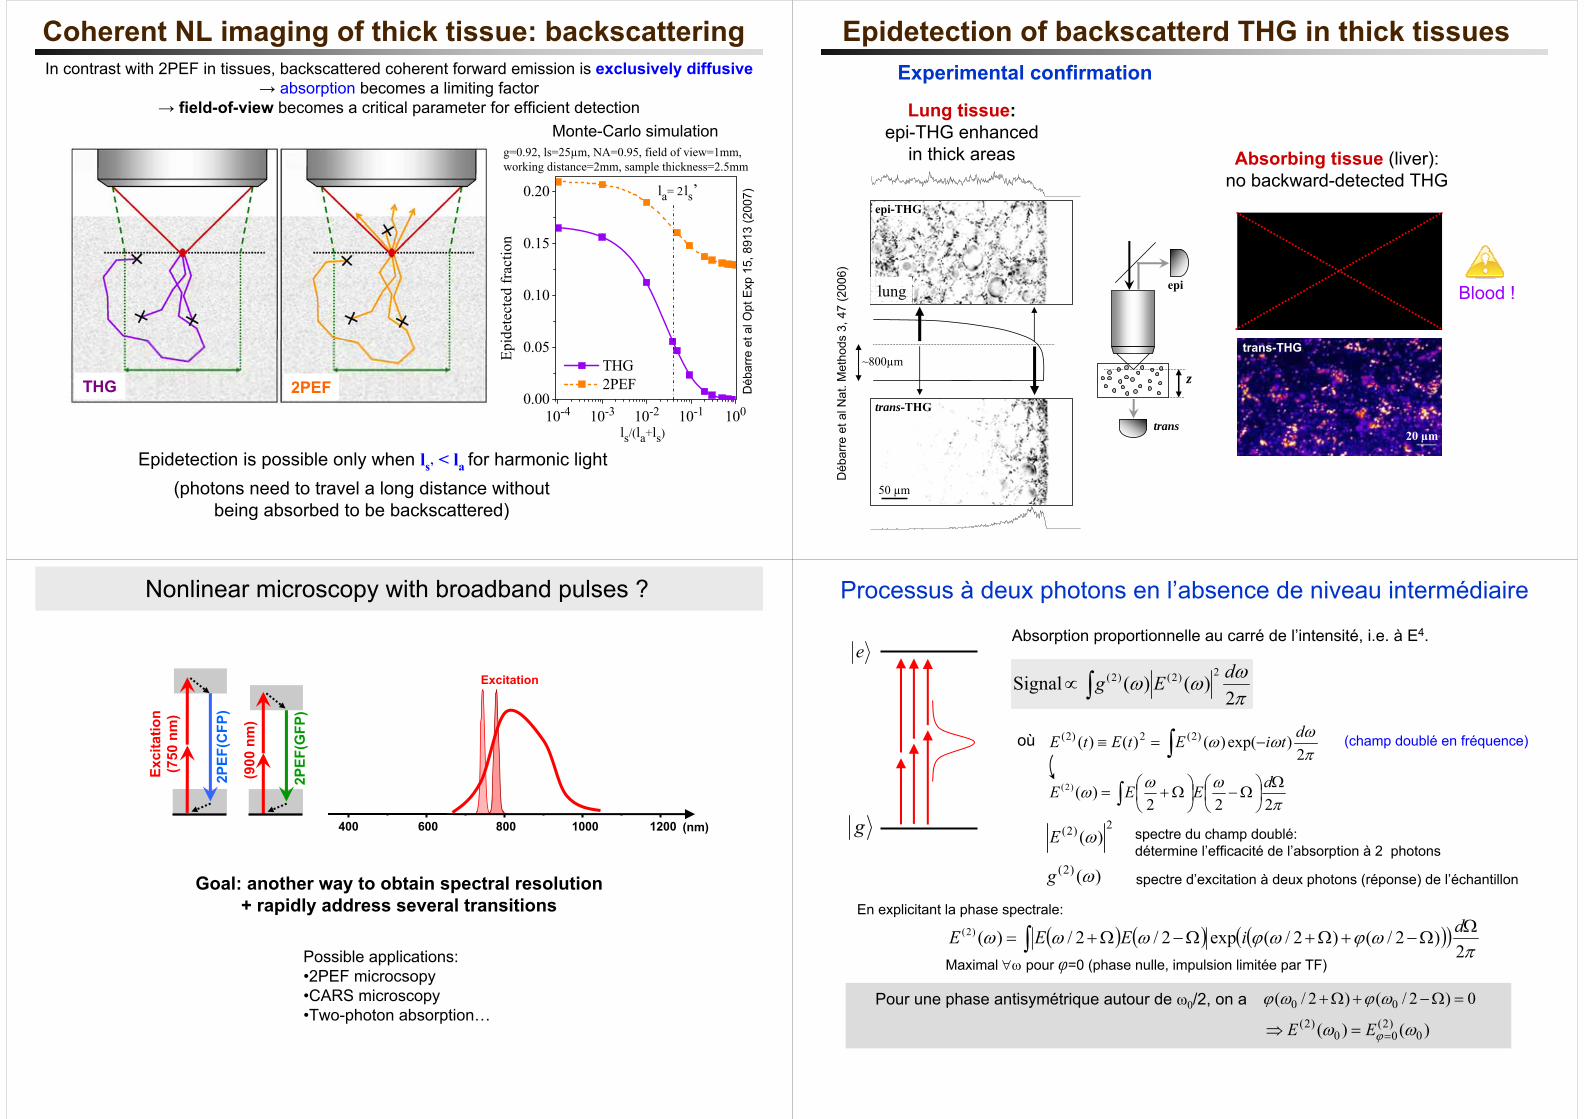
In contrast with 2PEF in tissues, backscattered coherent forward emission is exclusively diffusive → absorption becomes a limiting factor
→ field-of-view becomes a critical parameter for efficient detection
Epidetection is possible only when ls’ < la for harmonic light
THG 2PEF
(photons need to travel a long distance without being absorbed to be backscattered)
10-4 10-3 10-2 10-1 1000.00
0.05
0.10
0.15
0.20
Epid
etec
ted
frac
tion
THG 2PEF
Monte-Carlo simulation
ls/(la+ls)
la= 2ls’
g=0.92, ls=25µm, NA=0.95, field of view=1mm, working distance=2mm, sample thickness=2.5mm
Coherent NL imaging of thick tissue: backscattering
Déb
arre
et a
l Opt
Exp
15, 8
913
(200
7)
Experimental confirmation
Lung tissue:epi-THG enhanced
in thick areas
epi-THG
~800µm
trans-THG
50 µm
lung
Absorbing tissue (liver): no backward-detected THG
20 µm
trans-THG
Blood !
z
epi
trans
Epidetection of backscatterd THG in thick tissues
Déb
arre
et a
l Nat
. Met
hods
3, 4
7 (2
006)
Nonlinear microscopy with broadband pulses ?
Goal: another way to obtain spectral resolution+ rapidly address several transitions
Exci
tatio
n(7
50 n
m)
2PEF
(CFP
)
(900
nm
)
2PEF
(GFP
)
Excitation
400 600 800 1000 1200 (nm)
Possible applications:•2PEF microcsopy•CARS microscopy•Two-photon absorption…
Processus à deux photons en l’absence de niveau intermédiaire
e
g
Absorption proportionnelle au carré de l’intensité, i.e. à E4.
∫∝πωωω
2)()( Signal
2)2()2( dEg
πωωω
222)()2( Ω
⎟⎠⎞
⎜⎝⎛ Ω−⎟
⎠⎞
⎜⎝⎛ Ω+= ∫
dEEE
(champ doublé en fréquence)∫ −=≡πωωω
2)exp()()()( )2(2)2( dtiEtEtEoù
2)2( )(ωE spectre du champ doublé:détermine l’efficacité de l’absorption à 2 photons
( ) ( ) ( )( )∫Ω
Ω−+Ω+Ω−Ω+=π
ωϕωϕωωω2
)2/()2/(exp2/2/)()2( diEEE
Pour une phase antisymétrique autour de ω0/2, on a 0)2/()2/( 00 =Ω−+Ω+ ωϕωϕ
)()( 0)2(00
)2( ωω ϕ ==⇒ EE
En explicitant la phase spectrale:
spectre d’excitation à deux photons (réponse) de l’échantillon)()2( ωg
Maximal ∀ω pour φ=0 (phase nulle, impulsion limitée par TF)
t t
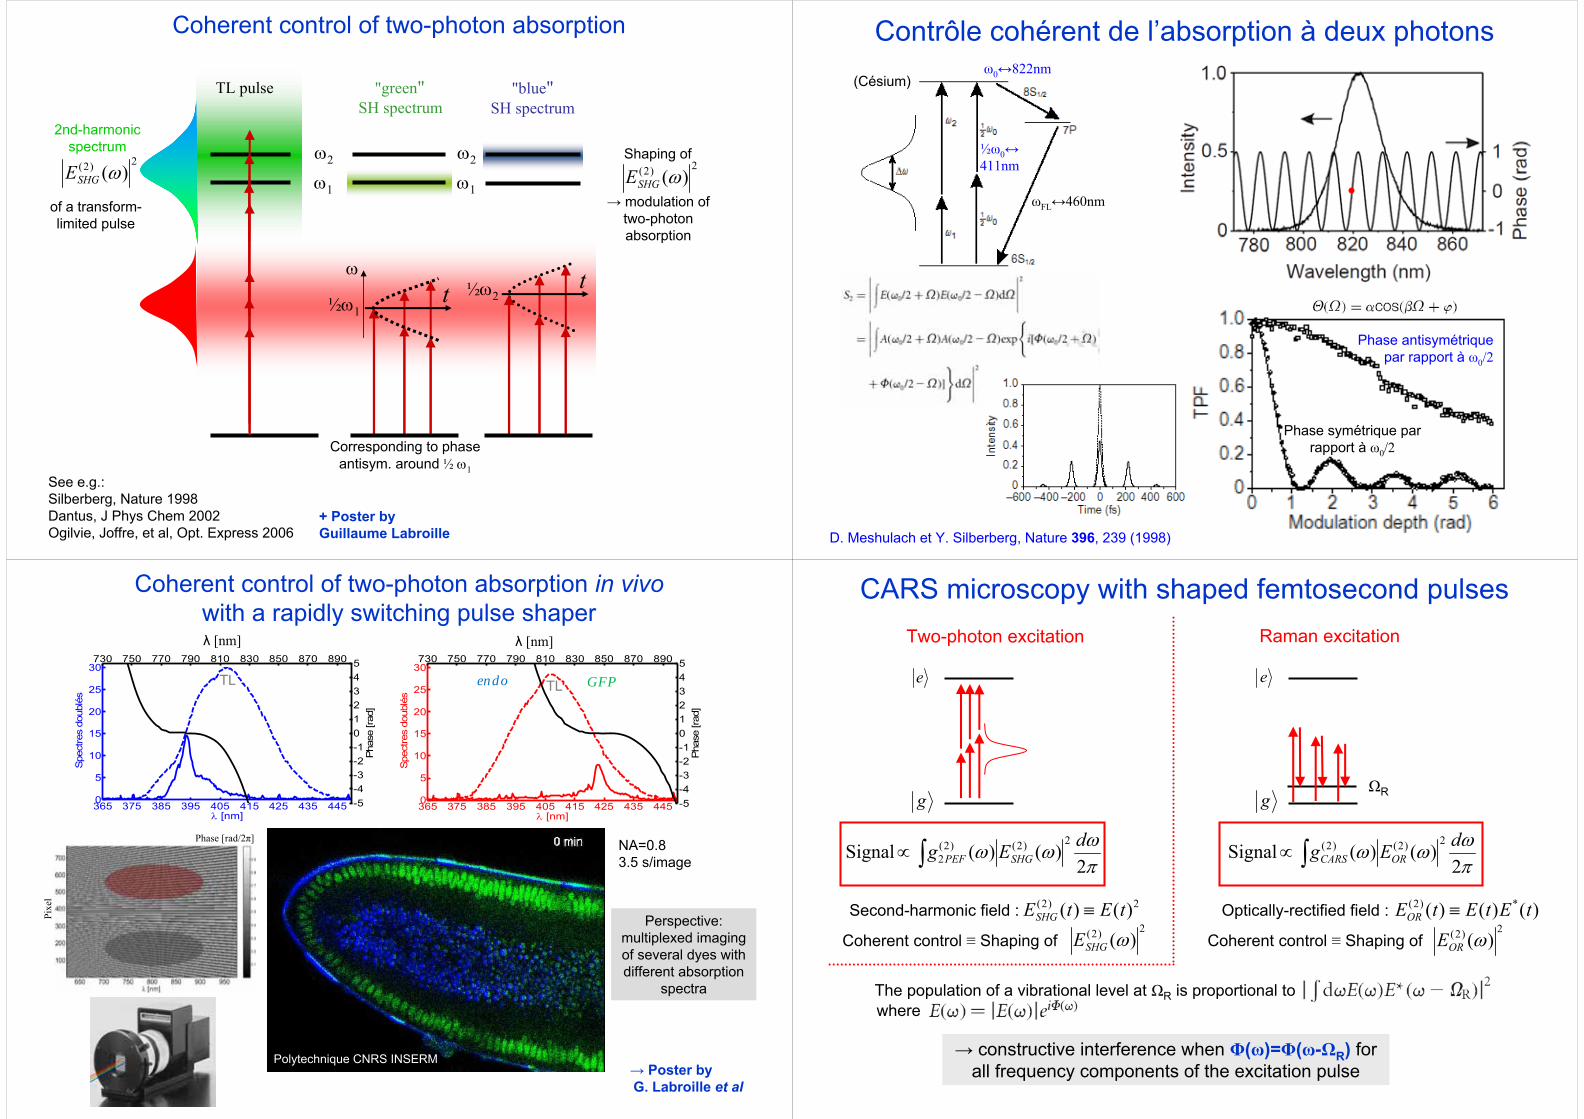
2)2( )(ωSHGE
2nd-harmonic spectrum
of a transform-limited pulse
2)2( )(ωSHGEShaping of
→ modulation of two-photon absorption
ω
½ω1
ω1
ω2
½ω2
+ Poster by Guillaume Labroille
Coherent control of two-photon absorption
"blue"SH spectrum
"green"SH spectrum
TL pulse
Corresponding to phase antisym. around ½ ω1
See e.g.:Silberberg, Nature 1998Dantus, J Phys Chem 2002Ogilvie, Joffre, et al, Opt. Express 2006
ω1
ω2
ω0↔822nm
½ω0↔411nm
ωFL↔460nm
D. Meshulach et Y. Silberberg, Nature 396, 239 (1998)
Contrôle cohérent de l’absorption à deux photons
Phase symétrique par rapport à ω0/2
Phase antisymétrique par rapport à ω0/2
(Césium)
λ [nm]
365 375 385 395 405 415 425 435 4450
5
10
15
20
25
30
λ [nm]
Spec
tres
doub
lés
730 750 770 790 810 830 850 870 890
-5-4-3-2-1012345
Phas
e [ra
d]
365 375 385 395 405 415 425 435 4450
5
10
15
20
25
30
λ [nm]
Spec
tres
doub
lés
730 750 770 790 810 830 850 870 890
-5-4-3-2-1012345
Phas
e [ra
d]
λ [nm]
Coherent control of two-photon absorption in vivowith a rapidly switching pulse shaper
→ Poster by G. Labroille et al
Perspective: multiplexed imagingof several dyes withdifferent absorption
spectra
Phase [rad/2π]
Pixe
l
GFPendoTL TL
NA=0.83.5 s/image
Polytechnique CNRS INSERM
∫∝πωωω
2)()( Signal
2)2()2(2
dEg SHGPEF
e
g
∫∝πωωω
2)()( Signal
2)2()2( dEg ORCARS
Second-harmonic field : 2)2( )()( tEtESHG ≡
Two-photon excitation Raman excitation
Optically-rectified field : )()()( *)2( tEtEtEOR ≡
Coherent control ≡ Shaping of 2)2( )(ωORECoherent control ≡ Shaping of
2)2( )(ωSHGE
The population of a vibrational level at ΩR is proportional towhere
→ constructive interference when Φ(ω)=Φ(ω-ΩR) for all frequency components of the excitation pulse
CARS microscopy with shaped femtosecond pulses
e
gΩR
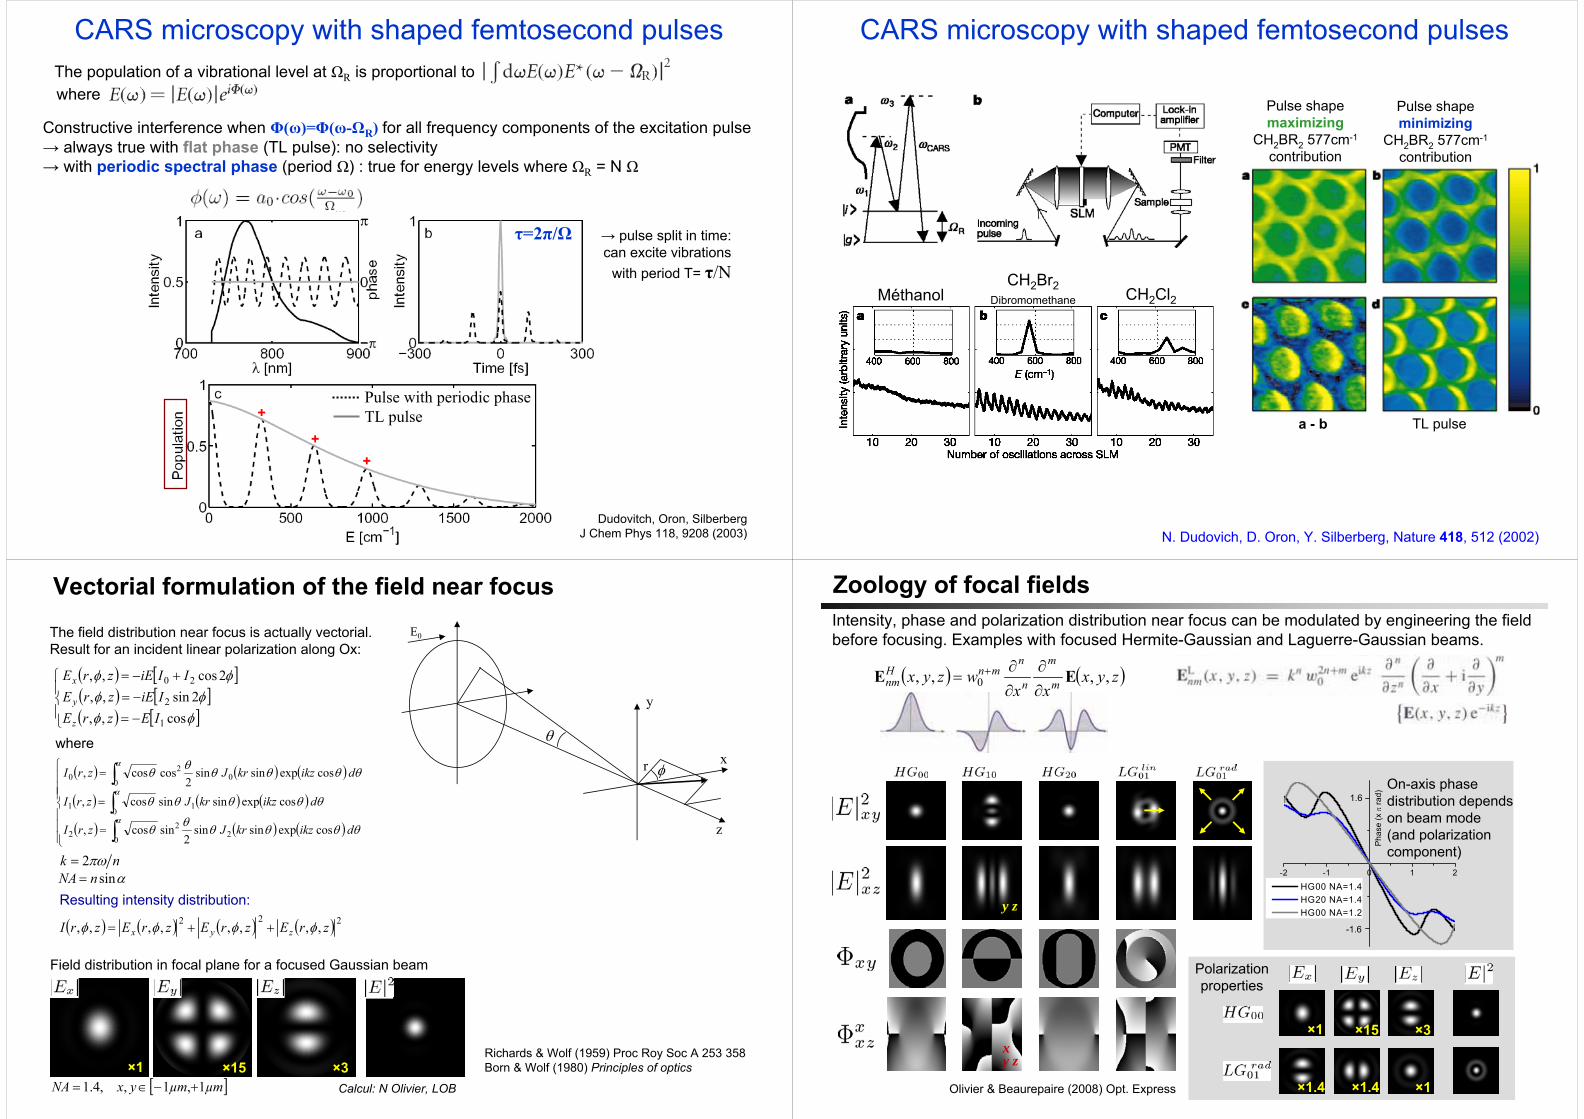
The population of a vibrational level at ΩR is proportional towhere
Constructive interference when Φ(ω)=Φ(ω-ΩR) for all frequency components of the excitation pulse→ always true with flat phase (TL pulse): no selectivity→ with periodic spectral phase (period Ω) : true for energy levels where ΩR = N Ω
τ=2π/Ω
Pulse with periodic phase TL pulse+
++
→ pulse split in time:can excite vibrations
with period T= τ/N
CARS microscopy with shaped femtosecond pulses
Dudovitch, Oron, SilberbergJ Chem Phys 118, 9208 (2003) N. Dudovich, D. Oron, Y. Silberberg, Nature 418, 512 (2002)
MéthanolCH2Br2
Dibromomethane CH2Cl2
Pulse shapemaximizing
CH2BR2 577cm-1
contribution
a - b TL pulse
Pulse shapeminimizing
CH2BR2 577cm-1
contribution
CARS microscopy with shaped femtosecond pulses
Vectorial formulation of the field near focus
( ) ( ) ( )
( ) ( ) ( )
( ) ( ) ( )⎪⎪⎪
⎩
⎪⎪⎪
⎨
⎧
=
=
=
∫∫∫
α
α
α
θθθθθθ
θθθθθ
θθθθθθ
02
22
011
00
20
cosexpsinsin2
sincos,
cosexpsinsincos,
cosexpsinsin2
coscos,
dikzkrJzrI
dikzkrJzrI
dikzkrJzrI
The field distribution near focus is actually vectorial.Result for an incident linear polarization along Ox:
( ) [ ]( ) [ ]( ) [ ]⎪
⎩
⎪⎨
⎧
−=−=
+−=
φφφφ
φφ
cos,,2sin,,
2cos,,
1
2
20
IEzrEIiEzrE
IIiEzrE
z
y
x
where
Resulting intensity distribution:
( ) ( ) ( ) ( ) 222 ,,,,,,,, zrEzrEzrEzrI zyx φφφφ ++=
E0
y
x
z
r φ
θ
Richards & Wolf (1959) Proc Roy Soc A 253 358Born & Wolf (1980) Principles of optics×15 ×3×1
Field distribution in focal plane for a focused Gaussian beam
nk πω2=αsinnNA =
[ ]µmµmyxNA 1,1,,4.1 +−∈= Calcul: N Olivier, LOB
y z
xy z
Zoology of focal fields
-2 -1 0 1 2
Pha
se (x
π ra
d)
HG00 NA=1.4 HG20 NA=1.4 HG00 NA=1.2
-1.6
1.6On-axis phase distribution dependson beam mode (and polarizationcomponent)
Olivier & Beaurepaire (2008) Opt. Express ×1.4×1.4 ×1
×15 ×3×1
Polarizationproperties
Intensity, phase and polarization distribution near focus can be modulated by engineering the fieldbefore focusing. Examples with focused Hermite-Gaussian and Laguerre-Gaussian beams.
( ) ( )zyxxx
wzyx m
m
n
nmnH
nm ,,,, 0 EE∂∂
∂∂
= +
×1.4×1.4 ×1
Can be usedto visualize
axial structures (ex: collagen SHG)
→
Yoshiki et al (2007) Opt. Lett. 32Yew & Sheppard (2007) Opt. Commun. 275
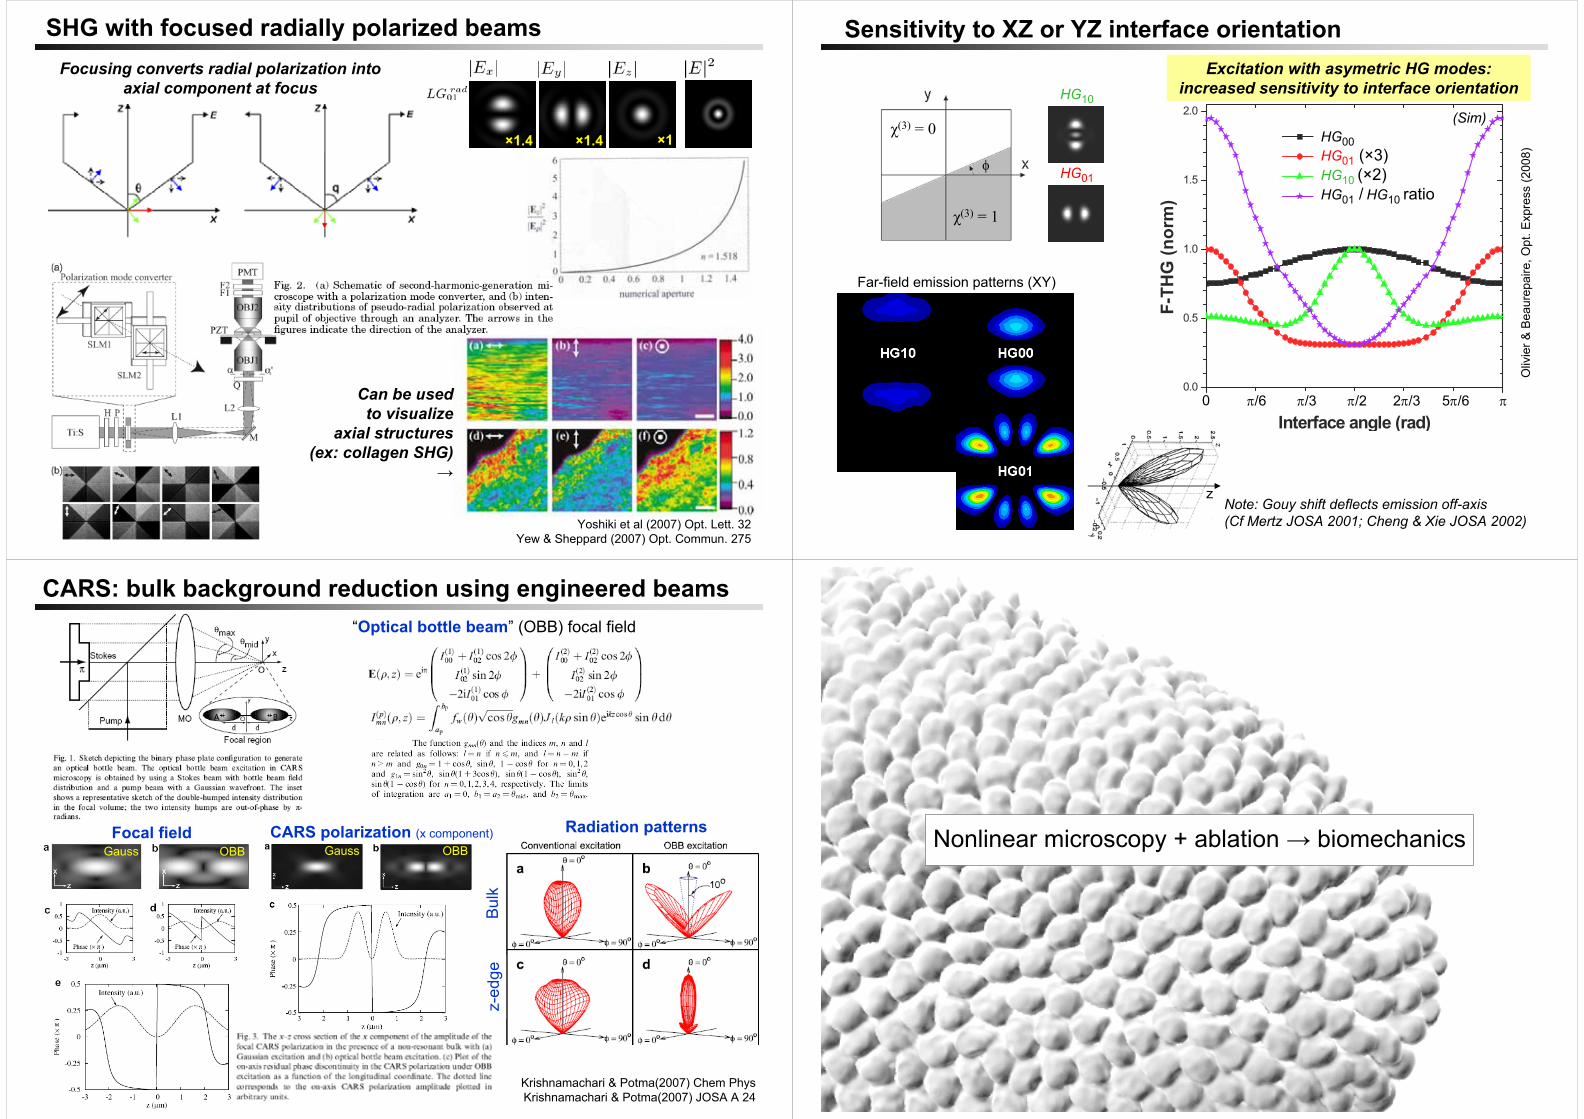
SHG with focused radially polarized beamsFocusing converts radial polarization into
axial component at focus
HG01
HG10
0.0
0.5
1.0
1.5
2.0
F-TH
G (n
orm
)
Interface angle (rad)
HG00 HG01 (x3) HG10 (x2) HG01/HG10 ratio
0 π/6 π/3 π/2 π2π/3 5π/6
HG00HG01 (×3)HG10 (×2)HG01 / HG10 ratio
χ(3) = 0
χ(3) = 1
φ
Sensitivity to XZ or YZ interface orientation
Oliv
ier &
Bea
urep
aire
, Opt
. Exp
ress
(200
8)
(Sim)
Far-field emission patterns (XY)
Excitation with asymetric HG modes: increased sensitivity to interface orientation
zNote: Gouy shift deflects emission off-axis (Cf Mertz JOSA 2001; Cheng & Xie JOSA 2002)
Krishnamachari & Potma(2007) Chem PhysKrishnamachari & Potma(2007) JOSA A 24
CARS: bulk background reduction using engineered beams“Optical bottle beam” (OBB) focal field
Focal fieldGauss OBB Gauss OBB
CARS polarization (x component)
Bulk
z-ed
ge
Radiation patterns Nonlinear microscopy + ablation → biomechanics
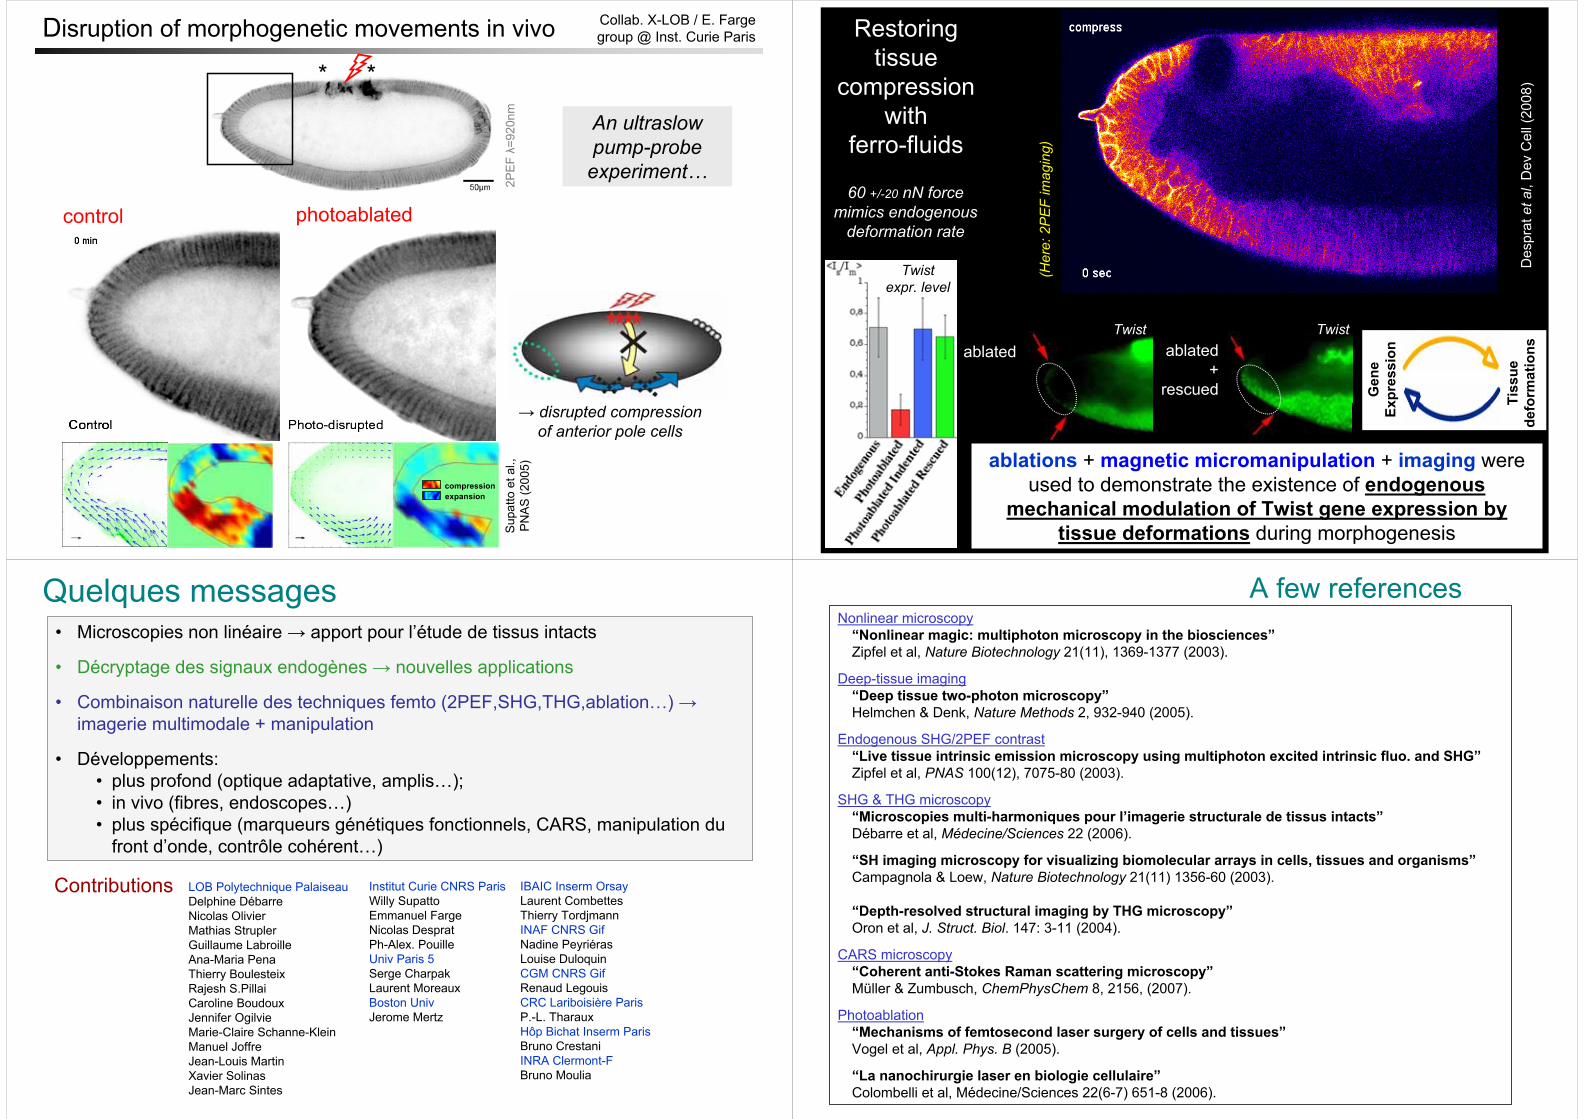
* *
2PE
F λ=
920n
m
Disruption of morphogenetic movements in vivo
→ disrupted compression of anterior pole cells
control photoablated
compressionexpansion
Sup
atto
et a
l.,
PNAS
(200
5)
An ultraslowpump-probe
experiment…
Collab. X-LOB / E. Farge group @ Inst. Curie Paris
ablated ablated+
rescued
ablations + magnetic micromanipulation + imaging were used to demonstrate the existence of endogenous
mechanical modulation of Twist gene expression by tissue deformations during morphogenesis
Des
prat
et a
l, D
evC
ell(
2008
)
Twist expr. level
Gen
e Ex
pres
sion
Tiss
ue
defo
rmat
ions
(Her
e: 2
PE
F im
agin
g)
Twist Twist
Restoringtissue
compressionwith
ferro-fluids
60 +/-20 nN force mimics endogenous
deformation rate
• Microscopies non linéaire → apport pour l’étude de tissus intacts
• Décryptage des signaux endogènes → nouvelles applications
• Combinaison naturelle des techniques femto (2PEF,SHG,THG,ablation…) →imagerie multimodale + manipulation
• Développements: • plus profond (optique adaptative, amplis…); • in vivo (fibres, endoscopes…)• plus spécifique (marqueurs génétiques fonctionnels, CARS, manipulation du
front d’onde, contrôle cohérent…)
Quelques messages
LOB Polytechnique PalaiseauDelphine DébarreNicolas Olivier Mathias StruplerGuillaume LabroilleAna-Maria Pena Thierry BoulesteixRajesh S.PillaiCaroline BoudouxJennifer OgilvieMarie-Claire Schanne-KleinManuel JoffreJean-Louis MartinXavier SolinasJean-Marc Sintes
Institut Curie CNRS ParisWilly SupattoEmmanuel FargeNicolas DespratPh-Alex. PouilleUniv Paris 5Serge CharpakLaurent MoreauxBoston UnivJerome Mertz
IBAIC Inserm OrsayLaurent CombettesThierry TordjmannINAF CNRS GifNadine PeyriérasLouise DuloquinCGM CNRS GifRenaud LegouisCRC Lariboisière ParisP.-L. TharauxHôp Bichat Inserm ParisBruno CrestaniINRA Clermont-FBruno Moulia
Contributions
A few referencesNonlinear microscopy
“Nonlinear magic: multiphoton microscopy in the biosciences”Zipfel et al, Nature Biotechnology 21(11), 1369-1377 (2003).
Deep-tissue imaging“Deep tissue two-photon microscopy”Helmchen & Denk, Nature Methods 2, 932-940 (2005).
Endogenous SHG/2PEF contrast“Live tissue intrinsic emission microscopy using multiphoton excited intrinsic fluo. and SHG”Zipfel et al, PNAS 100(12), 7075-80 (2003).
SHG & THG microscopy“Microscopies multi-harmoniques pour l’imagerie structurale de tissus intacts”Débarre et al, Médecine/Sciences 22 (2006).
“SH imaging microscopy for visualizing biomolecular arrays in cells, tissues and organisms”Campagnola & Loew, Nature Biotechnology 21(11) 1356-60 (2003).
“Depth-resolved structural imaging by THG microscopy”Oron et al, J. Struct. Biol. 147: 3-11 (2004).
CARS microscopy“Coherent anti-Stokes Raman scattering microscopy”Müller & Zumbusch, ChemPhysChem 8, 2156, (2007).
Photoablation“Mechanisms of femtosecond laser surgery of cells and tissues”Vogel et al, Appl. Phys. B (2005).
“La nanochirurgie laser en biologie cellulaire”Colombelli et al, Médecine/Sciences 22(6-7) 651-8 (2006).