TheTrust inTeams andTrust in Leaders Scale:A Review ofTheir ... · TheTrust inTeams andTrust in...
40
TheTrust inTeams andTrust in Leaders Scale: A Review of Their Psychometric Properties and Item Selection Ann-Renee Blais Megan Thompson DRDC Toronto Defence R&D Canada Technical Memorandum DRDC Toronto TM 2009-161 September 2009 Defence Research and Development Canada Recherche et développement pour la défense Canada DEFENCE DÉFENSE &
-
Upload
truongthuan -
Category
Documents
-
view
214 -
download
0
Transcript of TheTrust inTeams andTrust in Leaders Scale:A Review ofTheir ... · TheTrust inTeams andTrust in...
The Trust inTeams and Trust in LeadersScale: A Review of Their PsychometricProperties and Item Selection
Ann-Renee BlaisMegan ThompsonDRDC Toronto
Defence R&D CanadaTechnical Memorandum
DRDC Toronto TM 2009-161
September 2009
Defence Research andDevelopment Canada
Recherche et développement pour la défense Canada
DEFENCE DÉFENSE&

The Trust in Teams and Trust in Leaders Scale: A second look at their psychometric properties and item selection
Ann-Renee Blais Megan Thompson DRDC Toronto
Defence R&D Canada – Toronto Technical Memorandum DRDC Toronto TM 2009-161 September 2009
Principal Author
Original signed by Dr Ann-Renee Blais
Dr. Ann-Renee Blais
Defence Scientist
Approved by
Original signed by Dr Matthew Duncan
Dr. Matthew Duncan
Head, Collaborative Performance & Learning Section
Approved for release by
Original signed by Marko Jovanovic
Marko Jovanovic
for Chair, Document Review and Library Committee
© Her Majesty the Queen in Right of Canada, as represented by the Minister of National Defence, 2009
© Sa Majesté la Reine (en droit du Canada), telle que représentée par le ministre de la Défense nationale, 2009

DRDC Toronto TR 2009-161 i
Abstract ……..
One objective of Defence Research and Development Canada Toronto’s Trust in Military Teams Applied Research Project (12oe) was to develop reliable and valid measures of trust in teams and leaders at the level of small military units (i.e., section level). Several research studies resulted in two scales: the Trust in Teams and Trust in Leaders Scales. These scales were the subject of item selection, reliability, and validation analyses as documented in previous contractor reports (Adams, Bruyn, & Chung-Yan, 2004; Adams & Sartori, 2006). However, a recent review of the Trust in Teams and Trust in Leaders scale items in Adams and Sartori showed they differed substantively from those in Adams, Bruyn, and Chung-Yan. That is, some of the items were slightly reworded, whereas others were completely new, making direct comparisons and the continuity of scale development work from one version of the scale to the next a particular challenge. To address this issue, the current report presents a review of the literature concerning analytic approaches for the evaluation and selection of items with application to the most recent Trust in Teams and Trust in Leaders Scales (i.e., Adams & Sartori) in order to provide a sound psychometric basis for continued scale development work.
Résumé ….....
Le projet de recherche appliquée sur la confiance envers les équipes militaires (12oe) de RDDC Toronto avait notamment pour objectif d’élaborer des mesures fiables et valides de la confiance envers les équipes et envers les chefs au sein de petites unités militaires (p. ex. au niveau des sections). Plusieurs études de recherche ont permis d’établir des versions initiales de deux mesures : l’échelle de confiance envers les équipes et l’échelle de confiance envers les chefs. Ces premières versions des échelles ont fait l’objet d’analyses portant sur la sélection initiale des items et la fiabilité ainsi que d’analyses de validation, dont il a été question dans les rapports antérieurs des entrepreneurs (Adams, Bruyn et Chung-Yan, 2004; Adams et Sartori, 2006). Toutefois, un examen récent des items des échelles de confiance envers les équipes et envers les chefs a révélé que les items d’Adams et Sartori (2006) différaient sensiblement de ceux d’Adams, Bruyn et Chung-Yan (2004). En effet, certains des items avaient été légèrement reformulés, alors que d’autres étaient complètement nouveaux, ce qui rendait particulièrement difficiles les comparaisons directes ainsi que la continuité du travail d’élaboration de l’échelle d’une version à la version suivante. Afin de surmonter ce problème, nous faisons dans le présent rapport un survol de la littérature ayant trait aux méthodes d’analyse axées sur l’élaboration d’échelles et proposons des applications aux deuxièmes versions des échelles de confiance envers les équipes et envers les chefs. Nous espérons ainsi offrir une assise psychométrique solide pour guider le travail d’élaboration continue des échelles. À cette fin, nous avons examiné les publications portant sur les méthodes d’analyse qu’il convient d’utiliser pour l’évaluation et la sélection des items. Nous avons ensuite analysé une nouvelle fois les données relatives aux échelles de confiance envers les équipes et envers les chefs et examiné la sélection des items fondée sur ces méthodes d’analyse, dans le but d’offrir une assise plus solide aux recherches futures faisant appel à ces mesures.

ii DRDC Toronto TR 2009-161
This page intentionally left blank.

DRDC Toronto TR 2009-161 iii
Executive summary
The Trust in Teams and Trust in Leaders Scale: A second look at their psychometric properties and item selection:
Ann-Renee Blais; Megan Thompson; DRDC Toronto TM 2009-161; Defence R&D Canada – Toronto; September 2009.
Background: Trust has long been hypothesized to be a fundamental group dynamic: “… The efficiency, adjustment and even survival of any social group depends upon the presence or absence of…trust” (Rotter, 1967, p. 651). Many of the defining features of trust, including high levels of interdependence, perceived risk, vulnerability, and uncertainty (Costa, Roe, & Tailleau, 2001; Rousseau, Sitkin, Burt, & Camerer, 1998) make it especially relevant to the military context. For instance, military operations often involve high interdependence; counting on others to perform their work and roles competently and to provide mutual support under conditions of risk and uncertainty (Van der Kloet, Soeters, & Sanders, 2004). Moreover, “soldiers may [also] need to operate independently, in small groups, and their behavior cannot constantly be monitored, so their supervisors must trust them (Van Der Kloet et al., p. 131). Consequently, trust has been termed a fundamental enabler of military teams (e.g., Cox, 1996; Scull, 1990), with higher trust levels argued to be related to greater team cohesion, higher morale (Cassel, 1993), higher performance and achievement (Ivy, 1995), greater citizenship behaviours (Deluga, 1995), a more positive command climate (Cox), and lower unit attrition (Thomas & Barios-Choplin, 1996). Despite its ascribed importance, relatively few studies have specifically addressed trust within military teams, with the exception of those cited above. Just as striking is the lack of systematic attempts to measure trust and to validate measures of trust within a military context.
One objective of Defence Research and Development Canada Toronto’s Trust in Military Teams Applied Research Project (12oe) was to develop reliable and valid measures of trust in teams and leaders at the level of small military units (i.e., section level). Several research studies resulted in two scales: the Trust in Teams and Trust in Leaders Scales. These scales were the subject of item selection, reliability, and validation analyses as documented in previous contractor reports (Adams, Bruyn, & Chung-Yan, 2004; Adams & Sartori, 2006). However, a recent review of the Trust in Teams and Trust in Leaders scale items in Adams and Sartori showed they differed substantively from those in Adams, Bruyn, and Chung-Yan. That is, some of the items were slightly reworded, whereas others were completely new, making direct comparisons and the continuity of scale development work from one version of the scale to the next a particular challenge. To this end, we briefly summarize the literature concerning the analytic approaches for the evaluation and selection of items, re-analyze the 2006’s data (Adams & Sartori) collected with the Trust in Teams and Trust in Leaders Scales, and review the item selection based on these analytic approaches in order to provide a more robust basis for future scale work with these measures.
Results: With respect to the Trust in Teams Scale, although the three-, four- and five-factor models all produced acceptable fit indices, the four-factor model was both the most parsimonious and interpretable model. Based on the current analyses, and in preparation for future scale refinement work, we recommend retaining six items for the Competency, Integrity, and Predictability subscales. The Benevolence items proved more problematic with only four of
iv DRDC Toronto TR 2009-161
seven loading exclusively on the Benevolence factor. Nonetheless, based on the current data, we recommend the retention of six items for now, albeit two were less than ideal and will require further revision. Lastly, in some cases, we also suggest some minor wording changes. Reliability analyses of the reduced six-item versions of each of the four subscales produced good reliability estimates of the scores, and, consistent with our conceptual model, the subscales were positively and significantly inter-correlated. The results of a similar analytic strategy applied to the 40 initial Trust in Leaders scale items first led to the retention of 28 of the items, with 7 items per hypothesized construct (i.e., Benevolence, Competence, Predictability, and Integrity). The five-factor model resulted into an acceptable fit to the data, while the three- and four-factor models provided only a marginal fit. The Competence, Integrity, and Predictability items produced, for the most part, unique and salient loadings on their expected factors. However, the Benevolence subscale results were, again, problematic. Thus we recommend, for now, the retention of those items that loaded saliently on the intended factor, with revision and development of additional items in the near future. Despite the weaknesses associated with the dimensionality of this subscale, the internal consistency reliability estimates of the scores were all good. All of the subscales were positively and significantly inter-correlated, as expected. Significance: The current research represents the psychometric review and analysis of two measures, the Trust in Teams and Trust in Leaders Scales, having direct significance to small military units, such as infantry sections. While the current scales were created to meaningfully reflect the kind of interactions found in small units within the Land Force, we believe they could also be of use in other small team contexts, for instance with crews of larger aircraft, surveillance teams, as well as sensor or warfare teams on warships. Future plans: The next step will undoubtedly be to write additional items to replace those that proved to be problematic here and replicate the current findings in terms of the dimensionality of the scales (preferably in agreement with the theoretical four-factor models of trust), leading to the retention of the best items tapping into the four dimensions of trust. Although we should again employ exploratory factor analysis at that point, as the scales will still be under construction, our longer-term objective will be to demonstrate the robustness of the theoretical models via confirmatory factor analysis. For now, however, we urge researchers to use the scales as presented in this report, as they possess acceptable psychometric properties in their current state. In the longer term, it will be important to validate the scales utilizing incremental (Hunsley & Meyer, 2003) and multi-trait-multi-method approaches (Kenny, 1995) to explore their construct validity. Further work should also investigate their predictive validity using a longitudinal methodology. Down the road, additional work with an independent sample from a different context (e.g., a military sample from a different nation) would be of value.

DRDC Toronto TR 2009-161 v
Sommaire .....
The Trust in Teams and Trust in Leaders Scale: A second look at their psychometric properties and item selection:
Ann-Renee Blais; Megan Thompson; DRDC Toronto TM 2009-161; R & D pour la défense Canada – Toronto; Septembre 2009.
Contexte: On croit depuis longtemps que la confiance est un élément fondamental de la dynamique de groupe : « L’efficacité, l’adaptation et même la survie de tout groupe social dépendent de la présence ou de l’absence de… confiance » [Traduction] (Rotter, 1967, p. 651). Bon nombre des situations dans lesquelles la confiance est particulièrement cruciale, notamment un degré élevé d’interdépendance, le risque, la vulnérabilité et l’incertitude perçus (Costa, Roe et Tailleau, 2001; Rousseau, Sitkin, Burt et Camerer, 1998) rendent cet aspect particulièrement pertinent dans le contexte militaire. Ainsi, les opérations militaires exigent souvent une forte interdépendance et imposent de pouvoir compter sur les autres pour exécuter son travail et remplir son rôle avec compétence et pour s’appuyer mutuellement dans des situations de risque et d’incertitude. (van der Kloet, Soeters et Sanders, 2004). De plus, « les soldats doivent [aussi] parfois fonctionner de manière indépendante, en petits groupes, et leur comportement ne peut faire l’objet d’une supervision constante, de sorte que leurs superviseurs doivent pouvoir leur faire confiance [Traduction] (Van Der Kloet et coll., 2004, p. 131). En conséquence, la confiance est considérée comme un catalyseur essentiel des équipes militaires (Cox, 1996; Scull, 1990), un degré de confiance plus élevé étant, croit-on, associé à une plus forte cohésion et à un meilleur moral au sein des équipes (Cassel, 1993), à un rendement et à des réalisations supérieures (Ivy, 1995), à un plus grand sens civique (Deluga, 1995), à un climat de commandement plus positif (Cox, 1996) et à un plus faible taux de départs au sein de l’unité (Thomas et Barios-Choplin, 1996). Bien que l’importance de cet aspect soit reconnue, rares sont les études (mis à part celles mentionnées plus haut) qui ont expressément porté sur la confiance au sein des équipes militaires. Il est tout aussi étonnant de constater l’absence de tentatives systématiques de mesurer la confiance et de valider les mesures de la confiance dans un contexte militaire.
Le projet de recherche appliquée sur la confiance envers les équipes militaires (16kx) de RDDC Toronto avait notamment pour objectif d’élaborer des mesures fiables et valides de la confiance envers les équipes et envers les chefs au sein de petites unités militaires (p. ex. au niveau des sections). Plusieurs études de recherche ont permis d’établir des versions initiales de deux mesures : l’échelle de confiance envers les équipes et l’échelle de confiance envers les chefs. Ces premières versions des échelles ont fait l’objet d’analyses portant sur la sélection initiale des items et la fiabilité ainsi que d’analyses de validation, dont il a été question dans les rapports antérieurs des entrepreneurs (Adams, Bruyn et Chung-Yan, 2004; Adams et Sartori, 2006). Toutefois, un examen récent des items des échelles de confiance envers les équipes et envers les chefs a révélé que les items d’Adams et Sartori (2006) différaient sensiblement de ceux d’Adams, Bruyn et Chung-Yan (2004). En effet, certains des items avaient été légèrement reformulés, alors que d’autres étaient complètement nouveaux, ce qui rendait particulièrement difficiles les comparaisons directes ainsi que la continuité du travail d’élaboration de l’échelle d’une version à la version suivante. Afin de surmonter ce problème, nous faisons dans le présent rapport un survol de la littérature ayant trait aux méthodes d’analyse axées sur l’élaboration d’échelles et proposons des applications aux deuxièmes versions des échelles de confiance envers les équipes et envers
vi DRDC Toronto TR 2009-161
les chefs. Nous espérons ainsi offrir une assise psychométrique solide pour guider le travail d’élaboration continue des échelles. À cette fin, nous avons examiné les publications portant sur les méthodes d’analyse qu’il convient d’utiliser pour l’évaluation et la sélection des items. Nous avons ensuite analysé une nouvelle fois les données relatives aux échelles de confiance envers les équipes et envers les chefs et examiné la sélection des items fondée sur ces méthodes d’analyse, dans le but d’offrir une assise plus solide aux recherches futures faisant appel à ces mesures.
Résultats: En ce qui concerne l’échelle de confiance envers les équipes, bien que les modèles à trois, quatre et cinq facteurs aient permis d’obtenir des indices d’ajustement acceptables, le modèle à quatre facteurs était, tout à la fois, le plus parcimonieux et celui qui se prêtait le mieux à l’interprétation. À la lumière des analyses actuelles, et en préparation des travaux futurs d’amélioration des échelles, nous avons recommandé de retenir six items pour les sous-échelles de la compétence, de l’intégrité et de la prévisibilité. Les items ayant trait à la bienveillance ont posé davantage de problèmes, car seulement quatre sur sept saturaient exclusivement sur le facteur bienveillance. Néanmoins, à la lumière des données actuelles, nous avons recommandé de conserver les six items, même si au moins deux étaient loin d’être satisfaisants et devront sans doute faire l’objet d’une révision. Enfin, dans certains cas, nous avons aussi suggéré certains changements de formulation mineurs. Les analyses de fiabilité des versions abrégées à 6 items de chacune des quatre sous-échelles ont toutes permis d’obtenir des estimations des scores d’une bonne fiabilité (c.-à-d. coefficients alpha de Cronbach), et, conformément à notre modèle conceptuel, il existait une corrélation positive et significative entre les sous-échelles.
Les résultats obtenus au moyen d’une stratégie d’analyse semblable appliquée aux 40 items initiaux de l’échelle de la confiance envers les chefs avaient d’abord conduit à la conservation de 28 items, soit 7 par concept hypothétique (c.-à-d. bienveillance, compétence, prévisibilité et intégrité). Plus précisément, parmi tous les modèles d’analyse factorielle exploratoire qui ont été appliqués, le modèle à cinq facteurs, quoiqu’il ne se prête pas si facilement à l’interprétation, a permis d’obtenir un ajustement acceptable avec les données, tandis que les modèles à trois et à quatre facteurs n’ont offert qu’un ajustement marginal. Les items ayant trait à la compétence, à l’intégrité et à la prévisibilité obtenaient, pour la plupart, des saturations uniques et marquées sur les facteurs attendus. Toutefois, les résultats obtenus à l’aide de la sous-échelle de la bienveillance posaient également un problème dans l’échelle de la confiance envers les chefs. Nous suggérons donc, dans le cas de l’échelle de la bienveillance, de conserver les items actuels qui saturent uniquement et de façon marquée sur le facteur attendu, et de réviser et d’élaborer des items additionnels dans la prochaine version de la mesure. Malgré les faiblesses associées à l’aspect dimensionnel de cette sous-échelle, les estimations de la fiabilité de cohérence interne des scores (c.-à-d. coefficients alpha de Cronbach) étaient toutes satisfaisantes, et il existait une corrélation positive et significative entre les sous-échelles.
Importance: La présente étude constitue un examen et une analyse psychométriques de deux mesures : l’échelle de confiance envers les équipes et l’échelle de confiance envers les chefs et elle présente un intérêt direct pour les petites unités militaires, telles que les sections d’infanterie. Bien que les mesures actuelles aient été conçues dans le but de refléter de manière adéquate le type d’interactions nécessaires dans les petites unités (c.-à-d. membres et chefs des équipes) au sein de la Force terrestre, nous croyons que les mesures pourraient également s’avérer utiles dans d’autres petites équipes, par exemple les équipages de gros aéronefs, les équipes de surveillance ainsi que les équipes des capteurs ou d’autres équipes à bord des navires de guerre.

DRDC Toronto TR 2009-161 vii
Perspectives: Les prochaines étapes de l’exercice de mise au point des échelles consisteront à reproduire les résultats actuels sur le plan de l’aspect dimensionnel des mesures ainsi que les résultats psychométriques. Même si la prochaine version portant sur un échantillon indépendant devrait également faire l’objet d’analyses factorielles exploratoires, étant donné que l’échelle est toujours en cours d’élaboration, l’objectif ultime serait de démontrer la robustesse des échelles et du modèle conceptuel de la confiance au moyen d’analyses factorielles confirmatoires. Il serait tout aussi important de valider les échelles en utilisant une approche incrémentielle (Hunsley et Meyer, 2003) ainsi qu’une analyse multitraits multiméthodes pour explorer la validité du concept. Les recherches futures devraient aussi examiner la validité prédictive au moyen d’une méthode longitudinale. Enfin, il serait intéressant que d’autres travaux portent sur un échantillon indépendant provenant d’un contexte différent, par exemple un échantillon de militaires d’un autre pays.

viii DRDC Toronto TR 2009-161
This page intentionally left blank.

DRDC Toronto TR 2009-161 ix
Table of contents
Abstract …….. ................................................................................................................................. i Résumé …..... ................................................................................................................................... i Executive summary ........................................................................................................................ iii Sommaire ........................................................................................................................................ v Table of contents ............................................................................................................................ ix List of tables .................................................................................................................................... x 1 Introduction............................................................................................................................... 1
1.1 The Current Research .................................................................................................... 2 1.2 Analytical Approaches to Psychometric Development ................................................. 2
2 Method...................................................................................................................................... 5 2.1 Participants .................................................................................................................... 5 2.2 Measures........................................................................................................................ 5
2.2.1 Trust in teams.................................................................................................. 5 2.2.2 Trust in leader. ................................................................................................ 5
2.3 Procedure....................................................................................................................... 5 3 Results....................................................................................................................................... 6
3.1 Trust in Teams............................................................................................................... 6 3.1.1 Exploratory Factor Analyses........................................................................... 6 3.1.2 Recommendations ........................................................................................... 7 3.1.3 Subscale Descriptive Statistics........................................................................ 8
3.2 Trust in Leaders............................................................................................................. 9 3.2.1 Initial Item Selection ....................................................................................... 9 3.2.2 Exploratory Factor Analyses........................................................................... 9 3.2.3 Recommendations ......................................................................................... 11 3.2.4 Subscale Descriptive Statistics...................................................................... 11
4 Discussion............................................................................................................................... 12 4.1 The Way Ahead........................................................................................................... 12
References ..... ............................................................................................................................... 14 Annex A .. Appendices .................................................................................................................. 17
A.1 Appendix A ................................................................................................................. 17 A.2 Appendix B.................................................................................................................. 18

x DRDC Toronto TR 2009-161
List of tables
Table 1: Descriptive Statistics and Factor Loadings of the Trust in Teams Items (N = 220).......... 7 Table 2: Descriptive Statistics and Correlations Among the Trust in Teams Subscales (N =
220) ............................................................................................................................... 8 Table 3: Descriptive Statistics and Factor Loadings of the Trust in Leaders Items (N = 140)...... 10 Table 4: Descriptive Statistics and Correlations Among the Trust in Leaders Subscales (N =
140) ............................................................................................................................. 11

DRDC Toronto TR 2009-161 xi
This page intentionally left blank.


1 DRDC Toronto TR 2009-161
1 Introduction
Trusting another person means to willingly “make oneself vulnerable to another person or another party based on the expectation that the other will perform a particular action important to the trustor, irrespective of the ability to monitor or control that other party” (Mayer, Davis, & Schoorman, 1995, p. 712). One can choose to trust in another person’s (or group’s) competence (i.e., one believes the other(s) possesses the requisite skills and knowledge to accomplish a valued or needed task or goal), integrity (i.e., beliefs about another(s) honesty and the adherence to high principles and codes of honor), benevolence (i.e., beliefs that an other(s) actions are motivated by genuine care and concern), and/or their predictability (i.e., believing the other(s) reactions and behaviors can be reliably anticipated) [Mayer et al., 1995]. Reflecting on the centrality of trust to group dynamics and effectiveness, the eminent social psychologist, J. B. Rotter (1967) argued that … “[t]he efficiency, adjustment and even survival of any social group depends upon the presence or absence of … trust” (p. 651). Many of the defining features of trust, including high levels of interdependence, perceived risk, vulnerability, and uncertainty (Costa, Roe, & Tailleau, 2001; Rousseau, Sitkin, Burt, & Camerer, 1998) make it especially relevant to the military context. For instance, military operations often involve counting on others to perform their work and roles competently and to provide mutual support under conditions of risk and uncertainty (Van der Kloet, Soeters, & Sanders, 2004). Moreover, “soldiers may [also] need to operate independently, in small groups, and their behavior cannot constantly be monitored, so their supervisors must trust them (Van Der Kloet et al., p. 131). Consequently, trust has been termed a fundamental enabler of military teams (e.g., Cox, 1996; Scull, 1990), with greater trust levels argued to be related to greater team cohesion, morale (Cassel, 1993), performance and achievement (Ivy, 1995), and citizenship behaviours (Deluga, 1995), a more positive command climate (Cox), and lower unit attrition (Thomas & Barios-Choplin, 1996). Despite its ascribed importance, relatively few studies have specifically addressed trust within military teams, with the exception of those cited above. Just as striking is the lack of systematic attempts to measure trust and to validate measures of trust within a military context. Indeed the few existing military trust measures (see Deluga, 1995; Shamir, Brainin, Zakay, & Popper, 2000; Shamir & Lapidot, 2003; Van der Kloet et al., 2004) have been subjected to only the most cursory psychometric analyses. To be fair, it appears that validation was not the primary goal of these researchers. Rather, they were directing their efforts to help answer specific questions about trust dynamics and influences (e.g., the relationship between unit and leader trust and combat readiness), not attempting measure development. Nonetheless, in the long term, this lack of reliable and valid trust measurement has the potential to slow the growth and accumulation of valid knowledge about trust in this vital domain. In light of these issues, the Command Effectiveness and Behavior Section of Defence Research and Development Canada (DRDC) Toronto undertook a program of research on behalf of the Land Force to explore the psychological dynamics of trust development within military teams (12oe). One objective of that research was to develop measures that could assess trust within small military teams (i.e., infantry sections), and trust in leaders of those military teams. A number of reports were completed in the course of the research project beginning with a review of the psychological literature on trust and the development of a preliminary conceptual model of trust (Adams & Webb, 2003). The model was consistent with predominant models of trust in the psychological literature in which trust is hypothesized to be comprised of four components: competence, integrity, benevolence, and predictability. This conceptual development was

DRDC Toronto TR 2009-161 2
followed by a focus group study with armoured crews at CFB Petawawa and the development of preliminary Trust in Teams and Trust in Leaders scales that were constructed to reflect the four-factor model. These measures were then tested at CFB Petawawa with a separate group of respondents (Adams, Bruyn, & Chung-Yan, 2004). Revision of the two scales, followed by an additional validation study was also undertaken (Adams & Sartori, 2006). Thus, the work conducted within 12oe laid important conceptual and psychometric foundations for exploring the nature and role of trust in small military teams, specifically at the section level.
1.1 The Current Research
Our review of the work summarized in these previous contractor reports indicated that the Trust in Teams and Trust in Leaders scale items in Adams and Sartori (2006) differed substantively from those in Adams, Bruyn, and Chung-Yan (2004). That is, while some of the items were slightly reworded, others were completely new, making direct comparisons (and thus the continuity of scale development efforts) a particular challenge. The current report thus describes a re-analysis of the 2006’s data for the Trust in Teams and Trust in Leaders Scales, specifically reviewing item selection in order to provide a more robust basis for future scale work with these measures. To that end, we now turn to a review of the analytic approaches that informed our way ahead for our data analysis strategy.
1.2 Analytical Approaches to Psychometric Development
One can use various approaches to evaluate the quality of generated items and eliminate those proving to be inadequate. These procedures are not mutually exclusive, and, in fact, Wegener and Fabrigar (2004) recommend that one uses some combination of approaches. Most appropriate with respect to the current data are item descriptive statistics, item-total correlations, and factor analysis.
For example, one would discard those items with mean ratings near the endpoints of the rating scale (or little variance), as they are unlikely to differentiate among individuals. Similarly, one would remove those items that fail to show a sizable correlation (.30 in the expected direction; Nunnally & Bernstein, 1994) with the total or corrected total scale score (i.e., the total score except for the item of interest), as they do not distinguish between low and high scorers on the scale.
Exploratory factor analysis (EFA) is extremely useful for constructing measures (Wegener & Fabrigar, 2004). First, an EFA indicates how many latent variables (or factors) account for the correlations among manifest variables (or items). Second, it also provides information with respect to the magnitude and direction of relationships of the factors with each item (i.e., factor loadings), which also allows for the identification of faulty items. Furthermore, when one uses oblique rotations, an EFA generates a matrix of correlations among the factors that indicates the extent to which factors are distinct from one another. Confirmatory factor analysis (CFA) has also become increasingly popular in developing measures (Wegener & Fabrigar, 2004). The same underlying mathematical model (i.e., the common factor model, which aims to represent the structure of correlations among items using a small set of factors; Fabrigar, Wegener, MacCallum, & Strahan, 1999) underlies both CFA and EFA, but CFA involves a somewhat different set of procedures. In general, EFA assumes one does not have precise a priori knowledge of the underlying structure of items, whereas CFA requires one to specify in advance how many factors exist and which

3 DRDC Toronto TR 2009-161
items these factors will (and will not) influence. Wegener and Fabrigar (2004) claim that, when selecting items, EFA is often the best procedure to use, “…because the items being examined are often newly constructed items whose properties are not well established.” (p. 154). For example, one could use EFA to identify problems and complexities within the set of items, whereas CFA confirms whether one has specified the model correctly. Note that it is possible to conduct the same sorts of tests and statistical comparisons of models that differ in their number of factors in EFA and CFA, because of their common statistical origin. EFA can also verify not only that an item loads on the factor it is intended to load on, but also that it does not load on factors it should not load on (i.e., one can examine possible cross-factor loadings in a much less awkward manner than one does in CFA). In summary, Wegener and Fabrigar (2004) argue for the use of EFA when initially selecting items and replicating the factor structure of a new measure in similar or different populations. One should then use CFA in subsequent studies to provide more precise tests of the underlying structure of the measure (i.e., tests of hypotheses). Once one has established that EFA is the most appropriate form of analysis to conduct, one must choose a procedure to fit the common factor model to the data (Fabrigar et al., 1999). The most widely-used model-fitting methods include Maximum Likelihood (ML) and iterative principal factors. The main advantage of ML is that it allows for the computation of a number of indices of the model’s fit, statistical significance testing of factor loadings and correlations among factors, and the calculation of confidence intervals for these parameters. However, its primary drawback lies in its assumption of multivariate normality; using this procedure in the presence of severe non-normality (i.e., skewness > 2; kurtosis > 7; West, Finch, & Curran, 1995) may lead to misleading results. Fabrigar et al. (1999) encourage the use of descriptive indices of fit such as the Root Mean Square Error of Approximation (RMSEA; Browne & Cudeck, 1993) in ML factor analysis. One can obtain a sequence of ML solutions for a range of number of factors and then assess the fit of these models using the RMSEA and other fit measures, choosing the number of factors that provides optimal fit to the data without overfitting (Preacher & MacCallum, 2003). RMSEA values less than .05 indicate a good fit to the data, values between .05 and .08, an acceptable fit, values between .08 and .10, a marginal fit, and values greater than .10, a poor fit (Browne & Cudeck). In order to arrive at the solution with the best “simple structure” (i.e., the most easily interpretable, replicable, and meaningful structure), the factors need be rotated in multidimensional space. Fabrigar et al. (1999) espouse the clear advantages of an oblique rotation (i.e., permitting correlations among factors) over an orthogonal one (i.e., constraining factors to be uncorrelated) and see little reason for using the latter as the basis for interpretation. They suggest that one then carefully examines the rotated solution for the suggested model to validate its interpretability and plausibility. Note that, at the item level, factor loadings greater than or equal to |.35| typically indicate a salient loading (Clark & Watson, 1995). Good candidate items are those that have a salient loading on their a priori assigned factor and minimal loadings on other factors, whereas bad items are those that load weakly on the hypothesized factor or cross-load on one or more factors (Simms & Watson, 2007). Based on this literature, in the current research, we adopt the following analytic strategy. We begin by obtaining a sequence of obliquely rotated ML solutions for three, four (the hypothesized model), and five factors. We then assess the fit of these models using the RMSEA, choosing the

DRDC Toronto TR 2009-161 4
solution providing the best fit to the data while maintaining parsimony, interpretability, and plausibility from a theoretical perspective. We also examine item descriptive statistics and item-total correlations in order to choose the items with optimal properties. As well, we plan to consider each item’s representation and coverage of the content domain of interest, relevance and meaningfulness to the target population, wording/readability, and face validity.

5 DRDC Toronto TR 2009-161
2 Method
2.1 Participants Two hundred and twenty Canadian Forces (CF) military personnel served as participants in this research, 140 of them responded as team members, and 80, as team leaders. The majority of them were males (95%) serving in the combat arms (76%), 17-36 years of age (82%), had completed high school or some university or college (72%), and spoke English as their first language (96%). All of them confirmed they were currently members of a small team, with 99% reporting their team had a leader. Although 29% of participants reported more than seven team personnel changes during the previous year, the majority indicated they knew about 60% of their teammates well in a work context. Sixty-nine percent of participants mentioned completing between one and four field exercises with a previous military team. However, most of them (89%) reported having had no operational experience with their current teams.
2.2 Measures
2.2.1 Trust in teams.
Adams and Sartori (2006) included 40 items to reflect the four major dimensions of trust in teams, namely Benevolence, Competence, Integrity, and Predictability. Participants rated all 40 items on 7-point Likert-type scales ranging from Completely Disagree to Completely Agree.
2.2.2 Trust in leader.
Similarly, Adams and Sartori (2006) included 40 items that reflected the four major dimensions of trust in leader, namely Benevolence, Competence, Integrity, and Predictability. Participants rated all 40 items on 7-point Likert-type scales ranging from Completely Disagree to Completely Agree.
2.3 Procedure
Military personnel attended testing sessions in groups of 50 or 60, with each session lasting approximately 1 hour. A research assistant briefed them concerning the purpose of the study and the anonymity of their responses. They completed an informed consent and the survey packages at separate desks in the testing room. The research assistant encouraged them to distribute themselves randomly throughout the room to lessen the likelihood teammates were adjacent to each other. As well, team members and leaders completed the package in separate rooms to ensure members did not rate their leaders while in the same room. The Human Research Ethics Committee of DRDC reviewed and approved all study materials and procedures.

DRDC Toronto TR 2009-161 6
3 Results
3.1 Trust in Teams
3.1.1 Exploratory Factor Analyses As proposed above, we conducted three-, four-, and five-factor EFA on the 40 initial items (i.e., 7 Benevolence, 16 Competence, 9 Integrity, and 8 Predictability items; Adams & Sartori, 2006) with Comprehensive Exploratory Factor Analysis (CEFA; Browne, Cudeck, Tateneni, & Mels, 1998). As discussed previously, we selected an oblique (i.e., direct oblimin) rotation following a ML extraction method.1 We report the likelihood ratio statistic and the RMSEA and its 90% confidence interval (CI) as indices of goodness-of-fit of the model to the data.2 Three-factor model The RMSEA (90% CI) associated with the three-factor model indicated an acceptable fit to the data, .076 (.071; .081), χ2 (663) = 1500.95. The factor inter-correlations, all positive and significant, ranged from .61 to .76. None of the 90% CIs around the factor inter-correlations contained a value of 1, which offers support for the discriminant validity (i.e., conceptual distinctiveness) between the constructs. Four-factor model As well, the RMSEA (90% CI) for the four-factor model suggested an acceptable fit to the data, .069 (.064; .075), χ2 (626) = 1283.15, albeit superior to that of the three-factor model (the 90% CIs around the RMSEA values only overlap slightly). The factor inter-correlations, all positive and significant, ranged from .44 to .73. Again, none of the 90% CIs around the factor inter-correlations contained a value of 1.
Five-factor model Lastly, the RMSEA (90% CI) for the five-factor model also showed an acceptable fit to the data, .067 (.062; .073), χ2(590) = 1174.36. The factor inter-correlations, all positive and significant, ranged from .42 to .68, and none of the 90% CIs around the factor inter-correlations contained a value of 1.
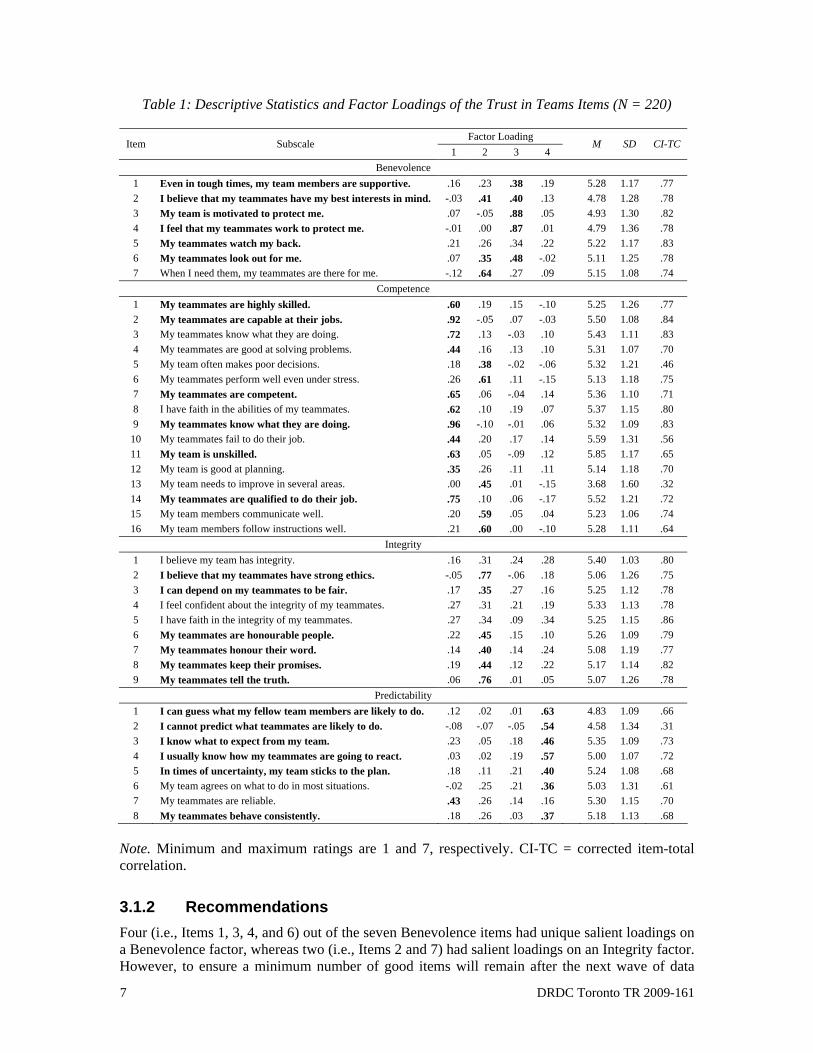
Based on its parsimony, interpretability, and plausibility from a theoretical perspective, we chose a four- over a five-factor model of trust in teams. We show its factor loadings as well as the descriptive statistics for each of the 40 items in Table 1. Note that most of the corrected item-total correlations, computed on the basis of the initial 40 items and their assignment to their respective a priori defined sub-scales, were much greater than .30, indicative of narrow constructs, that is, constructs that are narrowly conceptualized or defined. This was not entirely surprising given the specificity of the constructs under study and level of detail of the scale items. 1 Prior to running the EFAs, we assessed the skewness and kurtosis values of each item and found them to be lower than the respective cut-offs of |2.0| and |7.0| suggested by West, Finch, and Curran (1995) as indicative of severe non-normality. 2 It is standard procedure to report the likelihood ratio statistic, but it is highly sensitive to sample size (Fabrigar et al., 1999); we used a significance level of .05 throughout.
7 DRDC Toronto TR 2009-161
Table 1: Descriptive Statistics and Factor Loadings of the Trust in Teams Items (N = 220)
Factor Loading Item Subscale
1 2 3 4 M SD CI-TC
Benevolence 1 Even in tough times, my team members are supportive. .16 .23 .38 .19 5.28 1.17 .77 2 I believe that my teammates have my best interests in mind. -.03 .41 .40 .13 4.78 1.28 .78 3 My team is motivated to protect me. .07 -.05 .88 .05 4.93 1.30 .82 4 I feel that my teammates work to protect me. -.01 .00 .87 .01 4.79 1.36 .78 5 My teammates watch my back. .21 .26 .34 .22 5.22 1.17 .83 6 My teammates look out for me. .07 .35 .48 -.02 5.11 1.25 .78 7 When I need them, my teammates are there for me. -.12 .64 .27 .09 5.15 1.08 .74
Competence 1 My teammates are highly skilled. .60 .19 .15 -.10 5.25 1.26 .77 2 My teammates are capable at their jobs. .92 -.05 .07 -.03 5.50 1.08 .84 3 My teammates know what they are doing. .72 .13 -.03 .10 5.43 1.11 .83 4 My teammates are good at solving problems. .44 .16 .13 .10 5.31 1.07 .70 5 My team often makes poor decisions. .18 .38 -.02 -.06 5.32 1.21 .46 6 My teammates perform well even under stress. .26 .61 .11 -.15 5.13 1.18 .75 7 My teammates are competent. .65 .06 -.04 .14 5.36 1.10 .71 8 I have faith in the abilities of my teammates. .62 .10 .19 .07 5.37 1.15 .80 9 My teammates know what they are doing. .96 -.10 -.01 .06 5.32 1.09 .83
10 My teammates fail to do their job. .44 .20 .17 .14 5.59 1.31 .56 11 My team is unskilled. .63 .05 -.09 .12 5.85 1.17 .65 12 My team is good at planning. .35 .26 .11 .11 5.14 1.18 .70 13 My team needs to improve in several areas. .00 .45 .01 -.15 3.68 1.60 .32 14 My teammates are qualified to do their job. .75 .10 .06 -.17 5.52 1.21 .72 15 My team members communicate well. .20 .59 .05 .04 5.23 1.06 .74 16 My team members follow instructions well. .21 .60 .00 -.10 5.28 1.11 .64
Integrity 1 I believe my team has integrity. .16 .31 .24 .28 5.40 1.03 .80 2 I believe that my teammates have strong ethics. -.05 .77 -.06 .18 5.06 1.26 .75 3 I can depend on my teammates to be fair. .17 .35 .27 .16 5.25 1.12 .78 4 I feel confident about the integrity of my teammates. .27 .31 .21 .19 5.33 1.13 .78 5 I have faith in the integrity of my teammates. .27 .34 .09 .34 5.25 1.15 .86 6 My teammates are honourable people. .22 .45 .15 .10 5.26 1.09 .79 7 My teammates honour their word. .14 .40 .14 .24 5.08 1.19 .77 8 My teammates keep their promises. .19 .44 .12 .22 5.17 1.14 .82 9 My teammates tell the truth. .06 .76 .01 .05 5.07 1.26 .78
Predictability 1 I can guess what my fellow team members are likely to do. .12 .02 .01 .63 4.83 1.09 .66 2 I cannot predict what teammates are likely to do. -.08 -.07 -.05 .54 4.58 1.34 .31 3 I know what to expect from my team. .23 .05 .18 .46 5.35 1.09 .73 4 I usually know how my teammates are going to react. .03 .02 .19 .57 5.00 1.07 .72 5 In times of uncertainty, my team sticks to the plan. .18 .11 .21 .40 5.24 1.08 .68 6 My team agrees on what to do in most situations. -.02 .25 .21 .36 5.03 1.31 .61 7 My teammates are reliable. .43 .26 .14 .16 5.30 1.15 .70 8 My teammates behave consistently. .18 .26 .03 .37 5.18 1.13 .68
Note. Minimum and maximum ratings are 1 and 7, respectively. CI-TC = corrected item-total correlation.
3.1.2 Recommendations Four (i.e., Items 1, 3, 4, and 6) out of the seven Benevolence items had unique salient loadings on a Benevolence factor, whereas two (i.e., Items 2 and 7) had salient loadings on an Integrity factor. However, to ensure a minimum number of good items will remain after the next wave of data
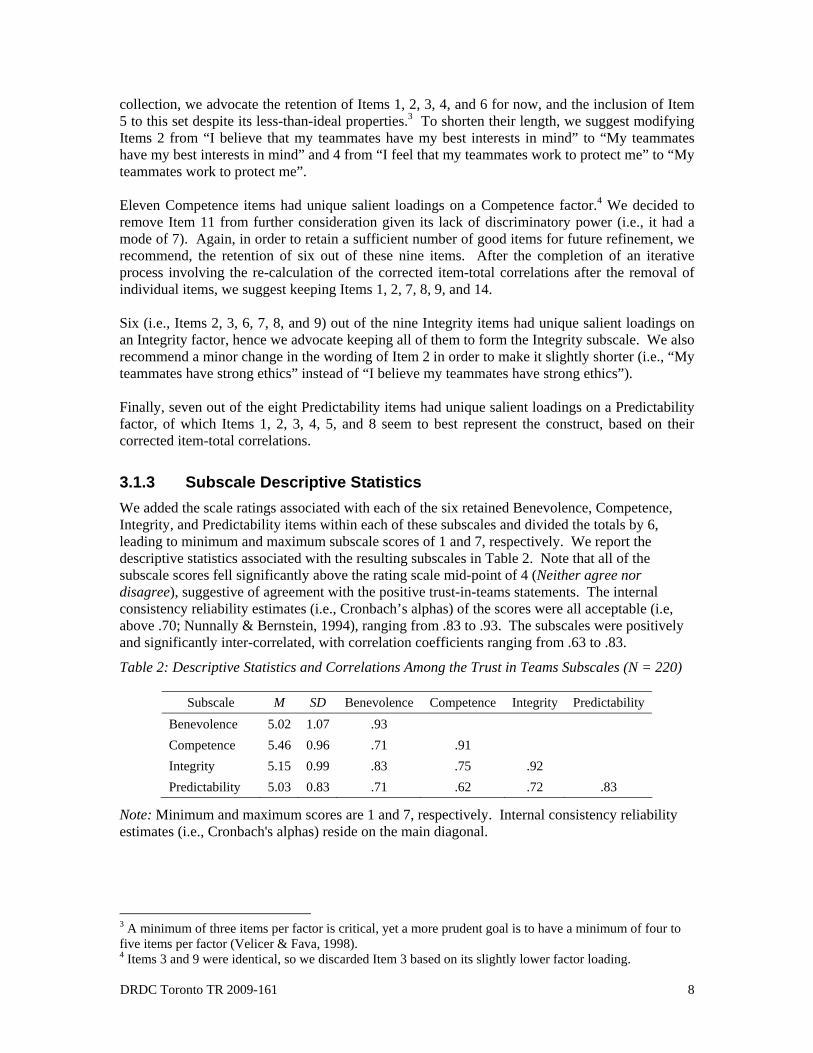
DRDC Toronto TR 2009-161 8
collection, we advocate the retention of Items 1, 2, 3, 4, and 6 for now, and the inclusion of Item 5 to this set despite its less-than-ideal properties.3 To shorten their length, we suggest modifying Items 2 from “I believe that my teammates have my best interests in mind” to “My teammates have my best interests in mind” and 4 from “I feel that my teammates work to protect me” to “My teammates work to protect me”. Eleven Competence items had unique salient loadings on a Competence factor.4 We decided to remove Item 11 from further consideration given its lack of discriminatory power (i.e., it had a mode of 7). Again, in order to retain a sufficient number of good items for future refinement, we recommend, the retention of six out of these nine items. After the completion of an iterative process involving the re-calculation of the corrected item-total correlations after the removal of individual items, we suggest keeping Items 1, 2, 7, 8, 9, and 14.
Six (i.e., Items 2, 3, 6, 7, 8, and 9) out of the nine Integrity items had unique salient loadings on an Integrity factor, hence we advocate keeping all of them to form the Integrity subscale. We also recommend a minor change in the wording of Item 2 in order to make it slightly shorter (i.e., “My teammates have strong ethics” instead of “I believe my teammates have strong ethics”). Finally, seven out of the eight Predictability items had unique salient loadings on a Predictability factor, of which Items 1, 2, 3, 4, 5, and 8 seem to best represent the construct, based on their corrected item-total correlations.
3.1.3 Subscale Descriptive Statistics We added the scale ratings associated with each of the six retained Benevolence, Competence, Integrity, and Predictability items within each of these subscales and divided the totals by 6, leading to minimum and maximum subscale scores of 1 and 7, respectively. We report the descriptive statistics associated with the resulting subscales in Table 2. Note that all of the subscale scores fell significantly above the rating scale mid-point of 4 (Neither agree nor disagree), suggestive of agreement with the positive trust-in-teams statements. The internal consistency reliability estimates (i.e., Cronbach’s alphas) of the scores were all acceptable (i.e, above .70; Nunnally & Bernstein, 1994), ranging from .83 to .93. The subscales were positively and significantly inter-correlated, with correlation coefficients ranging from .63 to .83.
Table 2: Descriptive Statistics and Correlations Among the Trust in Teams Subscales (N = 220)
Subscale M SD Benevolence Competence Integrity Predictability Benevolence 5.02 1.07 .93 Competence 5.46 0.96 .71 .91 Integrity 5.15 0.99 .83 .75 .92 Predictability 5.03 0.83 .71 .62 .72 .83
Note: Minimum and maximum scores are 1 and 7, respectively. Internal consistency reliability estimates (i.e., Cronbach's alphas) reside on the main diagonal.
3 A minimum of three items per factor is critical, yet a more prudent goal is to have a minimum of four to five items per factor (Velicer & Fava, 1998). 4 Items 3 and 9 were identical, so we discarded Item 3 based on its slightly lower factor loading.
9 DRDC Toronto TR 2009-161
3.2 Trust in Leaders
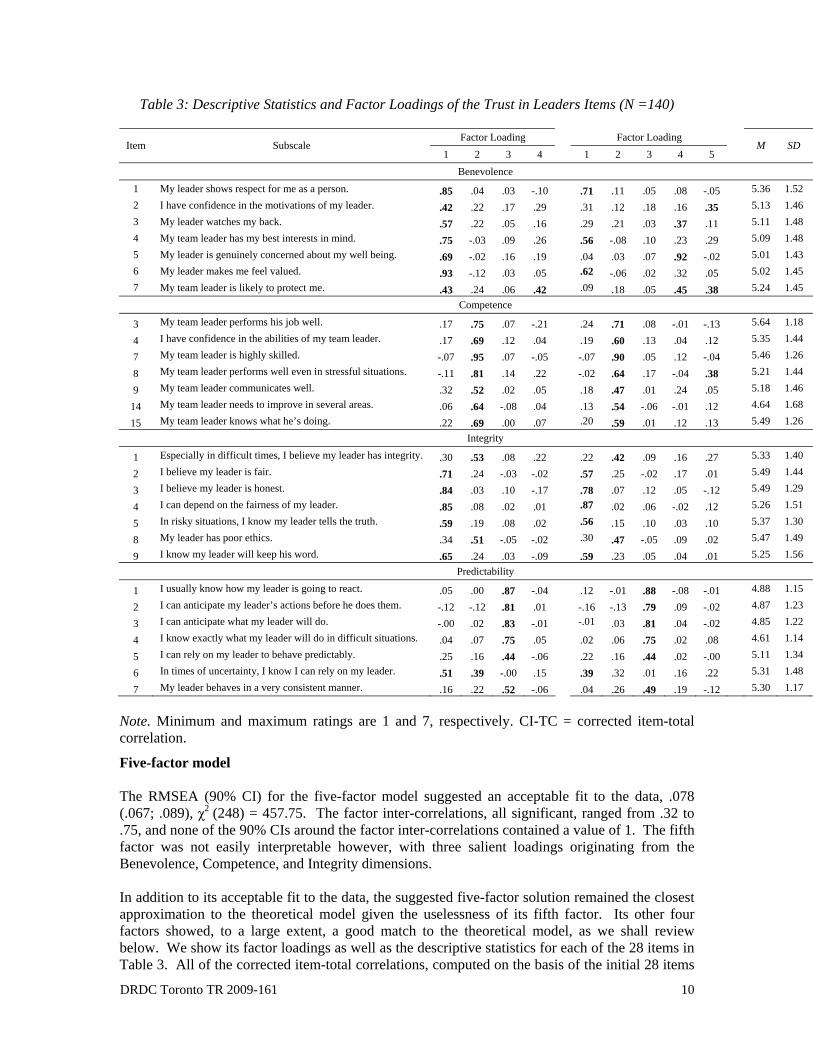
3.2.1 Initial Item Selection Again, building upon the work of Adams and Sartori (2006), who generated 40 items (i.e., 7 Benevolence, 16 Competence, 9 Integrity, and 7 Predictability items), we pared down the set of items and, in the end, kept 28 items, with 7 items per hypothesized construct. In doing so, our goal was to attain a participants-to-item ratio size of about 5:1 prior to conducting EFA (Gorsuch, 1983).5 To reach a manageable number of items on the Competence and Integrity factors, we first examined the item descriptive statistics and item-total correlations. As well, we considered each item’s representation and coverage of the content domain of interest, relevance and meaningfulness to the target population, wording/readability, and face validity. As far as the Integrity items were concerned, this initial item selection proved easy: we discarded two items (Items 7 and 8) that had modes of 7 and thus retained Items 1, 2, 3, 4, 5, 6, and 9. Two Competence items (Items 11 and 12) also had modes of 7, and so we did not consider them further. Finally, after completing an iterative process involving the re-calculation of the corrected item-total correlations after the removal of individual items, we suggest the retention of Items 3, 4, 5, 6, 7, 8, and 15 at this preliminary item selection stage. Note that the corrected item-total correlations, computed on the basis of the initial 16 Competence and 9 Integrity items and their assignment to their respective a priori defined sub-scales, were much greater than .30, again indicative of narrow constructs.
3.2.2 Exploratory Factor Analyses Again, we conducted three-, four-, and five-factor EFA on the 28 selected items with CEFA. We selected an oblique (i.e., direct oblimin) rotation following a ML extraction method.6 Three-factor model The RMSEA (90% CI) associated with the three-factor model was indicative of a marginal fit to the data, .095 (.085; .104), χ2 (297) = 666.42. The factor inter-correlations, all significant, ranged from .51 to .81. None of the 90% CIs around the factor inter-correlations contained a value of 1, which offers support for the discriminant validity between the constructs. Four-factor model The RMSEA (90% CI) associated with the four-factor model also suggested a marginal fit to the data, .085 (.075; .095), χ2 (272) = 546.13. The factor inter-correlations, all significant, ranged from .23 to .81. Again, none of the 90% CIs around the factor inter-correlations contained a value of 1. Interestingly, the fourth factor was not meaningful at all, with only one salient loading. 5 Authors such as MacCallum, Widaman, Zhang, and Hong (1999), however, have argued that strict rules regarding sample size for exploratory factor analysis should be abandoned, given that the nature of the data partly determines adequate sample size. 6 We assessed the skewness and kurtosis values of each item and found them to be lower than the recommended cut-offs of |2.0| and |7.0|.
DRDC Toronto TR 2009-161 10
Table 3: Descriptive Statistics and Factor Loadings of the Trust in Leaders Items (N =140)
Factor Loading Factor Loading Item Subscale
1 2 3 4 1 2 3 4 5 M SD
Benevolence 1 My leader shows respect for me as a person. .85 .04 .03 -.10 .71 .11 .05 .08 -.05 5.36 1.52 2 I have confidence in the motivations of my leader. .42 .22 .17 .29 .31 .12 .18 .16 .35 5.13 1.46 3 My leader watches my back. .57 .22 .05 .16 .29 .21 .03 .37 .11 5.11 1.48 4 My team leader has my best interests in mind. .75 -.03 .09 .26 .56 -.08 .10 .23 .29 5.09 1.48 5 My leader is genuinely concerned about my well being. .69 -.02 .16 .19 .04 .03 .07 .92 -.02 5.01 1.43 6 My leader makes me feel valued. .93 -.12 .03 .05 .62 -.06 .02 .32 .05 5.02 1.45 7 My team leader is likely to protect me. .43 .24 .06 .42 .09 .18 .05 .45 .38 5.24 1.45
Competence
3 My team leader performs his job well. .17 .75 .07 -.21 .24 .71 .08 -.01 -.13 5.64 1.18
4 I have confidence in the abilities of my team leader. .17 .69 .12 .04 .19 .60 .13 .04 .12 5.35 1.44
7 My team leader is highly skilled. -.07 .95 .07 -.05 -.07 .90 .05 .12 -.04 5.46 1.26
8 My team leader performs well even in stressful situations. -.11 .81 .14 .22 -.02 .64 .17 -.04 .38 5.21 1.44
9 My team leader communicates well. .32 .52 .02 .05 .18 .47 .01 .24 .05 5.18 1.46
14 My team leader needs to improve in several areas. .06 .64 -.08 .04 .13 .54 -.06 -.01 .12 4.64 1.68
15 My team leader knows what he’s doing. .22 .69 .00 .07 .20 .59 .01 .12 .13 5.49 1.26 Integrity
1 Especially in difficult times, I believe my leader has integrity. .30 .53 .08 .22 .22 .42 .09 .16 .27 5.33 1.40
2 I believe my leader is fair. .71 .24 -.03 -.02 .57 .25 -.02 .17 .01 5.49 1.44
3 I believe my leader is honest. .84 .03 .10 -.17 .78 .07 .12 .05 -.12 5.49 1.29
4 I can depend on the fairness of my leader. .85 .08 .02 .01 .87 .02 .06 -.02 .12 5.26 1.51
5 In risky situations, I know my leader tells the truth. .59 .19 .08 .02 .56 .15 .10 .03 .10 5.37 1.30
8 My leader has poor ethics. .34 .51 -.05 -.02 .30 .47 -.05 .09 .02 5.47 1.49
9 I know my leader will keep his word. .65 .24 .03 -.09 .59 .23 .05 .04 .01 5.25 1.56 Predictability
1 I usually know how my leader is going to react. .05 .00 .87 -.04 .12 -.01 .88 -.08 -.01 4.88 1.15
2 I can anticipate my leader’s actions before he does them. -.12 -.12 .81 .01 -.16 -.13 .79 .09 -.02 4.87 1.23
3 I can anticipate what my leader will do. -.00 .02 .83 -.01 -.01 .03 .81 .04 -.02 4.85 1.22
4 I know exactly what my leader will do in difficult situations. .04 .07 .75 .05 .02 .06 .75 .02 .08 4.61 1.14
5 I can rely on my leader to behave predictably. .25 .16 .44 -.06 .22 .16 .44 .02 -.00 5.11 1.34
6 In times of uncertainty, I know I can rely on my leader. .51 .39 -.00 .15 .39 .32 .01 .16 .22 5.31 1.48
7 My leader behaves in a very consistent manner. .16 .22 .52 -.06 .04 .26 .49 .19 -.12 5.30 1.17
Note. Minimum and maximum ratings are 1 and 7, respectively. CI-TC = corrected item-total correlation.
Five-factor model The RMSEA (90% CI) for the five-factor model suggested an acceptable fit to the data, .078 (.067; .089), χ2 (248) = 457.75. The factor inter-correlations, all significant, ranged from .32 to .75, and none of the 90% CIs around the factor inter-correlations contained a value of 1. The fifth factor was not easily interpretable however, with three salient loadings originating from the Benevolence, Competence, and Integrity dimensions. In addition to its acceptable fit to the data, the suggested five-factor solution remained the closest approximation to the theoretical model given the uselessness of its fifth factor. Its other four factors showed, to a large extent, a good match to the theoretical model, as we shall review below. We show its factor loadings as well as the descriptive statistics for each of the 28 items in Table 3. All of the corrected item-total correlations, computed on the basis of the initial 28 items
11 DRDC Toronto TR 2009-161
and their assignment to their respective a priori defined sub-scales, were much greater than .30, suggestive of narrow constructs.
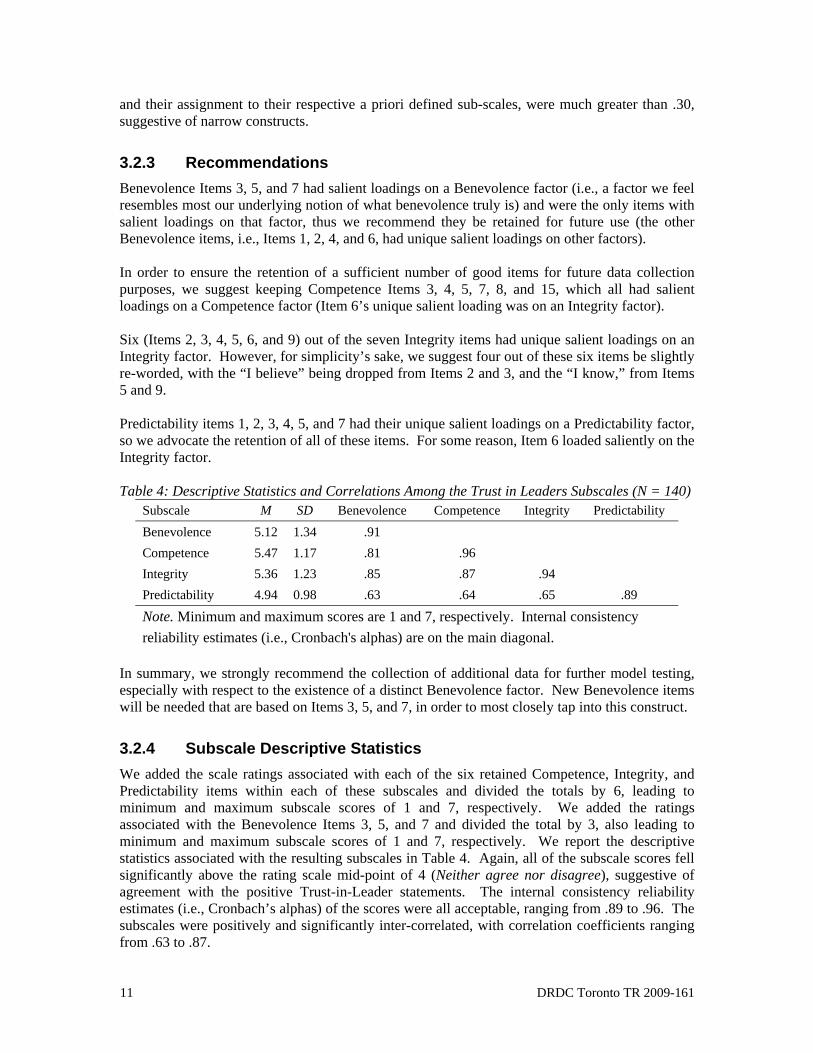
3.2.3 Recommendations Benevolence Items 3, 5, and 7 had salient loadings on a Benevolence factor (i.e., a factor we feel resembles most our underlying notion of what benevolence truly is) and were the only items with salient loadings on that factor, thus we recommend they be retained for future use (the other Benevolence items, i.e., Items 1, 2, 4, and 6, had unique salient loadings on other factors). In order to ensure the retention of a sufficient number of good items for future data collection purposes, we suggest keeping Competence Items 3, 4, 5, 7, 8, and 15, which all had salient loadings on a Competence factor (Item 6’s unique salient loading was on an Integrity factor). Six (Items 2, 3, 4, 5, 6, and 9) out of the seven Integrity items had unique salient loadings on an Integrity factor. However, for simplicity’s sake, we suggest four out of these six items be slightly re-worded, with the “I believe” being dropped from Items 2 and 3, and the “I know,” from Items 5 and 9. Predictability items 1, 2, 3, 4, 5, and 7 had their unique salient loadings on a Predictability factor, so we advocate the retention of all of these items. For some reason, Item 6 loaded saliently on the Integrity factor. Table 4: Descriptive Statistics and Correlations Among the Trust in Leaders Subscales (N = 140)
Subscale M SD Benevolence Competence Integrity Predictability Benevolence 5.12 1.34 .91 Competence 5.47 1.17 .81 .96 Integrity 5.36 1.23 .85 .87 .94 Predictability 4.94 0.98 .63 .64 .65 .89
Note. Minimum and maximum scores are 1 and 7, respectively. Internal consistency reliability estimates (i.e., Cronbach's alphas) are on the main diagonal.
In summary, we strongly recommend the collection of additional data for further model testing, especially with respect to the existence of a distinct Benevolence factor. New Benevolence items will be needed that are based on Items 3, 5, and 7, in order to most closely tap into this construct.
3.2.4 Subscale Descriptive Statistics We added the scale ratings associated with each of the six retained Competence, Integrity, and Predictability items within each of these subscales and divided the totals by 6, leading to minimum and maximum subscale scores of 1 and 7, respectively. We added the ratings associated with the Benevolence Items 3, 5, and 7 and divided the total by 3, also leading to minimum and maximum subscale scores of 1 and 7, respectively. We report the descriptive statistics associated with the resulting subscales in Table 4. Again, all of the subscale scores fell significantly above the rating scale mid-point of 4 (Neither agree nor disagree), suggestive of agreement with the positive Trust-in-Leader statements. The internal consistency reliability estimates (i.e., Cronbach’s alphas) of the scores were all acceptable, ranging from .89 to .96. The subscales were positively and significantly inter-correlated, with correlation coefficients ranging from .63 to .87.
DRDC Toronto TR 2009-161 12
4 Discussion
We undertook this study to provide psychometric review, analysis and scale item refinement for initial measures developed to tap trust in teams and in leader in small military units, such as infantry sections. Based on a review of the relevant literature concerning analytic approaches applicable to scale development efforts, our strategy for review and initial item reduction included testing alternative conceptual models of trust (i.e., three-, four- and five-factor models) and applying these to the current data set. Item reduction kept these results in mind but also balanced additional considerations such as retaining wording/readability (i.e., we slightly modified/shortened the wording of a few items) and internal consistency. The reduced, revised scales then underwent reliability and descriptive analyses in order to determine the internal consistency of the revised subscales at this stage of development.
With respect to the Trust in Teams Scale, although the three-, four- and five-factor models produced acceptable fit indices, the four-factor model was both the most parsimonious and interpretable model. Based on the current analyses, and in preparation for a future scale refinement work, we recommend retaining six items for the Competency, Integrity, and Predictability subscales. The Benevolence items proved more problematic with only four of seven loading exclusively on a Benevolence factor. Nonetheless, based on the current data, we recommended the retention of six items at this point, albeit two were less than ideal and will require further revision. Lastly, in some cases, we also suggested some minor wording changes. Reliability analyses of the reduced six-item versions of each of the four subscales produced good reliability estimates of the scores and, consistent with our conceptual model, the subscales were positively and significantly inter-correlated. In Appendix A, we present the Trust in Teams Scale in its current format. The results of a similar analytic strategy applied to the 40 initial Trust in Leaders scale items first led to the retention of 28 of the items, with 7 items per hypothesized construct (i.e., Benevolence, Competence, Predictability, and Integrity). Specifically, the five-factor model produced an acceptable fit to the data (with its fifth factor being essentially meaningless, which led to four interpretable factors), while the three- and four-factor models provided only a marginal fit. The Competence, Integrity, and Predictability items produced, for the most part, unique and salient loadings on their expected factors. However, the Benevolence subscale results were problematic for the Trust in Leaders Scale as well. Thus, at this point, the suggestion for the Benevolence scale is the retention of the three items that loaded saliently on the intended factor, with revision and development of additional items in the next iteration of the measure. Despite the weaknesses associated with the dimensionality of this subscale, the internal consistency reliability estimates of the scores were all good, and the subscales were positively and significantly inter-correlated, as expected. In Appendix B, we present the Trust in Leaders Scale in its current format.
4.1 The Way Ahead The next step will undoubtedly be to write additional items to replace those that proved to be problematic here and replicate the current findings in terms of the dimensionality of the scales (preferably in agreement with the theoretical four-factor models of trust), leading to the retention of the best items tapping into the four dimensions of trust. Although we should again employ exploratory factor analysis at that point, as the scales will still be under construction, our longer-term objective will be to demonstrate the robustness of the theoretical models via confirmatory factor analysis. For now, however, we urge researchers to use the scales as presented in this report, as they possess acceptable psychometric properties in their current state.

13 DRDC Toronto TR 2009-161
In the longer term, it will be important to validate the scales utilizing incremental (Hunsley & Meyer, 2003) and multi-trait-multi-method approaches (Kenny, 1995) to explore their construct validity. Further work should also investigate their predictive validity using a longitudinal methodology. Down the road, additional work with an independent sample from a different context (e.g., a military sample from a different nation) would be of value. As a final note, while the current measures were created to meaningfully reflect the kind of interactions required by small units (i.e., team members and leaders) within the Land Force, we believe that the measures could also be of use in other small team contexts, for instance with crews of larger aircraft, surveillance teams, as well as sensor or warfare teams on warships. Indeed, the current measures contain relatively context free instantiations of the core features of trust. Thus, the measures may well also be applied non-military teams in which risk, vulnerability, uncertainty, and therefore, trust are also likely to be an issue, such as emergency services crews (e.g., ambulance, firefighting teams), and teams within organizations (e.g., management teams, product development teams).
.

DRDC Toronto TR 2009-161 14
References .....
Adams, B.D., Lora E., Bruyn, L.E., & Greg Chung-Yan, G. (2004). Creating a Measure of Trust in Small Military Teams. DRDC Toronto No. CR-2004-077, Defence Research & Development, Toronto, ON.
Adams, B.D. & Sartori, J. (2006). Validating the Trust in Teams and Trust in Leaders Scales.
DRDC No. CR-2006-008, Defence Research & Development, Toronto, ON. Adams, B.D., & Webb, R.D.G. (2003). Model of Trust Development in Small Teams. DRDC No.
CR-2003-016: Defence Research & Development, Toronto, ON. Browne, M.W., & Cudeck, R. (1993). Alternative ways of assessing model fit. In K.A. Bollen &
J.S. Long (Eds.), Testing structural equation models (pp. 45-55). Newbury Park, CA: Sage.
Browne, M.W., Cudeck, R., Tateneni, K., & Mels, G. (1998). CEFA: Comprehensive Exploratory Factor Analysis [Document and computer software]. Available http://quantrm2.psy.ohio-state.edu/browne/software.htm.
Cassel, R. (1993). Building trust in Air Force leadership. Psychology: A Journal of Human
Behavior, 30, 4-15.
Clark, L.A., & Watson, D. (1995). Constructing validity: Basic issues in scale development. Psychological Assessment, 7, 309-319.
Costa, A.C., Roe, R.A., & Tailleau, T. (2001). Trust within teams: The relation with performance
effectiveness. European Journal of Work and Organizational Psychology, 10, 225-244. Cox, A. (1996). Unit cohesion and morale in combat: Survival in a culturally and racially
heterogeneous environment. United States Army Command and General Staff College, Fort Leavenworth, KS.
Deluga, R.J. (1995). The relation between trust in supervisor and subordinate citizenship
behavior. Military Psychology, 7, 1-16. Fabrigar, L.R., Wegener, D.T., MacCallum, R.C., & Strahan, E.J. (1999). Evaluating the use of
exploratory factor analysis in psychological research. Psychological Methods, 4, 272-299.
Gorsuch, R.L. (1983). Factor Analysis (2nd Ed.). Hillsdale, NJ: Erlbaum. Hunsley, J., & Meyer, G.L. (2003). The incremental validity of psychological testing and
assessment conceptual, methodological, and statistical issues. Psychological Assessment, 15, 446-455.
Ivy, L. (1995). A study in leadership: The 761st Tank Battalion and the 92nd Division in World
War II. United States Army Command and General Staff College, Fort Leavenworth, KS. Kenny, D.A. (1995). The multitrait–multimethod matrix: Design, analysis, and conceptual issues.
In P. Shrout & S. Fiske (Eds.), Personality Research, Methods, and Theory: A Festschrift Honoring Donald W. Fiske (pp. 111–124). Mahwah, NJ: Erlbaum.
15 DRDC Toronto TR 2009-161
MacCallum, R.C., Widaman, K.F., Zhang, S., & Hong, S. (1999). Sample size in factor analysis. Psychological Methods, 4, 84-99.
Nunnally, J., & Bernstein, I. (1994). Psychometric Theory (3rd Ed.). NY: McGraw Hill. Preacher, K.J., & MacCallum, R.C. (2003). Repairing Tom Swift’s electric factor analysis
machine. Understanding Statistics, 2, 13-43. Rotter, J.B. (1967). A new scale for the measurement of interpersonal trust. Journal of
Personality, 35, 651-665.
Rousseau, M., Sitkin, S., Burt R., & Camerer, C. (1998). Not so different after all: a cross-discipline view of trust. Academy of Management Review, 23, 393–404.
Scull, K. (1990). Cohesion: What we learned from COHORT. United States Army War College,
Carlisle Barracks, PA. Shamir, B., Brainin, E., Zakay, E., & Popper, M. (2000). Perceived combat readiness as collective
efficacy: Individual- and group-level analysis. Military Psychology, 12, 105-119. Shamir, B., & Lapidot, Y. (2003). Trust in organizational superiors: Systemic and collective
considerations. Organization Studies, 24, 463-491. Simms, L.J., & Watson, D. (2007). The construct validation approach to personality scale
construction. In R. Robins, C. Fraley, & R. Krueger (Eds.), Handbook of Research Methods in Personality Psychology (pp. 240-258). NY: Guilford Press.
Thomas, K, & Barios-Choplin, B. (1996). Effective leadership in TPU’s: Findings from
Interviews in 16 units. Naval Postgraduate School, Monterey, CA. Van der Kloet, I., Soeters, J.L., & Sanders, K. (2004). Development of trust among soldiers on a
deployment mission. Small Wars & Insurgencies, http://www.informaworld.com/smpp/title~content=t713636778~db=all~tab=issueslist~branches=15 - v1515, 131 – 157.
Velicer, W.F., & Fava, J.L. (1998). The effects of variable and subject sampling on factor pattern
recovery. Psychological Methods, 3, 231-251.
Wegener, D.T., & Fabrigar, L.R. (2004). Constructing and evaluating quantitative measures for social Psychological research: Conceptual challenges and methodological solutions. In Sansone, C. (Ed.), The Sage Handbook of Methods in Social Psychology (pp. 145-172). Newbury Park, CA: Sage.
West, S.G., Finch, J.F., & Curran, P.J. (1995). Structural equation models with non-normal
variables: Problems and remedies. In R. Hoyle (Ed.), Structural Equation Modeling: Concepts, Issues and Applications (pp. 56-75). Newbury Park, CA: Sage.

DRDC Toronto TR 2009-161 16

17 DRDC Toronto TR 2009-161
Annex A Appendices
A.1 Appendix A
Trust in Teams
Using the rating scale provided below, indicate the extent to which you agree with the following statements with respect to your current section or team:
1 = Strongly disagree
2 = Disagree
3 = Somewhat disagree
4 = Neither agree nor disagree
5 = Somewhat agree
6 = Agree
7 = Strongly agree
1. My teammates watch my back. (B)
2. My teammates honour their word. (I)
3. My teammates look out for me. (B)
4. I have faith in the abilities of my teammates. (C)
5. My teammates work to protect me. (B)
6. I can depend on my teammates to be fair. (I)
7. My teammates keep their promises. (I)
8. In times of uncertainty, my team sticks to the plan. (P)
9. Even in tough times, my team members are supportive. (B)
10. My teammates tell the truth. (I)
11. I usually know how my teammates are going to react. (P)
12. My teammates are competent. (C)
13. My teammates have strong ethics. (I)
14. My teammates are highly skilled. (C)

DRDC Toronto TR 2009-161 18
15. My teammates know what they are doing. (C)
16. I can guess what my fellow team members are likely to do. (P)
17. My team is motivated to protect me. (B)
18. I know what to expect from my team. (P)
19. My teammates have my best interests in mind. (B)
20. My teammates behave consistently. (P)
21. I cannot predict what teammates are likely to do. (P – reversed item)
22. My teammates are qualified to do their job. (C)
23. My teammates are capable at their jobs. (C)
24. My teammates are honourable people. (I)
B = Benevolence (i.e., to score, add all of the B items together and divide by 6, for a minimum and maximum of 1 and 7, respectively)
C = Competence (i.e., to score, add all of the C items together and divide by 6, for a minimum and maximum of 1 and 7, respectively)
I = Integrity (i.e., to score, add all of the I items together and divide by 6, for a minimum and maximum of 1 and 7, respectively)
P = Predictability (i.e., to score, add all of the P items together and divide by 6, for a minimum and maximum of 1 and 7, respectively; note that 21 is a reversed item)
A.2 Appendix B Trust in Leaders
Using the rating scale provided below, indicate the extent to which you agree with the following statements with respect to your current section or team:
1 = Strongly disagree
2 = Disagree
3 = Somewhat disagree
4 = Neither agree nor disagree
5 = Somewhat agree
6 = Agree
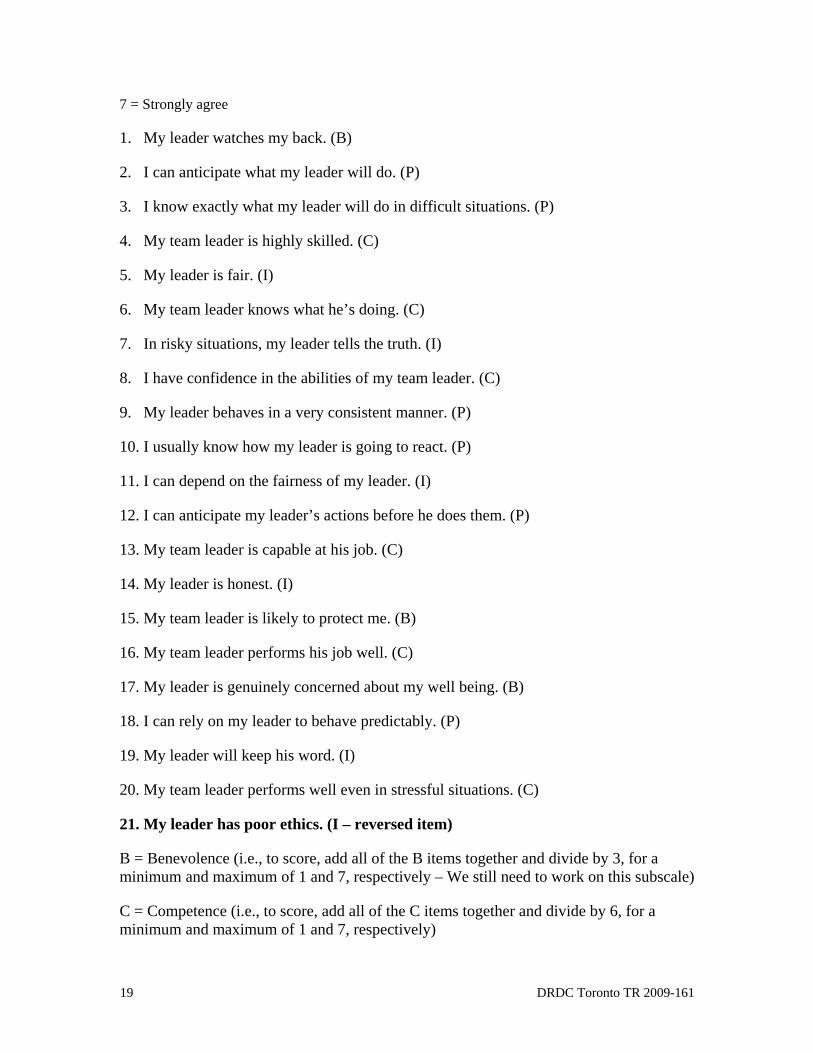
19 DRDC Toronto TR 2009-161
7 = Strongly agree
1. My leader watches my back. (B)
2. I can anticipate what my leader will do. (P)
3. I know exactly what my leader will do in difficult situations. (P)
4. My team leader is highly skilled. (C)
5. My leader is fair. (I)
6. My team leader knows what he’s doing. (C)
7. In risky situations, my leader tells the truth. (I)
8. I have confidence in the abilities of my team leader. (C)
9. My leader behaves in a very consistent manner. (P)
10. I usually know how my leader is going to react. (P)
11. I can depend on the fairness of my leader. (I)
12. I can anticipate my leader’s actions before he does them. (P)
13. My team leader is capable at his job. (C)
14. My leader is honest. (I)
15. My team leader is likely to protect me. (B)
16. My team leader performs his job well. (C)
17. My leader is genuinely concerned about my well being. (B)
18. I can rely on my leader to behave predictably. (P)
19. My leader will keep his word. (I)
20. My team leader performs well even in stressful situations. (C)
21. My leader has poor ethics. (I – reversed item)
B = Benevolence (i.e., to score, add all of the B items together and divide by 3, for a minimum and maximum of 1 and 7, respectively – We still need to work on this subscale)
C = Competence (i.e., to score, add all of the C items together and divide by 6, for a minimum and maximum of 1 and 7, respectively)
DRDC Toronto TR 2009-161 20
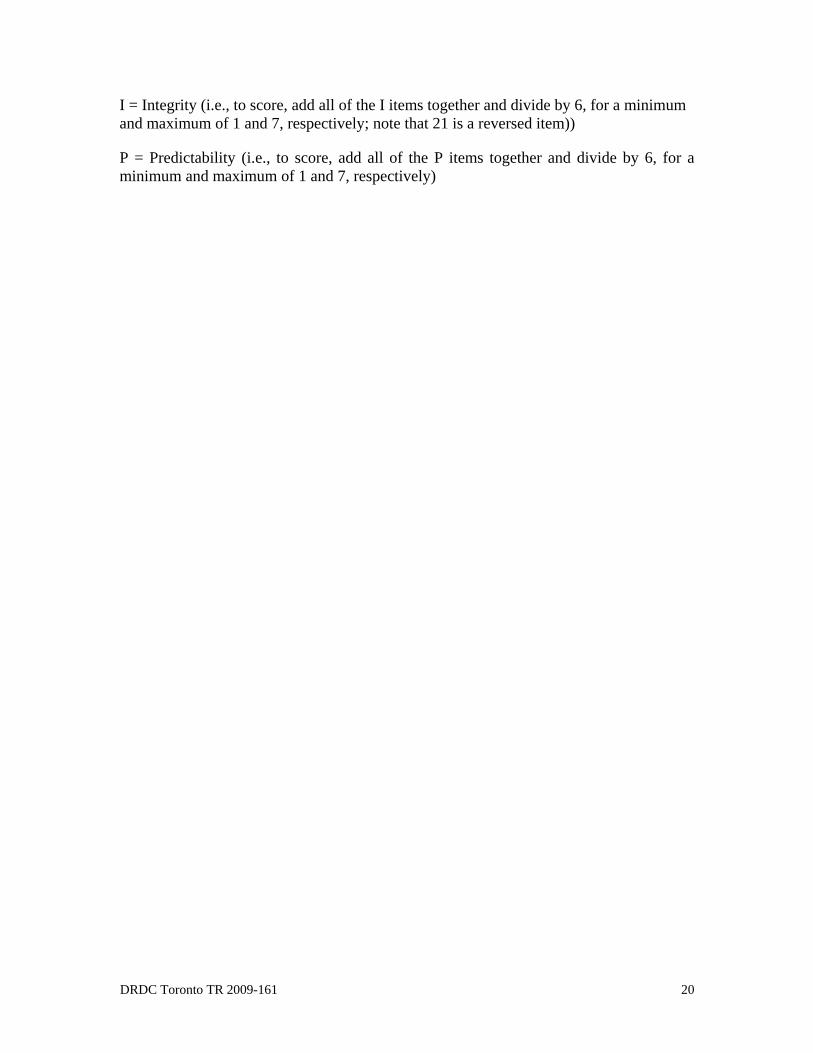
I = Integrity (i.e., to score, add all of the I items together and divide by 6, for a minimum and maximum of 1 and 7, respectively; note that 21 is a reversed item))
P = Predictability (i.e., to score, add all of the P items together and divide by 6, for a minimum and maximum of 1 and 7, respectively)
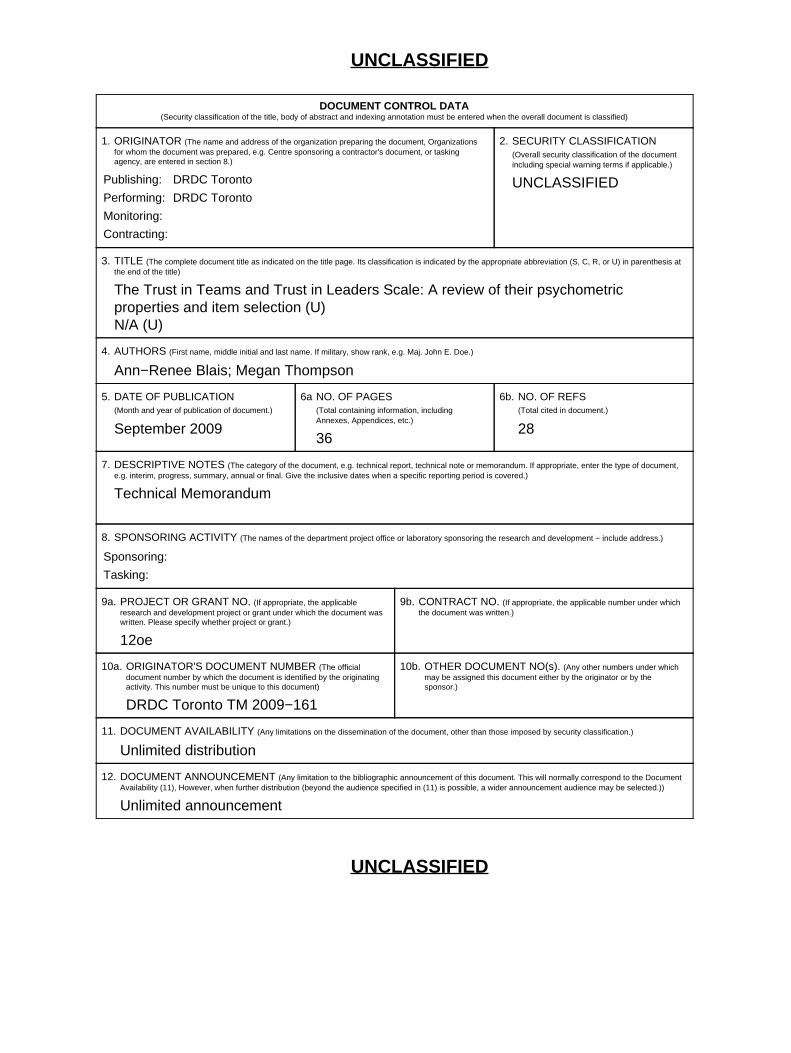
UNCLASSIFIED
DOCUMENT CONTROL DATA(Security classification of the title, body of abstract and indexing annotation must be entered when the overall document is classified)
1. ORIGINATOR (The name and address of the organization preparing the document, Organizationsfor whom the document was prepared, e.g. Centre sponsoring a contractor's document, or taskingagency, are entered in section 8.)
Publishing: DRDC Toronto
Performing: DRDC Toronto
Monitoring:
Contracting:
2. SECURITY CLASSIFICATION(Overall security classification of the documentincluding special warning terms if applicable.)
UNCLASSIFIED
3. TITLE (The complete document title as indicated on the title page. Its classification is indicated by the appropriate abbreviation (S, C, R, or U) in parenthesis atthe end of the title)
The Trust in Teams and Trust in Leaders Scale: A review of their psychometricproperties and item selection (U)N/A (U)
4. AUTHORS (First name, middle initial and last name. If military, show rank, e.g. Maj. John E. Doe.)
Ann−Renee Blais; Megan Thompson
5. DATE OF PUBLICATION(Month and year of publication of document.)
September 2009
6a NO. OF PAGES(Total containing information, includingAnnexes, Appendices, etc.)
36
6b. NO. OF REFS(Total cited in document.)
28
7. DESCRIPTIVE NOTES (The category of the document, e.g. technical report, technical note or memorandum. If appropriate, enter the type of document,e.g. interim, progress, summary, annual or final. Give the inclusive dates when a specific reporting period is covered.)
Technical Memorandum
8. SPONSORING ACTIVITY (The names of the department project office or laboratory sponsoring the research and development − include address.)
Sponsoring:
Tasking:
9a. PROJECT OR GRANT NO. (If appropriate, the applicableresearch and development project or grant under which the document waswritten. Please specify whether project or grant.)
12oe
9b. CONTRACT NO. (If appropriate, the applicable number under whichthe document was written.)
10a. ORIGINATOR'S DOCUMENT NUMBER (The officialdocument number by which the document is identified by the originatingactivity. This number must be unique to this document)
DRDC Toronto TM 2009−161
10b. OTHER DOCUMENT NO(s). (Any other numbers under whichmay be assigned this document either by the originator or by thesponsor.)
11. DOCUMENT AVAILABILITY (Any limitations on the dissemination of the document, other than those imposed by security classification.)
Unlimited distribution
12. DOCUMENT ANNOUNCEMENT (Any limitation to the bibliographic announcement of this document. This will normally correspond to the DocumentAvailability (11), However, when further distribution (beyond the audience specified in (11) is possible, a wider announcement audience may be selected.))
Unlimited announcement
UNCLASSIFIED
UNCLASSIFIED
DOCUMENT CONTROL DATA(Security classification of the title, body of abstract and indexing annotation must be entered when the overall document is classified)
13. ABSTRACT (A brief and factual summary of the document. It may also appear elsewhere in the body of the document itself. It is highly desirable that the abstract
of classified documents be unclassified. Each paragraph of the abstract shall begin with an indication of the security classification of the information in the paragraph(unless the document itself is unclassified) represented as (S), (C), (R), or (U). It is not necessary to include here abstracts in both official languages unless the text isbilingual.)
(U) One objective of DRDC Toronto’s Trust in Military Teams Applied Research Project (16kx)was to develop reliable and valid measures of trust in teams and leaders at the level ofsmall military units (i.e., section level). Several research studies resulted in initial versionsof two measures: the Trust in Teams and Trust in Leaders Scales. These initial versions ofthe scales were the subject of initial item selection, reliability, and validation analyses asdocumented in previous contractor reports (Adams, Bruyn, & Chung−Yan, 2004; Adams &Sartori, 2006). However, a recent review of the Trust in Teams and Trust in Leaders scaleitems in Adams and Sartori (2006) differed substantively from those in Adams, Bruyn, andChung−Yan (2004). That is, some of the items were slightly reworded, whereas otherswere completely new, making direct comparisons and the continuity of scale developmentwork from one version of the scale to the next a particular challenge. To address thisissue, the current report represents a review of the literature concerning scaledevelopment analyses approaches with applications to second versions of the Trust inTeams and Trust in Leaders Scales to provide a sound psychometric basis for continuedscale development work. To this end, we review the literature concerning the analyticapproaches to favour for the evaluation and selection of items. We then re−analyze thedata for the Trust in Teams and Trust in Leaders Scales and review the item selectionbased on these analytic approaches in order to provide a more robust basis for futurescale work with these measures.
(U) Le projet de recherche appliquée sur la confiance envers les équipes militaires (16kx) deRDDC Toronto avait notamment pour objectif d’élaborer des mesures fiables et valides dela confiance envers les équipes et envers les chefs au sein de petites unités militaires (p.ex. au niveau des sections). Plusieurs études de recherche ont permis d’établir desversions initiales de deux mesures : l’échelle de confiance envers les équipes et l’échellede confiance envers les chefs. Ces premières versions des échelles ont fait l’objetd’analyses portant sur la sélection initiale des items et la fiabilité ainsi que d’analyses devalidation, dont il a été question dans les rapports antérieurs des entrepreneurs (Adams,Bruyn et Chung−Yan, 2004; Adams et Sartori, 2006). Toutefois, un examen récent desitems des échelles de confiance envers les équipes et envers les chefs a révélé que lesitems d’Adams et Sartori (2006) différaient sensiblement de ceux d’Adams, Bruyn etChung−Yan (2004). En effet, certains des items avaient été légèrement reformulés, alorsque d’autres étaient complètement nouveaux, ce qui rendait particulièrement difficiles lescomparaisons directes ainsi que la continuité du travail d’élaboration de l’échelle d’uneversion à la version suivante. Afin de surmonter ce problème, nous faisons dans leprésent rapport un survol de la littérature ayant trait aux méthodes d’analyse axées surl’élaboration d’échelles et proposons des applications aux deuxièmes versions deséchelles de confiance envers les équipes et envers les chefs. Nous espérons ainsi offrirune assise psychométrique solide pour guider le travail d’élaboration continue deséchelles. À cette fin, nous avons examiné les publications portant sur les méthodesd’analyse qu’il convient d’utiliser pour l’évaluation et la sélection des items. Nous avonsensuite analysé une nouvelle fois les données relatives aux échelles de confiance enversles équipes et envers les chefs et examiné la sélection des items fondée sur cesméthodes d’analyse, dans le but d’offrir une assise plus solide aux recherches futuresfaisant appel à ces mesures.

14. KEYWORDS, DESCRIPTORS or IDENTIFIERS (Technically meaningful terms or short phrases that characterize a document and could be helpful in
cataloguing the document. They should be selected so that no security classification is required. Identifiers, such as equipment model designation, trade name,military project code name, geographic location may also be included. If possible keywords should be selected from a published thesaurus, e.g. Thesaurus ofEngineering and Scientific Terms (TEST) and that thesaurus identified. If it is not possible to select indexing terms which are Unclassified, the classification of eachshould be indicated as with the title.)
(U) teams; trust; leaders; psychometric properties
UNCLASSIFIED
www.drdc-rddc.gc.ca
Defence R&D Canada
Canada’s Leader in Defenceand National Security
Science and Technology
R & D pour la défense Canada
Chef de file au Canada en matièrede science et de technologie pourla défense et la sécurité nationale
DEFENCE DÉFENSE&