Thesis Proposal Presentation_Higgins
49
Assessment of Changes in Anthropometric Measures, and Dietary and Physical Activity Behaviors in Overweight and Obese Children Brianna D. Higgins Thesis Proposal MS Human Nutrition Candidate Drexel University
-
Upload
brianna-higgins -
Category
Healthcare
-
view
164 -
download
0
Transcript of Thesis Proposal Presentation_Higgins

Assessment of Changes in Anthropometric Measures, and Dietary and Physical Activity
Behaviors in Overweight and Obese Children
Brianna D. HigginsThesis Proposal
MS Human Nutrition CandidateDrexel University

Outline
• Background
• Specific Aims and Hypotheses
• Significance
• Outcome Measures
• Study Design
• Statistical Analyses

Childhood Obesity Background
• 1/3 of children and adolescents in the United States (US) are identified as overweight or obese
• Prevalence has doubled in children and quadrupled in adolescents over the past three decades
• 18.87% of children and adolescents in the US are considered to have abdominal obesity
(Ogden et al., JAMA. 2012; 307(5), 483-490; Xi et al., Pediatrics. 2014;134(2):e334-339)

Childhood Obesity in Philadelphia
• 40% of children, 6 to 17 years of age, were categorized as overweight or obese
• Prevalence of obesity among children in Philadelphia public schools declined• 21.7% in 2006 to 2007• 20.3% in 2012 to 2013
• No data exist about rates of abdominal obesity for children and adolescents in the Philadelphia area
(Division of Community Health NCfCDPaHP. Community Profile: Philadelphia, Pennsylvania. 2013; http://www.cdc.gov/nccdphp/dch/programs/CommunitiesPuttingPreventiontoWork/communities/profiles/both-pa_philadelphia.htm; Data Brief: Obesity and Severe Obesity among Philadelphia schoolchildren, 2006/2007 - 2012/2013. In: Health PDoP, ed2015)

Assessing Weight Status
• Obesity defined by body mass index (BMI)• Weight-to-height ratio (kg/m2)• 85th to 94th percentile = overweight• At or above 95th percentile = obese
• Associated with• Increased risk for cardiovascular disease
• Impaired glucose tolerance
• Type 2 diabetes mellitus
(http://www.cdc.gov/obesity/childhood/defining.html; Freedman et al., J Pediatr. 2007;150(1):12-17.e12; Sinha et al. NEJM. 2002;346(11):802-810; Wiegand et al., Eur J Endocrinol. 2004;151(2):199-206)

(http://www.cdc.gov/growthcharts/data/set2clinical/cj41c074.pdf)

Assessing Weight Status
• BMI z-score• Optimal measure of annual adiposity change for elementary school children
• Measure of the deviation of a specific BMI from the mean of the population of children of the same age and sex
• Represents the number of standard deviations from the mean
• Positive or negative sign represents heavier or lighter than the mean, respectively
(Inokuchi et al., Ann Hum Biol. 2011; 38(6), 747-751; http://www.who.int/nutgrowthdb/about/introduction/en/index4.html)
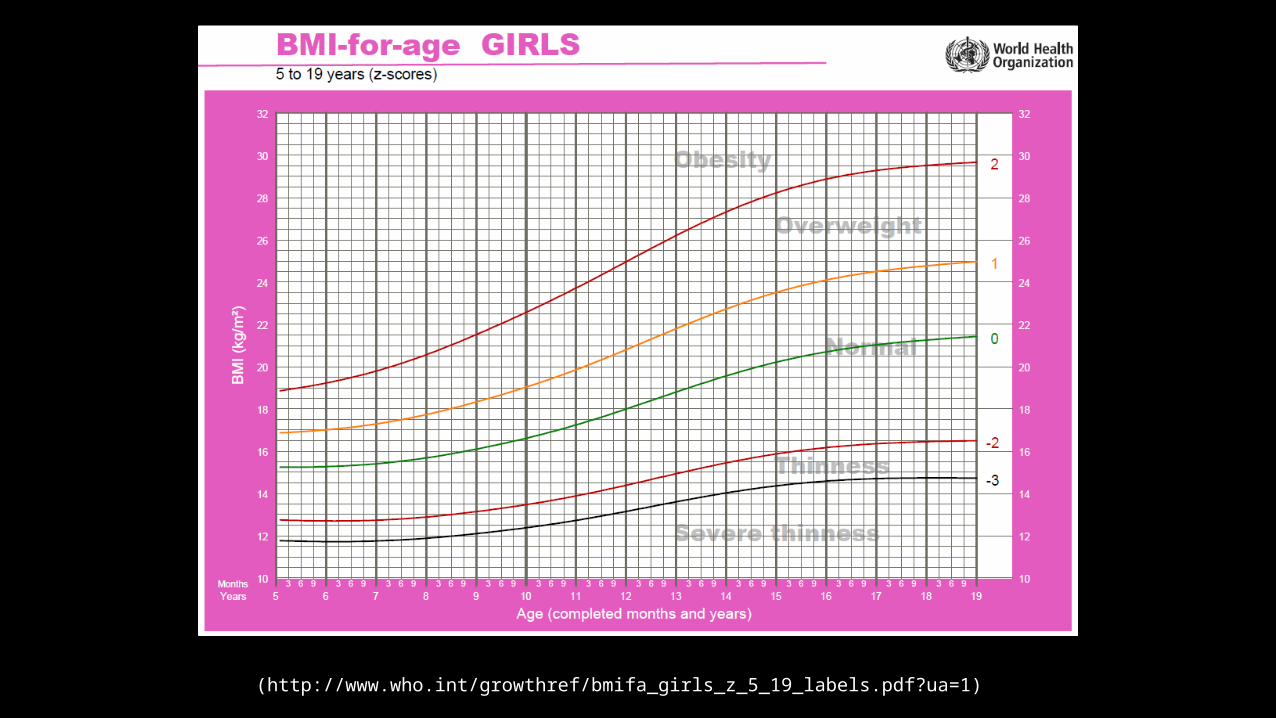
(http://www.who.int/growthref/bmifa_girls_z_5_19_labels.pdf?ua=1)

Assessing Weight Status
• Abdominal obesity • Waist circumference > 90th percentile
• Associated with• Metabolic and cardiovascular disease risk factors
• Insulin resistance
• Hypertension
• Hypercholesterolemia
(Fernandez et al., J Pediatr. 2004;145(4), 439-444; Skoczen et al., Exp Clin Endocrinol Diabetes. 2015;123(4):252-259; Bekkers et al., PloS one. 2012;7(12):e51801)

Obesity and Adiposity Associations in Children
• Breakfast
• Fruit and Vegetables
• Soda
• Physical Activity
(http://fairburyjeffs.org/parents/nutrition/fresh-fruit-and-vegetable-program/)

Breakfast Consumption and Obesity
• Children who skip breakfast are more likely to have diets with a higher daily percent of energy from fat
• Children and adolescents who eat breakfast• Consume fewer soft drinks and eat more fruits and vegetables than those
who skip breakfast
• Breakfast foods, such as cereals and breads, are high in fiber and have been shown to improve glucose and insulin parameters
• Leading to increased satiety and lower body weight
(Deshmukh-Taskar et al., J Am Diet Assoc. 2010; 110(6), 869-878; Timlin et al., Pediatrics. 2008; 121(3), e638-E645)

Fruit and Vegetable Intake and Obesity
• Rich in fiber, leading to increased satiety and lower body weight
• High in water content, which enhances satiety
• Increased fruit and vegetable consumption has been shown to decrease short-term energy intake in children
• Fewer kilocalories consumed• Lower body fat stores
(Timlin et al., Pediatrics. 2008; 121(3), e638-E645; Ledoux et al., Obes Rev. 2011; 12(5), e143-150. Miller et al., J Nutr Educ Behav. 2011; 43(5), 396-400)

Soda Consumption and Obesity
• Sugar-sweetened beverages have a high glycemic index and are energy dense• Increase overall energy intake • Increase blood glucose concentrations
• Children who consumed one regular carbonated soda per day had an average of 10% more total energy intake than non-soda consumers
(Ludwig et al., Lancet. 2001; 357(9255), 505-508; Harnack et al., J Am Diet Assoc. 1999; 99(4), 436-441; https://www.healthychildren.org/English/healthy-living/nutrition/Pages/Healthy-Active-Living-for-Families.aspx)

Authors Population Description
Dietary and Physical Activity
Behaviors Studied
Major Findings
Giammattei et al., Archives of
Pediatric and Adolescent
Medicine, 2003
Adolescents6th and 7th grades
Santa Barbara, CA
N = 385
Soft Drink Consumption
Those who consumed 3 or more soft drinks per day, compared to those who consumed
fewer than 3 soft drinks per day, had a higherBMI z-score (P=0.003) and percent body fat (P=0.02)
Were more likely to have a BMI at or above the 85th percentile than those who consumed
fewer than 3 soft drinks per day
(P= 0.006)
Vanselow et al., American Journal of
Clinical Nutrition, 2009
Adolescents11 to 15 years of age
Minneapolis, MN
N = 2,294
Soft Drink Consumption
No significant associations existed between BMI change and soft drink consumption over 5
years

Physical Activity and Obesity
• Increases energy expenditure• Major role in decreased body weight and BMI
• Recommendation for children 6 to 17 years of age• At least 60 minutes per day of moderate or vigorous physical activity
(Timlin et al., Pediatrics. 2008; 121(3), e638-E645; https://www.healthychildren.org/English/healthy-living/nutrition/Pages/Healthy-Active-Living-for-Families.aspx)

Authors Population Description
Dietary and Physical Activity
Behaviors Studied
Major Findings
Chaput et al., Pediatric Journal of
Obesity, 2012
Caucasian children
8 to 10 years of age
Montreal, Canada
N = 550
Physical Activity
7 days
Moderate-to-vigorous physical activity (MVPA) was significantly inversely associated with
percent body fat (P=0.02)
Children who did not accumulate >60 minutes per day of MVPA were more likely to be
overweight or obese compared to those who met that time (P<0.01)
Storey et al., Journal of Obesity,
2012
Adolescents in 7th through 10th grades
Alberta, Canada
N = 4,097
Physical Activity
Web-based questionnaire
Assessed previous 7 days of physical
activity
Both healthy weight (P<0.001) and overweight students (P<0.001) were more active than
obese students

Race and Ethnicity on Obesity
• White and Hispanic high school students consumed significantly more fruits and vegetables and 100% fruit juice
• Compared to Black high school students
• Prevalence of Black and Hispanic high school students who did not eat breakfast was significantly higher than White students
• Hispanic children in 4th through 6th grades in Philadelphia• Significantly less likely to get 60 minutes of MVPA per day than
other races
(CDC, National Youth Risk Behavior Survey, 2013; Trost et al, Med Sci Sports Exerc. 2013; 45(3), 470-474)

Sex and Obesity Factors
• Female high school students consumed significantly more fruits, vegetables and 100% fruit juice
• Compared to male students
• Boys in 4th through 6th grades in Philadelphia • Significantly higher amount of time in MVPA than girls
(CDC, National Youth Risk Behavior Survey, 2013; Trost et al, Med Sci Sports Exerc. 2013; 45(3), 470-474)

Authors Population Description
Individual Characteristics
Studied
Major Findings
Robbins et al., Preventing Chronic
Disease, 2015
Public school children in kindergarten
through 12th grades
Philadelphia, PA
N = 88,798
Race/Ethnicity
Sex
Hispanic boys and girls had highest prevalence of obesity compared to other races
No significant decline in obesity rates from 2006 to 2007 and 2012 to 2013
Boys had a significant decline in obesity from 2006 to 2007 and 2012 to 2013 (P<0.05), while
girls did not
Ogden et al., Journal of the American
Medical Association, 2012
Children and Adolescents,
6 to 17 years of age
United States
N = 655
Race/Ethnicity
Sex
During 1999 to 2010, the odds of being obese were significantly higher for non-Hispanic Black
males and females, and Mexican American males and females, compared to non-Hispanic
White males and females

School-based Intervention Settings
• Institute of Medicine recommends that schools be the focal point for childhood obesity prevention
• Importance of school-based interventions• No other institution has as much contact with children
• Play a pivotal role in promoting healthy behaviors to prevent obesity• Participation in school meal programs, presence of physical activity
programming, and teacher influences
(Koplan et al., J Am Diet Assoc. 2005; 105(1), 131-138; Baranowski, et al., Am J Health Behav. 2002; 26(6), 486-493)

Authors Population Description Interventions Major Findings
HEALTHY Study Group et al., The
New England Journal of
Medicine, 2010
Baseline students in 6th grade, followed for 3 years
42 schools7 cities in US
N = 4,603
Nutrition, physical activity, behavioral knowledge and skills, and communications and social marketing in 21
schools
Mean BMI z-score and percent of students with abdominal obesity were significantly
lower in the intervention schools than control schools
(P=0.04)
Tarro et al., Trials, 2014
Baseline students in 2nd and 3rd grades, followed for 28
months
38 schools4 cities in Spain
N = 1,939
Nutrition, healthy habits, and physical activity in 24 schools
Obesity prevalence in boys was decreased significantly in the intervention group
compared to the control group (P = 0.01)
Rush et al., British Journal of
Nutrition, 2012
Baseline students in 1st and 6th grades, followed for 2 years
124 schoolsWaikato Region, New Zealand
N = 1,352
Nutrition and physical activity in 62 schools
Intervention significantly associated with reduced accumulation of percent body fat
in the younger children (P=0.03)
Intervention did not result in BMI changes in overweight or obese children

Healthy Futures Initiative• Institutional Review Board approval
• Inclusion Criteria• Students in the same school for 4th, 5th and 6th grades
• Schools must have the three grades in the same building
• Five counties in Greater Philadelphia represented• Chester, Delaware, Montgomery, Bucks and Philadelphia

Study Design• Three levels of intervention
• 4 Core Schools
• 5 Level 1 Schools
• 4 Control Schools

Partner Programs for Core Schools
Vetri Foundation For Children
Eatiquette 1 to 2 days per week Up to 4 Culinary Classrooms per school year
Greener Partners Monthly in-classroom Seed-2-Snack lessons 2 Farm Explorer visits per year
Fit Essentials One 45-minute fitness period per week, with one take-away fitness assignment to complete outside of school
Biannual cardiovascular health and muscular strength measurements
Philadelphia Union 2 coach/player visits per year (90 minutes each)
VillanovaUniversity
VioScreen accounts for all students in grade for parental completion Focus group with 10 students per school per focus group

Partner Programs for Level 1 Schools
Vetri Foundation For Children
No programming
Greener Partners 4 in-classroom Seed-2-Snack lessons 1 Farm Explorer visit per year
Fit Essentials One 45-minute fitness period per month, with one take-away fitness assignment to complete outside of school
Biannual cardiovascular health and muscular strength measurements
Philadelphia Union 1 coach/player visits per year (90 minutes each)
Villanova University
No programming

Partner Programs for Control Schools
Vetri Foundation For Children
No programming
Greener Partners No programming
Fit Essentials No programming
Philadelphia Union No programming
Villanova University
No programming

Purpose
• Evaluate the effects of a school-based intervention, in overweight and obese students in the 5th grade on
• BMI z-score
• Waist circumference
• Dietary and physical activity behaviors
• The larger school-based intervention is three years in duration• Data for this study were collected during the second year (2014 to 2015)

Specific Aims and Hypotheses

Specific Aim and Hypothesis 1
• To examine the change in BMI z-score, over one academic year, in students in 5th grade, who are obese and overweight, and participating in a school-based intervention, with three distinct intervention levels (Core, Level 1, Control)
• It is hypothesized that students in the Core Schools will have a greater reduction in BMI z-score compared to Level 1 and Control Schools

Specific Aim and Hypothesis 2
• To examine the change in waist circumference, over one academic year, in students in 5th grade, who are obese and overweight, and participating in a school-based intervention, with three distinct intervention levels (Core, Level 1, Control)
• It is hypothesized that students in the Core Schools will have a greater reduction in waist circumference compared to Level 1 and Control Schools

Specific Aim and Hypothesis 3
• To examine the change in dietary behaviors, over one academic year, in students in 5th grade, who are obese and overweight, and participating in a school-based intervention, with three distinct intervention levels (Core, Level 1, Control)
• Dietary behaviors include • Breakfast, fruit, green salad, other vegetables and soda consumption
• It is hypothesized that students in the Core Schools will have a greater positive improvement in dietary behaviors compared to Level 1 and Control Schools

Specific Aim and Hypothesis 4
• To examine the change in the number of days students in the 5th grade participate in 60 minutes of physical activity, over one academic year, who are obese and overweight, and participating in a school-based intervention, with three distinct intervention levels (Core, Level 1, Control)
• It is hypothesized that students in the Core Schools will have a greater increase in the number of days they participate in 60 minutes of physical activity compared to Level 1 and Control Schools

Specific Aim 5
• To determine which race and/or ethnicity and sex has the greatest amount of change in each health behavior assessed and the greatest changes in BMI z-score and waist circumference, over one academic year, in overweight and obese students in 5th grade
• Health behaviors include • Breakfast, fruit, green salad, other vegetables and soda consumption• Time spent in physical activity

Hypothesis 5
• Male students and White students will have the greatest positive improvement in each behavior assessed, and thus, the greatest decreases in BMI z-score and waist circumference, compared to other races/ethnicities and sexes
• Positive improvements include• Increase in number of days of breakfast consumption• Increase in number of times consume fruit, green salad and other
vegetables• Decrease in number of times consumed soda• Increase number of days participated in 60 minutes of physical activity

Significance of Study
• First school-based intervention in Philadelphia using community partners
• Limited data on the rates of obesity in the regional Philadelphia area in children and adolescents
• Especially in children attending private or parochial schools
• Abdominal obesity not measured in this population
• Demographics of Philadelphia children allow for diverse study population

Outcome Measurements
• Height• Body Weight
• BMI calculated and converted to BMI z-score
• Waist Circumference
• Health Behaviors

Anthropometric Measurements
• All measurements taken
• In school nurse’s office or private room
• With shoes and sweatshirts/jackets removed
• By a Children’s Hospital of Philadelphia (CHOP) nurse or members of Drexel team trained by the CHOP nurse
• Beginning and end of school year

Anthropometric Measurement Methodology
Height Sliding vertical scale stadiometer Measured to nearest 0.5 cm
Body Weight Calibrated balance beam or electronic scale Measured to nearest 0.5 kg
Waist Circumference Soft measuring tape Measurement taken under shirt 1 inch above umbilicus Measured to nearest 0.5 cm

Health Behavior Measurement
• Youth Behavior Survey
• Measurement taken in homeroom teacher’s classroom
• Beginning and end of school year

Example Questions from Youth Behavior Survey

Youth Behavior Survey
During the past 7 days, on how many days did you eat breakfast?
o0 days o 1 day o2 days o3 days o4 days o5 days o6 days o7 days

Youth Behavior Survey
During the past 7 days, how many times did you eat fruit? (Do not count fruit juice)
During the past 7 days, how many times did you eat green salad?
During the past 7 days, how many times did you eat vegetables other than green salad?
During the past 7 days, how many times did you drink a can, bottle, or glass of soda or pop, such as Coke, Pepsi, or Sprite?
o I did not eat fruit during the past 7 days
o 1 to 3 times during the past 7 days
o 4 to 6 times during the past 7 days
oMore than 6 times during the past 7 days

Youth Behavior Survey
During the past 7 days, on how many days were you physically active for a total of at least 60 minutes per day? (Add up all the time you spent in any kind of physical activity that increased your heart rate and made you breathe hard some of the time)
o0 days o 1 day o2 days o3 days o4 days o5 days o6 days o7 days

Youth Behavior Survey
What is your sex?
Are you Hispanic or Latino?
What is your race? (Select one or more responses)
o Female oMale
o Yes o No
o American Indian or Alaska Native o Asiano Black or African American o Native Hawaiian or Other Pacific
Islander oWhite

Statistical Analyses
• IBM SPSS Edition 23 software
• Descriptive Statistics
• General linear mixed models • Differences among the Core, Level 1 and Control Schools
• Repeated measures analysis of covariance (ANCOVA)• Sex• Race
• α-value set to 0.05

Study Time Line
August 2014 through
May 2015
October 2015 through
February 2016
March 2016 through
May 2016
Data Collected Thesis ProposalData Analyses
Thesis Writing Thesis Defense

Acknowledgments
• Dr. Stella Volpe• Dr. Sinclair Smith• Dr. Patricia Shewokis
• Abby Gilman• Emily Werner

Independence Blue Cross Foundation