Thesis presentation
37
PERCEPTION OF FOURTH YEAR STUDENTS MAJOR IN COMPUTER EDUCATION ON THE SERVICE AND CURRICULAR PROGRAM OF COLLEGE OF EDUCATION IN RTU PASIG CAMPUS
-
Upload
honey-turqueza -
Category
Documents
-
view
38 -
download
1
Transcript of Thesis presentation
PERCEPTION OF FOURTH YEAR STUDENTS MAJOR IN COMPUTER EDUCATION ON THE SERVICE AND CURRICULAR PROGRAM OF
COLLEGE OF EDUCATION IN RTU PASIG CAMPUS

CHAPTER ITHE PROBLEM AND ITS BACKGROUND

INTRODUCTION

Statement of the problemThe researchers of this study sought answers to the following inquiries
1. What is the demographic profile of the respondents in terms of1. Gender
2. Age
2. What are the perceptions of the pre-service teachers on the adequacy and relevance of the BSE-Curriculum?
3. To what extent do the teachers possess the 21st Century skills in teaching?
4. What is the level of satisfaction on services in Rizal Technological University?
5. What is the level of satisfaction on facilities in Rizal Technological University?
6. Is there any significant difference between the perception of male and female Fourth Year College students of CED
HypothesisThere is significant difference between the perception of male and female Fourth Year College student of CED and the relevance of CED Curriculum.
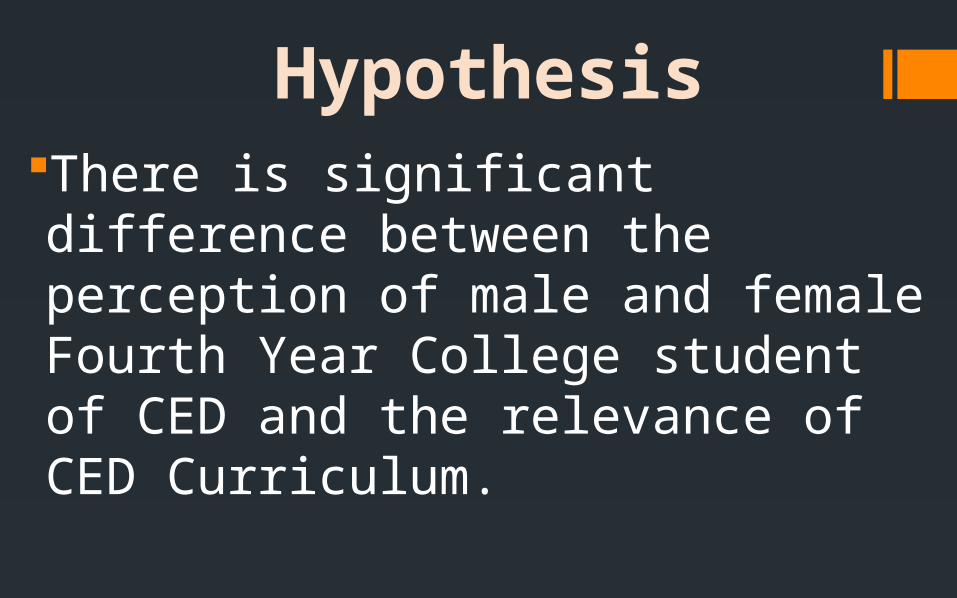
Conceptual Framework
• Demographic profiles of the student
• The perceptions of the pre-service teachers on the adequacy and relevance of the BSE- Curriculum?
• Reasons of the 4th year students for enrolling at RTU Pasig?
• Level of Satisfaction on Services.
• Levels of Satisfaction on the Facilities.
Input
• Analyzing data by data gathering, using sampling scheme, instrumentation, and statistical treatment of data. .
Process
• Enhancement of the curriculum and services in RTU Pasig Campus.
Output
Scope and DelimitationThe study sought to find the perception of Fourth Year students on the service and curricular program of College of Education in RTU-Pasig Campus. The researcher utilized six (7) graduating students from College of Education major in Computer Education. This study spanned one semester of school year 2014-2015.
Significance of the StudyThe researchers believe that this study provide benefits to the following:
Students- This study will help to improve the learning of the students in CED. The better curriculum, the better learning.
College/Department- This will serve as an instrument for curriculum enhancement and enrichment of the content of the curriculum.
Researchers- This study will serve as vehicle for their long dreamt Bachelor Degree.

Chapter IIIMETHODS AND PROCEDURES

Research Methodology
This chapter present the research method used, population and sampling scheme, description of the respondents, development of instruments, validation of instruments, data gathering procedures and statistical treatment of data.
Research Method usedThe study is concerned with the Perception of Fourth Year
Students on the Service and Curricular Program of College of Education In RTU Pasig Campus. The descriptive method of research is the most appropriate method use.
Descriptive research, also known as statistical research, describes data and characteristics about population or phenomenon being studied (Gonzaga).
Descriptive method is the fact-finding study with adequate and accurate interpretations of findings. It describes of emphasis what actually exist such as current conditions practices, situations, or any phenomena (Calderon).
Population and Sampling SchemeThe respondents were Fourth Year Students Major in Computer Education. This type of sampling is one of which everyone in the population of the inquiry has an equal chance of being selected to be include in sample (Calderon).
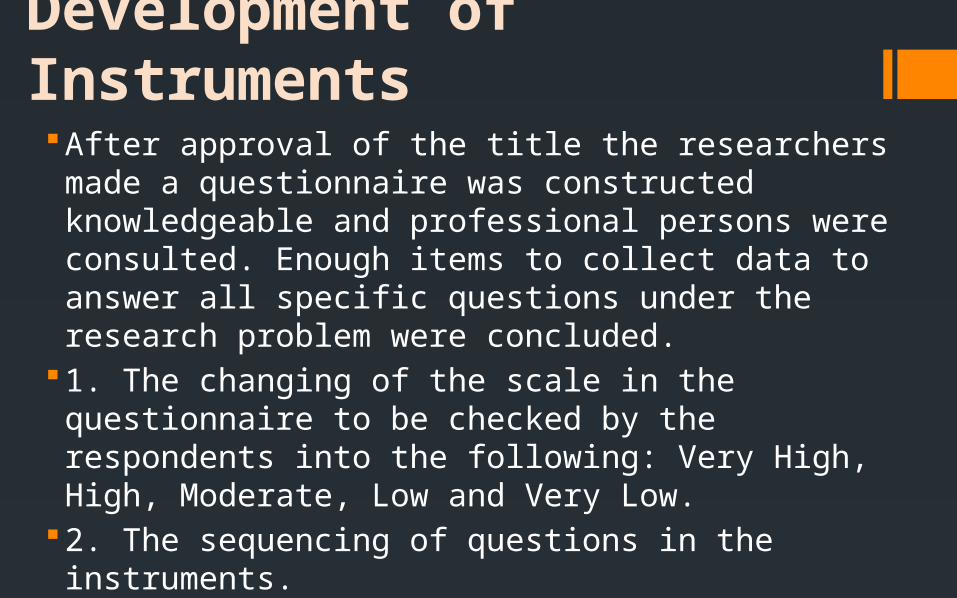
Development of InstrumentsAfter approval of the title the researchers made a
questionnaire was constructed knowledgeable and professional persons were consulted. Enough items to collect data to answer all specific questions under the research problem were concluded.
1. The changing of the scale in the questionnaire to be checked by the respondents into the following: Very High, High, Moderate, Low and Very Low.
2. The sequencing of questions in the instruments.3. The changes of the survey questions from vague thesis
statement and survey questions to clear and specific one.
ProcedureAfter the revision of the questionnaire, copies were produced. The questionnaires given to the respondents and they were given enough time to answer questions one day, the accomplished questionnaires were collected and the data were tallied.

Statistical Treatment of DataTo test the perceptions of the respondents regarding to the services and the curricular program of the RTU Pasig, the researchers used the statistical treatment of data which are the percentage, ranking, frequency and weighted mean.
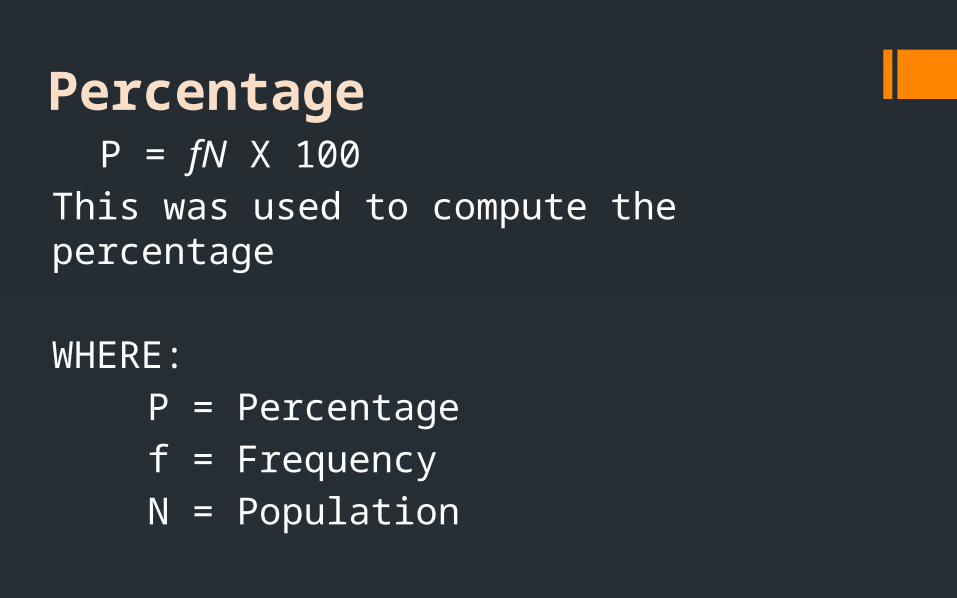
P = fN X 100
This was used to compute the percentage
WHERE:
P = Percentage
f = Frequency
N = Population
Percentage

RankingRanking is process of arranging positions in line or in regular formation in decreasing and increasing order using metric values.
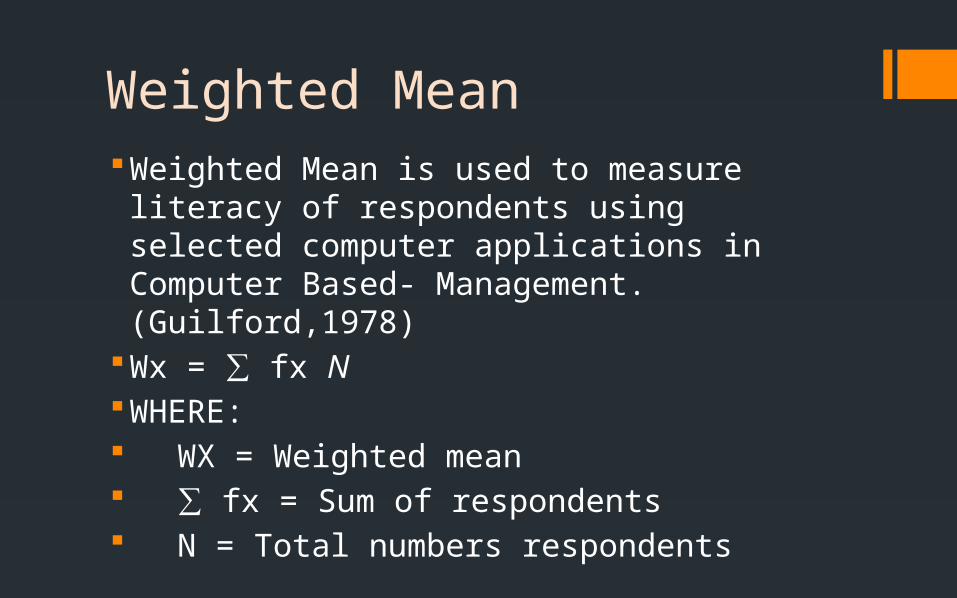
Weighted MeanWeighted Mean is used to measure literacy of
respondents using selected computer applications in Computer Based- Management.(Guilford,1978)
Wx = ∑ fx NWHERE: WX = Weighted mean ∑ fx = Sum of respondents N = Total numbers respondents
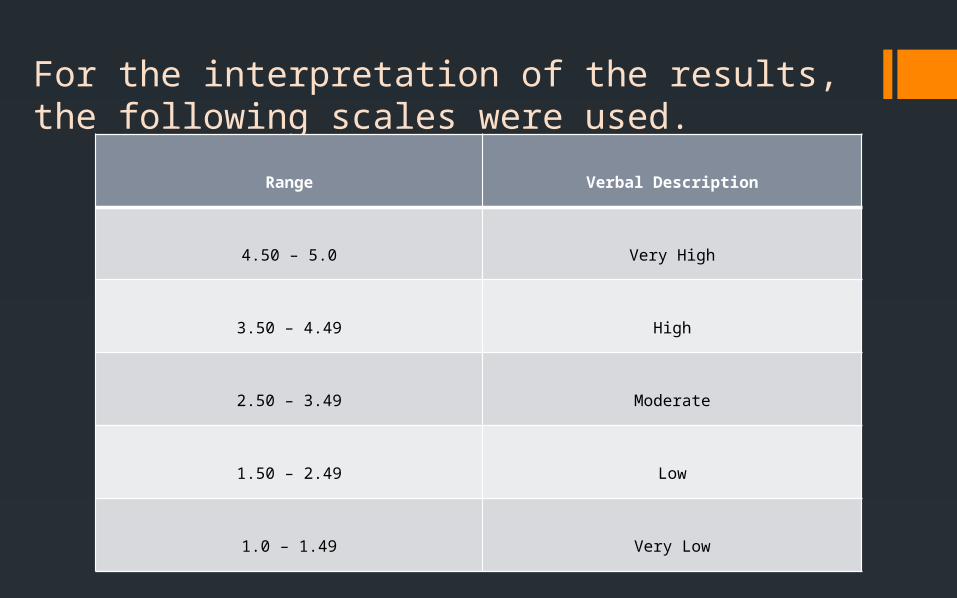
For the interpretation of the results, the following scales were used.
Range Verbal Description
4.50 – 5.0 Very High
3.50 – 4.49 High
2.50 – 3.49 Moderate
1.50 – 2.49 Low
1.0 – 1.49 Very Low

CHAPTER IV
PRESENTATION, ANALYSIS AND INTERPRETATION OF DATA
Description of Respondents
The respondents of this study are the Fourth Year Students on the Service and Curricular Program of College of Education In RTU Pasig Campus. The following Tables will describe the respondents more deeply by their gender and age.
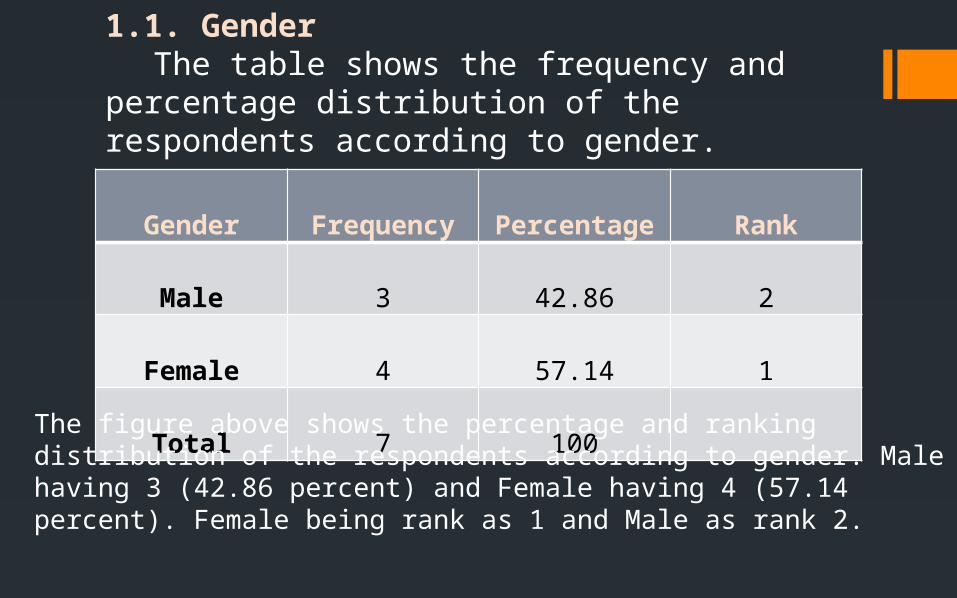
1.1. Gender The table shows the frequency and
percentage distribution of the respondents according to gender.
Gender Frequency Percentage Rank
Male 3 42.86 2
Female 4 57.14 1
Total 7 100
The figure above shows the percentage and ranking distribution of the respondents according to gender. Male having 3 (42.86 percent) and Female having 4 (57.14 percent). Female being rank as 1 and Male as rank 2.

1.2. Age The table shows the frequency and
percentage distribution of the respondents according to Age.
Age Range Frequency Percentage Rank
19 2 28.57 2
20 2 28.57 2
21 3 42.86 1
Total 45 100
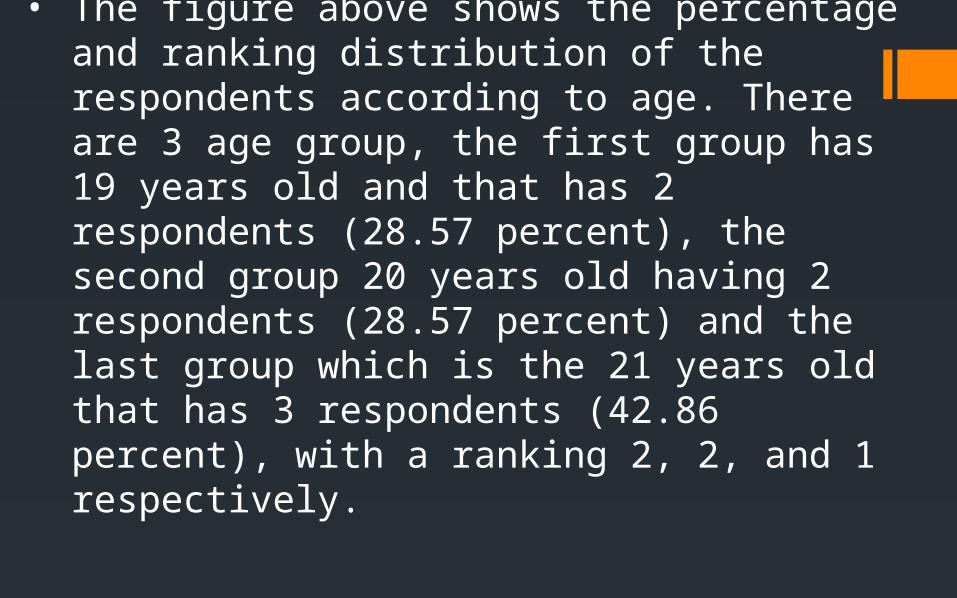
• The figure above shows the percentage and ranking distribution of the respondents according to age. There are 3 age group, the first group has 19 years old and that has 2 respondents (28.57 percent), the second group 20 years old having 2 respondents (28.57 percent) and the last group which is the 21 years old that has 3 respondents (42.86 percent), with a ranking 2, 2, and 1 respectively.
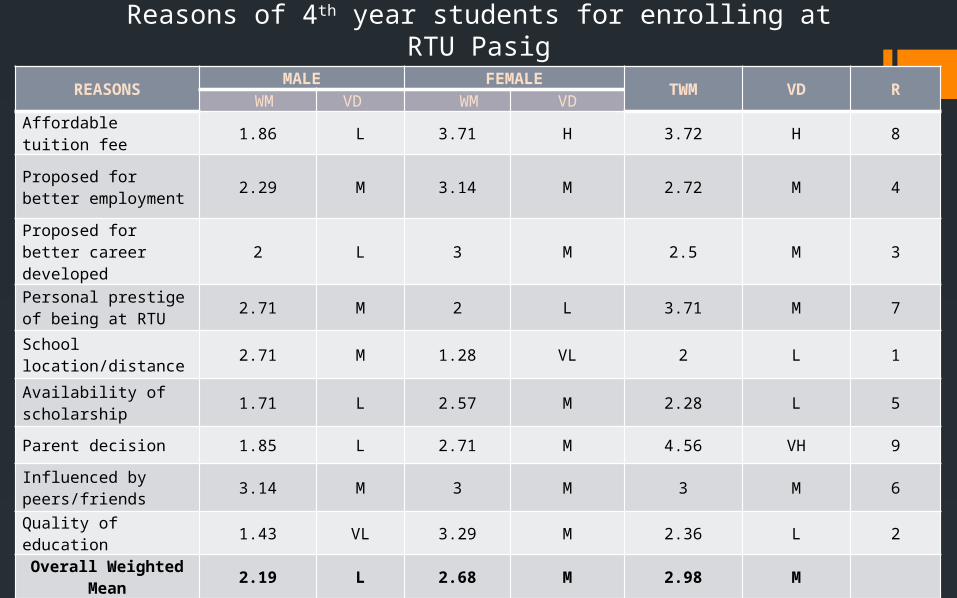
TABLE 3Reasons of 4th year students for enrolling at RTU Pasig
REASONSMALE FEMALE
TWM VD R WM VD WM VD
Affordable tuition fee 1.86 L 3.71 H 3.72 H 8
Proposed for better employment
2.29 M 3.14 M 2.72 M 4
Proposed for better career developed
2 L 3 M 2.5 M 3
Personal prestige of being at RTU
2.71 M 2 L 3.71 M 7
School location/distance
2.71 M 1.28 VL 2 L 1
Availability of scholarship
1.71 L 2.57 M 2.28 L 5
Parent decision 1.85 L 2.71 M 4.56 VH 9
Influenced by peers/friends
3.14 M 3 M 3 M 6
Quality of education 1.43 VL 3.29 M 2.36 L 2
Overall Weighted Mean
2.19 L 2.68 M 2.98 M

The table above show the weighted mean of each of the questions in academe with their gender, must of the Male respondents answered the questions with a weighted mean of 2.19 and above having a verbal description of Medium and Low, compared with the Female and who answered the questions with a weighted mean of 2.68 and below having a verbal description of Medium, High, Low and Very Low in ranking.

TABLE 4Levels of Satisfaction on Services
SERVICESMALE FEMALE
TWM VD RWM VD WM VD
Electronic Data Processing
2.67 M 1.75 L 2.21 L 1
Guidance and Counseling
3 M 2 L 2.5 M 4
Cashier 2.67 M 1.75 L 2.21 L 1
Accounting 3.33 M 2.25 L 2.79 M 6
Registrar 3 M 2.25 L 2.63 H 5
Clinic 3 M 2.25 L 2.63 H 5
Theatro Rizalia/Cultural 3 M 3.25 L 3.13 H 8
Himig Rizalia (Musical) 3 M 3.25 L 3.13 H 8
Computer Library 5 VH 3.75 M 4.38 H 12
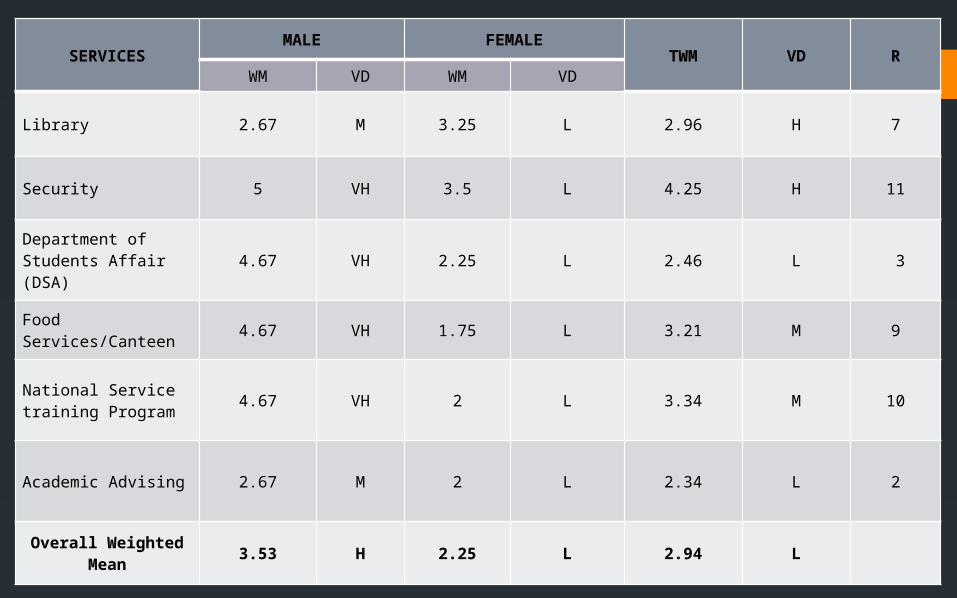
SERVICESMALE FEMALE
TWM VD RWM VD WM VD
Library 2.67 M 3.25 L 2.96 H 7
Security 5 VH 3.5 L 4.25 H 11
Department of Students Affair (DSA)
4.67 VH 2.25 L 2.46 L 3
Food Services/Canteen 4.67 VH 1.75 L 3.21 M 9
National Service training Program
4.67 VH 2 L 3.34 M 10
Academic Advising 2.67 M 2 L 2.34 L 2
Overall Weighted Mean
3.53 H 2.25 L 2.94 L

The table above shows the weighted mean of the respondents according to gender and their level of satisfaction on services in RTU Pasig, the Male having the 3.53 weighted mean and a Verbal Description between Low and Medium, compared to Female respondents the weighted mean 2.25 and have a Verbal Description of between Medium, High and Low.

TABLE 5Satisfaction on the Facilities
FACILITIESMALE FEMALE
TWM VD RWM VD WM VD
Library (Updated Books, Internet/Wifi)
2.25 M 2.75 M 2.5 M 1
Computer Laboratory 3.75 H 4 H 3.88 H 7
Science Laboratory 1.25 VL 3.75 H 2.5 M 2
Drawing Laboratory 2.5 M 3.25 M 2.88 M 4
Classrooms (Electric fan, Chairs,Boards)
3.5 H 2.25 L 2.88 M 4
Clinic (Medicines) 3.5 H 3.25 M 3.38 M 6
Canteen 3 H 3 M 3 M 6
Gymnasium 2.5 M 3.25 M 2.75 M 3
Audio Visual 2.5 M 3.25 M 2.75 M 3
Home Economics/TLE Room
2.5 M 3.5 H 2.88 M 4
Comfort Room 3 M 2 L 2.5 M 2
Overall Weighted Mean
2.85 M 3.25 M 2.95 M
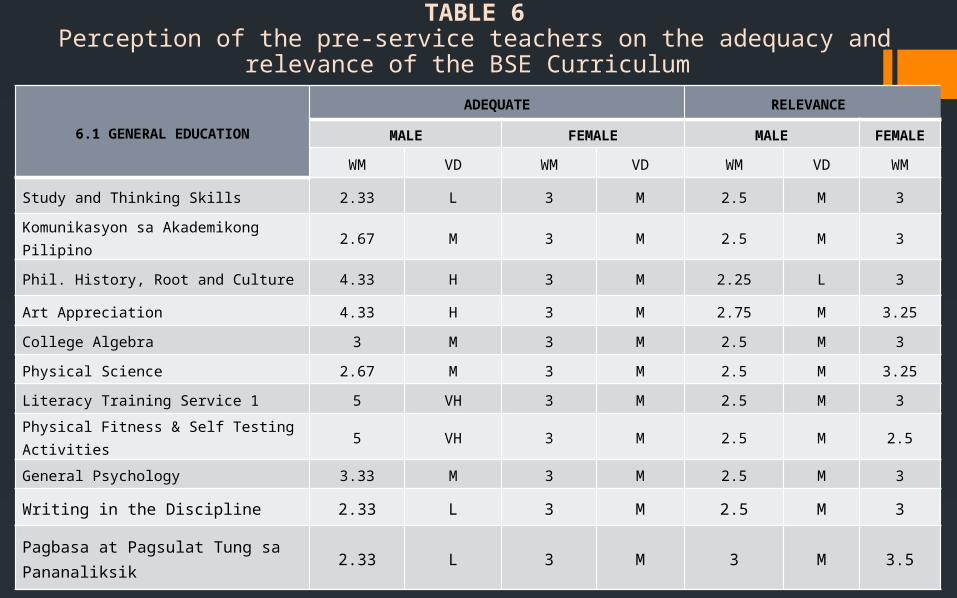
TABLE 6Perception of the pre-service teachers on the adequacy and relevance of the BSE
Curriculum
6.1 GENERAL EDUCATION
ADEQUATE RELEVANCE
MALE FEMALE MALE FEMALE
WM VD WM VD WM VD WM
Study and Thinking Skills 2.33 L 3 M 2.5 M 3
Komunikasyon sa Akademikong Pilipino 2.67 M 3 M 2.5 M 3
Phil. History, Root and Culture 4.33 H 3 M 2.25 L 3
Art Appreciation 4.33 H 3 M 2.75 M 3.25
College Algebra 3 M 3 M 2.5 M 3
Physical Science 2.67 M 3 M 2.5 M 3.25
Literacy Training Service 1 5 VH 3 M 2.5 M 3
Physical Fitness & Self Testing Activities 5 VH 3 M 2.5 M 2.5
General Psychology 3.33 M 3 M 2.5 M 3
Writing in the Discipline 2.33 L 3 M 2.5 M 3
Pagbasa at Pagsulat Tung sa Pananaliksik
2.33 L 3 M 3 M 3.5
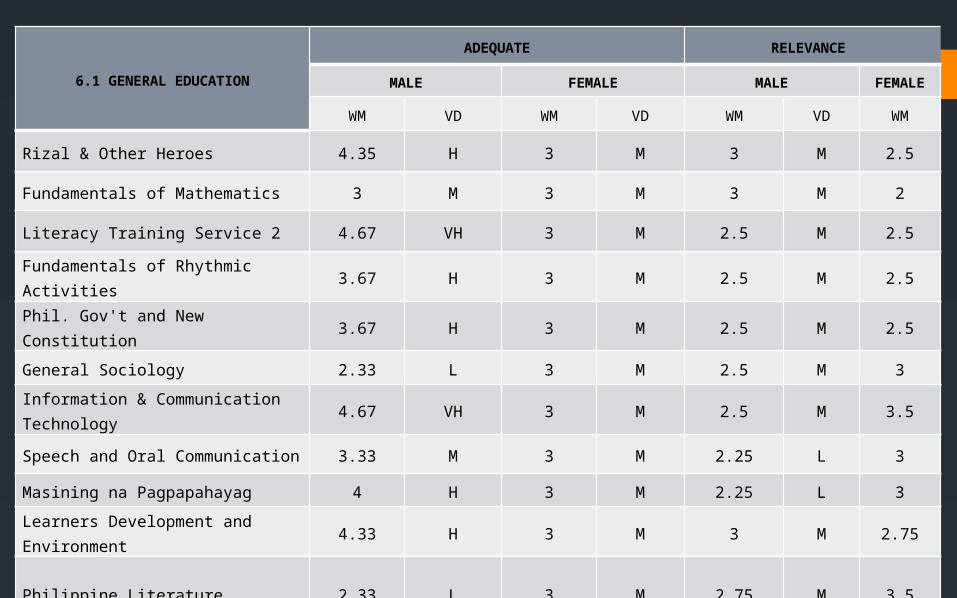
6.1 GENERAL EDUCATION
ADEQUATE RELEVANCE
MALE FEMALE MALE FEMALE
WM VD WM VD WM VD WM
Rizal & Other Heroes 4.35 H 3 M 3 M 2.5
Fundamentals of Mathematics 3 M 3 M 3 M 2
Literacy Training Service 2 4.67 VH 3 M 2.5 M 2.5
Fundamentals of Rhythmic Activities 3.67 H 3 M 2.5 M 2.5
Phil. Gov't and New Constitution 3.67 H 3 M 2.5 M 2.5
General Sociology 2.33 L 3 M 2.5 M 3
Information & Communication Technology
4.67 VH 3 M 2.5 M 3.5
Speech and Oral Communication 3.33 M 3 M 2.25 L 3
Masining na Pagpapahayag 4 H 3 M 2.25 L 3
Learners Development and Environment
4.33 H 3 M 3 M 2.75
Philippine Literature 2.33 L 3 M 2.75 M 3.5

6.1 GENERAL EDUCATION
ADEQUATE RELEVANCE
MALE FEMALE MALE FEMALE
WM VD WM VD WM VD WM
Economics, Taxation, Land Reform 4 H 3 M 3 M 3
Teaching in the Learning Environment 4 H 3 M 3 M 2.25
Understanding Curriculum 4.33 H 3 M 2.75 M 3
Master Works of the World 2.33 L 2.75 M 3 M 3
Environmental Science 4 H 3 M 2.5 M 2.75
Team Sports 4.33 H 4 M 2.75 M 2.75
Elementary Statistics 3.67 H 4 M 2.5 M 3
Research 4.67 V 2.75 M 2.75 M 3
Experience the Teaching Learning Prcs 3.67 H 2.75 M 2.5 M 2.75
Thesis Writing 1 4.33 H 3 M 2.75 M 3
Learning Assessment Strategies 4.67 VH 4.25 M 2.75 M 2.5
Thesis Writing 2 5 VH 4.25 M 2.75 M 3
Overall Weighted Mean 3.39 M 2.82 M 2.6 M 2.89

6.2 PROFESSIONAL EDUCATION
ADEQUATE RELEVANCE
MALE FEMALE MALE FEMALE
WM VD WM VD WM VD WM
Human Growth and Development 4 H 3.5 H 4 H 4.75
Educational Technology 3.67 H 3.5 H 3.67 H 4.75
Educational Psychology 4.33 H 3.5 H 3.67 H 4.75
Curriculum Development 3.67 H 3.5 H 3.67 H 4
Guidance and Counseling 3 M 3.5 H 3.67 H 4
The teaching Profession 4 H 3.5 H 3.67 H 4.75
Developmental Reading 2.67 M 3.5 H 4 H 4
Social Dimension of Education 4 H 3.5 H 3.67 H 4.75
Principles of Teaching 4 H 3.5 H 4 H 4
Assessment of Students Learning 4 H 3.5 H 3.67 H 4.75
Special Topics in Education 4.33 H 3.5 H 4 H 4.75
Seminar 1 2 L 3.5 H 3.67 H 4.75
In Campus Teaching 5 VH 3.5 H 3.67 H 4
Seminar 2 2.67 M 3.5 H 3.67 H 4
Practice Teaching 4.33 H 3.5 H 3.67 H 4
Overall Weighted Mean 3.71 H 3.5 H 3.25 M 4.4

6.3 SPECIALIZATION
ADEQUATE RELEVANCE
MALE FEMALE MALE FEMALE
WM VD WM VD WM VD WM
Program Logic and Formulation 4.33 H 4 H 4 H 4.75
Program Languages 4.33 H 4 H 4 H 4.75
Computer Hardware 4.33 H 4 H 3.67 H 4.5
Software Application 4 H 4 H 3.67 H 4.75
Webpage Design 4 H 4 H 4 H 4.5
Operating System 4.33 H 4 H 4 H 4.5
Fundamentals of Computer Networks 4.33 H 4 H 4 H 4.75
Database Design 4.33 H 3 M 3.67 H 3.5
Information System Analysis Design 4.33 H 2 L 3.67 H 2.5
Software Engineering 3.33 H 2 L 3.67 H 1.75
Basic Electricity 3.33 H 3.75 H 3.67 H 4.5
Business Math 3.33 H 3.75 H 3.67 H 4.5
Food and Nutrition 4.67 VH 3.75 H 3.67 H 4.75
Cosmetology 2.67 M 3.75 H 4 H 4.75
Basic Drafting 2.33 L 3.75 H 3.33 H 4.5
Plumbing 3.67 H 3.75 H 4 H 4.5
Basic Electronics 2.33 L 3.75 H 3.33 M 4.75
Carpentry 3.67 H 3.75 H 4 H 4.75
Overall Weighted Mean 3.76 H 3.40 M 3.78 H 4.01

TABLE 721st Century Skills in Teaching
21st Century SkillsMALE FEMALE
TWM VD RWM VD WM VD
Act as positive role model for students 3.67 H 3.75 H 3.71 H 6
Creates an environment that promotes fairness
4 H 3.5 H 3.75 H 7
Makes the physical environment safe and conducive to learning
3.67 H 3.5 H 3.58 H 4
Communicates higher learning expectations to each learner
3.67 H 3.75 H 3.71 H 6
Establishes and maintains consistent standard of learners’ behavior
3.67 H 3.75 H 3.71 H 6
Is familiar with learners’ 3 M 3.75 H 3.37 M 1
Background knowledge and experiences
3.67 H 3.75 H 3.71 H 6
Demonstrate concern for holistic development of learners
3.33 M 3.5 H 3.41 M 2
Demonstrate mastery of subject 4 H 3.5 H 3.75 H 7
Communicates clear goal that are appropriate for learners
3.67 H 3.25 M 3.46 M 3
Make good use of allotted instructional time
3.33 M 3.5 H 3.41 M 2
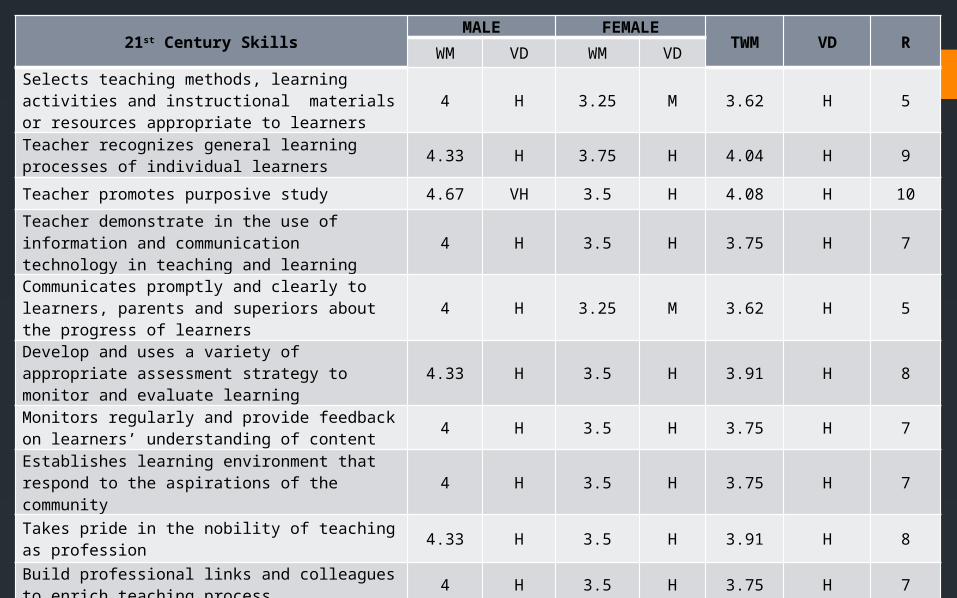
21st Century SkillsMALE FEMALE
TWM VD RWM VD WM VD
Selects teaching methods, learning activities and instructional materials or resources appropriate to learners
4 H 3.25 M 3.62 H 5
Teacher recognizes general learning processes of individual learners
4.33 H 3.75 H 4.04 H 9
Teacher promotes purposive study 4.67 VH 3.5 H 4.08 H 10
Teacher demonstrate in the use of information and communication technology in teaching and learning
4 H 3.5 H 3.75 H 7
Communicates promptly and clearly to learners, parents and superiors about the progress of learners
4 H 3.25 M 3.62 H 5
Develop and uses a variety of appropriate assessment strategy to monitor and evaluate learning
4.33 H 3.5 H 3.91 H 8
Monitors regularly and provide feedback on learners’ understanding of content
4 H 3.5 H 3.75 H 7
Establishes learning environment that respond to the aspirations of the community
4 H 3.5 H 3.75 H 7
Takes pride in the nobility of teaching as profession 4.33 H 3.5 H 3.91 H 8
Build professional links and colleagues to enrich teaching process
4 H 3.5 H 3.75 H 7
Reflects on the extent of the attainment of professional development goals
4.33 H 3.5 H 3.91 H 8
Overall Weighted Mean 3.89 H 3.53 H 3.71 H
CHAPTER V
SUMMARY, CONCLUSION AND RECOMMENDATION
