Thesis Ndlovu
151
The Wear Properties of Tungsten Carbide-Cobalt Hardmetals from the Nanoscale up to the Macroscopic Scale Der Technischen Fakultät der Universität Erlangen-Nürnberg zur Erlangung des Grades DOKTOR-INGENIEUR by Siphilisiwe Ndlovu Erlangen 2009
description
Thesis
Transcript of Thesis Ndlovu
The Wear Properties of Tungsten Carbide-Cobalt Hardmetals
from the Nanoscale up to the Macroscopic Scale
Der Technischen Fakultät der Universität Erlangen-Nürnberg
zur Erlangung des Grades
DOKTOR-INGENIEUR
by
Siphilisiwe Ndlovu
Erlangen 2009


Das Verschleißverhalten von
Wolframkarbid-Kobalt-Hartmetallen von der Nanoskala bis
zur Makroskala
Der Technischen Fakultät der Universität Erlangen-Nürnberg
zur Erlangung des Grades
DOKTOR-INGENIEUR
vorgelegt von
Siphilisiwe Ndlovu
Erlangen 2009

Als Dissertation genehmigt von
Der Technischen Fakultät der
Universität Erlangen-Nürnberg
Tag der Einreichung: 22. 09. 2009
Tag der Promotion : 08. 12. 2009
Dekan: Prof. Dr.-Ing. habil. R. German
Berichterstatter: Prof. Dr. rer.nat. M. Göken
Prof. Dr. S. Virtanen

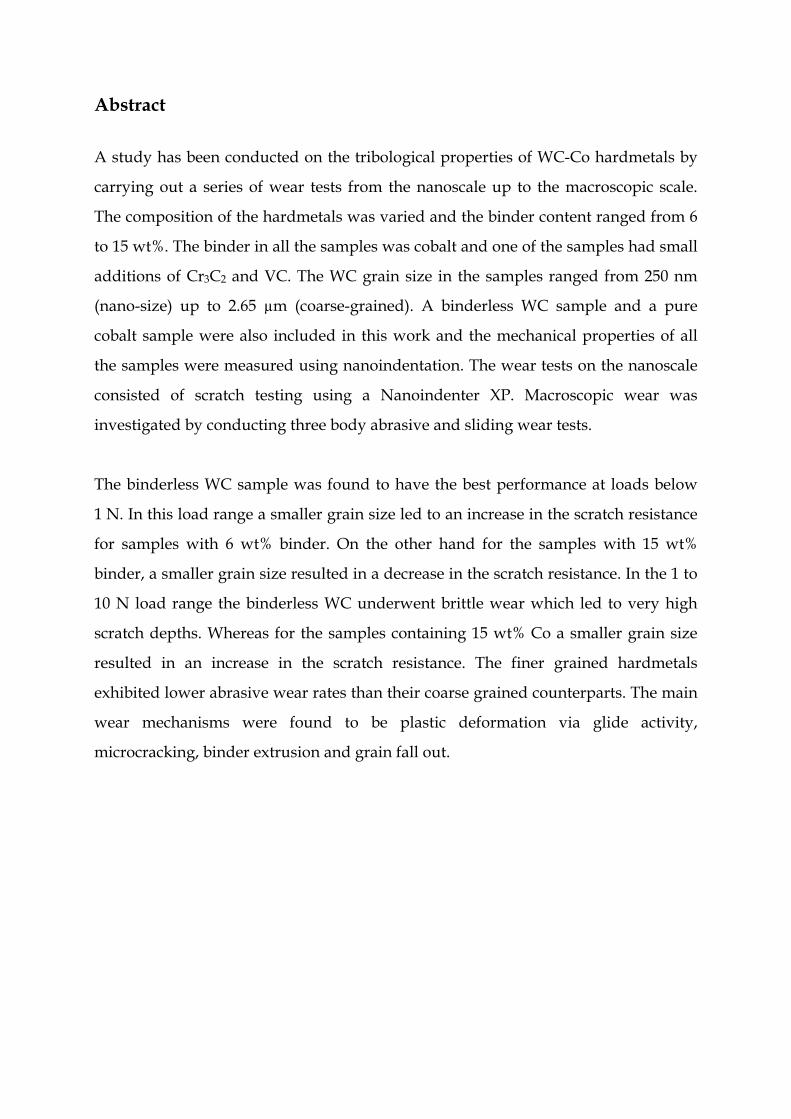
Abstract
A study has been conducted on the tribological properties of WC-Co hardmetals by
carrying out a series of wear tests from the nanoscale up to the macroscopic scale.
The composition of the hardmetals was varied and the binder content ranged from 6
to 15 wt%. The binder in all the samples was cobalt and one of the samples had small
additions of Cr3C2 and VC. The WC grain size in the samples ranged from 250 nm
(nano-size) up to 2.65 µm (coarse-grained). A binderless WC sample and a pure
cobalt sample were also included in this work and the mechanical properties of all
the samples were measured using nanoindentation. The wear tests on the nanoscale
consisted of scratch testing using a Nanoindenter XP. Macroscopic wear was
investigated by conducting three body abrasive and sliding wear tests.
The binderless WC sample was found to have the best performance at loads below
1 N. In this load range a smaller grain size led to an increase in the scratch resistance
for samples with 6 wt% binder. On the other hand for the samples with 15 wt%
binder, a smaller grain size resulted in a decrease in the scratch resistance. In the 1 to
10 N load range the binderless WC underwent brittle wear which led to very high
scratch depths. Whereas for the samples containing 15 wt% Co a smaller grain size
resulted in an increase in the scratch resistance. The finer grained hardmetals
exhibited lower abrasive wear rates than their coarse grained counterparts. The main
wear mechanisms were found to be plastic deformation via glide activity,
microcracking, binder extrusion and grain fall out.
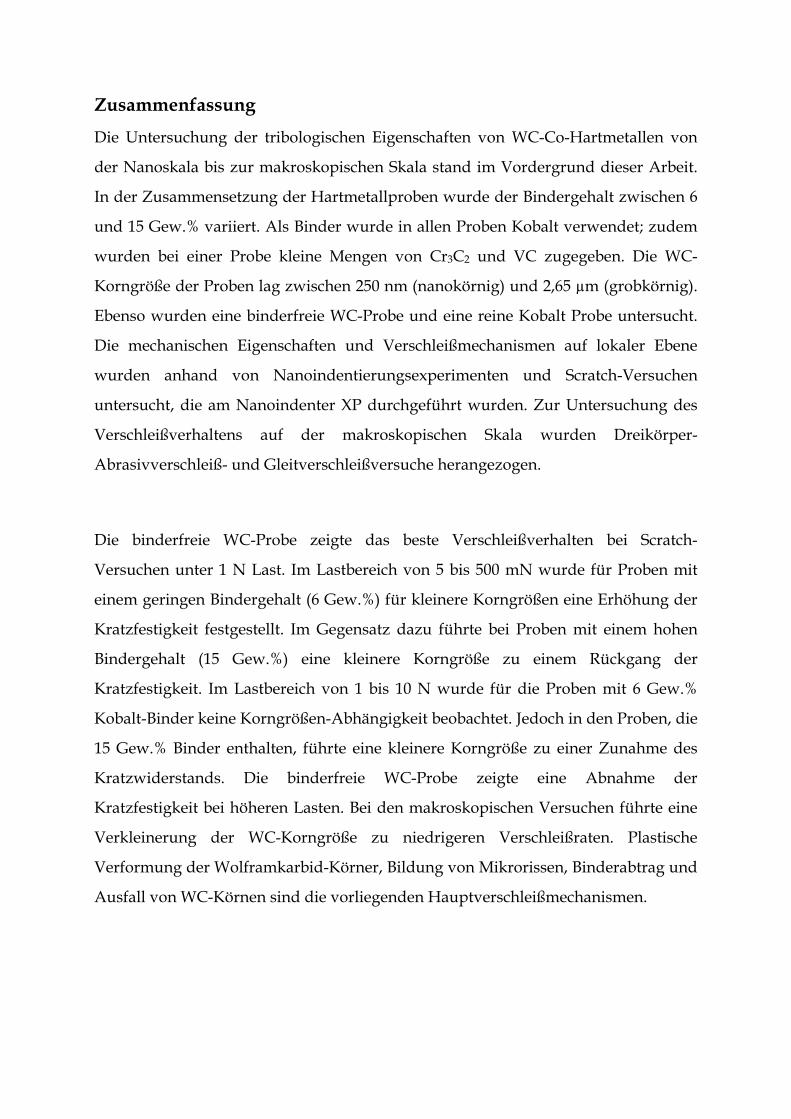
Zusammenfassung
Die Untersuchung der tribologischen Eigenschaften von WC-Co-Hartmetallen von
der Nanoskala bis zur makroskopischen Skala stand im Vordergrund dieser Arbeit.
In der Zusammensetzung der Hartmetallproben wurde der Bindergehalt zwischen 6
und 15 Gew.% variiert. Als Binder wurde in allen Proben Kobalt verwendet; zudem
wurden bei einer Probe kleine Mengen von Cr3C2 und VC zugegeben. Die WC-
Korngröße der Proben lag zwischen 250 nm (nanokörnig) und 2,65 µm (grobkörnig).
Ebenso wurden eine binderfreie WC-Probe und eine reine Kobalt Probe untersucht.
Die mechanischen Eigenschaften und Verschleißmechanismen auf lokaler Ebene
wurden anhand von Nanoindentierungsexperimenten und Scratch-Versuchen
untersucht, die am Nanoindenter XP durchgeführt wurden. Zur Untersuchung des
Verschleißverhaltens auf der makroskopischen Skala wurden Dreikörper-
Abrasivverschleiß- und Gleitverschleißversuche herangezogen.
Die binderfreie WC-Probe zeigte das beste Verschleißverhalten bei Scratch-
Versuchen unter 1 N Last. Im Lastbereich von 5 bis 500 mN wurde für Proben mit
einem geringen Bindergehalt (6 Gew.%) für kleinere Korngrößen eine Erhöhung der
Kratzfestigkeit festgestellt. Im Gegensatz dazu führte bei Proben mit einem hohen
Bindergehalt (15 Gew.%) eine kleinere Korngröße zu einem Rückgang der
Kratzfestigkeit. Im Lastbereich von 1 bis 10 N wurde für die Proben mit 6 Gew.%
Kobalt-Binder keine Korngrößen-Abhängigkeit beobachtet. Jedoch in den Proben, die
15 Gew.% Binder enthalten, führte eine kleinere Korngröße zu einer Zunahme des
Kratzwiderstands. Die binderfreie WC-Probe zeigte eine Abnahme der
Kratzfestigkeit bei höheren Lasten. Bei den makroskopischen Versuchen führte eine
Verkleinerung der WC-Korngröße zu niedrigeren Verschleißraten. Plastische
Verformung der Wolframkarbid-Körner, Bildung von Mikrorissen, Binderabtrag und
Ausfall von WC-Körnen sind die vorliegenden Hauptverschleißmechanismen.
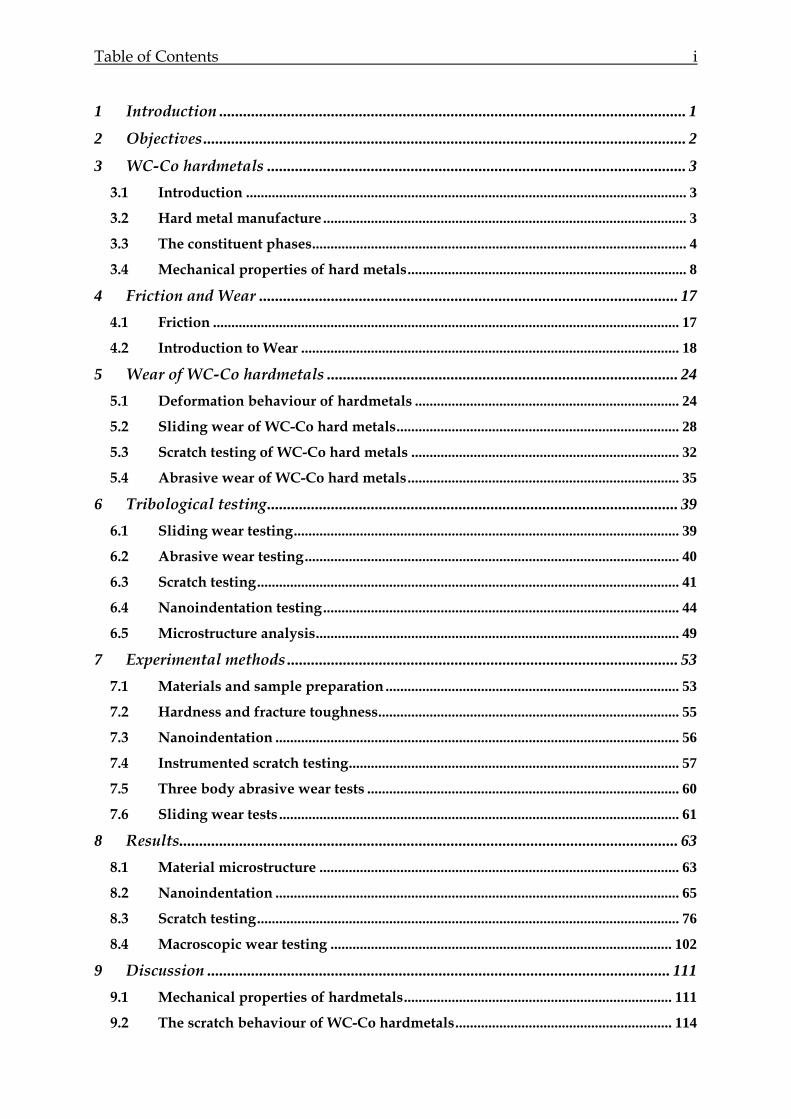
Table of Contents i
1 Introduction ..................................................................................................................... 1
2 Objectives ......................................................................................................................... 2
3 WC-Co hardmetals ......................................................................................................... 3 3.1 Introduction ........................................................................................................................ 3 3.2 Hard metal manufacture ................................................................................................... 3 3.3 The constituent phases...................................................................................................... 4 3.4 Mechanical properties of hard metals............................................................................ 8
4 Friction and Wear ......................................................................................................... 17 4.1 Friction ............................................................................................................................... 17 4.2 Introduction to Wear ....................................................................................................... 18
5 Wear of WC-Co hardmetals ........................................................................................ 24
5.1 Deformation behaviour of hardmetals ........................................................................ 24 5.2 Sliding wear of WC-Co hard metals............................................................................. 28 5.3 Scratch testing of WC-Co hard metals ......................................................................... 32 5.4 Abrasive wear of WC-Co hard metals.......................................................................... 35
6 Tribological testing....................................................................................................... 39
6.1 Sliding wear testing......................................................................................................... 39 6.2 Abrasive wear testing ...................................................................................................... 40 6.3 Scratch testing................................................................................................................... 41 6.4 Nanoindentation testing ................................................................................................. 44 6.5 Microstructure analysis................................................................................................... 49
7 Experimental methods .................................................................................................. 53
7.1 Materials and sample preparation ................................................................................ 53 7.2 Hardness and fracture toughness.................................................................................. 55 7.3 Nanoindentation .............................................................................................................. 56 7.4 Instrumented scratch testing.......................................................................................... 57 7.5 Three body abrasive wear tests ..................................................................................... 60 7.6 Sliding wear tests ............................................................................................................. 61
8 Results............................................................................................................................. 63
8.1 Material microstructure .................................................................................................. 63 8.2 Nanoindentation .............................................................................................................. 65 8.3 Scratch testing................................................................................................................... 76 8.4 Macroscopic wear testing ............................................................................................. 102
9 Discussion .................................................................................................................... 111
9.1 Mechanical properties of hardmetals......................................................................... 111 9.2 The scratch behaviour of WC-Co hardmetals........................................................... 114
Table of Contents ii
9.3 Abrasive wear ................................................................................................................. 126 9.4 Sliding wear .................................................................................................................... 127 9.5 Wear mechanisms: from the nanoscale and macroscopic scale............................. 128
10 Conclusions .............................................................................................................. 131
11 References ................................................................................................................. 133
1 Introduction 1
1 Introduction
Cemented tungsten carbide offers excellent wear resistance due to the combination of
the hard WC particles in a soft binder matrix making tungsten carbide one of the
oldest and most successful powder metallurgy products [1]. These hardmetals are
therefore used in a wide range of applications where wear resistance is very
important, such as sand blast/spray nozzles, seals in slurry pumps and component
parts in the oil industry [2,3].
Nanoscratch testing and nanoindentation measurements allow an evaluation of the
wear and mechanical properties of materials on the local scale [4,5]. In hardmetals
and cermets it is possible to measure the individual properties of the binder phase
and hard carbide phase and to possibly develop models which describe the
macroscopic mechanical deformation on the basis of the microscopic properties. The
application of nanoindentation methods in studying the properties of different
phases in composite materials separately has been shown very successfully on
nickelbase-superalloys [6].
In hardmetals the wear properties are the most important mechanical properties.
Nanoindentation techniques allow also quantitative measurements of lateral forces
during indenting and scratching. The relations between hardness and modulus of
elasticity and of friction and wear can be investigated on the microstructural scale.
The scratch resistance is not directly related with the hardness or other mechanical
properties. However, a deeper understanding of the relation between hardness and
scratch resistance is of interest. [7]
The fracture mechanisms can be studied with in-situ deformation experiments in a
AFM or SEM. With scanning probe techniques the microstructure including their
magnetic properties and the nanotribological properties can be studied in detail and
could lead to a better understanding of the microstructure property relations.
2 Objectives 2
2 Objectives
The main objective of this study was to investigate the wear properties of tungsten
carbide hardmetals from the nano to the macro scale. These investigations would be
used to determine the correlation between the macroscopic and nanoscale wear
mechanisms in tungsten carbide hardmetals and to understand the microstructural
influences on the wear.
This objective was explored through two main experimental approaches:
• The nanoscale wear of WC-Co hardmetals was conducted by carrying out
scratch tests on the samples .
• The macroscopic wear was conducted by carrying out sliding wear tests using
a tribometer and by three body abrasive wear tests.
The microstructural properties of the hardmetals were varied and two main features
investigated:
• The influence of the WC grain size on the wear mechanisms at both nano and
macro scale.
• The influence of the binder content on the wear mechanisms.
In addition the influence of the mechanical properties of the hardmetals on the
sliding wear properties will be investigated.
3 WC-Co hardmetals 3
3 WC-Co hardmetals
3.1 Introduction
WC-Co hardmetals are made by cementing very hard monocarbide grains (WC) in a
binder matrix of tough cobalt metal (Co) by liquid phase sintering. The high
solubility of WC in cobalt at high temperatures and the excellent wetting of WC by
the liquid cobalt binder result in optimum densification during liquid phase
sintering, producing a structure with little porosity [8]. The resultant cemented
carbide has high strength, toughness and hardness.
3.2 Hard metal manufacture
The manufacturing process consists of five main steps:
• production of powders,
• milling,
• pressing,
• pre-sintering and
• sintering.
Several techniques are available for the manufacture of tungsten carbide powders.
These include a traditional method based on the production of tungsten powder via
the hydrogen reduction of tungsten oxide followed by carburisation. The direct
caburisation of tungsten oxides can also be conducted [9]. The spray conversion
process allows the WC-Co powder to be produced in situ [10].
Milling of the powders is carried out to produce a homogeneous dispersion of
tungsten carbide in cobalt. During this process the particle size of the tungsten
carbide is normally reduced and stresses are induced in the particles which facilitates
the sintering process [11-14]. The cobalt may also undergo a phase transformation
during milling from a predominantly cubic structure to a hexagonal close packed
structure. A lubricant is added to the blended powder, mainly to reduce the friction
3 WC-Co hardmetals 4
between the powder mixture and the surfaces of the tools and also to minimize the
tendency to form cracks [15].
The milled powders are pressed into shape using rigid steel or carbide dies with
pressures of up to 150-990 MPa [15]. Components can be pressed directly into
specified shapes or they may be pressed into large blocks which will later be shaped.
Following the pressing process the composite is pre-sintered in hydrogen with the
temperature increasing from room temperature up to 800 °C. The hydrogen reduces
the amount of adsorbed oxygen and oxides on the surface of the particles. When
cooled the material is coherent enough to allow further shaping and it is also less
susceptible to damage in the compacted form.
Sintering is normally conducted in vacuum at temperatures between approximately
1350 °C and 1550 °C. The rounded shape of the tungsten carbides in the early stages
of sintering leads to a facetted morphology which results in the flat trigonal prism
shape of the WC grains [16].
3.3 The constituent phases
3.3.1 Cobalt
Cobalt is the most commonly used binder for WC because of its excellent carbide
wetting and adhesion properties. The capillary action of cobalt during sintering
allows the achievement of high densities [8].
Cobalt exists in two allotropic forms, the hexagonally packed form which is stable at
temperatures below 417 °C and the face centred cubic form which is stable up to a
temperature of 1495 °C, the melting point of cobalt [17,18]. However, a significant
amount of fcc cobalt is present in sintered WC-Co hard metals at room temperature.
The transformation between the two phases is martensitic in nature [19,20]. The
3 WC-Co hardmetals 5
cobalt transformation is also affected by the amount of tungsten carbide dissolved in
the binder and the binder mean free path, which is the distance between two carbide
particles. A high tungsten and carbon concentration in the binder has been shown to
increase the martensitic transformation temperature from 417 °C to approximately
750 °C [10]. This prevents the formation of the brittle hcp phase at low temperatures.
Hardmetals with a finer microstructure, have been found to have a higher fcc/hcp
ratio than conventional grades, this is due to the higher solution of tungsten in the
binder phase [10].
3.3.2 Tungsten carbide
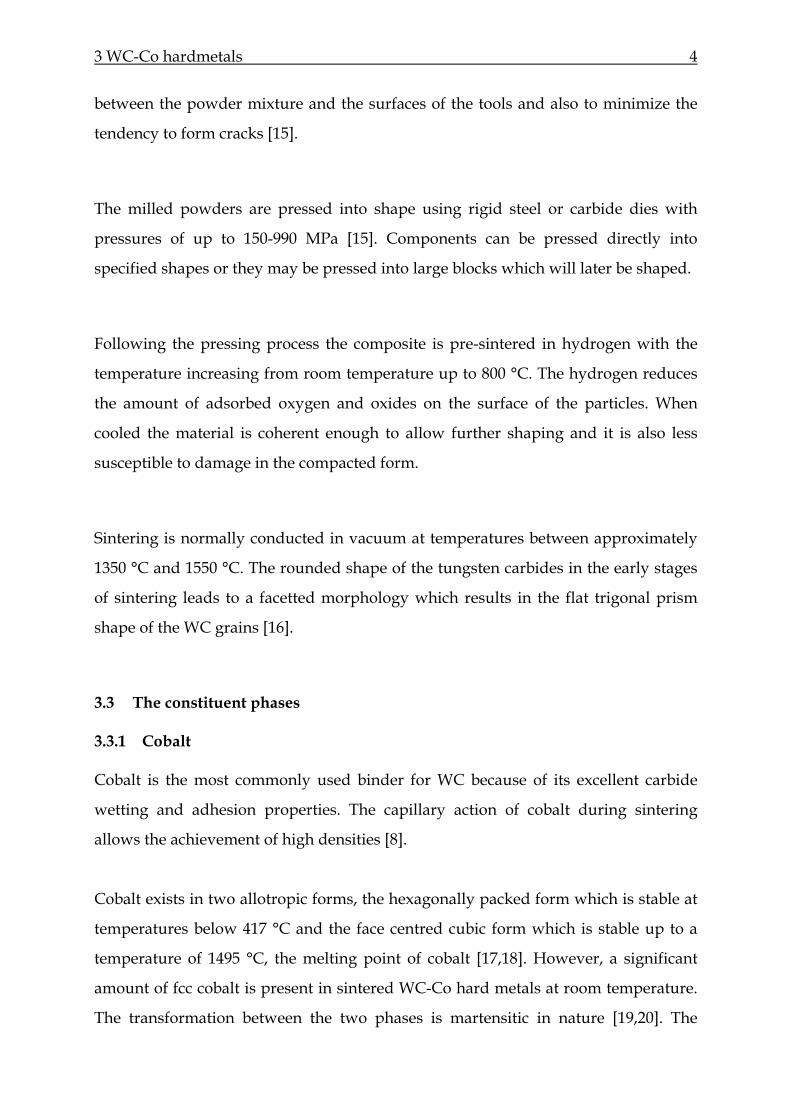
Tungsten combines with carbon to form two carbides, WC, which has a maximum
microhardness of 24 GPa and W2C with a microhardness of 30 GPa [21]. Pure WC
does not melt under standard atmospheric conditions, but decomposes into a liquid
phase and graphite above a temperature of approximately 2780 °C as seen in the W-C
phase diagram.
Figure 3-1: Pseudo-eutectic WC-Co phase diagram [22]
3 WC-Co hardmetals 6
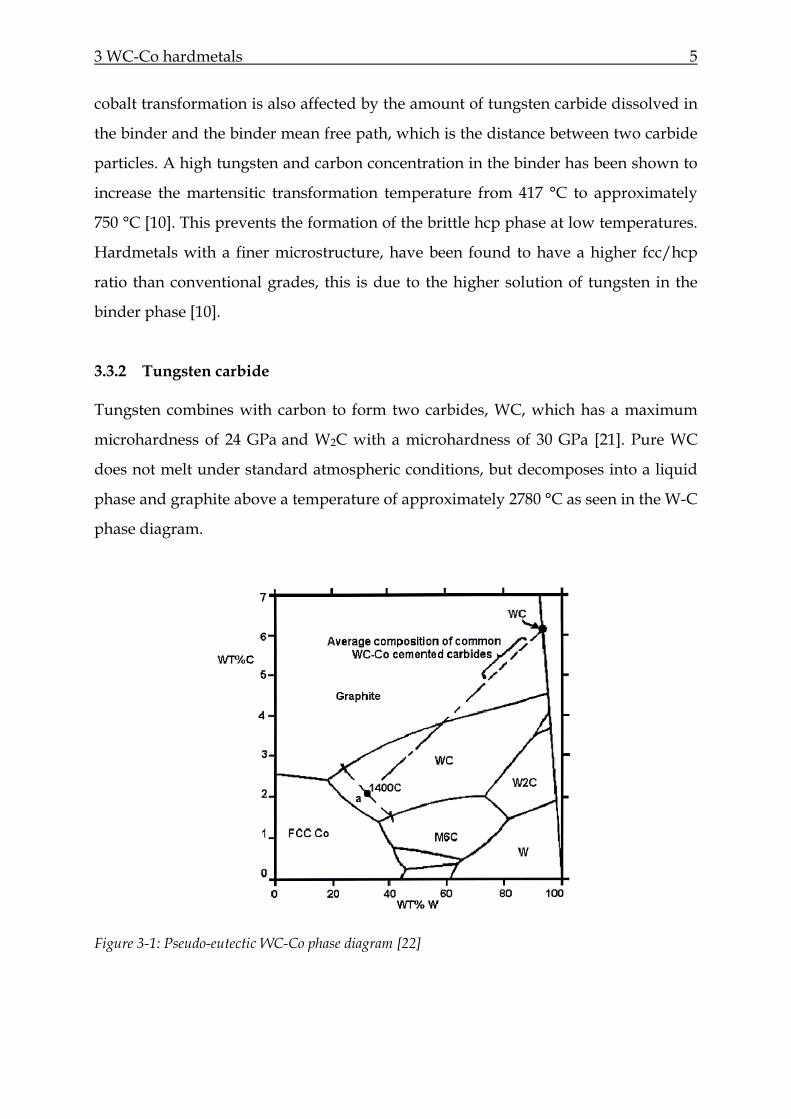
The major phase in cemented carbides is the monocarbide WC. This has a simple
hexagonal crystal structure with two atoms per unit cell and a c/a ratio of 0.976 [16].
The W atoms occupies the 0,0,0 position and the carbon atom is located in the 31 ,
32 ,
21 or in the
32 ,
31 ,
21 position resulting in a non-centrosymmetric crystal structure
[23]. The WC crystal structure is polar with two sets of three equivalent { 0110 } planes
which leads to the formation of triangle-shaped crystals.
As a result of its crystal structure many of the properties of individual tungsten
carbide grains, including hardness, are highly anisotropic. However, no anisotropy is
observed in the sintered materials due to the random orientation of the grains.
Figure 3-2: The crystal structure of hcp tungsten carbide [21]
The hardness of tungsten carbide grains at room temperature varies from a
minimum of 10 GPa (measured parallel to the c-axis on the { 0110 } planes) to a
maximum of 24 GPa (measured along the basal plane) [20]. Up until the mid 1960s
WC was considered to a perfectly brittle phase however a lot of evidence exists
showing the plastic deformation of WC grains. Slip band formation has been
observed close to hardness indentations in WC single crystals. Glide bands and
dislocation networks show that the WC grains in WC-Co hard metals are plastically
deformed during compression testing. The slip planes are { 0110 } (prism planes) with
3 WC-Co hardmetals 7
< 0001>, < 0211 > and < 3211 > as the preferred slip directions [24,25]. It has been
suggested that the { 0110 } planes are the most energetically favourable for cleavage.
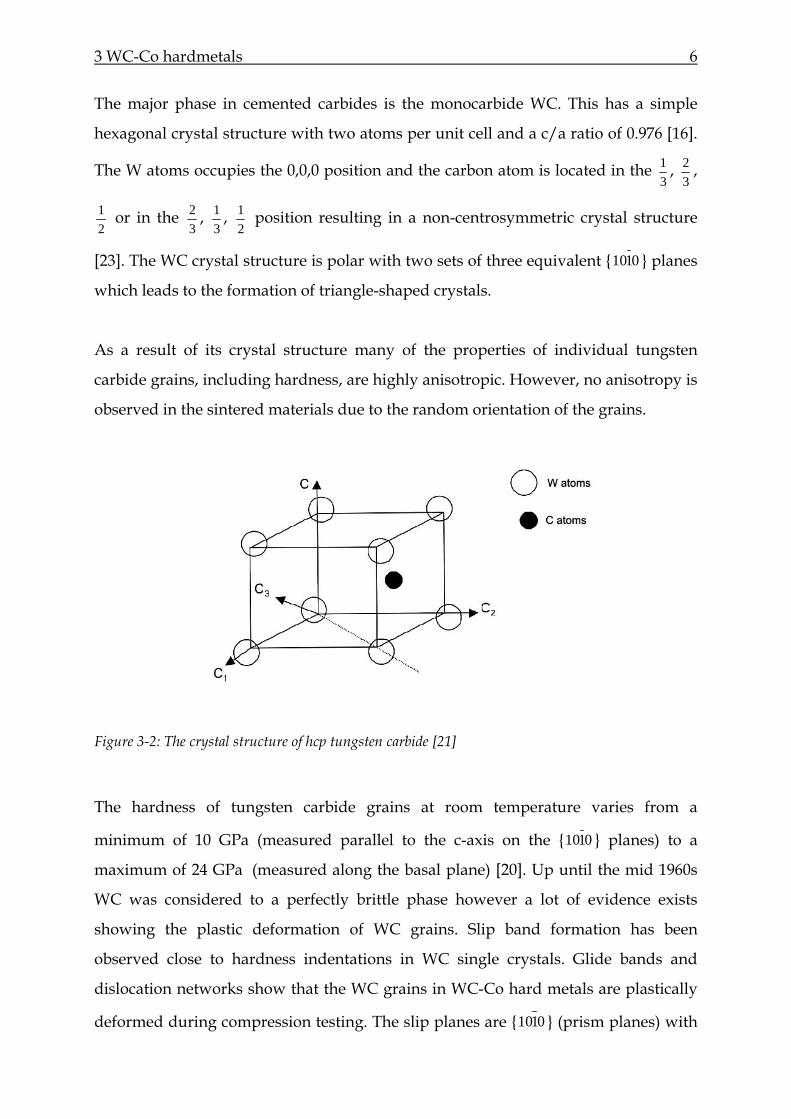
3.3.3 The microstructural features of WC-Co alloys
The grain size of the WC powder used, the amount of cobalt and the processing
parameters such as the sintering time and temperature determine the microstructure
of the cemented carbide. The four features that characterise the microstructure are
the WC grain size, cobalt content, binder mean free path and contiguity.
Figure 3-3: A schematic representation of the WC-Co alloy illustrating the microstructural
parameters, where λCo is the mean free path of the binder phase, dWC is the WC grain size and CWC is
contiguity [26]
The WC grain size is defined as the mean linear intercept of the WC phase and this
can vary from ultra fine (200 nm) up to coarse grained (5 µm).
The mean free path is defined as the average thickness of the binder between the WC
grains and is dependent on the cobalt content and the size of the WC grains.
Contiguity is a measure of the continuity of the carbide skeleton existing within a
WC-Co alloy and is defined as the fraction of the total WC grain boundary surface
area that is taken up by the WC/WC interface. Contiguity decreases with increasing
binder content, decreasing WC grain size and is also dependent on the processing
history of the carbide.
3 WC-Co hardmetals 8
The grain size, mean free path and contiguity all influence the mechanical properties
of WC-Co hardmetals and this is discussed in the following section.
3.4 Mechanical properties of hard metals
3.4.1 Hardness
The hardness of WC-Co hardmetals is affected not only by the hardmetal
composition but also by the level of porosity and the microstructure. The hardness of
tungsten carbide based hard metals has been extensively characterised and been
found to increase with decreasing cobalt content and decreasing WC grain size [27].
The highly constraining WC grains increase the yield strength of the cobalt binder
and make the hardness of the hard metals highly dependent on the binder mean free
path and the overall cobalt content.
Lee and Gurland expressed this dependence in terms of a Hall-Petch type relation
given in equation 3.1. Results from Roebuck et al. suggest that this dependence
becomes invalid when the WC grain size is below 0.3 µm and the hardness is
significantly lower than that predicted by Lee and Gurland’s model [28].
HWC = a + bd-1/2 (kg/mm2) E 3-1
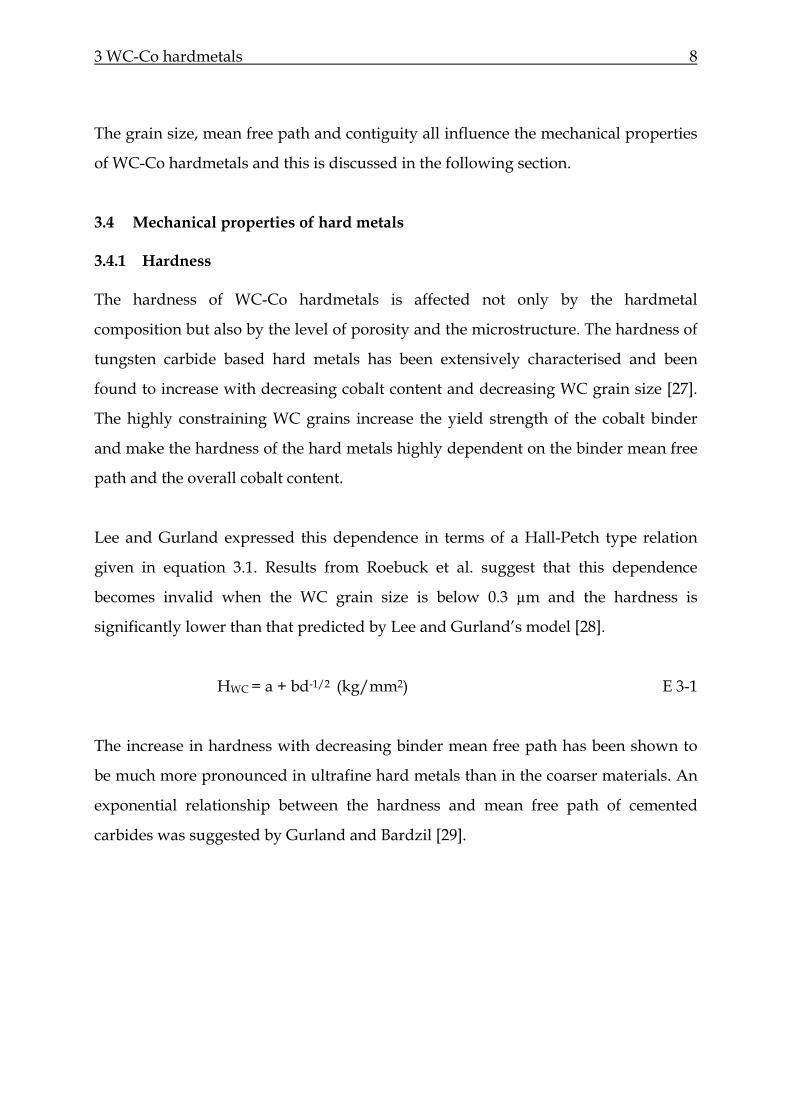
The increase in hardness with decreasing binder mean free path has been shown to
be much more pronounced in ultrafine hard metals than in the coarser materials. An
exponential relationship between the hardness and mean free path of cemented
carbides was suggested by Gurland and Bardzil [29].
3 WC-Co hardmetals 9
Figure 3-4: Dependence of the hardness of WC-Co hardmetals on the binder mean free path [29]
The hardness in WC grains is strongly anisotropic and Knoop hardness values
ranging from 2000 HK on the (0001) plane and 1050 HK for indentation on the {1010}
and {1011} planes have been reported [21,30,31].
3.4.2 Fracture toughness
Fracture toughness indicates the resistance of a material to fracture in the presence of
a sharp crack. The fracture toughness is measured by the critical stress intensity
factor, KIC. The KIC values are calculated from equation 3-2 [32].
KIC = A ∑
iia
HF E 3-2
Where H is the hardness of the material, F the indentation load and ai the length of
each Palmqvist crack. When all the quantities are expressed in SI units the constant A
is equal to 0.2784.
3 WC-Co hardmetals 10
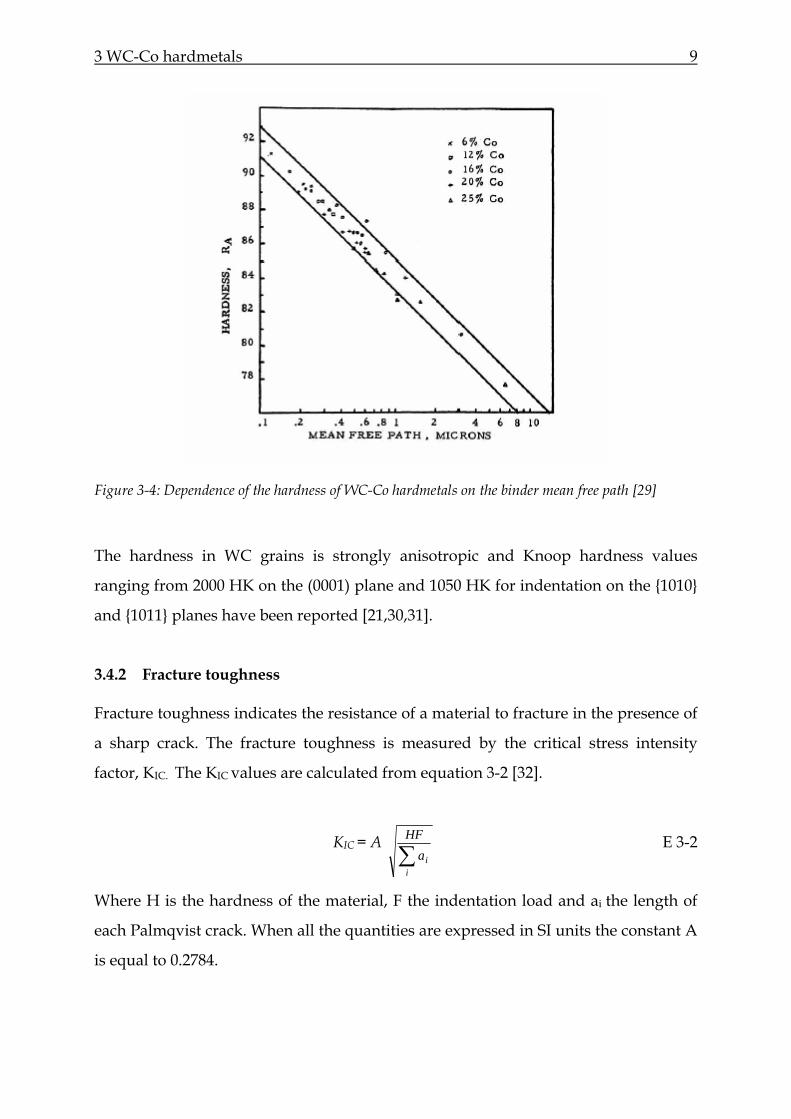
A plot of the toughness versus hardness exhibits the expected relationship, i.e. the
toughness decreases with increasing hardness. However for nanostructured hard
metals there is no decrease of the toughness with increasing hardness which implies
that different toughening mechanisms are present in conventional and
nanostructured materials. The fracture toughness and hardness of hardmetals vary in
different ways when the composition and/or microstructure of the material are
varied. There is some disagreement in the literature as to what type of relationship
between these properties exists [33-35]
Figure 3-5: Fracture toughness plotted against hardness for a range of WC-Co hardmetals with
differing grain sizes and binder contents [36]
Roeback and Almond found that as the cobalt volume fraction and WC grain size are
decreased the fracture toughness tends towards a limiting value of about 7 MPa
m1/2 [9], later work on very fine grained hard metals confirmed this trend [36,37].
These results suggest that further refinement in the WC grain size would lead to an
increase in hardness without any sacrifice in the fracture toughness of the hard
metal.
3 WC-Co hardmetals 11
3.4.3 Young’s modulus
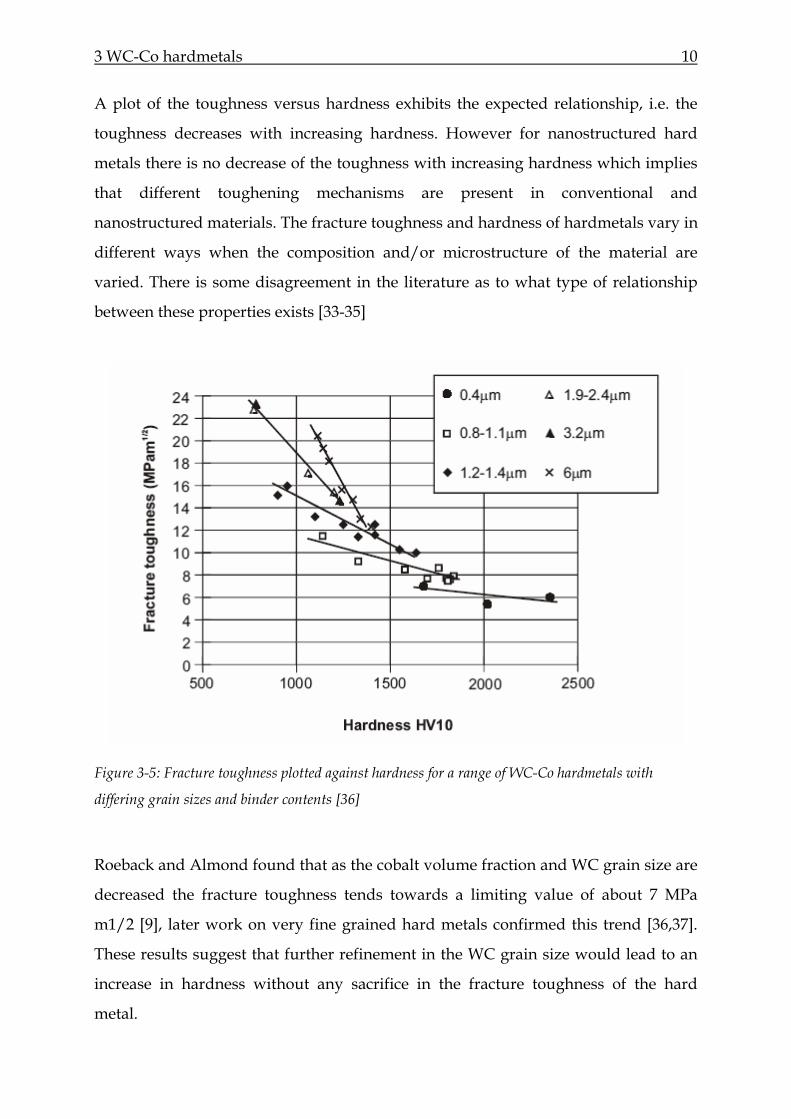
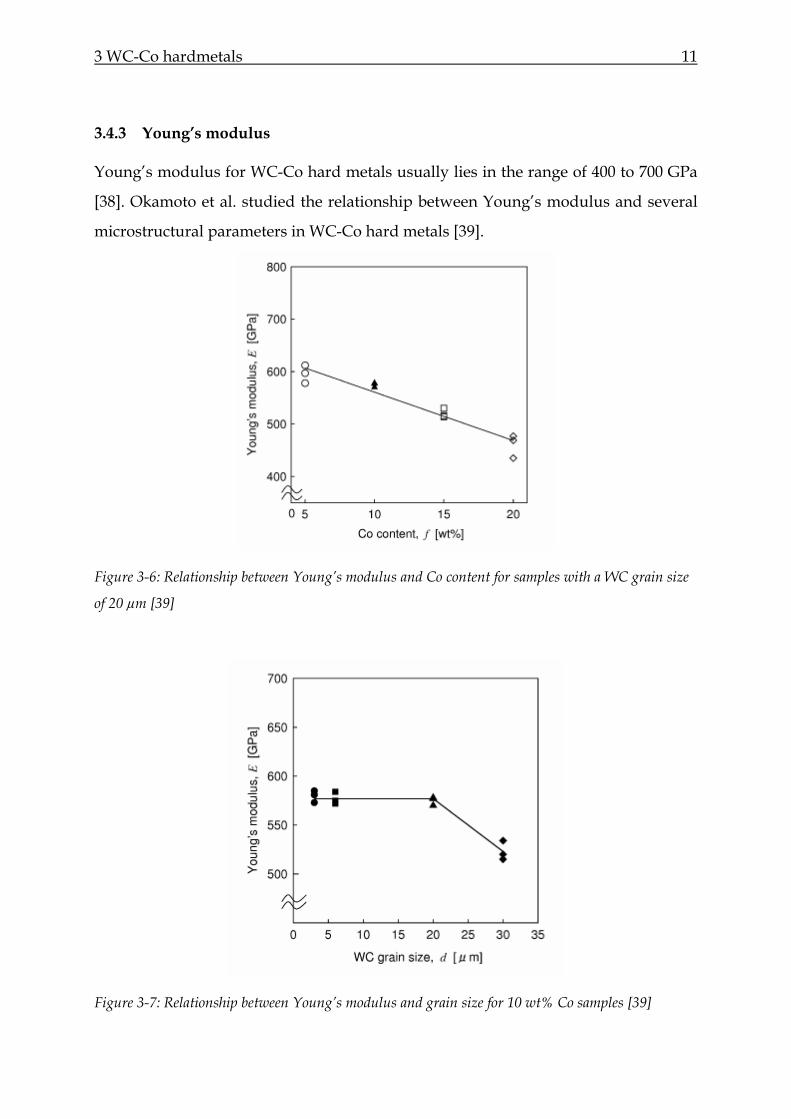
Young’s modulus for WC-Co hard metals usually lies in the range of 400 to 700 GPa
[38]. Okamoto et al. studied the relationship between Young’s modulus and several
microstructural parameters in WC-Co hard metals [39].
Figure 3-6: Relationship between Young’s modulus and Co content for samples with a WC grain size
of 20 µm [39]
Figure 3-7: Relationship between Young’s modulus and grain size for 10 wt% Co samples [39]
3 WC-Co hardmetals 12
The Young’s modulus had a value of approximately 577 GPa for samples with a WC
grain size ranging from 3 to 20 µm and 523 GPa for samples with a WC grain size of
30 µm. Therefore no clear correlation between the WC grain size and Young’s
modulus could be established. However, the Young’s modulus was found to be
inversely proportional to the Co content as shown in figure 3-6. This suggests that
the Young’s modulus of WC-Co hard metals depends on the ratio of WC to Co.
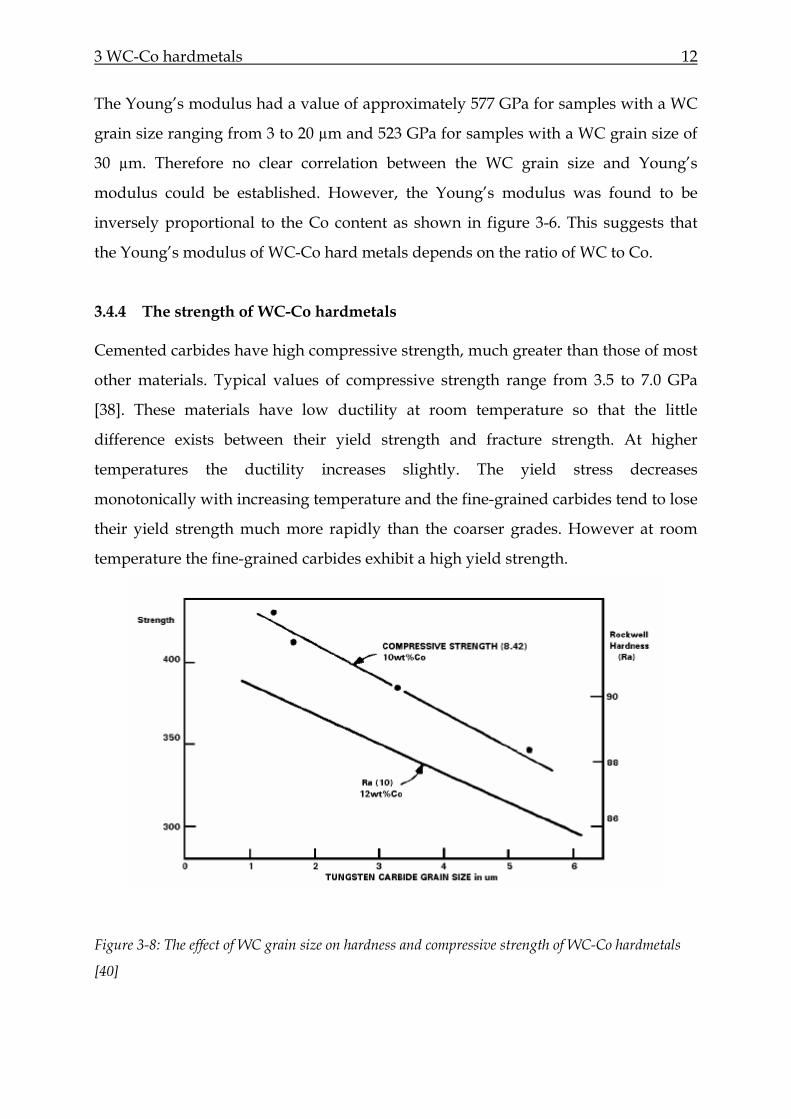
3.4.4 The strength of WC-Co hardmetals
Cemented carbides have high compressive strength, much greater than those of most
other materials. Typical values of compressive strength range from 3.5 to 7.0 GPa
[38]. These materials have low ductility at room temperature so that the little
difference exists between their yield strength and fracture strength. At higher
temperatures the ductility increases slightly. The yield stress decreases
monotonically with increasing temperature and the fine-grained carbides tend to lose
their yield strength much more rapidly than the coarser grades. However at room
temperature the fine-grained carbides exhibit a high yield strength.
Figure 3-8: The effect of WC grain size on hardness and compressive strength of WC-Co hardmetals
[40]
3 WC-Co hardmetals 13
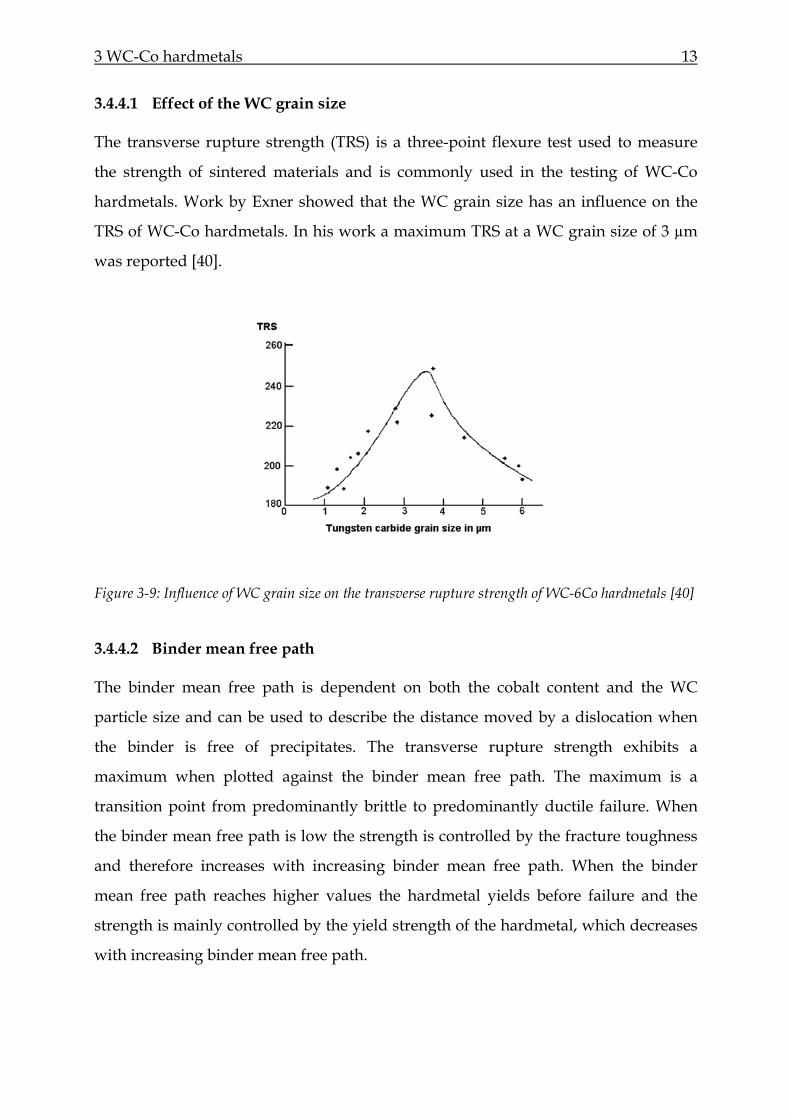
3.4.4.1 Effect of the WC grain size
The transverse rupture strength (TRS) is a three-point flexure test used to measure
the strength of sintered materials and is commonly used in the testing of WC-Co
hardmetals. Work by Exner showed that the WC grain size has an influence on the
TRS of WC-Co hardmetals. In his work a maximum TRS at a WC grain size of 3 µm
was reported [40].
Figure 3-9: Influence of WC grain size on the transverse rupture strength of WC-6Co hardmetals [40]
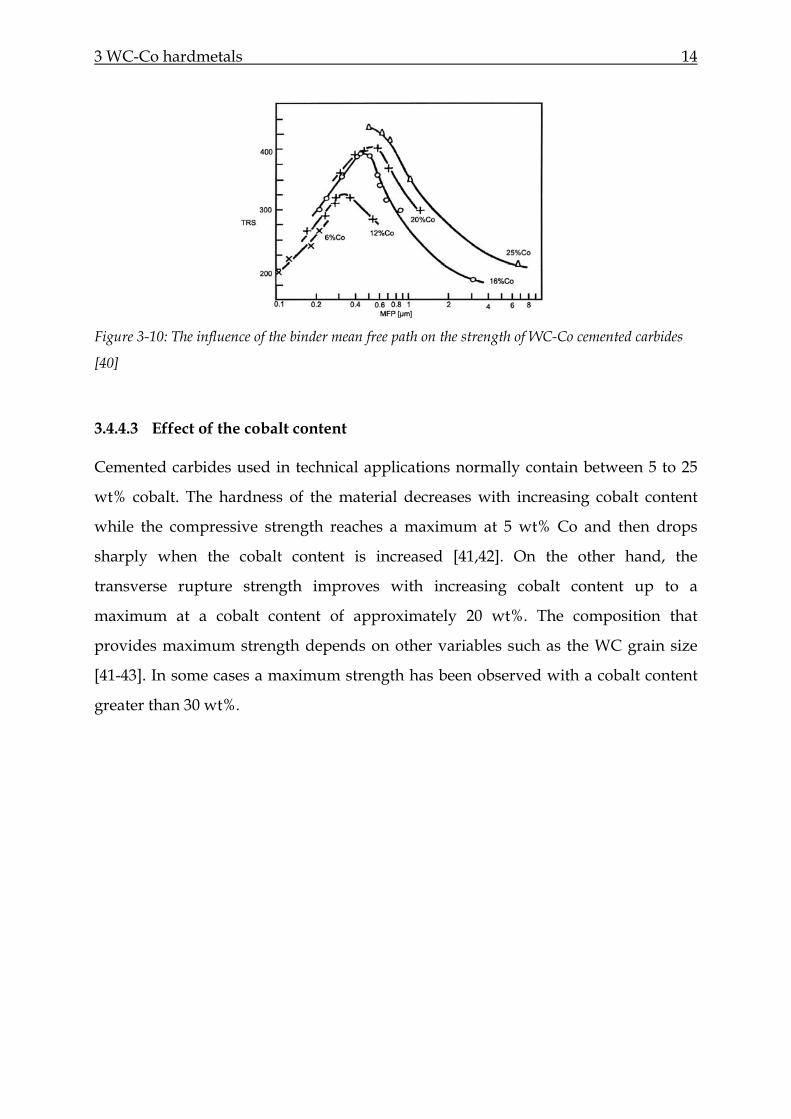
3.4.4.2 Binder mean free path
The binder mean free path is dependent on both the cobalt content and the WC
particle size and can be used to describe the distance moved by a dislocation when
the binder is free of precipitates. The transverse rupture strength exhibits a
maximum when plotted against the binder mean free path. The maximum is a
transition point from predominantly brittle to predominantly ductile failure. When
the binder mean free path is low the strength is controlled by the fracture toughness
and therefore increases with increasing binder mean free path. When the binder
mean free path reaches higher values the hardmetal yields before failure and the
strength is mainly controlled by the yield strength of the hardmetal, which decreases
with increasing binder mean free path.
3 WC-Co hardmetals 14
Figure 3-10: The influence of the binder mean free path on the strength of WC-Co cemented carbides
[40]
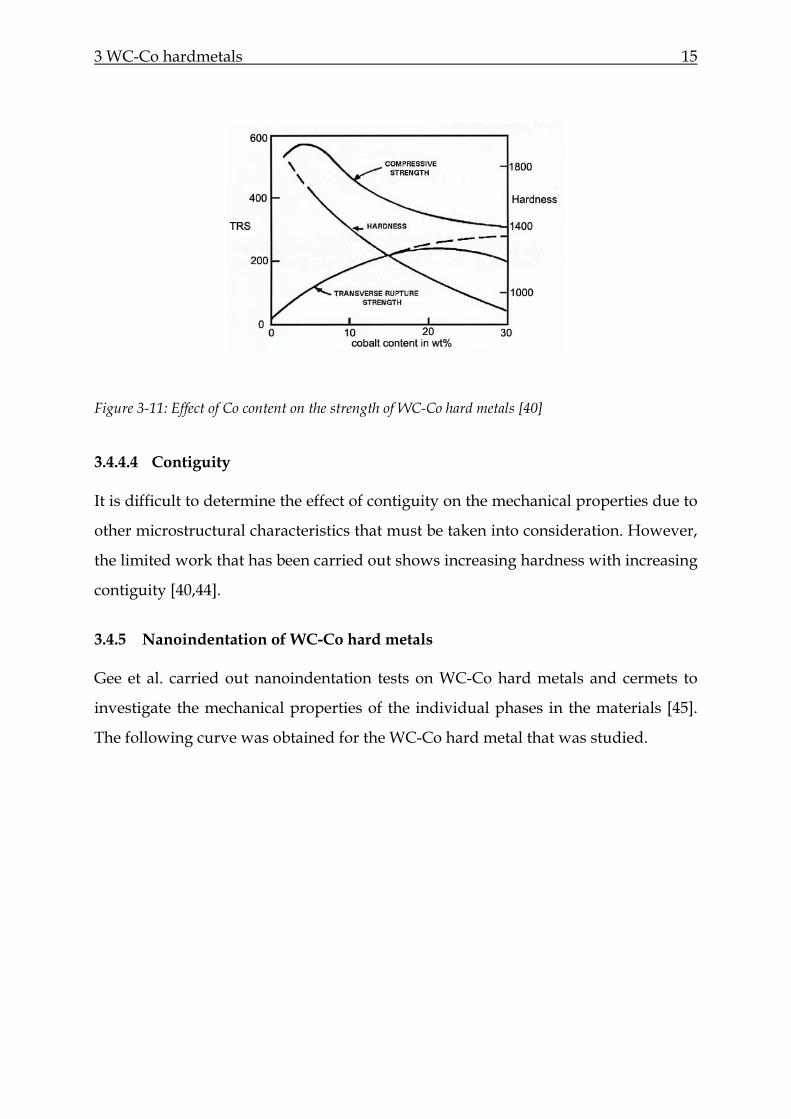
3.4.4.3 Effect of the cobalt content
Cemented carbides used in technical applications normally contain between 5 to 25
wt% cobalt. The hardness of the material decreases with increasing cobalt content
while the compressive strength reaches a maximum at 5 wt% Co and then drops
sharply when the cobalt content is increased [41,42]. On the other hand, the
transverse rupture strength improves with increasing cobalt content up to a
maximum at a cobalt content of approximately 20 wt%. The composition that
provides maximum strength depends on other variables such as the WC grain size
[41-43]. In some cases a maximum strength has been observed with a cobalt content
greater than 30 wt%.
3 WC-Co hardmetals 15
Figure 3-11: Effect of Co content on the strength of WC-Co hard metals [40]
3.4.4.4 Contiguity
It is difficult to determine the effect of contiguity on the mechanical properties due to
other microstructural characteristics that must be taken into consideration. However,
the limited work that has been carried out shows increasing hardness with increasing
contiguity [40,44].
3.4.5 Nanoindentation of WC-Co hard metals
Gee et al. carried out nanoindentation tests on WC-Co hard metals and cermets to
investigate the mechanical properties of the individual phases in the materials [45].
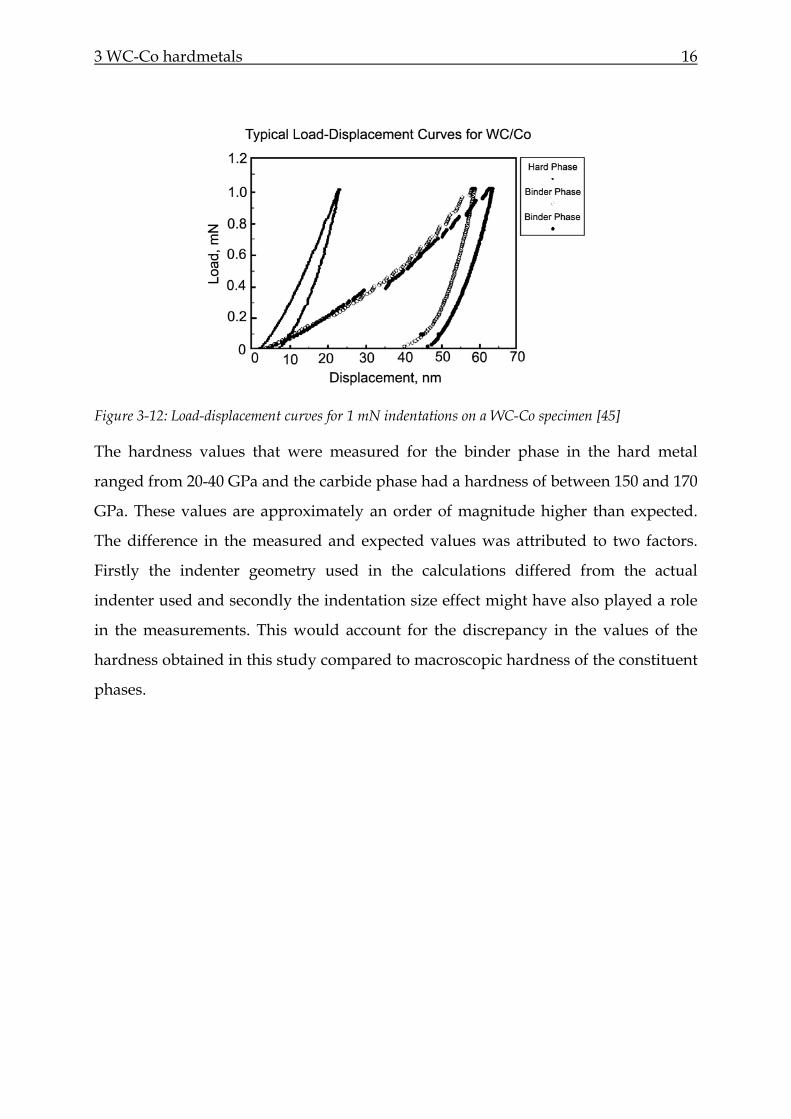
The following curve was obtained for the WC-Co hard metal that was studied.
3 WC-Co hardmetals 16
Figure 3-12: Load-displacement curves for 1 mN indentations on a WC-Co specimen [45]
The hardness values that were measured for the binder phase in the hard metal
ranged from 20-40 GPa and the carbide phase had a hardness of between 150 and 170
GPa. These values are approximately an order of magnitude higher than expected.
The difference in the measured and expected values was attributed to two factors.
Firstly the indenter geometry used in the calculations differed from the actual
indenter used and secondly the indentation size effect might have also played a role
in the measurements. This would account for the discrepancy in the values of the
hardness obtained in this study compared to macroscopic hardness of the constituent
phases.
4 Friction and Wear 17
4 Friction and Wear
This work focuses on the wear of cemented carbides therefore an understanding of
the fundamentals of the friction and wear processes that take place is essential. The
main focus of the work is the wear. However the friction behaviour is also of interest
and will be discussed briefly. This will be followed by a discussion of the different
wear mechanisms that occur in tribological systems and chapter 5 will concentrate on
the wear of WC-Co hardmetals.
4.1 Friction
Friction is defined as the resistance encountered by one body in moving over
another. This definition covers two important types of motion, sliding and rolling. In
both these types of motion a tangential force is needed to move the upper body over
the stationary counterface. The ratio between the frictional force F and the normal
load W is known as the coefficient of friction and is usually denoted by the symbol µ:
µ = F/W E 4-1
The magnitude of the friction force is normally described by the value of the
coefficient of friction which can vary from 0.001 to greater than 10. The coefficient of
friction normally lies in the range of 0.1 to 1 for most common materials sliding in
air [46].
The frictional force needed to initiate sliding is usually greater than that necessary to
maintain it and therefore the coefficient of static friction is greater than the coefficient
of dynamic friction. Once sliding is established, µ is found to be nearly independent
of the sliding velocity over a wide range for many systems although at high sliding
speeds, of the order of tens or hundreds of metres per second, µd falls with increasing
velocity.
4 Friction and Wear 18
4.2 Introduction to Wear
Wear is defined as the progressive loss of material from the surface of a solid body
due to mechanical action, i.e. the contact and relative motion of a body against a
solid, liquid or gaseous counterbody [47]. Wear occurs in many different situations,
for example, in piston rings, gears and in human body joints such as the knee and
hip. In all these cases widely varying wear conditions exist. Friction and wear are
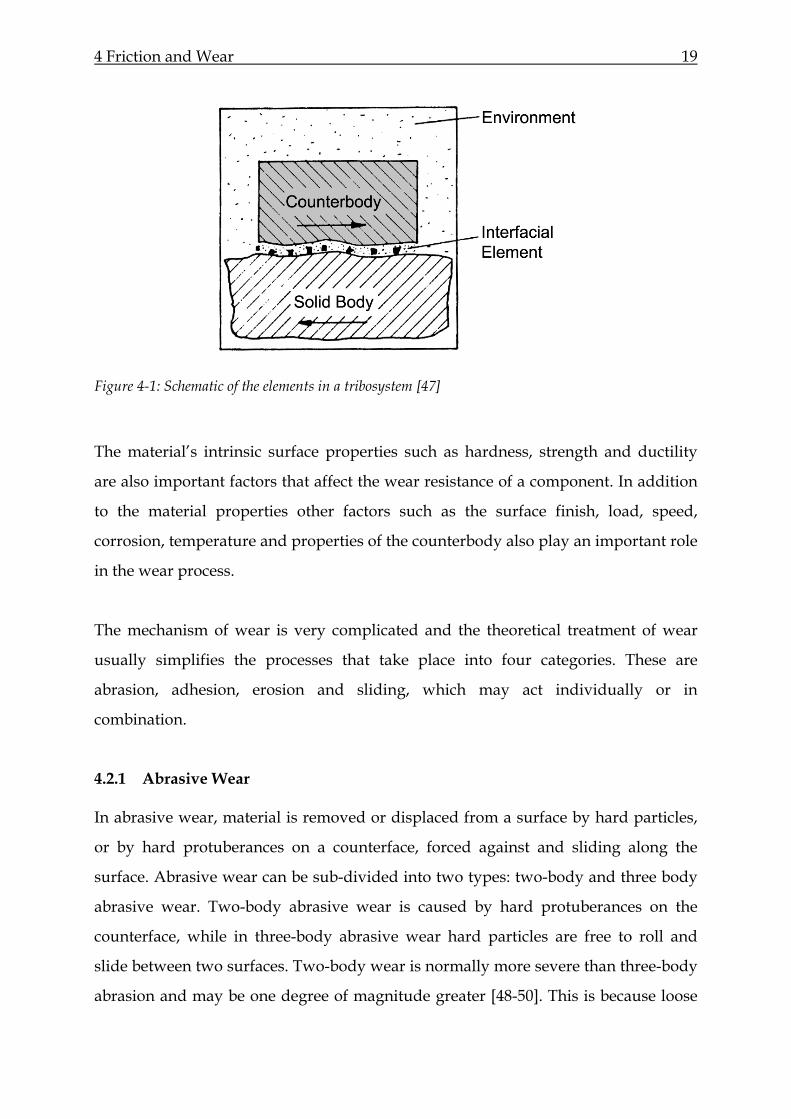
both characteristics of the engineering system, which is called the tribosystem;
represented in Figure 4-1: Schematic of the elements in a tribosystem
The tribosystem usually consists of four elements,
1. A solid body,
2. Counterbody,
3. Interfacial element,
4. Environment.
The nature of the various elements that make up the tribosystem will clearly have a
direct effect on the wear process. The counterbody may be a solid, a liquid, a gas or a
mixture of these. Interfacial elements include lubricants, adsorbed and oxidised
layers and solid particles.
Wear can be divided into the following categories:
• Solid particle erosion
• Slurry erosion
• Cavitation erosion
• Abrasive wear
• Sliding wear
• Adhesive wear
In this work the focus is on abrasive, sliding and adhesive wear and these will be
described in further detail in the sections that follow.
4 Friction and Wear 19
Figure 4-1: Schematic of the elements in a tribosystem [47]
The material’s intrinsic surface properties such as hardness, strength and ductility
are also important factors that affect the wear resistance of a component. In addition
to the material properties other factors such as the surface finish, load, speed,
corrosion, temperature and properties of the counterbody also play an important role
in the wear process.
The mechanism of wear is very complicated and the theoretical treatment of wear
usually simplifies the processes that take place into four categories. These are
abrasion, adhesion, erosion and sliding, which may act individually or in
combination.
4.2.1 Abrasive Wear
In abrasive wear, material is removed or displaced from a surface by hard particles,
or by hard protuberances on a counterface, forced against and sliding along the
surface. Abrasive wear can be sub-divided into two types: two-body and three body
abrasive wear. Two-body abrasive wear is caused by hard protuberances on the
counterface, while in three-body abrasive wear hard particles are free to roll and
slide between two surfaces. Two-body wear is normally more severe than three-body
abrasion and may be one degree of magnitude greater [48-50]. This is because loose
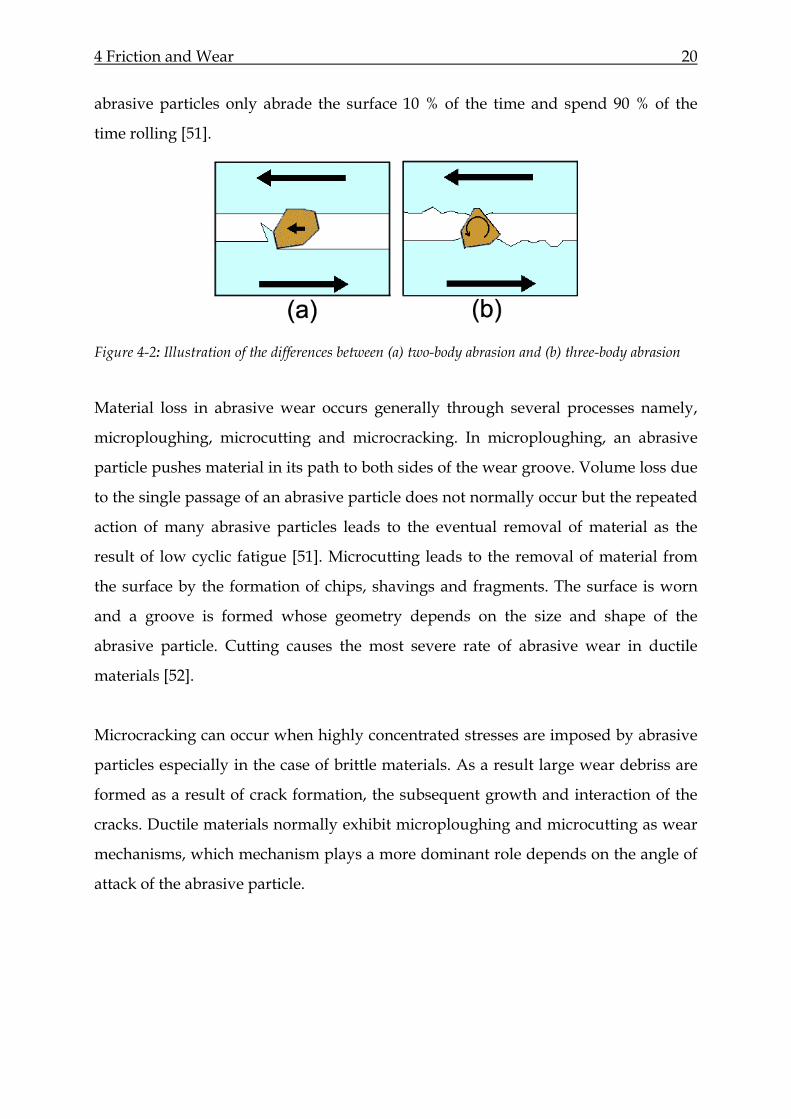
4 Friction and Wear 20
abrasive particles only abrade the surface 10 % of the time and spend 90 % of the
time rolling [51].
Figure 4-2: Illustration of the differences between (a) two-body abrasion and (b) three-body abrasion
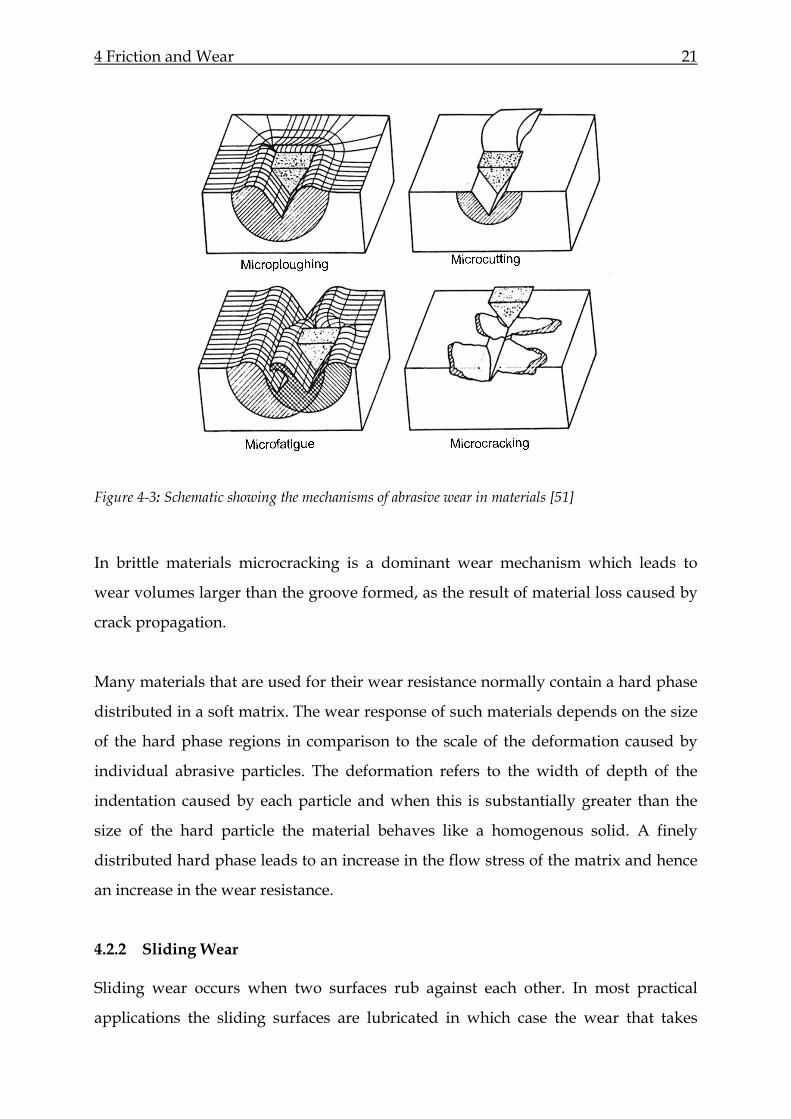
Material loss in abrasive wear occurs generally through several processes namely,
microploughing, microcutting and microcracking. In microploughing, an abrasive
particle pushes material in its path to both sides of the wear groove. Volume loss due
to the single passage of an abrasive particle does not normally occur but the repeated
action of many abrasive particles leads to the eventual removal of material as the
result of low cyclic fatigue [51]. Microcutting leads to the removal of material from
the surface by the formation of chips, shavings and fragments. The surface is worn
and a groove is formed whose geometry depends on the size and shape of the
abrasive particle. Cutting causes the most severe rate of abrasive wear in ductile
materials [52].
Microcracking can occur when highly concentrated stresses are imposed by abrasive
particles especially in the case of brittle materials. As a result large wear debriss are
formed as a result of crack formation, the subsequent growth and interaction of the
cracks. Ductile materials normally exhibit microploughing and microcutting as wear
mechanisms, which mechanism plays a more dominant role depends on the angle of
attack of the abrasive particle.
4 Friction and Wear 21
Figure 4-3: Schematic showing the mechanisms of abrasive wear in materials [51]
In brittle materials microcracking is a dominant wear mechanism which leads to
wear volumes larger than the groove formed, as the result of material loss caused by
crack propagation.
Many materials that are used for their wear resistance normally contain a hard phase
distributed in a soft matrix. The wear response of such materials depends on the size
of the hard phase regions in comparison to the scale of the deformation caused by
individual abrasive particles. The deformation refers to the width of depth of the
indentation caused by each particle and when this is substantially greater than the
size of the hard particle the material behaves like a homogenous solid. A finely
distributed hard phase leads to an increase in the flow stress of the matrix and hence
an increase in the wear resistance.
4.2.2 Sliding Wear
Sliding wear occurs when two surfaces rub against each other. In most practical
applications the sliding surfaces are lubricated in which case the wear that takes
4 Friction and Wear 22
place is termed, lubricated sliding wear, however in many laboratory investigations
the surfaces slide in air without lubricant. This type of sliding wear is called dry
sliding wear. The amount of material removal during sliding wear is dependent on
the load and sliding distance. Wear is usually measured by either removing the
specimen at regular intervals and weighing or measuring it or by continuously
measuring its position with an electrical or mechanical transducer and determining
the wear from its dimensions. The friction force during a wear test is determined by
measuring the tangential force on the specimen of the torque on a rotating
counterface. A continuous measurement of the friction coefficient allows any changes
in the sliding behaviour to be observed, these changes normally indicate a change in
the surface nature or topography.
The sliding velocity also affects the wear that takes place since the sliding velocity
affects the rate of frictional energy dissipation. Wear also depends on the nominal
contact pressure and wear transitions are commonly induced by changes in contact
pressure. The linear dimensions of the specimen are also important and other factors
to also be considered are the testing temperature, and in the case of lubricated
systems the viscosity of the lubricant.
4.2.3 Adhesive Wear
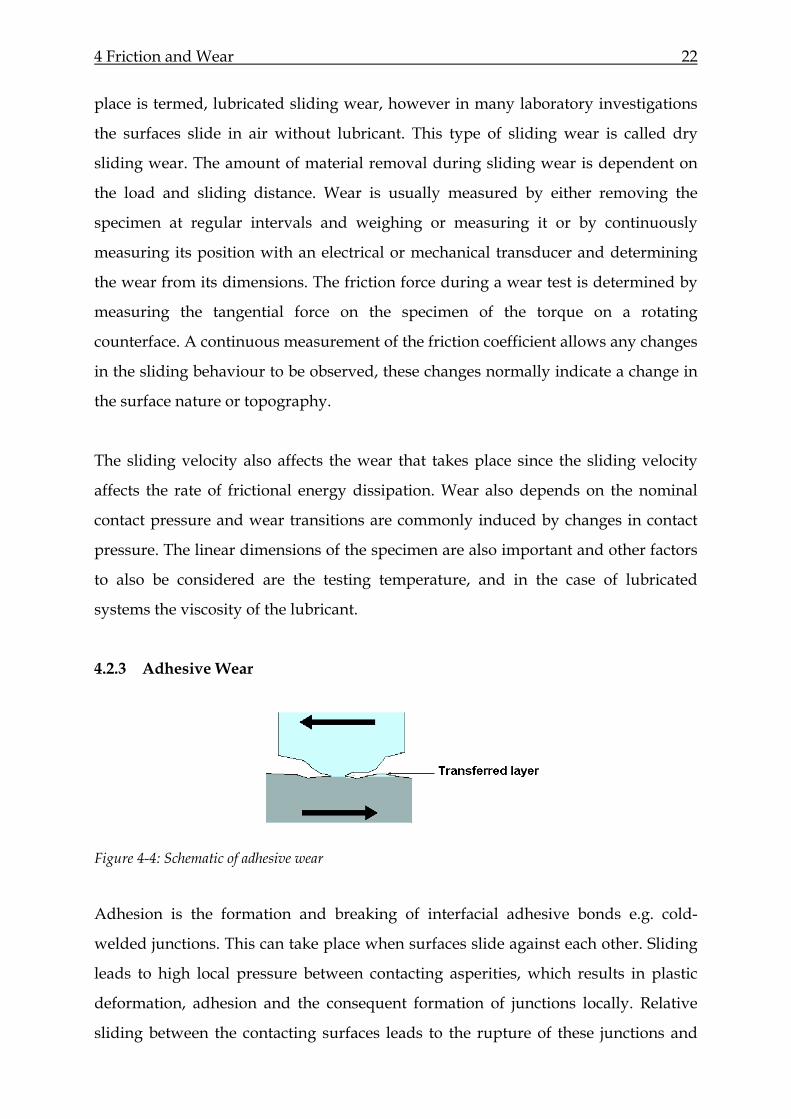
Figure 4-4: Schematic of adhesive wear
Adhesion is the formation and breaking of interfacial adhesive bonds e.g. cold-
welded junctions. This can take place when surfaces slide against each other. Sliding
leads to high local pressure between contacting asperities, which results in plastic
deformation, adhesion and the consequent formation of junctions locally. Relative
sliding between the contacting surfaces leads to the rupture of these junctions and

4 Friction and Wear 23
subsequent material transfer from one surface to the other, in addition to the
production of debris and material loss. The presence of a lubricating or oxide film
reduces the tendency for adhesion to occur [52].
5 Wear of WC-Co hardmetals 24
5 Wear of WC-Co hardmetals
5.1 Deformation behaviour of hardmetals
There have been many attempts to model the deformation behaviour of WC-Co hard
metals and the results of these studies will be discussed here. The discussion will be
divided into three sections. The first two sections will focus on the deformation
mechanisms that occur in the WC grains and the cobalt binder. Finally the combined
deformation of the alloy will then be discussed.
5.1.1 Deformation and fracture mechanisms in WC
WC grains are able to plastically deform without the occurrence of brittle fracture
due to the presence of several slip planes. Early work on bulk samples suggested that
the slip planes are of the { 0110 } type and the slip directions are < 0001>, < 0211 > and
< 3211 > [21,30,53]. These slip systems have been observed in the transmission
electron microscope and the operation of these systems is thought to be sufficient to
provide the five independent systems necessary to produce the shape changes [54]
needed to maintain continuity in deformed polycrystalline WC-Co. Unit dislocations
with the Burgers vectors < 0001 >, 31 < 0211 > and
31 < 3211 > have all been observed
and said to be glissile on a number of different planes. Furthermore in some regions
of both deformed and undeformed samples dissociated partial dislocations were
observed on {1010} planes which are defined by the following reaction
31 < 3211 > →
61 < 3211 > +
61 < 3211 >
Later work claimed that only the { 0110 } < 3211 > system which produces slip
equivalent to { 0110 } < 0211 > and { 0110 } < 0001 > is active in the WC and there only
four slip systems would be available [55]. This would limit the deformation of
polycrystalline WC and lead to interfacial crack formation. The occurrence of
5 Wear of WC-Co hardmetals 25
microcracking at the WC/WC interface supports the lack of sufficient slip systems.
The number of slip systems in WC is therefore not very clear [55,56].
Deformation of WC grains by glide of 61 < 3211 > partials is usually associated with
slip in intense shear bands and intersecting bands often result in the nucleation of
microcracks [56-58].
WC grains usually have a relatively high dislocation density in the as-sintered
condition and can therefore plastically deform through dislocation multiplication.
5.1.2 Co binder deformation characteristics
The binder in as-sintered WC-Co hard metals is mainly present as fcc, this is unstable
at room temperature and results in the presence of numerous stacking faults in the
undeformed state. The energy in the binder is lowered by a fcc to hcp martensitic
transformation which takes place during deformation and is accompanied by twin
formation [59-61]. This is facilitated by the movement of 61 <112> partial dislocations.
Since the binder is a solid solution of W and C dissolved in Co the martensitic
transformation is possibly retarded by the dissolved W and C which lower the
martensitic transformation temperature. The transformation is accompanied with a
change in shape and the rigid WC skeleton restricts the transformation.
Since the fcc lattice is unstable at room temperature the stacking fault energy
becomes very low and therefore dislocations and stacking faults are the prominent
feature in deformed samples.
Thin lamellae of hcp material surrounded by fcc binder have been observed by x-ray
diffraction of deformed WC-Co hard metals. Lamellae of hcp material form readily in
the binder upon deformation and the stacking faults present in the undeformed
material act as nucleation planes for the lamella formation. During deformation the
stacking faults increase in thickness and eventually coalesce to form the lamellae of
hcp material that are observed. A complete transformation from fcc to hcp has never

5 Wear of WC-Co hardmetals 26
been observed in these alloys. Work by Sarin and Johannesson estimated that less
than 10% of the binder transforms before fracture of the material takes place [62].
Therefore four types of defects are introduced in the binder phase during plastic
deformation [63]:
i. dislocations
ii. stacking faults
iii. twins
iv. regions where the face-centred cubic lattice is transformed to stable hexagonal
lattice
5.1.3 Deformation of WC-Co cemented carbides
Deformation in the hardmetal begins with the ductile deformation of the carbide via
a glide mechanism. The complex structure of the carbide skeleton means that a small
amount of plastic deformation in a single grain can result in large deformation in
other parts of the skeleton [62]. The cobalt binder then undergoes a transformation
into a hcp lamella. This is caused by the glide of partial dislocation on one of the four
slip planes of the fcc binder. The hcp lamellae only have one slip plane so that
deformation becomes increasingly difficult as it progresses. This leads to crack
formation in the binder phase and the simultaneous break up of the WC grains. The
dominant mechanism in this process is the break up of the carbide skeleton and is
observed by the large number of cracks at WC/WC interface as opposed to the
WC/Co interface.
The fcp to hcp transformation during the deformation of WC-Co toughens the
composite however as the deformation progresses this ability decreases and the
binder can no longer impede cracks [60].
5.1.3.1 Crack propagation in WC-Co alloys
Four types of fracture paths can be distinguished in WC-Co hard metals:
5 Wear of WC-Co hardmetals 27
C transgranular fracture through the carbide crystals
C/C along carbide grain boundaries
B transgranular through the binder phase (Co)
B/C along binder/carbide boundaries
Fracture paths B and B/C are formed by the nucleation and coalescence of voids in
the binder phase. The voids are formed by the hydrostatic stress that develops in the
ligament as the binder is stretched without debonding from the WC grains [64]. The
work of fracture along the binder/carbide interfaces is smaller than for transgranular
fracture through the binder.
Carbide fracture normally precedes binder fracture and determines the direction and
type of path the crack takes. However the main contribution to fracture energy comes
from path B. The crack normally initiates in the brittle WC phase and avoids the
ductile binder which forms ligaments attatched to the WC grains. As the crack
continues to open each ligament is stretched until it ruptures. At this point the crack
tip in the matrix has moved further ahead. The local geometry of the microstructure
determines whether the crack advances along a B or B/C type path.
The plastic deformation of the binder is constrained when the surrounding WC
skeleton is intact. When the carbide next to the binder region cracks, localised
deformation of the binder begins under plastic strain. As the ligament is stretched its
lateral contraction is impeded by its continuity with the carbide and pore-like crack
blunting and/or the formation of voids inside the ligament occurs.

5 Wear of WC-Co hardmetals 28
Figure 5-1: Schematic of the crack tip region in WC-Co during deformation. The black region
represents the binder phase, and the grey regions represent the WC grains. The white region is the
area where WC grain fall-out has occurred [65]
Crack paths B and B/C both lead to the formation of ligaments and voids in the
binder phase. The main difference is that the plastic deformation when the crack runs
parallel to the carbide/binder interface is reduced. Path B/C is therefore more
energetically favourable and is observed as long as the angle between the crack and
the interface does not exceed a critical value, which has been found to be about 25°.
When this value is exceeded the crack is forced to travel through the centre of the
binder region [64].
5.2 Sliding wear of WC-Co hard metals
Sliding wear occurs when two solid surfaces slide against each other and is similar to
abrasive wear in that they both require relative motion between two surfaces. Sliding
wear is more of a surface phenomenon which makes it difficult to predict the friction
and wear behaviour from bulk properties. The mechanical properties of hexagonal
materials are very anisotropic and this further complicates the wear behaviour of
WC-Co hard metals. Sliding wear is not a stable mechanism, during the course of
wear the contact surface changes and heat is produced because of friction and this
affects the wear rate. Pirso et al. carried out sliding wear tests on WC-Co hardmetals
[66]. During the initial stage of sliding wear no material detachment was observed
for the WC-6 wt% Co and the WC grains became glossy and polished. Carbide grain
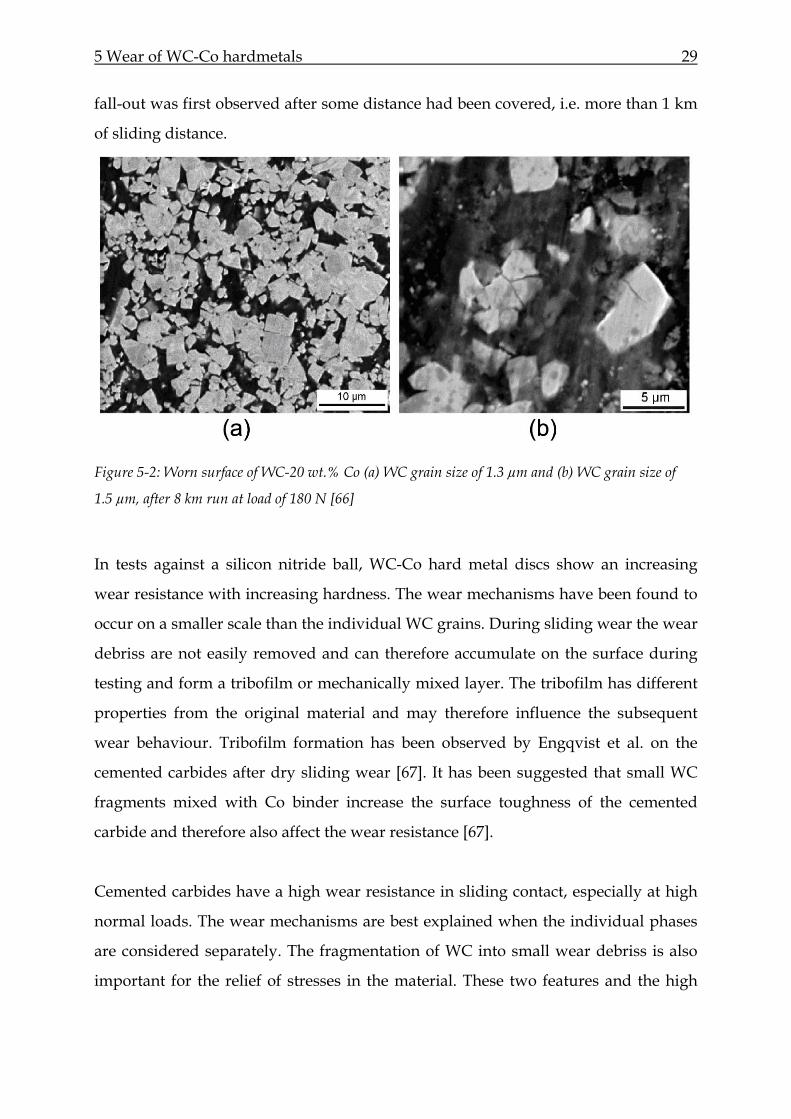
5 Wear of WC-Co hardmetals 29
fall-out was first observed after some distance had been covered, i.e. more than 1 km
of sliding distance.
Figure 5-2: Worn surface of WC-20 wt.% Co (a) WC grain size of 1.3 µm and (b) WC grain size of
1.5 µm, after 8 km run at load of 180 N [66]
In tests against a silicon nitride ball, WC-Co hard metal discs show an increasing
wear resistance with increasing hardness. The wear mechanisms have been found to
occur on a smaller scale than the individual WC grains. During sliding wear the wear
debriss are not easily removed and can therefore accumulate on the surface during
testing and form a tribofilm or mechanically mixed layer. The tribofilm has different
properties from the original material and may therefore influence the subsequent
wear behaviour. Tribofilm formation has been observed by Engqvist et al. on the
cemented carbides after dry sliding wear [67]. It has been suggested that small WC
fragments mixed with Co binder increase the surface toughness of the cemented
carbide and therefore also affect the wear resistance [67].
Cemented carbides have a high wear resistance in sliding contact, especially at high
normal loads. The wear mechanisms are best explained when the individual phases
are considered separately. The fragmentation of WC into small wear debriss is also
important for the relief of stresses in the material. These two features and the high
5 Wear of WC-Co hardmetals 30
fracture toughness of the composite accounts for its ability to endure high pressures
without entering into a high wear regime.
A friction coefficient between 0.3 and 0.5 has been reported for cemented carbides
and the effect of the microstructure on the friction coefficient is still not clear [68].
Binderless carbides exhibit a high resistance to microfracturing and have similar
wear rates to cemented carbides containing a metallic binder phase. The main wear
mechanisms observed have been the fragmentation of WC grains and the oxidation
of the fragments.
Larsen Basse carried out sliding wear tests on WC-Co hard metals using a Rockwell
B indenter as a slider [69]. The cobalt binder was found to accumulate on the surface
during testing, similar observations were also made by Almond et al. [70]. It was
suggested that the binder is initially squeezed out of the surface by compressive
stresses in front of and on the sides of the indenter. Cobalt extrusion is followed by
cracking of the WC grains. This is followed by the microfracture of WC grains
adjacent to the surface defects, which occurs due to load concentrations around the
defect and reduced resistance to fracture as a result of binder flow and extrusion. WC
fragments are removed and cobalt smears on the surface of the hard metal. The
cobalt on the surface is expected to act as a lubricant which could reduce wear.
5 Wear of WC-Co hardmetals 31
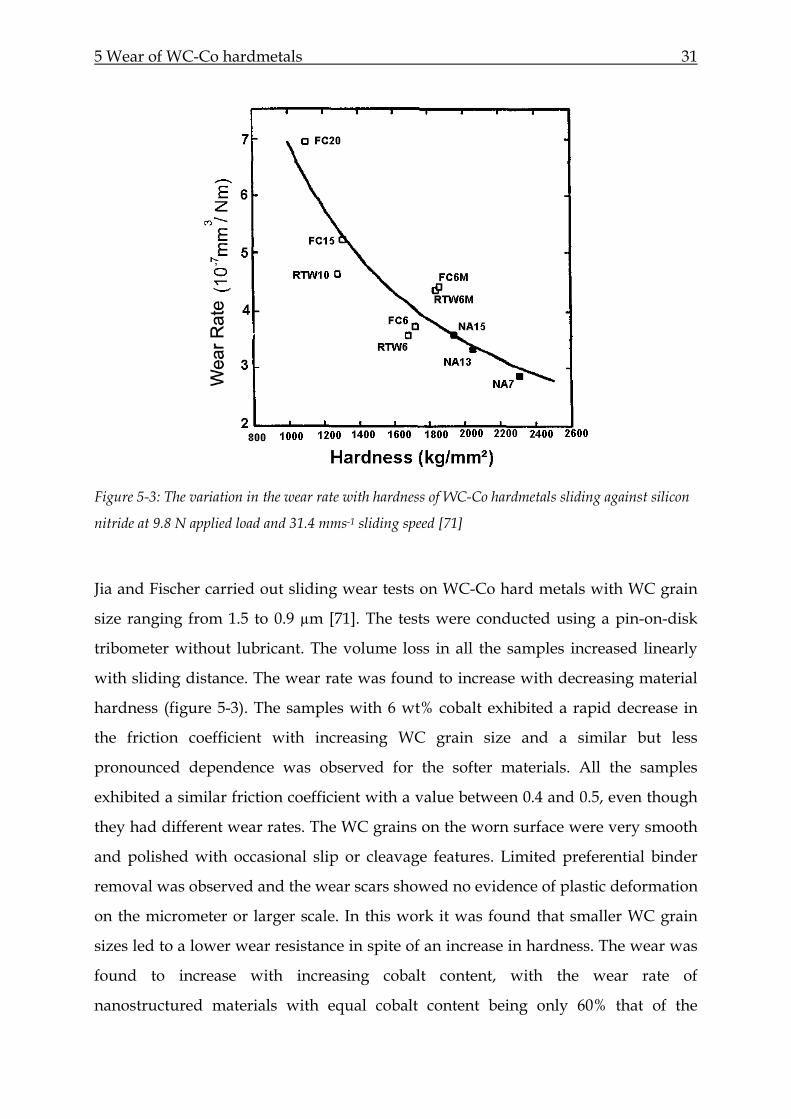
Figure 5-3: The variation in the wear rate with hardness of WC-Co hardmetals sliding against silicon
nitride at 9.8 N applied load and 31.4 mms-1 sliding speed [71]
Jia and Fischer carried out sliding wear tests on WC-Co hard metals with WC grain
size ranging from 1.5 to 0.9 µm [71]. The tests were conducted using a pin-on-disk
tribometer without lubricant. The volume loss in all the samples increased linearly
with sliding distance. The wear rate was found to increase with decreasing material
hardness (figure 5-3). The samples with 6 wt% cobalt exhibited a rapid decrease in
the friction coefficient with increasing WC grain size and a similar but less
pronounced dependence was observed for the softer materials. All the samples
exhibited a similar friction coefficient with a value between 0.4 and 0.5, even though
they had different wear rates. The WC grains on the worn surface were very smooth
and polished with occasional slip or cleavage features. Limited preferential binder
removal was observed and the wear scars showed no evidence of plastic deformation
on the micrometer or larger scale. In this work it was found that smaller WC grain
sizes led to a lower wear resistance in spite of an increase in hardness. The wear was
found to increase with increasing cobalt content, with the wear rate of
nanostructured materials with equal cobalt content being only 60% that of the
5 Wear of WC-Co hardmetals 32
conventional counterpart. Jia and Fischer concluded that the best way to increase
sliding wear resistance was to reduce the cobalt content and increase the WC grain
size.
5.3 Scratch testing of WC-Co hard metals
Engqvist et al carried out scratch tests on single crystal WC crystals using a Vickers
diamond tip in air [72]. The loads were relatively high in comparison to the loads
used in this work. In this work a maximum load of 500 mN was used for the testing
but in the work reported form Engqivst a maximum load of 2 N was applied. The tip
was oriented with a corner in the scratch direction. The scratch behaviour of the WC
crystals was found to change according to the crystallographic orientation. The
grooves normal to the prism direction exhibited the highest scratch resistance and
the lowest amount of material removal. Ridges were formed along the scratch and
these were only observed for this crystal orientation. Scratch parallel to the prism
direction resulted in lowest scratch hardness and hence the highest material removal.
The amount of material removal varied between the different surfaces. The material
removal from the basal plane was approximately 3.5 times higher than from the
surface normal to the prism direction.
Shearing and cleavage along the scratch was found in the scratches on the basal
surface. Scratching in the orthogonal prism direction led to ridge formation and
cracks along the grooves. Strong material fracture was observed close to the indenter.
Slip bands were also visible and crack direction changed from being relatively
parallel to the scratch direction to being more aligned to the direction of the slip
bands. Scratching parallel to the prism direction led to crystal slipping parallel to the
scratch. No ridge formation or cracks were formed. Wear debriss were also observed.
5 Wear of WC-Co hardmetals 33
Figure 5-4: Images of grooves in a) perpendicular prism and (b) parallel prism direction after scratch
testing with a Vickers diamond tip in air with a scratch velocity of 20 µm/s and an applied load of 2 N
[72]
Cracks perpendicular to the scratch direction were formed at the bottom of the
scratches on all the surfaces. Angular rod fragments were formed during scratching
in the orthogonal prism direction, these debriss were similar in nature to those
formed in the surface parallel to the prism direction. Scratching on the basal plane
produced debriss with a different morphology. The debriss had a triangular shape
presumably with the basal surface as the triangle plane. The region in front of the
scratch tip deformed plastically with slip band formation.
Jia et al also conducted scratch tests on WC-Co hard metals using a modified Vickers
hardness tester [71]. Single and multiple scratch tests were carried out with loads
varying from 1 N to 10 N and a speed of 0.05 mms-1. The sample with a WC grain
size of 2.5 µm and containing 10 wt% Co showed piled-up ridges, consisting of
extruded WC grains and binder material, along the scratch. A number of the
displaced WC grains were cracked and some exhibited slip lines indicating plastic
deformation. Some of the WC grains in the wear track were also cracked or
deformed. As the load was increased the WC grain cracking became more severe and
more material was piled up on the edges of the scratch. Less binder was observed in
5 Wear of WC-Co hardmetals 34
the track suggesting that binder extrusion took place. The sample containing 6 wt%
Co with a grain size of 0.8 µm had a similar appearance after scratching. However
less material displacement was observed and there were also fewer WC grains
fragmented in the scratch. Additionally less binder extrusion was observed in the
materials with a finer microstructure.
The nano-structured hard metals studied in the work by Jia et al exhibited a higher
scratch resistance. The scratches were found to be smaller and this is correlated to the
higher hardness of these materials. No micro cracking was observed at loads of 100 g
and 500 g in the nano-structured materials. Cracks perpendicular to the scratch
direction were found at a load of 1000 g. The cracks are approximately two orders
larger than the grain size.
Work by Gee et al produced similar observations to the work by Jia and Fischer [73].
Scratch testing of WC-Co hard metals at loads ranging from 140-300 mN resulted in
debris formation and cracking of the WC grains. In addition to slip line formation,
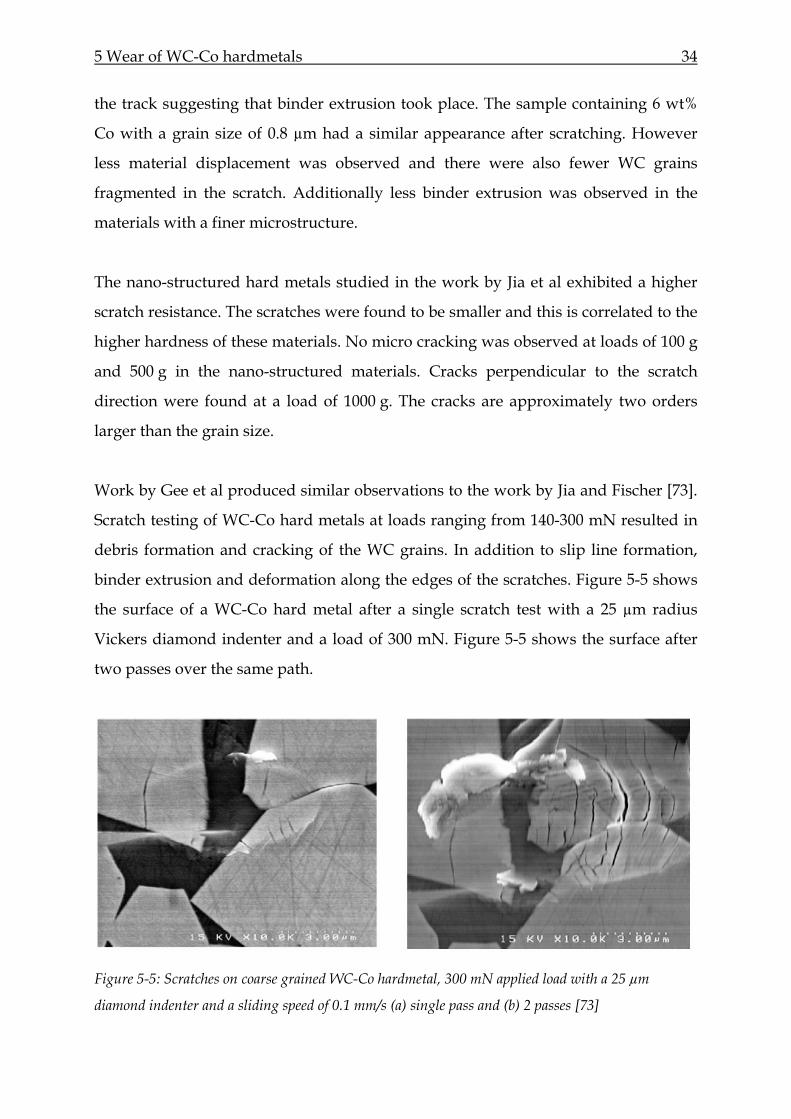
binder extrusion and deformation along the edges of the scratches. Figure 5-5 shows
the surface of a WC-Co hard metal after a single scratch test with a 25 µm radius
Vickers diamond indenter and a load of 300 mN. Figure 5-5 shows the surface after
two passes over the same path.
Figure 5-5: Scratches on coarse grained WC-Co hardmetal, 300 mN applied load with a 25 µm
diamond indenter and a sliding speed of 0.1 mm/s (a) single pass and (b) 2 passes [73]
5 Wear of WC-Co hardmetals 35
The damage observed by carrying out multiple tests over the same path indicated
that repeated damage may have a stronger contribution to wear than the initial
contact. This work showed that the wear mechanisms that occur on the macroscopic
scale also take place in micro-scale contact.
5.4 Abrasive wear of WC-Co hard metals
As a result of the different properties of the WC and Co phases the abrasive wear of
cemented carbides is complicated. The abrasive wear of WC-co hard metals is
divided into categories that depend on the size and hardness of the abrasive
particles. Wear by grits that are 1.2 times harder than the composite belong to the
“hard abrasive region” whereas the “soft abrasive region” refers to wear by softer
grits, which exhibit a lower wear rate [74]. Within each category there are sub-
divisions defined by the size of the abrasive grooves in relation to the microstructure.
If the grooves are large in comparison to the microstructure the wear is called tough
and if the groove size is comparable to or smaller than the microstructure the wear is
called mild. The abrasive wear of WC-Co hard metals will be discussed according
this nomenclature. The relative wear ranking of hard metals is highly dependent on
the triboysystem and is further influenced by the size and nature of the abrasive
used, the abrading wheel speed, the applied load and the material properties.
5.4.1 Mild abrasive wear
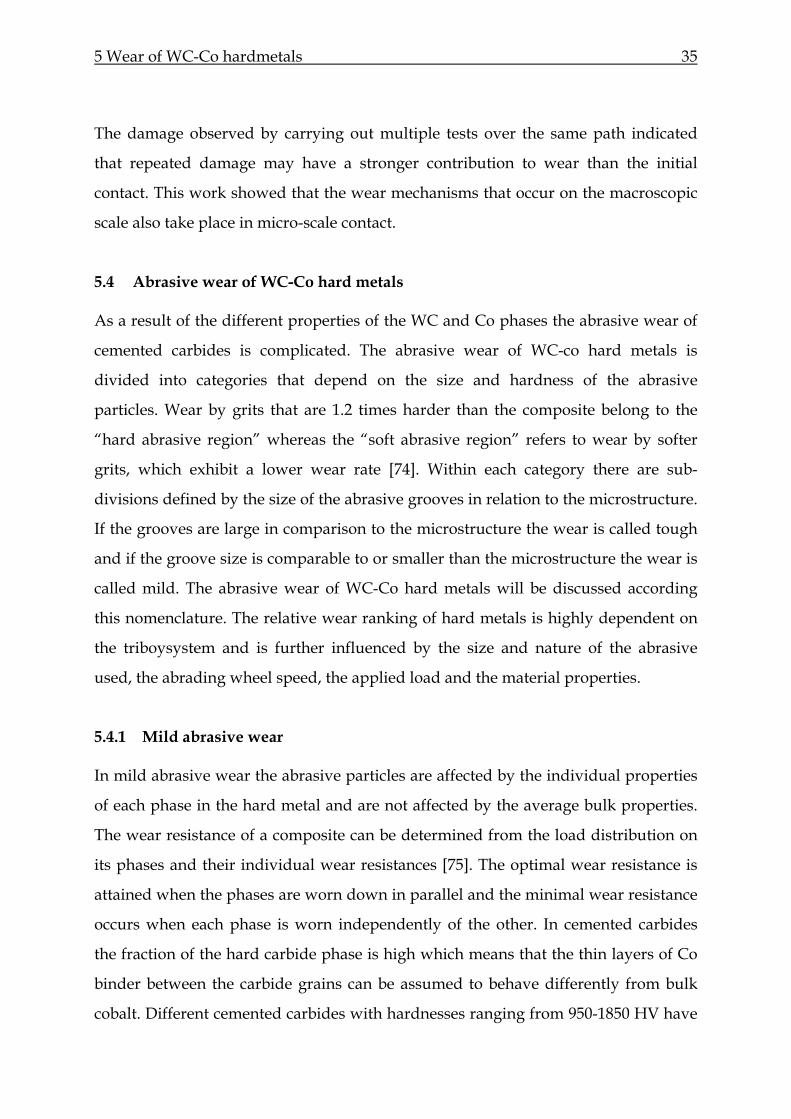
In mild abrasive wear the abrasive particles are affected by the individual properties
of each phase in the hard metal and are not affected by the average bulk properties.
The wear resistance of a composite can be determined from the load distribution on
its phases and their individual wear resistances [75]. The optimal wear resistance is
attained when the phases are worn down in parallel and the minimal wear resistance
occurs when each phase is worn independently of the other. In cemented carbides
the fraction of the hard carbide phase is high which means that the thin layers of Co
binder between the carbide grains can be assumed to behave differently from bulk
cobalt. Different cemented carbides with hardnesses ranging from 950-1850 HV have
5 Wear of WC-Co hardmetals 36
been found to have very similar wear resistances, very similar to the average of
monocrystalline WC.
Figure 5-6: Schematic illustration of the theoretical optimum load and minimum load distribution
modes [76].
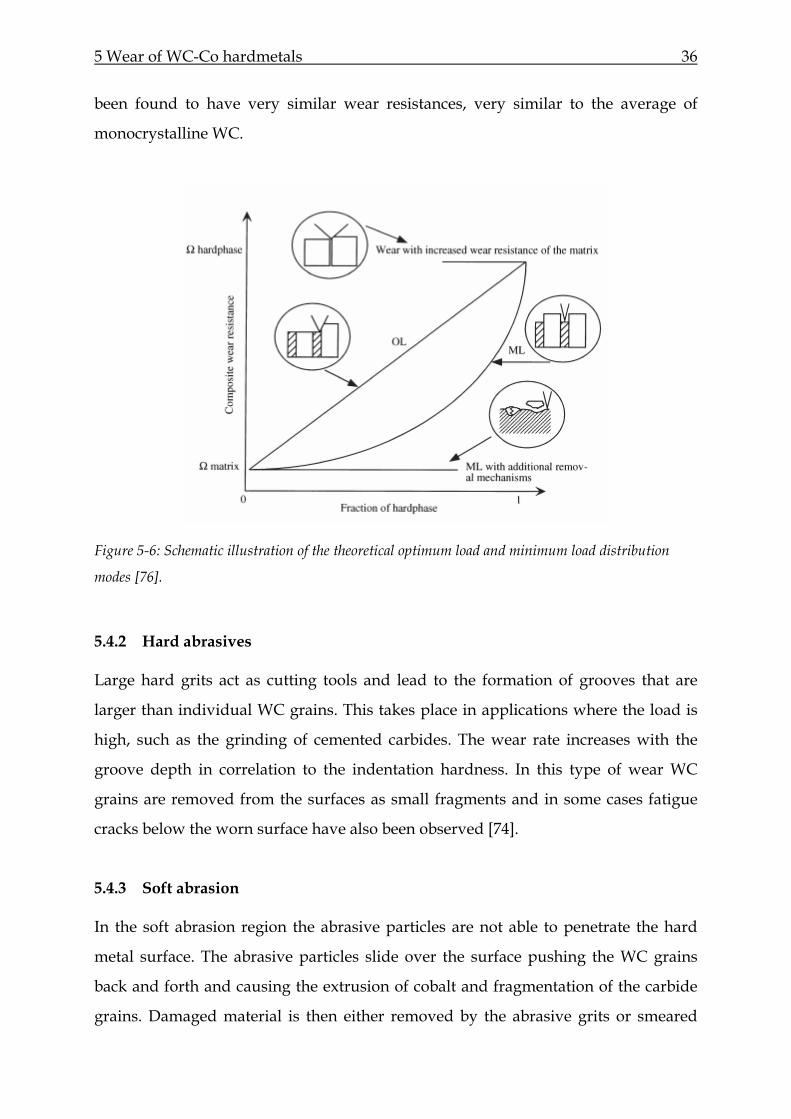
5.4.2 Hard abrasives
Large hard grits act as cutting tools and lead to the formation of grooves that are
larger than individual WC grains. This takes place in applications where the load is
high, such as the grinding of cemented carbides. The wear rate increases with the
groove depth in correlation to the indentation hardness. In this type of wear WC
grains are removed from the surfaces as small fragments and in some cases fatigue
cracks below the worn surface have also been observed [74].
5.4.3 Soft abrasion
In the soft abrasion region the abrasive particles are not able to penetrate the hard
metal surface. The abrasive particles slide over the surface pushing the WC grains
back and forth and causing the extrusion of cobalt and fragmentation of the carbide
grains. Damaged material is then either removed by the abrasive grits or smeared
5 Wear of WC-Co hardmetals 37
over the material surface. In this wear regime the wear resistance has been found to
be proportional to the mean free path of the cobalt binder and finer WC grains and a
lower cobalt content increase the wear resistance.
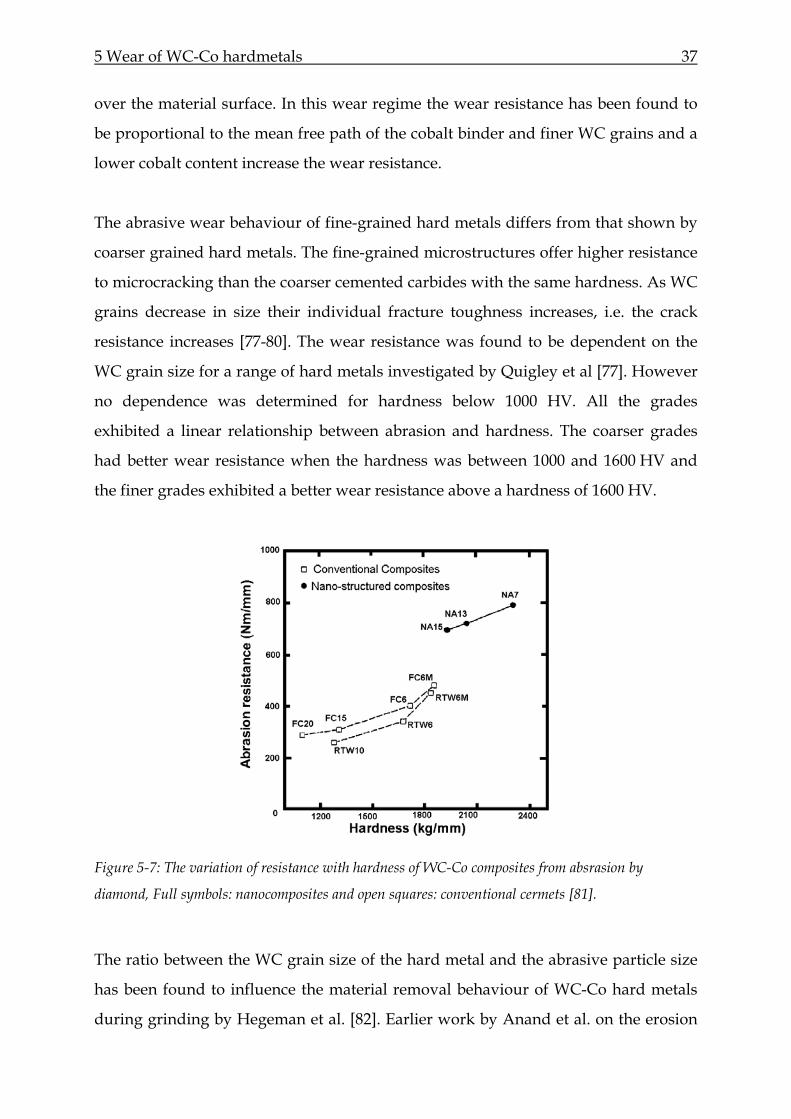
The abrasive wear behaviour of fine-grained hard metals differs from that shown by
coarser grained hard metals. The fine-grained microstructures offer higher resistance
to microcracking than the coarser cemented carbides with the same hardness. As WC
grains decrease in size their individual fracture toughness increases, i.e. the crack
resistance increases [77-80]. The wear resistance was found to be dependent on the
WC grain size for a range of hard metals investigated by Quigley et al [77]. However
no dependence was determined for hardness below 1000 HV. All the grades
exhibited a linear relationship between abrasion and hardness. The coarser grades
had better wear resistance when the hardness was between 1000 and 1600 HV and
the finer grades exhibited a better wear resistance above a hardness of 1600 HV.
Figure 5-7: The variation of resistance with hardness of WC-Co composites from absrasion by
diamond, Full symbols: nanocomposites and open squares: conventional cermets [81].
The ratio between the WC grain size of the hard metal and the abrasive particle size
has been found to influence the material removal behaviour of WC-Co hard metals
during grinding by Hegeman et al. [82]. Earlier work by Anand et al. on the erosion
5 Wear of WC-Co hardmetals 38
of WC-Co hard metals also indicated a dependency of the wear rate on the ratio
between the erodent particle size and the WC grain size [83]. Jia et al. observed a
similar relationship during scratch testing [71]. Therefore the wear mechanisms
observed in WC-Co hardmetals are not only dependent on the material
microstructure but also on the properties of the tribological system.
6 Tribological testing 39
6 Tribological testing
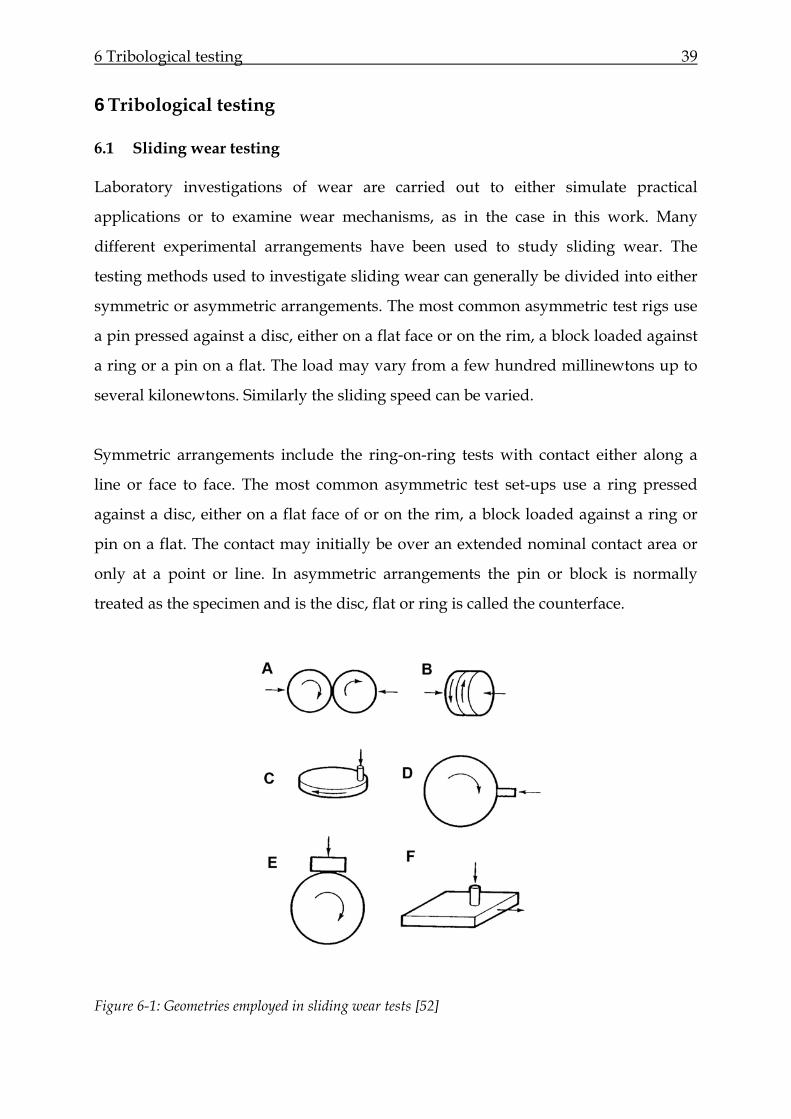
6.1 Sliding wear testing
Laboratory investigations of wear are carried out to either simulate practical
applications or to examine wear mechanisms, as in the case in this work. Many
different experimental arrangements have been used to study sliding wear. The
testing methods used to investigate sliding wear can generally be divided into either
symmetric or asymmetric arrangements. The most common asymmetric test rigs use
a pin pressed against a disc, either on a flat face or on the rim, a block loaded against
a ring or a pin on a flat. The load may vary from a few hundred millinewtons up to
several kilonewtons. Similarly the sliding speed can be varied.
Symmetric arrangements include the ring-on-ring tests with contact either along a
line or face to face. The most common asymmetric test set-ups use a ring pressed
against a disc, either on a flat face of or on the rim, a block loaded against a ring or
pin on a flat. The contact may initially be over an extended nominal contact area or
only at a point or line. In asymmetric arrangements the pin or block is normally
treated as the specimen and is the disc, flat or ring is called the counterface.
Figure 6-1: Geometries employed in sliding wear tests [52]
6 Tribological testing 40
The friction can be measured continuously during a wear test by measuring the
tangential force on the specimen or the torque on a rotating counterface. This allows
changes in the sliding behaviour to be monitored and this is important since any
changes may indicate a change in the surface topography or a change in the wear
mechanism. The wear observed during sliding depends on the sliding distance and
to some extent on the sliding velocity and the duration of the test. The sliding
velocity affects the rate of dissipation of frictional energy and therefore affects the
temperature at the interface. The nominal contact pressure between the sliding
surfaces is important and another factor which may also play a role in the overall
wear process is the dimensions of the specimen.
6.2 Abrasive wear testing
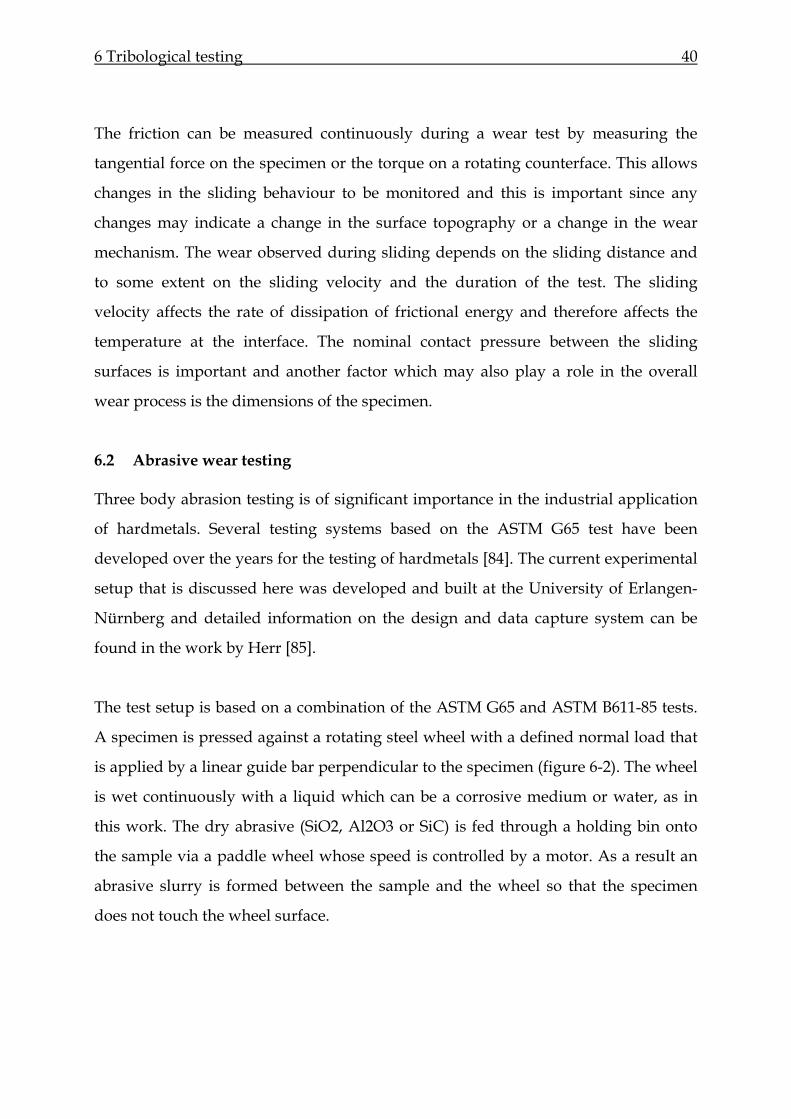
Three body abrasion testing is of significant importance in the industrial application
of hardmetals. Several testing systems based on the ASTM G65 test have been
developed over the years for the testing of hardmetals [84]. The current experimental
setup that is discussed here was developed and built at the University of Erlangen-
Nürnberg and detailed information on the design and data capture system can be
found in the work by Herr [85].
The test setup is based on a combination of the ASTM G65 and ASTM B611-85 tests.
A specimen is pressed against a rotating steel wheel with a defined normal load that
is applied by a linear guide bar perpendicular to the specimen (figure 6-2). The wheel
is wet continuously with a liquid which can be a corrosive medium or water, as in
this work. The dry abrasive (SiO2, Al2O3 or SiC) is fed through a holding bin onto
the sample via a paddle wheel whose speed is controlled by a motor. As a result an
abrasive slurry is formed between the sample and the wheel so that the specimen
does not touch the wheel surface.
6 Tribological testing 41
Figure 6-2: Schematic of the three-body abrasive wheel test apparatus designed at the University of
Erlangen-Nürnberg [85]
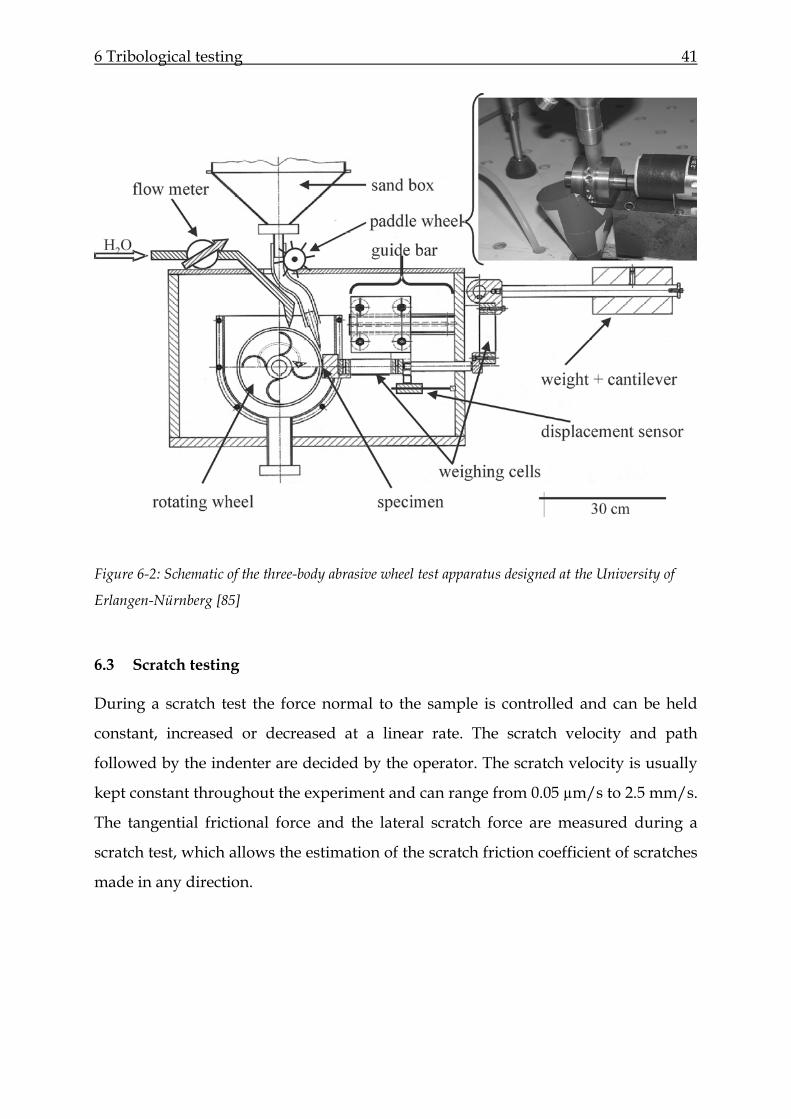
6.3 Scratch testing
During a scratch test the force normal to the sample is controlled and can be held
constant, increased or decreased at a linear rate. The scratch velocity and path
followed by the indenter are decided by the operator. The scratch velocity is usually
kept constant throughout the experiment and can range from 0.05 µm/s to 2.5 mm/s.
The tangential frictional force and the lateral scratch force are measured during a
scratch test, which allows the estimation of the scratch friction coefficient of scratches
made in any direction.
6 Tribological testing 42
Figure 6-3: Schematic of scratch forces during a scratch test. The normal load is applied, the tangential
and lateral forces are measured and result from the material’s behaviour and indenter geometry [86].
A typical scratch experiment is performed in three stages: an original profile, a
scratch segment and a residual profile [86]. During the original profile stage, the
surface morphology is obtained by pre-profiling the surface under a very small load
at the location where the scratch will be performed. The actual penetration depth of
the indenter into the sample surface is determined by comparing the indenter
displacement normal to the surface during the scratching with the topography of the
original surface at each position along the scratch length. The roughness and slope of
the surface are taken into account in the calculation of the indenter penetration
during scratch segment. The residual scratch profile at one location is determined in
a similar manner. Additional morphological information can be determined by
profiling across the scratch, which can be incorporated into the overall test
procedure.
Under mild loading, scratches create elastic-plastic deformation which leads to a
groove with two adjacent lateral pile-up pads. These scratches are often described in
terms of the following parameters (Figure 6-4):
• Scratch width, a
• Scratch residual depth, p
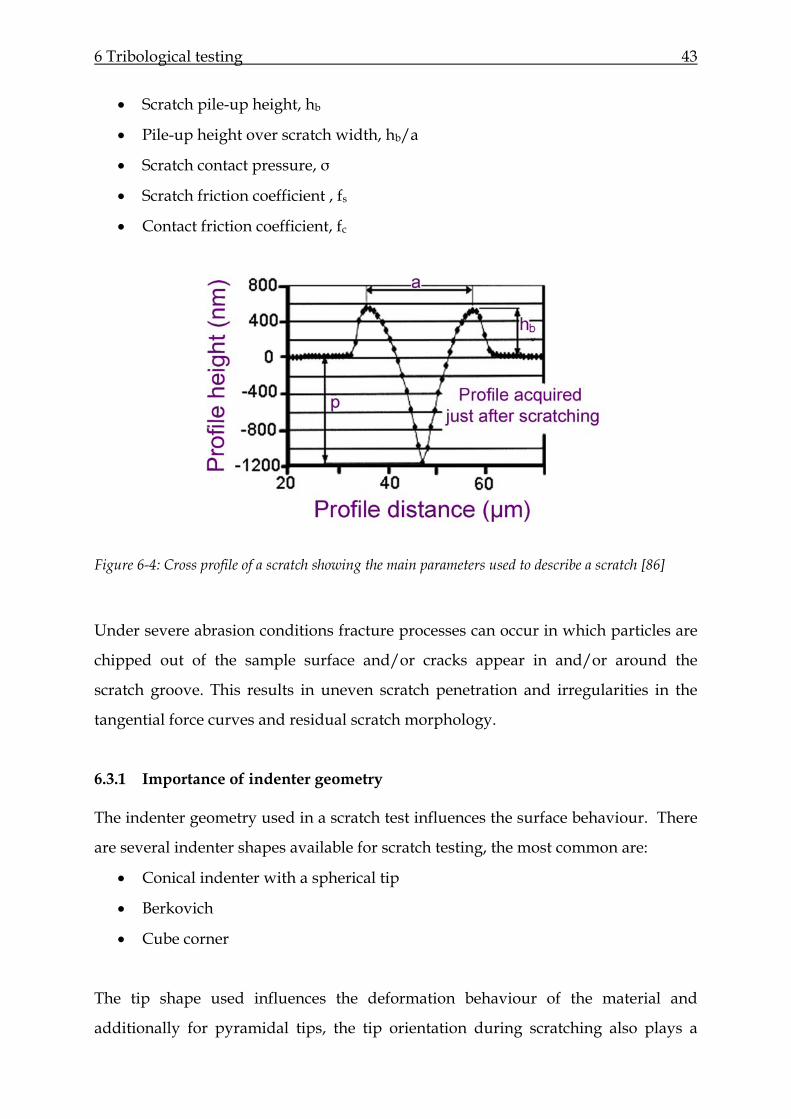
6 Tribological testing 43
• Scratch pile-up height, hb
• Pile-up height over scratch width, hb/a
• Scratch contact pressure, σ
• Scratch friction coefficient , fs
• Contact friction coefficient, fc
Figure 6-4: Cross profile of a scratch showing the main parameters used to describe a scratch [86]
Under severe abrasion conditions fracture processes can occur in which particles are
chipped out of the sample surface and/or cracks appear in and/or around the
scratch groove. This results in uneven scratch penetration and irregularities in the
tangential force curves and residual scratch morphology.
6.3.1 Importance of indenter geometry
The indenter geometry used in a scratch test influences the surface behaviour. There
are several indenter shapes available for scratch testing, the most common are:
• Conical indenter with a spherical tip
• Berkovich
• Cube corner
The tip shape used influences the deformation behaviour of the material and
additionally for pyramidal tips, the tip orientation during scratching also plays a
6 Tribological testing 44
role. In the work by Youn et a.l the coefficient of friction was found to vary between
0.16 and 0.38 depending on the orientation of the Berkovich tip [87].
In this work a Berkovich indenter was used. It has a three-sided pyramid shape and
therefore the indenter orientation is important in testing. The pile-up formation is
less prominent when the edge of the Berkovich indenter is oriented in the scratch
direction.
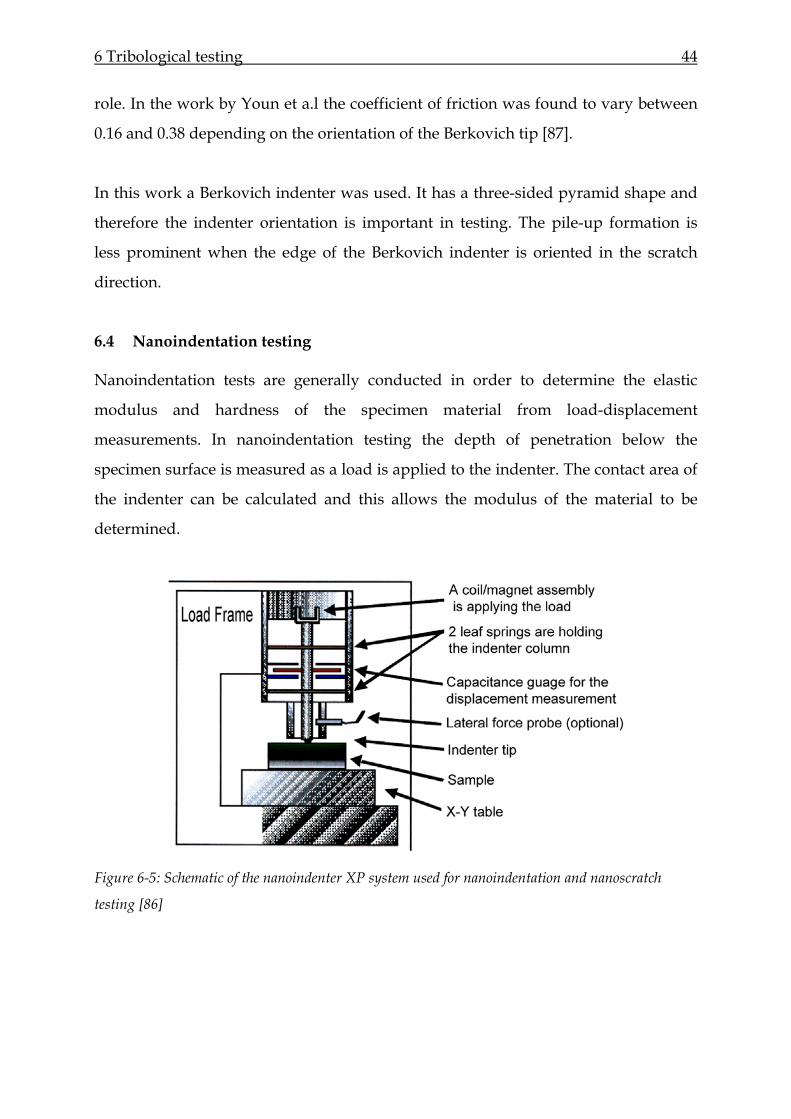
6.4 Nanoindentation testing
Nanoindentation tests are generally conducted in order to determine the elastic
modulus and hardness of the specimen material from load-displacement
measurements. In nanoindentation testing the depth of penetration below the
specimen surface is measured as a load is applied to the indenter. The contact area of
the indenter can be calculated and this allows the modulus of the material to be
determined.
Figure 6-5: Schematic of the nanoindenter XP system used for nanoindentation and nanoscratch
testing [86]
6 Tribological testing 45
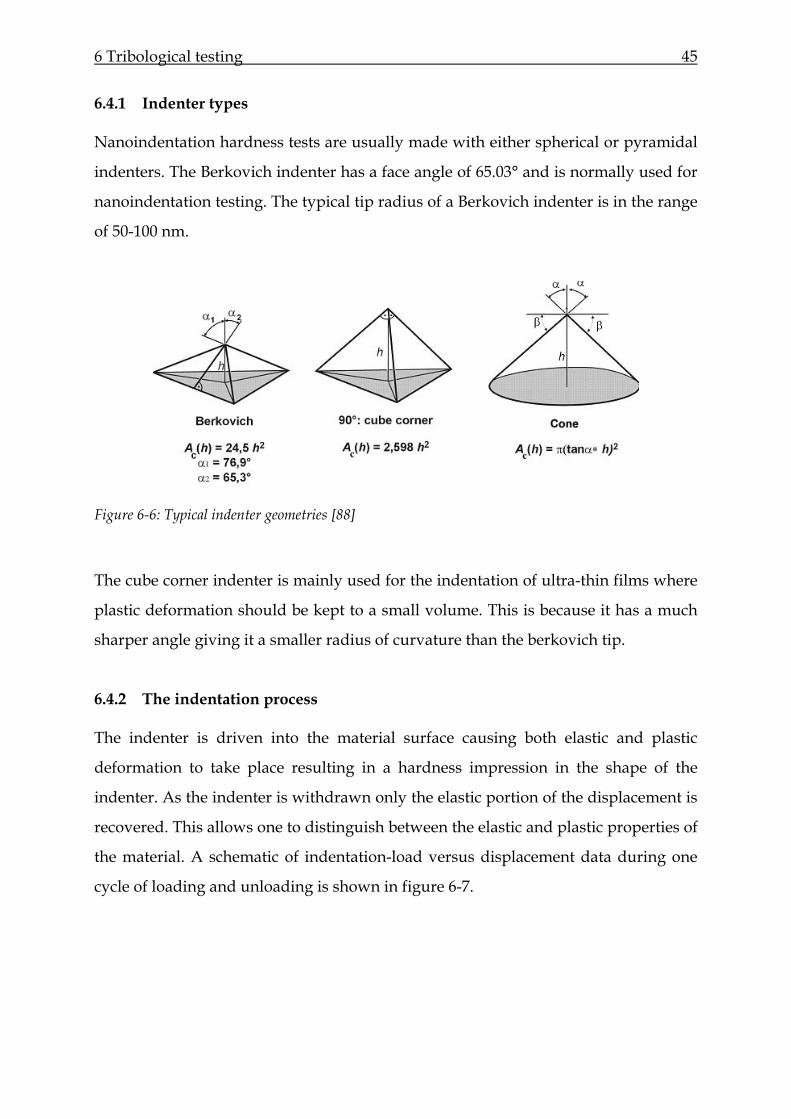
6.4.1 Indenter types
Nanoindentation hardness tests are usually made with either spherical or pyramidal
indenters. The Berkovich indenter has a face angle of 65.03° and is normally used for
nanoindentation testing. The typical tip radius of a Berkovich indenter is in the range
of 50-100 nm.
Figure 6-6: Typical indenter geometries [88]
The cube corner indenter is mainly used for the indentation of ultra-thin films where
plastic deformation should be kept to a small volume. This is because it has a much
sharper angle giving it a smaller radius of curvature than the berkovich tip.
6.4.2 The indentation process
The indenter is driven into the material surface causing both elastic and plastic
deformation to take place resulting in a hardness impression in the shape of the
indenter. As the indenter is withdrawn only the elastic portion of the displacement is
recovered. This allows one to distinguish between the elastic and plastic properties of
the material. A schematic of indentation-load versus displacement data during one
cycle of loading and unloading is shown in figure 6-7.
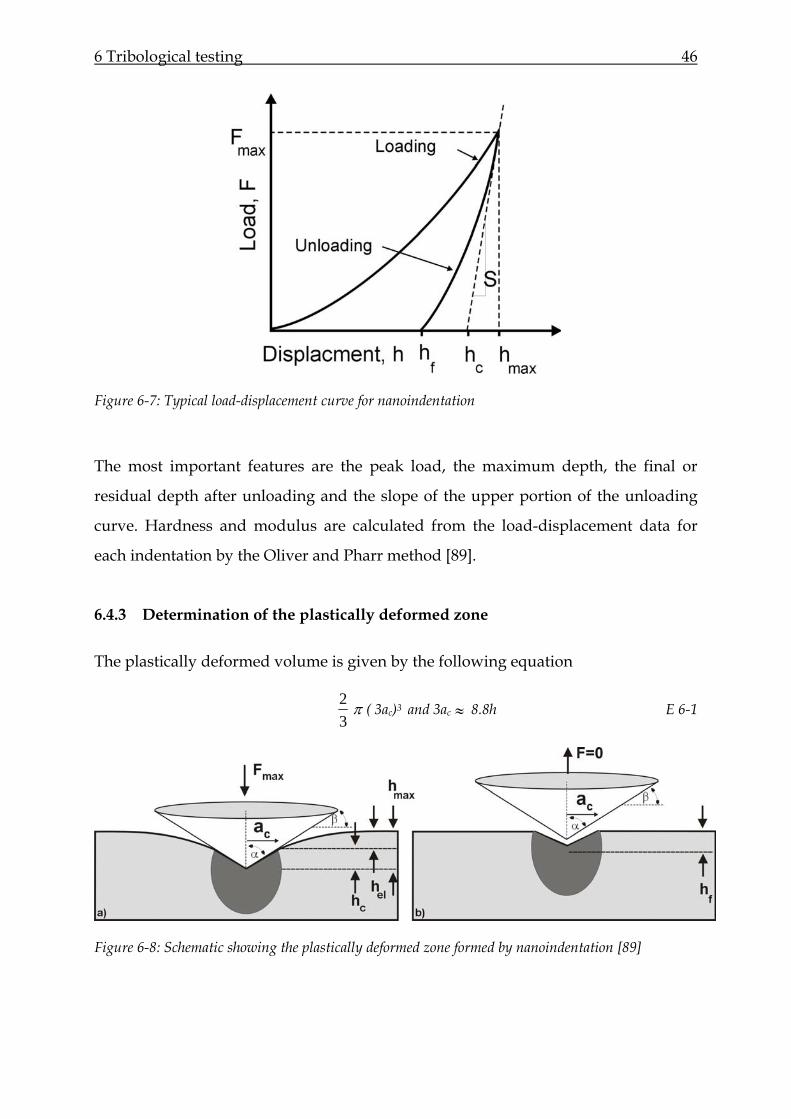
6 Tribological testing 46
Figure 6-7: Typical load-displacement curve for nanoindentation
The most important features are the peak load, the maximum depth, the final or
residual depth after unloading and the slope of the upper portion of the unloading
curve. Hardness and modulus are calculated from the load-displacement data for
each indentation by the Oliver and Pharr method [89].
6.4.3 Determination of the plastically deformed zone
The plastically deformed volume is given by the following equation
32 π ( 3ac)3 and 3ac ≈ 8.8h E 6-1
Figure 6-8: Schematic showing the plastically deformed zone formed by nanoindentation [89]
6 Tribological testing 47
The hardness and modulus values are calculated from the load-displacement data for
each indentation according to the Oliver and Pharr method. In this method the
unloading curve is fitted to a power law with the form
P = Pm
n
m hhhh
⎟⎟⎠
⎞⎜⎜⎝
⎛−−
0
0 E 6-2
Where Pm is the maximum load, hm is the maximum displacement and h0 and n are
fitted constants. The plastic depth under load hp is determined from the following
equation:
hp = hm - εSPm E 6-3
where S is the stiffness (S = dP/dh), and ε is a constant (0.75 for a Berkovich
indenter). This equation was derived by Sneddon for a punch indenter pressed into
an elastic material [91]. If the area function for the indenter tip ((Ap = f(hp)) is known
the hardness H can be calculated from the following equation:
H = p
m
AP E 6-4
and modulus, E can be calculated from:
E = )( 22
112 ν
νπ
−⎟⎟
⎠
⎞
⎜⎜
⎝
⎛ −−
i
ip
EA
S E 6-5
Where Ei and νI are the modulus and Poisson’s ratio for the indenter and ν is the
Poisson’s ratio for the specimen being tested.
6.4.4 Indentation fracture mechanics
The contact loading of brittle solids can lead to elastic and plastic deformation in
addition to microcracking at and below the stressed surfaces. Cone-shaped Hertzian
cracks are an example of this kind of cracking. A circular cone-shaped crack
originates around the contact area between the sphere and flat surface of a brittle
6 Tribological testing 48
solid when the critical load is exceeded. The crack grows from the circumference of
the contact area into the solid with increasing load. The maximum tensile stress
occurs at the contact area.
It is important to distinguish blunt and sharp indenters from each other when
looking at indentation problems. Pyramids or cones are considered as sharp and
spheres are considered to be blunt indenters. The type of indenter that is used
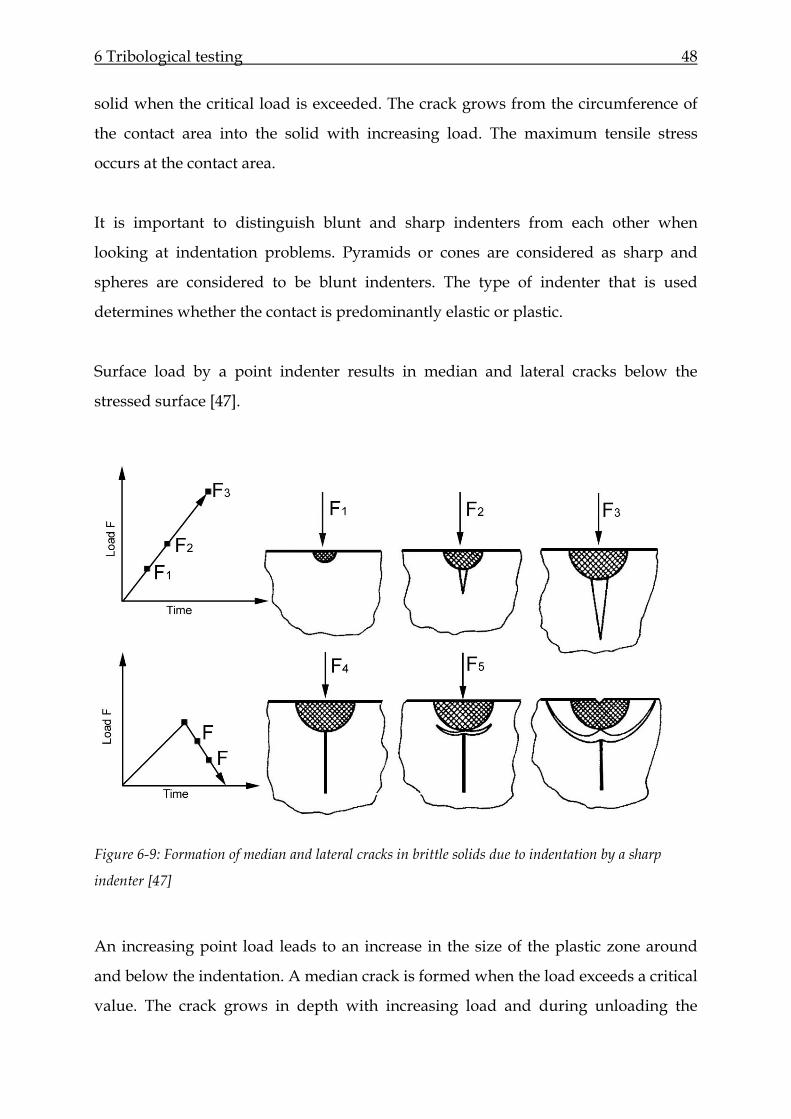
determines whether the contact is predominantly elastic or plastic.
Surface load by a point indenter results in median and lateral cracks below the
stressed surface [47].
Figure 6-9: Formation of median and lateral cracks in brittle solids due to indentation by a sharp
indenter [47]
An increasing point load leads to an increase in the size of the plastic zone around
and below the indentation. A median crack is formed when the load exceeds a critical
value. The crack grows in depth with increasing load and during unloading the
6 Tribological testing 49
median crack is closed and lateral cracks are formed and propagate to the surface
under an applied load of less than F5. Reloading closes the lateral cracks and reopens
the median crack. Residual stresses due to plastic deformation cause the formation of
lateral cracks during unloading, these can play a part in the formation of microcracks
in the material. Residual tensile stresses lead to an increase in the crack length and
reduce the critical load required for microcracking. Median cracks may propagate in
depth due to residual stresses during unloading.
6.5 Microstructure analysis
The materials response to indentation or wear testing is determined by measuring
the amount of wear that occurs, or the indentation depth but in addition the
deformation of the microstructure is examined using electron microscopy. The
following sections describe how a scanning electron microscope works and also
describes a focused ion beam which can be used for further microstructural
investigation and advanced sample preparation.
6.5.1 Scanning electron microscopy
A scanning electron microscope (SEM) scans the sample with a high energy beam of
electrons in a raster pattern, these electrons interact with the sample surface
producing signals containing information about the sample surface topography,
composition and even the electrical conductivity.
A typical SEM normally has several detectors that are able to detect different signals,
which include secondary electrons, back scattered electrons (BSE) and characteristic
x-rays. Very high resolution images of the sample surface, with magnifications of up
to 100 000, can be obtained when using the standard detection mode, secondary
electron imaging (SEI). The high depth of field produced by the SEM result in an
image with a three-dimensional appearance.
In this work the initial electron microscopy work was conducted on a Hitachi S4800
cold field emission SEM (FE-SEM). A field-emission cathode in the electron gun of a
scanning electron microscope provides narrower probing beams at low as well as
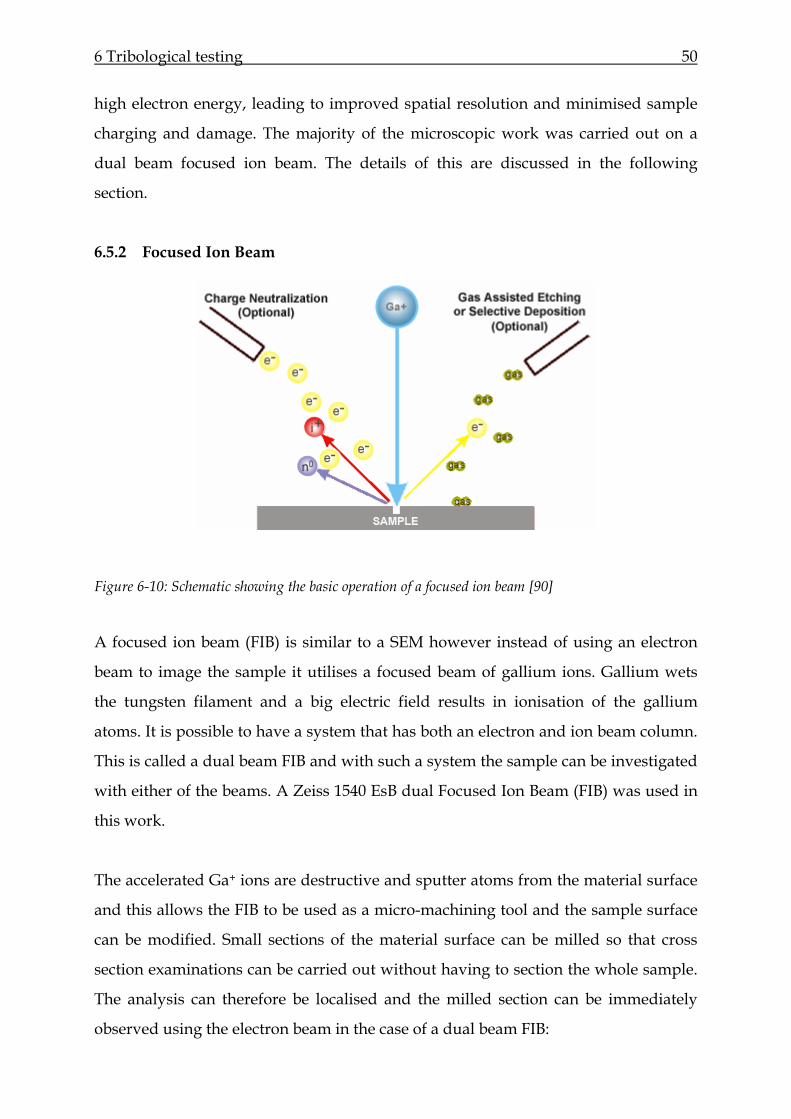
6 Tribological testing 50
high electron energy, leading to improved spatial resolution and minimised sample
charging and damage. The majority of the microscopic work was carried out on a
dual beam focused ion beam. The details of this are discussed in the following
section.
6.5.2 Focused Ion Beam
Figure 6-10: Schematic showing the basic operation of a focused ion beam [90]
A focused ion beam (FIB) is similar to a SEM however instead of using an electron
beam to image the sample it utilises a focused beam of gallium ions. Gallium wets
the tungsten filament and a big electric field results in ionisation of the gallium
atoms. It is possible to have a system that has both an electron and ion beam column.
This is called a dual beam FIB and with such a system the sample can be investigated
with either of the beams. A Zeiss 1540 EsB dual Focused Ion Beam (FIB) was used in
this work.
The accelerated Ga+ ions are destructive and sputter atoms from the material surface
and this allows the FIB to be used as a micro-machining tool and the sample surface
can be modified. Small sections of the material surface can be milled so that cross
section examinations can be carried out without having to section the whole sample.
The analysis can therefore be localised and the milled section can be immediately
observed using the electron beam in the case of a dual beam FIB:
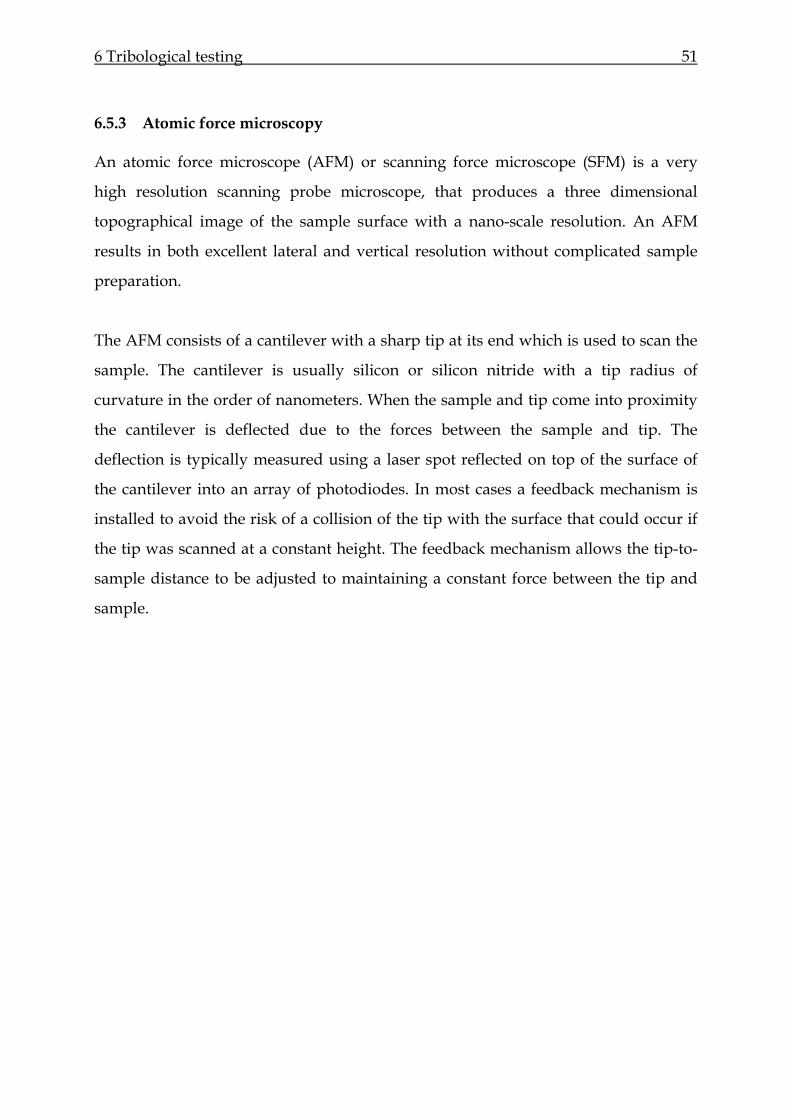
6 Tribological testing 51
6.5.3 Atomic force microscopy
An atomic force microscope (AFM) or scanning force microscope (SFM) is a very
high resolution scanning probe microscope, that produces a three dimensional
topographical image of the sample surface with a nano-scale resolution. An AFM
results in both excellent lateral and vertical resolution without complicated sample
preparation.
The AFM consists of a cantilever with a sharp tip at its end which is used to scan the
sample. The cantilever is usually silicon or silicon nitride with a tip radius of
curvature in the order of nanometers. When the sample and tip come into proximity
the cantilever is deflected due to the forces between the sample and tip. The
deflection is typically measured using a laser spot reflected on top of the surface of
the cantilever into an array of photodiodes. In most cases a feedback mechanism is
installed to avoid the risk of a collision of the tip with the surface that could occur if
the tip was scanned at a constant height. The feedback mechanism allows the tip-to-
sample distance to be adjusted to maintaining a constant force between the tip and
sample.
6 Tribological testing 52
Figure 6-11: Schematic of an atomic force microscope
The AFM can be operated in several modes divided into two categories, static
(contact), and dynamic (non-contact). In the non-contact mode the cantilever is
vibrated. Most imaging is conducted using the contact mode, in this mode the force
between the sample surface and the tip is kept constant by maintaining a constant
deflection.
In the non-contact mode the cantilever does not contact the sample surface but
oscillates above the adsorbed fluid layer on the surface. Attractive van der Waals
forces decrease the resonant frequency of the cantilever, and are responsible for the
image formation [91].
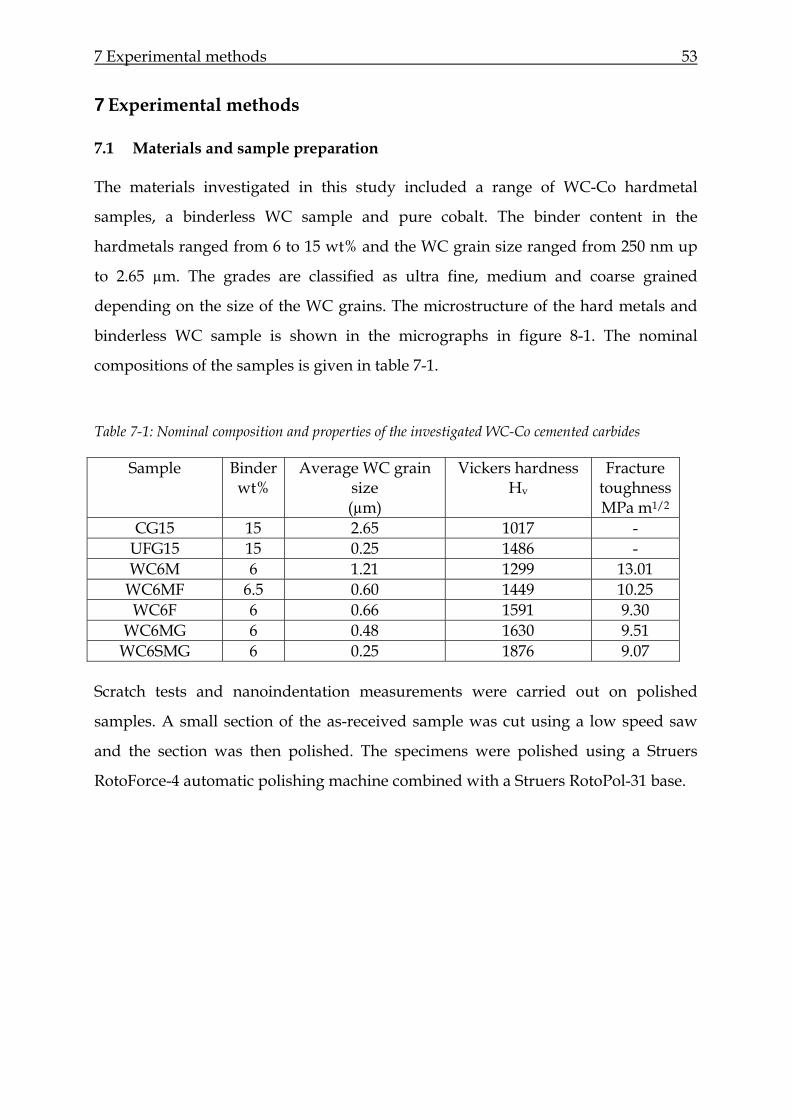
7 Experimental methods 53
7 Experimental methods
7.1 Materials and sample preparation
The materials investigated in this study included a range of WC-Co hardmetal
samples, a binderless WC sample and pure cobalt. The binder content in the
hardmetals ranged from 6 to 15 wt% and the WC grain size ranged from 250 nm up
to 2.65 µm. The grades are classified as ultra fine, medium and coarse grained
depending on the size of the WC grains. The microstructure of the hard metals and
binderless WC sample is shown in the micrographs in figure 8-1. The nominal
compositions of the samples is given in table 7-1.
Table 7-1: Nominal composition and properties of the investigated WC-Co cemented carbides
Sample Binder wt%
Average WC grain size (µm)
Vickers hardness Hv
Fracture toughness MPa m1/2
CG15 15 2.65 1017 - UFG15 15 0.25 1486 - WC6M 6 1.21 1299 13.01
WC6MF 6.5 0.60 1449 10.25 WC6F 6 0.66 1591 9.30
WC6MG 6 0.48 1630 9.51 WC6SMG 6 0.25 1876 9.07
Scratch tests and nanoindentation measurements were carried out on polished
samples. A small section of the as-received sample was cut using a low speed saw
and the section was then polished. The specimens were polished using a Struers
RotoForce-4 automatic polishing machine combined with a Struers RotoPol-31 base.
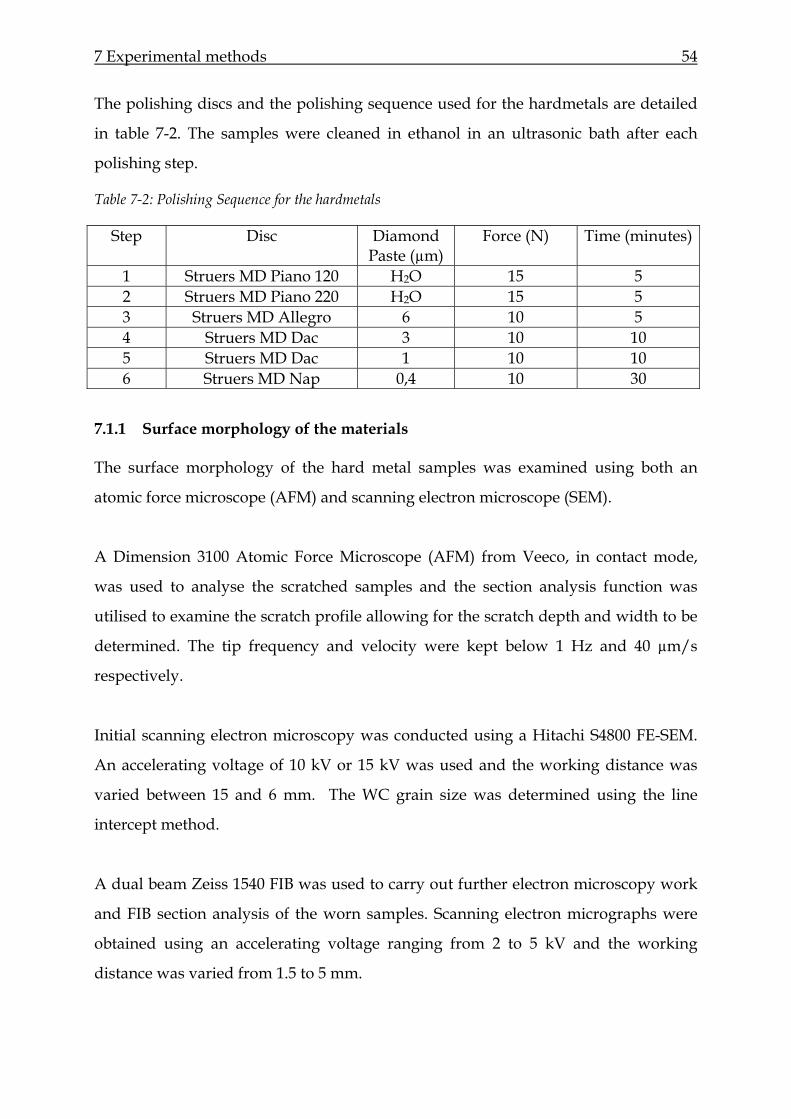
7 Experimental methods 54
The polishing discs and the polishing sequence used for the hardmetals are detailed
in table 7-2. The samples were cleaned in ethanol in an ultrasonic bath after each
polishing step.
Table 7-2: Polishing Sequence for the hardmetals
Step Disc Diamond Paste (µm)
Force (N) Time (minutes)
1 Struers MD Piano 120 H2O 15 5 2 Struers MD Piano 220 H2O 15 5 3 Struers MD Allegro 6 10 5 4 Struers MD Dac 3 10 10 5 Struers MD Dac 1 10 10 6 Struers MD Nap 0,4 10 30
7.1.1 Surface morphology of the materials
The surface morphology of the hard metal samples was examined using both an
atomic force microscope (AFM) and scanning electron microscope (SEM).
A Dimension 3100 Atomic Force Microscope (AFM) from Veeco, in contact mode,
was used to analyse the scratched samples and the section analysis function was
utilised to examine the scratch profile allowing for the scratch depth and width to be
determined. The tip frequency and velocity were kept below 1 Hz and 40 µm/s
respectively.
Initial scanning electron microscopy was conducted using a Hitachi S4800 FE-SEM.
An accelerating voltage of 10 kV or 15 kV was used and the working distance was
varied between 15 and 6 mm. The WC grain size was determined using the line
intercept method.
A dual beam Zeiss 1540 FIB was used to carry out further electron microscopy work
and FIB section analysis of the worn samples. Scanning electron micrographs were
obtained using an accelerating voltage ranging from 2 to 5 kV and the working
distance was varied from 1.5 to 5 mm.
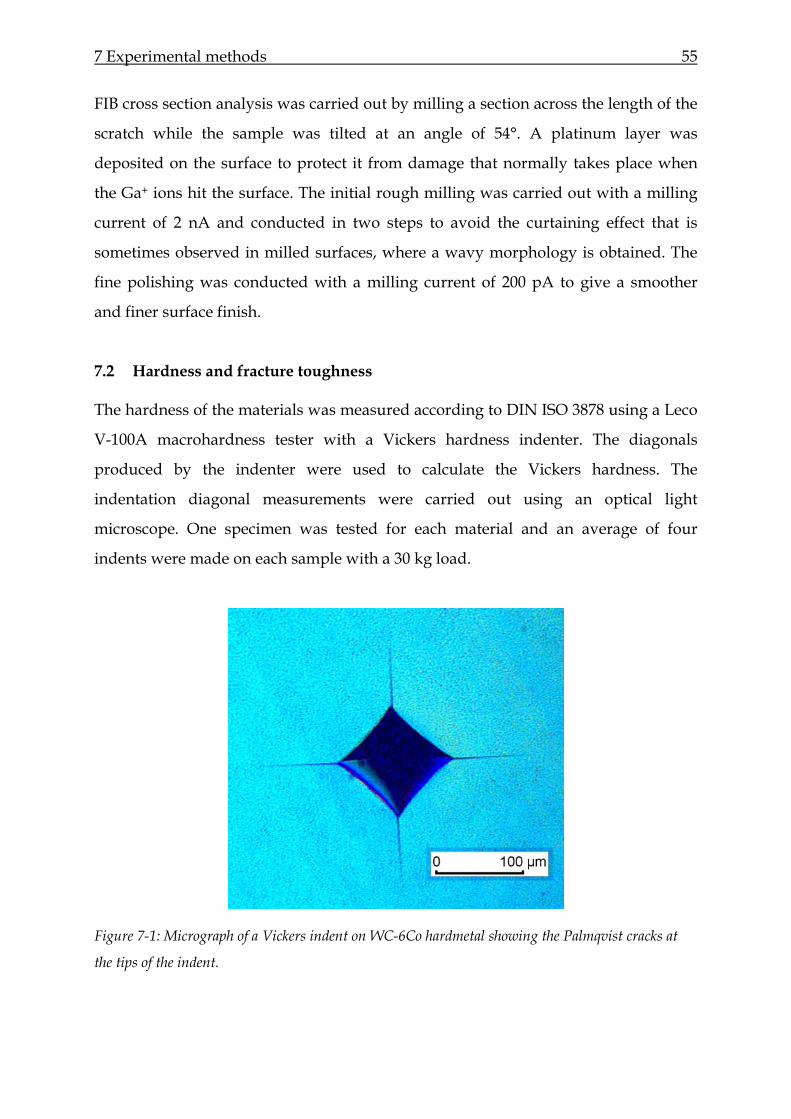
7 Experimental methods 55
FIB cross section analysis was carried out by milling a section across the length of the
scratch while the sample was tilted at an angle of 54°. A platinum layer was
deposited on the surface to protect it from damage that normally takes place when
the Ga+ ions hit the surface. The initial rough milling was carried out with a milling
current of 2 nA and conducted in two steps to avoid the curtaining effect that is
sometimes observed in milled surfaces, where a wavy morphology is obtained. The
fine polishing was conducted with a milling current of 200 pA to give a smoother
and finer surface finish.
7.2 Hardness and fracture toughness
The hardness of the materials was measured according to DIN ISO 3878 using a Leco
V-100A macrohardness tester with a Vickers hardness indenter. The diagonals
produced by the indenter were used to calculate the Vickers hardness. The
indentation diagonal measurements were carried out using an optical light
microscope. One specimen was tested for each material and an average of four
indents were made on each sample with a 30 kg load.
Figure 7-1: Micrograph of a Vickers indent on WC-6Co hardmetal showing the Palmqvist cracks at
the tips of the indent.
7 Experimental methods 56
The fracture toughness of the materials investigated in this study was determined
from the lengths of the Palmqvist cracks using equation 3-2, which was initially
derived by Shetty et al. [32]. In figure 7-1 you can see a micrograph of a hardmetal
sample showing the crack formation.
KIC = A∑
iia
HF E 3-2
H is the hardness of the material, F the indentation load and ai the length of each
Palmqvist crack. When all the quantities are expressed in SI units, the constant A is
equal to 0.2784. The crack lengths were determined by measuring the end to end
distance between opposite cracks and subtracting the length of the diagonal of the
hardness indent. The measurements were carried out using a light microscope and
image analysis program, Image C.
7.3 Nanoindentation
Nanoindentation experiments were performed in the low and high load regime for
studying the local and global mechanical properties of the WC-Co hard metals
respectively. The hardness and Young’s modulus of the bulk materials and
constituent phase could be determined from the nanoindentation measurements.
The local properties were measured using a nanoindenting AFM (NI-AFM) from
Hysitron Inc. combined with a multimode AFM from Digital Instruments. This was
used to indent the WC grains and cobalt binder phases separately to measure the
mechanical properties of each phase in the hard metal. The indents were carried out
with a load of 5 mN. It was not possible to get a good resolution of the WC grains for
all the samples so limited results will be presented in the results section of this thesis.
The global properties were investigated at a higher load of 700 mN with a
Nanoindenter XP. Tip shape calibration was carried out using fused silica as the
calibration standard. A 4x4 array of indents, spaced 20 µm apart, were performed on
7 Experimental methods 57
each sample with a Berkovich indenter using the continuous stiffness mode of the
Nanoindenter XP with a penetration depth of 2 µm. The Oliver/Pharr procedure is
incorporated into the MTS testworks software and was used to evaluate the
continuous stiffness measurements (CSM). With CSM measurements the hardness
and modulus of single indents is evaluated as a function of displacement.
7.4 Instrumented scratch testing
7.4.1 Nanoscratch testing
Nanoscratch tests on the hard metals were performed using a Nanoindenter XP with
a load controlled head. The load is applied normal to the sample surface via a
magnet/coil system which allows for precise and fast control. The indenter column is
supported by two leaf springs, providing very low stiffness to the vertical axis. A
maximum distance of 1.5 mm is allowed for the indenter travel normal to the sample
surface. Within this range the resolution is better than 0.1 nm. The maximum load
capacity for the standard system is 500 mN with a precision of less than 1 mN.
A diamond Berkovich indenter was used and the scratch tests were performed with
one corner of the Berkovich indenter in the scratch direction, this was important as
the tip orientation has been found to have an effect on the results [87,92].
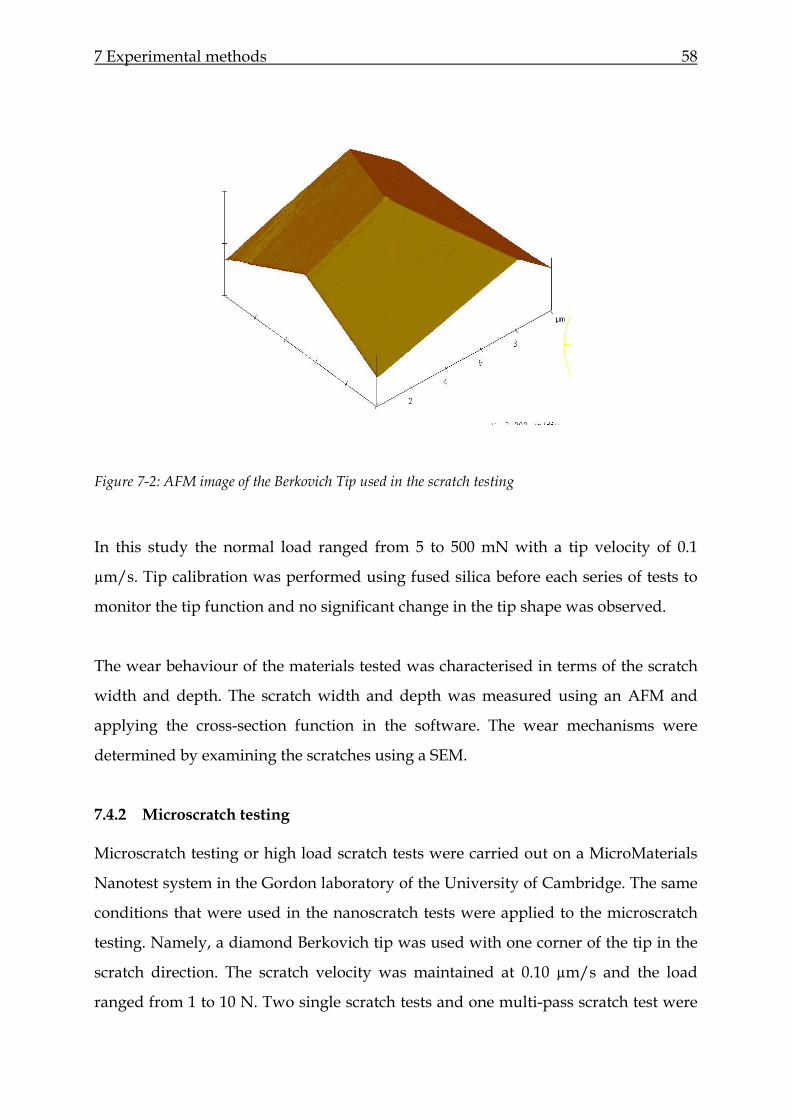
7 Experimental methods 58
Figure 7-2: AFM image of the Berkovich Tip used in the scratch testing
In this study the normal load ranged from 5 to 500 mN with a tip velocity of 0.1
µm/s. Tip calibration was performed using fused silica before each series of tests to
monitor the tip function and no significant change in the tip shape was observed.
The wear behaviour of the materials tested was characterised in terms of the scratch
width and depth. The scratch width and depth was measured using an AFM and
applying the cross-section function in the software. The wear mechanisms were
determined by examining the scratches using a SEM.
7.4.2 Microscratch testing
Microscratch testing or high load scratch tests were carried out on a MicroMaterials
Nanotest system in the Gordon laboratory of the University of Cambridge. The same
conditions that were used in the nanoscratch tests were applied to the microscratch
testing. Namely, a diamond Berkovich tip was used with one corner of the tip in the
scratch direction. The scratch velocity was maintained at 0.10 µm/s and the load
ranged from 1 to 10 N. Two single scratch tests and one multi-pass scratch test were
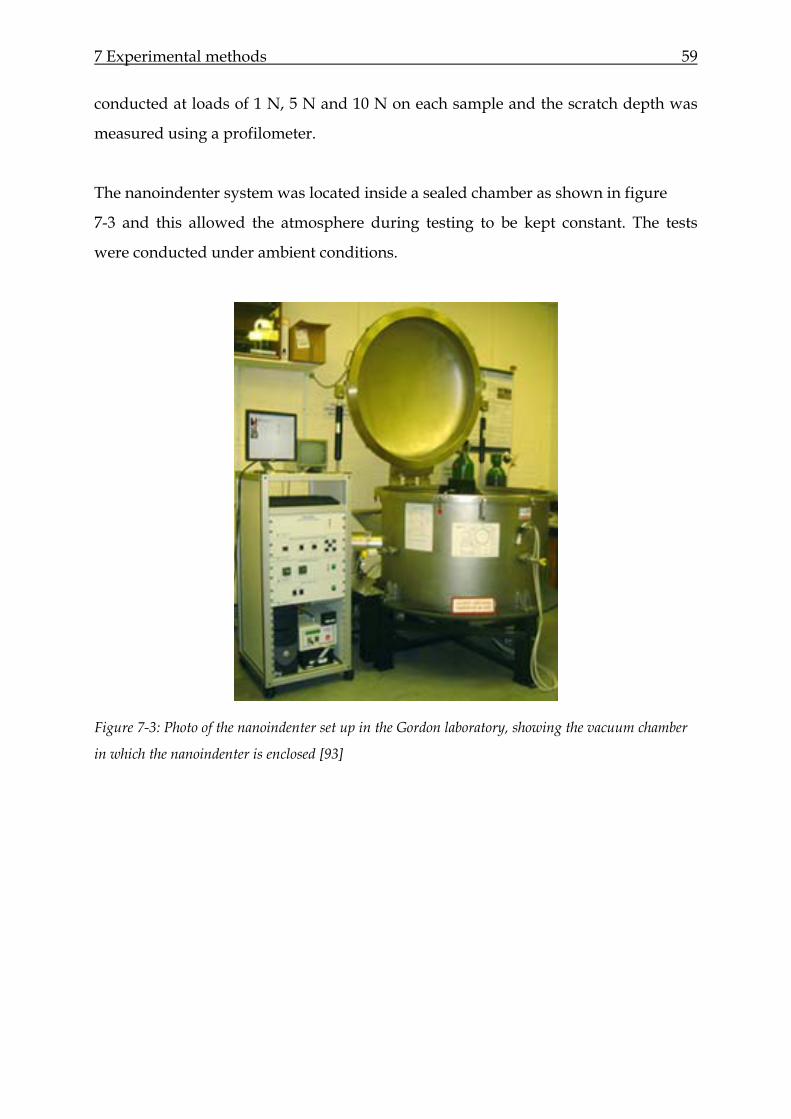
7 Experimental methods 59
conducted at loads of 1 N, 5 N and 10 N on each sample and the scratch depth was
measured using a profilometer.
The nanoindenter system was located inside a sealed chamber as shown in figure
7-3 and this allowed the atmosphere during testing to be kept constant. The tests
were conducted under ambient conditions.
Figure 7-3: Photo of the nanoindenter set up in the Gordon laboratory, showing the vacuum chamber
in which the nanoindenter is enclosed [93]
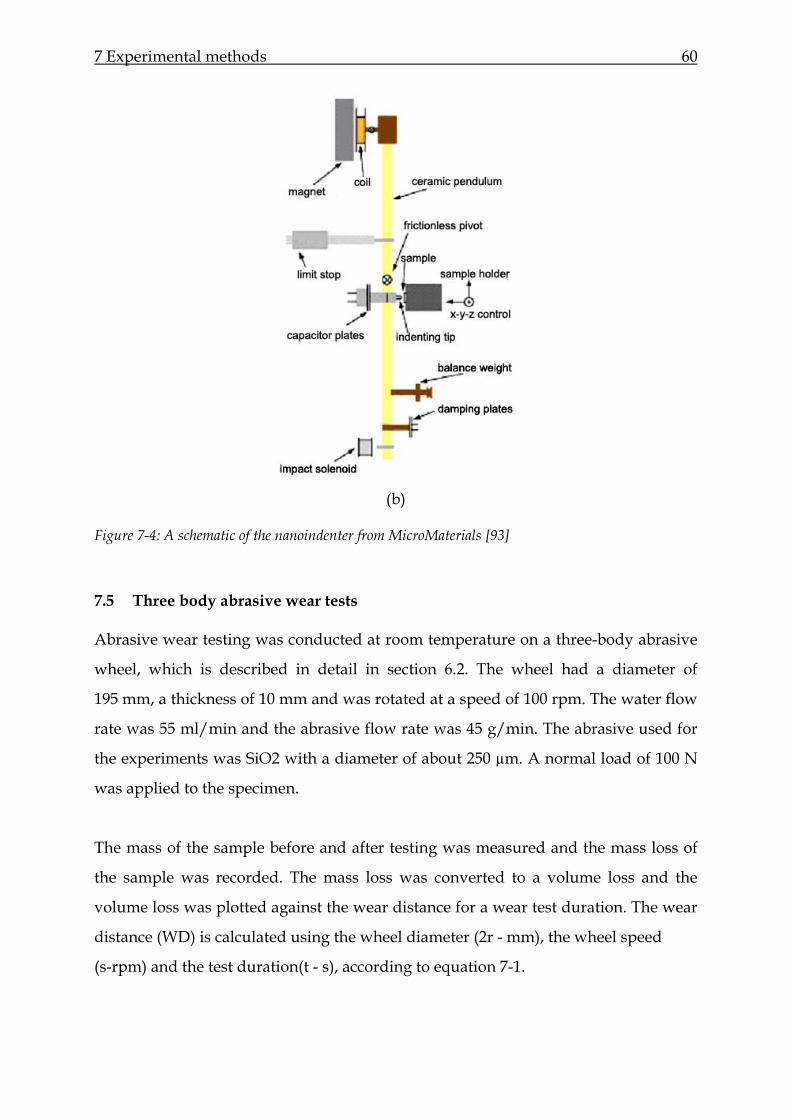
7 Experimental methods 60
(b)
Figure 7-4: A schematic of the nanoindenter from MicroMaterials [93]
7.5 Three body abrasive wear tests
Abrasive wear testing was conducted at room temperature on a three-body abrasive
wheel, which is described in detail in section 6.2. The wheel had a diameter of
195 mm, a thickness of 10 mm and was rotated at a speed of 100 rpm. The water flow
rate was 55 ml/min and the abrasive flow rate was 45 g/min. The abrasive used for
the experiments was SiO2 with a diameter of about 250 µm. A normal load of 100 N
was applied to the specimen.
The mass of the sample before and after testing was measured and the mass loss of
the sample was recorded. The mass loss was converted to a volume loss and the
volume loss was plotted against the wear distance for a wear test duration. The wear
distance (WD) is calculated using the wheel diameter (2r - mm), the wheel speed
(s-rpm) and the test duration(t - s), according to equation 7-1.

7 Experimental methods 61
E 7-1
The sample geometry and resulting wear scar is shown in figure 7-5.
29mm 2mm 19.5mm
Figure 7-5 : Wear sample geometry: schematic [94]
Figure 7-6: Photograph of sample showing the as-received state on the left and the worn state on the
right [94].
7.6 Sliding wear tests
Sliding wear tests were conducted on a pin-on-disk tribometer, under dry conditions
at room temperature in laboratory air. The apparatus was built by the department of
mechanical Engineering at the University of Erlangen-Nürnberg. The WC-Co
hardmetals constituted the discs, which had a 40 mm diameter and were used in the
as-received condition without any additional polishing. The pin consisted of a steel
ball (100Cr6) with a diameter of ca 4 mm. The normal load applied was 9.8 N and the
6010002
⋅⋅⋅⋅
=tnrWD π
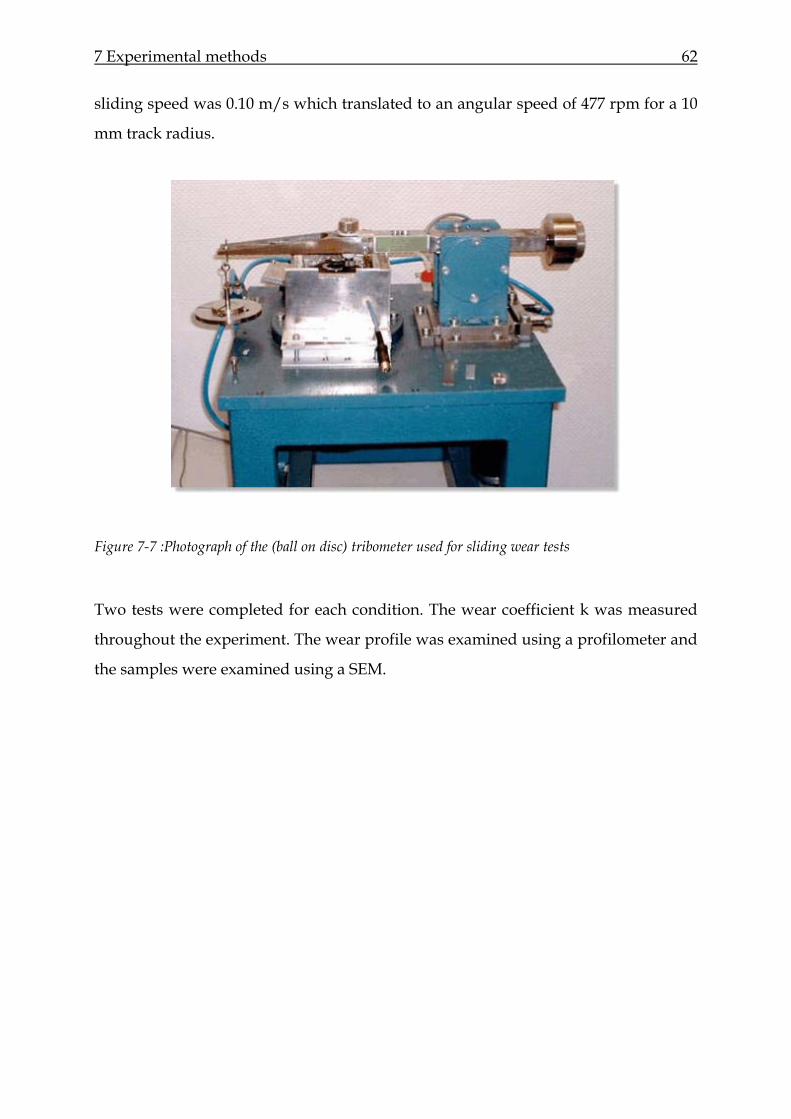
7 Experimental methods 62
sliding speed was 0.10 m/s which translated to an angular speed of 477 rpm for a 10
mm track radius.
Figure 7-7 :Photograph of the (ball on disc) tribometer used for sliding wear tests
Two tests were completed for each condition. The wear coefficient k was measured
throughout the experiment. The wear profile was examined using a profilometer and
the samples were examined using a SEM.

8 Results 63
8 Results
In this chapter the results of the experimental work that was carried out are
described. The experimental data is presented in graphic form and electron
micrographs and AFM images are also displayed to show the microstructural
features of the wear processes that took place.
8.1 Material microstructure
The binderless WC had a multicrystalline microstructure with an average grain size
of 570 nm (figure 8-1a). The presence of pores was observed from the electron
micrographs of the sample. The pore shape and size varied with most pores
occurring on the grain boundary. The WC grain shape varied but the grains were
generally less angular than those in the WC-Co hardmetal.
The hardmetal samples were divided into two main categories, those with a low
binder content of 6 wt% and the second group containing the samples with a high
binder content of 15 wt%. The polished samples were examined using a scanning
electron microscope and the grain size was determined using the line intercept
method.
The WC grains were trapezoidal in shape with sharp edges and corners (figures 8-1b
to 8-1h). The WC grain size in each sample was found to vary and the size
distribution of the samples is shown in figure 8-3. These materials exhibited high
contiguity due to the low binder content. In some cases it was not possible to
distinguish the grain boundaries clearly. The average grain size of the samples varied
from 0.25 to 2.65 µm giving a wide range of grain sizes for investigation.
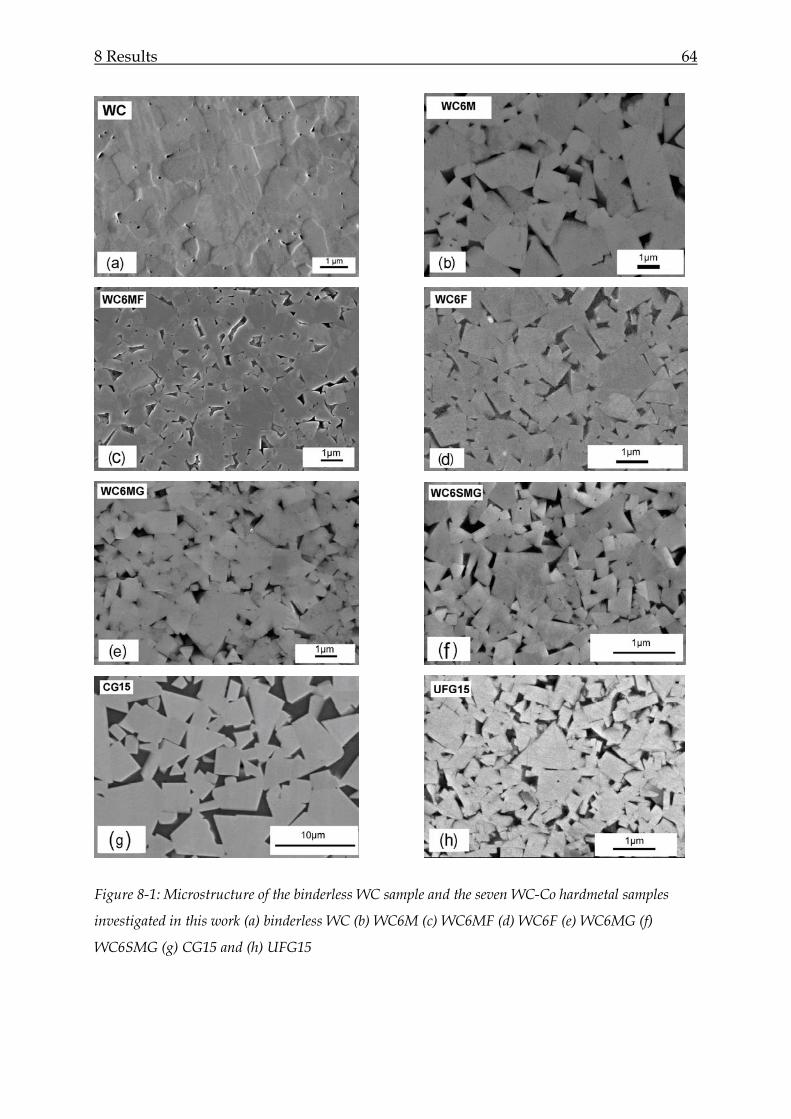
8 Results 64
Figure 8-1: Microstructure of the binderless WC sample and the seven WC-Co hardmetal samples
investigated in this work (a) binderless WC (b) WC6M (c) WC6MF (d) WC6F (e) WC6MG (f)
WC6SMG (g) CG15 and (h) UFG15
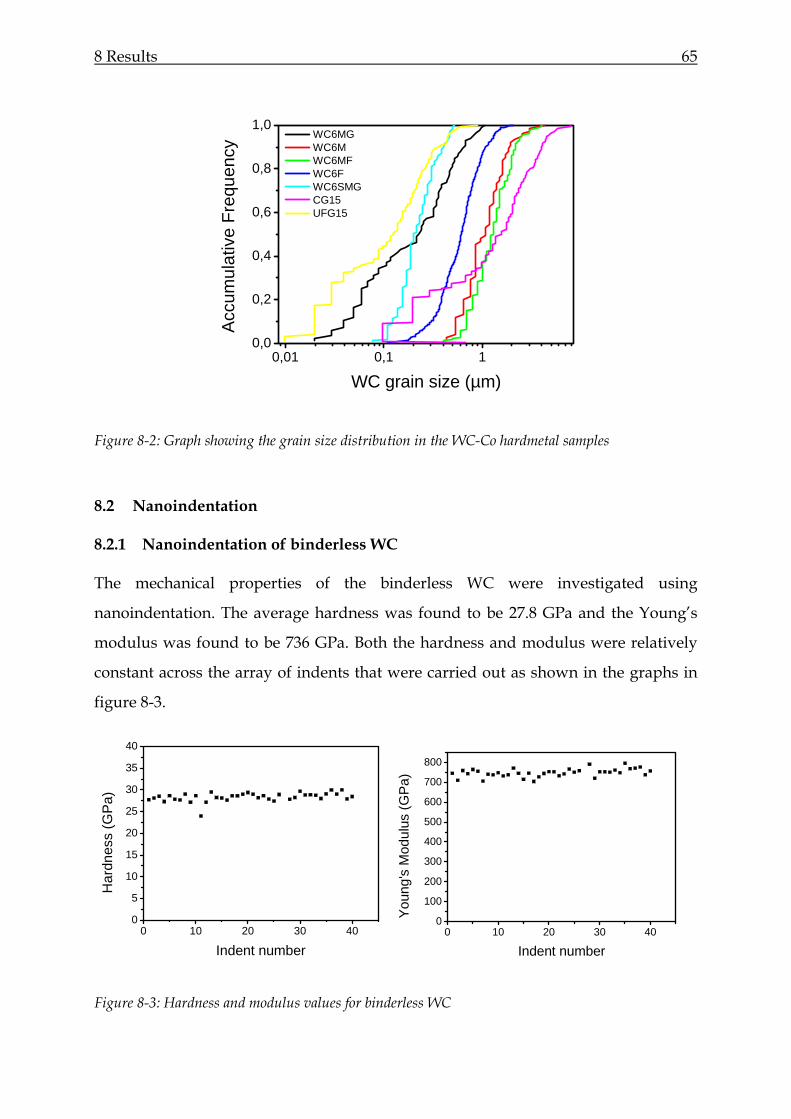
8 Results 65
0,01 0,1 10,0
0,2
0,4
0,6
0,8
1,0
Acc
umul
ativ
e Fr
eque
ncy
WC grain size (µm)
WC6MG WC6M WC6MF WC6F WC6SMG CG15 UFG15
Figure 8-2: Graph showing the grain size distribution in the WC-Co hardmetal samples
8.2 Nanoindentation
8.2.1 Nanoindentation of binderless WC
The mechanical properties of the binderless WC were investigated using
nanoindentation. The average hardness was found to be 27.8 GPa and the Young’s
modulus was found to be 736 GPa. Both the hardness and modulus were relatively
constant across the array of indents that were carried out as shown in the graphs in
figure 8-3.
0 10 20 30 400
5
10
15
20
25
30
35
40
Har
dnes
s (G
Pa)
Indent number
0 10 20 30 400
100
200
300
400
500
600
700
800
You
ng's
Mod
ulus
(GP
a)
Indent number
Figure 8-3: Hardness and modulus values for binderless WC
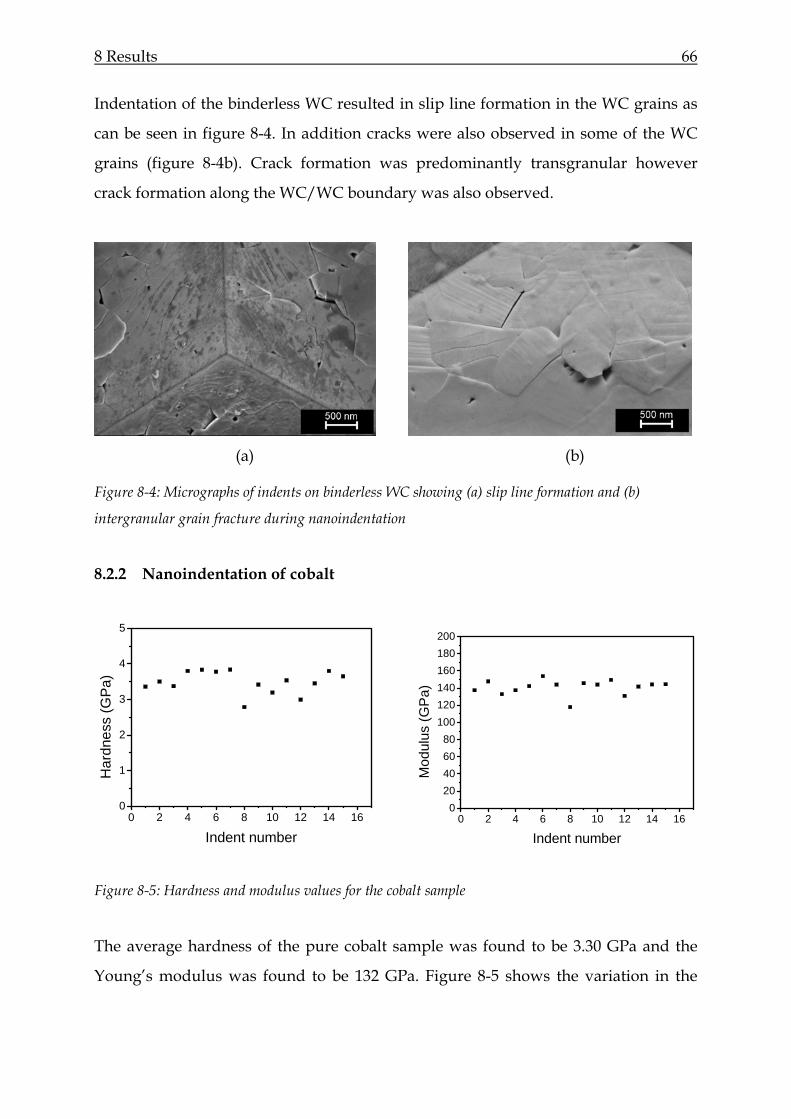
8 Results 66
Indentation of the binderless WC resulted in slip line formation in the WC grains as
can be seen in figure 8-4. In addition cracks were also observed in some of the WC
grains (figure 8-4b). Crack formation was predominantly transgranular however
crack formation along the WC/WC boundary was also observed.
(a) (b)
Figure 8-4: Micrographs of indents on binderless WC showing (a) slip line formation and (b)
intergranular grain fracture during nanoindentation
8.2.2 Nanoindentation of cobalt
0 2 4 6 8 10 12 14 160
1
2
3
4
5
Har
dnes
s (G
Pa)
Indent number
0 2 4 6 8 10 12 14 160
20406080
100120140160180200
Mod
ulus
(GP
a)
Indent number
Figure 8-5: Hardness and modulus values for the cobalt sample
The average hardness of the pure cobalt sample was found to be 3.30 GPa and the
Young’s modulus was found to be 132 GPa. Figure 8-5 shows the variation in the
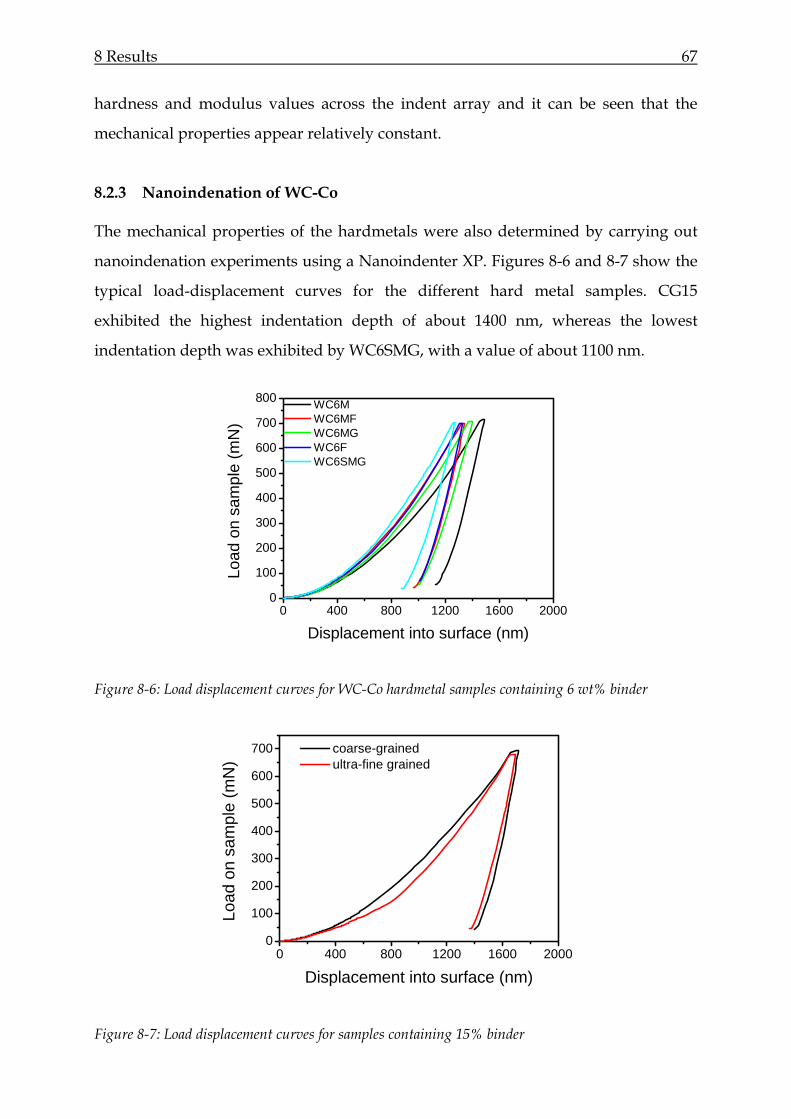
8 Results 67
hardness and modulus values across the indent array and it can be seen that the
mechanical properties appear relatively constant.
8.2.3 Nanoindenation of WC-Co
The mechanical properties of the hardmetals were also determined by carrying out
nanoindenation experiments using a Nanoindenter XP. Figures 8-6 and 8-7 show the
typical load-displacement curves for the different hard metal samples. CG15
exhibited the highest indentation depth of about 1400 nm, whereas the lowest
indentation depth was exhibited by WC6SMG, with a value of about 1100 nm.
0 400 800 1200 1600 20000
100
200
300
400
500
600
700
800
Load
on
sam
ple
(mN
)
Displacement into surface (nm)
WC6M WC6MF WC6MG WC6F WC6SMG
Figure 8-6: Load displacement curves for WC-Co hardmetal samples containing 6 wt% binder
0 400 800 1200 1600 20000
100
200
300
400
500
600
700
Load
on
sam
ple
(mN
)
Displacement into surface (nm)
coarse-grained ultra-fine grained
Figure 8-7: Load displacement curves for samples containing 15% binder
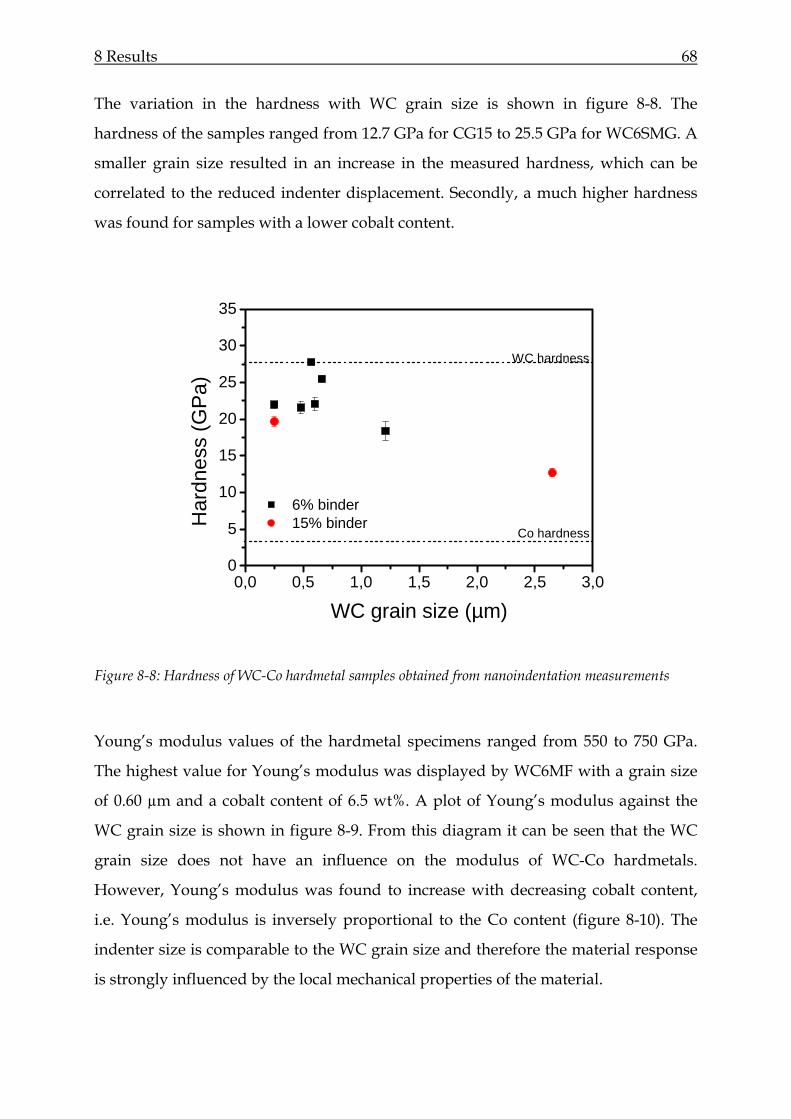
8 Results 68
The variation in the hardness with WC grain size is shown in figure 8-8. The
hardness of the samples ranged from 12.7 GPa for CG15 to 25.5 GPa for WC6SMG. A
smaller grain size resulted in an increase in the measured hardness, which can be
correlated to the reduced indenter displacement. Secondly, a much higher hardness
was found for samples with a lower cobalt content.
0,0 0,5 1,0 1,5 2,0 2,5 3,00
5
10
15
20
25
30
35
Har
dnes
s (G
Pa)
WC grain size (µm)
6% binder 15% binder
WC hardness
Co hardness
Figure 8-8: Hardness of WC-Co hardmetal samples obtained from nanoindentation measurements
Young’s modulus values of the hardmetal specimens ranged from 550 to 750 GPa.
The highest value for Young’s modulus was displayed by WC6MF with a grain size
of 0.60 µm and a cobalt content of 6.5 wt%. A plot of Young’s modulus against the
WC grain size is shown in figure 8-9. From this diagram it can be seen that the WC
grain size does not have an influence on the modulus of WC-Co hardmetals.
However, Young’s modulus was found to increase with decreasing cobalt content,
i.e. Young’s modulus is inversely proportional to the Co content (figure 8-10). The
indenter size is comparable to the WC grain size and therefore the material response
is strongly influenced by the local mechanical properties of the material.
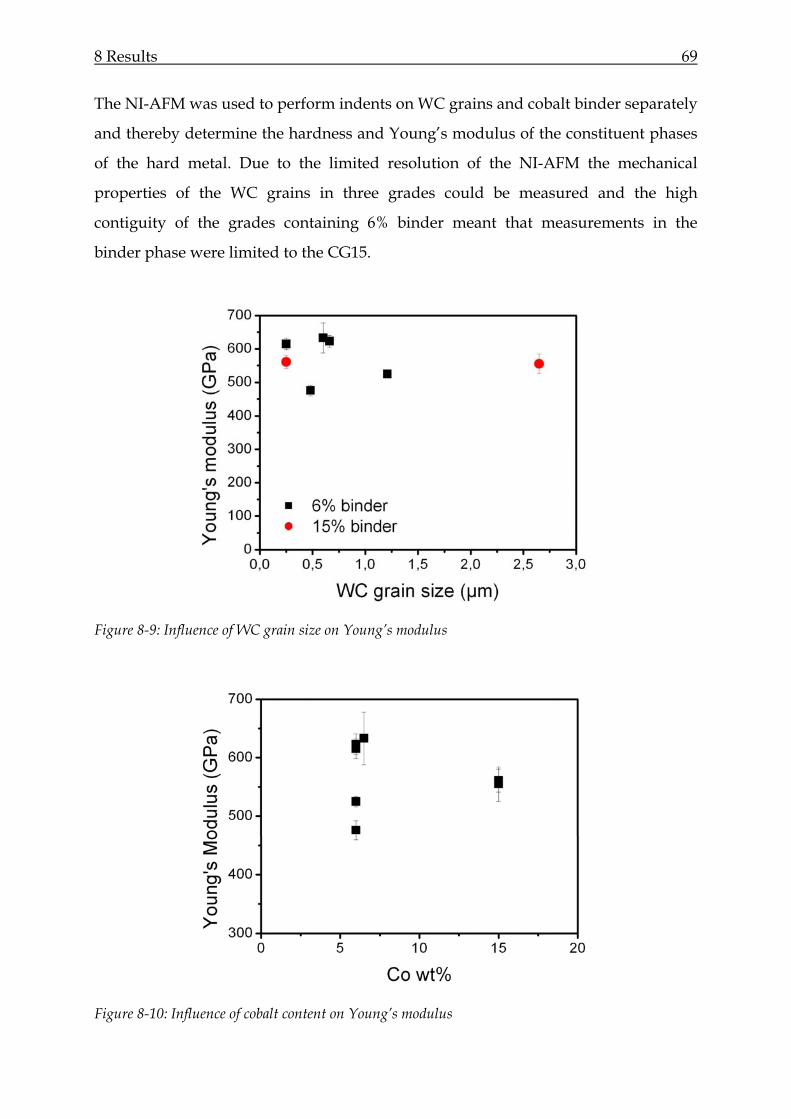
8 Results 69
The NI-AFM was used to perform indents on WC grains and cobalt binder separately
and thereby determine the hardness and Young’s modulus of the constituent phases
of the hard metal. Due to the limited resolution of the NI-AFM the mechanical
properties of the WC grains in three grades could be measured and the high
contiguity of the grades containing 6% binder meant that measurements in the
binder phase were limited to the CG15.
Figure 8-9: Influence of WC grain size on Young’s modulus
Figure 8-10: Influence of cobalt content on Young’s modulus
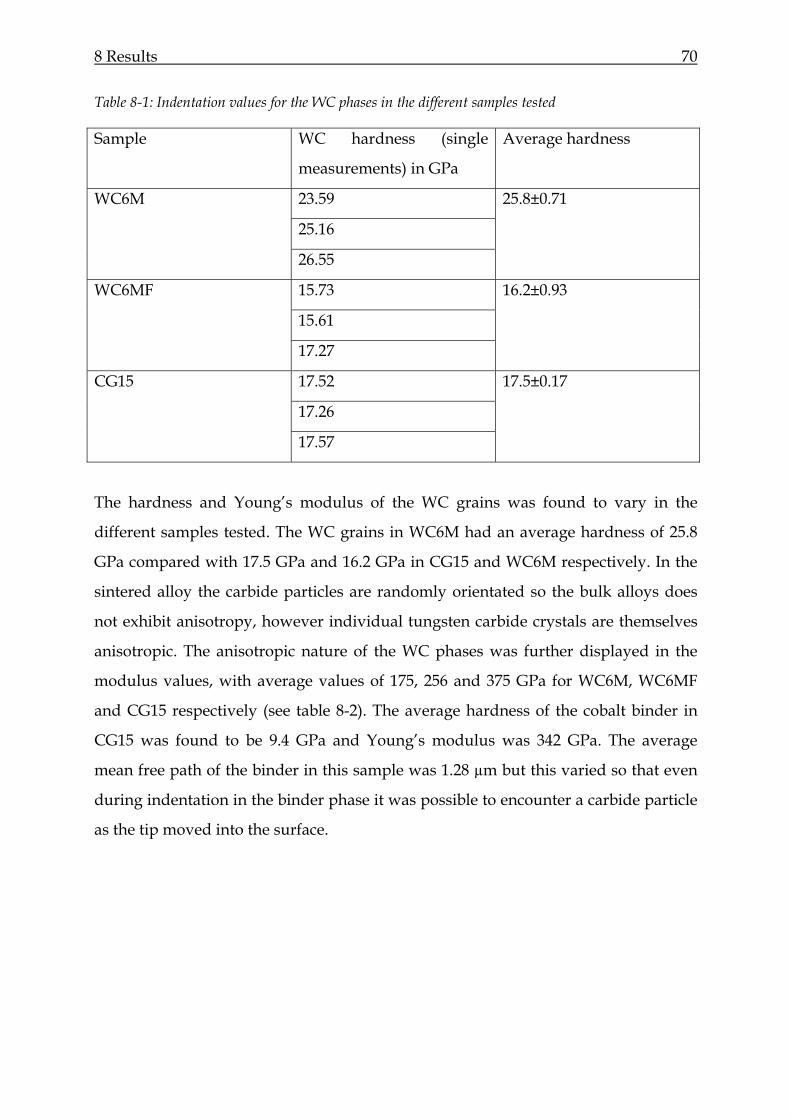
8 Results 70
Table 8-1: Indentation values for the WC phases in the different samples tested
Sample WC hardness (single
measurements) in GPa
Average hardness
23.59
25.16
WC6M
26.55
25.8±0.71
15.73
15.61
WC6MF
17.27
16.2±0.93
17.52
17.26
CG15
17.57
17.5±0.17
The hardness and Young’s modulus of the WC grains was found to vary in the
different samples tested. The WC grains in WC6M had an average hardness of 25.8
GPa compared with 17.5 GPa and 16.2 GPa in CG15 and WC6M respectively. In the
sintered alloy the carbide particles are randomly orientated so the bulk alloys does
not exhibit anisotropy, however individual tungsten carbide crystals are themselves
anisotropic. The anisotropic nature of the WC phases was further displayed in the
modulus values, with average values of 175, 256 and 375 GPa for WC6M, WC6MF
and CG15 respectively (see table 8-2). The average hardness of the cobalt binder in
CG15 was found to be 9.4 GPa and Young’s modulus was 342 GPa. The average
mean free path of the binder in this sample was 1.28 µm but this varied so that even
during indentation in the binder phase it was possible to encounter a carbide particle
as the tip moved into the surface.
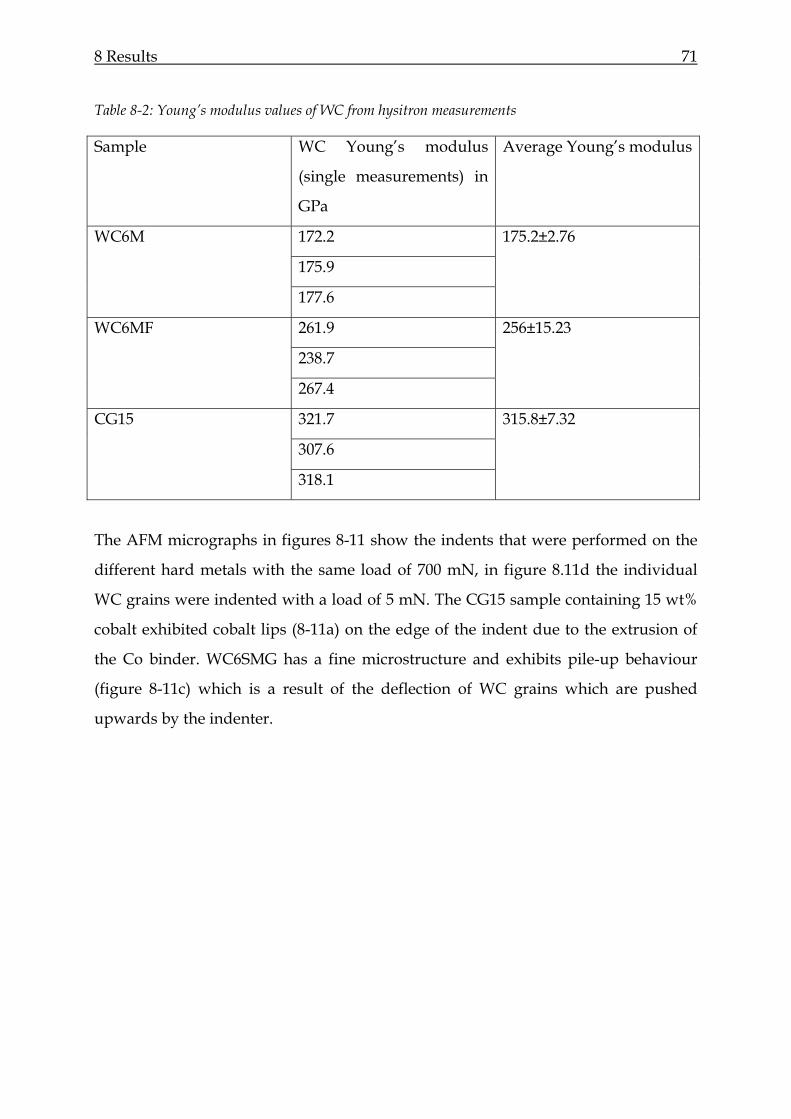
8 Results 71
Table 8-2: Young’s modulus values of WC from hysitron measurements
Sample WC Young’s modulus
(single measurements) in
GPa
Average Young’s modulus
172.2
175.9
WC6M
177.6
175.2±2.76
261.9
238.7
WC6MF
267.4
256±15.23
321.7
307.6
CG15
318.1
315.8±7.32
The AFM micrographs in figures 8-11 show the indents that were performed on the
different hard metals with the same load of 700 mN, in figure 8.11d the individual
WC grains were indented with a load of 5 mN. The CG15 sample containing 15 wt%
cobalt exhibited cobalt lips (8-11a) on the edge of the indent due to the extrusion of
the Co binder. WC6SMG has a fine microstructure and exhibits pile-up behaviour
(figure 8-11c) which is a result of the deflection of WC grains which are pushed
upwards by the indenter.
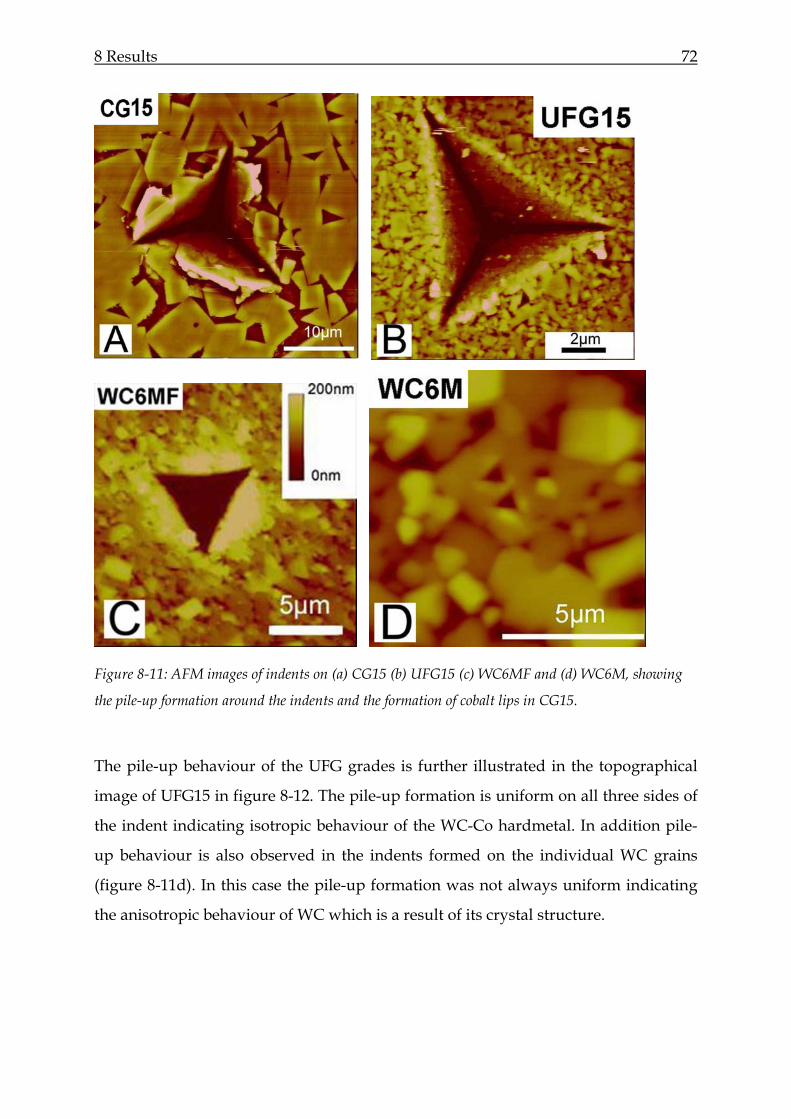
8 Results 72
Figure 8-11: AFM images of indents on (a) CG15 (b) UFG15 (c) WC6MF and (d) WC6M, showing
the pile-up formation around the indents and the formation of cobalt lips in CG15.
The pile-up behaviour of the UFG grades is further illustrated in the topographical
image of UFG15 in figure 8-12. The pile-up formation is uniform on all three sides of
the indent indicating isotropic behaviour of the WC-Co hardmetal. In addition pile-
up behaviour is also observed in the indents formed on the individual WC grains
(figure 8-11d). In this case the pile-up formation was not always uniform indicating
the anisotropic behaviour of WC which is a result of its crystal structure.
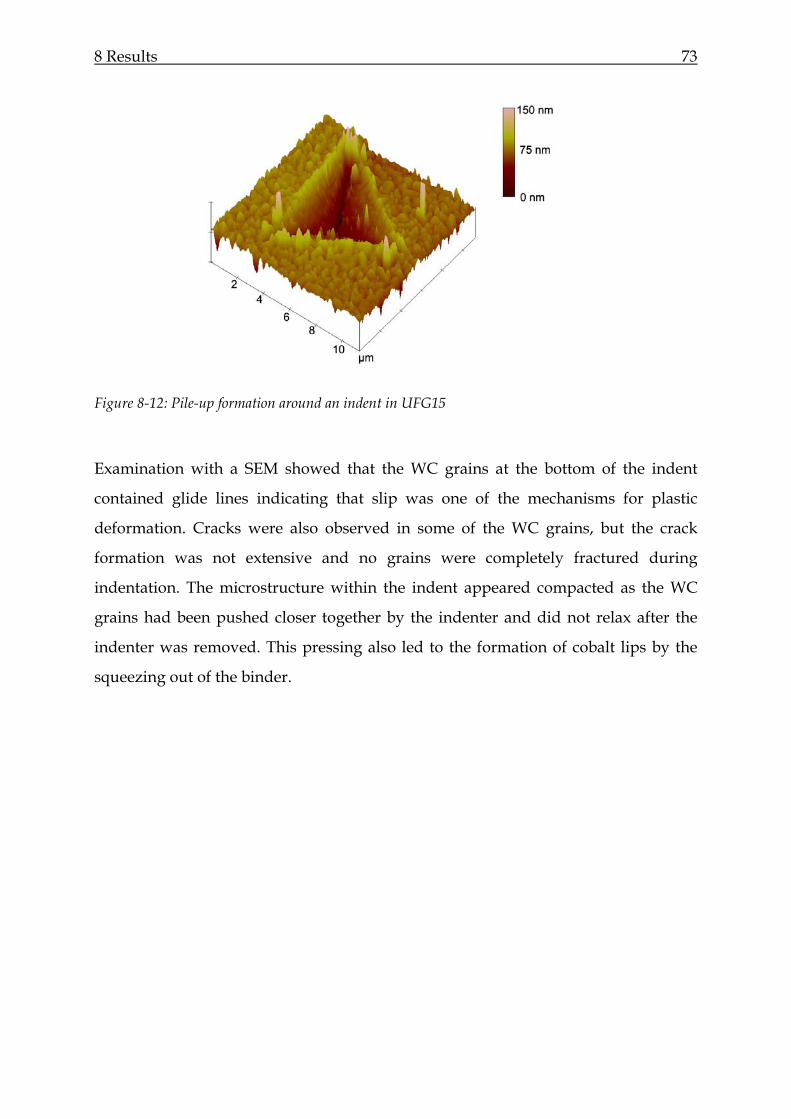
8 Results 73
Figure 8-12: Pile-up formation around an indent in UFG15
Examination with a SEM showed that the WC grains at the bottom of the indent
contained glide lines indicating that slip was one of the mechanisms for plastic
deformation. Cracks were also observed in some of the WC grains, but the crack
formation was not extensive and no grains were completely fractured during
indentation. The microstructure within the indent appeared compacted as the WC
grains had been pushed closer together by the indenter and did not relax after the
indenter was removed. This pressing also led to the formation of cobalt lips by the
squeezing out of the binder.

8 Results 74
Figure 8-13: SEM Micrograph of an indent on WC6MF showing glide line and crack formation in the
WC grains.
It is also clear from figures 8-11a and b that the number of deformed grains during
indentation varies strongly from the coarse grained to the fine grained hardmetal.
The indent size in CG15 is much larger. However from figure 8-11a only a few grains
are deformed. In comparison, in the UFG sample (figure 8-11b) the indent size is
smaller but includes a large number of deformed WC grains. The number of
deformed grains is related to the plastically deformed volume which was calculated.
It was assumed that the WC grains were cuboidal in shape and therefore the number
of deformed grains was estimated by dividing the total deformed volume by the
volume of a single grain. CG15 had the largest deformed volume but the least
number of deformed grains because of the coarse grained structure. The UFG
materials had smaller plastically deformed volumes but due to the finer
microstructures the estimated number of deformed grains was significantly higher,
see figure 8-14. Therefore the deformation behaviour of the UFG hardmetals is a bulk
material behaviour throughout the entire indentation process whereas in the coarser
grained hardmetals the individual WC grains influence the deformation behaviour
when the tip first enters the hard metal surface.
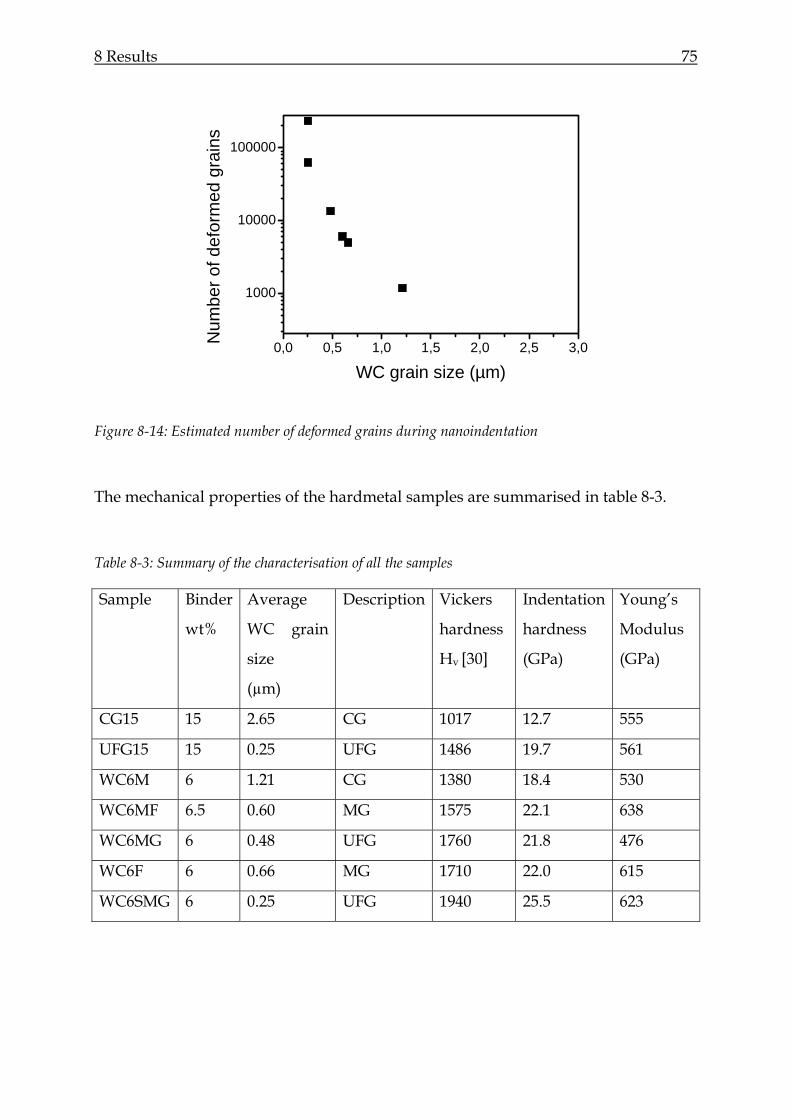
8 Results 75
0,0 0,5 1,0 1,5 2,0 2,5 3,0
1000
10000
100000
Num
ber o
f def
orm
ed g
rain
s
WC grain size (µm)
Figure 8-14: Estimated number of deformed grains during nanoindentation
The mechanical properties of the hardmetal samples are summarised in table 8-3.
Table 8-3: Summary of the characterisation of all the samples
Sample Binder
wt%
Average
WC grain
size
(µm)
Description Vickers
hardness
Hv [30]
Indentation
hardness
(GPa)
Young’s
Modulus
(GPa)
CG15 15 2.65 CG 1017 12.7 555
UFG15 15 0.25 UFG 1486 19.7 561
WC6M 6 1.21 CG 1380 18.4 530
WC6MF 6.5 0.60 MG 1575 22.1 638
WC6MG 6 0.48 UFG 1760 21.8 476
WC6F 6 0.66 MG 1710 22.0 615
WC6SMG 6 0.25 UFG 1940 25.5 623
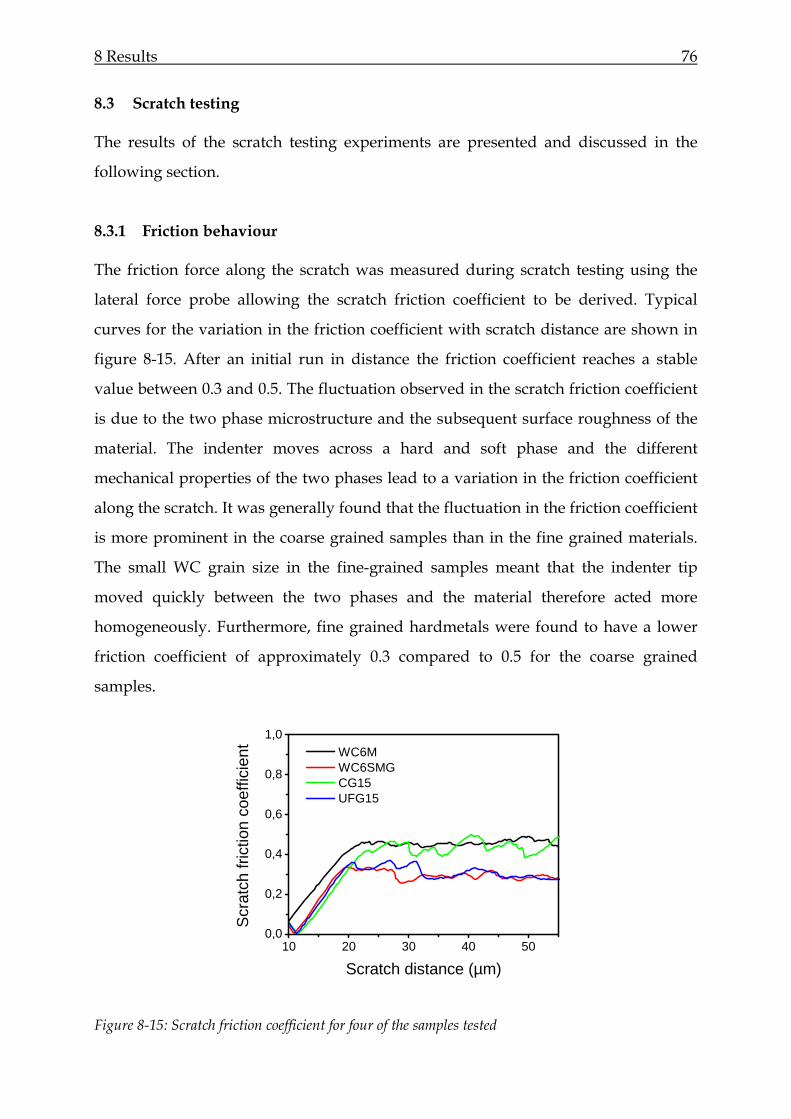
8 Results 76
8.3 Scratch testing
The results of the scratch testing experiments are presented and discussed in the
following section.
8.3.1 Friction behaviour
The friction force along the scratch was measured during scratch testing using the
lateral force probe allowing the scratch friction coefficient to be derived. Typical
curves for the variation in the friction coefficient with scratch distance are shown in
figure 8-15. After an initial run in distance the friction coefficient reaches a stable
value between 0.3 and 0.5. The fluctuation observed in the scratch friction coefficient
is due to the two phase microstructure and the subsequent surface roughness of the
material. The indenter moves across a hard and soft phase and the different
mechanical properties of the two phases lead to a variation in the friction coefficient
along the scratch. It was generally found that the fluctuation in the friction coefficient
is more prominent in the coarse grained samples than in the fine grained materials.
The small WC grain size in the fine-grained samples meant that the indenter tip
moved quickly between the two phases and the material therefore acted more
homogeneously. Furthermore, fine grained hardmetals were found to have a lower
friction coefficient of approximately 0.3 compared to 0.5 for the coarse grained
samples.
10 20 30 40 500,0
0,2
0,4
0,6
0,8
1,0
Scr
atch
fric
tion
coef
ficie
nt
Scratch distance (µm)
WC6M WC6SMG CG15 UFG15
Figure 8-15: Scratch friction coefficient for four of the samples tested
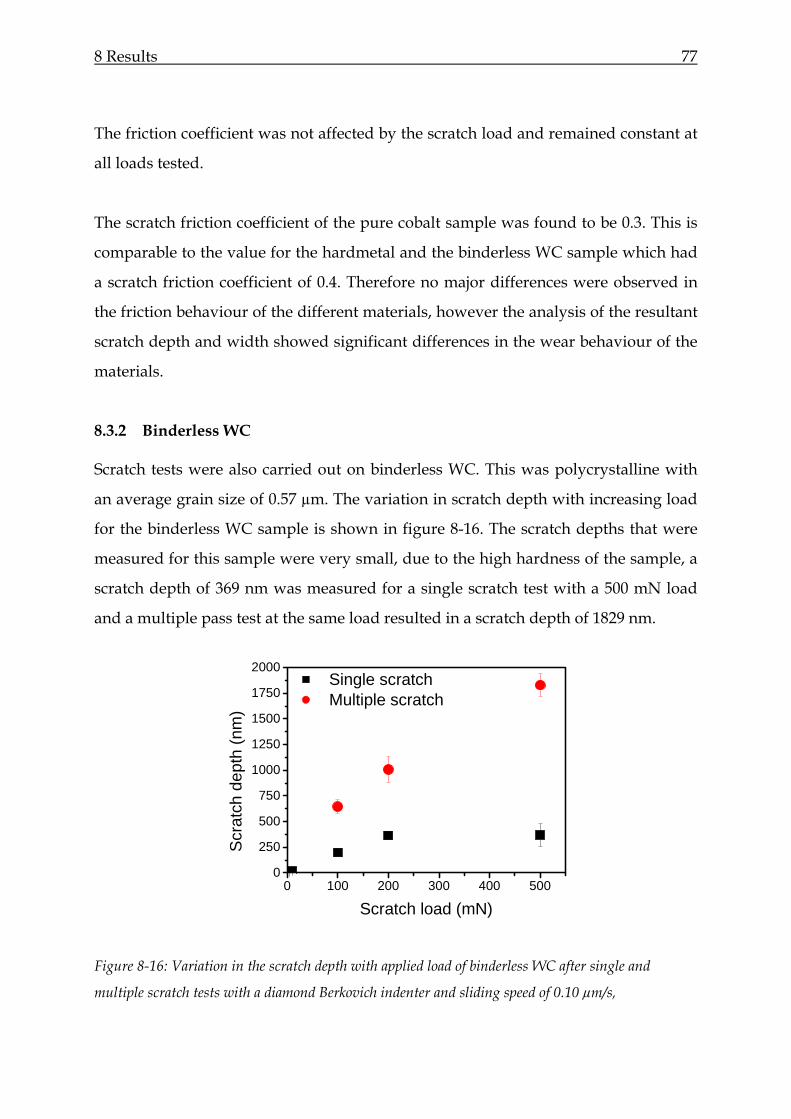
8 Results 77
The friction coefficient was not affected by the scratch load and remained constant at
all loads tested.
The scratch friction coefficient of the pure cobalt sample was found to be 0.3. This is
comparable to the value for the hardmetal and the binderless WC sample which had
a scratch friction coefficient of 0.4. Therefore no major differences were observed in
the friction behaviour of the different materials, however the analysis of the resultant
scratch depth and width showed significant differences in the wear behaviour of the
materials.
8.3.2 Binderless WC
Scratch tests were also carried out on binderless WC. This was polycrystalline with
an average grain size of 0.57 µm. The variation in scratch depth with increasing load
for the binderless WC sample is shown in figure 8-16. The scratch depths that were
measured for this sample were very small, due to the high hardness of the sample, a
scratch depth of 369 nm was measured for a single scratch test with a 500 mN load
and a multiple pass test at the same load resulted in a scratch depth of 1829 nm.
0 100 200 300 400 5000
250
500
750
1000
1250
1500
1750
2000
Scr
atch
dep
th (n
m)
Scratch load (mN)
Single scratch Multiple scratch
Figure 8-16: Variation in the scratch depth with applied load of binderless WC after single and
multiple scratch tests with a diamond Berkovich indenter and sliding speed of 0.10 µm/s,
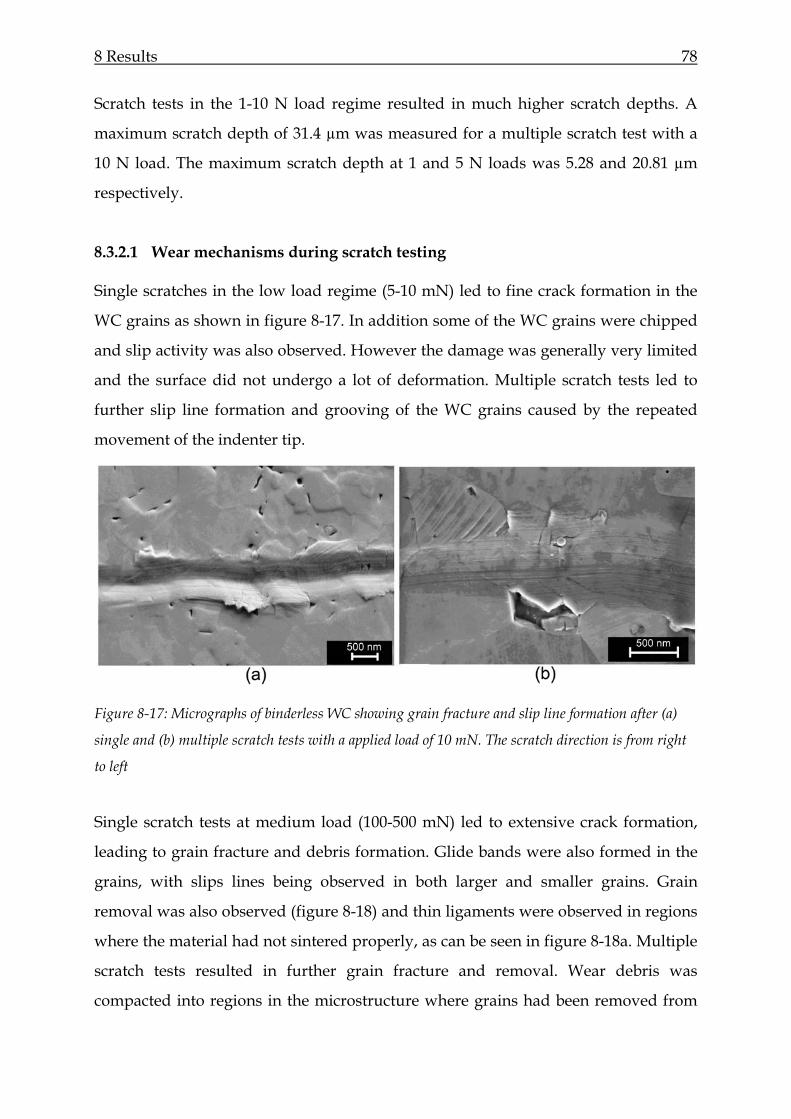
8 Results 78
Scratch tests in the 1-10 N load regime resulted in much higher scratch depths. A
maximum scratch depth of 31.4 µm was measured for a multiple scratch test with a
10 N load. The maximum scratch depth at 1 and 5 N loads was 5.28 and 20.81 µm
respectively.
8.3.2.1 Wear mechanisms during scratch testing
Single scratches in the low load regime (5-10 mN) led to fine crack formation in the
WC grains as shown in figure 8-17. In addition some of the WC grains were chipped
and slip activity was also observed. However the damage was generally very limited
and the surface did not undergo a lot of deformation. Multiple scratch tests led to
further slip line formation and grooving of the WC grains caused by the repeated
movement of the indenter tip.
Figure 8-17: Micrographs of binderless WC showing grain fracture and slip line formation after (a)
single and (b) multiple scratch tests with a applied load of 10 mN. The scratch direction is from right
to left
Single scratch tests at medium load (100-500 mN) led to extensive crack formation,
leading to grain fracture and debris formation. Glide bands were also formed in the
grains, with slips lines being observed in both larger and smaller grains. Grain
removal was also observed (figure 8-18) and thin ligaments were observed in regions
where the material had not sintered properly, as can be seen in figure 8-18a. Multiple
scratch tests resulted in further grain fracture and removal. Wear debris was
compacted into regions in the microstructure where grains had been removed from
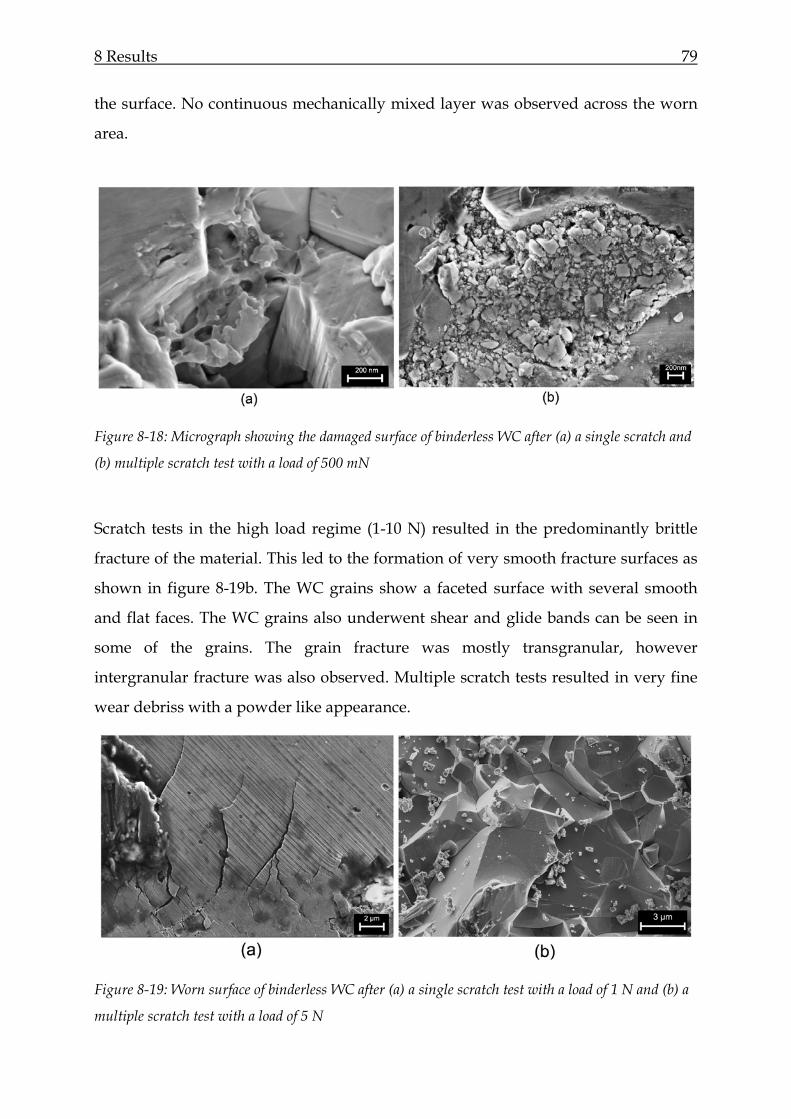
8 Results 79
the surface. No continuous mechanically mixed layer was observed across the worn
area.
Figure 8-18: Micrograph showing the damaged surface of binderless WC after (a) a single scratch and
(b) multiple scratch test with a load of 500 mN
Scratch tests in the high load regime (1-10 N) resulted in the predominantly brittle
fracture of the material. This led to the formation of very smooth fracture surfaces as
shown in figure 8-19b. The WC grains show a faceted surface with several smooth
and flat faces. The WC grains also underwent shear and glide bands can be seen in
some of the grains. The grain fracture was mostly transgranular, however
intergranular fracture was also observed. Multiple scratch tests resulted in very fine
wear debriss with a powder like appearance.
Figure 8-19: Worn surface of binderless WC after (a) a single scratch test with a load of 1 N and (b) a
multiple scratch test with a load of 5 N
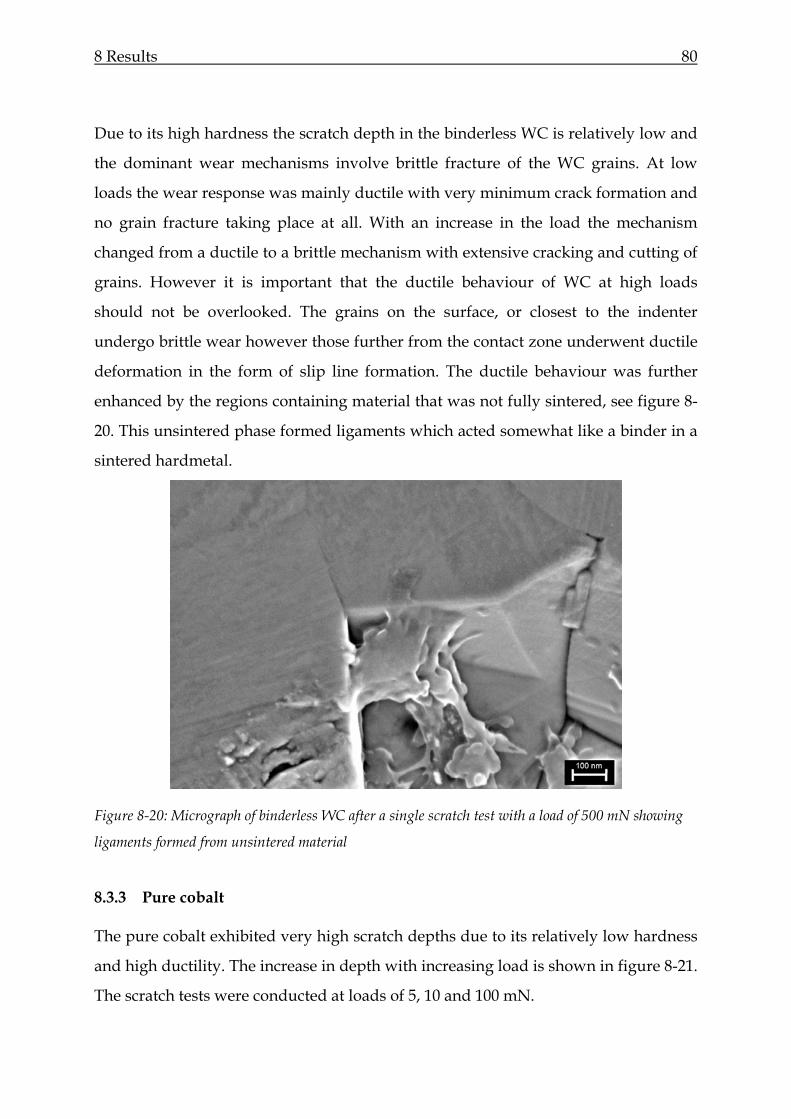
8 Results 80
Due to its high hardness the scratch depth in the binderless WC is relatively low and
the dominant wear mechanisms involve brittle fracture of the WC grains. At low
loads the wear response was mainly ductile with very minimum crack formation and
no grain fracture taking place at all. With an increase in the load the mechanism
changed from a ductile to a brittle mechanism with extensive cracking and cutting of
grains. However it is important that the ductile behaviour of WC at high loads
should not be overlooked. The grains on the surface, or closest to the indenter
undergo brittle wear however those further from the contact zone underwent ductile
deformation in the form of slip line formation. The ductile behaviour was further
enhanced by the regions containing material that was not fully sintered, see figure 8-
20. This unsintered phase formed ligaments which acted somewhat like a binder in a
sintered hardmetal.
Figure 8-20: Micrograph of binderless WC after a single scratch test with a load of 500 mN showing
ligaments formed from unsintered material
8.3.3 Pure cobalt
The pure cobalt exhibited very high scratch depths due to its relatively low hardness
and high ductility. The increase in depth with increasing load is shown in figure 8-21.
The scratch tests were conducted at loads of 5, 10 and 100 mN.
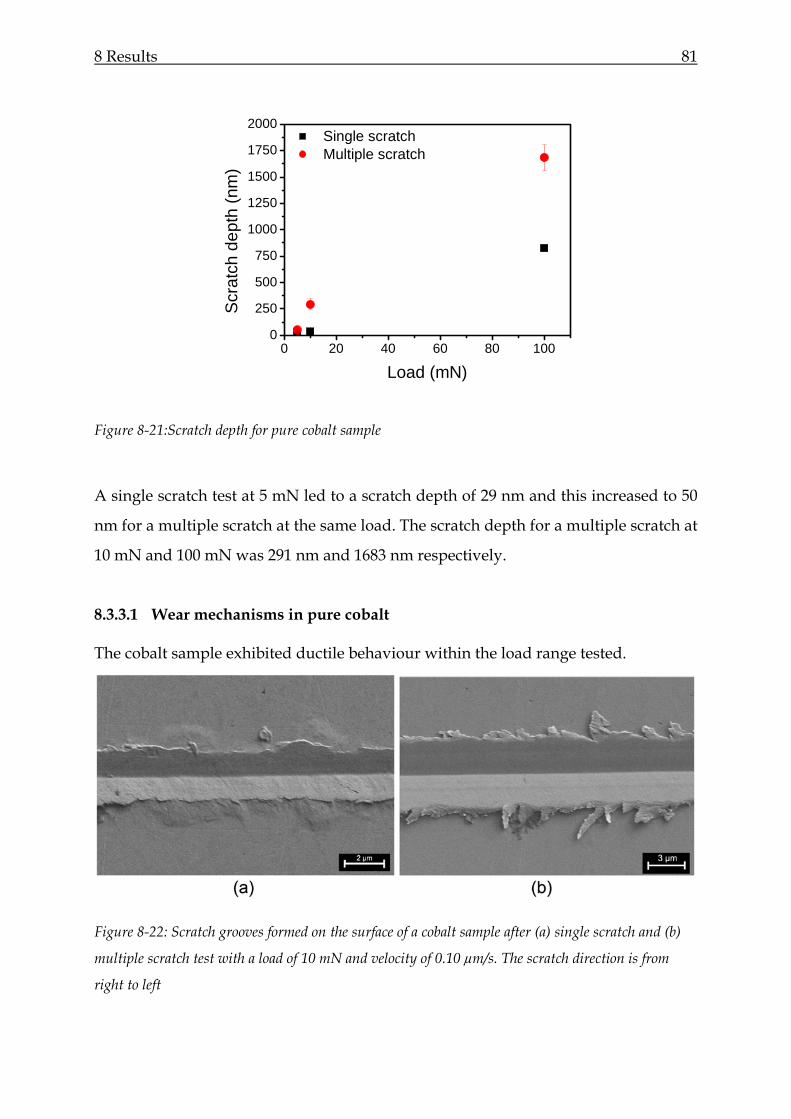
8 Results 81
0 20 40 60 80 1000
250
500
750
1000
1250
1500
1750
2000 Single scratch Multiple scratch
Scr
atch
dep
th (n
m)
Load (mN)
Figure 8-21:Scratch depth for pure cobalt sample
A single scratch test at 5 mN led to a scratch depth of 29 nm and this increased to 50
nm for a multiple scratch at the same load. The scratch depth for a multiple scratch at
10 mN and 100 mN was 291 nm and 1683 nm respectively.
8.3.3.1 Wear mechanisms in pure cobalt
The cobalt sample exhibited ductile behaviour within the load range tested.
Figure 8-22: Scratch grooves formed on the surface of a cobalt sample after (a) single scratch and (b)
multiple scratch test with a load of 10 mN and velocity of 0.10 µm/s. The scratch direction is from
right to left
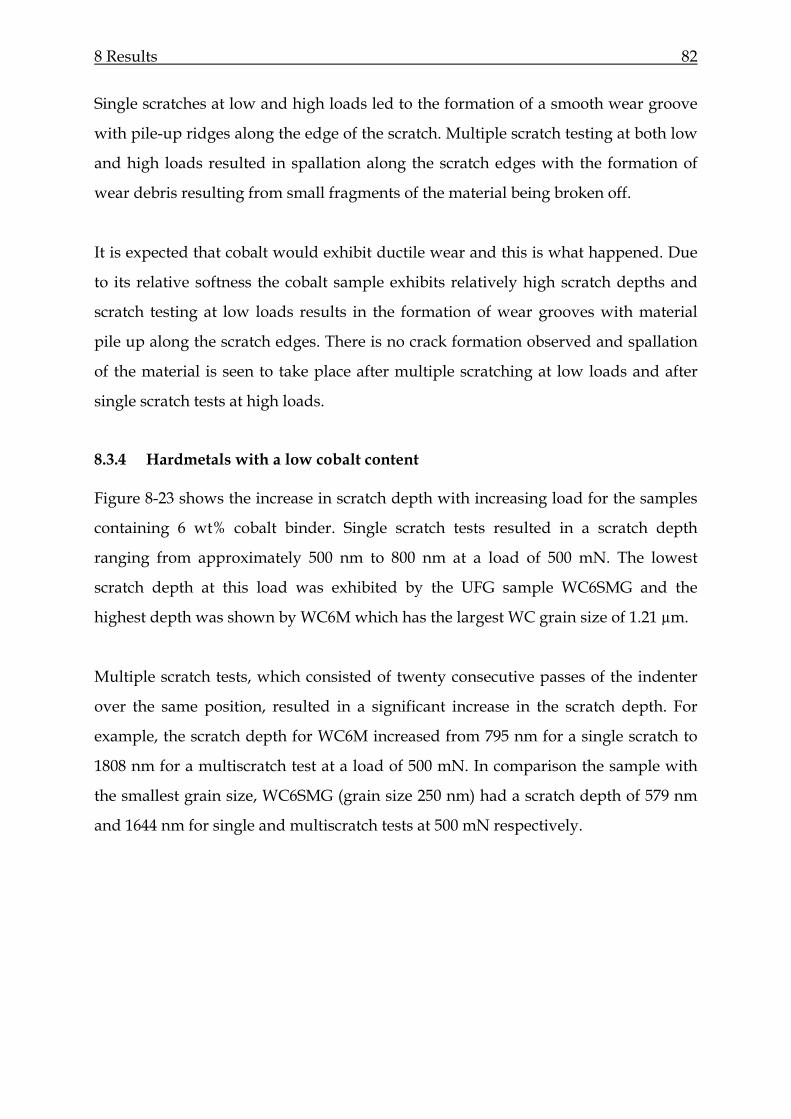
8 Results 82
Single scratches at low and high loads led to the formation of a smooth wear groove
with pile-up ridges along the edge of the scratch. Multiple scratch testing at both low
and high loads resulted in spallation along the scratch edges with the formation of
wear debris resulting from small fragments of the material being broken off.
It is expected that cobalt would exhibit ductile wear and this is what happened. Due
to its relative softness the cobalt sample exhibits relatively high scratch depths and
scratch testing at low loads results in the formation of wear grooves with material
pile up along the scratch edges. There is no crack formation observed and spallation
of the material is seen to take place after multiple scratching at low loads and after
single scratch tests at high loads.
8.3.4 Hardmetals with a low cobalt content
Figure 8-23 shows the increase in scratch depth with increasing load for the samples
containing 6 wt% cobalt binder. Single scratch tests resulted in a scratch depth
ranging from approximately 500 nm to 800 nm at a load of 500 mN. The lowest
scratch depth at this load was exhibited by the UFG sample WC6SMG and the
highest depth was shown by WC6M which has the largest WC grain size of 1.21 µm.
Multiple scratch tests, which consisted of twenty consecutive passes of the indenter
over the same position, resulted in a significant increase in the scratch depth. For
example, the scratch depth for WC6M increased from 795 nm for a single scratch to
1808 nm for a multiscratch test at a load of 500 mN. In comparison the sample with
the smallest grain size, WC6SMG (grain size 250 nm) had a scratch depth of 579 nm
and 1644 nm for single and multiscratch tests at 500 mN respectively.
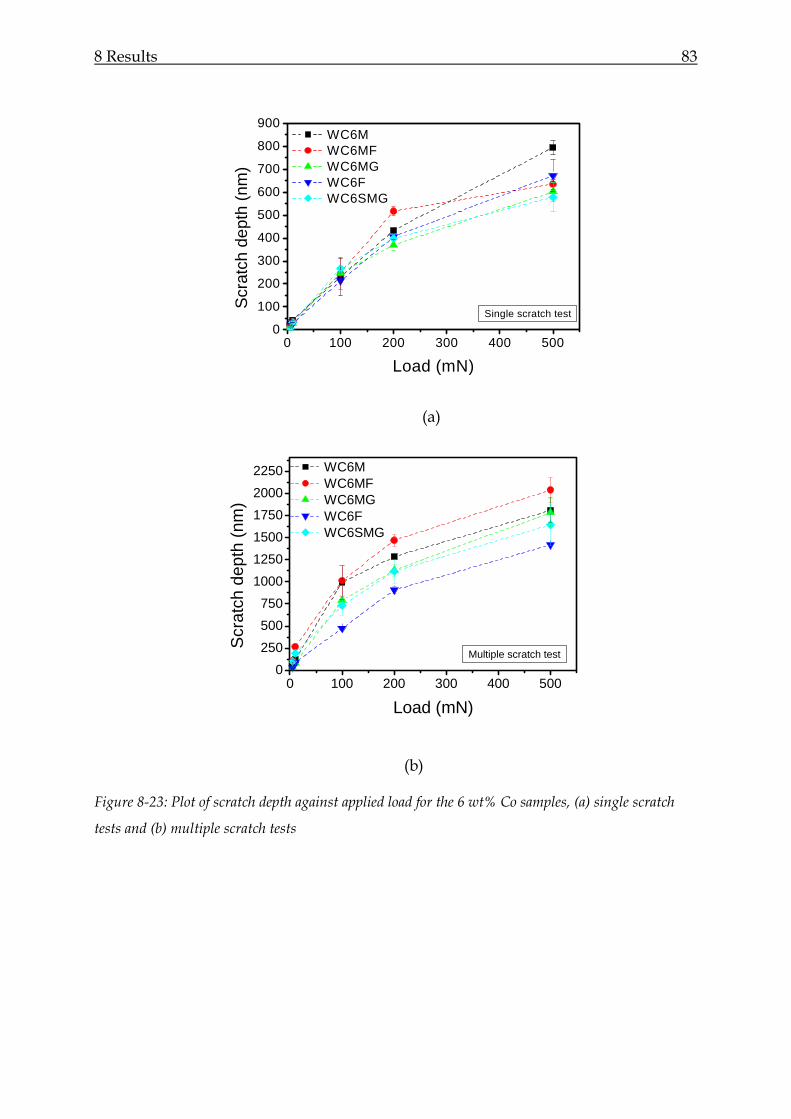
8 Results 83
0 100 200 300 400 5000
100
200
300
400
500
600
700
800
900
Scr
atch
dep
th (n
m)
Load (mN)
WC6M WC6MF WC6MG WC6F WC6SMG
Single scratch test
(a)
0 100 200 300 400 5000
250500750
100012501500175020002250
Scr
atch
dep
th (n
m)
Load (mN)
WC6M WC6MF WC6MG WC6F WC6SMG
Multiple scratch test
(b)
Figure 8-23: Plot of scratch depth against applied load for the 6 wt% Co samples, (a) single scratch
tests and (b) multiple scratch tests
8 Results 84
The percentage increase in scratch depth from single to multiple scratch tests was
determined from the following equation.
% increase = 100×−
Single
Singlefinal
ddd
E 8-1
Where dfinal was the scratch depth after twenty passes and dSingle the scratch depth
after a single scratch test.
The percentage increase in scratch depth from single to multiple scratch test was
found to be different for each of the materials, for example an increase of 243% was
found for WC6M, with an increase in scratch depth from 298 nm to 1022 nm for
scratch testing at 100 mN. Compared to an increase of 178% for WC6SMG, with a
change in scratch depth from 227 nm to 632 nm at the same load.
In figure 8-24 the WC grain size is plotted against the scratch depth for both single
and multiple scratch tests at a load of 100 mN. For single scratch tests no clear
correlation between the WC grain size and scratch depth could be observed, however
a trend was observed in the multiple scratch tests. An increase in the WC grain size
leads to an increase in the scratch depth i.e. a decrease in scratch resistance.
However, WC6F did not follow this trend and showed a much lower scratch depth
than would be expected from the trend. This sample contains additions of VC and
Cr3C2 in the binder phase. These modifications to the binder are known to increase
the corrosion resistance of WC-Co hardmetals and could possibly also lead to an
improvement in the wear resistance [95].
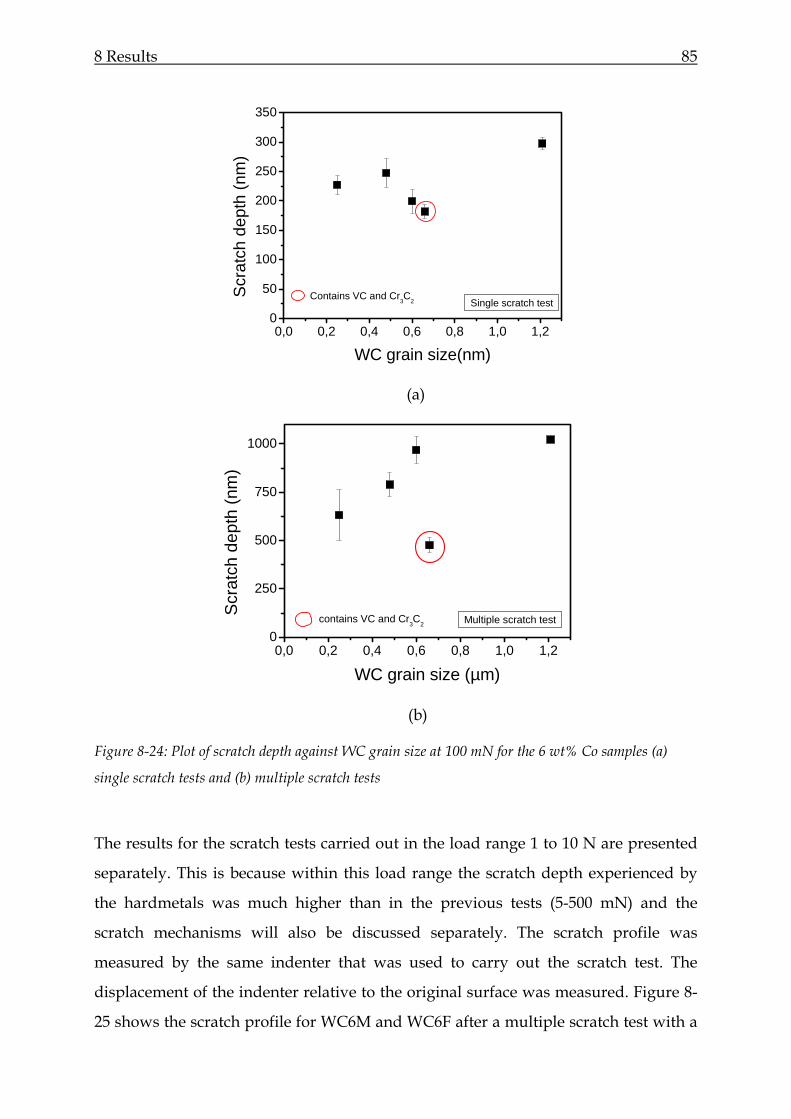
8 Results 85
0,0 0,2 0,4 0,6 0,8 1,0 1,20
50
100
150
200
250
300
350
Scr
atch
dep
th (n
m)
WC grain size(nm)
Contains VC and Cr3C2 Single scratch test
(a)
0,0 0,2 0,4 0,6 0,8 1,0 1,20
250
500
750
1000
Scr
atch
dep
th (n
m)
WC grain size (µm)
Multiple scratch testcontains VC and Cr3C2
(b)
Figure 8-24: Plot of scratch depth against WC grain size at 100 mN for the 6 wt% Co samples (a)
single scratch tests and (b) multiple scratch tests
The results for the scratch tests carried out in the load range 1 to 10 N are presented
separately. This is because within this load range the scratch depth experienced by
the hardmetals was much higher than in the previous tests (5-500 mN) and the
scratch mechanisms will also be discussed separately. The scratch profile was
measured by the same indenter that was used to carry out the scratch test. The
displacement of the indenter relative to the original surface was measured. Figure 8-
25 shows the scratch profile for WC6M and WC6F after a multiple scratch test with a
8 Results 86
load of 5 N. This is a typical scratch profile that was produced during this high load
scratch testing. Due to the hard nature of the WC grains and the damage mechanisms
that took place the scratch depth varied extensively along the entire length of the
scratch resulting in a very jagged profile.
0 50 100 150 200 2500
5000
10000
15000
20000
Scra
tch
dept
h (n
m)
Scratch distance (µm)
Pass 1 Pass 20
0 50 100 150 200 2500
4000
8000
12000
16000
Scra
tch
dept
h (n
m)
Scratch distance (µm)
Pass 1Pass 20
(a) (b)
Figure 8-25: Scratch profile of (a) WC6M and (b) WC6F after scratch testing with 5 N load
WC6M WC6MF WC6F WC6MG WC6SMG0
4
8
12
16
20
Scr
atch
dep
th (µ
m)
1 N 5 N 10 N
Figure 8-26: Average scratch depth for single scratch tests between 1 and 10 N load
The average scratch depth for single scratch tests at 1, 5 and 10 N was plotted for the
WC-6Co samples in figure 8-26. The highest average scratch depth for a single
scratch test at 10 N was shown by WC6MG which had a scratch depth of
approximately 17.7 µm compared to 9.27 µm for WC6MF. No clear correlation
between the scratch depth and WC grain size could be determined as shown in

8 Results 87
figure 8-27 which plots the WC grain size against the scratch depth for single scratch
tests performed with a load of 5 N.
0,0 0,2 0,4 0,6 0,8 1,0 1,20
2
4
6
8
10
12S
crat
ch d
epth
(µm
)
WC grain size (µm)
Figure 8-27:Graph showing the variation in scratch with the WC grain size for single scratch tests
performed on the WC-6Co samples with a 5 N load
8.3.4.1 Wear mechanisms in WC-6Co hardmetals
The wear behaviour of the hardmetals in the low load regime (5-50 mN) is discussed
in this section. Single scratch tests between 5 and 10 mN led to scratch grooves being
formed across the sample as shown in the SEM images in figure 8-28. Small cracks
were also formed across the groove. The crack length was relatively small and did
not span the entire width of the groove. The cracks formed perpendicularly to the
scratch direction and were concentrated in the centre of the groove. Glide lines were
observed in WC6M (figure 8-28a). The grains showing slip were mainly within the
wear groove however some of the grains along the boundary of the scratch also
showed glide bands, indicating that the WC grains outside the scratch were also
plastically deformed during scratching.

8 Results 88
Figure 8-28: Micrographs showing the wear mechanisms on the WC-Co hardmetals after (a,c,d) single
and (b,d,f) multiple scratch test at a load of 10 mN. The images of WC6M show slip line and crack
formation. Grain fall-out can be seen in WC6MF and a tribofilm is on the surface of WC6SMG after
multiple scratch testing. The scratch direction is from right to left
Multiple scratch tests led to the deepening and widening of the scratch groove. In
single scratch tests there was only one groove channel visible however with multiple
scratch tests the wear scar consisted of several channels formed by the repeated
movement of the diamond indenter across the surface. The cracks were still relatively

8 Results 89
small in length, however debris formation indicated that crack growth and
intersection does took place. Furthermore, cracks were also visible not only towards
the centre of the wear groove but along the edges of the groove. Glide activity was
now visible in all the samples. In addition to grain fracture grain removal was also
observed in some of the samples. Two large holes can be seen in WC6MF, these holes
show the positions where WC grains were pulled out of the hardmetal surface. In
this sample the wear debris, consisting of small WC grain fragments, was also
observed to sit between the WC grains, occupying the spaces previously occupied by
WC grains. In the case of WC6SMG a tribolfim was observed on the surface after
multiple scratching. This consisted of cobalt binder that was squeezed out by the
indenter during scratching. The WC grain fall out in this sample was much less
pronounced in comparison to the other samples and furthermore there was less
obvious crack formation.
Single scratches at medium loads (100-500 mN) resulted in extensive WC grain
cracking. Crack formation was concentrated along the edges of the scratch groove
and resulted in grain removal on the edges of the scratch. Some of the cracks also
extended across the entire width of the scratch. Pile-up formation on the edges of the
scratch took place (figure 8-29). In addition, glide band formation in the grains within
and adjacent to the worn areas could be seen, both in the large and in the smaller WC
grains.
Figure 8-29: Pile up in WC6M during single scratch at 100 mN
8 Results 90
Prismatic slip was observed in some of the larger grains and was identified by the
slips lines formed in three directions forming a triangular pattern (figure 8-30). Crack
formation in the WC grains occurred both in the slip direction as well as normal to
the slip direction.
Figure 8-30: Prismatic slip in WC6M after a single scratch test with a 200 mN load
Examination at high magnification allowed the deformation of the cobalt binder to be
carefully examined. The cobalt binder was found to have undergone plastic
deformation via void formation resulting in thin ligaments of cobalt loosely attatched
to the WC grains (figure 8-31). Ultimately the binder attains a porous-like structure
during scratching which makes it easier for WC grains to fall out. In figures 8-31a
and 8-31b WC grains can bee seen which are attached to thin cobalt ligaments. In
figure 8-31b the cleavage of the WC grain along the slip plane can also be observed.
The fracture surface of the WC grain in this micrograph indicates both ductile and
brittle wear mechanisms. The round particles present on the fracture surface are
thought to be unmelted WC particles from the sintering process.

8 Results 91
Figure 8-31: micrographs showing the worn surface after single scratch tests performed with 500 mN
load on various WC-6Co hardmetal samples.
Multiple scratches at high load resulted in crack growth and intersection leading to
the formation of a mechanically mixed layer on the wear surface. This is often
referred to by some researchers as a tribofilm [67]. This consisted of WC fragments
and cobalt binder mixed together (figure 8-32). This layer was strongly adhered to
the hardmetal surface and was not removed when the specimen was cleaned in the
ultrasonic bath after testing. This mechanically mixed layer covered the entire length
of the wear groove so that it was not possible to examine the underlying
microstructure without carrying out cross-section analysis. Because the scratches
formed were very fine (µm range) cross section analysis could only be carried out
using a FIB. Therefore the cross section examination of the hardmetals was done on a
limited number of samples. Figure 8-33 shows a cross-section of a scratch on WC6MF
after a multiple scratch test with a load of 500 mN. Cracks from the surface extend
into the bulk material as indicated in the marked region on the micrograph. The
mechanically mixed layer on the surface of the scratch is also visible and furthermore
8 Results 92
pores in the material can also be observed. These could accelerate crack growth into
the bulk microstructure.
Figure 8-32: Mechanically mixed layer or tribofilm on WC6MG after a multiple scratch test with a
load of 100 mN
Figure 8-33: A FIB cross-section of a scratch on WC6MF formed after a multiple scratch test with a
load of 500 mN.
Single scratch tests in the 1-10 N load regime resulted in widespread WC grain fall
out along the edges of the scratch as seen in figure 8-34a which shows the lower edge
of scratch on WC6M after a single scratch with a 1 N load. There was also extensive
8 Results 93
grain fracture throughout the worn region indicating predominantly brittle wear.
However glide lines were also observed on the grains adjacent to the scratch
showing the ductile deformation of the area not immediately in the contact zone of
the indenter. There was a build up of material at the bottom of the scratch, forming a
ridge, as a result of material being pushed by the indenter during scratching (figure
8-34b). There was also pile-up of the cobalt binder along the edge of the scratch, this
was further aided by the removal of the WC grains which made it easier for the
binder to be extruded. Multiple scratches led to further grain removal and fracture,
with the formation of wear debris which became embedded into the hardmetal
surface (figure 8-34c). The debris formed during multiple scratch testing was much
finer than that formed by single scratches (see figure 8-34d).
Figure 8-34: (a) Grain fall-out on the edge of a scratch performed with a load of 1 N and (b) material
pile-up in the scratch direction after a multiple scratch test with a load of 5 N. The scratch direction is
from right to left.
8.3.4.2 Summary of scratch testing on WC-6Co hardmetals
During a scratch test the load is first applied and the indenter penetrates the sample.
Once the testing load is reached the indenter moves across the sample at the selected
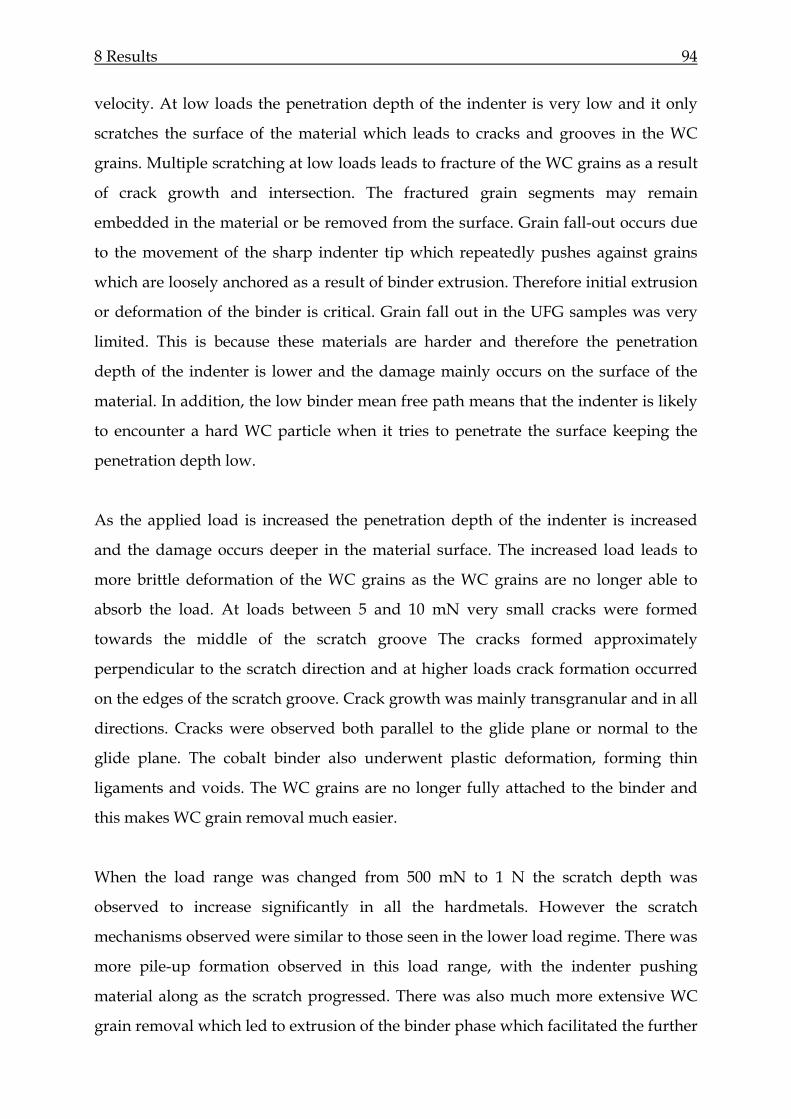
8 Results 94
velocity. At low loads the penetration depth of the indenter is very low and it only
scratches the surface of the material which leads to cracks and grooves in the WC
grains. Multiple scratching at low loads leads to fracture of the WC grains as a result
of crack growth and intersection. The fractured grain segments may remain
embedded in the material or be removed from the surface. Grain fall-out occurs due
to the movement of the sharp indenter tip which repeatedly pushes against grains
which are loosely anchored as a result of binder extrusion. Therefore initial extrusion
or deformation of the binder is critical. Grain fall out in the UFG samples was very
limited. This is because these materials are harder and therefore the penetration
depth of the indenter is lower and the damage mainly occurs on the surface of the
material. In addition, the low binder mean free path means that the indenter is likely
to encounter a hard WC particle when it tries to penetrate the surface keeping the
penetration depth low.
As the applied load is increased the penetration depth of the indenter is increased
and the damage occurs deeper in the material surface. The increased load leads to
more brittle deformation of the WC grains as the WC grains are no longer able to
absorb the load. At loads between 5 and 10 mN very small cracks were formed
towards the middle of the scratch groove The cracks formed approximately
perpendicular to the scratch direction and at higher loads crack formation occurred
on the edges of the scratch groove. Crack growth was mainly transgranular and in all
directions. Cracks were observed both parallel to the glide plane or normal to the
glide plane. The cobalt binder also underwent plastic deformation, forming thin
ligaments and voids. The WC grains are no longer fully attached to the binder and
this makes WC grain removal much easier.
When the load range was changed from 500 mN to 1 N the scratch depth was
observed to increase significantly in all the hardmetals. However the scratch
mechanisms observed were similar to those seen in the lower load regime. There was
more pile-up formation observed in this load range, with the indenter pushing
material along as the scratch progressed. There was also much more extensive WC
grain removal which led to extrusion of the binder phase which facilitated the further
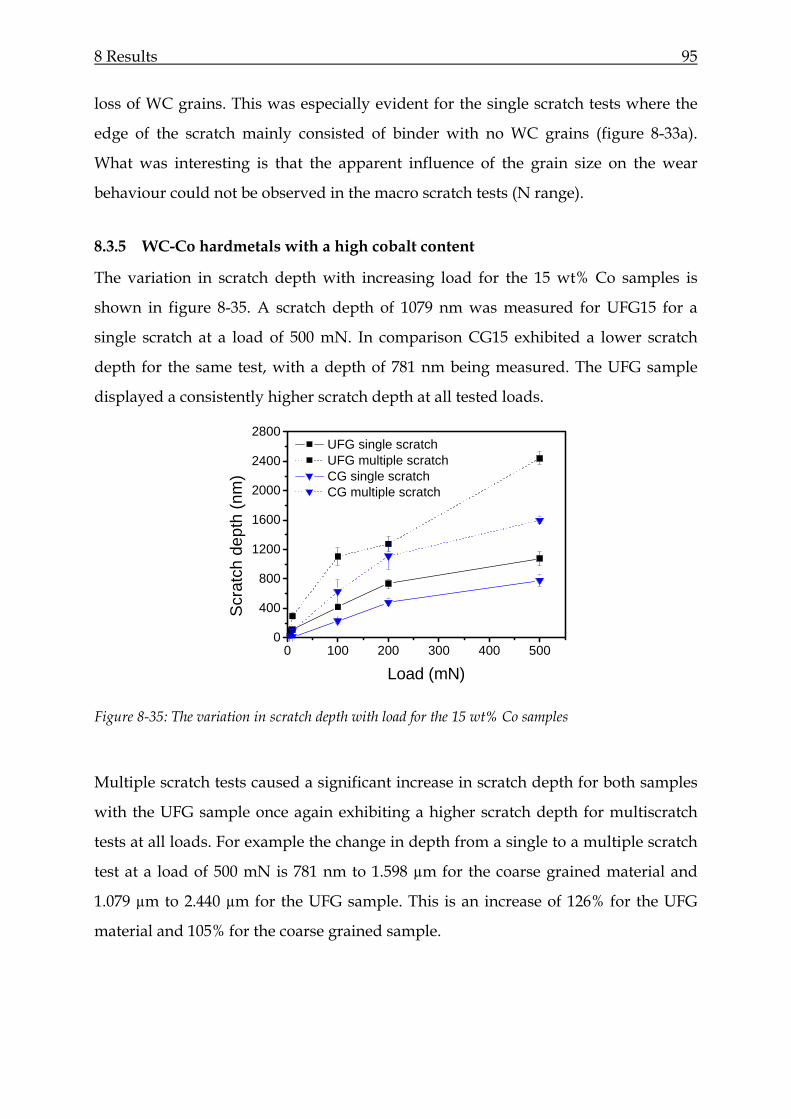
8 Results 95
loss of WC grains. This was especially evident for the single scratch tests where the
edge of the scratch mainly consisted of binder with no WC grains (figure 8-33a).
What was interesting is that the apparent influence of the grain size on the wear
behaviour could not be observed in the macro scratch tests (N range).
8.3.5 WC-Co hardmetals with a high cobalt content
The variation in scratch depth with increasing load for the 15 wt% Co samples is
shown in figure 8-35. A scratch depth of 1079 nm was measured for UFG15 for a
single scratch at a load of 500 mN. In comparison CG15 exhibited a lower scratch
depth for the same test, with a depth of 781 nm being measured. The UFG sample
displayed a consistently higher scratch depth at all tested loads.
0 100 200 300 400 5000
400
800
1200
1600
2000
2400
2800
Scr
atch
dep
th (n
m)
Load (mN)
UFG single scratch UFG multiple scratch CG single scratch CG multiple scratch
Figure 8-35: The variation in scratch depth with load for the 15 wt% Co samples
Multiple scratch tests caused a significant increase in scratch depth for both samples
with the UFG sample once again exhibiting a higher scratch depth for multiscratch
tests at all loads. For example the change in depth from a single to a multiple scratch
test at a load of 500 mN is 781 nm to 1.598 µm for the coarse grained material and
1.079 µm to 2.440 µm for the UFG sample. This is an increase of 126% for the UFG
material and 105% for the coarse grained sample.

8 Results 96
0,0 0,5 1,0 1,5 2,0 2,5 3,00
200
400
600
800
1000
1200
Scr
atch
dep
th (n
m)
WC grain size (µm)
Single scratch Multiple scratch
Figure 8-36: Variation in scratch depth with WC grain size for the WC-15Co samples
In this load range (5-500 mN) the scratch depth was found to decrease with
increasing WC grain size i.e. the scratch resistance was determined to be inversely
proportional to the WC grain size (figure 8-36). A finer grain size led to a higher
scratch depth.
In the 1-10 N load range the scratch depth increased drastically for both samples. The
scratch profile for single and multiple scratches on CG15 and UFG15 after scratch
testing with a 1 N load are shown in figure 8-37. The scratch depth in CG15 was
found to be relatively even however in UFG15 it varied along the length of the
scratch. The average scratch depth for single scratch tests is shown in figure 8-38.
UFG15 exhibited a lower scratch depth than CG15 in this load range. This is the
opposite of what was determined in the 5-500 mN load range where CG15 exhibited
better wear resistance and had consistently lower scratch depths than UFG15.
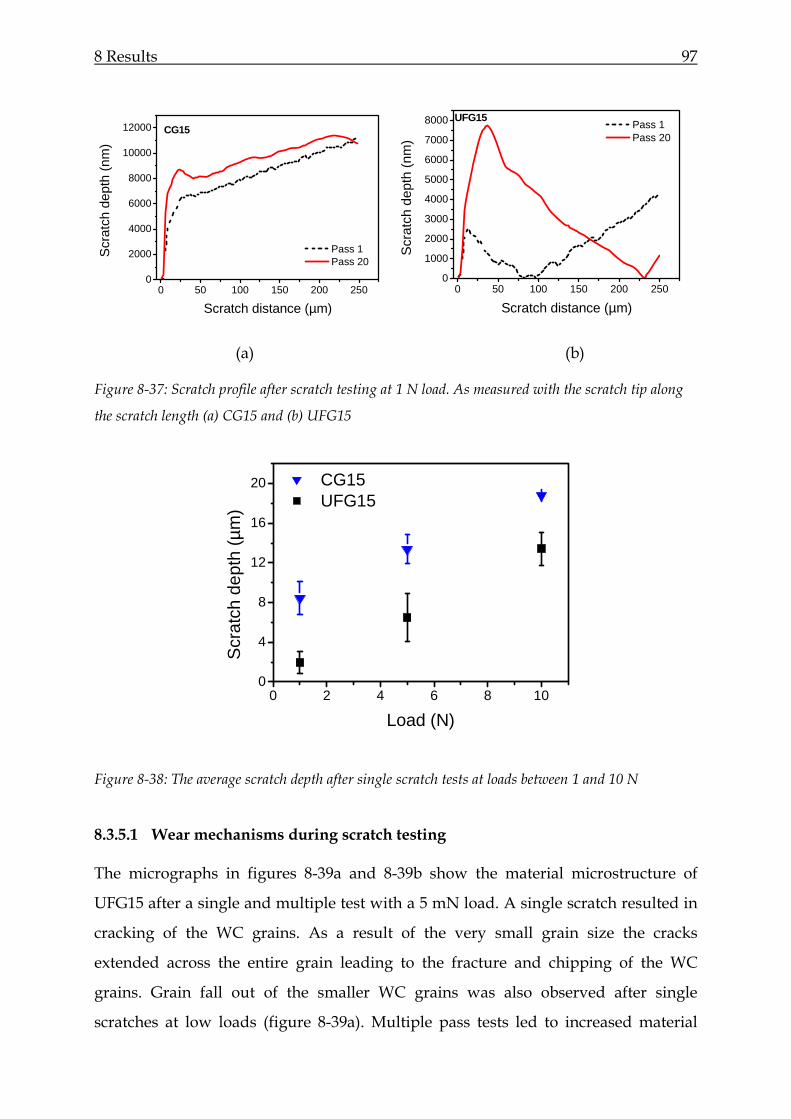
8 Results 97
0 50 100 150 200 2500
2000
4000
6000
8000
10000
12000
Scr
atch
dep
th (n
m)
Scratch distance (µm)
Pass 1 Pass 20
CG15
0 50 100 150 200 2500
1000
2000
3000
4000
5000
6000
7000
8000
Scr
atch
dep
th (n
m)
Scratch distance (µm)
Pass 1 Pass 20
UFG15
(a) (b)
Figure 8-37: Scratch profile after scratch testing at 1 N load. As measured with the scratch tip along
the scratch length (a) CG15 and (b) UFG15
0 2 4 6 8 100
4
8
12
16
20
Scr
atch
dep
th (µ
m)
Load (N)
CG15 UFG15
Figure 8-38: The average scratch depth after single scratch tests at loads between 1 and 10 N
8.3.5.1 Wear mechanisms during scratch testing
The micrographs in figures 8-39a and 8-39b show the material microstructure of
UFG15 after a single and multiple test with a 5 mN load. A single scratch resulted in
cracking of the WC grains. As a result of the very small grain size the cracks
extended across the entire grain leading to the fracture and chipping of the WC
grains. Grain fall out of the smaller WC grains was also observed after single
scratches at low loads (figure 8-39a). Multiple pass tests led to increased material
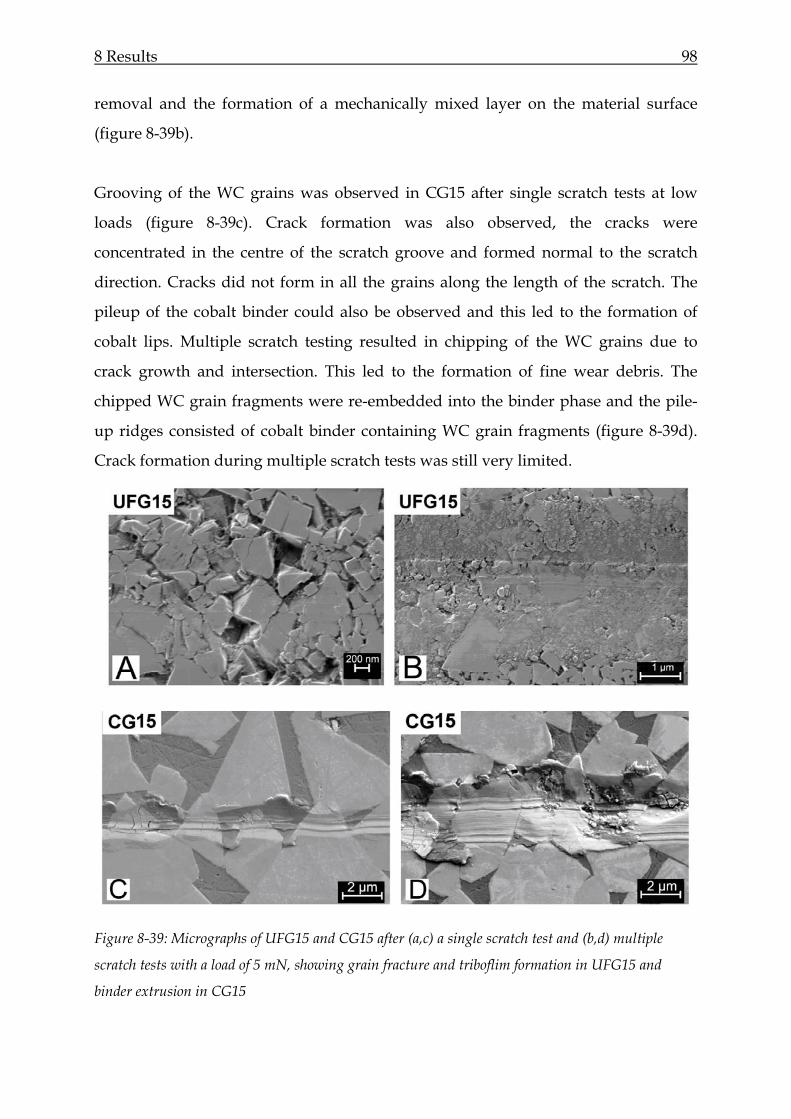
8 Results 98
removal and the formation of a mechanically mixed layer on the material surface
(figure 8-39b).
Grooving of the WC grains was observed in CG15 after single scratch tests at low
loads (figure 8-39c). Crack formation was also observed, the cracks were
concentrated in the centre of the scratch groove and formed normal to the scratch
direction. Cracks did not form in all the grains along the length of the scratch. The
pileup of the cobalt binder could also be observed and this led to the formation of
cobalt lips. Multiple scratch testing resulted in chipping of the WC grains due to
crack growth and intersection. This led to the formation of fine wear debris. The
chipped WC grain fragments were re-embedded into the binder phase and the pile-
up ridges consisted of cobalt binder containing WC grain fragments (figure 8-39d).
Crack formation during multiple scratch tests was still very limited.
Figure 8-39: Micrographs of UFG15 and CG15 after (a,c) a single scratch test and (b,d) multiple
scratch tests with a load of 5 mN, showing grain fracture and triboflim formation in UFG15 and
binder extrusion in CG15
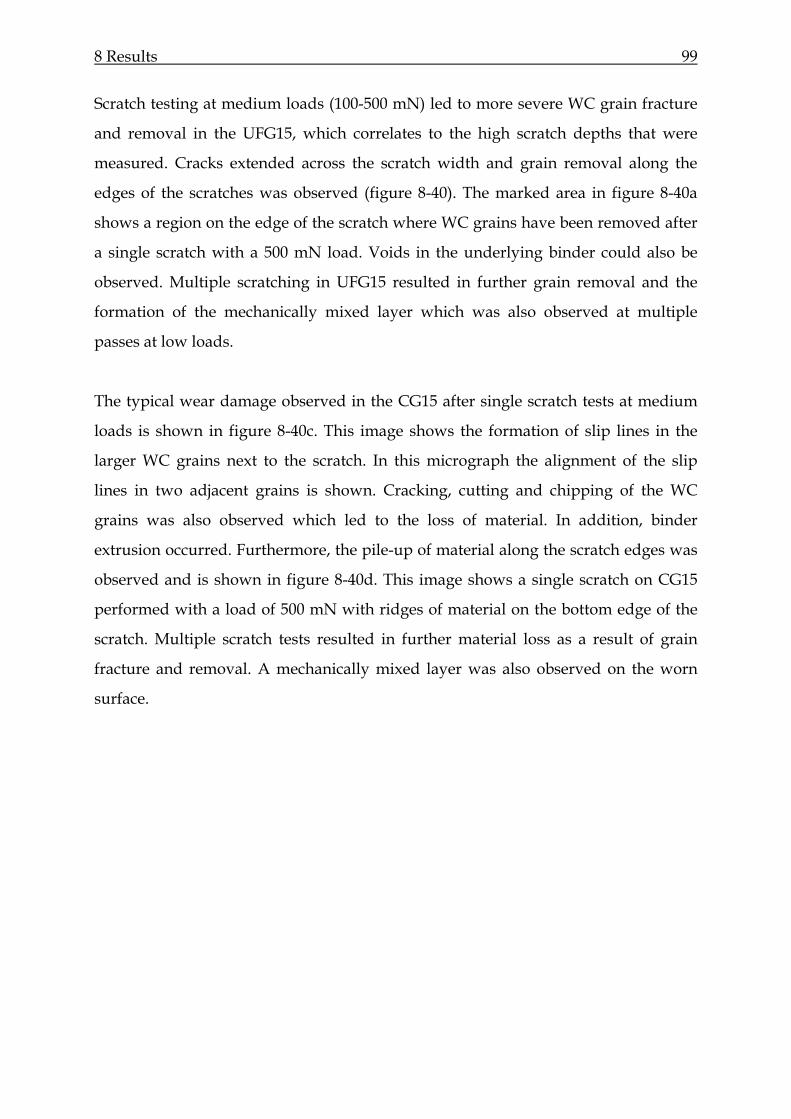
8 Results 99
Scratch testing at medium loads (100-500 mN) led to more severe WC grain fracture
and removal in the UFG15, which correlates to the high scratch depths that were
measured. Cracks extended across the scratch width and grain removal along the
edges of the scratches was observed (figure 8-40). The marked area in figure 8-40a
shows a region on the edge of the scratch where WC grains have been removed after
a single scratch with a 500 mN load. Voids in the underlying binder could also be
observed. Multiple scratching in UFG15 resulted in further grain removal and the
formation of the mechanically mixed layer which was also observed at multiple
passes at low loads.
The typical wear damage observed in the CG15 after single scratch tests at medium
loads is shown in figure 8-40c. This image shows the formation of slip lines in the
larger WC grains next to the scratch. In this micrograph the alignment of the slip
lines in two adjacent grains is shown. Cracking, cutting and chipping of the WC
grains was also observed which led to the loss of material. In addition, binder
extrusion occurred. Furthermore, the pile-up of material along the scratch edges was
observed and is shown in figure 8-40d. This image shows a single scratch on CG15
performed with a load of 500 mN with ridges of material on the bottom edge of the
scratch. Multiple scratch tests resulted in further material loss as a result of grain
fracture and removal. A mechanically mixed layer was also observed on the worn
surface.
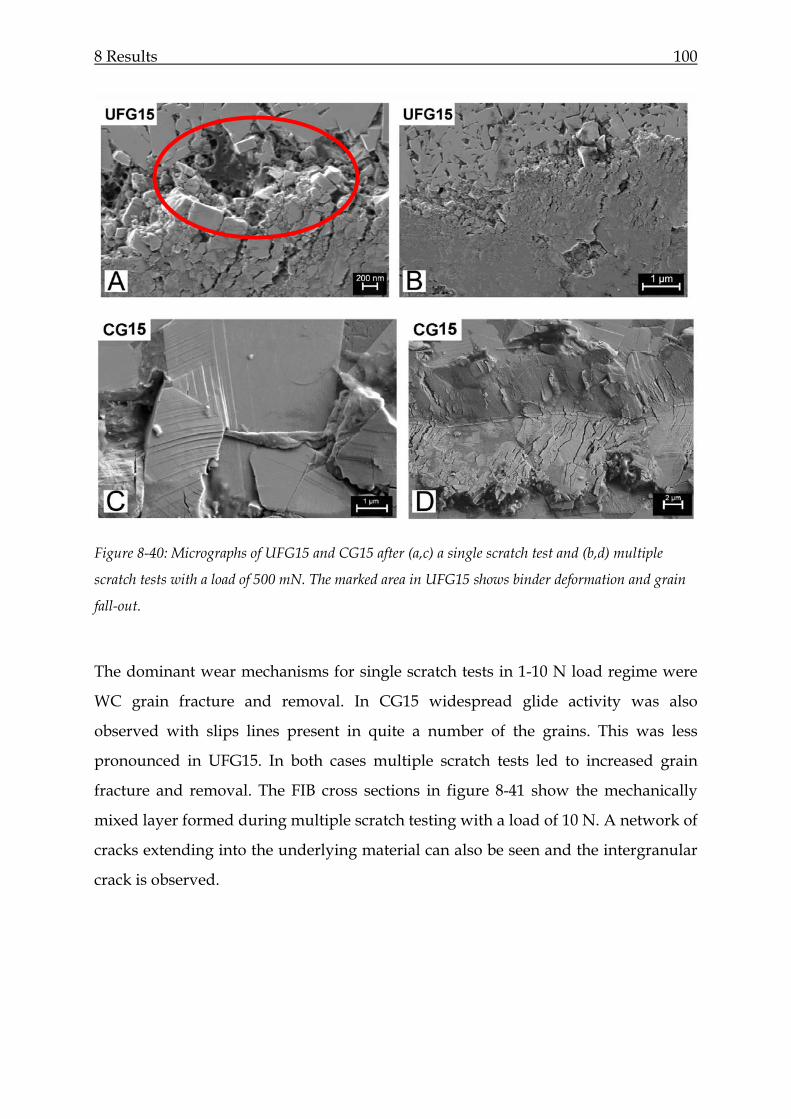
8 Results 100
Figure 8-40: Micrographs of UFG15 and CG15 after (a,c) a single scratch test and (b,d) multiple
scratch tests with a load of 500 mN. The marked area in UFG15 shows binder deformation and grain
fall-out.
The dominant wear mechanisms for single scratch tests in 1-10 N load regime were
WC grain fracture and removal. In CG15 widespread glide activity was also
observed with slips lines present in quite a number of the grains. This was less
pronounced in UFG15. In both cases multiple scratch tests led to increased grain
fracture and removal. The FIB cross sections in figure 8-41 show the mechanically
mixed layer formed during multiple scratch testing with a load of 10 N. A network of
cracks extending into the underlying material can also be seen and the intergranular
crack is observed.
8 Results 101
Figure 8-41: FIB cross section on a scratch formed after a multiple scratch test with a 10 N load. The
marked area is magnified in the right image, showing the extension of cracks into the subsurface of the
hardmetal (a) UFG15 and (b) CG15.
In CG15 the intergranular crack growth is more prominent and the mechanically
mixed layer is relatively thin in comparison to that formed on UFG15. In CG15 the
mechanically mixed layer is composed of grain fragments and in the UFG
counterpart whole grains are present in this layer.
8.3.5.2 Summary of scratch testing on WC-15Co hardmetals
At low scratch loads the coarse grained material exhibits very low scratch depths and
the damage is confined to grooving of the WC grains and extrusion of the cobalt
binder. The UFG material on the other hand shows much more severe damage
mechanisms. Single scratches resulted in grooving, cracking and chipping of the WC
grains and also the fall out of WC particles in the UFG sample. In CG15 the grains are
very large, increasing the probability that the indenter encounters a WC grain and
therefore only the surface of the WC grains is damaged. In comparison the WC grain
size in the UFG sample is comparable to the penetration depth at low loads and the
8 Results 102
movement of the indenter across the material can lead to the removal of the WC
grains. At a load of 500 mN a scratch depth of 781 nm was observed for the CG
material after a single scratch test which is very small in comparison to the average
grain size of 2.65 µm. On the other hand the scratch depth for the UFG sample at the
same load was 1.079 µm which is more than four times the average grain size of the
material.
At higher loads a similar mechanism would be expected i.e. a higher penetration
depth which allows the fine grains in the UFG material to be dug out by the indenter
and the larger CG grains are still much larger than the penetration depth and
therefore not easily removed. However at higher loads the force of the indenter
pushing against the WC grains also leads to the extrusion of the binder which
precedes the removal of WC grains from the surface. An increase in the load also
leads to crack formation in the grains which can no longer undergo plastic
deformation to absorb the load. The presence of slip lines and sharp fracture edges
was observed within single grains in CG15. Slip activity was not observed in UFG15,
though it is likely that it took place but due to the fine grain size was difficult to
observe.
8.4 Macroscopic wear testing
Sliding wear and three body abrasive tests were conducted on the WC-6Co
hardmetals to investigate the macroscopic wear behaviour of the materials. The
results of these tests will be discussed in the following section beginning with the
results of the three body abrasion testing.
8.4.1 Three body abrasive wear
Three body abrasive testing was carried out at 100 N load and with a rotation speed
of 100 rpm. The average size of the SiO2 particles was 200 µm. The results of the wear
loss for each sample is shown in figure 8-42.
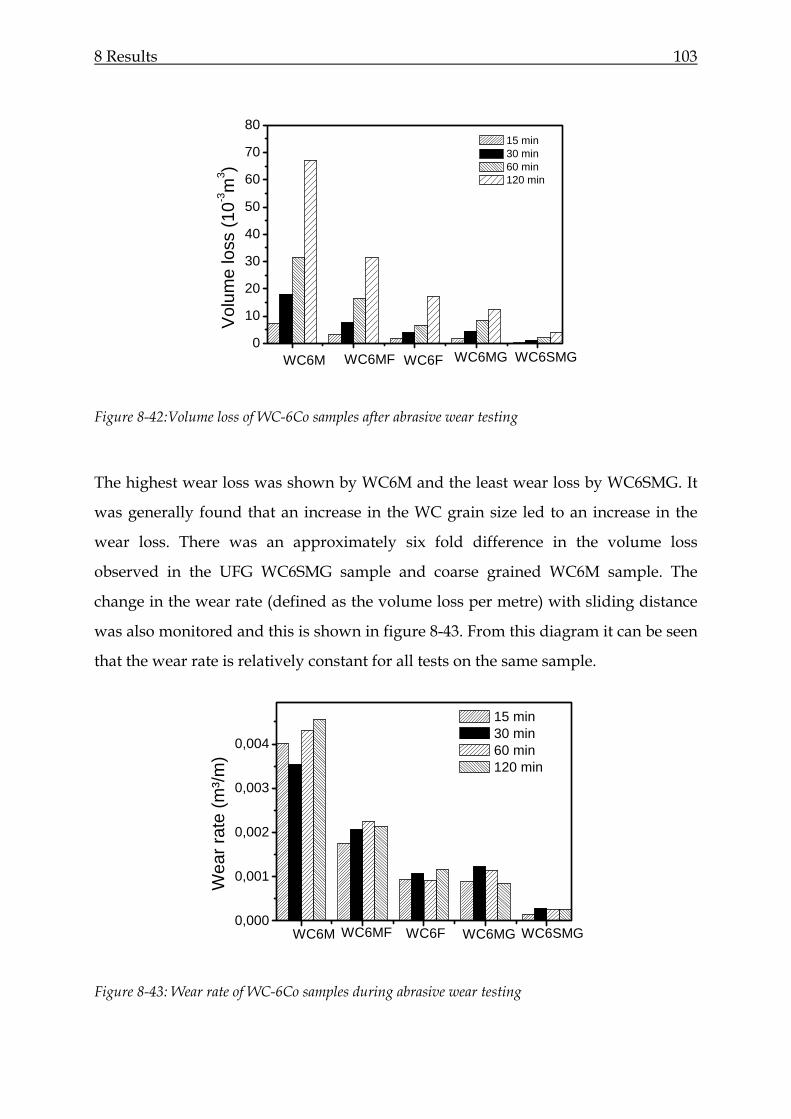
8 Results 103
0
10
20
30
40
50
60
70
80
Vol
ume
loss
(10-3
m3 )
15 min 30 min 60 min 120 min
WC6M WC6MF WC6F WC6MG WC6SMG
Figure 8-42:Volume loss of WC-6Co samples after abrasive wear testing
The highest wear loss was shown by WC6M and the least wear loss by WC6SMG. It
was generally found that an increase in the WC grain size led to an increase in the
wear loss. There was an approximately six fold difference in the volume loss
observed in the UFG WC6SMG sample and coarse grained WC6M sample. The
change in the wear rate (defined as the volume loss per metre) with sliding distance
was also monitored and this is shown in figure 8-43. From this diagram it can be seen
that the wear rate is relatively constant for all tests on the same sample.
0,000
0,001
0,002
0,003
0,004
Wea
r rat
e (m
³/m)
15 min 30 min 60 min 120 min
WC6M WC6MF WC6F WC6MG WC6SMG
Figure 8-43: Wear rate of WC-6Co samples during abrasive wear testing
8 Results 104
8.4.1.1 Wear mechanisms during three body abrasive wear
The worn surfaces of the WC-6Co hardmetals were observed from the top view and
in cross section to determine the wear mechanisms that took place. Figure 8-44a
shows grooves formed on the surface of WC6SMG after testing as a result of
entrapped sand particles. Cross-section examination indicated large sections on the
material surface where WC grains had been removed from the material (figure 8-
44b). The worn surface of the UFG sample, WC6SMG, appeared to be covered with a
thin layer of cobalt which was smeared across the worn region and possibly
protected the material from further damage (figure 8-44a). Holes and depressions
throughout the worn surface indicated regions where entire grains had been
removed during testing. Widespread grain cracking was observed in all the samples
and this led to the formation of wear debris consisting of small WC fragments which
varied in shape and size. Slip lines were observed in some of the larger grains in the
samples, with several slip directions being observed within single grains. Grain
fracture was predominantly intergranular and crack growth was found to occur in
several directions within individual grains. Figure 8-44d shows several cracks
formed within a single WC grain. The major crack is seen to extend in one of the slip
directions and smaller cracks can be observed in different directions. The
delamination or cleavage of WC grains was found to lead to the formation of platelet
like wear debris.
8 Results 105
Figure 8-44: Electron micrographs of WC-6wt% Co hardmetal surface after abrasive wear (a) Grooves
formed by entrapped sand particles on WC6SMG (b) Cross section showing grain fall-out on WC6MF
(c) Top view of worn region showing WC grain fracture and removal on WC6M (d) magnified view of
a WC grain showing crack growth along a glide plane in WC6M.
A tribofilm was observed on the surface of WC6F (see figure 8-45). The tribofilm did
not completely cover the worn surface but consisted of small patches randomly
distributed across the worn surface. The tribofilm formed relatively quickly and was
observed in a sample tested for 15 minutes, a wear distance of approximately 1800 m.
The tribofilm had a globular appearance and appeared like a fine network across
sections of the worn surface of WC6F. None of the other samples exhibited any
tribofilm formation during abrasion testing. WC6F contains additions of VC and
Cr3C2 and this could play a role in the formation of the tribofilm.
8 Results 106
Figure 8-45: SEM micrograph showing the tribofilm formation on WC6F after abrasive testing
against a steel wheel with a load of 100 N
8.4.1.2 Summary of abrasive wear mechanisms
Macroscopic wear testing resulted in several wear mechanisms, mainly;
• WC grain fracture
• WC grain removal
• Binder extrusion
• Slip line formation
• Tribofilm formation
Tribofilm formation was only observed in one of the samples, WC6F, the cobalt film
formed on the surface of WC6SMG could also be considered a tribofilm. WC6F
contained additions of VC and Cr2C3 and this could have influenced the formation of
the tribofilm. The wear rate in all materials was found to increase with increasing
WC grain size.
WC grain fracture was mainly transgranular and could be closely examined at high
magnifications in the SEM. Crack growth along the slip plane was observed, as
shown in figure 8-44d. Grain cleavage by delamination was observed in addition to
prismatic slip.
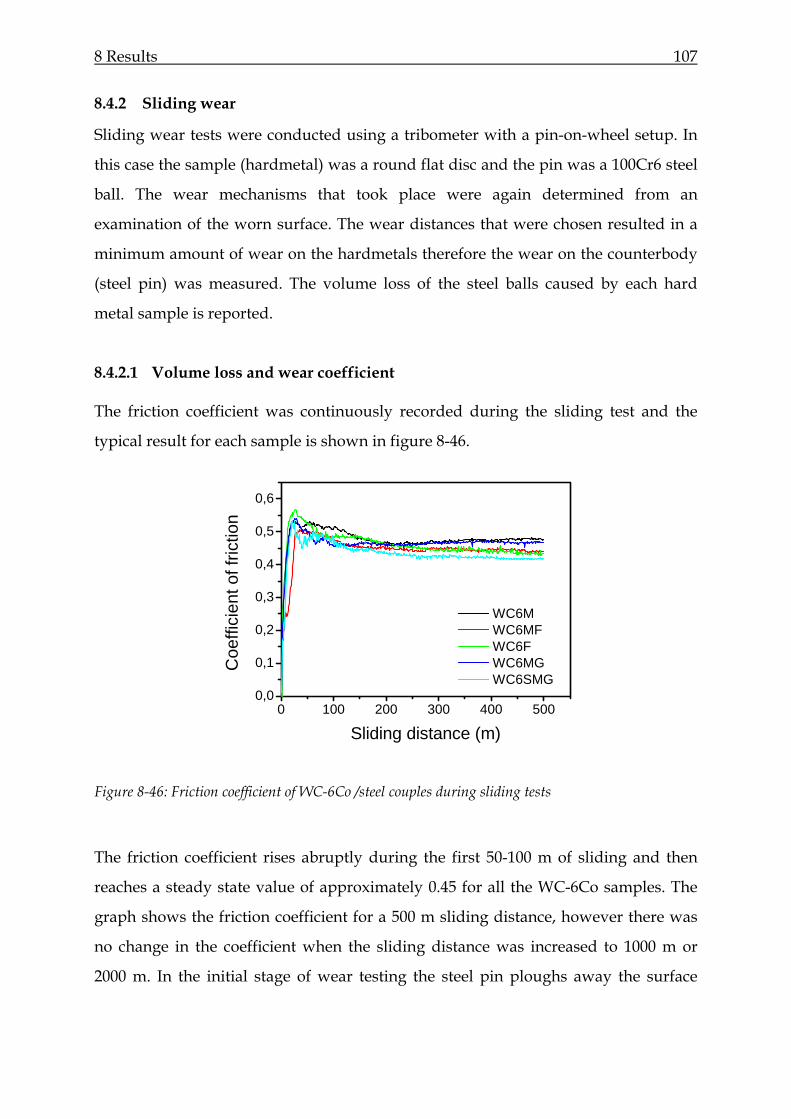
8 Results 107
8.4.2 Sliding wear
Sliding wear tests were conducted using a tribometer with a pin-on-wheel setup. In
this case the sample (hardmetal) was a round flat disc and the pin was a 100Cr6 steel
ball. The wear mechanisms that took place were again determined from an
examination of the worn surface. The wear distances that were chosen resulted in a
minimum amount of wear on the hardmetals therefore the wear on the counterbody
(steel pin) was measured. The volume loss of the steel balls caused by each hard
metal sample is reported.
8.4.2.1 Volume loss and wear coefficient
The friction coefficient was continuously recorded during the sliding test and the
typical result for each sample is shown in figure 8-46.
0 100 200 300 400 5000,0
0,1
0,2
0,3
0,4
0,5
0,6
Coe
ffici
ent o
f fric
tion
Sliding distance (m)
WC6M WC6MF WC6F WC6MG WC6SMG
Figure 8-46: Friction coefficient of WC-6Co /steel couples during sliding tests
The friction coefficient rises abruptly during the first 50-100 m of sliding and then
reaches a steady state value of approximately 0.45 for all the WC-6Co samples. The
graph shows the friction coefficient for a 500 m sliding distance, however there was
no change in the coefficient when the sliding distance was increased to 1000 m or
2000 m. In the initial stage of wear testing the steel pin ploughs away the surface
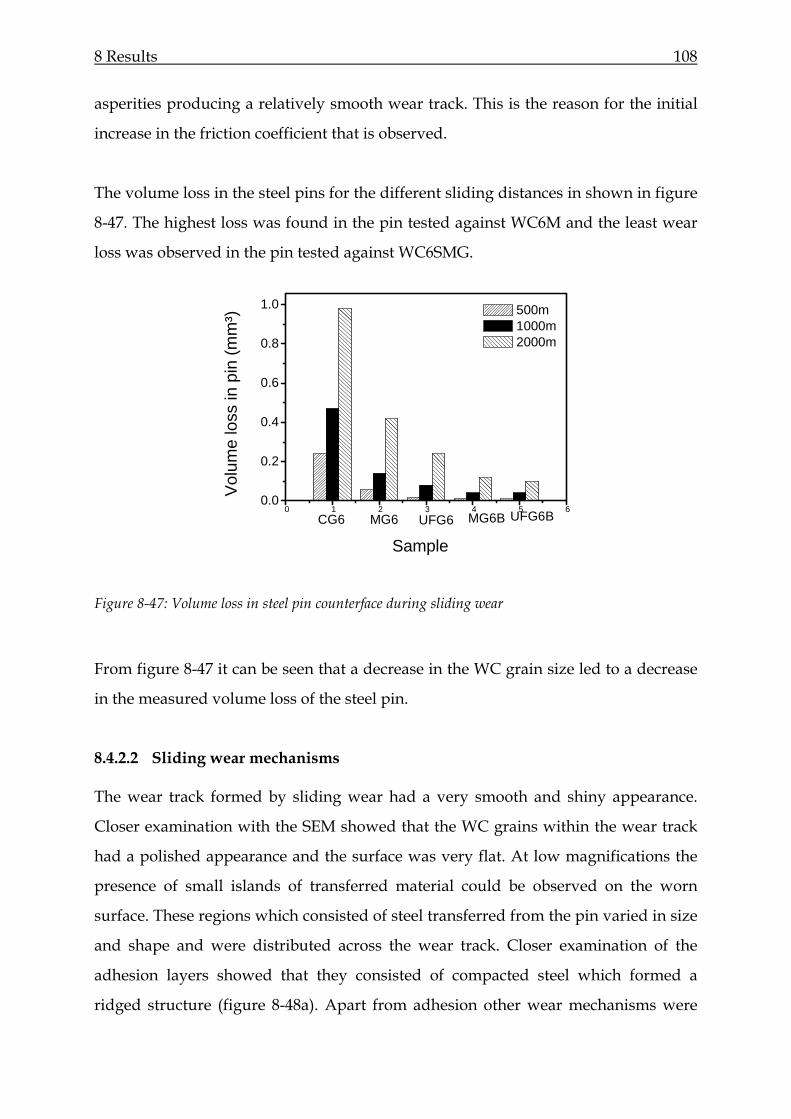
8 Results 108
asperities producing a relatively smooth wear track. This is the reason for the initial
increase in the friction coefficient that is observed.
The volume loss in the steel pins for the different sliding distances in shown in figure
8-47. The highest loss was found in the pin tested against WC6M and the least wear
loss was observed in the pin tested against WC6SMG.
0 1 2 3 4 5 60.0
0.2
0.4
0.6
0.8
1.0
Vol
ume
loss
in p
in (m
m³)
Sample
500m 1000m 2000m
CG6 MG6 UFG6 MG6B UFG6B
Figure 8-47: Volume loss in steel pin counterface during sliding wear
From figure 8-47 it can be seen that a decrease in the WC grain size led to a decrease
in the measured volume loss of the steel pin.
8.4.2.2 Sliding wear mechanisms
The wear track formed by sliding wear had a very smooth and shiny appearance.
Closer examination with the SEM showed that the WC grains within the wear track
had a polished appearance and the surface was very flat. At low magnifications the
presence of small islands of transferred material could be observed on the worn
surface. These regions which consisted of steel transferred from the pin varied in size
and shape and were distributed across the wear track. Closer examination of the
adhesion layers showed that they consisted of compacted steel which formed a
ridged structure (figure 8-48a). Apart from adhesion other wear mechanisms were
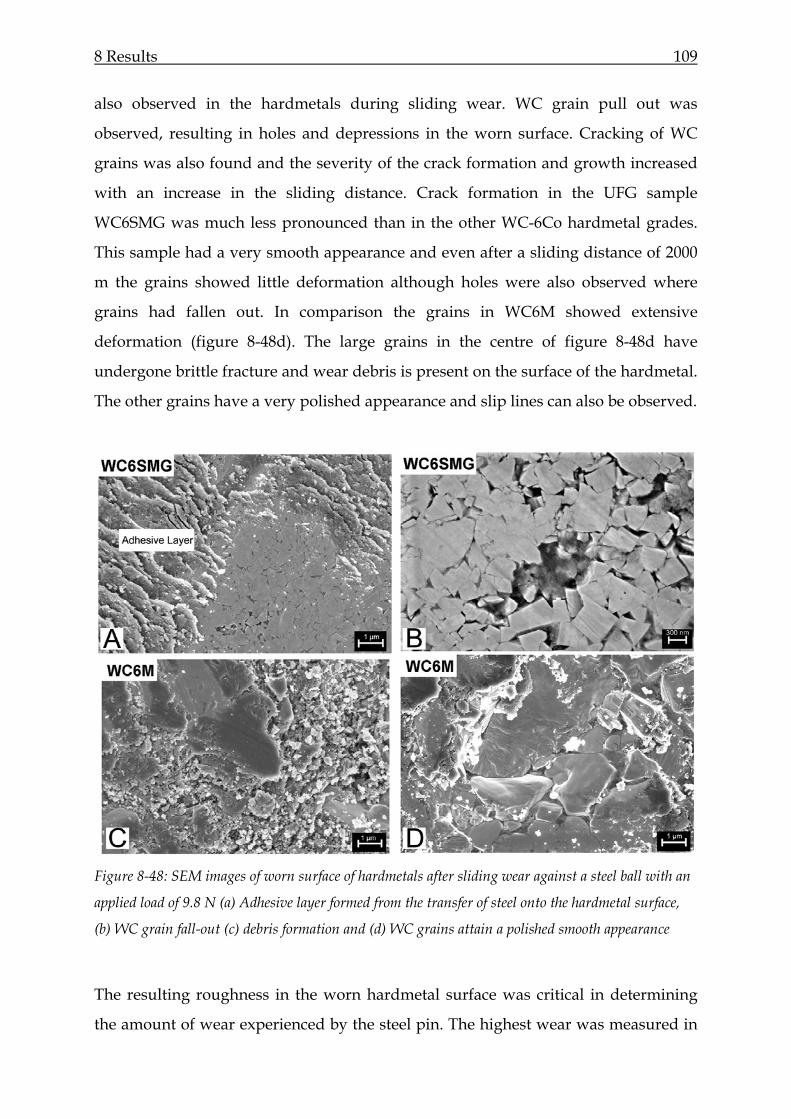
8 Results 109
also observed in the hardmetals during sliding wear. WC grain pull out was
observed, resulting in holes and depressions in the worn surface. Cracking of WC
grains was also found and the severity of the crack formation and growth increased
with an increase in the sliding distance. Crack formation in the UFG sample
WC6SMG was much less pronounced than in the other WC-6Co hardmetal grades.
This sample had a very smooth appearance and even after a sliding distance of 2000
m the grains showed little deformation although holes were also observed where
grains had fallen out. In comparison the grains in WC6M showed extensive
deformation (figure 8-48d). The large grains in the centre of figure 8-48d have
undergone brittle fracture and wear debris is present on the surface of the hardmetal.
The other grains have a very polished appearance and slip lines can also be observed.
Figure 8-48: SEM images of worn surface of hardmetals after sliding wear against a steel ball with an
applied load of 9.8 N (a) Adhesive layer formed from the transfer of steel onto the hardmetal surface,
(b) WC grain fall-out (c) debris formation and (d) WC grains attain a polished smooth appearance
The resulting roughness in the worn hardmetal surface was critical in determining
the amount of wear experienced by the steel pin. The highest wear was measured in
8 Results 110
the pin tested against WC6M which had a very rough worn surface, consisting of
fractured WC grains and wear debris. The wear debris on the surface cause abrasive
wear mechanisms which result in increased material removal from the steel
counterbody. On the other hand, the relatively smooth surface of the UFG sample
(WC6SMG) does not cause much damage to the counterbody and results in the low
volume losses that were recorded. Therefore a high volume loss in the steel pin
indicated a rough worn hardmetal surface. There was a high amount of material
transfer from the pin to the hardmetal surface.
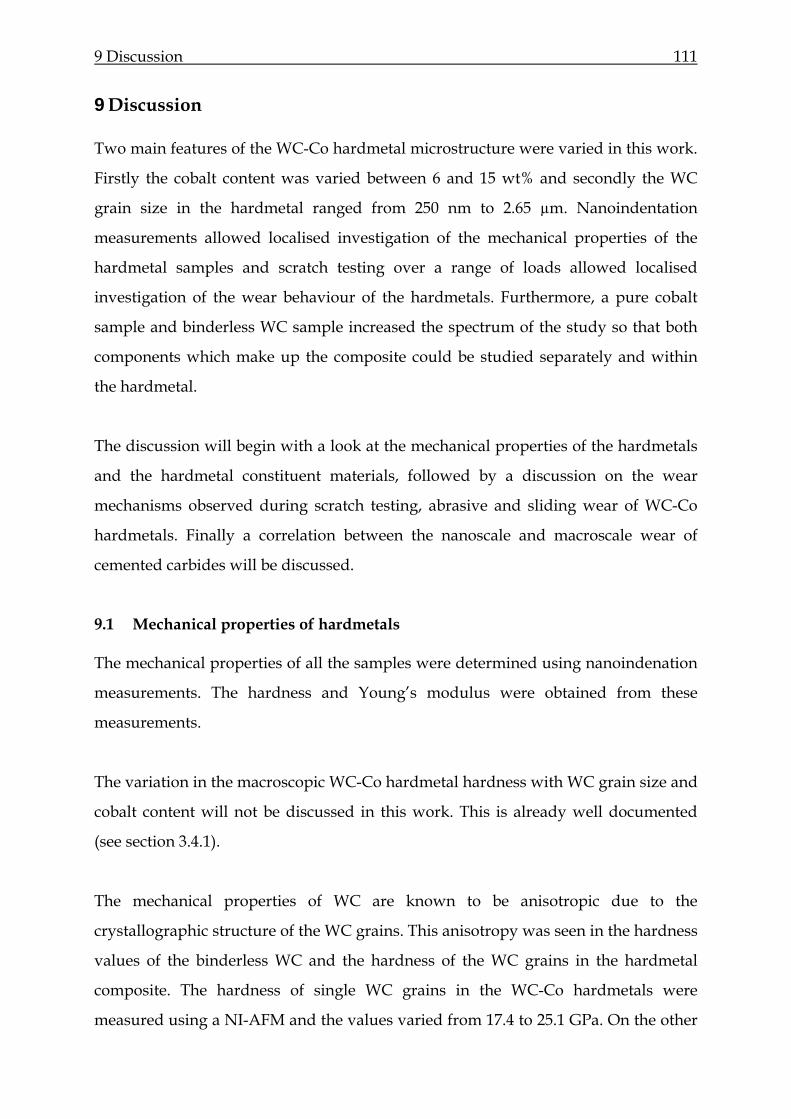
9 Discussion 111
9 Discussion
Two main features of the WC-Co hardmetal microstructure were varied in this work.
Firstly the cobalt content was varied between 6 and 15 wt% and secondly the WC
grain size in the hardmetal ranged from 250 nm to 2.65 µm. Nanoindentation
measurements allowed localised investigation of the mechanical properties of the
hardmetal samples and scratch testing over a range of loads allowed localised
investigation of the wear behaviour of the hardmetals. Furthermore, a pure cobalt
sample and binderless WC sample increased the spectrum of the study so that both
components which make up the composite could be studied separately and within
the hardmetal.
The discussion will begin with a look at the mechanical properties of the hardmetals
and the hardmetal constituent materials, followed by a discussion on the wear
mechanisms observed during scratch testing, abrasive and sliding wear of WC-Co
hardmetals. Finally a correlation between the nanoscale and macroscale wear of
cemented carbides will be discussed.
9.1 Mechanical properties of hardmetals
The mechanical properties of all the samples were determined using nanoindenation
measurements. The hardness and Young’s modulus were obtained from these
measurements.
The variation in the macroscopic WC-Co hardmetal hardness with WC grain size and
cobalt content will not be discussed in this work. This is already well documented
(see section 3.4.1).
The mechanical properties of WC are known to be anisotropic due to the
crystallographic structure of the WC grains. This anisotropy was seen in the hardness
values of the binderless WC and the hardness of the WC grains in the hardmetal
composite. The hardness of single WC grains in the WC-Co hardmetals were
measured using a NI-AFM and the values varied from 17.4 to 25.1 GPa. On the other
9 Discussion 112
hand the hardness of the binderless WC varied from 23.2 to 30.2 GPa. The hardness
in the binderless WC sample was therefore slightly higher than that of the individual
WC grains in the hardmetal composite samples. It was expected that the hardness of
the WC grains in the composite would be higher due to the constraint caused by the
cobalt binder phase, however this constraint is normally more pronounced for fine
grain structures and the grains that were measured in the hardmetals had grain sizes
ranging from 2.65 to 0.66 µm. This anisotropy also affects the wear response of the
individual WC grains and will be discussed in detail later.
Figure 9-1: AFM images of indents on (a) WC6M and (b) WC6MF made with an applied load of 5
mN showing the variation in the pile-up formation around the indents.
Similarly there was a variation in the mechanical properties of the cobalt phase
measured within the hardmetal compared to the pure cobalt sample. The hardness
value of the binder measured in CG15 was 9.4 GPa which was almost three times the
value of the hardness of the pure cobalt sample which had a hardness of 3.3 GPa
which is closer to the literature value of 1.02 GPa [95]. The reason for this difference
is mainly due to the fact that within the hardmetal the cobalt binder is surrounded by
hard WC grains and even when the testing load and penetration are kept low the
probability of encountering a hard WC particle are high, especially considering the
small mean free path in the hardmetal. These values show a significant improvement
to the nanoindentation data obtained by Gee et al [47]. They reported hardness
values within the range of 20-40GPa for the binder in a WC-Co sample. The hardness
value of the hard WC particle in the same work was reported to lie between 150 and
9 Discussion 113
170 GPa. They attributed the results to indentation size effect which could also be the
cause for the high values obtained in this work. However the values determined in
this study lie in the expected order of magnitude.
The influence of VC and Cr3C2 on the hardness of the cobalt binder could not be
directly measured since it was not possible to indent the binder phase in WC6F
which contained these modifiers. It has however been reported that the main effect of
these additives is to reduce WC grain growth during sintering and this leads to an
increase in the composite hardness [96]. According to work by Zarrickson Cr3C2
additions of less than 2% do not have any effect on the hardness [98]. On the other
hand fine VC particles are often found in the cobalt binder which can lead to an
increase in the hardness [99].
The microstructural response of the cemented carbides to indentation was mainly
ductile with glide lines being formed in the grains in the centre of the indent. Slip in
WC grains by indentation was also observed by both Engqvist and Jia et al during
indentation with a Vickers indenter respectively [71,72]. The extrusion of the binder
leading to the formation of cobalt lips in the indent was also observed. Grain fracture
took place with the formation of fine cracks. The pile-up of material along the indent
edges was observed in all the hardmetal samples and was more pronounced in the
fine grained materials. Pile-up was also observed in the indents formed on individual
WC grains indicating the ductile flow of the hard WC phase during indentation. The
pile-up formation was not uniform and varied from grain to grain (figure 9-1).
Indentation in the binderless WC resulted in more grain fracture than in the
cemented carbides and furthermore the grain fracture was not only transgranular but
also intergranular. Similarly to the cemented carbides, slip lines were formed in the
grains within the indent.
The Young’s modulus of the WC-Co hardmetals was found to lie within the expected
range of 400 to 700 GPa [38]. Furthermore the cobalt content was found to have an
influence on the Young’s modulus values of the hardmetals. Young’s modulus was
9 Discussion 114
found to decrease with increasing cobalt content (Figure 7-10). Okamoto et al. also
observed this trend when carrying out investigations on WC-Co hardmetals with a
WC grain size of 20 µm and a cobalt content ranging from 5 to 20 wt% [39]. They
reported an average value of 577 GPa for samples with a grain size ranging from 3-20
µm. The WC grain size was not found to have any influence on the Young’s modulus
of the hardmetals.
9.2 The scratch behaviour of WC-Co hardmetals
Scratch tests were conducted at loads ranging from 5 mN to 10 N using a Berkovich
indenter. Firstly the influence of the load on the amount of wear and the wear
mechanisms in WC-Co hardmetals will be discussed. Secondly the influence of the
binder content (wt%) and WC grain size on the nanoscale wear observed during
scratch testing will be looked into in detail.
9.2.1 Influence of the load on wear
The scratch depth was found to increase with increasing load, similarly multiple
scratch tests resulted in an increase in depth, when compared to single scratch tests
but the relative increase from a single to a multiple scratch differed from sample to
sample. This is due to the influence of the material microstructure on the wear
mechanisms. Furthermore, as the scratch test progresses the initial damage
mechanisms affect the subsequent material behaviour. Crack formation leads to
material removal and debris formation. The debris particles act as abrasive particles
leading to further wear, thus complicating the entire material response.
9.2.1.1 Low loads
During single scratch tests at low loads the material response was predominantly
ductile with little to no crack formation taking place in the hardmetal samples. Thus
microploughing was considered to be one of the main wear mechanisms taking
place. Microploughing led to the formation of the grooves that were formed within
the wear scar. The movement of the indenter across the surface introduces high shear
strains into the surface material. The shear strain decreases with depth into the bulk
9 Discussion 115
and the depth of deformation is proportional to the displacement depth of the
indenter. Thus the indenter acts as a single abrasive particle during abrasive wear. At
low loads the deformed region work hardens and crack formation occurs when the
work-hardened layer is no longer able to sustain further deformation. The material
below the hardened surface is still able to deform, so that the deformed volume
extends further than the contact region of the indenter. This accounts for the groove
formation that was observed in the hardmetals for single scratch tests between 5 and
10 mN.
Multiple scratch tests between 5 mN and 10 mN resulted in the microfatigue wear of
the hardmetal surfaces due to the repeated movement of the indenter across the
exposed surface. Twenty scratches were conducted for each multiple scratch test, and
this led to crack formation in the WC grains and also led to the loss of material from
the surface due to grain fracture and grain removal. Wear debris was formed during
multiple scratch testing, consisting of small WC grain fragments. Some of these were
removed from the surface completely but a lot of the debris remained on the worn
surface and occupied the voids formed by the pull out of WC grains and binder
extrusion. The glide activity of the WC grains was also observed after multiple
scratch testing. Slip lines were observed in some of the grains along the edges of the
scratch. The carbide is therefore able to undergo plastic deformation via a glide
mechanism and since the WC grains form a skeleton, a small amount of plastic
deformation in individual grains can cause large distortion in the bulk skeleton. This
accounts for the slip lines observed relatively far away from the scratch groove.
A tribofilm was observed on the surface of WC6SMG, furthermore this sample
showed very little grain fracture or removal in comparison to the other hardmetals.
The indenter was not able to penetrate the material surface easily due to the high
bulk hardness of the hardmetal and low load, thus it caused very little damage to the
surface and the compressive effect of the indenter pushed out cobalt binder from
between the WC grains. The binder was then spread across the worn region by the
indenter.
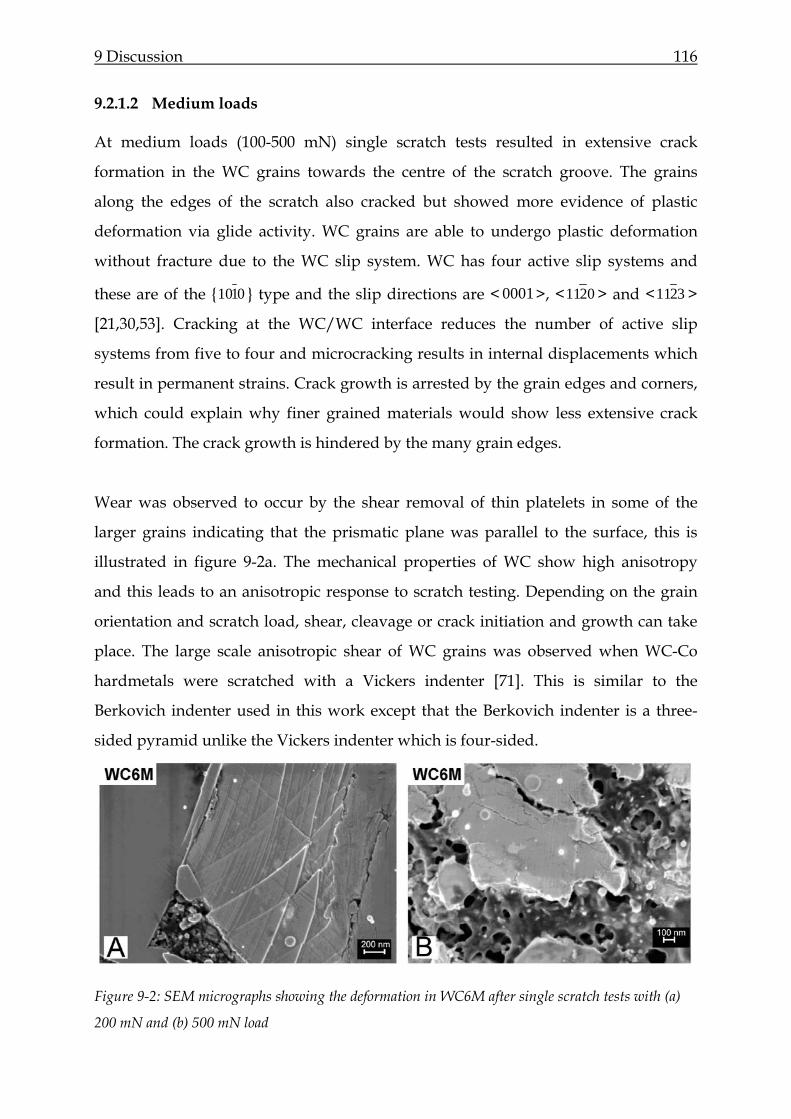
9 Discussion 116
9.2.1.2 Medium loads
At medium loads (100-500 mN) single scratch tests resulted in extensive crack
formation in the WC grains towards the centre of the scratch groove. The grains
along the edges of the scratch also cracked but showed more evidence of plastic
deformation via glide activity. WC grains are able to undergo plastic deformation
without fracture due to the WC slip system. WC has four active slip systems and
these are of the { 0110 } type and the slip directions are < 0001>, < 0211 > and < 3211 >
[21,30,53]. Cracking at the WC/WC interface reduces the number of active slip
systems from five to four and microcracking results in internal displacements which
result in permanent strains. Crack growth is arrested by the grain edges and corners,
which could explain why finer grained materials would show less extensive crack
formation. The crack growth is hindered by the many grain edges.
Wear was observed to occur by the shear removal of thin platelets in some of the
larger grains indicating that the prismatic plane was parallel to the surface, this is
illustrated in figure 9-2a. The mechanical properties of WC show high anisotropy
and this leads to an anisotropic response to scratch testing. Depending on the grain
orientation and scratch load, shear, cleavage or crack initiation and growth can take
place. The large scale anisotropic shear of WC grains was observed when WC-Co
hardmetals were scratched with a Vickers indenter [71]. This is similar to the
Berkovich indenter used in this work except that the Berkovich indenter is a three-
sided pyramid unlike the Vickers indenter which is four-sided.
Figure 9-2: SEM micrographs showing the deformation in WC6M after single scratch tests with (a)
200 mN and (b) 500 mN load
9 Discussion 117
The deformation of the binder was also observed after single scratch tests at medium
load. The cobalt binder is normally present in the fcc form and during deformation
the fcc-hcp transformation takes place quite easily, due to the low stacking fault
energy of the cobalt. The stacking fault energy is reported to be less than 20 mJm -2
[9]. The low stacking fault energies lead to increased dislocation densities during
deformation and high work hardening rates, this is thought to lead to crack
formation in the adjoining carbide grains. As the strain increases the cracks advance.
Figure 9-2b shows a fractured WC grain attached to cobalt binder. Voids have been
formed in the binder phase and further deformation of the WC skeleton will lead to
an enlargement of the voids in the binder and the eventual breakage of the thin
ligaments formed. Binder deformation assists the removal of WC grains from the
surface.
The pile-up of material along the scratch edges is normally observed in ductile
materials and is not expected in brittle materials such as WC-Co hardmetals.
However, pile-up formation in the hardmetals was observed at high loads. The pile-
up ridges were not uniform and not always continuous along the entire length of the
scratch. Jia et al also reported the pile-up behaviour in hardmetals containing 10 wt%
cobalt binder after scratch testing [71].
Multiple scratch tests at medium load led to microfatigue mechanisms as previously
discussed. Microcutting was also observed. This was induced by the diamond
indenter which is harder than the WC phase in the hardmetals. Microcutting could
also be caused by fragmented WC grains. A lot of wear debris was formed during
multiple scratch testing at medium loads and this formed a mechanically mixed layer
on the material surface. The WC fragments were re-embedded into the cobalt binder
and compacted by the repeated movement of the indenter. Cross section examination
of the scratches showed that the mechanically mixed layer was not very thick and
was very uneven. This layer is considered to have had a protective effect resulting in
less damage to the bulk material.
9 Discussion 118
Removal of the cobalt binder at medium load also led to increased WC grain pull
out. Binder removal results in a relaxation of the internal compressive stresses in the
carbide grains causing them to crack and fall out of the matrix. Once a grain is
removed the remaining adjacent grains can be easily removed because they are less
rigidly supported. WC grain pull-out is therefore influenced by the amount of binder
in the hardmetal. A higher binder content means that it will take longer to
preferentially remove the binder such that carbide pull-out is possible. This explains
why WC grain fall-out was observed in the samples containing 6 wt% binder after
multiple scratch tests at low loads whereas CG15, containing 15 wt% binder, only
exprienced grain fall out after multiple scratch tests at medium load.
9.2.1.3 High load regime
When the load was increased to between 1 and 10 N the WC grain fracture became
more severe, with individual WC grains being broken into several fragments in
single scratch tests. Crack formation was generally normal to the scratch direction
and so the orientation of the WC grains did not appear to influence crack formation
or progression. WC is able to undergo deformation without fracture but in this case
the load exceeded the shear strength of the tungsten carbide grains and resulted in
the fracture that was observed. In addition to grain fracture, WC grain removal along
the scratch edges was observed after single scratch tests. The grain removal was
caused by the edges of the indenter which applied a considerable load to the material
surface. This caused both the binder and the WC grains to be removed from the
material surface. Thus large sections of the worn surface showed exposed binder
phase and subsequent scratch tests would lead to further grain removal which would
occur more easily as a result of the damage that has already taken place.
Microcutting and microfatigue mechanisms were once again observed with carbide
grain fragmentation taking place. The wear debris had a similar morphology to that
observed at lower loads however in this case it had a much finer appearance.
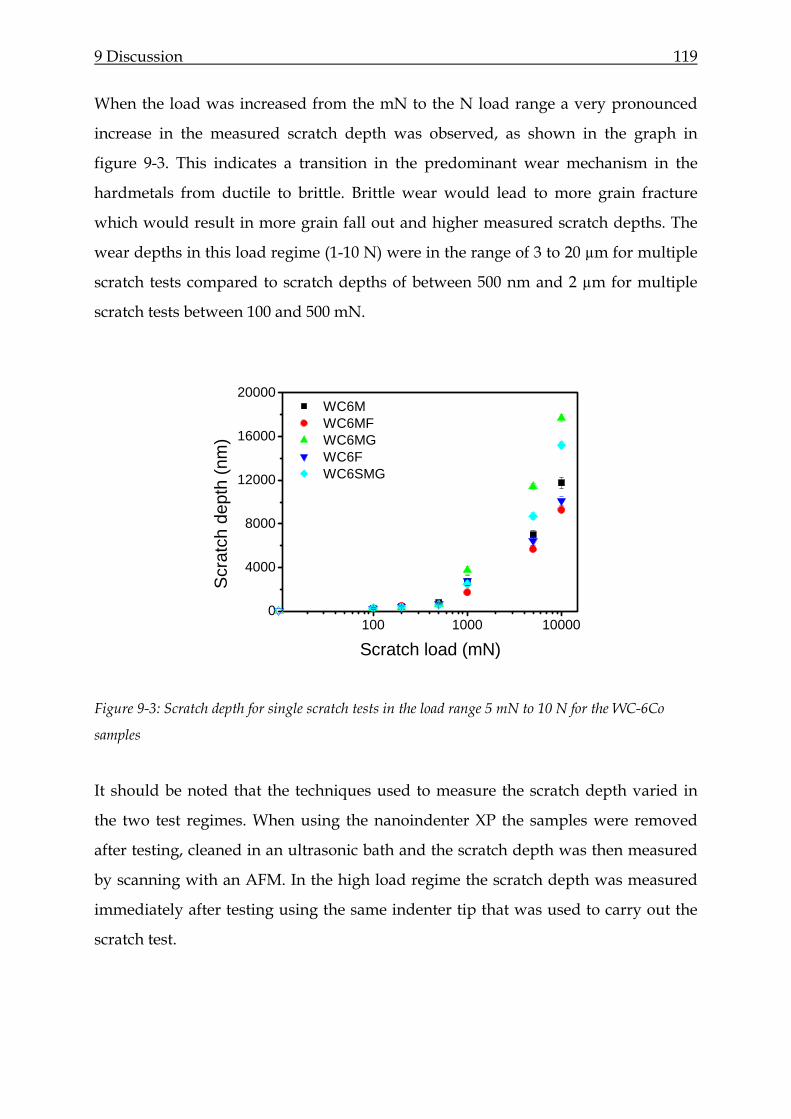
9 Discussion 119
When the load was increased from the mN to the N load range a very pronounced
increase in the measured scratch depth was observed, as shown in the graph in
figure 9-3. This indicates a transition in the predominant wear mechanism in the
hardmetals from ductile to brittle. Brittle wear would lead to more grain fracture
which would result in more grain fall out and higher measured scratch depths. The
wear depths in this load regime (1-10 N) were in the range of 3 to 20 µm for multiple
scratch tests compared to scratch depths of between 500 nm and 2 µm for multiple
scratch tests between 100 and 500 mN.
100 1000 100000
4000
8000
12000
16000
20000
Scr
atch
dep
th (n
m)
Scratch load (mN)
WC6M WC6MF WC6MG WC6F WC6SMG
Figure 9-3: Scratch depth for single scratch tests in the load range 5 mN to 10 N for the WC-6Co
samples
It should be noted that the techniques used to measure the scratch depth varied in
the two test regimes. When using the nanoindenter XP the samples were removed
after testing, cleaned in an ultrasonic bath and the scratch depth was then measured
by scanning with an AFM. In the high load regime the scratch depth was measured
immediately after testing using the same indenter tip that was used to carry out the
scratch test.
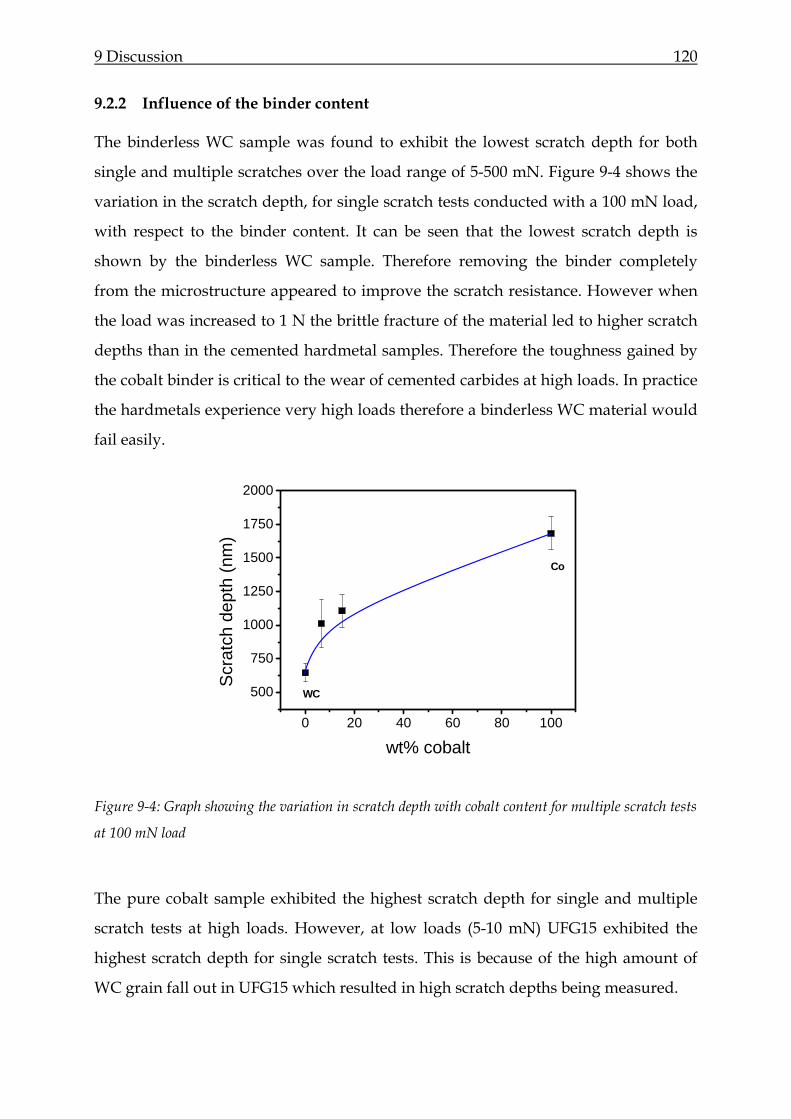
9 Discussion 120
9.2.2 Influence of the binder content
The binderless WC sample was found to exhibit the lowest scratch depth for both
single and multiple scratches over the load range of 5-500 mN. Figure 9-4 shows the
variation in the scratch depth, for single scratch tests conducted with a 100 mN load,
with respect to the binder content. It can be seen that the lowest scratch depth is
shown by the binderless WC sample. Therefore removing the binder completely
from the microstructure appeared to improve the scratch resistance. However when
the load was increased to 1 N the brittle fracture of the material led to higher scratch
depths than in the cemented hardmetal samples. Therefore the toughness gained by
the cobalt binder is critical to the wear of cemented carbides at high loads. In practice
the hardmetals experience very high loads therefore a binderless WC material would
fail easily.
0 20 40 60 80 100
500
750
1000
1250
1500
1750
2000
Scr
atch
dep
th (n
m)
wt% cobalt
WC
Co
Figure 9-4: Graph showing the variation in scratch depth with cobalt content for multiple scratch tests
at 100 mN load
The pure cobalt sample exhibited the highest scratch depth for single and multiple
scratch tests at high loads. However, at low loads (5-10 mN) UFG15 exhibited the
highest scratch depth for single scratch tests. This is because of the high amount of
WC grain fall out in UFG15 which resulted in high scratch depths being measured.
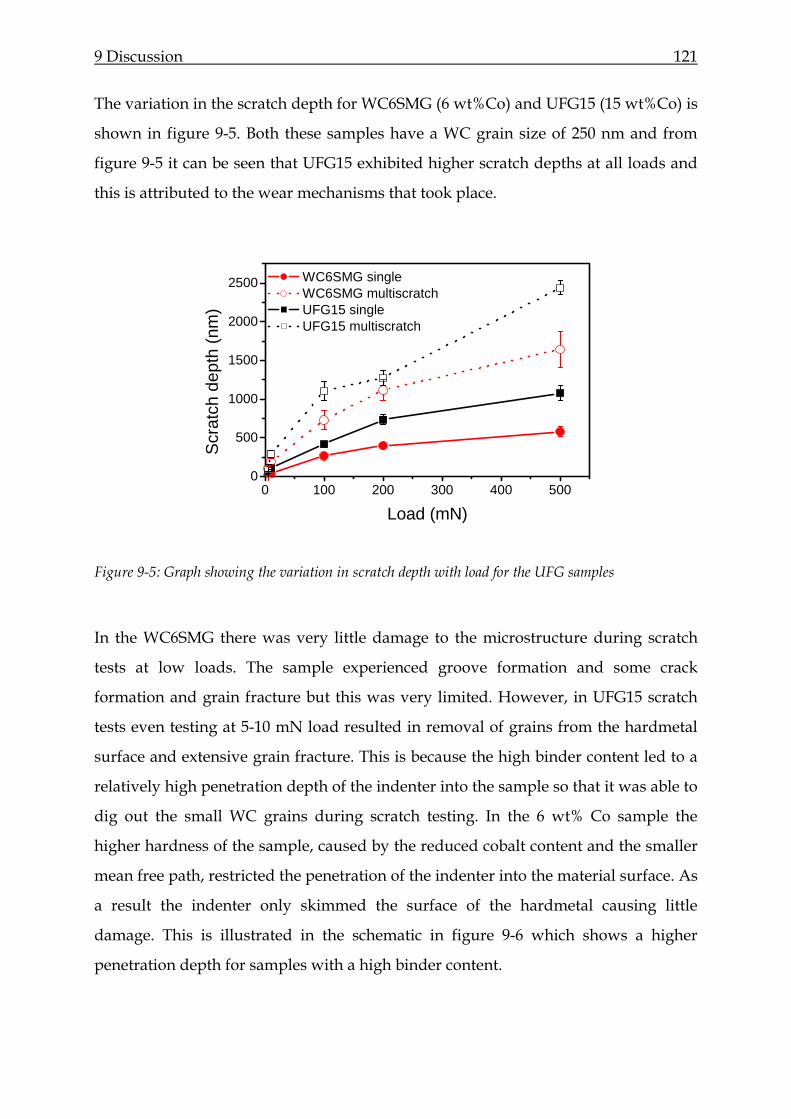
9 Discussion 121
The variation in the scratch depth for WC6SMG (6 wt%Co) and UFG15 (15 wt%Co) is
shown in figure 9-5. Both these samples have a WC grain size of 250 nm and from
figure 9-5 it can be seen that UFG15 exhibited higher scratch depths at all loads and
this is attributed to the wear mechanisms that took place.
0 100 200 300 400 5000
500
1000
1500
2000
2500
Scr
atch
dep
th (n
m)
Load (mN)
WC6SMG single WC6SMG multiscratch UFG15 single UFG15 multiscratch
Figure 9-5: Graph showing the variation in scratch depth with load for the UFG samples
In the WC6SMG there was very little damage to the microstructure during scratch
tests at low loads. The sample experienced groove formation and some crack
formation and grain fracture but this was very limited. However, in UFG15 scratch
tests even testing at 5-10 mN load resulted in removal of grains from the hardmetal
surface and extensive grain fracture. This is because the high binder content led to a
relatively high penetration depth of the indenter into the sample so that it was able to
dig out the small WC grains during scratch testing. In the 6 wt% Co sample the
higher hardness of the sample, caused by the reduced cobalt content and the smaller
mean free path, restricted the penetration of the indenter into the material surface. As
a result the indenter only skimmed the surface of the hardmetal causing little
damage. This is illustrated in the schematic in figure 9-6 which shows a higher
penetration depth for samples with a high binder content.
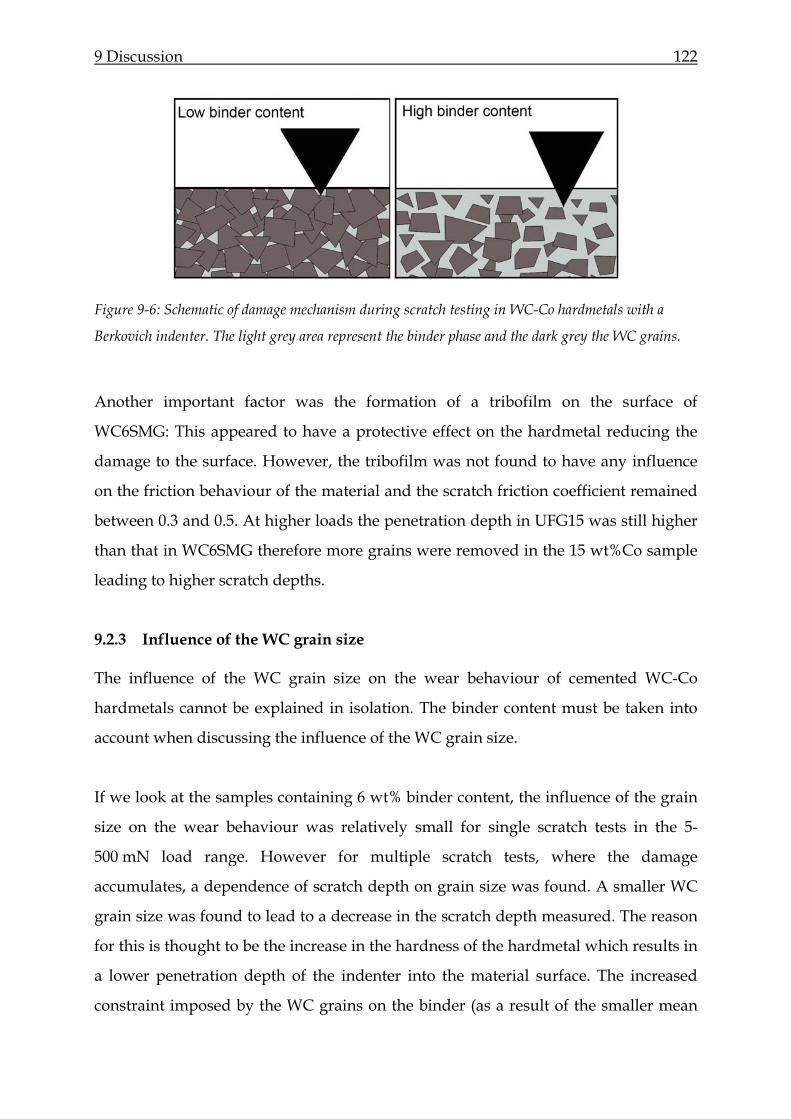
9 Discussion 122
Figure 9-6: Schematic of damage mechanism during scratch testing in WC-Co hardmetals with a
Berkovich indenter. The light grey area represent the binder phase and the dark grey the WC grains.
Another important factor was the formation of a tribofilm on the surface of
WC6SMG: This appeared to have a protective effect on the hardmetal reducing the
damage to the surface. However, the tribofilm was not found to have any influence
on the friction behaviour of the material and the scratch friction coefficient remained
between 0.3 and 0.5. At higher loads the penetration depth in UFG15 was still higher
than that in WC6SMG therefore more grains were removed in the 15 wt%Co sample
leading to higher scratch depths.
9.2.3 Influence of the WC grain size
The influence of the WC grain size on the wear behaviour of cemented WC-Co
hardmetals cannot be explained in isolation. The binder content must be taken into
account when discussing the influence of the WC grain size.
If we look at the samples containing 6 wt% binder content, the influence of the grain
size on the wear behaviour was relatively small for single scratch tests in the 5-
500 mN load range. However for multiple scratch tests, where the damage
accumulates, a dependence of scratch depth on grain size was found. A smaller WC
grain size was found to lead to a decrease in the scratch depth measured. The reason
for this is thought to be the increase in the hardness of the hardmetal which results in
a lower penetration depth of the indenter into the material surface. The increased
constraint imposed by the WC grains on the binder (as a result of the smaller mean
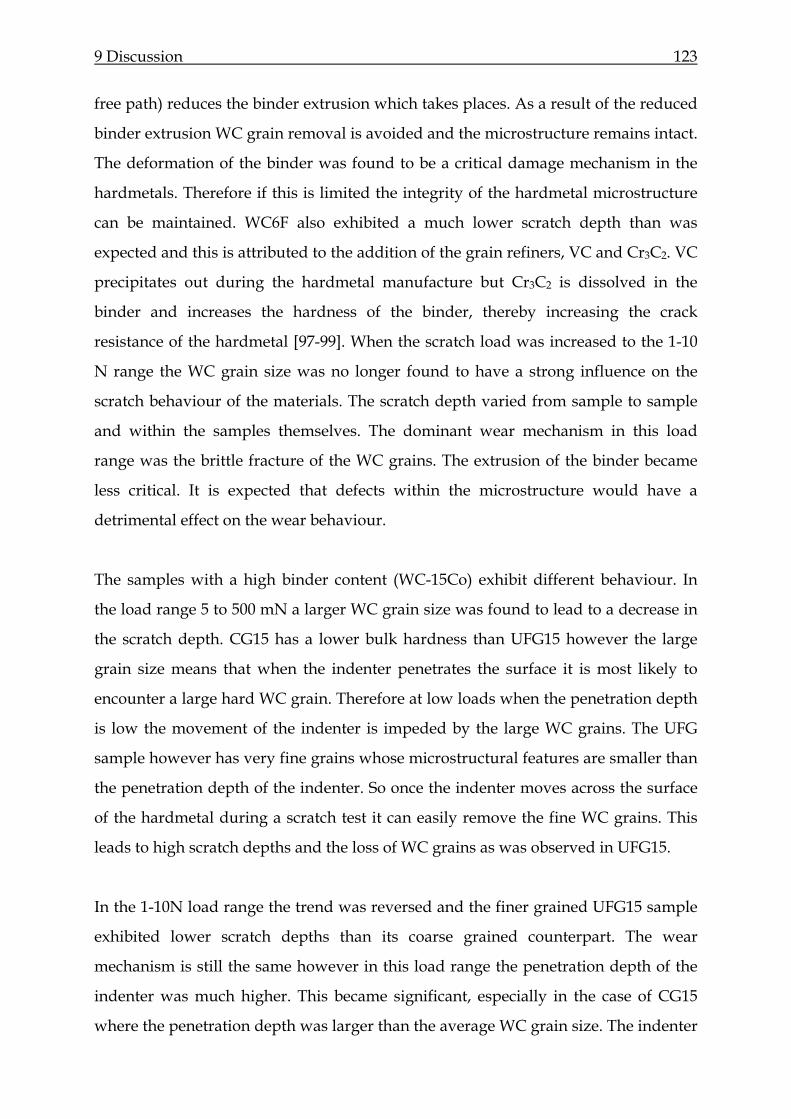
9 Discussion 123
free path) reduces the binder extrusion which takes places. As a result of the reduced
binder extrusion WC grain removal is avoided and the microstructure remains intact.
The deformation of the binder was found to be a critical damage mechanism in the
hardmetals. Therefore if this is limited the integrity of the hardmetal microstructure
can be maintained. WC6F also exhibited a much lower scratch depth than was
expected and this is attributed to the addition of the grain refiners, VC and Cr3C2. VC
precipitates out during the hardmetal manufacture but Cr3C2 is dissolved in the
binder and increases the hardness of the binder, thereby increasing the crack
resistance of the hardmetal [97-99]. When the scratch load was increased to the 1-10
N range the WC grain size was no longer found to have a strong influence on the
scratch behaviour of the materials. The scratch depth varied from sample to sample
and within the samples themselves. The dominant wear mechanism in this load
range was the brittle fracture of the WC grains. The extrusion of the binder became
less critical. It is expected that defects within the microstructure would have a
detrimental effect on the wear behaviour.
The samples with a high binder content (WC-15Co) exhibit different behaviour. In
the load range 5 to 500 mN a larger WC grain size was found to lead to a decrease in
the scratch depth. CG15 has a lower bulk hardness than UFG15 however the large
grain size means that when the indenter penetrates the surface it is most likely to
encounter a large hard WC grain. Therefore at low loads when the penetration depth
is low the movement of the indenter is impeded by the large WC grains. The UFG
sample however has very fine grains whose microstructural features are smaller than
the penetration depth of the indenter. So once the indenter moves across the surface
of the hardmetal during a scratch test it can easily remove the fine WC grains. This
leads to high scratch depths and the loss of WC grains as was observed in UFG15.
In the 1-10N load range the trend was reversed and the finer grained UFG15 sample
exhibited lower scratch depths than its coarse grained counterpart. The wear
mechanism is still the same however in this load range the penetration depth of the
indenter was much higher. This became significant, especially in the case of CG15
where the penetration depth was larger than the average WC grain size. The indenter
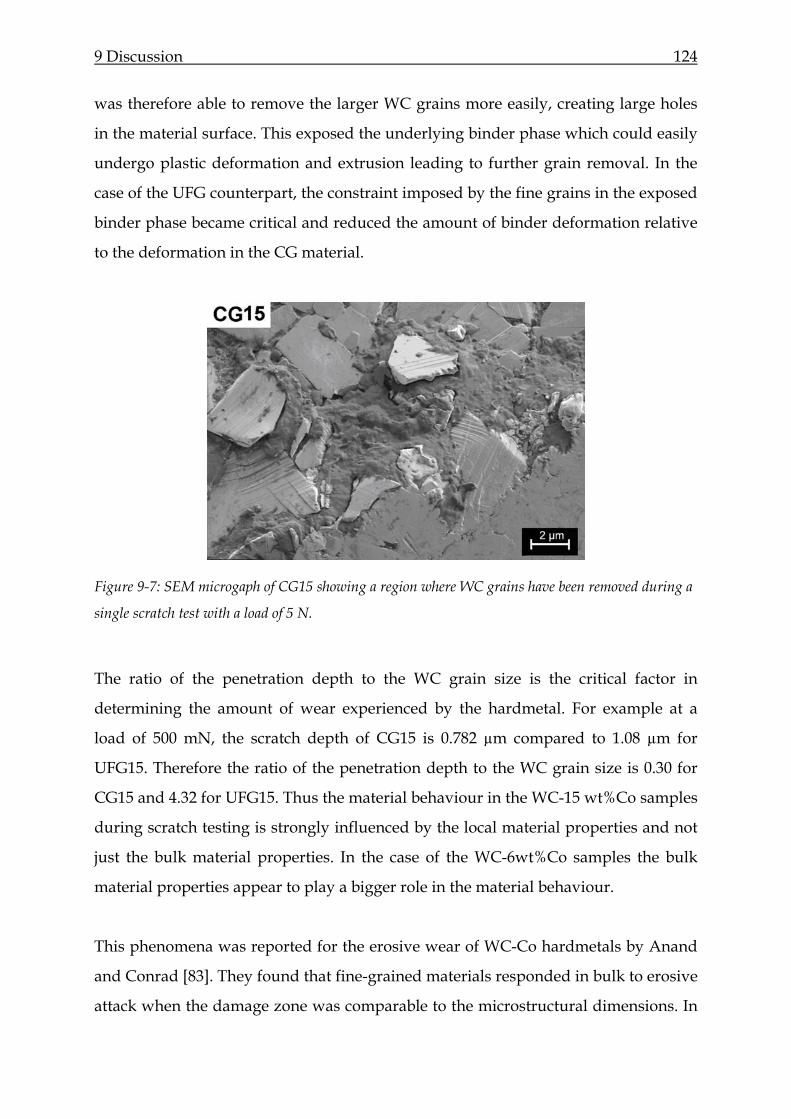
9 Discussion 124
was therefore able to remove the larger WC grains more easily, creating large holes
in the material surface. This exposed the underlying binder phase which could easily
undergo plastic deformation and extrusion leading to further grain removal. In the
case of the UFG counterpart, the constraint imposed by the fine grains in the exposed
binder phase became critical and reduced the amount of binder deformation relative
to the deformation in the CG material.
Figure 9-7: SEM microgaph of CG15 showing a region where WC grains have been removed during a
single scratch test with a load of 5 N.
The ratio of the penetration depth to the WC grain size is the critical factor in
determining the amount of wear experienced by the hardmetal. For example at a
load of 500 mN, the scratch depth of CG15 is 0.782 µm compared to 1.08 µm for
UFG15. Therefore the ratio of the penetration depth to the WC grain size is 0.30 for
CG15 and 4.32 for UFG15. Thus the material behaviour in the WC-15 wt%Co samples
during scratch testing is strongly influenced by the local material properties and not
just the bulk material properties. In the case of the WC-6wt%Co samples the bulk
material properties appear to play a bigger role in the material behaviour.
This phenomena was reported for the erosive wear of WC-Co hardmetals by Anand
and Conrad [83]. They found that fine-grained materials responded in bulk to erosive
attack when the damage zone was comparable to the microstructural dimensions. In
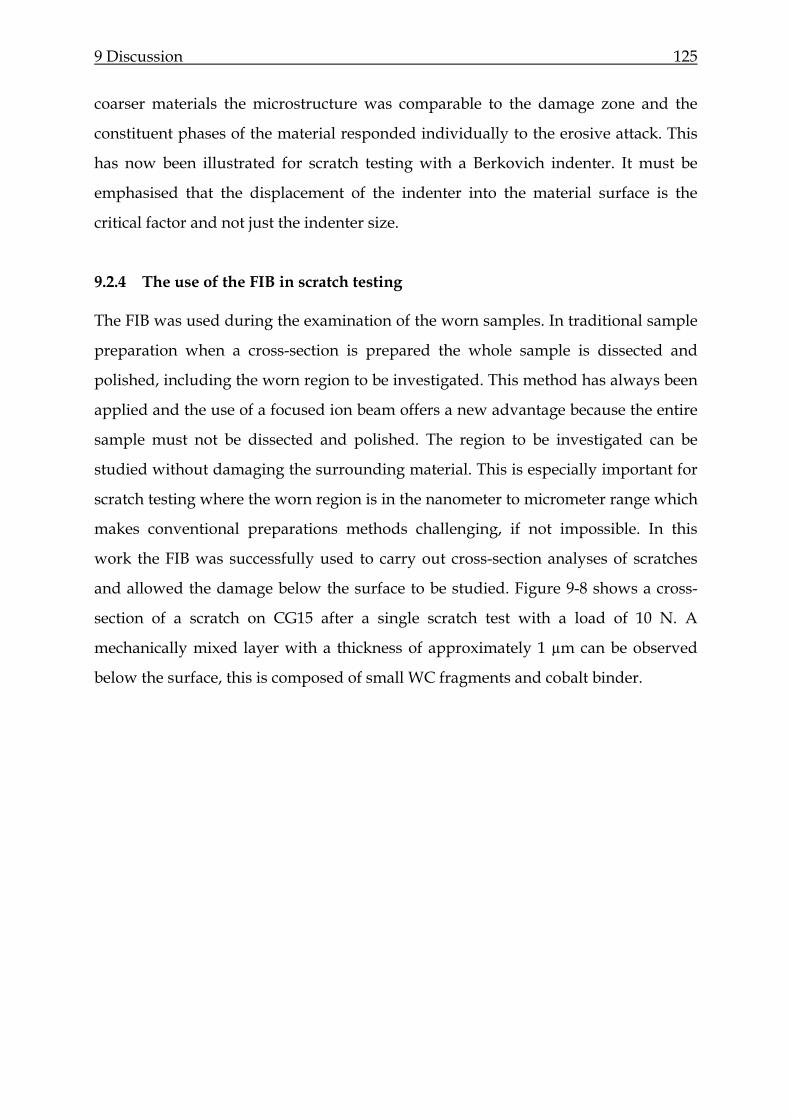
9 Discussion 125
coarser materials the microstructure was comparable to the damage zone and the
constituent phases of the material responded individually to the erosive attack. This
has now been illustrated for scratch testing with a Berkovich indenter. It must be
emphasised that the displacement of the indenter into the material surface is the
critical factor and not just the indenter size.
9.2.4 The use of the FIB in scratch testing
The FIB was used during the examination of the worn samples. In traditional sample
preparation when a cross-section is prepared the whole sample is dissected and
polished, including the worn region to be investigated. This method has always been
applied and the use of a focused ion beam offers a new advantage because the entire
sample must not be dissected and polished. The region to be investigated can be
studied without damaging the surrounding material. This is especially important for
scratch testing where the worn region is in the nanometer to micrometer range which
makes conventional preparations methods challenging, if not impossible. In this
work the FIB was successfully used to carry out cross-section analyses of scratches
and allowed the damage below the surface to be studied. Figure 9-8 shows a cross-
section of a scratch on CG15 after a single scratch test with a load of 10 N. A
mechanically mixed layer with a thickness of approximately 1 µm can be observed
below the surface, this is composed of small WC fragments and cobalt binder.
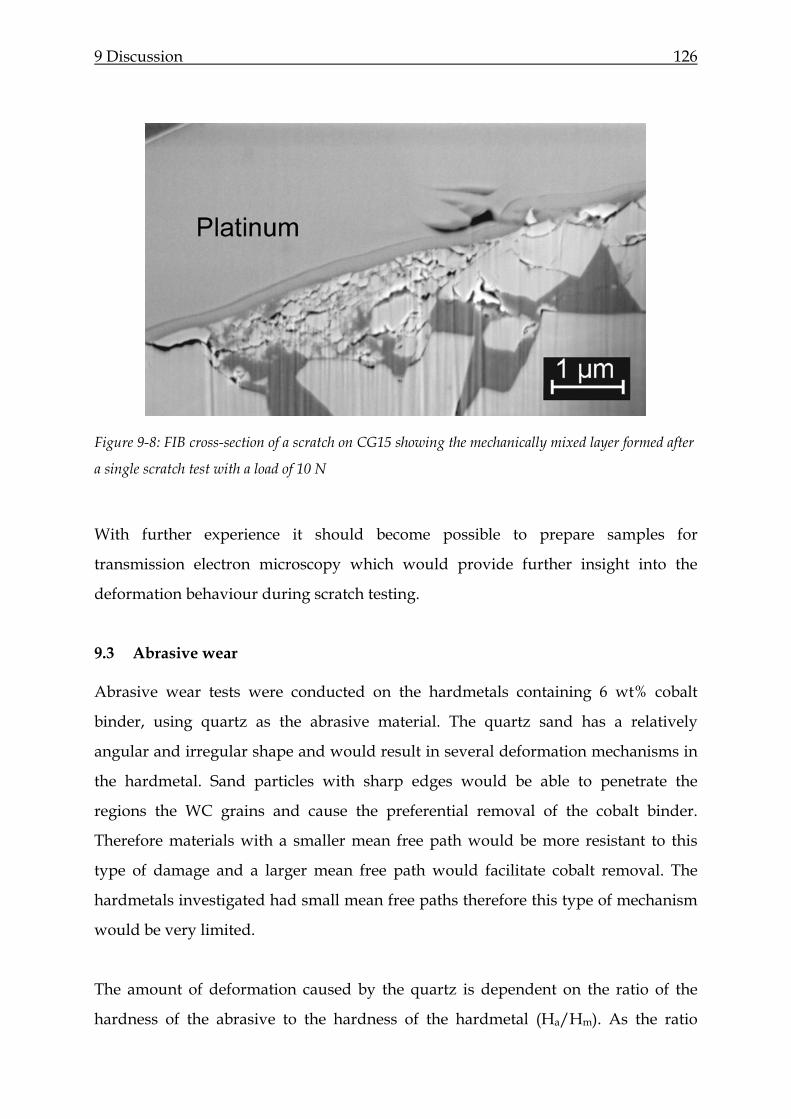
9 Discussion 126
Figure 9-8: FIB cross-section of a scratch on CG15 showing the mechanically mixed layer formed after
a single scratch test with a load of 10 N
With further experience it should become possible to prepare samples for
transmission electron microscopy which would provide further insight into the
deformation behaviour during scratch testing.
9.3 Abrasive wear
Abrasive wear tests were conducted on the hardmetals containing 6 wt% cobalt
binder, using quartz as the abrasive material. The quartz sand has a relatively
angular and irregular shape and would result in several deformation mechanisms in
the hardmetal. Sand particles with sharp edges would be able to penetrate the
regions the WC grains and cause the preferential removal of the cobalt binder.
Therefore materials with a smaller mean free path would be more resistant to this
type of damage and a larger mean free path would facilitate cobalt removal. The
hardmetals investigated had small mean free paths therefore this type of mechanism
would be very limited.
The amount of deformation caused by the quartz is dependent on the ratio of the
hardness of the abrasive to the hardness of the hardmetal (Ha/Hm). As the ratio
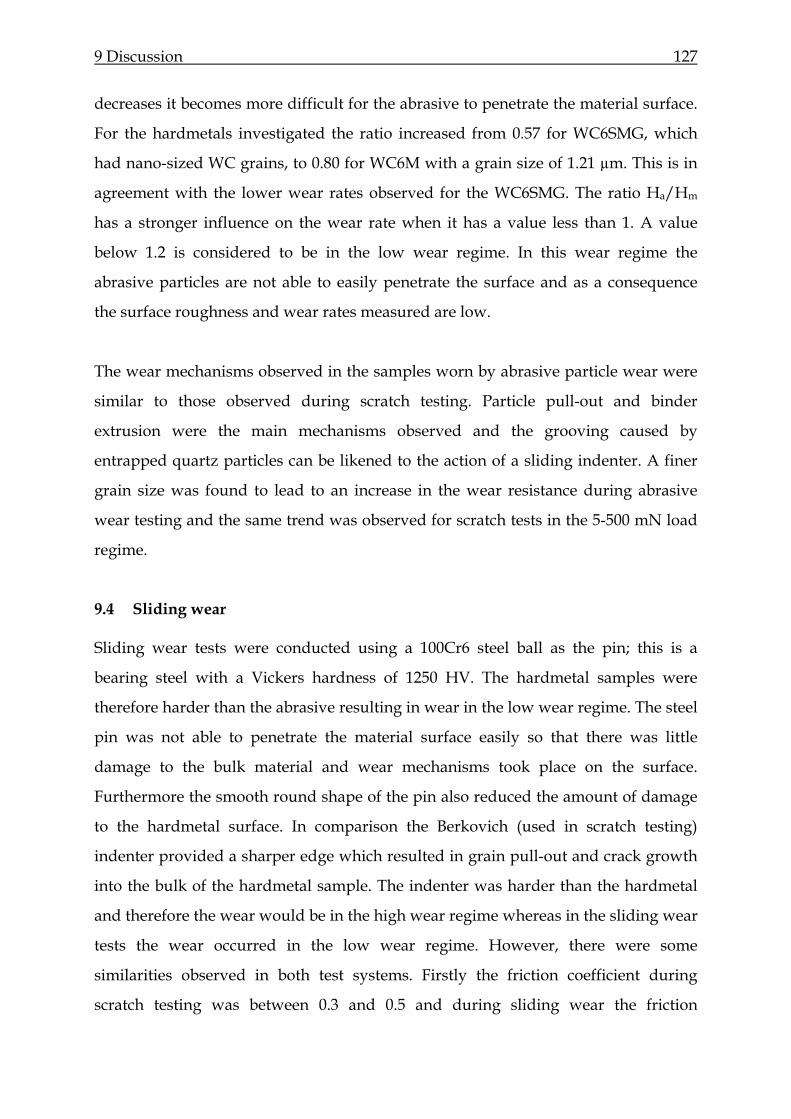
9 Discussion 127
decreases it becomes more difficult for the abrasive to penetrate the material surface.
For the hardmetals investigated the ratio increased from 0.57 for WC6SMG, which
had nano-sized WC grains, to 0.80 for WC6M with a grain size of 1.21 µm. This is in
agreement with the lower wear rates observed for the WC6SMG. The ratio Ha/Hm
has a stronger influence on the wear rate when it has a value less than 1. A value
below 1.2 is considered to be in the low wear regime. In this wear regime the
abrasive particles are not able to easily penetrate the surface and as a consequence
the surface roughness and wear rates measured are low.
The wear mechanisms observed in the samples worn by abrasive particle wear were
similar to those observed during scratch testing. Particle pull-out and binder
extrusion were the main mechanisms observed and the grooving caused by
entrapped quartz particles can be likened to the action of a sliding indenter. A finer
grain size was found to lead to an increase in the wear resistance during abrasive
wear testing and the same trend was observed for scratch tests in the 5-500 mN load
regime.
9.4 Sliding wear
Sliding wear tests were conducted using a 100Cr6 steel ball as the pin; this is a
bearing steel with a Vickers hardness of 1250 HV. The hardmetal samples were
therefore harder than the abrasive resulting in wear in the low wear regime. The steel
pin was not able to penetrate the material surface easily so that there was little
damage to the bulk material and wear mechanisms took place on the surface.
Furthermore the smooth round shape of the pin also reduced the amount of damage
to the hardmetal surface. In comparison the Berkovich (used in scratch testing)
indenter provided a sharper edge which resulted in grain pull-out and crack growth
into the bulk of the hardmetal sample. The indenter was harder than the hardmetal
and therefore the wear would be in the high wear regime whereas in the sliding wear
tests the wear occurred in the low wear regime. However, there were some
similarities observed in both test systems. Firstly the friction coefficient during
scratch testing was between 0.3 and 0.5 and during sliding wear the friction
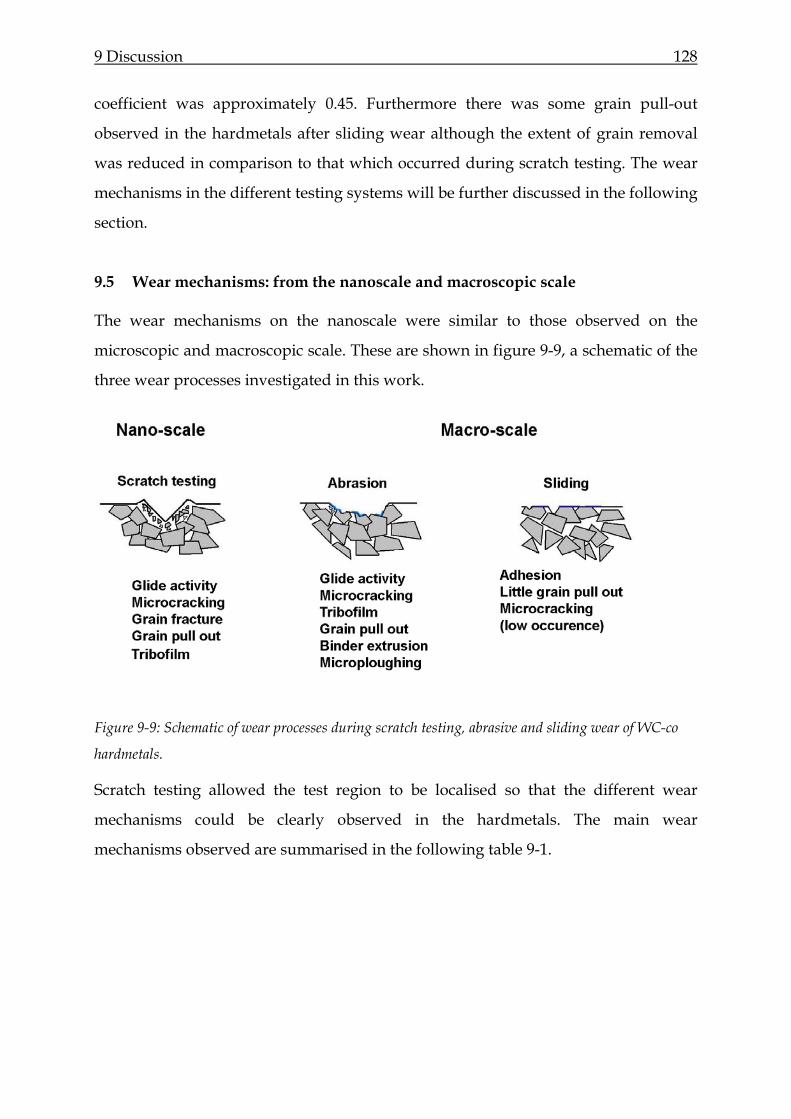
9 Discussion 128
coefficient was approximately 0.45. Furthermore there was some grain pull-out
observed in the hardmetals after sliding wear although the extent of grain removal
was reduced in comparison to that which occurred during scratch testing. The wear
mechanisms in the different testing systems will be further discussed in the following
section.
9.5 Wear mechanisms: from the nanoscale and macroscopic scale
The wear mechanisms on the nanoscale were similar to those observed on the
microscopic and macroscopic scale. These are shown in figure 9-9, a schematic of the
three wear processes investigated in this work.
Figure 9-9: Schematic of wear processes during scratch testing, abrasive and sliding wear of WC-co
hardmetals.
Scratch testing allowed the test region to be localised so that the different wear
mechanisms could be clearly observed in the hardmetals. The main wear
mechanisms observed are summarised in the following table 9-1.
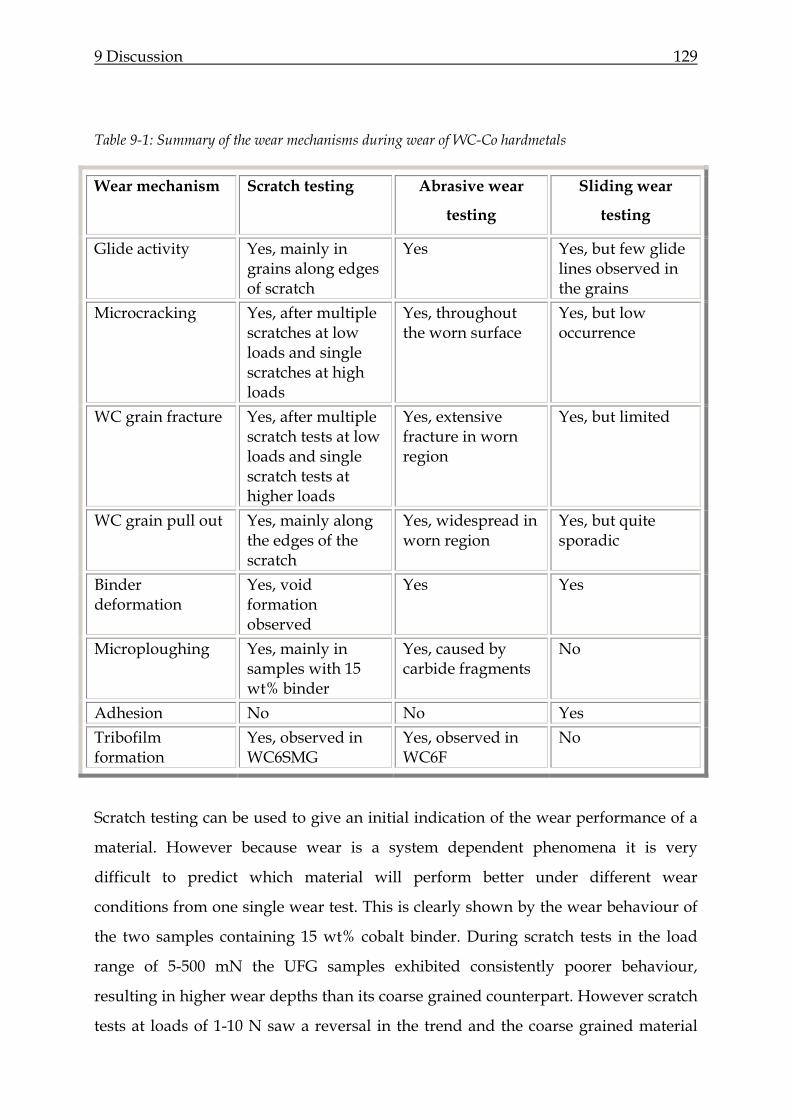
9 Discussion 129
Table 9-1: Summary of the wear mechanisms during wear of WC-Co hardmetals
Wear mechanism Scratch testing Abrasive wear
testing
Sliding wear
testing
Glide activity Yes, mainly in grains along edges of scratch
Yes Yes, but few glide lines observed in the grains
Microcracking Yes, after multiple scratches at low loads and single scratches at high loads
Yes, throughout the worn surface
Yes, but low occurrence
WC grain fracture Yes, after multiple scratch tests at low loads and single scratch tests at higher loads
Yes, extensive fracture in worn region
Yes, but limited
WC grain pull out Yes, mainly along the edges of the scratch
Yes, widespread in worn region
Yes, but quite sporadic
Binder deformation
Yes, void formation observed
Yes Yes
Microploughing Yes, mainly in samples with 15 wt% binder
Yes, caused by carbide fragments
No
Adhesion No No Yes Tribofilm formation
Yes, observed in WC6SMG
Yes, observed in WC6F
No
Scratch testing can be used to give an initial indication of the wear performance of a
material. However because wear is a system dependent phenomena it is very
difficult to predict which material will perform better under different wear
conditions from one single wear test. This is clearly shown by the wear behaviour of
the two samples containing 15 wt% cobalt binder. During scratch tests in the load
range of 5-500 mN the UFG samples exhibited consistently poorer behaviour,
resulting in higher wear depths than its coarse grained counterpart. However scratch
tests at loads of 1-10 N saw a reversal in the trend and the coarse grained material

9 Discussion 130
showed a reduced scratch resistance. On the other hand the samples containing 6
wt% binder showed no grain size dependence for scratch tests between 1 and 10 N
but in the lower load range a smaller grain size was found to increase the scratch
resistance.
A ranking of the materials is only possible for one type of wear test and under
specific conditions. The advantage of carrying out scratch testing on the nanoscale is
that because the worn region is very small the deformation behaviour of the WC
grains can be more easily identified and furthermore the deformation of the binder
phase can also be studied. In this work detailed clear images of the binder
deformation could be obtained. At the macroscopic scale the damage zone and level
of wear is very high so that identifying the wear in the individual grains and in the
binder phase is not that easy. Furthermore with scratch testing very small samples
are needed for testing. During scratch testing the indenter acts as a single abrasive
particle and multiple scratch testing gives a good indication of the processes that
occur during abrasive wear testing. In this work the indenter used was a diamond
Berkovich indenter and this has a considerably higher hardness and sharper edges
than the quartz sand that was used in the abrasive wear tests therefore a comparison
of the two systems must be made with care.
10 Conclusions 131
10 Conclusions
In this work a systematic study of the nanoscale and macroscale wear properties of
tungsten carbide hardmetals was conducted. The objective was to determine the
wear mechanisms that occur on the nanoscale and correlate these to those observed
on the macroscopic scale. Scratch tests were used to investigate the nanoscale wear
and abrasive and sliding wear tests were used to conduct macroscopic wear testing.
The most important findings of the scratch tests are:
• For scratch tests in the load range 5 to 500 mN a smaller grain size was found
to lead to an increase in the scratch resistance for samples with a low binder
content (6 wt%). On the other hand for the samples with a high binder content
(15 wt%), a smaller grain size resulted in a decrease in the scratch resistance
with higher scratch depths being measured for UFG15.
• In the load range 1 to 10 N no grain size dependence was observed for the
samples containing 6 wt% cobalt binder. However, in the samples containing
15 wt% binder a smaller grain size resulted in an increase in the scratch
resistance.
• A lower binder content resulted in an increase in the scratch resistance.
• The main wear mechanisms, are plastic deformation via glide activity,
microcracking, binder extrusion and grain fall out.
The most important findings of the abrasive tests are:
• The finer grained hardmetals exhibited lower wear rates than the coarse
grained samples. The wear rates were however generally very low due to the
relatively low hardness of the quartz in comparison to the hardmetals.
• The wear rate was found to be generally constant over the entire wear
distance, therefore there was no indication of an initial incubation period.
• The main wear mechanisms observed were the glide activity of the WC grains;
extensive grain fracture and fall out.

10 Conclusions 132
The important findings of the sliding wear tests are:
• The least amount of wear was shown by the hardmetal with the smallest grain
size. The coarse grained sample exhibited the most damage to the worn
surface.
• The main wear mechanism observed was the adhesion of material from the
pin onto the hardmetal surface.
This work was able to provide some insight into the wear mechanisms that take
place in WC-Co hardmetals at different test levels: on the nanoscale, microscale and
on the macroscopic scale. The nanoscratch tests allowed a closer look at the wear
mechanisms in individual grains and more especially in the binder phase.
11 References 133
11 References
1. V. K. Sarin, Cemented carbide cutting tools, Advances in powder technology,
Ed D. Y. Chin, ASM, (1981), 253-287
2. H. Engqvist, G. A. Botton, S. Ederyd, M. Phanuel, J. Fondelius, N. Axên, Wear
phenomena on WC-based face seal rings, Int. J. Refract. Met. Hard. Mater. 18
(2000) 39-46
3. R. Edwards, Cutting Tools, Institute of Materials, (1993), 200
4. M. Göken and M. Kempf: Microstructural Properties of Superalloys
Investigated by Nanoindentations in an Atomic Force Microscope, Acta mater.
47(3) (1999), 1043-1052
5. M. Göken and M. Kempf: Pop-ins in Nanoindentations - The Initial Yield
Point, Zeitschrift für Metallkunde 92 (2001), 1061-1067
6. M. Göken, M. Kempf, and W.D. Nix: Hardness and Modulus of The Lamellar
Microstructure in PST-TiAl Studied by Nanoindentations and AFM, Acta
mater. 49(5) (2001), 903-901
7. T. Staedler, K. Schiffmann, Correlation of nanomechanical and
nanotribological behavior of thin DLC coatings on different substrates, Surface
Science 482 (2001), 1125
8. A. A. Ogwu and T. J. Davies, Proposed selecton rules for suitable binders in
cemented hard metals with possible applications for improving ductility in
intermetallics, J. of Mater. Science 27 (1992), 5382-5388
9. B. Roebuck and E.A. Almond, Deformation and fracture processes and the
physical metallurgy of WC-Co hardmetals. International Materials Review
33[2] (1988) 90-110
10. K Jia. and T.E Fischer. Microstructure, hardness and toughness of
nanostructured and conventional WC-Co composites. Nanostructured
Materials 10[5] (1998) 875-891
11. R.F. Snowball and Milner D.R. Powder Metallurgy 11 (1968) 23-40.

11 References 134
12. J. Hinnuber et al. An electron-microscopy and x-ray investigation of the
milling of tungsten carbide/cobalt mixtures. Powd. Metall. 8 (1961) 1-24.
13. E. M. Trent Powder Metallalurgy 9 (1962) 322.
14. D. Lewis and J. Lindley Journal of the American Ceramic Society 49 (1966) 49.
15. R. Porat et al. Investigations of the sintering mechanisms for cemented
carbides based on nanocrystalline powders. Proc. Euro Powd. Metall. Conf.,
European Powder Metallurgy Association, Shrewsbury (1996) 101-107.
16. H.E. Exner Physical and chemical nature of cemented carbides. International
Materials Review 24[4] (1979) 149-173.
17. H. Winterhager and J. Krüger, Pure cobalt and its properties, Cobalt 29 (1965)
185-195
18. M. J. Bibby and J. Gordon Parr; Die α→ε Umwandlung in polykristallinem
Kobalt, Kobalt 20 (1963) 101-103
19. G. Wirmark and G.L. Dunlop, Phase transformations in the binder phase of
Co-W-C cemented carbides, Proc. 1st International Conference on the Science
of Hard Materials (1981) 311-325
20. H.E. Exner Qualitative and quantitative interpretation of microstructures in
cemented carbides, Proc1st Int. Conference on the Science of hard materials
(1981) 311-325
21. D. N. French and D. A. Thomas, Hardness anisotropy and slip in WC crystals,
Transaction of the AIME, 233 (1965), 950-952
22. Uhrenius B. et al. A study of the Co-W-C system at liquidus temperatures,
Scandanavian Journal of Metallurgy 5 (1976) 49-56.
23. P. Rautala and J. T. Norton, Tungsten-cobalt-carbon-system, Transactions of
the AIME, 194 (1952), 1045-1050
24. D. J. Rowcliffe, V. Jayaram, M. K. Hibbs and R. Sinclair, Compressive
deformation and fracture in WC materials, Materials Science and Engineering,
A105/106 (1988), 299-303
11 References 135
25. V. Jayaram, Plastic incompatibility and crack nucleation during deformation
on four independent slip systems in tungsten carbide-cobalt, Acta Metal. 35
(1987) 1307-1315
26. V. Pugsley, The influence of corrosion on the mechanical properties of
hardmetals and cermets, PhD thesis, Erlangen, 2002
27. H. C. Lee and J. Gurland, Hardness and deformation of cemented tungsten
carbide, Materials Science and Engineering 33 (1978) 125-133
28. B. Roebuck, Terminology, testing, properties, imaging and models for fine-
grained hardmetals, Int. J. of Refract. Metals and hard Mater. 13 (1995) 265-279
29. J. Gurland and P. Bardzil Relation of strength, composition and grain size of
sintered WC-Co alloys. Transactions of the AIME 203 (1955) 311-315
30. T. Takahashi and E.J. Freise, Determination of the slip system in single crystals
of tungsten monocarbide. Philos. Mag. 12 (1965), p. 1
31. M. Y. Lee, Metall. Trans., 14A (1983) 1625-1629
32. D. K. Shetty, I. G. Wright, P.N. Mincer and A. H. Clauer, Indentation fracture
of WC-Co cermets, Journal of Materials Science 20 (1985) 1873-1882
33. V. Richter and M. v Ruthendorf: On hardness and toughness of ultrafine and
nanocrystalline hard materials, International Journal of Refractory Metals and
Hard Materials 17 (1999) 141-152
34. J.L Chermant. and F. Osterstck Fracture toughness and fracture of WC-Co
composites. Journal of Material Science 11 (1976) 1939-1951.
35. R. Warren and B Johannesson. International Journal of Refractory Metals and
Hard Materials 3 (1984) 187.
36. D.G.F O’Quicgley. et al. New results on the relationship between hardness
and fracture toughness of WCCo hardmetal. Materials Science and
Engineering A 209 (1996) 228-230
37. N. Sacks, I. Northrop and C. Allen, Fracture toughness of nanocrystalline WC-
Co hardmetals, in: G. Knerringer, P. Rödhammer and P. Wilhartitz (eds.,
11 References 136
Proceedings of the 14th Plansee Seminar (Volume 2)), Plansee AG Reutte, 1997,
680-688
38. K. J. Brookes, World directory and Handbook of Hardmetals and hard
materials, 1996, 97
39. S. Okamoto, Y. Nakazono, K. Otsuka, Y. Shimoitani and J. Takada, Mechanical
properties of WC/Co cemented carbide with larger WC grain size, Materials
Characterization 55 (2995) 281-287
40. H.E Exner. and J. A Gurland, A review of parameters influencing some
mechanical properties of tungsten carbide cobalt alloys. Powder Metallurgy 13
(1970) 13-31
41. G. S. Kreimer et al. Physics Met. Metall. 17 (1964) 85
42. E. W. Engle, Powder Metallurgy, Ed. J. Wulff, 1942, 436
43. J. Gurland and P. Bardzil, J. Metals. Transactions of the AIME, 1995 331
44. J.V. Laptev, Intercarbide surface is the main obstacle to increase fracture
toughness and strength of hardmetals in PM’94; Powder Metallurgy World
Congress, Paris 1994, Les Editions de Physique, Les Ulis, France 103-106
45. M. G. Gee, B. Roebuck, P. Lindahl and H-O. Andren, Constituent phase
nanoindentation of WC/Co and Ti (C,N) hard metals, Materials Science and
Engineering A209 (1996) 128-136
46. D.A. Rigney, Fundamentals of friction and wear of materials ASM, 1981
47. K-H. Zum Gahr. Microstructure and wear of materials. Elsevier Science
Publishers, The Netherlands, (1987).
48. E. Rabinowicz, L. A. Dunn and P. G. Russel, A study of abrasive wear under
three-body conditions, Wear 4 (1961) 345-355
49. L. Fang, X. L. Komg, J. Y. Su and Q. D. Zhou, Movement patterns of abrasive
particles in three body abrasion, Wear 162-164 (1993) 782-789
50. Y. Xie and B. Bushan, Effects of particle size, polishing pad and contact
pressure in free abrasive polishing, Wear 200 (1996) 281-295
11 References 137
51. K-H. Zum Gahr, Wear by hard particles, Tribology International 31 (1998) 587-
596
52. I. M. Hutchings, Tribology: Friction and wear of engineering materials,
Butterwort-Heinemann, 1992
53. S. B. Luyckx, Acta Metall, 18 (1970) 233-236
54. R.M. Greenwood, M.H. Loretto and R.E. Smallman, The defect structure of
tungsten carbide in deformed tungsten carbide–cobalt composites. Acta
Metall. 30 (1982), pp. 1193–1196
55. V. Jayaram. R. Sinclair and D. J. Rowcliffe, Acta Metall. 31 (1981) 373-378
56. B. Roebuck and E. A. Almond, Recent advances in hardmetal production, 1
(1979) 28-1-28-19
57. S. Bartolucci and H. H. Schlossin, Acta Metall.14 (1966) 337-339
58. F. R. N. Nabarro and S.B. Luycks, Trans. Jpn. Inst. Met, 9 (1968) 610-615
59. A. Horsewell, B. Ralph and P. R. Howell, Phys. Status Solidi, 29 (1975) 587-594
60. S. Mahajon, M. L. Green and D. Brasen, Metall. Trans., 8A (1977) 283-293
61. R. T. Holt, Cobalt 16 (1972) 145-149
62. V. K. Sarin and T. Johannesson, On the deformation of WC-Co cemented
carbides, Metal Sci. 9 (1975) 472
63. M. Rettenmayr, H. E. Exner and W. Mader, Electron microscopy of binder
phase deformation in WC-Co alloys, Materials Science and Technology 4
(1988), 984-990
64. R. Spiegler and H. F. Fischmeister, Prediction of crack paths in WC-Co alloys,
Acta metal. Materi. 40 (1992) 1653-1661
65. L. S. Sigl, H. E. Exner and H. F. Fischmeister, Characterization of fracture
processes and fracture relevant parameters in WC-Co hardmetals,
Proceedings of the Int. Conference on the science of hard materials 1984, 631-
644
11 References 138
66. J. Pirso, S. Letunovits and M. Viljus, Friction and wear behaviour of cemented
carbides, Wear 257 (2004) 257-265
67. H. Engqvist, H. Högberg, G. A. Botton, S. Ederyd, N. Axén, Tribofilm
formation on cemented carbides in dry sliding conformal contact, Wear, 239
(2000) 219-228
68. J. Pirso, M. Viljus and S. Letunovits, Friction and dry sliding wear behaviour
of cermets, Wear 260 (2006) 815-824
69. J. Larsen-Basse, Binder extrusion in sliding wear of WC-Co alloys, Wear 105
(1985) 247-256
70. E. A. Almond, L. A. Lay and M. G. Gee, Comparison of war mechanisms in
ceramics and cemented carbides, Proc. 2nd Int. Conf. on hard materials, 1984,
23-28
71. K. Jia and T. E. Fischer, Sliding wear of conventional and nanostructured
cemented carbides, Wear 203-204 (1997) 310-318
72. H. Engqvist, S. Ederyd, N. Axén, S. Hogmark, Grooving wear of single-crystal
tungsten carbide, Wear, 230 (1999) 165-174
73. M.G. Gee, A.D. Gee, A cost effective test system for micro-tribology
experiments, Wear 263 (2007) 1484-1491
74. H. Engqvist, N. Axén, Abrasion of cemented carbides by small grits, Tribology
International 32 (1999) 527-534
75. H Enqvist, Microstructural aspects on wear of cemented carbides. Ph.D. thesis.
Uppsala University, Sweden (2000).
76. C.S Yust, Tribology and wear, International Materials Review 30[3] (1985) 141-
154
77. D.F.G O’Quigley, et al. An empirical ranking of a wide range of WC-Co
grades in terms of their abrasion resistance measured by the ASTM Standard
B611-85 test. International Journal of Refractory Metals and Hard Materials 15
(1997) 73-79
11 References 139
78. K. Jia, The effect of fine microstructure on the wear and relevant mechanical
properties of cemented carbide. PhD thesis. Stevens Institute of Technology,
(1996).
79. J. Larsen-Basse, Effects of hardness and local fracture toughness on the
abrasive wear of WC-Co alloys. I Mech E conference Publications (1987) 277-
282
80. J. Larsen-Basse, Resistance of cemented carbides to sliding abrasion: role of
binder metal. eds. Viswanadham R.K., Rowcliffe D.J. and Gurland J., Science
of Hard Materials Plenum Press, (1983) 707-813.
81. K.Jia and T. E. Fischer, Abrasion resistance of nanostructured and
conventional cemented carbides, Wear 200 (1996) 206-214
82. J. B. J. W. Hegeman, J. Th. M. De Hosson and G. de With, Grinding of WC-Co
hardmetals, Wear 248 (2001) 187-196
83. K. Anand and H. Conrad, Microstructure and scaling effects in the damage of
WC-Co alloys by single impacts of hard particles, Journal of. Materials Science
23 (1988) 2931-2942
84. M.G. Gee, A. Gant and B. Roebuck, Wear mechanisms in abrasion and erosion
of WC/Co and related hardmetals, Wear 263 (2007) 137-148
85. M. Herr, Tribologisches Verhalten von ultra-feinkörnigen Hartmetallen mit
verschiedenen Binderliegerungen. Ph.D. thesis. University Erlangen-
Nürnberg (2002)
86. Nanoindenter XP handbook, MTS Systems
87. S. W. Youn and C. G. Kang, Effect of nanoscratch conditions on both
deformation behaviour and wet-etching characteristics of silicon (100) surface,
Wear 261 (2006) 328-337
88. M. Kempf, Nanohärtemessungen mit dem Rasterkraftmikroskop, Der Andere
Verlag, Osnabrück, 2002
11 References 140
89. W. C. Oliver and G. M. Pharr, An improved technique for determining
hardness and elastic modulus using load displacement sensing indentation
experiments, Journal of Materials Research 7 (1992) 1564-1583
90. http://fibics.com/FIBBasics.html
91. Digital Instruments Inc, MultiMode™ SPM Instruction Manuel, Version
4.31ce, 1996-99
92. D. Mulliah, D. Christopher, S. D. Kenny, Roger Smith, Nanoscratching of
silver (100) with a diamond tip, Nuclear Instruments and Methods in Physics
Research B202 (2003) 294-299
93. J. Wheeler, PhD Thesis Materials Science and Engineering University of
Cambridge
94. N. Sacks, The wear and corrosive-wear response of tungsten carbide-cobalt
hardmetals under woodcutting and three body abrasion conditions, PhD
thesis, University of Erlangen-Nürnberg, 2002
95. Joseph R. Davis, ASM specialty handbook: nickel, cobalt, and their alloys.
ASM International, (2000) p. 347
96. D. Banerjee, G. K. Lal and G. S: Upadhyaya, Effect of Binder-Phase
modification and Cr3C2 addition on properties of WC-10Co Cemented
carbide, Journal of Materials Engineering and Performance 4 (1995) 563-572
97. S. Luyckx and M. Zunaid Alli, Comparison between V8C7 and Cr3C2 as grain
refiners for WC-Co, Materials & Design, 22 (2001) 507-510
98. J. Zarrickson, B. Jansson, G. S. Uphadyaya and H-O. Andrén, WC-Co based
cemented carbides with large additions of Cr3C2, International Journal of
Refractory Metals and Hard Materials 16 (1998) 417-422
99. S. Co. A. Hernandez, J. Ochoa and J. Lira-Olivares, Phase relations and
mechanical properties of VC substituted WC-10Co cemented carbide alloys,
International Journal of Refractory Metals and Hard Materials 15 (1997) 205-
214
Acknowledgements
I would like to express my deepest gratitude to the following people, who helped me
throughout the course of this project. My heartfelt thanks go to:
• Prof. Dr. M. Göken, who supported and supervised this project and was also
instrumental in writing the project proposal. He encouraged me to attend a
number of international conferences which gave me a wonderful opportunity to
publish and share my work with other Scientists in my field.
• Dr. K. Durst for his supervision, helpful discussions and support
• Prof. Dr. Sockel for his assistance with the project proposal and practical
assistance
• Dr. H.W. Höppel for his scientific input and assistance in practical matters
• The German academic exchange service (DAAD) for financial support
• Thomas Sander from the Institute of construction technology at the Friedrich-
Alexander University Erlangen-Nürnberg for his assistance with sliding wear
experiments
• Dr. J. Wheeler at the University of Cambridge for assistance with scratch testing
at high loads
• Anneliese Weiß for assistance with scanning electron microscopy
• Werner Langner for his assistance with abrasive wear testing and Richard
Kosmala for his laboratory assistance
• Tina Hausöl for her assistance with writing the German summary in my thesis
• All my colleagues and friends
• My family for their love, support and constant encouragement.