
Thesis m a Hansen - fx risk management
103
i Aarhus School of Business, University of Aarhus January 2009 An empirical study of strategic approaches to foreign exchange risk management used by Danish medium-sized non-financial companies Master Thesis - M.Sc Finance and International Business Author: Marianna Andryeyeva Hansen Academic advisor: Tom Aabo, Associate Professor, PhD
-
Upload
aditya-soni -
Category
Documents
-
view
15 -
download
0
description
foreign exchange risk management
Transcript of Thesis m a Hansen - fx risk management

i
Aarhus School of Business, University of Aarhus
January 2009
An empirical study of strategic
approaches to foreign exchange risk
management used by Danish
medium-sized non-financial
companies
Master Thesis - M.Sc Finance and International Business
Author: Marianna Andryeyeva Hansen Academic advisor: Tom Aabo, Associate Professor, PhD

ii
An empirical study of strategic approaches to foreign An empirical study of strategic approaches to foreign An empirical study of strategic approaches to foreign An empirical study of strategic approaches to foreign exchange risk management used by Danish mediumexchange risk management used by Danish mediumexchange risk management used by Danish mediumexchange risk management used by Danish medium----
sized nonsized nonsized nonsized non----financial companies financial companies financial companies financial companies
Abstract:
The study empirically investigates the strategic foreign exchange risk management practice by Danish medium-sized non-financial, not-listed companies that are involved in international activities. The study shows that interaction between financial and operational hedges exists in the management of operating exposure and that operational and financial strategies are seen as complements to each other. The empirical results supported the hypothesis that the hedging strategies of the companies depend on their previously build flexibility. Multinationality and foreign exposure were significant explanatory factors for the importance and application of various hedging strategies. On the aggregate level, the risk management objective of the companies and the involvement of both the operational and financial departments in the risk management were significant factors in explaining the importance and application of the operational hedging strategies. The size of the company exhibited significance in explaining the importance and application of the financial hedging means.
Key words: risk management, operating exposure, financial instrument, operational hedging, real
options
Author: Marianna A. Hansen
Email: [email protected]
Studentno.: ma71942
Examno.: 277911
Study: M.Sc. in Finance and International Business
School: Aarhus School of Business University of Aarhus

iii
AKNOWLEDGEMENTS
I would like to express my deepest gratitude to the 368 financial directors that despite
their enormous workload found time and showed interest in my survey; to my
supervisor for his clear and constructive advises; to my dear husband for endless
support and care; to our son for being a very patient little boy for the past half a year;
and to our nearest family for their help and support…..
M.A.H.

iv
Table of context
1. Introduction .................................................................................................................. 1 2. Theoretical background................................................................................................ 3
2.1 Foreign exchange rate operating exposure............................................................. 3 2.2 Risk management of the exchange rate operating exposure .................................. 5
2.2.1 Financial and operational hedging approaches ............................................... 5 2.2.2 The real options perspective on operational hedging...................................... 7
3. Empirical literature review........................................................................................... 9 4. Research design and data collection .......................................................................... 13
4.1 Research methodology ..................................................................................... 13 4.1.1 Target population definition.......................................................................... 13 4.1.2 Questionnaire design..................................................................................... 19 4.1.3 Survey implementation ................................................................................. 21
4.2 Survey response................................................................................................. 23 4.2.1 Response rate ................................................................................................ 23 4.2.2 Survey feedback ............................................................................................ 24
4.3 Response bias..................................................................................................... 25 5. Univariate analysis of the survey data ....................................................................... 28
5.1 Descriptive statistics for the sample of the researched companies.................... 28 5.2 Descriptive statistics for survey responses..................................................... 29
6. Empirical results......................................................................................................... 52 6.1 Hypotheses setting ............................................................................................ 52 6.2 Correlation analysis .......................................................................................... 55 6.3 Regression results.............................................................................................. 55
6.2.1 Factors behind the importance of financial and operational means for a company’s risk management of foreign exchange operating exposure ..................... 56 6.2.2 Factors behind the application of financial and operational means for the companies’ risk management of foreign exchange operating exposure ................ 60 6.2.3 Limitations and robustness considerations ................................................... 63
7. Conclusions ................................................................................................................ 65 List of references............................................................................................................ 67 Appendices........................................................................................................................I

Chapter 1 INTRODUCTION
1
1. Introduction
Exchange rates represent one of the major sources of macroeconomic risk for a non-
financial company. In the long run exchange rate changes influence a company’s
volume of foreign trade, the costs of foreign purchases, alter its domestic and
international competitive profile and the structure of foreign markets in which the
company operates. These changes have a large impact on small and internationally
oriented economies (Bodnar and Gentry 1993), like Denmark. In the second part of
2008 several periodicals sounded the alarm about the downsizing of Danish export and
the weakening of the competitive position of Danish non-financial companies.1 The
situation is conditioned by a combination of the economic recession in Europe and in
the rest-world and by the strengthening of the Danish currency2. The Danish krone has
reached its strongest real value of the past 25 years and it is highly volatile compared to
other important currencies.3 The revaluation of the national currency makes Danish
products more expensive and less competitive on the world market. Therefore the
search for the optimal strategy to manage currency risks is essential for Danish non-
financial companies. This is especially true for the medium-sized companies since they
constitute a very significant part of the Danish industry structure.4
Academic works on foreign exchange risk management have also underlined the
significance of the impact of exchange rates changes on a company’s operational cash
flows and competitive position (Martin and Mauer 2003). From a theoretical
perspective the researchers agree that the correct risk management of the impact of
exchange rate changes on a company’s operations should involve strategic approaches
(Glaum, 1990). In order to improve the decision-making process the issue of
integration of strategic approaches to foreign exchange risk management should also be
addressed by practitioners. However, the empirical research of foreign exchange risk
management practice is primarily concentrated on the usage of tactical tools. Thus, the
theoretical conclusions with regards to the strategic foreign exchange risk management
are not corroborated by the actual management practice to a desirable extent. Therefore
1 See for exsample Nielsen J., “Eksporten til Tyskland ned i gear” , Børsen, d. 22.08.08, s. 22; Størup J. økonom I Fionia Bank, ”Dansk eksport sendt till tælling”; Fyens Stiftstidende, d. 27.10.2007, s. 18 and ”Store økonomiske udfodringer for Europa”, Berlingske Tidende, d. 23.08.2008, business, s. 12 2 Halskov K. , “Europa på randen af recession”, Jyllands Posten, d. 15.08. 2008, s. 12 3 Skovgaard L.E., “Historisk stærk kronekurs”, Berlingske Tidende, d. 13.07.2008, business, s. 7 4 www.danishexporter.dk/scripts/danishexporters/economy.asp

Chapter 1 INTRODUCTION
2
the aim of the present study is to fill the gap and provide additional empirical evidence
on the companies’ strategic approaches to foreign exchange risk management.
Specifically, by conducting a survey and applying univariate and regression analyses to
understand the behavior of a sample of Danish medium sized non-financial non-listed
companies that are involved in international operations in regard to the strategic foreign
exchange risk management. Therefore the central research goals are:
1. To provide empirical data about the actual and potential strategies used for the
exchange risk management by Danish medium-sized non-financial companies and in
particular, answer the question if the interaction between operational and financial
hedges exists in the actual risk management practice of companies;
2. By the means of regression analysis to examine the relations between company
specific characteristics and the importance and application of financial and
operational approaches towards the management of foreign exchange operating
exposure and particularly the companies’ adoption of various real options strategies
as a response to exchange rate changes.
The research in hand is organized as follows: section 2 provides a theoretical
background and explains the concept of operating exposure and the possible ways of its
management. Section 3 comments on previous empirical research on the topic of
strategic approaches used for the foreign exchange risk management. Section 4
describes the research methodology. Section 5 provides a descriptive statistical analysis
of the survey responses. Section 6 presents the empirical results. And finally, the
conclusion is given in section 7.

Chapter 2 THEORETICAL BACKGROUND
3
2. Theoretical background
Three types of a company’s exposure to unexpected exchange rates fluctuations are
identified in the finance management literature5. Translation exposure is exposure of
the company’s financial accounts to changes in exchange rates. It is the risk that the
financial figures reflected in the accounting statements will change their value as a
result of the translation of foreign accounts into the domestic currency. This type of
exposure is relatively easy to identify and measure since gain or loss from exchange
rate changes is recorded in financial reports. Transaction exposure is known as
exposure of the company’s future cash flows to the fluctuations in exchange rates. In
this case, the risk is attached to already establish contractual agreements with
determined future cash flows and a determined time horizon. Thus, transaction
exposure is measured by the extent to which changes in the exchange rates will effect
the domestic value of accounts receivables and payables, including loans and
investments, denominated in foreign currency during the actual time of a contract. On
the contrary, operating exposure is exposure of the possible future operating cash flows
to the changes in exchange rates during an undetermined time horizon. In this case the
risk is connected to the company’s operations and competitive position. That is why
operating exposure is also referred to by some academics as economic or competitive
exposure6. The main focus of the present thesis is on the management of operating
foreign exchange exposure by companies.
2.1 Foreign exchange rate operating exposure
Adverse movements in exchange rates with time change the macroenvironment of the
company and effect its future operating cash flows. If discounted, these cash flows
become equal to the company’s net present value (Glaum 1990). The degree to which
changes in operating cash flows will effect the company’s market value due to the
unexpected changes in the exchange rates is referred to as the foreign exchange
operating exposure of the company. Operating exposure is characterized by a longer,
undetermined time horizon compared to translation or transaction exposure. In the long
run, nominal exchange rates adjust to offset cumulative differences in foreign
countries’ rates of inflation (Lessard 1986, p. 150) so the purchasing power of home or 5 See for example Adler and Dumas (1984), Srinivasulu (1981), Lessard (1986). 6 See for example Booth and Rotenberg (1990), Belk and Edelshain (1997).

Chapter 2 THEORETICAL BACKGROUND
4
foreign currency in a given country on a certain date in the future will differ from its
anticipated value (Adler and Dumas 1984 p. 42). Thus, the company’s operating
exposure to exchange rate fluctuations is exposure to changes in real exchange rates.
That is why the exposure is broad in scope, since unexpected changes in real exchange
rates effect not only actual but also potential cash flows by the means of altering the
structure of such operational variables as cost, volume, price, revenues and by changing
the competitive position of the exposed company (Srinivasulu 1981, Lessard 1986,
Booth and Rotenberg 1990). On top of that, the exposure is enhanced by the changes in
the identities and policies of competitors, suppliers and customers (Loderer and Pichler
2000).
The risk of undesirable changes in the company’s value resulting from unexpected
changes in the real exchange rates is presented for companies across both domestic and
international markets. Choi and Kim (2003) in their analysis showed that both
internationally involved companies and companies with only domestic operations are
exposed to foreign exchange risk in the long run. The present research, however,
concerns only those companies that are at least to some degree involved in international
operations.
Considering the nature of operating exposure it is obvious that it has the greatest
consequences for a company’s development and growth compared to other types of
exposure. Glaum (1990) highlighted the concept of operating exposure as the prior
foreign exchange exposure academic concept. The results of the survey of the British
Times 1000 corporations conducted by Belk and Edelshain (1997) revealed that
operating exposure is also important for practitioners since the majority of the
companies defined this particular exposure as the most significant in the total foreign
exchange rate exposure. However, despite the fact that the companies recognize that
they are highly vulnerable to the elements of operational exposure, several studies
witnessed that in their practice the companies mostly manage transaction and
translation exposures (Lessard 1986, Hakkarainen et al 1998, Bodnar et. al 1998). The
most obvious explanation of this is that the broad scope of the operating exposure
makes it impossible to measure it only via analysis of the companies’ financial
accounts and statements. Therefore difficulties in quantification and prediction of
operating exposure due to many uncertain elements make it difficult to choose the

Chapter 2 THEORETICAL BACKGROUND
5
appropriate management tools to manage it. Furthermore, management of the long-term
exposure to currency fluctuations is costly and time consuming. It would definitely
require a great deal of the company’s resources in order to gather the necessary
information for the analysis, which means that management of the operating exposure
would be impossible for the companies restricted in their resources. Belk and Edelshain
(1997) pointed out that insufficient knowledge of the phenomenon also prevents
managers from considering all possible alternatives and make them concentrate on
exposures that can be assessed ex post. Lessard (1986) emphasized, that not all
managers realize the fact that management of the operating exposure is already
incorporated into the operational decisions of the company. The following section will
discuss the approaches that can be used for the risk management of operating exposure.
2.2 Risk management of the exchange rate operating exposure
2.2.1 Financial and operational hedging approaches
To reduce exposure to unexpected currency fluctuations in the long run, corporate risk
management can resort to financial and operational approaches (Srinivasulu 1981,
Lessard 1986, Aggarwal and Soenen 1989, Chowdhry and Howe 1999, Hommel 2003,
Carter et all. 2003, among others). Financial approach involves the usage of various
financial instruments, such as forward or futures contracts, options, and swaps. The
goal of financial hedging is to increase value by minimizing the variance of the net cash
flows. Financial instruments are considered to be an appropriate tool for minimizing the
risk from near-term exposures that have predetermined future cash flows and can be
relatively easily quantified (Srinivasulu 1981, Lessard 1986, Bodnar et al. 1995). The
potential of the financial instruments to manage operating exposure to exchange rate
changes is limited due to the broader scope of exposure, its longer time horizon and
existing uncertainty in the underlying cash flows in addition to the exchange rate
uncertainty. The elements of operating exposure effect all parts of the company and
therefore cannot be exclusively look upon as a financial phenomenon. For example,
financial means become irrelevant hedging mechanisms when changes in the exchange
rates alter the competitive position of the company or results in loss of various business
opportunities.

Chapter 2 THEORETICAL BACKGROUND
6
According to the risk management literature, management of the operating exposure
should be based on the strategic coordination of the activities in company’s financial
and operational areas. The strategic financial approach to the management of the
operating exposure is based on the proper choice of the financing base and may involve
the choice of alternative credit lines in different currencies or even in different
countries. Operational strategies may involve timing and choice of new markets and
market segments, thorough pricing, choice of alternative sourcing or production
locations, planning of production mix and production inputs. The main goal of the
operational approach is to minimize the real effects of the future changes in exchange
rates and find correct response to exchange rate changes (Glaum, 1990). Furthermore,
the involvement of the operational approaches to the foreign exchange risk
management allows a company not only to reduce exposure to exchange rate changes
but also to achieve extra profit in the presence of favorable exchange rate conditions
(Kogut and Kulatialka 1994, Bartram et al. 2005).
The significant part of the theoretical discussion and further empirical research on the
topic of strategic approaches to foreign exchange risk management is devoted to the
problem of interaction between financial and operational hedges in the management
practice of companies. Based on the real options framework, Hommel (2003) presents
arguments that for a non-financial company operational hedging is definitely a strategic
complement to financial hedging. However the extend to which each of these types of
hedging will be used depends on the company’s previous investments into operational
flexibility. In the absence of previous investments into flexibility, the company’s
hedging strategy will be, to a greater extend, built on the usage of various financial
hedging techniques. Operational hedging in this case will be used only as a substitute in
the absence of the necessary financial instruments. On the contrary, operational
flexibility incorporates various real options that provide a company with the possibility
to freely use operational and financial means as hedging compliments. Thus, a pure
exporter will mainly rely on financial instruments as a hedging strategy and a company
with subsidiaries dispersed in different locations with different currencies will be
actively involved in operational hedging by shifting production and sourcing as a
response to exchange rate movements. Chowdhry and Howe (1999) stress that
operating hedging is important for the management of the long-term exposures.
Furthermore, after examination of the conditions under which a company would resort

Chapter 2 THEORETICAL BACKGROUND
7
to operational hedging they come to the conclusion that both exchange rate and demand
uncertainty should be present. However, Hau (1999) refuted the demand uncertainty as
a necessary condition and stated that an operational response to exchange rate changes
is simply an exercising of real options incorporated into previous investments of a
company.
The ability to utilize strategic hedging techniques implies the involvement of various
corporate departments into the hedging process and the incorporation of the ways of
measurement and management of the exposure into the corporate management policy.
Srinivasulu (1981), Glaum (1990) accentuated that the policy of dealing with
unexpected currency fluctuations by the means of correctly made marketing,
production, sourcing and financial decisions must constitute a part of the long run
corporate strategy of the company. Furthermore, in order to correctly implement
strategic approaches, the financial department should closely interact with operational
departments (Lessard 1986, Capel 1997). Miller (1998) stresses that in order to assess
and manage operating exposure a company should regularly analyze its competitive
position, input supply, market demand and technological risks.
2.2.2 The real options perspective on operational hedging
The real options perspective serves as a good framework to explain possible
operational hedging strategies for the management of foreign exchange risk. The main
focus of the real options framework is on the value of flexibility (Triantis 2005).
Flexibility, incorporated in the company’s previous investments and operational
decisions, provides it with a set of real opportunities like to expand, to defer future
investments, to shut down operations completely or temporality, to switch inputs or
outputs. The available set of real opportunities allows the company not only to
minimize or shift the risk but also to benefit from the present uncertainty.
Kogut and Kulatialka (1994), argue that the operational flexibility of a company
involved in international activities is incorporated in its network of geographically
dispersed foreign subsidiaries. The existing network provides the company with a
flexibility that is equivalent to the portfolio of real options that can be exercised in
order to hedge the company’s future cash flows. Thus, depending on changes in the
exchange rates, the company’s response can for example include a shift of production

Chapter 2 THEORETICAL BACKGROUND
8
between two manufacturing plants located in different countries, the placement of a
plant in one of the foreign locations, an increase in the production in one of countries or
a decrease in the other, or an introduction of new products on the market.
In line with Kogut&Kulatialka, Allen&Pantzalis (1996) also argued that the company’s
operating flexibility built-in its international network should be perceived as portfolio
of real and financial options. These options represent the company’s possibilities to
manage operating exposure by shifting factors of production and various resources
across foreign countries within the company’s international network.
Caple (1997), Carter et al. (2003), Driouchi et al. (2006) emphasize the fact that based
on the real options framework, operational flexibility gives a company the opportunity
to exploit favorable developments in the exchange rates besides the opportunity to
minimize the negative impact of exchange rate changes. Similar to the above
mentioned academics they explained that a company can be involved in operational
hedging by realizing existing real possibilities through operational and multinational
flexibility.

Chapter 3 EMPIRICAL LITERATURE REVIEW
9
3. Empirical literature review
The empirical evidence on strategic management of operating exchange rate exposure
presented in the financial literature is rather limited. Most of the empirical studies
concerned with foreign exchange exposure risk management are devoted to the usage of
the short-term financial hedging instruments and the topic of the involvement of
strategic approaches to the foreign exchange risk management by companies is
researched only marginally. The purpose of the present chapter is to comment on the
scarce empirical research conducted on the interaction between financial and
operational approaches to foreign exchange risk management and companies’ adoption
of various real options strategies as a response to exchange rate changes.
According to the results of one the most significant surveys within the field of risk
management conducted by Bodnar et al. (1998) the majority of companies concentrate
their risk management activities on the management of directly observable near term
currency exposures. Only 12 % of the companies responded that they manage longer
term exposures and 11% manage competitive exposure. The goal of the conducted
survey was to investigate derivative usage for the risk management purpose, despite
that, they found indication that companies consider both financial and operational
means for their risk management activities. 14% of the responding companies stated
that they do not use derivatives because they can effectively manage their exposures by
resorting to various operational approaches. The researchers, however, have not
attempted to study those operational approaches more detailed and no empirical analysis
has been performed on the factors that determine the company’s choice of hedging
approaches. Furthermore, the study was conducted on a sample of large companies.
As the result of a survey conducted among large British industrial multinational
enterprises Joseph (2000) also came to the conclusion that the risk management of the
majority of the companies is based on the usage of derivatives and the companies apply
a limited number of operational strategies. According to his results the choice of
internal hedging techniques can be explained by the company’s degree of
internalization, though in general a company’s specific characteristics serve as a better
explanatory factors for company’s choice of external techniques.

Chapter 3 EMPIRICAL LITERATURE REVIEW
10
Rangan (1998) in his empirical analysis of the US, European and Japanese multinational
manufacturing companies reached the conclusion that companies do shift production in
response to the changes in exchange rates but these operational shifts are relatively
modest. However, the conclusion was made based on the analysis of the data on
industry and country level and the results were not supported by the actual data from
companies. Bradley and Moles (2002) investigated the degree to which non-financial
companies in UK that are listed on the stock market use strategic approaches in their
foreign exchange exposure management. Their survey results revealed that companies
do undertake various real action strategies as shifting the country of their sourcing of
inputs or changing their production location as the response to movements in exchange
rates. However, in line with Rangan’s conclusions, only one third of the respondents in
their study indicated that they shift productions and sourcing locations as a response to
exchange rate changes, thus operational shifts are relatively modest. Additionally, they
found that most of the companies at least to some degree attempt to match currency
denomination of costs and revenues cash flows. Besides, the companies also involve
such strategic financial instrument as the choice of currency denomination of their
foreign debt. Therefore their general conclusion is that the companies prefer to use a
combination of the financial and operational approaches in their operating exposure risk
management. Furthermore, they found the evidence that the degree of adopting strategic
approaches will be higher for those companies that have a network of foreign
subsidiaries and the degree of resorting to operational hedges is related to the extent of
involving operational departments in the foreign exposure risk management.
Allayannis et al. (2001) studied exchange rate exposure management strategies of 265
US multinational non-financial companies. According to their results a company can
benefit only from supplementary usage of financial and operational hedging techniques.
However, this study was based on the information presented in the COMPUSTAT
database and operational and financial strategies were proxied by several variables
received from the financial reports available from the companies therefore the actual
strategies of the companies were not investigated. Another empirical study of US
multinationals by Pantzalis et al. (2001) revealed that operational hedges are significant
for the management of foreign exchange risk. But this study was concerned with the
impact of operational hedges on the foreign exchange exposure itself rather than with
investigation of the operational strategies that are adopted by companies or factors that

Chapter 3 EMPIRICAL LITERATURE REVIEW
11
influence companies’ choices of operational hedges. Similar to Pantzalis, Carter et. al.
(2003) also examined the effect of both operational and financial hedging techniques on
foreign exchange exposure. According to them, financial and operational strategies are
effective mechanisms in case of both negative or positive exchange rate changes.
Furthermore according to their regression results the hypothesis that operational
hedging techniques can be considered as real options adopted by companies holds from
two perspectives. First of all, the ability of the companies to adopt operational
approaches to foreign exchange risk management is incorporated in the existing
network of foreign subsidiaries of companies. Thus the companies that have no foreign
subsidiaries do not possess those operational hedging options that the companies with
the network of foreign subsidiaries do. Second of all, the companies that adopt operational
hedges besides reducing their exposures to adverse currency movements have an option to
receive extra profits from beneficial exchange rate positions. In line with Allayannis et al.
(2001), Pantzalis et. al. (2001), Carter et. al. (2003) in a similar empirical study Choi and
Kim (2003) also examined currency exposures of US firms and found the evidence that
interaction between operational and financial hedging exists.
Marshall (2000) compared risk management practices among UK, USA and Asia
Pacific multinational corporations. He found that companies in Asia Pacific adopt
significantly different approaches to their foreign exchange exposure management than
UK and US companies. He also found that for the management of operating exposure,
pricing strategy was the most popular. The research conducted by Marshall was oriented
on the identification of regional differences for the management of transaction and
translation exposures, thus a limited amount of attention was paid to the strategies the
companies used for the management of operating exposure.
Driouchi et al.(2006) explored the relationship between the general performance of
companies and their operational capabilities from the perspective of real options.
Though this study does not directly investigate foreign exchange risk management
practice or exchange rate exposure of companies, it provided additional evidence that
the companies that posses various real options operational capabilities incorporated in
their international and operational flexibility can in general reduce risk and benefit from
advantageous opportunities. In the empirical study by Faseruk and Mushara (2008)
which focused on exchange risk management, the authors pointed on the value

Chapter 3 EMPIRICAL LITERATURE REVIEW
12
enhancing power of the combination of financial and operational foreign exchange risk
management activities. According to their results, in those cases when companies
jointly involve financial and operational hedges the market-to-book value of companies
was increased by 14% and market value-to-sales by 40%. The research however, was
only addressed to the risk management practice of large Canadian non-financial
companies and risk management activities were proxied by variables taken from the
financial statements of the companies.
Based on the sample of Danish companies two empirical studies shed some light on the
strategic approaches of foreign exchange risk management by Danish companies. Kuhn
(2007) investigated the risk management practice of Danish medium sized companies.
Though his primary interest of the research was concerned with the usage of financial
instruments, he found that about 25 % of the companies consider the usage of
operational means in general as an important tool in managing foreign exchange risk.
Using a sample of Danish listed non-financial companies Aabo and Simkins (2005)
found that interaction between financial and operational hedging techniques for foreign
exchange risk management exists and companies do use real options strategies as the
response to exchange rates changes. If taken individually, company-specific
characteristics like the company’s size, export and the number of foreign subsidiaries
failed to explain the company’s choice to undertake real options strategies. Only a
combination of the mentioned characteristics was a statistically significant explanatory
factor for the likelihood of adopting by companies real options strategies. The study,
however, was focused on large listed companies and therefore the results can not be
transferred to the medium-sized companies. Furthermore, the authors have not analyzed
the significance of the factors in explaining the companies’ choice between financial
and operational hedges.
As it is seen from the mentioned above studies, most of the empirical research on the
topic of interaction between financial and operational approaches to foreign exchange
risk management is addressed to large companies and yet little attempt is made to study
which strategies are important for the companies and to which extent those strategies
are used. The results of all the studies, however, provide direct evidence that companies
do manage foreign exchange exposure by applying strategic approaches and their
application is a significant value enhancing activity for companies.

Chapter 4 RESEARCH DESIGN AND DATA COLLECTION
13
4. Research design and data collection
4.1 Research methodology
The empirical research conducted for the purpose of the thesis is designed to provide a
“snapshot” of the strategic foreign exchange risk management practice of Danish
medium-sized companies. In order to test a range of hypotheses presented in the
academic and empirical literature on the topic and to answer the research questions
cross-sectional data was utilized. A self-completion approach was applied to collect the
data about the companies’ foreign exchange risk management practice. For this purpose
a structured electronic survey was developed and delivered to the target group of
respondent companies. Additional company specific data necessary for the research was
obtained through the web-direct database7. The following sections provide a description
of the sampling process and survey design, administering and response. A detailed
descriptive analysis of the received data will be presented in chapter 5.
4.1.1 Target population definition
The research in hand is targeting Danish medium sized non-financial companies that are
not listed on the stock exchange. The web-direct database was used in order to frame
the group of the Danish companies relevant to the research. In the database companies
are grouped into 20 economic sectors according to their economic activity based on the
NACE statistical classification of economic activities8. 1055 companies from seven
economic sectors were selected as target population for the survey based on the
presented data in the database on the 2nd October 2008. The selection process included 5
steps that are presented in the table 1 below and are discussed in detail in the following
paragraphs.
7 The WEB-DIRECT database presents data about all companies registered in Denmark and facilitates search of companies by their type, industry, accounting figures for the last 5 years, structure and ownership type, registration information, names of owners, directors and management. WEB-DIRECT is developed and supported by Experian A/S. A demo version is presented on www.kob.dk. The version used for the purpose of the thesis was available in the library of Aarhus School of Business. 8 NACE stands for "Nomenclature Generale des Activites Economiques dans I`Union Europeenne" (General Name for Economic Activities in the European Union). The system is the European standard for industry classifications. The latest version that came into effect from 01.01.2008 is based on the "International Standard Industrial Classification of all economic activities" (ISIC) of the United Nations. A detailed classification is presented in Appendix 1.

Chapter 4 RESEARCH DESIGN AND DATA COLLECTION
14
Table 1: Stages of the target population selection process
Table describes the five stages of the target population selection process and reports the number of companies included after each step.
Stage Number of companies included
Step 1 Restricting to non-financial non-listed companies 120407
Step 2 Limiting to medium sized companies:
2.1 companies that have employees between 50 and 499 3208
2.2 companies whose total balance is between 75-750 million DKK 1434
Step 3 Excluding duplicate companies 1379 Step 4 Excluding economic sectors with less than 20 companies 1307
Step 5 Excluding companies with a foreign mother company 1055
Step 1: Restricting to non-financial non-listed companies. As the first step of the
selection process from the total number of companies presented in the Web-direct
database only companies were chosen that are private and are not listed on the stock
exchange and whose main activities do not involve financial and insurance services.
Private companies were defined as those that are registered as “Aktieselskab” (A/S) or
“Anpartsselskab” (ApS) 9. Non-financial companies were defined as all those that are
not registered under section F “Financial and insurance services” in the database. As the
result 120407 companies were suggested in Web-direct. .
Step 2: Limiting to the medium-sized companies. The criteria for the medium sized
companies were chosen from the official definition of small and medium sized
companies adopted by the European commission and applicable within the EU from
January 1st, 2005. According to Commission Recommendation C (2003) 142210
three
criteria are used in order to distinguish between micro-, small- and medium- sized
enterprises. According to the definition medium sized companies are companies that
have headcount of no more than 249 employees and whose annual turnover is less than
or equal to €50 million and/or whose annual total balance sheet is less than or equal to
€43 million (see figure 1 below). However, when applying the definition it is important
to realize the three following points. First of all the EU Recommendation refers only to
the ceilings for staff and financial criteria. This means that it is stated directly that 9 “Aktieselskab” is a private business entity where shareholders share a common responsibility. “Anpartsselskab” is a private business entity with a limited responsibility. The British equivalent of “aktieselskab” and “anpartsselskab” is “public limited company” (www.ordbogen.com) 10 “Commission recommendation of 6 May 2003 concerning the definition of micro, small and medium-sized enterprises (notified under document number C (2003) 1422)”. Official Journal of the European Union, 20.05.2003.

Chapter 4 RESEARCH DESIGN AND DATA COLLECTION
15
medium sized companies should have a staff of less than 250 but it is not directly stated
that it should have no less than 50 employees (the staff criteria for small enterprises).
Figure 1: Criteria that are used for the definition of the micro-, small- and medium-sized enterprises. Source: European Commission Recommendation C (2003) 1422.
The same is true for financial criteria. This causes a problem in defining the enterprise
category in the case when, for example, the company has less than 50 employees but the
total balance is equal to € 43 million. This, nevertheless, can be indirectly resolved
through the second important issue in Recommendations. According to them, the staff
headcount criterion is considered the main criterion11. And in the case of needed
administrative simplifications, the single criteria, staff headcount, can be applied12.
Thus, for the purpose of the present research, the first criteria that was applied to find
the number of medium sized companies in the total number of non-financial non-listed
companies in Denmark was the number of employees.
Finally, it is noted in the Recommendation that the financial criteria are a necessary
addition to the staff headcount since it “grasp the real scale and performance of an
enterprise”13. Furthermore, it is possible to use one or both of the financial criteria.
However, according to §5 of the above mentioned Recommendations it is not advisable
to use annual turnover as sole financial criterion since it depends on the nature of the
economic activity of the companies14. That is why it is recommended to use in
combination with the total balance criterion. Otherwise, the total balance can be used
separately. Considering the fact that the targeted companies lie across several economic
sectors and that the indicator of the total balance was presented for all the companies in
11 OJ , L 124/37, 20.5. 2003, p. 4 12 OJ , L 124/37, 20.5. 2003, p. 7 13 OJ , L 124/37, 20.5. 2003, p. 4 14 OJ , L 124/37, 20.5. 2003, p. 5
Medium
Small
Micro
Enterprise
catogory
< 250
< 10
< 50
and/or
≤≤≤≤ €50
million
≤≤≤≤ € 43
million
≤≤≤≤ € 10
million
≤≤≤≤ € 10
million
≤≤≤≤ € 2
million
≤≤≤≤ € 2
million
Criteria
Headcount Annual
turnover
Annual total
balance

Chapter 4 RESEARCH DESIGN AND DATA COLLECTION
16
the Web-direct database, the total balance was the second criterion applied in order to
confine the group of medium sized companies.
The application of the staff and the total balance criteria was conducted in the following
way. At the beginning it was decided to choose those companies that have employees
from 50 to 250. However, there is a function for sorting companies according to the
number of employees is based on the min/max interval in web direct. Thus, it facilitates
a search for companies that have from 50 to 199 or from 50 to 499 employees.
Intuitively, larger of medium sized companies are interesting for the research since they
possess more opportunities for various strategic foreign exchange risk management
tactics. That is why it was decided to extend the upper bound and cut down total number
of 120407 to those companies that have from 50 to 499 employees. This resulted in a
list of 3208 companies.
The indicator of the total balance for the accounting year 2007 in the Web direct
database was used as the financial criteria15. In order to facilitate the search in the
database the euro equivalent was translated into Danish krone using the euro/krone
exchange rate on the 1st of January 200816 and then rounded to the whole. As the result
the criteria of total balance between 75 and 350 million DKK was obtained. However,
using the same logic as for extending upper bound of the staff headcount, the total
balance criteria was decided to be set between 75 and 750 million DKK. Finally, 1434
medium sized non-financial non-listed companies were singled out.
Step 3: Excluding duplicate companies. When initiating a search for companies across
two or more economic sectors in the Web-direct database, companies that belong to
more than one economic sector will appear on the list more than once. That is why the
list of 1434 companies was checked on duplicated companies and as the result 1379
companies were left based on their main economic activity.
Step 4: Excluding industries with less than 20 companies. Analysis of the distribution of
the 1379 companies across the economic sectors showed that in 13 out of 20 economic
15 The Web-direct database suggests a “total balance for the accounting year 2007” as a search criterion for the total balance. However, it should be noticed that the presented data for the total balance after applying the mentioned search criterion corresponds to the yearly total balance of companies with different closing dates since for some companies the accounting year is not the same as calendar year. Therefore for 717 (68%) of the companies the total balance presented with closing date 31 December 2007, for 268 (25%) – during second half of 2007 and for 70 (7%) – during first half of 2008. 16 745,425 DKK/ 100 Euro Source: http://www.x-rates.com/cgi-bin/hlookup.cgi

Chapter 4 RESEARCH DESIGN AND DATA COLLECTION
17
sectors the number of companies didn’t exceed 1% of the total selected population (see
Appendix 2 for details). That is why in order to eliminate noise in future calculations it
was decided to remove companies from economic sectors with less than 20 companies
from the target population (equivalent 1,5% of the total 1379).
Step 5: Excluding companies with a foreign mother company. Finally, companies that
have a foreign mother company were excluded from the target population. The research
in hand aims to investigate the behavior of the Danish companies in regard to the
strategic exchange risk management. In those companies that are registered in Denmark
but are subsidiaries of a foreign company, the risk management policy is mostly
determined by the holding company and reflects the specifics of the foreign
management practices. Thus companies that were stated as part of foreign holding in
the Web-direct database were excluded form the target population.
As the result of the sampling process 1055 Danish medium sized non-financial non-
listed companies were included in the target population. (See table 2 below).
Table 2: Distribution of the companies from the target population across economic
sectors
Economic activity sector Name
Industry
code N %
C MANUFACTURING 10-33 455 43.13%
F CONSTRUCTION 41-43 62 5.88%
G WHOLESALE AND RETAIL TRADE; REPAIR OF MOTOR VEHICLES AND MOTORCYCLES 45-47 308 29.19%
H TRANSPORTATION AND STORAGE 49-53 91 8.63%
J INFORMATION AND COMMUNICATION 58-63 53 5.02%
M PROFESSIONAL, SCIENTIFIC AND TECHNICAL ACTIVITIES 69-75 54 5.12%
N ADMINISTRATIVE AND SUPPORT SERVICE ACTIVITIES 77-82 32 3.03%
TOTAL 1055 100.00%
INDUSTRIALS 517 49.00%
SERVICES 538 51.00%
The majority of the companies included in the survey is represented by companies from
the “manufacturing” and the “wholesale and retail trade and repair of motor vehicles
and motorcycles” economic sectors – combined 72,32% (43,13% and 29,19%
respectively). Approximately the same number of companies, around 5% of the total
target population, was included from each of the “construction”, “information and
communication” and “professional, scientific and technical activities” sectors”. Almost

Chapter 4 RESEARCH DESIGN AND DATA COLLECTION
18
9% of the included companies were from the “transportation and storage” sector. And
the lowest number of companies equal to 3% was included from the “administrative and
support services activities” sector.
Despite the fact that companies from industries where the number of medium-sized
companies was very small were excluded from the target population, a substantial
difference in the number of companies that was included from each economic sector
was still presented. That is why it was decided to make an extra grouping of companies
according to their industry characteristics. Therefore, industries were divided into two
main groups used in the future analysis: industrials (that included sectors C
“Manufacturing” and F “Construction”) and services (that included sectors G
“Wholesale and retail trade; repair of motor vehicles and motorcycles”, H
“Transportation and storage”, J “Information and communication”, M “Professional,
scientific and technical activities” and H “Administrative and support service
activities”). Such a structural division was made based on the logic suggested by
Andersen (2005) p.38ff. The main characteristic of industrials is that their final product
is “physical” goods, whereas the final product of service companies has no physical
form. It is assumed that the business process of these two groups would be build
differently and thus there will be difference in their foreign exchange risk management
approaches.
A more aggregative division allowed us to obtain two suitable groups for further
analysis with an almost equal number of companies. The “industrial” group included
49% of companies from the target population and the “service” group – 51%. It was
decided to use this division in the descriptive and regression analyses presented in the
following chapters. The descriptive statistics for the whole target population and with
differentiation across industrial and service groups is given in table 3 below. On
average, a company included in the target population has total balance of DKK 195
million (middle value DKK 143 million) and employs 147 workers (middle value 118).
517 companies (49,00%) of companies were defined as the industrial group and 538
(51,00%) as the service group. The distribution of both the total balance and the number
of employees indicators is not normal. Both distributions are very picked and skewed to
the right. There was found no statistically significant difference in the mean values for
the indicator of the total balance separately for industrial and service group.

Chapter 4 RESEARCH DESIGN AND DATA COLLECTION
19
Table 3: Descriptive statistics for the target population of 1055 Danish medium-
sized non-financial companies
The table reports descriptive statistics for the target population of the companies consisting of the 1055 Danish non-financial medium-sized companies. The table provides data for the two indicators that were used for the definition of medium-sized companies: the total balance and the number of employees. The descriptive statistics is presented for the whole population and for the groups of industrial and service companies. P-value for the t-statistics that was estimated for comparison of mean values for two mentioned groups is also reported.
Total balance (DKK million) Number of employees
total industrials service total industrials services
min 75 75 75 50 50 50
max 745 711 745 499 498 499
skevness 1,79 1,85 1,75 1,42 1,27 1,59
kurtosiss 6,1 6,2 5,9 4,7 4,2 5,4
median 143 146 142 118 126 109
mean 195 193 198 147 155 139
t stat (p-
value) 0,5212 0,0051
n 1055 517 538 1055 517 538
% 100,00% 49,00% 51,00% 100,00% 49,00% 51,00%
On average the total balance of the industrial companies is slightly but not significantly
smaller: DKK 193 million for industrials against DKK 198 million for service
companies. However, a statistically significant difference17 was revealed in the mean
values for the indicator of the number of employees. The average number of employees
is higher for industrials (155) than for service companies (139). Therefore the service
companies included in the target population are on average slightly bigger in terms of
total balance, but industrials are significantly bigger in terms of the number of workers
employed.
4.1.2 Questionnaire design
Data on the strategic foreign exchange risk management practice of the companies is
not readily available in official databases, especially when concerning medium sized
companies. Therefore, to collect data on strategic foreign exchange risk management
practice of the Danish medium sized companies an electronic self-completed
questionnaire was developed and delivered to the target population of companies. The
structure of the questionnaire was inspired by the empirical studies conducted by Josef
(2000), Bradley and Moles (2002), Aabo and Simkins (2005), Kuhn (2007). Some
17 Significant at 1% level

Chapter 4 RESEARCH DESIGN AND DATA COLLECTION
20
questions are similar but not identical. A full version of the questionnaire is presented in
appendix 3.
The questionnaire included 23 closed-end questions concerning the international
involvement of the companies and their strategic foreign exchange risk management
approaches. The funnel approach was used to design a questionnaire. Therefore the
most general questions were asked first, followed by more specific questions. The
questionnaire was divided into two sections. Section A was designed as an introductory
section where questions concerning the international activities of the company were
asked. The research in hand is targeting only companies with international operations.
However, the population of the 1055 companies included both companies with and
without international activities since the information about the companies’ international
involvement was not presented in Web-direct. In order to eliminate companies oriented
purely on the domestic market question 1 in the in the first section was designed as a
screening question that allowed companies without international operations to terminate
the questionnaire immediately. Questions 2 –7 were designed to provide information
about the degree of the company’s international involvement and flexibility as well as to
stimulate the participants to think about their international operations and focus their
attention on the topic.
In the Section B direct questions about the company’s strategic approaches towards
foreign exchange risk management were asked. Questions 8-15 were designed to collect
information about the importance and usage of financial and operational hedges.
Questions 16-17 were concerned with the company’s actual and potential real options
strategies as the response to foreign exchange rate changes. Questions 18 – 20 were
concerned with the company’s attention to the management of operating exposure. And
finally, questions 21-23 were asked to provide data on a few control variables needed
for the future analysis.
All the questions in the survey were designed as closed-end questions therefore all of
them contained the set of predetermined answers. The category “other” in several
questions was deliberately avoided in order to lower the risk that this category would be
the most frequently chosen. Nominal, interval/ordinal and ratio scales were used in the
questions.

Chapter 4 RESEARCH DESIGN AND DATA COLLECTION
21
One potential problem that could result in a lower response rate was identified while
designing the questionnaire. The questionnaire was constructed in English while the
working language in the most of the medium-sized companies is Danish. Therefore to
minimize the risk that the respondents would terminate the survey shortly after having
begun or that the answers would be distorted, the questions were kept brief with a
simple wording and ambiguous questions or questions that include two or more issues
were avoided. The questions were arranged logically so that each coming question was
contributing to a better understanding of the following questions. Danish equivalents
were given for some specific terms. The heading of the questions was clearly indicated
and instructions on how to answer each question were given.
4.1.3 Survey implementation
To deliver the questionnaire to the target group of companies the electronic approach
was utilized. This approach was chosen because it allows a quick and cheap way to
deliver the survey to the target participants. Additionally, it provides quick response and
a high quality of data, already converted into numerical form suitable for the analysis.
The designed questionnaire was converted into electronic form as a web hosted Internet
survey by the means of the StudSurvey tool provided by the IT department of the
Aarhus School of Business. StudSurvey is a convenient tool that provides flexibility in
the design of online questionnaires because if it’s numerous incorporated functions.
Several of the functions were greatly used for the online version of the questionnaire.
First of all StudSurvey allowed us to incorporate logic in the response process by
adapting questions to the respondents based on their previous choices. Thus,
respondents that answered “no” to the 1st question18 were automatically redirected at the
end of the questionnaire and those respondents that chose category “zero” in question
519 were automatically redirected to question 8. Another important function did not
allow respondents to skip the questions. This function ensured that no questions were
left unanswered by the respondents. StudSurvey also gave the possibility to present the
questions in the needed form and order online.
The survey was conducted during the period between the 9th of October and the 5th of
December 2008. The first, invitation mail was sent on 9th of October and the last
18 Those respondents that were not internationally involved 19 Those respondents that do not have subsidiaries

Chapter 4 RESEARCH DESIGN AND DATA COLLECTION
22
reminder-mail was sent on the 26th of November. All in all one invitation mail and four
follow-ups were delivered to the respondents that contained the link to the online
questionnaire and the request to take part in the survey if possible. The mails sent to the
companies can be divided into two types (see appendix 4 for examples). Each type of
mail started with a brief description of the purpose of the survey followed by the
instruction of how to participate in the survey. The bottom of the mails contained
detailed contact information of the author of the survey. The first type of mails was
emphasizing the possibility to participate in the survey. In the second type of the mails,
the respondents were also asked to reply by email and state the reason that kept them
away from the answering the questionnaire. The invitation mails were written in
Danish and addressed to the financial director (økonomichefen) of the companies. In
order to increase the response rate, in most cases the mails were addressed personally.
The names of the financial directors as well as the email addresses of the companies
were received in Web-direct. Initially, the names of the financial directors for 859
companies out of 1055 targeted were available and email addresses were available for
996 companies. The rest of the email addresses were found on the Internet sites of the
companies. As a result, personal mails written with the specific name of the financial
director were sent to 859 (81%) companies, invitation mails addressed generally to the
financial director were delivered to 165 (16%) companies, 17 (2%) emails were sent via
web pages of companies, and for 14 (1%) companies there was found no possibility to
deliver the survey electronically.
The StudSurvey tool provides a quick and convenient way to send unlimited quantities
of the non-personal emails. However, considering that the majority of the invitation
mails were personal, it was chosen to send the emails by the regular student mail
provided by ASB. To keep further control over responses each respondent received an
identification code that the respondent inserted before logging into the survey. Thus it
was insured that only qualified respondents participated in the survey and that it was
possible to control which companies provided which responses. All responses during
the survey period were collected in the ASB server where it was possible to control the
statistics. The distribution of answers during the survey period can be seen in appendix
5. As the final step, after the survey period was over, the received responses were
downloaded from StudSurvey in the form of numerical information presented in an

Chapter 4 RESEARCH DESIGN AND DATA COLLECTION
23
excel file. Afterwards it was checked for consistency and used in the further analysis in
both Excel and the econometrical program Eviews.
4.2 Survey response
4.2.1 Response rate
The achieved response rate for the survey from the angle of the whole target population,
the economic sectors and the groups of industrial and service companies is reported in
table 4 below (see also appendix 6 for the response data). 368 companies have chosen to
take part in the survey and an overall response rate of 34,9% was achieved. The answers
were received from companies that represent all seven economic sectors included in the
research. Response rate for each sector varied from a min of 30,8% (for the sector C
“Manufacturing”) to a max of 53,7% (for the sector M “Professional, scientific and
technical activities). 53% of the answers were received from the companies defined as
service group companies and 47% from the companies defined as industrials.
Table 4: Achieved response rate for the survey
The table reports response rate for the whole target population, the companies from the seven economic sectors and the companies from the industrial and services groups. The number and the percentage of companies are given.
Response Respondents Non respondents
Economic sector
Target population
Respondents Non
respondents
have international operations
have no international operations
email received
no answer
C Manufacturing 455 43,13% 140 30.8% 315 69.2% 99 70.7% 41 29.3% 102 32.4% 213 67.6%
F Construction 62 5,88% 33 53.2% 29 46.8% 6 18.2% 27 81.8% 9 31.0% 20 69.0%
G Wholesale and retail trade; repair of motor vehicles and motorcycles
308 29,19% 98 31.8% 210 68.2% 44 44.9% 54 55.1% 52 24.8% 158 75.2%
H Transportation and storage 91 8,63% 30 33.0% 61 67.0% 11 36.7% 19 63.3% 14 23.0% 47 77.0%
J Information and communication 53 5,02% 22 41.5% 31 58.5% 7 31.8% 15 68.2% 4 12.9% 27 87.1%
M Professional scientific and technical activities
54 5,12% 29 53.7% 25 46.3% 13 44.8% 16 55.2% 3 12.0% 22 88.0%
N Administrative and support service activities
32 3,03% 16 50.0% 16 50.0% 6 37.5% 10 62.5% 6 37.5% 10 62.5%
N total 1055 100,0% 368 34,9% 687 65,1% 186 17,6% 182 17,3% 190 18,0% 497 47,1%
Industrials 517 49,0% 173 47,0% 344 50,1% 105 56,5% 68 37,4% 111 58,4% 233 46,9%
Service 538 51,0% 195 53,0% 343 49,9% 81 43,5% 114 62,6% 79 41,6% 264 53,1%

Chapter 4 RESEARCH DESIGN AND DATA COLLECTION
24
The survey responses were received from companies that have international operations
as well as companies that are oriented purely on the domestic market. Therefore the
overall response rate was spread between the companies that are not involved in
international operations (17,3%) and the internationally involved companies (17,6%).
These 17,6% represents the effective response rate. The effective response rate is
somewhat lower compared to the response rate of the significant surveys in the field of
foreign exchange risk management20. However, the 1055 companies that were contacted
for the purpose of the survey included both companies that are and are not involved into
international activities and only those companies that have international operations are
of interest to this study. Excluding not internationally involved companies from the
target group would significantly improve the effective response rate. Otherwise, the
number of the responding companies that are internationally involved is significant for
conducting statistical calculations and generalizing the results of the survey. Therefore
we conclude that the survey response is quite satisfactory.
4.2.2 Survey feedback
Various feedback was received on the survey from both companies that choose to
answer the questionnaire and that refrained from it. The feedback from companies that
participated in the survey was received thanks to the incorporated function in
StudSurvey that allowed the respondents to leave comments about the survey. Most of
the respondents that left comments pointed out that the company is a part of a holding
that effects company’s freedom to choose foreign exchange risk management strategies
and therefore this influenced their answers for the survey. However, there was presented
no exact information for all the targeted companies about to which degree the mother
company influenced the risk management policies of the daughter companies.
Considering this, it was decided to make no distinction between self-standing
companies and the companies that are part of a holding in the analysis of the responses.
Several of the respondents acknowledged the relevance of the stated survey questions.
A few of the respondents indicated that the survey was a bit too broad and answering
20 For example the response rates for the following significant surveys in the foreign exchange rate management field are: Bodnar et al. (1995) – 26.5%, Bodnar et al. (1998) – 20,7%, Marshall (2000) – 30%, Hakkarainen et al. (1998) -71%

Chapter 4 RESEARCH DESIGN AND DATA COLLECTION
25
some questions involved deeper thinking that they would prefer. None of the comments
contained any significant critique of the survey.
In the mails-reminders that was sent to the targeted population of the companies
respondents were asked in the case of refraining from answering the survey to return a
short email and possibly state the reason why they have chosen not to answer the
questionnaire. 190 companies returned an email where they indicated their
unwillingness to take part in the survey (see table 5).
Table 5: Reasons that prevented the companies from participating in the survey
The table presents the reasons that were mentioned by companies that refrained to take part in the survey. These reasons were stated in the emails sent by 190 companies.
Reason n
% to total that sent email not to participate
1 Lack of time 58 30,53%
2 English 11 5,79%
3 Have principle not to participate in any kind of survey 33 17,37%
4 Other reasons 19 10,00%
5 Stated no reason 69 36,32%
Total 190 100,00%
The majority of the companies (36,3%) that sent a message stated no reason for their
lack of participation. Only a minor number of companies (5,8% or little over 1,0% of
the all targeted companies) indicated that the English language was the reason why they
did not take part in the survey. Thus the language of the survey turned out not to be a
serious problem for the potential responders. The most widespread reason why tge
companies did not participate (30.5%) was the lack of time. This sounds very
reasonable since the questionnaire was sent during the time when the majority of the
companies were involved in the budgeting process. It is likely that these companies
represent a potential group that could help to improve the response rate if the
questionnaire had been sent out on another, less busy time of the year.
4.3 Response bias
In order to control for the factor that the sample of responded companies can be
considered as a true representative for the target population the differences in the mean
values for several financial criteria for the respondents and the non-respondents were
tested for significance. The criterion of the number of total employees and six financial
criteria (total balance, net profit, capital ratio, ROA, ROE and leverage) have been

Chapter 4 RESEARCH DESIGN AND DATA COLLECTION
26
chosen for the analysis. The financial indicators were directly taken from the Web-direct
database or were calculated based on the available information in Web-direct21.
Originally, the mean values were compared for the two subgroups of respondents and
non-respondents by the means of the econometric program EViews. To compare the
mean values the simple t-test was carried. The results of the test are presented in table 6
below.
Table 6: Comparison of the mean values of the financial indicators for the
response groups by the means of the t-test The table reports results for the t-test conducted to compare the mean values of the financial indicators for the two response groups. The mean values are reported for each financial indicator differentiated for respondents and non-respondents. The p-values for the t-statistics are provided.
Employees
(number)
Total
balance
(DKK mil)
Net profit
(DKK mil)
ROA
(%)
ROE
(%)
Leverage
(%)
Capital
ratio
(%)
Respondents (n=368) 152 199 9,7 4,1 15,2 3,5 28,5 Mean
value Non-respondents
(n=687) 144 194 10,6 5,3 13,2 4,2 29,3
t-statistics (p-value) 0,1863 0,5202 0,7103 0,2992 0,884 0,5126 0,8457
It was found that there are differences present in the mean values of the financial criteria
for the response groups. However, no statistically significant differences in the mean
values were observed for any of the indicators. Therefore, the companies that provided
the response for the survey can be viewed as true representatives for the targeted
population of companies.
However, in the present research the difference between the companies that represent
industrial and service companies is made. Furthermore, the respondents are divided
between those that are involved in international activities and those that are not.
Therefore a test for the comparison of the mean values was also conducted for the
response groups with further differentiation for industrials and service and for
internationally involved and internationally not involved companies. The t-test allows
testing the significance of the difference in the means of only two subgroups. Therefore,
in order to assess the statistical differences in the mean values of each of the financial
variable between the six groups of companies the analysis of variance (ANOVA) was
applied. The results are presented in table 7 below.
21 Presented in Web-direct: The number of employees; Total balance = Total Assets; Net profit; Capital ratio = Equity/
Share capital. Calculated: ROA = Net profit/Total assets. ROE = Net profit/Equity; Leverage = (Total assets - Equity)/Equity.

Chapter 4 RESEARCH DESIGN AND DATA COLLECTION
27
Table 7: Comparison of the mean values of the financial indicators for the
response groups by the means of ANOVA The table reports results for the analysis of variance (ANOVA) conducted to compare the mean values of the financial indicators for the six response subgroups of companies. The mean values are reported for each of the financial indicators. The p-values for the ANOVA F-statistics are provided
Respondents
with international
operations
without international
operations
Non-
respondents
Anova F-
statistic (p-
value)
Industrials 166 (n= 105) 152 (n=68) 152 (n=344) Employees
(number) Services 134 (n= 81) 152 (n= 114) 136 (n=343) 0,0273
Industrials 204 (n= 105) 177 (n=68) 193 (n=344) Total
balance
(MDKK) Services
245 (n= 81) 175 (n= 114) 195 (n=343) 0,0091
Industrials 7,9 (n= 105) 12,5 (n=68) 9,4 (n=344) Net profit
(MDKK) Services 15,5 (n= 81) 5,6 (n=114) 11,8 (n=343) 0,3709
Industrials 3,4 (n= 105) 7,8 (n=68) 4,9 (n=344) ROA (%)
Services 5,7 (n= 81) 1,5 (n= 114) 5,7 (n=343) 0,1493
Industrials 35,1 (n= 105) 15,5 (n=68) 0,5 (n=344) ROE (%)
Services 0,2 (n= 81) 16,4 (n= 114) 26,0 (n=343) 0,6158
Industrials 2,4 (n= 105) 2,4 (n=68) 3,9 (n=344) Leverage
(%) Services 2,8 (n= 81) 2,8 (n= 114) 4,5 (n=343) 0,6594
Industrials 26,8 (n= 105) 31,5 (n=68) 25,6 (n=344) Capital ratio
(%) Services 32,9 (n= 81) 20,5 (n= 114) 33,0 (n=343) 0,6053
This more differentiated comparison of the mean values revealed that some statistically
significant difference exists for the indicators of total balance and the number of
employees22 across the six response groups of companies. Looking at the mean values
for theses indicators, it is obvious that on average the responding companies that are
internationally involved are larger in terms of total balance. Furthermore, the
responding service companies with international operations are distinctively larger. In
terms of the number of workers employed, the industrial companies that are
internationally involved are on average the largest. However, a multiple comparisons
test in order to determine which of the group’s means are significantly different was not
conducted.
Statistically significant differences in the mean values of the rest of financial indicators
were not observed. Thus, generally we still maintain the conclusion reached above that
the sample of responding companies can be considered as true representatives for the
targeted population of companies.
22 Significant at 1% and 5% levels correspondently

Chapter 5 UNIVARIATE ANALYSIS OF THE SURVEY DATA
28
5. Univariate analysis of the survey data
As the result of the conducted survey various cross-sectional data on companies’
international involvement and management practice of operating foreign exchange rate
exposure was obtained. In order to analyze and summarize the results of the survey
statistically two types of analysis were performed. In the present chapter a detailed
descriptive analysis of the survey results will be given. In the following chapter the
regression analysis will be applied in order to ascertain dependencies between exchange
rate exposure management strategies used by the companies and various company
specific characteristics.
5.1 Descriptive statistics for the sample of the researched companies
As previously stated, an effective response rate of 17,63% was achieved for the
conducted survey. This corresponds to a total of 186 Danish non-financial medium-
sized companies that were included in the final sample. The descriptive statistics for the
final sample is presented in the table below.
Table 8: Descriptive statistics for the sample of 186 Danish companies
The table reports the descriptive statistics for the final sample of the researched companies consisting of the 186 Danish non-financial medium-sized companies. The table provides data for the two indicators that were used for the definition of medium-sized companies: the total balance and the number of employees. The descriptive statistics is presented for the total sample and for the groups of industrial and service companies. P-value for the t-statistics for comparison of the mean values of the indicators for the two mentioned groups is also reported.
Total balance (mil DKK) Number of employees
total industrials service total industrials services
min 75 75 76 50 51 50
max 745 591 745 498 498 450
skev 1,53 1,35 1,42 1,29 1,09 1,65
kurt 5,0 4,2 4,3 4,4 3,8 5,9
median 173 156 192 122 147 106
mean 221 204 245 152 166 134
t stat (p-value) 0,0614 0,0224
n 186 105 81 186 105 81
% 100,00% 56,45% 43,55% 100,00% 56,45% 43,55%
Companies that on average have total balance of 221 million DKK (median DKK 173
million) and employ 152 workers (median 122) per company were included in the final
sample. 105 companies (56,45%) were included from the industrial group and 81
(43,55%) from the service group. The distribution of both of the indicators, the total

Chapter 5 UNIVARIATE ANALYSIS OF THE SURVEY DATA
29
balance and the number of workers is not normal. Both distributions are picked and
skewed to the right. The distribution that is closest to normal is the distribution of the
number of workers for the industrial group of companies. There was also found a
statistically significant difference in the mean values of both indicators for the industrial
and service groups. Average total balance of the industrials is smaller (DKK 204
million) than that of the service companies (DKK 245 million). The average number of
employees is higher for industrials (166) than for service companies (134). Thus,
though the number of the service companies included in the sample is smaller, on
average they are significantly larger23 in terms of the total balance than the industrials.
On the other hand, the industrial companies included in the sample are on average larger
in terms of the number of employed workers24 than the service companies. This seems
reasonable since bigger service companies will more likely to be involved in
international activities and since the longer operational cycle of industrial companies
would involve more workers. In general we expect to find differences in the company
characteristics and in the way in which the two groups of Danish non-financial medium-
sized companies defined above, implement their foreign exchange risk management
strategies.
5.2 Descriptive statistics for survey responses
This subchapter presents detailed descriptive data for all the questions included in the
conducted survey. The answers for each question were received from 186 companies.
Answers for single question 7 are received from 121 companies since it was directed to
those companies that have subsidiaries abroad. At minimum the number and the
corresponding percentage of companies is provided for each answer option. When it
was possible the mean values were calculated and the p-value for the t-statistics used for
the comparison of the groups’ mean values was reported. For several questions the
answers were additionally summarized in a way that allowed a better understanding of
the achieved results.
The results of the survey showed that revenues and costs are the main indicators of a
company’s degree of international involvement (see table 9 below).
23 Significant at 10% level 24 Significant at 5% level

Chapter 5 UNIVARIATE ANALYSIS OF THE SURVEY DATA
30
Table 9: The degree of a company’s international involvement
The table reports the survey results for question 2: What percentage of your company’s consolidated operating revenues, operating
costs, operating assets and financial debt is in foreign currency. The total percentage and the percentage of companies from the “industrials” and “service” groups that have chosen each response category are given. In the bottom of the table the average values and the p-value for t-statistics are presented. The average values were calculated using midpoints of the intervals with min 0 and max 100%.
Revenues Costs Assets Debt
industrials service total industrial service total industrial service total industrial service total
0 5,71% 8,64% 6,99% 3,81% 3,70% 3,76% 22,86% 30,86% 26,34% 24,76% 38,27% 30,65%
1-20% 13,33% 28,40% 19,89% 37,14% 32,10% 34,95% 38,10% 25,93% 32,80% 32,38% 20,99% 27,42%
21-40% 14,29% 8,64% 11,83% 20,95% 23,46% 22,04% 17,14% 17,28% 17,20% 20,00% 12,35% 16,67%
41-60% 23,81% 13,58% 19,35% 26,67% 20,99% 24,19% 15,24% 8,64% 12,37% 16,19% 11,11% 13,98%
61-80% 21,9P0% 16,05% 19,35% 8,57% 11,11% 9,68% 5,71% 9,88% 7,53% 4,76% 9,88% 6,99%
81-99% 20,00% 20,99% 20,43% 2,86% 8,64% 5,38% 0,95% 6,17% 3,23% 1,90% 7,41% 4,30%
100% 0,95% 3,70% 2,15% 0,00% 0,00% 0,00% 0,00% 1,23% 0,54% 0,00% 0,00% 0,00%
n 105 81 186 105 81 186 105 81 186 105 81 186
average 51,8% 46,0% 49,3% 31,9% 36,2% 33,8% 21,4% 25,8% 23,3% 22,4% 25,0% 23,5%
median 50,0% 30,0% 10,0% 10,0% t-stat
(p-value) 0,2197 0,2293 0,2433 0,5053
More than 90% of the companies indicated that they have at least 1% of revenues and
costs denominated in a foreign currency. Except the two extremes (0 and 100%) the
distribution of the percentage of foreign revenues across the given intervals is almost
even for the whole sample of companies but differs from the angle of industrials and
service groups. For industrials, the majority of companies have foreign revenues
between 41-99% (65,71% of the companies). For services 28,4% of the companies have
a low percentage of foreign costs (between 1 and 20%) and 37,04% of the companies
have foreign revenues between 60-99%. The distribution of costs denominated in
foreign currency, on the other hand, is similar for the total population and separately for
the two groups of companies. 81,18% of the companies in the whole sample and
84,76% and 76,54% of the companies in industrial and service groups respectively have
foreign costs between 1 and 60%. On average the companies have 49,3% of the
revenues and 33,8% of costs denominated in foreign currency per company.25 Opposite
to revenues and costs, assets and debt are less widespread indicators of the companies’
international involvement. Only 73% of the companies in the sample have at least 1 %
of the assets in foreign currency and 69,35% have at least 1 % of foreign debt.
Furthermore, for the majority of the companies the percentage of foreign debt and assets
25 The result nicely corresponds to the result received by Kuhn (2007) who found that the average foreign revenues of the Danish medium sized companies are 47,1% and the average costs 31.2 % per company. It should be considered that on average the companies included in his sample were smaller.

Chapter 5 UNIVARIATE ANALYSIS OF THE SURVEY DATA
31
does not exceed 60% of the total debt and assets, which applies to both the total sample
and the two groups of companies. On average the companies have 23,3% of their assets
and 23,5% of their debt denominated in foreign currency per company. Generally,
looking at all the indicators of the companies’ international involvement it is obvious
that participation in business on an international scale is more relevant for Danish
medium sized companies than their “physical” presence abroad. It is also interesting to
compare the average percentages of the companies’ costs, revenues, debt and assts
denominated in foreign currency in the context of industrials and service groups.
Despite the fact that a statistically significant difference in the mean values was not
ascertained for any of the indicators, the difference in the mean values is still present.
Furthermore, one would assume that the more internationally involved group of
industrials would on average also have higher percentage of foreign currency
denominated revenues, costs, assets and debt. However, the results of the survey
witness that except revenues, service companies have on average a higher percentage of
foreign costs, debt and assets. Thus, even if among the industrials generally there are
more internationally involved companies than among service companies, those service
companies that have international activities are at least as much or in some instances
even more involved in the international business process as the industrial companies
Table 10: Operational flexibility of the company
The table reports results to survey question 3: In which of the following geographic regions does your company
receive foreign operating revenues and/or bear foreign operating costs. Panel A shows dispersion of company’s foreign operating revenues and costs along geographic regions. Panel B reports the number of geographic regions (from 0 to 8) in which a company receives foreign revenues or bear foreign costs.
Panel A
EU zone
Rest
Europe CIS US/Can
Mex/C&S
America CA/ ME EA/Pacific Africa
166 139 62 90 39 61 79 35 Operating
revenues 89,25% 74,73% 33,33% 48,39% 20,97% 32,80% 42,47% 18,82%
158 102 22 62 22 27 75 17 Operating
costs 84,95% 54,84% 11,83% 33,33% 11,83% 14,52% 40,32% 9,14%
Panel B
Average
0 1 2 3 4 5 6 7 8 total industrials services
T-stat (p-
value)
15 24 40 28 16 14 14 15 20 Operating
revenues 8,06% 12,90% 21,51% 15,05% 8,60% 7,53% 7,53% 8,06% 10,75% 3,6 3,8 3,4 0,2793
8,06% 20,97% 42,47% 57,53% 66,13% 73,66% 81,18% 89,25% 100,00%
9 45 50 42 17 10 3 2 8 Operating
costs 4,84% 24,19% 26,88% 22,58% 9,14% 5,38% 1,61% 1,08% 4,30% 2,6 2,3 3,0 0,0219
4,84% 29,03% 55,91% 78,49% 87,63% 93,01% 94,62% 95,70% 100,00%

Chapter 5 UNIVARIATE ANALYSIS OF THE SURVEY DATA
32
Most of the received foreign revenues and borne costs by companies are in the EU zone
(89,25% and 84,95% respectively) and to a lesser degree in the rest of Europe excluding
the CIS countries (74.73% and 54,84% respectively). Outside of Europe companies are
mostly involved in receiving revenues (having sales) or having costs (sourcing) in the
US, Canada and Asia/Pacific regions. Africa is the most “unpopular” region for Danish
medium-sized companies to have sales or to source.
From panel B it is obvious that the companies prefer to spread their operations across
geographic regions. The most frequently a company bears costs and/or receives
revenues in two geographic regions. The majority of the companies have costs or
revenues in 0 to 3 geographic regions (57.53% of the companies for revenues and
78,49% of the companies for costs). Only a few companies receive revenues in 6, 7 or
all 8 regions and even fewer companies bear costs in more than 4 regions. This means
that Danish medium-sized companies orient their sales on all possible geographic areas
but have only a few sourcing areas. The average number of geographic regions where
the company receives operating revenues is similar for industrials and service
companies. However, a statistically significant difference exists in the average number
of geographic zones for operating costs. Industrials bear costs on average approximately
in 2 zones and service companies approximately in 3 zones. Such difference probably
exists because services companies to a greater degree can manipulate the choice of their
sourcing locations and industrials can be more connected to their suppliers and
production facilities. The distribution of the companies’ operations across the
geographic regions26 provides evidence that to some degree companies organize their
foreign revenues and cost cash flows in the way that they partly compensate their
currency positions27. This conclusion is supported by the results presented in table 10
below and by the survey results for question 4, presented further down in the section.
The results summarized in table 10 below, are based on the answers for survey question
3. From table 10 one can see that the majority of companies organize their foreign
operational cash flows in the way that they come from similar currency zones or the
difference is no more than 2 zones and only a few companies have a substantial
difference in 5-7 zones. On average companies have a difference equal to 2 zones and 26 The eight geographic regions for the purpose of the thesis were defined as currency areas with similar currency and currency regimes based on the approaches used by Carter et al. (2003), Allayanis et al. (2001) and Kato&Uctum (2008). 27 Referred as ”natural hedges” in the further analysis.

Chapter 5 UNIVARIATE ANALYSIS OF THE SURVEY DATA
33
no statistically significant difference in the mean values was ascertained separately for
the industrial and the service groups.
Table 11: The company’s ability to implement natural hedges in their practice (a)
The table reports the results from survey question 3 summarized in a way that shows the difference in the number of currency zones in which the companies receive foreign revenues and in which they bear foreign costs. Min = 0 (no difference) and max = 7 (7 zones). The number and the percentage of companies for the specific number of zones is calculated as well as mean values for the total sample and for the two studied groups of companies. The p-value for the t-statistics is given.
Average
0 1 2 3 4 5 6 7 N total industrials service
T-stat (p-
value)
48 47 27 23 18 12 8 3 186
25,81% 25,27% 14,52% 12,37% 9,68% 6,45% 4,30% 1,61% 100,00% 2,0 2,1 1,9 0,6045
25,81% 51,08% 65,59% 77,96% 87,63% 94,09% 98,39% 100,00% -
To support the statement that natural hedges are presented in the practice of Danish
medium sized companies they were directly asked in survey question 4 if there is a
substantial difference in the currency denomination of their operating revenues and
costs. The results are presented in the table below.
Table 12: The company’s ability to implement natural hedges in their practice (b)
The table reports results to survey question 4: If you look at the currencies in which your company’s operating revenues and
operating costs are denominated, is there a match between them? 1= No match; 2= Relatively low match; 3= Match to some degree; 4= Relatively high match; 5= Complete match.
1 2 3 4 5 Mean value
N
total industrials service
T-stat (p-
value)
n 24 39 70 49 4 186
% 12,9% 21,0% 37,6% 26,3% 2,2% 100,0% cum
% 12.9% 33,87% 71.51% 97,85% 100,0% -
2,8 2,9 2,8 0,5724
The majority of the companies (37.6%) have a certain match between currencies in
which their operating revenues and costs are denominated. And overall 87,1 % of the
companies have at least some match in the currencies since only 12,9% of the
companies answered that they have no match in the currencies at all. This 12,9% is
probably equal to that group of companies that have production or sourcing in the
country with one particular currency, for example in Asia Pacific area and have sales in
the region with another currency, like fore example Europe. But on average all
companies do to some degree apply natural hedging in their practice28 and this is true
for both industrial and service companies.
28 This conclusion is similar to the one reached by Bradely and Moles (2002).
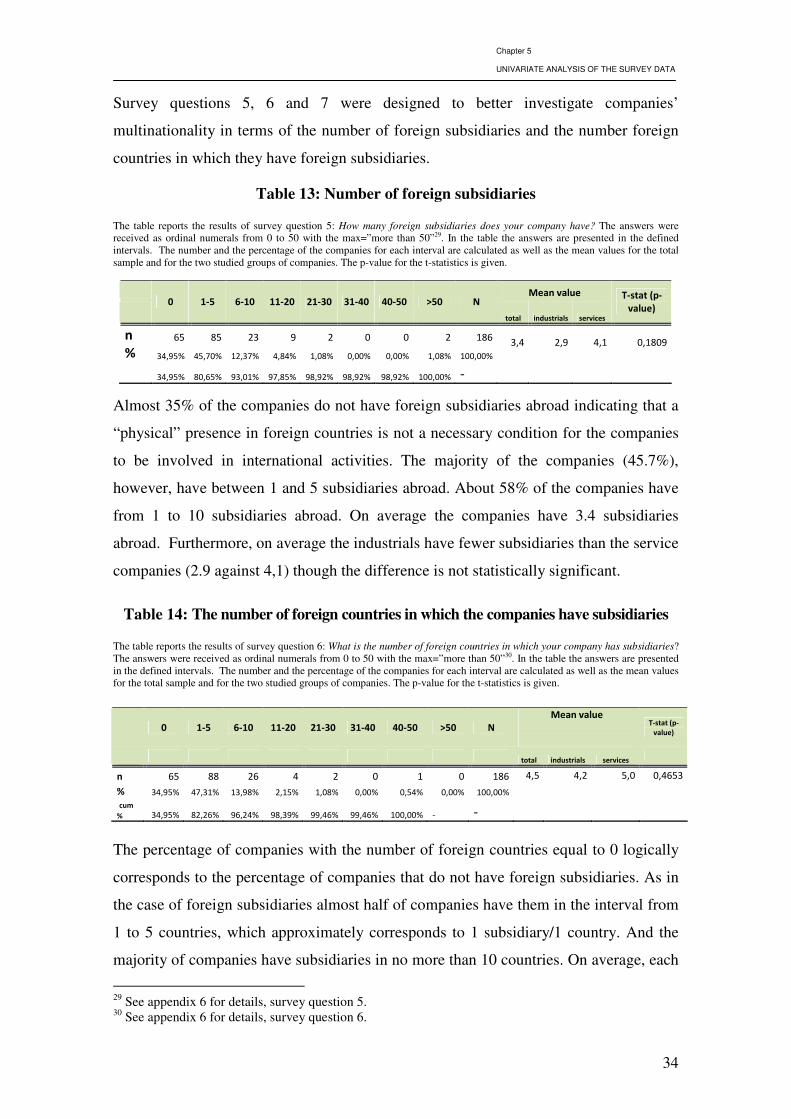
Chapter 5 UNIVARIATE ANALYSIS OF THE SURVEY DATA
34
Survey questions 5, 6 and 7 were designed to better investigate companies’
multinationality in terms of the number of foreign subsidiaries and the number foreign
countries in which they have foreign subsidiaries.
Table 13: Number of foreign subsidiaries
The table reports the results of survey question 5: How many foreign subsidiaries does your company have? The answers were received as ordinal numerals from 0 to 50 with the max=”more than 50”29. In the table the answers are presented in the defined intervals. The number and the percentage of the companies for each interval are calculated as well as the mean values for the total sample and for the two studied groups of companies. The p-value for the t-statistics is given.
Mean value
0 1-5 6-10 11-20 21-30 31-40 40-50 >50 N
total industrials services
T-stat (p-
value)
n 65 85 23 9 2 0 0 2 186
% 34,95% 45,70% 12,37% 4,84% 1,08% 0,00% 0,00% 1,08% 100,00%
3,4 2,9 4,1 0,1809
34,95% 80,65% 93,01% 97,85% 98,92% 98,92% 98,92% 100,00% -
Almost 35% of the companies do not have foreign subsidiaries abroad indicating that a
“physical” presence in foreign countries is not a necessary condition for the companies
to be involved in international activities. The majority of the companies (45.7%),
however, have between 1 and 5 subsidiaries abroad. About 58% of the companies have
from 1 to 10 subsidiaries abroad. On average the companies have 3.4 subsidiaries
abroad. Furthermore, on average the industrials have fewer subsidiaries than the service
companies (2.9 against 4,1) though the difference is not statistically significant.
Table 14: The number of foreign countries in which the companies have subsidiaries
The table reports the results of survey question 6: What is the number of foreign countries in which your company has subsidiaries? The answers were received as ordinal numerals from 0 to 50 with the max=”more than 50”30. In the table the answers are presented in the defined intervals. The number and the percentage of the companies for each interval are calculated as well as the mean values for the total sample and for the two studied groups of companies. The p-value for the t-statistics is given.
0 1-5 6-10 11-20 21-30 31-40 40-50 >50 N
Mean value
T-stat (p-
value)
total industrials services
n 65 88 26 4 2 0 1 0 186 4,5 4,2 5,0 0,4653
% 34,95% 47,31% 13,98% 2,15% 1,08% 0,00% 0,54% 0,00% 100,00%
cum
% 34,95% 82,26% 96,24% 98,39% 99,46% 99,46% 100,00% - -
The percentage of companies with the number of foreign countries equal to 0 logically
corresponds to the percentage of companies that do not have foreign subsidiaries. As in
the case of foreign subsidiaries almost half of companies have them in the interval from
1 to 5 countries, which approximately corresponds to 1 subsidiary/1 country. And the
majority of companies have subsidiaries in no more than 10 countries. On average, each
29 See appendix 6 for details, survey question 5. 30 See appendix 6 for details, survey question 6.

Chapter 5 UNIVARIATE ANALYSIS OF THE SURVEY DATA
35
company has subsidiaries in 4,5 countries. No difference in the average values was
ascertained for the industrial and service groups.
To assess the dispersion of the companies’ subsidiaries across foreign geographic
locations in more consolidated terms, the companies were also asked to name the
geographic regions in which they have subsidiaries31. For the results see table below.
Table 15: The number of geographic regions in which the companies have subsidiaries
The table reports the results of survey question 7: In which of the following geographic regions does your company have
subsidiaries? The results are reported for the 121 companies that have foreign subsidiaries. Panel A shows the dispersion of the companies’ foreign subsidiaries along geographic regions. The number and the percentage of companies for each zone are calculated. Panel B reports the number of zones (from 0 to 8) in which the companies have subsidiaries. The number and the percentage of companies for each zone are calculated as well as mean values for the total sample and for the two studied groups of companies. The p-value for the t-statistics is given.
Panel A
EU zone Rest Europe CIS US/Can
Mex/C&S
America CA/ ME EA/Pacific Africa
n 82 72 12 40 10 8 36 5
% 67,77% 59,50% 9,92% 33,06% 8,26% 6,61% 29,75% 4,13%
Panel B
Mean Value
1 2 3 4 5 6 7 8 N total industrials services
T-stat
(p-
value)
n 46 43 13 11 3 1 3 1 121
% 38,02% 35,54% 10,74% 9,09% 2,48% 0,83% 2,48% 0,83% 100,00%
1,4 1,4 1,5 0,8074
cum % 38,02% 73,55% 84,30% 93,39% 95,87% 96,69% 99,17% 100,00% -
It is obvious, that geographically the subsidiaries of the companies are concentrated in
the same geographic areas. On average a company has subsidiaries in 1.4 geographic
zones and the concentration is almost the same for both the industrial and service
companies. 73% of the companies have their subsidiaries in one or two geographic
zones. The majority of companies have their subsidiaries in the EU zone or in the rest
of Europe. The third most “popular” location is the US and Canada followed by the
Asia Pacific region. Only a few companies have subsidiaries in the CIS countries
despite the fact that these countries geographically are a part of Europe. It is clear, that
medium sized companies prefer markets with a low “psychic distance”32 and
internationalize by going to those markets that are similar to their domestic market.
31 The eight geographic regions for the purpose of the thesis were defined as currency areas with similar currency and currency regimes based on the approaches used by Carter et al. (2003), Allayanis et al. (2001) and Kato&Uctum (2008). 32 For a description of “psychic distance” in the theories of internalization see Hollensen (2007)

Chapter 5 UNIVARIATE ANALYSIS OF THE SURVEY DATA
36
The second part of the survey was mostly concerned with specific potential and actual
exchange rate exposure management strategies of the companies. The two first
questions in the section were asked in order to determine the importance of financial
and operational hedging strategies for the companies. The results of the survey for these
questions are presented in the following tables.
Table 16: The importance of financial means
The table reports survey results of question 8: In order to manage the impact of exchange rate fluctuations on your company’s
operating cash flows or competitive position, how important are the following financial means for your company? The answered was ranged from 1 = important to 5= Unimportant.
1 2 3 4 5 Mean value
Important
Somewhat
important
Neither
important or
unimportant
Somewhat
unimportant
Un-
important N total industrials services
T-stat (p-value)
51 52 18 20 45 186 Shortsighted
currency derivatives 27,4% 28,0% 9,7% 10,8% 24,2% 100,0%
2,8 2,8 2,7 0,5161
10 36 38 32 70 186 Longsighted
currency derivatives 5,4% 19,4% 20,4% 17,2% 37,6% 100,0%
3,6 3,7 3,6 0,5337
47 47 27 24 41 186 Choice of the
currency of debt
denomination 25,3% 25,3% 14,5% 12,9% 22,0% 100,0% 2,8 2,8 2,9 0,6067
Survey question 8 concerns the importance for the companies of more tactical financial
means, like shortsighted currency derivatives and more strategic financial means like
longsighted currency derivatives and the choice of the currency for debt denomination.
It is obvious that usage of shortsighted currency derivatives is of high importance for
the companies. 55.4% of the companies answered that these instruments are important
or somewhat important for them (see table 16). On average, the importance of usage of
shortsighted currency derivatives is placed between the “somewhat important” and
“neither important nor unimportant” categories. On the second place ranked after its
importance for the companies to manage their foreign exchange risk is the choice of
debt denomination. For 50,06% of companies this tool is at least somewhat important.
And on average, the importance of usage of foreign debt is also placed between the
“somewhat important” and “neither important nor unimportant” categories. The
situation is different with importance of longsighted currency derivatives. For the
majority of the companies this instrument is somewhat unimportant and the category
“unimportant” was the most frequently checked category. So, we can see that most of
the companies would choose tactical financial instruments when managing foreign
exchange exposure. In the case when they will need to apply a more strategically

Chapter 5 UNIVARIATE ANALYSIS OF THE SURVEY DATA
37
oriented approach they would rather choose foreign debt instead of longsighted
currency derivatives. The importance of the usage of all financial means is almost the
same for the companies from the industrial and service groups. Only a minor,
statistically insignificant difference was found.
Question 9 was asked to determine the importance of certain operational means for the
companies (See table 17 below). Pricing strategy was chosen to be the most important
operational instrument for companies when managing foreign exchange risk33 and
54,3% of the companies consider this instrument at least as somewhat important.
Table 17: The importance of operational means
The table reports survey results of question 9: In order to manage the impact of exchange rate fluctuations on your company’s
operating cash flows or competitive position, how important are the following operational means for your company? The answered was ranged from 1 = important to 5= Unimportant.
1 2 3 4 5 Mean value
Important
Somewhat
important
Neither
important or
unimportant
Somewhat
unimportant Unimportant N total industrials services
T-stat
(p-value)
5 28 51 18 84 186 Product mix choice 2,7% 15,1% 27,4% 9,7% 45,2% 100,0%
3,8 3,7 3,9 0,5095
13 43 40 27 63 186 Market
choice 7,0% 23,1% 21,5% 14,5% 33,9% 100,0% 3,5 3,5 3,5 0,9634
8 37 51 24 66 186 Sourcing
locations 4,3% 19,9% 27,4% 12,9% 35,5% 100,0% 3,6 3,5 3,6 0,4769
12 41 44 16 73 186 Production
locations 6,5% 22,0% 23,7% 8,6% 39,2% 100,0% 3,5 3,4 3,7 0,2460
36 65 24 14 47 186 Pricing
strategy 19,4% 34,9% 12,9% 7,5% 25,3% 100,0% 2,8 2,9 2,8 0,7376
The last important operational instrument chosen was the choice of product mix. Here,
45,2% of the companies checked the “unimportant” category. The degree of the
importance of such operational instruments as market choice, the choice of sourcing and
production locations is similar for the companies. These instruments are relatively
unimportant for the companies since on average the importance of usage of these
instruments was placed between the “neither important nor unimportant” and the
“somewhat unimportant” categories. It is interesting to notice, that the choice of
sourcing locations and the production location was not as important for the companies
as one would assume, since there is a widespread assumption that companies will
always look for “cheaper” sourcing or production locations. Furthermore, the industrial
companies’ choice of sourcing locations was slightly more important than it was for the
service companies. This also goes against the statement that for service companies
33 Finding is similar to that of Marshal (2000)

Chapter 5 UNIVARIATE ANALYSIS OF THE SURVEY DATA
38
(especially those from wholesale sector) the correct choice of sourcing location is of
high importance. The choice of production location is slightly more important for the
industrials but not to as a high degree as one would assume. The choice of production
location was not defined by service companies as completely unimportant. The
explanation to this can be that the service companies tend to perceive production
location, as the location where the company is presented “physically”. Generally, the
importance of the usage of all operational means is almost the same for the companies
from the industrial and service groups and just a minor, statistically insignificant
difference was found in the mean values for the chosen categories.
The survey results for the two previous questions indicate that in general the companies
tend to name various financial hedging means as more important than operational
means. However, from those results it is difficult to conclude something concrete about
the importance between financial and operational means. For this purpose the
companies were directly asked to define the importance between the financial and
operational means for their management of the operating foreign exchange exposure
(see the table below).
Table 18: Relative importance of financial or operational means
The table reports the survey results of the question 10: In order to manage operating exposure to currency fluctuations, what
means are important in your opinion, financial or operational? 1= Financial means are much more important; 2= Financial means are more important; 3= Financial and operational means are equally important; 4= Operational means are more important; 5 = Operational means are much more important.
1 2 3 4 5 Mean value
N
total industrials services
T-stat (p-
value)
n 24 44 55 48 15 186
% 12,9% 23,7% 29,6% 25,8% 8,1% 100,0% 2,9 3,1 2,8 0,0987
36, 6% of the companies indicated that financial means were of higher importance.
Specifically, 12,9% of the companies stated that financial means are much more
important and 23,7% that financial means are more important. However, almost the
same number of companies, 33.9%, pointed out that operational means are of higher
importance. Although, fewer companies mentioned operational means as much more
important compare to the number of companies that mentioned financial means as much
more important. Despite the fact that the majority of the companies were inclined to
pick one of the risk management approaches, financial or operational, the most

Chapter 5 UNIVARIATE ANALYSIS OF THE SURVEY DATA
39
interesting result was that the most frequently chosen category was category 3
=”Financial and operational means are equally important”. Thus the results of the
survey provide a clear indication that both financial and operational means are at the
same level of importance for the companies. These results also bear witness to a
possible interaction between financial and operational hedges, which was studied in
questioned 11 and 12 of the survey and will be discussed further below.
It is also interesting to look at the relative importance of the financial and operational
means from the perspective of the industrial and service companies. The statistically
significant difference34 was revealed in the mean values of the response categories. The
results showed that the industrials are inclined to put more weight on the importance of
the usage of operational means than the service companies. A possible explanation for
this can be that the industrials potentially have more operational flexibility in general
which allows them to resort to various operational hedging approaches. Furthermore,
the operational cycle of industrials is normally much longer than that of the service
companies, which is why the industrial companies have a more longsighted approach to
their operational decisions and strategies.
In order to explore more specifically the reasons that make the companies choose which
of the hedging approaches to apply, operational or financial, the companies were first
asked to indicate their reasons not to involve financial means and in the following
question to state their reasons for not involving operational means. The results are
presented in table 19 below. The most common reason for the companies not to involve
financial hedges was the case when currency fluctuations have no significant impact on
the companies operating cash flows and competitive position. This is a very natural
choice because if exchange rate fluctuation does not significantly alter the companies’
operating cash flows then there is no use of risk management actions. What is
interesting for our research is that the second most mentioned reason (or logically the
most important in the case when it becomes relevant for the companies to use risk
management techniques) was that companies do not involve financial means because
the exposure can be better managed by involving operational means. Thus, there was
found one more piece of evidence that the companies adopt both financial and
operational approaches in their risk management practice.
34 Significant at 10% level.

Chapter 5 UNIVARIATE ANALYSIS OF THE SURVEY DATA
40
Table 19: The company’s reasoning behind its choice not to involve
financial means in the hedging of operating exposure
The table reports the survey results for question 11: If your company's management of operating
exposure to currency fluctuations sometimes or frequently does not involve financial means, what are
the likely reasons?
Yes No Currency fluctuations has no significant impact on the company's operating cash flows and competitive position 106 56,99% 80 43,01% Operating exposure is better managed by operational means (i.e. choice of sourcing or production locations, pricing strategy etc.) 81 43,55% 105 56,45% The cost of hedging by financial means are too high
70 37,63% 116 62,37% Operating exposure cannot be quantified properly in order to be hedged by financial means 66 35,48% 120 64,52% The management of the company believes that in the long run positive and negative exchange rate changes cancel each other out
66 35,48% 120 64,52% Lack of knowledge and expertise of operating exposure
36 19,35% 150 80,65% The proper financial instruments are not available on the market
25 13,44% 161 86,56%
The third most important reason not to use financial means was that the cost of hedging
by financial means is too high. Combined with the fact that the least mentioned reason
was the absence of proper financial instruments on the market we can conclude that the
survey’s findings supported the idea that most of the needed financial instruments can
be found on the market but in some cases, especially in the long run, their usage will be
very costly for the companies.
As in the case of financial means, when the influence of exchange rate changes on the
company’s operating cash flows is insignificant, the company does no resort to risk
management actions. That is why this reason was chosen as the primary reason by
companies (see table 20 below).
Table 20: The company’s is reasoning behind its choice not to
involve operational means in the hedging of operating exposure
The table reports survey results of the question 12: If your company's management of operating
exposure to currency fluctuations sometimes or frequently does not involve operational means, what are
the likely reasons?
Yes No Currency fluctuations have no significant impact on the company's operating cash flows and competitive position 94 50,54% 92 49,46% Operating exposure is better managed by financial means
91 48,92% 95 51,08% The cost of hedging by operational means are too high
65 34,95% 121 65,05% The management of the company believes that in the long run positive and negative exchange rate changes cancel each other out
64 34,41% 122 65,59% The information needed for estimates is unavailable or uncertain
53 28,49% 133 71,51% Lack of knowledge and expertise of operating exposure
39 20,97% 147 79,03%

Chapter 5 UNIVARIATE ANALYSIS OF THE SURVEY DATA
41
Again, the direct evidence was found that in the case when companies chose no to use
operational means the first explanation would be that the exposure could be better
managed by financial means. Based solely on the results of questions 11 and 12 we
cannot affirm if the companies consider the financial and operational hedging options as
complements or substitutes to each other.
However, the survey results of questions 11 and 12 combined with the results of the
above discussed question 10 provide us with strong evidence that Danish medium-sized
non-financial companies resort to both financial and operational means in their foreign
exchange risk management practice. Furthermore, they view financial and operational
hedges as complements to each other and therefore interaction between the two
mentioned approaches exists in real practice of the companies. This conclusion is
similar to the conclusions reached by Allayannis et al. (2001), Pantzalis et. al. (2001),
Carter et. al. (2003), Choi and Kim (2003), Aabo amd Simkins (2005).
According to the survey results the companies would also choose not to involve
operational means when it is too costly for them. This was the third most important
reason. Notably, the lack of knowledge of operating exposure to prevent companies
form involving operational hedging techniques was the last chosen option and the last
most uncommon reason was the case when the information needed for estimates is
unavailable or uncertain. This means that the management of Danish medium sized non-
financial companies is interested in and spends time on understanding and
implementing various risk management hedging strategies and collecting various
information for this purpose. That is also supported by the degree of attention that the
companies have shown to the present research.
Having researched the general importance and the interaction between financial and
operational hedges, the following survey questions were mostly directed at a
specification of the actual financial and operational approaches that are used by the
companies (See table 21 below).
The majority of the companies reported that within the last year they used shortsighted
currency derivatives (54.84 % of the companies) and foreign debt (49,86 % of the
companies) within the past year.

Chapter 5 UNIVARIATE ANALYSIS OF THE SURVEY DATA
42
Table 21: The usage of financial instruments by the companies (a)
Table reports survey results for the question 13: During the last year, has your company used currency
derivatives or issued debt in foreign currency in order to manage foreign exchange risk? The total percentage of companies is not equal 100 since companies can involve more then one type of financial instruments.
Yes No Shortsighted currency derivatives
102 54,84% 84 45,16% Longsighted currency derivatives
47 25,27% 139 74,73% Debt in the foreign currency
92 49,46% 94 50,54%
One fourth of the companies resorted to the usage of longsighted currency derivatives
(25.27%). Such findings corresponds to the results received in the survey question 8
about the importance of financial means for the exchange risk management, where
companies clearly stated that shortsighted currency derivatives and foreign debt was
generally of higher importance. Furthermore, responses to question 14, can serve as
evidence that financial means are mostly used as a tactical approach to currency
exposure risk management (see table 22 below).
Table 22: The usage of financial instruments by the companies (b)
The table reports the survey results of question 14: At the present time, what is the average time horizon that your
company has covered its foreign exchange exposure by using financial means? The average time horizon is calculated as midpoints of the suggested intervals converted into moths. The max time horizon was taken as 5 years= 60 moths
Panel A
Period % cum %
0-1 months 64 34,41% 34,41%
1-3 months 29 15,59% 50,00%
3-6 months 28 15,05% 65,05%
6-12 months 32 17,20% 82,26%
1-2 years 13 6,99% 89,25%
2-5 years 10 5,38% 94,62%
> 5 years 10 5,38% 100,00%
n 186 100,00% -
If using only financial means, 82.26% of the companies covered currency exposure over
a time horizon no longer than one year. Only 7% of the companies reported that they
Panel B
Average (months): industrials 9,2
services 8,9
total 9,1
T-stat (p-value) 0,9124

Chapter 5 UNIVARIATE ANALYSIS OF THE SURVEY DATA
43
covered currency exposure between 1-2 years by the means of financial instruments.
And even a smaller percentage of the companies, equal to 5.38%, covered a longer term
exposures over 2-5 years and the same more than 5 years. This survey result also
corresponds to the previous finding of the present research where the companies
mentioned that the third most important reason that prevents them from using financial
means for management of longer term - operating exposure is the cost of existing
financial instruments. The results of question 14 are relevant for both industrial and
service companies. Both groups of companies cover their exposures on an average of 9
moths (see table 22, panel B).
According to the finance literature, companies use financial hedging instruments with
the main purpose of minimizing the variance of the net cash flow. However, there is a
possibility to receive an extra return from the usage of financial means. Question 15
addressed this issue to the companies.
Table 23: Usage of financial instruments by the companies (c)
The table reports the survey results of question 15: How often does your company’s view/forecast of exchange rates cause your
company to take the following financial actions? The number and the percentage of the companies for each category are reported as well as mean values for the total sample and for the two studied groups of companies. The p-value for the t-statistics is given.
1 2 3 Mean value
Never Sometimes Often N total industrials services
T-stat (p-value)
79 67 40 186 Alter timing of hedges
42,5% 36,0% 21,5% 100,0% 1,8 1,75 1,84 0,4480
81 70 35 186 Alter the size of hedges
43,5% 37,6% 18,8% 100,0% 1,8 17,8 1,7 0,8497
64 70 52 186 Actively take positions in currency derivatives
or issue debt in foreign currency
34,4% 37,6% 28,0% 100,0% 1,9 1,97 1,89 0,4809
The survey results for the question revealed that the majority of the companies use
financial instruments exactly with the purpose to reduce the variance of their cash flows.
The mean values for the three indicators fall between the categories “never” and
“sometimes” and are similar for both the industrials and services groups. However, in
some instances, the companies use financial instruments in order to received extra profit
from their risk management activities. 21,5% of the respondents indicated that they
often alter timing of hedges based on the company’s forecast of exchange rates, 18,8%
often alter the size of the hedges and 28% actively take positions in currency derivatives
or issue debt in foreign currency.

Chapter 5 UNIVARIATE ANALYSIS OF THE SURVEY DATA
44
Survey questions 16 and 17 directed attention to the companies’ actual and potential
usage of real options strategies as a response to foreign exchange rate changes. The
findings of these questions are reported in table 24 below and are discussed in the
following passages. When the companies resorted to various real actions as their
response to exchange rate changes the majority of the companies chose to shift supplier
to foreign locations where it became cheaper to source. One third of the companies
(33.33%) mentioned that they have undertaken such action within the past 5 years.
Table 24: The usage of real options strategies by the companies (b)
The table reports the survey results of question 16: In the past 5 years has your company undertaken any of the following actions
partly or fully due to positive or negative developments in exchange rates? and of question 17: In the following 5 years is it likely
that your company will undertake any of the following actions partly or fully due to positive or negative developments in exchange
rates? . The number and the percentages of the companies that answered yes or no to each possible strategy are presented.
Actions that have been undertaken
(question 16)
Actions that are likely to be
undertaken (question 17)
Yes No Yes No
Shift supplier to foreign locations where it
became cheaper to source due to exchange
rate changes 62 33,33% 124 66,67% 69 37,10% 117 62,90% Enter a new foreign market where your company did not have any sales or
operations before 55 29,57% 131 70,43% 65 34,95% 121 65,05% Increase capacity, accelerate resource
utilization or extend production in foreign
countries 37 19,89% 149 80,11% 49 26,34% 137 73,66% Change the composition of products sold
(change of product mix) 36 19,35% 150 80,65% 56 30,11% 130 69,89% Temporally close or reduce operations in a
foreign market 33 17,74% 153 82,26% 38 20,43% 148 79,57% Change the set of inputs or processes used
for production 27 14,52% 159 85,48% 40 21,51% 146 78,49% Shift production to foreign locations where it
became cheaper to produce due to exchange
rate changes 26 13,98% 160 86,02% 36 19,35% 150 80,65% Delay entry into a foreign market
23 12,37% 163 87,63% 29 15,59% 157 84,41% Abandon a foreign market completely
14 7,53% 172 92,47% 26 13,98% 160 86,02%
29,57% of the companies stated that they had entered a new foreign market where they
did not have any sales and operations before. This provides evidence that when
resorting to operational hedging techniques in the form of various real actions the
companies are primarily oriented on getting advantages through exchange rate changes.
To a lesser extent, in the past five year the companies resorted to such real actions as an
increase of capacity, an acceleration of resource utilization or an extension of
production in foreign countries (19.89%), a change in the composition of products sold
(19,35%), a temporally closing or reduction of operations in a foreign market (17,74%).
Interestingly, the change of product mix was the fourth most popular strategy adopted
as a response to exchange rate changes. This strategy, though, was mentioned as the last

Chapter 5 UNIVARIATE ANALYSIS OF THE SURVEY DATA
45
important when assessing the general importance of operational means for exchange
rate exposure management (see survey results for question 9). However, in question 9
the companies were asked to assess the importance of the most famous operational
hedging strategies. That is why though the change of the product mix was mentioned as
the last important it is in no way is the least important.
The survey results in question 16 also showed that the last common real options strategy
was to abandon a foreign market completely. Only 14% of the companies indicated
they resorted to this action within past five years. This again supports the idea that the
operational hedging strategies adopted by companies are mostly oriented on achieving
benefits from exchange rate changes. Therefore, if the companies would choose to
abandon a foreign market completely when the developments in exchange rates are
unfavorable they would loose the option to profit in that market if the situation should
change in a favorable direction.
When it comes to the possibility to respond to future exchange rate changes by the
means of adopting various real actions the picture is similar though the percentage of
companies that are in favor of adopting the real options strategies is somewhat higher.
These findings are supported by the results received by Aabo and Simkings (2005) in
their study of the large listed Danish companies. According to them, as the response to
the exchange rate changes 54% of the companies the will be likely to change sourcing
locations (the most common strategy) and only 19% will likely to abandon a foreign
market completely (the least common strategy).
In table 25 below the survey results for the same question 16 and 17 are presented,
though summarized in a way, which allows us to see the average number of real options
strategies that the companies have undertaken or will possibly undertake as a response
to exchange rate changes.
According to the results presented in table 25, it becomes evident that a quite high
percentage of the companies (40,86%) during the past five years have not adopted any
of the real options strategies as a response to the developments in exchange rates. The
second largest group consisting of 16.67% of the companies is represented by the
companies that have undertaken only one strategy. And in general 90% of the

Chapter 5 UNIVARIATE ANALYSIS OF THE SURVEY DATA
46
companies adopted no more than 4 real options strategies in the past five years. This
results in an average of 1,7 real actions per company.
Table 25: The usage of real options strategies by the companies (b)
The table summarizes the survey results of questions 16 and 17 in the way that shows the number and the percentage of the companies that resort to a specific number of real actions. The number of actions is from min 0 (no actions) to max 9 (all nine actions). The table also provides cumulative percentage, average for the total sample and for the two studied groups of companies. The p-value for the t-statistics is given.
Average
0 1 2 3 4 5 6 7 8 9 N total
industri
als
serv
ices
T-stat (p-
value)
76 31 25 20 17 8 4 2 1 2 186 Actual
actions 40,86% 16,67% 13,44% 10,75% 9,14% 4,30% 2,15% 1,08% 0,54% 1,08% 100,00%
1,7 1,8 1,5 0,2862
40,86% 57,53% 70,97% 81,72% 90,86% 95,16% 97,31% 98,39% 98,92% 100,00% -
78 15 19 23 17 11 10 5 4 4 186 Potential
actions 41,94% 8,06% 10,22% 12,37% 9,14% 5,91% 5,38% 2,69% 2,15% 2,15% 100,00%
2,2 2,4 1,9 0,1411
41,94% 50,00% 60,22% 72,58% 81,72% 87,63% 93,01% 95,70% 97,85% 100,00% -
The group of industrial companies is on average inclined to have a slightly higher
number of actions than the service group. The mean values were calculated as 1.8 for
the industrials and 1.5 for the service companies. However, the t-test conducted for the
comparison of the mean values for the two groups have not ascertained any statistically
significant difference.
The results for the potential strategies to be undertaking are slightly contradictive.
Despite the fact that the number of real actions that are likely to be undertaken by the
companies on average is higher (2.2 compared to 1.7), the percentage of the companies
that are unlikely to undertake any of the strategies is also higher (41,94% compared to
40,86%). However, the percentage of companies that will possibly adopt one or two
strategies is lower than that for already adopted strategies. At the same time the
percentage of companies that are considering usage of more than 2 strategies is higher
compared to that for companies that have adopted more than 2 strategies in the past 5
years. The possible explanation for such results is that those companies that have not
undertaken any of the real options strategies in the past are less likely to use this type of
foreign exchange exposure management in the future. On the contrary, those companies
that have adopted some strategies in the past will try to adopt even more strategies in
the future. In chapter 7, by the means of regression analysis we will attempt to analyze

Chapter 5 UNIVARIATE ANALYSIS OF THE SURVEY DATA
47
several factors that influence the companies’ choice to resort to real strategies for the
purpose of managing exchange rate exposure.
According to the risk management literature, in order to be able to correctly implement
financial and operational hedges when dealing with foreign exchange operating
exposure, in their practice the companies should incorporate certain management
policies. Therefore survey questions 18, 19 and 20 were designed to learn if the
companies incorporate certain types of analysis necessary for the management of
operating exposure, if their attention to the operating exposure have changed within the
past time as well as if risk management is the function belonging to only the financial
department or other departments are also involved in it.
The majority of the companies regularly perform only one type of analysis. 68.3% of
the companies indicated that they make short term (1 year or less) predictions of the
future operational cash flows (see table 26).
Table 26: Types of analysis performed by the companies for the
purpose of foreign exchange risk management
The table reports survey results of question 18: Does your company perform the following types of analysis? The number and the percentage of companies that perform certain types of analysis are reported as well as the mean values for the total sample and for the two studied groups of companies. The p-value for the t-statistics is given.
1 2 3 Mean value
Regularly Sometimes Never N total industrials services
T-stat
(p-value)
127 49 10 186 Makes short term predictions of future operational
cash flows
68,3% 26,3% 5,4% 100,0% 1,37 1,44 1,28 0,0790
43 85 58 186 Makes long term predictions of future operational
cash flows
23,1% 45,7% 31,2% 100,0% 2,08 2,06 2,11 0,6206
57 70 59 186 Makes short term predictions of exchange rates
30,6% 37,6% 31,7% 100,0% 2,01 1,88 2,88 0,0420
18 62 106 186 Makes long term predictions of exchange rates
9,7% 33,3% 57,0% 100,0% 2,47 2,46 2,49 0,7110
16 44 126 186 Analyzes the likely behavior of competitors to
possible changes in future exchange rates
8,6% 23,7% 67,7% 100,0% 2,59 2,55 2,64 0,3489
21 58 107 186 Analyzes the likely behavior of customers to
possible changes in future exchange rates
11,3% 31,2% 57,5% 100,0% 2,46 2,47 2,46 0,9233
20 71 95 186 Analyzes the likely behavior of suppliers to
possible changes in future exchange rates
10,8% 38,2% 51,1% 100,0% 2,40 2,47 2,32 0,1460

Chapter 5 UNIVARIATE ANALYSIS OF THE SURVEY DATA
48
Only one third of the companies regularly make short term predictions of exchange
rates. Notably, more than a half of the companies never make long term predictions of
exchange rates and one third of the companies never predict operational cash flows for a
period of more than 1 year. This finding is similar to the survey results received by
Bradley and Moles (2002) who found that only a minor percentage of companies make
longer-term forecasts of future cash flows. These findings are somewhat disappointing
since an implementation of a strategic approach to foreign exchange risk management
would naturally require a longer-term approach to the analysis of future operational cash
flows and exchange rates from the companies.
Furthermore, even less attention is paid by the companies to the analysis of behavior of
the competitors, customers and suppliers to possible changes in future exchange rates
More than a half of the companies stated that they do not perform such analysis.
From the perspective of the industrial and service companies the regularity of the
performance of the mentioned types of analysis is similar. The only statistically
significant difference was found in the regularity of performance of short-term
predictions of operational cash flows and exchange rates. The service companies more
regularly perform short-term predictions of operational cash flows35 and industrials
more regularly predict exchange rates in the short run36.
Despite the fact that the majority of the companies do not pay as close attention to the
longer term analysis as needed for a correct implementation of the strategic approach to
the foreign exchange risk management, for 43,5 % of the companies the general
attention to the influence of exchange rate fluctuations on the company's operations and
operating cash flows have increased (see table 27 below).
The attention to the operational exposure only decreased for 9.1% of companies.
However, it is likely that the decrease in the attention of the companies happened not
because they neglect the influence of exchange rates on operational cash flows and
competitive positioning but simply because they downsized their international
operations and concentrated on other aspects of risk management than risks from
exchange rates.
35 Significant at 10% level 36 Significant at 5% level

Chapter 5 UNIVARIATE ANALYSIS OF THE SURVEY DATA
49
Table 27: The companies’ attention to operating foreign exchange
rate exposure
The table reports the survey results of question 19: Within the last few years, has the degree of attention of your company to the
influence of exchange rate fluctuations on your company's operations and operating cash flows changed? The number and the percentage of companies are reported as well as mean values for the total sample and for the two studied groups of companies. The p-value for the t-statistics is given.
1 2 3 Mean value
has decreased has remained the
same increased N total industrials services
T-stat (p-
value)
17 88 81 186
9,1% 47,3% 43,5% 100,0% 2,34 2,29 2,42 0,1578
The findings of questions 18 and 19 are similar to the conclusion made by Lessard
(1986) that the majority of the companies pay attention to their operating exposure, but
only a few companies try to estimate it in a careful manner.
Table 28: Involvement of the companies’ departments into foreign exchange risk
management
The table reports the survey results of question 20: In your company, are the following departments (or the people responsible for
these areas) involved in the management of foreign exchange risk? The number and the percentage of are reported as well as the mean values for the total sample and for the two studied groups of companies. The p-value for the t-statistics is given.
1 2 3 Mean value
Regularly Sometimes Never N total industrials services
T-stat (p-value)
171 11 4 186 Finance
91,9% 5,9% 2,2% 100,0% 1,10 1,11 1,09 0,6100
57 84 45 186 Sales
30,6% 45,2% 24,2% 100,0% 1,94 1,85 2,05 0,0650
15 28 143 186 Marketing
8,1% 15,1% 76,9% 100,0% 2,69 2,66 2,73 0,4347
8 46 132 186 Purchasing
4,3% 24,7% 71,0% 100,0% 2,67 2,67 2,67 1,0000
47 84 55 186 Production
25,3% 45,2% 29,6% 100,0% 2,04 2,05 2,04 0,9234
As it was expected the finance department is mostly involved in the risk management
process. 91,9% of the companies responded that the finance department is involved
regularly. Besides the finance department, approximately one third of the companies
indicated that the sales and production departments are involved in the risk management
process. The marketing and purchasing departments are less involved. This indicates
that the companies do not solely rely on the finance department in their risk
management practice. This is similar to the survey results received by Bradley and
Moles (2002). However, it is surprising that the service companies on a statistically

Chapter 5 UNIVARIATE ANALYSIS OF THE SURVEY DATA
50
significantly37 less regular basis involve the sales department into the risk management
process than the industrial companies do.
The final three questions of the survey were designed to collect data on the three control
variables that could be used in the regression analysis. The survey results for these
questions are reported below. On average, the internationally involved companies that
participated in the survey have fixed assets of 33,1 % of the total assets (see table 29
below).
Table 29: Company’s fixed assets
Table reports survey results for the question 21: What are your company's fixed assets in percentage of
total assets? The number and the percentage of companies that perform certain types of analysis are reported as well as mean values for the total sample and for the two studied groups of companies. The p-value for the t-statistics is given.
Percentage
intervals n % 0 1 0,54%
1-20 64 34,41% Average (months): 21-40 57 30,65% total 33,1
41-60 40 21,51% industrials 37,8
61-80 18 9,68% services 26,9
81-99 6 3,23% T-stat (p-value) 0,0008
100 0 0,00%
186 100,00% For the industrials the average percentage is higher than for service companies. This
result is logical considering the difference in the nature of business of industrials and
service companies. The industrial group of companies have on average 37,8% of fixed
assets in the total assets and the service companies have 26,95%. The t-test conducted
for the comparison of the mean values showed that the difference is statistically
significant.
The companies were also asked to define their general attitude to the foreign exchange
risk management (see results in table 30 below). 60,2% of the companies responded that
they consider themselves as fairly risk averse, meaning that though their company
considers possibilities for extra profit from the management of foreign exchange risks,
the primary task is to minimize the negative impact of exchange rate fluctuations.
37 Significant at 10%

Chapter 5 UNIVARIATE ANALYSIS OF THE SURVEY DATA
51
Table 30: The companies’ foreign exchange risk management goal
The table reports the survey results of question 22: If you think about the general attitude of your company to
foreign exchange risk management, which of the following statements would best describe it? The number and the percentage of the companies for each category are reported as well as the mean values for the total sample and for the two studied groups of companies. The p-value for the t-statistics is given.
1 2 3 Mean value
totally risk averse fairly risk averse Risk taking N total industrial service
T-stat (p-value)
64 112 10 186
34,4% 60,2% 5,4% 100,0% 1,71 1,70 1,73 0,6908
34,4% of the companies stated that their only task is to minimize the negative impact of
exchange rate fluctuations. Only 5,4% of the companies indicated that they are risk
taking and therefore they are constantly seeking additional return from the risk
management activities. A statistically significant difference in the risk attitude for the
industrials and service group was not found.
The final question in the survey was concerned with volatility of the business
environment in which the companies operate. The results are presented in the following
table.
Table 31: The companies’ business environment
The table reports the survey results of question 23: How would you characterize the general business environment in which
your company primarily operates? The number and the percentage of the companies for each category are reported as well as the mean values for the total sample and for the two studied groups of companies. The p-value for the t-statistics is given.
1 2 3 4 5 Mean value
Very
stable
Fairly
stable
Neither stable
nor volatile
Fairly
volatile
Very
volatile
N
total industrials services
T- stat
(p-value)
12 82 35 47 10 186
6,5% 44,1% 18,8% 25,3% 5,4% 100,0%
2,8 2,7 3,0 0,0779
The majority of the companies (44,1%) assess their business environment as fairly
stable. 25,3% of the companies indicated that their business environment is fairly
volatile. Approximately the same number of companies operate in a very stable or very
volatile environment – correspondently 6.5% and 5,4% of the companies. The
conducted t-test for the comparison of the mean values of the indicator for the industrial
and service groups showed that there is statistically significant difference, though at a
10% level. Thus, on average the industrials on average operate in more stable
environment than the service companies.

Chapter 6 EMPIRICAL RESULTS
52
6. Empirical results
6.1 Hypotheses setting
The purpose of the present chapter is by the means of regression analysis to examine
relations between company specific characteristics and the importance and application
of financial and operational approaches towards the management of foreign exchange
operating exposure by Danish medium sized non-financial non-listed companies. The
possible relations that will be discussed below are based mainly on the argumentation
presented in the literature on the usage of financial and operational means for the
management of foreign exchange operating exposure and on corporate hedging in
general. Considering their logic the following hypotheses are stated:
(1) There is alternatively a positive or a negative relation between company’s size,
proxied by the total assets (TOASSET), and the importance and application of financial
and operational hedges. The bigger companies possess a previously build operational
network and can benefit from the economies of scale in the costs of hedging, therefore
they will be more readily involved in both financial and operational hedges (Nance et
al. 1993, Pantzalis et al. 2001). Smaller companies can not take advantage of a
developed operational network; however, according to Nance et al.(1993) the
possibility of financial distress will provide them with higher incentive to hedge.
(2) There is a negative relation between a company’s profitability, proxied by the
profit-to-equity ratio (ROE), and the importance and application of financial and
operational hedges. Profitable companies are less likely to experience financial distress
and therefore are less motivated to be involved in hedging (Nance et al. 1993, Géczy et
al. 1997).
(3) There is a negative relation between a company’s capital structure, proxied by the
equity-to-total assets ratio (SOLV), and the importance and application of financial
and operational hedges. The availability of the debt increases the risk of economic loss
from exchange depreciation therefore the companies will use various hedging activities
to reduce possible risk. On the contrary, the companies with a higher equity in the
capital structure will be less motivated to be involved in hedging (Froot et al. 1994,
Nance et al. 1993, Géczy et al. 1997).
Chapter 6 EMPIRICAL RESULTS
53
(4) There is alternatively a positive or a negative relation between a company’s
operational flexibility and investments in growth options, proxied by the fixed assets-to-
total assets ratio (FIXASSET), and the importance and application of operational hedges
and a positive relation with the importance and application of financial hedges.
Additionally a company’s operational flexibility and growth opportunity is a more
significant factor in explaining the importance and application of operational hedging
strategies. Fixed assets are a company’s previous investments into plant, property and
equipment, other intangible assets and R&D expenses that provide the company with
general operational flexibility and growth opportunities. To exploit these growth
opportunities require stable cash flows and sufficient internal funds from the company and
therefore the company would to a greater extent consider possible risk management
activities (Géczy et al. 1997). Furthermore the existing operating options are prerequisites
to the possible applied operational hedging strategies (Trigeorgis 1993, Driouchi 2006). On
the other hand existing fixed assets, especially those that do not have an easily
transportable physical form, like a plant or equipment, can represent a source of high
adjustment costs that will make company less inclined towards adoption of certain
operational strategies (Capel 1997).
(5) There is a positive relation between a company’s multinational network (proxied by the
number of the company’s foreign subsidiaries (FRSUB) and the number of foreign
countries in which the company has subsidiaries (FRCON)) and the importance and
application of financial and operational hedges. The international network of the
company’s subsidiaries that is spread across foreign countries and geographic regions
provides company with additional operational flexibility. A company with a developed
international network has a possibility to choose the optimal location for its activities in the
case of exchange rates fluctuations and is in a favorable position to use operational hedging
techniques. (Mello et al. 1995, Allen and Rantazalis 1996, Homel 2003, Carter et al. 2003).
Furthermore, the higher the degree of the international involvement is the higher the
foreign exchange exposure of the company will be and therefore the company will be more
intensively involved in various hedges.
(6) There is alternatively a positive or a negative relation between a company’s foreign
exchange exposure (proxied by foreign-to-total sales (FSALE), foreign-to-total
costs(FCOST) and foreign-to-total assets (FASSET) ratios) and the importance and

Chapter 6 EMPIRICAL RESULTS
54
application of financial and operational hedges. It is assumed that companies with a higher
involvement in international activities have more reasons for concern about the exchange
risk and therefore the demand for hedging will increase (Choi&Kim 2003,
Moels&Robertson 2002, Booth&Rotenberg 1990). However, company can reduce the total
exposure by matching currencies of sourcing and sales cash flows (Flood&Lessard 1986)
therefore the need for hedging will be reduced.
(7) There is a positive and significant relation between a company’s risk attitude (RKATT)
and the importance and application of operational hedging approaches. The company’s
risk management objective is directly linked to the choice of hedging tools since the choice
will depend on whether the goal of the company is exclusively to reduce risk or also to
benefit from unexpected opportunities (Belk&Glaum, 1990). The real options perspective
on operational hedging implies that operational approaches will be mostly considered by
those companies that are averse only to the downside risk and are willing to benefit from
the upside (Capel 1997).
(8) There is a positive and significant relation between the volatility of the company’s
business environment (ENVR) and the importance and application of operational hedging
approaches. According to the real options framework the volatility of the business
environment creates valuable growth opportunities therefore, the more uncertainty there is
the more valuable are for the company available real options (Carter et. al 2003).
(9) There is a positive and significant relation between a cooperation of the financial and
operational departments (DEP) for the risk management of exposure and the importance
of financial and operational hedging approaches. This cooperation will also have a
positive and significant relation with the application of operational approaches and be
insignificant for the application of financial approaches. Cooperation of the financial
department with other departments will contribute to the understanding and collection of
the comprehensive data on the company’s operating exposure. A correct application of
operational hedges would also require the participation of the operational departments
whereas the usage of financial instruments will be the prerogative of financial department
(Bradly&Moels 2002, Capel 1997).
(10) The industry characteristic will be a significant factor in explaining the importance
and application of operational and financial hedges. This is based on the fact that a

Chapter 6 EMPIRICAL RESULTS
55
(1)
company operates within certain industry and therefore its management activities
including a choice of hedging strategies will depend on the industry structure and
characteristics. Furthermore, the degree of the company’s exposure to currency
fluctuations will also vary from industry to industry (Moffet&Karlsen 1994,
Chowdhry&Howe 1999, Booth&Rotenberg 1990, Froot et al. 1993).
6.2 Correlation analysis
The analysis of the strength of association between independent variables that will be
used in the regression analysis showed that a majority of the variables have slight and
almost negligible or small relation38. A moderate correlation exists between the foreign
sale and the foreign cost variables (0.45), the foreign sale and the foreign asset (0.48)
and the foreign cost and the foreign asset (0.50). Very strong relation exists only
between the foreign subsidiaries and the foreign countries variable (0.99) which
corresponds to reality since most of the medium sized companies typically to have one
subsidiary in one country.
6.3 Regression results
The logistic regression analysis is utilized to provide empirical evidence on the
relations discussed in the section above. Considering the nature of the dependent
variables the binary probit and ordered probit regressions are estimated based on the
following general model:
1 2 3 4 5 6
7 8 9 10 11 11 11
i i i i i i i i
i i i i i i i i
Y c TOASSET ROE SOLV FIXASSET FRCON FRSUB
FSALE FCOST FASSET RKATT ENVR DEP IND
λ λ λ λ λ λ
λ λ λ λ λ λ λ ω
= + + + + + +
+ + + + + + + +
Where:
Y - the dependent variable that will be defined in sections 6.3.1 and 6.3.2
C - the constant term (relevant for the binary probit regressions)
TOASSET - the natural logarithm of the total assets of the company
ROE - the ratio of the net profit of the company to its total assets
SOLV - the ratio of the equity of the company to its total assets
FIXASSET - the percentage of the fixed assets of the company to its total assets (midpoints of intervals from survey question 21)
38 See Appendix 7 for correlation coefficients. The strength of the associations was defined based on the “rule of thumb” suggested by Hair (2003): with coefficient rage 0-0.2 slight, negligible relation, 0.21-0.4 small, 0.41-0.7 moderate, 0.71-0.90 high and 0.91-1.0 very strong relation. However, test on statistical significance of the coefficients has not been performed.

Chapter 6 EMPIRICAL RESULTS
56
FRCON - the natural logarithm of the number of foreign countries plus 1 (survey
question 6) FRSUB - the natural logarithm of the number of foreign subsidiaries plus 1 (survey
question 5) FSALE - the ratio of the foreign revenues to the total revenues of the company
(midpoints of the intervals from survey question 2) FCOST - the ratio of the foreign costs to the total costs of the company (midpoints of
the intervals from survey question 2) FASSET - the ratio of the foreign assets to the total assets of the company (midpoints of
the intervals from survey question 2) RKATT - the ordered variable coded as 1=”totally risk averse”, 2=”fairly risk
averse” 3=“risk taking” (according to survey question 22) ENVR - the ordered variable coded as 1=”very stable”, 2=”fairly stable”, 3= “not
particularly stable or volatile” 4= “fairly volatile” and 5 = “very
volatile” (according to survey question 23) DEP - the binary variable: 1 = both financial and operational departments are
involved in the risk management 0 = only financial department is involved in the risk management (according to survey question 20)
IND - the dummy: 1= the industrial company, 0 = otherwise
ω - the error term
The results of the regression analysis are presented in sections 6.3.1 and 6.3.2. The
analysis was conducted on the traditional restricted model (models 1 and 2) and the
extended models (models 3 and 4). The models 1 or 2 included the company’s size,
profitability, capital structure and operational flexibility parameters and foreign sale as
indication for foreign exposure. Because of high correlation, in model 1 the number of
foreign countries was used as a measure of multinationality and in model 2 the number
of foreign subsidiaries was used instead. Model 3 is similar to model 1 but extended by
including all foreign exposure parameters. Model 4 is a full model except that only one
measure of multinationality, the number of foreign countries, is used.
6.2.1 Factors behind the importance of financial and operational means for a
company’s risk management of foreign exchange operating exposure
To test the relations between company specific characteristics and the importance of
financial and operational approaches three ordered depended variables were used in
the regression analysis: (1) “the importance of operational means”39 (results: table 32
panel A), (2) “the importance of financial means”40 (results: table 32 panel B), (3) “the
39 From survey question 9. In the regression analysis the total summated score for the company’s response was used in the range from 5 to 25. 40 From survey question 8. In the regression analysis the total summated score for the company’s response was used in the range from 3 to 15.

Chapter 6 EMPIRICAL RESULTS
57
importance of financial or operational means”41 (results: table 32 panel C). Since the
variables (1) and (2) were measured in the direction “from important to unimportant”
the negative regression coefficient would represent the positive relation and vice versa.
For variable (3) a negative coefficient is associated with the greater importance of the
financial means and a positive with the greater importance of the operational means.
As it can be seen from table 32 that reports regression results, profitability, operational
flexibility, multinationality and foreign exposure are all significant factors that explain
the importance of operational hedging approaches for the companies (See panel A). The
multinationality (FRCON) and the foreign exposure (FSALE) measures are both
significant at a 1% level in all estimated models. Measures of operational flexibility and
profitability are significant at 10% level in all models except that the profitability
indicator is insignificant in model 4. Furthermore, according to model 4, indicators of the
risk management objective (RKATT) and the involvement of the financial and the
operational departments (DEP) are significant factors at a 5% and a 10% level
correspondently. Multinationality and foreign exposure indicators are also significant
factors in explaining the importance of financial means for the risk management of
operating exposure by the companies, both significant at a 1% level and in all estimated
models (See panel B). Other significant explanatory variables are company size
(TOASSET) and capital structure (SOLV). Capital structure is significant at a 1% level in
all the models, and company size is significant at a 10% level in models 1-3. The results
of the regressions showed that the size of a company exhibits a positive relation with the
importance of both financial and operational means (see panel A and B). However, the
factor is significant for the importance of financial means and not significant for
operational means. As it was predicted, the importance of both operational and financial
hedges is lower for more profitable companies and for the companies with higher
percentage of equity in the capital structure. However, profitability is more significant in
explaining importance of operational means and capital structure in explaining
importance of financial means. Operational flexibility and the growth opportunities factor
exhibits positive relation with the importance of financial means though the relation is
statically insignificant. The factor is significant for the importance of operational means
but the relation is negative. 41From survey question 10. Ordered variable coded as 1=financial means are much more important; 2= financial means are more important; 3=financial and operational means are equally important; 4=operational means are more important; 5=operational means are much more important.

58
Table 32: Estimated regression models for the importance of financial and operational means
The table reports the results of four regression models estimated for each of the ordered dependent variables based on the sample of 186 companies. Panel A – the dependent variable “importance of operational
means”. Panel B – the dependent variable “importance of financial means”. Panel C – the dependent variable “importance of financial or operational means”. For each variable the coefficient and p-value (stated below the coefficient) are presented. The variables that are significant at 1%-level, the 5%-level, and the 10%-level, are marked with *, **, and *** respectively. At the bottom of the table the LR statistics and the p-value (LR) are presented. TOASSET is the natural logarithm of the total assets the company; ROE - the ratio of the net profit of the company to its total assets; SOLV – the ratio of the equity of the company to its total assets; FIXASSET – the percentage of the fixed assets of the company to its total assets; FRCON – the natural logarithm of the number of foreign countries plus 1; FRSUB – the natural logarithm of the number of foreign subsidiaries plus 1; FSALE - the ratio of the foreign revenues to the total revenues of the company; FCOST - the ratio of the foreign costs to the total costs of the company; FASSET – the ratio of the foreign assets to the total assets of the company; RATT – the ordered variable coded as 1=”totally risk averse”, 2=”fairly risk averse” 3=“risk taking”; ENV - the ordered variable coded as 1=”very stable”, 2=”fairly stable”, 3= “not particularly stable or volatile” 4= “fairly volatile” and 5 = “very volatile”; DEP - 1 = both the financial and operational departments are involved in the risk management 0 = only the financial department is involved in the risk management; IND - binary variable: 1= an industrial company, 0= a service company.
PANEL A
PANEL B
PANEL C
IMPORTANCE OF OPERATIONAL MEANS
IMPORTANCE OF FINANICAL MEANS
IMPORTANCE OF FINANICAL or OPERATIONAL MEANS
Regresser Model 1
Model 2 Model 3 Model 4 Model 1
Model 2 Model 3 Model 4 Model 1 Model 2 Model 3 Model 4
TOASSET -0,0383 -0,0414 -0,0399 -0,0511 -0,2501 *** -0,2455 *** -0,2271 *** -0,2119 -0,1571 -0,1538 -0,1564 -0,1721
0,7788 0,7612 0,7707 0,7122 0,0679 0,0733 0,0987 0,1270 0,2615 0,2721 0,2659 0,2253
ROE 0,1787 *** 0,1719 *** 0,1827 *** 0,1655 0,0678 0,0666 0,0802 0,0622 0,0465 0,0468 0,0515 0,0465
0,0855 0,0975 0,0794 0,1153 0,5124 0,5198 0,4399 0,5527 0,6604 0,6584 0,6272 0,6644
SOLV 0,5549 0,5876 0,5394 0,4489 1,2454 * 1,2721 * 1,2969 * 1,2745 * 0,2794 0,2910 0,2659 0,2299
0,1605 0,1374 0,1738 0,2631 0,0018 0,0014 0,0012 0,0016 0,4873 0,4693 0,5102 0,5733
FIXASSET 0,6500 *** 0,6487 *** 0,6216 *** 0,7784 ** -0,2535 -0,2622 -0,2679 -0,2657 -0,3450 -0,3472 -0,3794 -0,3580
0,0749 0,0755 0,0896 0,0366 0,4718 0,4672 0,4593 0,4682 0,3462 0,3432 0,3023 0,3351
FRCON -0,3706 * -0,3777 * -0,3486 * -0,3016 * -0,2713 * -0,2581 *** -0,1256 -0,1312 -0,1261
0,0001 0,0001 0,0005 0,0020 0,0064 0,0990 0,2005 0,1905 0,2120
FRSUB -0,3317 * -0,2951 * -0,1273
0,0003 0,0014 0,1695
FSALE -0,7800 * -0,8086 * -0,8292 * -0,8521 * -1,1006 * -1,1044 * -0,8800 * -0,7648 ** 0,2281 0,2316 0,1967 0,1591
0,0039 0,0026 0,0062 0,0060 0,0001 0,0000 0,0037 0,0133 0,4044 0,3850 0,5222 0,6129
FCOST -0,2250 -0,2461 -0,6784 *** -0,6724 *** -0,3093 -0,3106
0,5441 0,5075 0,0693 0,0723 0,4194 0,4182
FASSET 0,3398 0,4472 -0,0925 -0,0884 0,3795 0,4080
0,3576 0,2290 0,8036 0,8133 0,3205 0,2877
RKATT -0,3625 ** -0,0039 -0,1101 0,0106 0,9777 0,4442
ENVR 0,0231 -0,0738 0,0008
0,7611 0,2984 0,9915
DEP -0,3091 *** -0,3526 ** 0,0714
0,0519 0,0265 0,6611
IND -0,1273 -0,1424 -0,1155 -0,0961 0,0773 0,0640 0,0343 0,0495 0,2737 *** 0,2682 0,2839 *** 0,2721
0,4257 0,3732 0,4767 0,5618 0,6271 0,6877 0,8317 0,7633 0,0943 0,1011 0,0872 0,1072
LR-statistic 44,0098 42,5811 44,9653 55,4553 57,1764 57,7870 61,2614 67,6325 8,1635 8,4125 9,4142 10,1890 p-value 0,0000 0,0000 0,0000 0,0000 0,0000 0,0000 0,0000 0,0000 0,3184 0,29763 0,4000 0,5994
n 186 186 186 186 186 186 186 186 186 186 186 186

59
Thus, we can consider that the previous investments in fixed assets increase the
company’s adjustment costs of operational shifts and the company mostly relies on the
existent operational structure. Or, on the other hand, the available growth opportunities
are a sign of the company’s profitability and stable position on the market that also
decreases companies need for hedging and the company will mostly rely on the short-
term financial instruments. As hypothesized, the company’s multinationality and the
degree of foreign exposure exhibit a positive and statistically significant relation with
the importance of both operational and financial means. Both measures of
multinationality used in the analysis (FRCON and FRSUB) are statistically significant
at 1%. As for foreign exposure, the traditional measure foreign sales (FSALE) is
statistically significant in all models. As for foreign costs (FCOST) and foreign assets
(FASSET) the results are different for operational and financial means. The foreign cost
indicator exhibits positive relation in both cases, but is significant only for the
importance of financial means at a 10% level. The foreign asset indicator is insignificant
in both cases however, it has a positive relation with the importance of financial means
but a negative relation with the importance of operational means.
According to the results, the indicator of the involvement of the operational and the
financial departments into risk management (DEP) has a positive and statistically
significant relation with the importance of both financial and operational approaches to
the hedging of operating exposure. This corresponds to the stated hypotheses.
Furthermore, as it was predicted, the risk management objective (RKATT) also exhibits
positive relations with the importance of both hedging approaches and is more
significant for the importance of operational means. Thus, those companies that have
their goal not only to minimize downside risk but also to benefit from the available
unexpected possibilities tend to put more weight on the importance of operational
means. Contrary to the expectation, the indicators of the volatility of the environment in
which the company operates and the industry characteristics are insignificant based on
the results of the analysis. Notably, the volatility of the business environment exhibits a
negative relation with the importance of operational means but a positive with the
importance of financial means.
The regression results for the importance of financial or operational means for the
companies are unexpected (see panel C). The dependent variable represents the

60
company’s opinion about which of the two approaches is more important for the
company. None of the explanatory factors used in the analysis exhibits statistically
significant relation with the dependant variable. In model 1 and 3 the industry indicator
was significant though only at a 10% level. However, this should not be taken into
consideration because all models have an insignificant explanatory power. Various
explanations can be given to this fact. We can claim that the answers of the companies
on the question are subjective to a certain degree. On the other hand, considering the
separate results of the regressions for the operational and financial hedges as well as
descriptive survey results it is obvious that there is a close interaction between the
operational and financial approaches in the practice of the companies. Thus on an
general base it is difficult to give preference to each of the hedging approaches
objectively. Therefore, the insignificant coefficients in the regressions can serve as a
sign of significant interaction between the operational and financial hedges.
Furthermore, if the interaction is really significant then the factors that influence the
importance between these two approaches to risk management will be more company
specific, considering each business case separately, and thus the analysis should be
made on a less aggregate level with another set of explanatory factors or by the means
of a case study. Therefore we would remain prudent in our guesses about the results in
panel C and would emphasize that further empirical research on the matter is desirable.
6.2.2 Factors behind the application of financial and operational means for
the companies’ risk management of foreign exchange operating exposure
To test the relations between company specific characteristics and the actual and potential
application of financial and operational approaches to the management of operating
foreign exchange exposure the four models discussed above were estimated. The analysis
was conducted for the two ordered and two binary dependent variables. The ordered
dependent variables were defined as (1) “real actions undertaken”42 (results: table 33
panel A) and (2) “real actions potential”43 (results: table 33 panel B). The binary
dependent variables were defined as (3) “shortsighted financial means used”44 (results:
42 Based on the answers for survey question 16. Ordered variable in the range from 0 = no real actions undertaken to max 9 = real actions undertaking. 43 Based on the answers for survey question 17. Ordered variable in the range from 0 = no real actions to undertake potentially to max 9 = real actions to undertake potentially. 44 Based on the answers for survey question 13. Binary variable: 1= shortsighted derivatives were used; 0 = no shortsighted derivatives were used.

61
table 33 panel C) and (4) “longsighted financial means used”45 (results: table 33 panel
D). In all the four sets of regressions the positive regression coefficient would represent
the positive relation and vice versa.
According to the regression results reported in table 33 multinationality, proxied by
either the number of foreign countries (FRCON) or the number of foreign subsidiaries
(FSUB) and operating exposure, proxied by the percentage of foreign sale (FSALE) are
significant factors that explain the companies’ decision to implement operational
strategies. The higher a company’s exposure and the higher degree of multinationality
the more it was inclined to respond with various real actions on the exchange rate
changes. Furthermore, the risk objective of companies (RKATT) and the involvement
of the financial department (DEP) were other factors that have a positive and significant
relation with the company’s decision to use operational shifts in the past five years as
response to fluctuations in exchange rates. These results support the conclusions made
in the previous section about the importance of operational means and the stated
hypotheses. On the other hand, when it comes to the possible implementation of the real
action strategies for foreign exchange risk management, the companies put emphasis on
the operational and multinational flexibility (See panel B). The indicators of operational
flexibility and multinationality are significant in all models and exhibit positive relation
with the dependant variable. Interestingly, the indicator of operational flexibility
(FIXASSET) has negative relations with the importance of operational means (see the
section above). However, it has positive and significant relations with the possible
implementation of real actions strategies. Another interesting result is that when it
comes to the application of shortsighted financial means, the size of the company
becomes significant at a 1% factor. Showing that larger companies to a greater extend
use shortsighted derivatives. Furthermore multinationality was a more significant factor
for the usage of shortsighted derivatives than the measure of foreign exposure. This can
be seen as evidence of the fact that multinationality partly can serve as a measure of
foreign exposure. Capital structure, multinationality and foreign exposure are significant
factors that explain the companies’ implementation of the financial strategies, like
longsighted currency derivatives and foreign debt.
45 Based on the answers for the survey question 13. Binary variable: 1= longsighted derivatives and/or foreign debt were used; 0 = no longsighted derivatives and/or foreign debt were used.

62
Table 33: Estimated regression models for the usage of financial and operational means
The table reports the results for the four regression models estimated for each of the ordered dependent variables based on the sample of 186 companies. Panel A – the dependent variable “real actions undertaken”. Panel B – the dependent variable “real actions potential”. Panel C – the dependent variable “shortsighted financial means used”. Panel D – the dependent variable “longsighted financial means used”. For each variable the coefficient and p-value (stated below the coefficient) are presented. The variables that are significant at 1%-level, the 5%-level, and the 10%-level, are marked with *, **, and *** respectively. At the bottom of the table the LR statistics and the p-value (LR) are presented. TOASSET is the natural logarithm of the total assets the company; ROE - the ratio of the net profit of the company to its total assets; SOLV – the ratio of the equity of the company to its total assets; FIXASSET – the percentage of the fixed assets of the company to its total assets; FRCON – the natural logarithm of the number of foreign countries plus 1; FRSUB – the natural logarithm of the number of foreign subsidiaries plus 1; FSALE - the ratio of the foreign revenues to the total revenues of the company; FCOST - the ratio of the foreign costs to the total costs of the company; FASSET – the ratio of the foreign assets to the total assets of the company; RATT – the ordered variable coded as 1=”totally risk averse”, 2=”fairly risk averse” 3=“risk taking”; ENV - the ordered variable coded as 1=”very stable”, 2=”fairly stable”, 3= “not particularly stable or volatile” 4= “fairly volatile” and 5 = “very volatile”; DEP - 1 = both the financial and operational departments are involved in the risk management 0 = only the financial department is involved in the risk management; IND - binary variable: 1= an industrial company, 0= a service company.
PANEL A
PANEL B
PANEL C
PANEL D
REAL ACTIONS UNDERTAKEN
REAL ACTIONS POTENTIAL
SHORTSIGHTED FINANCIAL MEANS USED
LONGSIGHTED FINANCIAL MEANS USED
Regressor M1 M2 M3 M4 M1 M2 M3 M4 M1 M2 M3 M4 M1 M2 M3 M4
C n/a n/a n/a n/a n/a n/a n/a n/a -6,242 * -6,237 * -6,444 * -6,725 * 0,056 0,074 0,374 -0,271
0,004 0,004 0,003 0,003 0,979 0,970 0,861 0,904
TOASSET 0,219 0,217 0,224 0,230 0,088 0,089 0,076 0,075 0,507 * 0,506 * 0,518 * 0,525 -0,047 -0,050 -0,082 -0,060
0,126 0,130 0,120 0,116 0,537 0,533 0,597 0,604 0,005 0,005 0,005 0,004 0,790 0,780 0,651 0,740
ROE -0,064 -0,063 -0,065 -0,043 -0,034 -0,030 -0,044 -0,024 0,102 0,104 0,092 0,101 0,222 0,225 0,211 0,225
0,596 0,580 0,566 0,711 0,751 0,777 0,678 0,828 0,476 0,464 0,514 0,480 0,135 0,131 0,157 0,134
SOLV -0,321 -0,344 -0,302 -0,203 -0,070 -0,092 -0,068 0,003 -0,382 -0,403 -0,364 -0,330 -0,808 -0,838 *** -0,901 *** -0,822
0,439 0,408 0,468 0,632 0,866 0,822 0,869 0,994 0,448 0,424 0,472 0,519 0,106 0,094 0,076 0,109
FIXASSET 0,304 0,304 0,330 0,231 0,735 *** 0,731 *** 0,776 ** 0,716 *** -0,555 -0,550 -0,485 -0,492 0,508 0,518 0,465 0,449
0,438 0,438 0,403 0,565 0,057 0,058 0,046 0,068 0,229 0,233 0,299 0,297 0,269 0,260 0,321 0,343
FRCON 0,249 ** 0,259 ** 0,226 ** 0,277 * 0,268 * 0,244 * 0,247 ** 0,265 ** 0,259 0,334 * 0,275 ** 0,262**
0,013 0,012 0,030 0,006 0,010 0,020 0,049 0,039 0,046 0,009
0,036 0,048
FRSUB 0,239 ** 0,253 * 0,234 ** 0,322 *
0,012 0,008 0,048 0,007
FSALE 0,670 ** 0,678 ** 0,742 ** 0,721 ** 0,425 0,446 0,375 0,347 0,510 0,521 0,650 *** 0,641 1,023 * 1,033 * 0,571 0,582
0,020 0,018 0,022 0,030 0,139 0,120 0,250 0,299 0,132 0,122 0,094 0,106 0,003 0,003 0,140 0,143
FCOST 0,056 0,059 0,602 0,613 0,451 0,444 0,367 0,364
0,887 0,881 0,125 0,119 0,355 0,363 0,451 0,454
FASSET -0,261 -0,326 -0,370 -0,426 -0,774 -0,787 0,170 ** 1,137**
** 0,503 0,405 0,348 0,282 0,119 0,115 0,016 0,019
RKATT 0,276 *** 0,201 0,062 0,151
0,066 0,175 0,732 0,433
ENVR 0,028 0,013 0,030 0,041
0,728 0,874 0,765 0,690
DEP 0,385 ** 0,268 -0,004 -0,023
0,021 0,107 0,985 0,914
IND 0,124 0,137 0,109 0,094 0,124 0,137 0,135 0,118 0,104 0,113 0,066 0,082 -0,056 -0,074 -0,015 0,008
0,469 0,424 0,529 0,599 0,469 0,421 0,437 0,504 0,614 0,582 0,754 0,702 0,979 0,723 0,944 0,970
LR-statistic 26,9
27,1 27,3 36,8 21,7
21,2
24,3
29,0
26,7
26,8
29,4
29,6
30,5
30,8
38,7
39,6
p-value 0,000
0,000 0,001 0,000 0,003
0,003
0,004
0,004
0,000
0,000
0,001
0,003
0,000
0,000
0,000
0,000
n 186
186 186 186 186
186
186
186
186
186
186
186
186
186
186
186

63
However, only the indicator of multinationality, proxied by either the number of foreign
countries (FRCON) or the number of foreign subsidiaries (FRSUB) was a significant
factor in all models. Foreign sale as a measure of foreign exposure was significant at 1%
in model 1 and 2. And in model 3 and 4 a significant variable that proxied foreign
exchange exposure was foreign assets (significant at the conventional 5% level). In model
2 and 3 the capital structure indicator (ROE), was significant at 2% and exhibiting the
predicted negative relation. In general the received results support the stated hypothesis
about a possible direction of the relations, however many factors did not exhibit a
significant explanatory power for the companies’ application of the financial and
operational means to the management of foreign exchange operating exposure.
6.2.3 Limitations and robustness considerations
As it could be seen from the previous empirical analysis the received regression results to a
certain degree corroborate theoretical logic and provide a base for further analysis.
However, the interpretation of the results cannot be done without considering certain
limitations set by the applied research methodology.
The survey as research method is very good in collecting data from the field but is still a
subjective source. For example, the company’s definition of the importance of financial
and operational means is to a certain degree subjective since each of the respondents
will have a personal interpretation of the category “importance”. Also, the question
about the likelihood of implementation of real actions is subjective, since it is easier to
agree with a statement than to carry out the implementation in real life. Therefore,
considering the possible distortions of the empirical results set by the limitations in the
methodology, the same regression models were estimated for the service and industrial
companies separately in order to check the robustness of the results received above.
Despite the fact that in the regression analysis for the whole sample of companies the
incorporated indicator for industrials and service companies did not gain significance in
any of the estimated models there were differences present when the models were
estimated for the industrials and service companies separately (see appendix 8 for the
correlation coefficients and appendix 9 for the estimated models). The directions of the
relations between dependent and independent variables remained the same for the
importance of the operational means among the industrial companies. The variables
FRCON, FSALE, RKATT and DEP also remained significant but additionally other

64
measures of foreign exposure like FCOST and FASSET became significant. However,
the variables ROE and FIXASSET were insignificant. As for the importance of
financial means for the industrial companies, variables FIXASSET, FASSET and
RKATT changed the sign of the relations. Although all the measures of multinationality
and foreign exchange exposure kept their significance, the size of the company became
an insignificant factor. Among the service companies, the variables FCOST and
FASSET changed signs of the relation with the importance of the operational means.
Additionally, only the variables FRCON and FSALE remained as significant as in the
regression analysis for the whole sample. The variables SOLV and FASSET gained
significance instead of ROE, RKATT and DEP for the whole sample. In the
explanation of the financial means for the service companies the measures of
multinationality (FSALE) and foreign exposure (FCOST) lost their significance and
instead FASSET became a significant factor. As for the regression models for the
importance of financial or operational means, they still did not gain explanatory power
neither among the industrials nor the services companies.
There were also several changes in the relations and explanatory power between the
independent variables and the dependant variables for the actual and potential strategies of
the companies when estimated separately for the sample of the industrial and service
companies. Among the industrial companies the variable FIXASSET became significant in
explaining the undertaking of real actions but FCON became insignificant. For explaining
the potential real strategies the risk attitude factor (RKATT) became significant. As for the
financial means used size became an insignificant factor in explaining the usage of
shortsighted financial means and the variable FASSET gained significance instead of
FCOST. For the sample of the service companies the variable FSALE, RKATT and DEP
lost significance in explaining the implementation of real options strategies in the past.
Additionally, company size was the only factor that remained significant in explaining the
usage of financial shortsighted means and ROE became significant in explaining the usage
of longsighted financial means.
Generally only the measures of multinationality and foreign exposure remained quite
robust when the analysis was made on a less aggregate level and the other factors
exhibited change in relation and significance. However, some of the changes in the
direction of relation showed a better support to the theoretical predictions.

65
7. Conclusions
The present study complements the existing risk management literature by providing
empirical evidence on the strategic foreign exchange risk management practice by Danish
medium-sized non-financial not-listed companies. The empirical data obtained from the
conducted survey supports the fact that interaction between operational and financial hedges
exists in the actual risk management practice of companies and the operational and financial
strategies are seen as being complements to each other. One third of the responding
companies directly stated that operational and financial means are equally important in the
management of foreign exchange operating exposure. Furthermore, the companies indicated
that the second most important reason for not involving financial means into the risk
management of operating exposure is that the exposure can be managed by the means of
various operational strategies. Pricing strategy was named as the most popular operational
hedging strategy used by the companies. When it comes to the adoption by the companies
various real actions as a response to foreign exchange rate fluctuation, the majority of the
companies consider a shift of supplier to foreign locations where it is became cheaper to
source due to exchange rate changes.
Among the company specific factors that explain the importance and application of financial
and operational hedging approaches the measures of multinationality and foreign exposure
are undoubtedly significant as explanatory factors for the importance and application of
hedging strategies. Besides these measures, on the aggregate level the measures of
profitability and growth opportunities, the company’s risk objective and the involvement of
the operational and financial departments in the risk management process are also significant
factors in explaining the importance of operational hedges and the size of the company, its
capital structure and the involvement of the operational and financial departments are
important as an explanation of the importance of financial means. When it comes to the
analysis of the relation between company specific factors and the importance between
financial and operational means, none of the factors exhibited significance and the estimated
regression models in general did not have enough explanatory power.
As in the case of the importance of financial and operational hedging approaches, the
measures of multinationality and foreign exchange exposure are also the most significant
factors that explain the companies’ actual and potential involvement in real action strategies

66
and the usage of shortsighted and longsighted financial means. Risk management objective
and involvement of both financial and operational departments were important factors in
explaining the actual real options strategies adopted by the companies as a response to
exchange rate changes. Additionally, the presented growth opportunities are an explanatory
factor for the possible real options strategies undertaken by the companies and company’s
size is significant for explaining the usage of shortsighted financial means.
There are some limitations to the presented research. Despite the attempt design objective and
precise questions one can argue about a certain degree of subjectivity in some of the survey
questions. This is one of the possible reasons that some of the regression results were not
robust when the regressions were estimated on the restricted sample of companies. Generally,
the limitations of the research do not make the results less valuable for the decision making
process, however, the results should be interpreted with a certain degree of prudence.
Further research is also desirable. A comparable empirical study on a similar sample of
medium sized companies from countries with small and open economies like Denmark would
contribute to a better understanding and interpretation of the results achieved in the present
thesis. Analysis on a less aggregate level, like an analysis of companies from the same
industry would be advantageous and a study with follow-up interviews or case study on the
topic would also be relevant.

67
List of references 1. Aabo, T. and Simkins B.J., 2005, “Interaction between real options and financial hedging:
fact or fiction in managerial decision-making”, Review of Financial Economics 14, pp. 353 – 369.
2. Adler, M. and Dumas, B., 1984, “Exposure to currency risk: definition and measurement”. Financial Management, 13(2), pp. 41-50.
3. Aggarwal, R. and Soenen, L., 1989, “Managing persistent real changes in currency values: the roles of multinational operating strategies”, Columbia Journal of World Business, vol. 24, 3, pp. 60-67
4. Allayannis, G., Ihrig, J. and Weston, J.P., 2001, “Exchange-Rate Hedging: Financial versus Operational Strategies”, AEA Papers and Proceedings, may, pp. 391 – 395.
5. Allen, L. and Pantzalis, C., 1996. “Valuation of the operating flexibility of multinational corporations”. Journal of International Business Studies, 27, pp. 633–653.
6. Andersen, T.M., Dalim, B., Linderoth, H., 2006, ”The Danish Economy, An International Perspective”, 2nd Edition, DJOF Publishing Copenhagen.
7. Bartram, S., Dufey, G. and Frenkel, M.R., 2005, “A primer on the exposure of non-financial corporations to foreign exchange rate risks”. Journal of Multinational Financial Management 15, pp. 394-413.
8. Belk, P.A. and Edelshain D. J., 1997, “Foreign Exchange Rate Management – The Paradox”. Managerial Finance 23, pp. 5-24.
9. Belk, P.A. and Glaum, M., 1990, “The Management of Foreign Exchange Risk in UK Multinationsl: An Empirical Investigation”, Accounting and Business Research, 21,81, pp. 3-13
10. Bodnar, G.M. and Gentry, W.M., 1993, “Exchange rate exposure and industry characteristics: evidence from Canada, Japan and the USA”. Journal of International Money and Finance 12, pp. 29-45
11. Bodnar, G.M., Hayt, G.S. and Marston, R.C., 1998. Wharton Survey of Financial Risk Management by US Non-Financial Firms. Financial Management 27, pp. 70-91.
12. Booth, L. and Rotenberg, W., 1990, “Assessing Foreign Exchange Exposure: Theory and Application Using Canadian Firms” Journal of International Financial Management and Accounting 2, 1, pp. 1 – 22.
13. Bradley, K. and Moles, P., 2002, “Managing Strategic Exchange Rate Exposures: Evidence from UK firms”. Managerial Finance 28, pp. 28 - 41
14. Capel, J., 1997, “A Real Options Approach to Economic Exposure Management”. Journal of International Financial Management and Accounting 8, 2, pp. 87-113.
15. Carter, D. A., Pantzalis, C. and Simkins, B., 2003, “Asymmetric exposure to foreign-exchange risk: Financial and real options hedges implemented by U.S. multinational corporations”. Proceedings from the 7th Annual International Conference on Real Options: Theory Meets Practice. Washington, D.C.
16. Choi, J.J. and Kim, Y.C., 2003, “The Asian exposure of U.S. firms: Operational and risk

68
Management Strategies”. Pacific-Basin Finance Journal 11, pp. 121-138.
17. Chowdhry, B. abd Howe, J.T.B., 1999, “Corporate risk management for multinational corporations: financial and operational hedging policies”. European Finance Review 2, pp. 229-246
18. Driouchi, T., Battisti, G. and Bennett, D., 2006, “Downsize Risk Implications of Multinationality and Real options” Proceedings from the 10th Annual International Conference on Real Options: Theory Meets Practice, New-York City, USA, June 14-17
19. Faseruk, A. and Mishara, D.R., 2008, “An examination of US dollar risk management by Canadian non-financial firms”. Management Research News, vol. 31, 8, pp. 570-581
20. Flood, E. and Lessard, D.R., 1986, “On the measurement of operating exposure to exchange rates: conceptual approach ”. Financial management, spring, pp. 25-36
21. Froot, K. A., Scharfstein, D. S. and Stein, J. C., 1993. “Risk Management: Coordinating Corporate Investment and Financing Policies”. The Journal of Finance 48, 5, pp. 1629-1658
22. Froot, K.A., Scharfstein, D. S. and Stein, J.C., 1994. “A framework for Risk Management”. Harvard Business Review, nov.-dec., pp. 91 – 102.
23. Géczy, C., Minton, B. A., Schrand, C., 1997, “Why Firms Use Currency Derivatives.” The Journal of Finance, 52, 4, September , p. 1323-1354.
24. Glaum, M., 1990, “Strategic Management of Exchange Rate Risks”. Long Range Planning 23, 4, pp. 65 – 72.
25. Hakkarainen, A., Joseph, N., Kasanen, E. and Puttonen, V., 1998. “The Foreign Exchange Exposure Management Practices of Finnish Industrial Firms” Journal of International Financial Management and Accounting 9, 1, pp. 34 – 57.
26. Hair, J., Babin, B., Money, A. and Samouel, P., ”Essentials on Business Research Methods”. Wiley, US., 2003.
27. Hau, H., 1999, “Comment on “ Corporate risk management for multinational corporations: financial and operational hedging policies”, European Finance Review 2, pp. 247-249
28. Hollensen, S., 2007, “Global marketing: a decision-oriented approach”, N.Y., Prentice Hall/Financial times, 714 p.
29. Hommel, U., 2003, ”Financial versus operative hedging of currency risk”. Global Finance Journal 14, pp. 1-18
30. Joseph, N.L., 2000, “The choice of hedging techniques and the characteristics of UK industrial firms”. Journal of Multinational Financial Management 10, pp. 161-184.
31. Kato,I. and Uctum, M., 2008, “Choice of exchange rate regime and currency zones”. International Review of Economics and Finance, 17, pp. 436 – 456.
32. Kogut, B. and Kulatilaka, N., 1994, “Operating Flexibility, Global Manufacturing, and the Option Value of a Multinational Network”. Management Science 40, 1, pp. 123-139.
33. Kuhn, J., 2007, Corporate Risk Management and Hedging Practice by Medium-sized Companies in Denmark”, Master thesis, Aarhus School of Business.

69
34. Lessard, D.R. 1986, “Financial and Global Competition” in Completion in Global industries, ed. M.Porter, Harvard Business Press, Boston, Massachusetts
35. Loderer, C. and Pichler, K., 2000, “Firms, do you know your currency risk exposure? Survey results”. Journal of Empirical Finance, 7, pp. 317 – 344.
36. Marshall, A. P., 2000, “Foreign Exchange Rate Management in UK, USA and Asia Pacific multinational companies”. Journal of Multinational Financial Management 10, pp. 185 – 211.
37. Martin, A. D. and Mauer, L. J., 2003, “Transaction versus economic exposure: which has greater cash flow consequences?” International Review of Economics and Finance 12, pp. 437 – 449.
38. Mello, A. S., Parsons, J.E. and Triantis, A. J., 1995, “An Integrated Model of multinational flexibility and financial hedging”. Journal of International Economics 39, pp. 27-51.
39. Miller, K. D., 1998, “Economic exposure and integrated risk management”, Strategic Management Journal, 19, 5, 497-514 pp.
40. Moffett, M.H. and Karlsen, J. K., 1994, “Managing Foreign Exchange Rate Exposure”. Journal of International Financial Management and Accounting 5, 2, pp. 157 – 175.
41. Nance, D. R., Smith, C. W., Smithson, C. W., 1993, “On the Determinants of Corporate Hedging”. The Journal of Finance, 48, 1, March, p. 267-284
42. Pantzalis, C., Simkins, B.J. and Laux, P.A., 2001, “Operational Hedges and the Foreign Exchange Exposure of U.S. Multinational Corporations”. Journal of International Business Studies, 32, 4, pp. 793 – 812.
43. Rangan, S., 1998. Do Multinationals operate Flexibly? Theory and evidence. Journal of International Business Studies 29,2, pp. 217-237
44. Srinivasulu, S. L., 1981, “Strategic response to Foreign Exchange Risks” Columbia Journal of World Business, spring, pp. 13-22
45. Triantis, A., 2005, “Realizing the potential of real options: Does theory meet practice?” Journal of applied corporate finance 17, 2, pp. 8-16.
46. Trigeorgis, L., 1993, “Real Options and Interactions with Financial Flexibility”. Financial Management, autumn, pp. 202-224

APPENDIX 1
I
Appendices
APPENDIX 1:
NACE classification as for January 1st 2008
Source: REGULATION (EC) No 1893/2006 OF THE EUROPEAN PARLIAMENT AND OF
THE COUNCIL of 20 December 2006: establishing of the statistical classification of economic activities NACE Revision 2 and amending Council Regulation (EEC) No 3037/90.
SECTION A — AGRICULTURE, FORESTRY AND FISHING
01 Crop and animal production, hunting and related service activities
02 Forestry and logging
03 Fishing and aquaculture
SECTION B — MINING AND QUARRYING
05 Mining of coal and lignite
06 Extraction of crude petroleum and natural gas
07 Mining of metal ores
08 Other mining and quarrying
09 Mining support service activities
SECTION C — MANUFACTURING
10 Manufacture of food products
11 Manufacture of beverages
12 Manufacture of tobacco products
13 Manufacture of textiles
14 Manufacture of wearing apparel
15 Manufacture of leather and related products
16 Manufacture of wood and of products of wood and cork, except furniture; manufacture of articles of straw and plaiting materials
17 Manufacture of paper and paper products
18 Printing and reproduction of recorded media
19 Manufacture of coke and refined petroleum products
20 Manufacture of chemicals and chemical products
21 Manufacture of basic pharmaceutical products and pharmaceutical preparations
22 Manufacture of rubber and plastic products
23 Manufacture of other non-metallic mineral products
24 Manufacture of basic metals
25 Manufacture of fabricated metal products, except machinery and equipment
26 Manufacture of computer, electronic and optical products
27 Manufacture of electrical equipment
28 Manufacture of machinery and equipment
29 Manufacture of motor vehicles, trailers and semi-trailers
30 Manufacture of other transport equipment
31 Manufacture of furniture
32 Other manufacturing
33 Repair and installation of machinery and equipment
SECTION D — ELECTRICITY, GAS, STEAM AND AIR CONDITIONING SUPPLY
35 Electricity, gas, steam and air conditioning supply
SECTION E — WATER SUPPLY; SEWERAGE, WASTE MANAGEMENT AND REMEDIATION ACTIVITIES
36 Water collection, treatment and supply
37 Sewerage
38 Waste collection, treatment and disposal activities; materials recovery
39 Remediation activities and other waste management services
SECTION F — CONSTRUCTION
41 Construction of buildings
42 Civil engineering
43 Specialised construction activities
SECTION G — WHOLESALE AND RETAIL TRADE; REPAIR OF MOTOR VEHICLES AND MOTORCYCLES
45 Wholesale and retail trade and repair of motor vehicles and motorcycles
46 Wholesale trade, except of motor vehicles and motorcycles
47 Retail trade, except of motor vehicles and motorcycles
SECTION H — TRANSPORTATION AND STORAGE
49 Land transport and transport via pipelines
50 Water transport

APPENDIX 1
II
51 Air transport
52 Warehousing and support activities for transportation
53 Postal and courier activities
SECTION I — ACCOMMODATION AND FOOD SERVICE ACTIVITIES
55 Accommodation
56 Food and beverage service activities
SECTION J — INFORMATION AND COMMUNICATION
58 Publishing activities
59 Motion picture, video and television programme production, sound recording and music publishing activities
60 Programming and broadcasting activities
61 Telecommunications
62 Computer programming, consultancy and related activities
63 Information service activities
SECTION K — FINANCIAL AND INSURANCE ACTIVITIES
64 Financial service activities, except insurance and pension funding
65 Insurance, reinsurance and pension funding, except compulsory social security
66 Activities auxiliary to financial services and insurance activities
SECTION L — REAL ESTATE ACTIVITIES
68 Real estate activities
SECTION M — PROFESSIONAL, SCIENTIFIC AND TECHNICAL ACTIVITIES
69 Legal and accounting activities
70 Activities of head offices; management consultancy activities
71 Architectural and engineering activities; technical testing and analysis
72 Scientific research and development
73 Advertising and market research
74 Other professional, scientific and technical activities
75 Veterinary activities
SECTION N — ADMINISTRATIVE AND SUPPORT SERVICE ACTIVITIES
77 Rental and leasing activities
78 Employment activities
79 Travel agency, tour operator reservation service and related activities
80 Security and investigation activities
81 Services to buildings and landscape activities
82 Office administrative, office support and other business support activities
SECTION O — PUBLIC ADMINISTRATION AND DEFENCE; COMPULSORY SOCIAL SECURITY
84 Public administration and defence; compulsory social security
SECTION P — EDUCATION
85 Education
SECTION Q — HUMAN HEALTH AND SOCIAL WORK ACTIVITIES
86 Human health activities
87 Residential care activities
88 Social work activities without accommodation
SECTION R — ARTS, ENTERTAINMENT AND RECREATION
90 Creative, arts and entertainment activities
91 Libraries, archives, museums and other cultural activities
92 Gambling and betting activities
93 Sports activities and amusement and recreation activities
SECTION S — OTHER SERVICE ACTIVITIES
94 Activities of membership organisations
95 Repair of computers and personal and household goods
96 Other personal service activities
SECTION T — ACTIVITIES OF HOUSEHOLDS AS EMPLOYERS; UNDIFFERENTIATED GOODS- AND SERVICES-PRODUCING ACTIVITIES OF HOUSEHOLDS FOR OWN USE
97 Activities of households as employers of domestic personnel
98 Undifferentiated goods- and services-producing activities of private households for own use
SECTION U — ACTIVITIES OF EXTRATERRITORIAL ORGANISATIONS AND BODIES
99 Activities of extraterritorial organisations and bodies

APPENDIX 2
III
APPENDIX 2:
Distribution of companies across economic sectors
during the target population selection process
Table 34: Distribution of companies across economic sectors during the target
population selection process after performing step 3, 4 and 5
Step 3 Step 4 Step 5 Economic
activity sector
NAME Industry
code N % N % N %
SECTION A AGRICULTURE, FORESTRY AND FISHING 01-03 7 0,51% - - - -
SECTION B MINING AND QUARRYING 05-09 6 0,44% - - - -
SECTION C MANUFACTURING 10-33 557 40,39% 557 42,62% 455 43,13%
SECTION D ELECTRICITY, GAS, STEAM AND AIR CONDITIONING SUPPLY 35 4 0,29% - - - -
SECTION E
WATER SUPPLY; SEWERAGE, WASTE MANAGEMENT AND REMEDIATION ACTIVITIES 36-39 7 0,51% - - - -
SECTION F CONSTRUCTION 41-43 65 4,71% 65 4,97% 62 5,88%
SECTION G
WHOLESALE AND RETAIL TRADE; REPAIR OF MOTOR VEHICLES AND MOTORCYCLES 45-47 400 29,01% 400 30,60% 308 29,19%
SECTION H TRANSPORTATION AND STORAGE 49-53 104 7,54% 104 7,96% 91 8,63%
SECTION I ACCOMMODATION AND FOOD SERVICE ACTIVITIES 55-56 18 1,31% - - - -
SECTION J INFORMATION AND COMMUNICATION 58-63 74 5,37% 74 5,66% 53 5,02%
SECTION K FINANCIAL AND INSURANCE ACTIVITIES 64-66 0 0,00% - - - -
SECTION L REAL ESTATE ACTIVITIES 68 13 0,94% - - - -
SECTION M PROFESSIONAL, SCIENTIFIC AND TECHNICAL ACTIVITIES 69-75 68 4,93% 68 5,20% 54 5,12%
SECTION N ADMINISTRATIVE AND SUPPORT SERVICE ACTIVITIES 77-82 39 2,83% 39 2,98% 32 3,03%
SECTION O PUBLIC ADMINISTRATION AND DEFENCE; COMPULSORY SOCIAL SECURITY 85 2 0,15% - - - -
SECTION Q HUMAN HEALTH AND SOCIAL WORK ACTIVITIES 86-88 2 0,15% - - - -
SECTION R ARTS, ENTERTAINMENT AND RECREATION 90-93 11 0,80% - - - -
SECTION S OTHER SERVICE ACTIVITIES 94-96 2 0,15% - - - -
SECTION T
ACTIVITIES OF HOUSEHOLDS AS EMPLOYERS; UNDIFFERENTIATED GOODS- AND SERVICES-PRODUCING ACTIVITIES OF HOUSEHOLDS FOR OWN USE 97-98 - - - - - -
SECTION U ACTIVITIES OF EXTRATERRITORIAL ORGANISATIONS AND BODIES 99 - - - - - -
TOTAL 1379 100,00% 1307 100,00% 1055 100,00%

APPENDIX 3
IV
APPENDIX 3:
Questionnaire sent to companies
Business Survey
"STRATEGIC FOREIGN EXCHANGE RISK MANAGEMENT PRACTICE OF DANISH MEDIUM SIZED NON-FINANCIAL COMPANIES"
Fall, 2008
Dear Respondent, Thank you very much for agreeing to participate in the survey.
• The aims of the survey are: 1) to investigate if interaction between financial and operational hedging exists in the risk management of operating exposure to currency fluctuations; 2) to analyze the factors that explain the companies’ choice to use real actions as a response to the exchange rate changes.
• The results of this survey will be used for academic purposes only. • Strict confidentiality is guarantied for respondents. • There are 1, 21 or 23 questions, depending on your answers. • It takes approximately 10 minutes to answer all 23 questions
SECTION A
THE DEGREE OF THE COMPANY'S INTERNATIONAL FLEXIBILITY AND INVOLVEMENT IN INTERNATIONAL ACTIVITIES
1. Think about your company's operating revenues, operating costs, operating assets and financial debt. Is at least one of these four categories to any degree denominated in a currency other than DKK?
� Yes
� No
2. What percentage of your company’s consolidated operating revenues, operating costs, operating assets and financial debt is in foreign currency? (Please check the option in each row that is closest to your estimate)
0% 1-20% 21-40% 41-60% 61-80% 81-99% 100%
Operating revenues � � � � � � �
Operating costs � � � � � � �
Operating assets � � � � � � �
Financial debt � � � � � � �

APPENDIX 3
V
3. In which of the following geographic regions does your company receive foreign operating revenues (have foreign sales) and/or bear foreign operating costs (have foreign production or sourcing)? (Please choose all appropriate options)
Operating revenues
Operating costs
Euro zone ( Austria, Belgium, Cyprus, Finland, France, Germany, Greece, Ireland, Italy, Luxembourg, Malta, the Netherlands, Portugal, Slovenia, Spain)
� �
The rest of Europe (Albania, Bulgaria, Bosnia-Herz., Croatia, Czech Rep., Estonia, Hungary, Iceland, Latvia, Lithuania, Macedonia, Moldova, Norway, Poland, Romania, Serb.-Mont., Slovakia, Sweden, Turkey, the United Kingdom)
� �
Countries of CIS (the Russian Federation, Belorussia, Ukraine) � � The United states, Canada � � Mexico, Central and South America and the Caribbean � � Central Asia and Middle East (Afghanistan, Arabian Emirates, Armenia, Azerbaijan, Georgia, India, Iraq, Iran, Israel, Kazakhstan, Kirgizstan, Mongolia, Oman, Pakistan, Saudi Arabia, Syria, Turkmenistan, Uzbekistan etc.)
� �
East Asia and the Pacific (Australia, China, Cambodia, Indonesia, Japan, Korea, Laos, Malaysia, New Zealand, Singapore, Taiwan, Thailand, The Philippines, Vietnam etc.)
� �
Africa � �
4. If you look at the currencies in which your company’s operating revenues and operating costs are denominated, is there a match between them? I.e. in order to receive revenues in a certain currency does your company bear costs in the same currency (match) or does it bear costs denominated in another currency (no match)? (Please check one appropriate option)
� No match
� Relatively low match
� Match to some degree
� Relatively high match
� Complete match
5. How many foreign subsidiaries does your company have? (Please select one answer)*
[Select an answ er]
6. What is the number of foreign countries in which your company has subsidiaries? (Please select one answer)*
[Select an answ er]
7. In which of the following geographic regions does your company have foreign subsidiaries? (Please check all the appropriate options)
Foreign
subsidiaries

APPENDIX 3
VI
Euro zone ( Austria, Belgium, Cyprus, Finland, France, Germany, Greece, Ireland, Italy,
Luxembourg, Malta, the Netherlands, Portugal, Slovenia, Spain) �
The rest of Europe (Albania, Bulgaria, Bosnia-Herz., Croatia, Czech Rep., Estonia, Hungary, Iceland, Latvia, Lithuania, Macedonia, Moldova, Norway, Poland, Romania, Serb.-Mont., Slovakia, Sweden, Turkey, the United Kingdom)
�
Countries of CIS (the Russian Federation, Belorussia, Ukraine) � The United states, Canada � Mexico, Central and South America and the Caribbean � Central Asia and Middle East (Afghanistan, Arabian Emirates, Armenia, Azerbaijan, Georgia, India, Iraq, Iran, Israel, Kazakhstan, Kirgizstan, Mongolia, Oman, Pakistan, Saudi Arabia, Syria, Turkmenistan, Uzbekistan etc.)
�
East Asia and the Pacific (Australia, China, Cambodia, Indonesia, Japan, Korea, Laos, Malaysia, New Zealand, Singapore, Taiwan, Thailand, The Philippines, Vietnam etc.)
�
Africa �
SECTION B
STRATEGIC APPROACHES TOWARDS FOREIGN EXCHANGE RISK MANAGEMENT USED IN THE COMPANY
Please read this definition before answering the following questions:
Operating exposure to currency fluctuations is the sensitivity of the company's value to unexpected changes in exchange rates. The exposure is characterized by a long time horizon and broad scope, since the exposed items are the operating cash flows, the competitive position of the company and the structure of the markets in which the company has operations.
8. In order to manage the impact of exchange rate fluctuations on your company’s operating cash flows or competitive position (i.e. operating exposure), how important are the following financial means for your company? (Please check one option in each row)
Important Somewhat
important Neither
important or unimportant
Somewhat unimportant
Unimportant
Shortsighted currency derivatives (forward contracts ( = "terminskontrakter" in Danish), options)
� � � � �
Longsighted currency derivatives (swaps)
� � � � �
Choice of the currency in which the company's debt is denominated
� � � � �
9. In order to manage the impact of exchange rate fluctuations on your company’s operating cash flows or competitive position (i.e. operating exposure), how important are the following operational means for your company? (Please check one option in each row)
Important Somewhat
important Neither important or unimportant
Somewhat unimportant
Unimportant
Choice of the appropriate � � � � �

APPENDIX 3
VII
product mix
Choice of the appropriate market and market segments
� � � � �
Choice of the input sourcing locations
� � � � �
Choice of the production locations
� � � � �
Choice of the pricing strategy
� � � � �
10. In order to manage operating exposure to currency fluctuations, what means are important in your opinion, financial (i.e. forward contracts (= "terminskontrakter" in Danish), options, swaps, debt in foreign currency) or operational (i.e. choice of sourcing or production locations, pricing strategy etc.)? (Please check one option)
� Financial means are much more important
� Financial means are more important
� Financial and operational means are equally important
� Operational means are more important
� Operational means are much more important
11. If your company's management of operating exposure to currency fluctuations sometimes or frequently does not involve financial means (i.e. forward contracts (= "terminskontrakter" in Danish), options, swaps, debt in foreign currency), what are the likely reasons? (Please check the appropriate option in each row)
Yes No
Currency fluctuations has no significant impact on the company's operating cash flows and competitive position
� �
Operating exposure cannot be quantified properly in order to be hedged by financial means � � Operating exposure is better managed by operational means (i.e. choice of sourcing or production locations, pricing strategy etc.)
� �
The cost of hedging by financial means are too high � � The proper financial instruments are not available on the market � � Lack of knowledge and expertise of operating exposure � � The management of the company believes that in the long run positive and negative exchange rate changes cancel each other out
� �
12. If your company's management of operating exposure to currency fluctuations sometimes or frequently does not involve operational means (i.e. choice of sourcing or production locations, pricing strategy etc.), what are the likely reasons? (Please check the appropriate option in each row)
Yes No
Currency fluctuations has no significant impact on the company's operating cash flows and competitive position
� �
The information needed for estimates is unavailable or uncertain � � Operating exposure is better managed by financial means (i.e. forward contracts (= "terminskontrakter" in Danish), options, swaps, debt in foreign currency)
� �
The cost of hedging by operational means are too high � � Lack of knowledge and expertise of operating exposure � � The management of the company believes that in the long run positive and negative exchange � �

APPENDIX 3
VIII
rate changes cancel each other out
13. During the last year, has your company used currency derivatives or issued debt in foreign currency in order to manage foreign exchange risk? (Please check the appropriate option in each row)*
Yes No
Shortsighted currency derivatives (forward contracts ( = "terminskontrakter" in Danish), options)
� �
Longsighted currency derivatives (swaps) � � Debt in foreign currency � �
14. At the present time, what is the average time horizon that your company has covered its foreign exchange exposure by using financial means (i.e. forward contracts (="terminskontrakter" in Danish), options, swaps, debt in foreign currency)? (Please check one option)
�0-1 months �1-3 months �3-6 months �6-12 months �1-2 years �2-5 years �> 5 years
15. How often does your company’s view/forecast of exchange rates cause your company to take the following financial actions? (Please check one option in each row)*
Never Sometimes Often
Alter the timing of hedges � � �
Alter the size of hedges � � �
Actively take positions in currency derivatives (forward contracts ( = "terminskontrakter" in Danish), options, swaps) or issue debt in foreign currency
� � �
16. In the past 5 years has your company undertaken any of the following actions partly or fully due to positive or negative developments in exchange rates? (Please check the appropriate option in each row)
Yes No
Enter a new foreign market where your company did not have any sales or operations before � �
Shift supplier to foreign locations where it became cheaper to source due to exchange rate changes
� �
Shift production to foreign locations where it became cheaper to produce due to exchange rate changes
� �
Increase capacity, accelerate resource utilization or extend production in foreign countries � �
Delay entry into a foreign market � �
Abandon a foreign market completely � �
Temporally close or reduce operations in a foreign market � �
Change the set of inputs or processes used for production � �
Change the composition of products sold (change of product mix) � �
17. In the following 5 years is it likely that your company will undertake any of the following actions partly or fully due to positive or negative developments in exchange rates? (Please check the appropriate option in each row)
Yes No
Enter a new foreign market where your company did not have any sales or operations before � � Shift supplier to foreign locations where it became cheaper to source due to exchange rate changes
� �

APPENDIX 3
IX
Shift production to foreign locations where it became cheaper to produce due to exchange rate changes
� �
Increase capacity, accelerate resource utilization or extend production in foreign countries � � Delay entry into a foreign market � � Abandon a foreign market completely � � Temporally close or reduce operations in a foreign market � � Change the set of inputs or processes used for production � � Change the composition of products sold (change of product mix) � �
18. Does your company perform the following types of analysis? (Please check one option in each row)
Regularly Sometimes Never
Makes short term (1 year or less) predictions of future operational cash flows
� � �
Makes long term (more than 1 year) predictions of future operational cash flows
� � �
Makes short term (1 year or less) predictions of exchange rates � � � Makes long term (more than 1 year) predictions of exchange rates � � � Analyzes the likely behavior of competitors to possible changes in future exchange rates
� � �
Analyzes the likely behavior of customers to possible changes in future exchange rates
� � �
Analyzes the likely behavior of suppliers to possible changes in future exchange rates
� � �
19. Within the last few years, has the degree of attention of your company to the influence of exchange rate fluctuations on your company's operations and operating cash flows changed? (Please check one option)
Attention
has decreased � has remained the same � has increased �
20. In your company, are the following departments (or the people responsible for these areas) involved in the management of foreign exchange risk? (Please check one option in each row)*
Involved regularly Involved to some extent Never involved
Purchasing � � � Production � � � Finance � � � Sales � � � Marketing � � �

APPENDIX 3
X
21. What are your company's fixed assets ( = "anlægsaktiver" in Danish) in percentage of total assets (= "samlede aktiver" in Danish)? (Please choose one option closest to your estimate)
0% 1-20% 21-40% 41-60% 61-80% 81-99%
Fixed assets in percentage of total assets � � � � � �
22. If you think about the general attitude of your company to foreign exchange risk management, which of the following statements would best describe it? (Please check one option)
General objective
Totally risk averse (i.e. the only task of the foreign exchange risk management is to minimize the impact of exchange rate changes on the performance of the company)
�
Fairly risk averse (i.e. though the company considers possibilities for extra profit from the management of foreign exchange risks, the primary task is to minimize the impact of exchange rate fluctuations )
�
Risk taking (i.e. the foreign exchange risk management is constantly seeking additional return (profit) from the risk management activities )
�
23. How would you characterize the general business environment in which your company primarily operates? (Please choose one appropriate option)
Business environment
Very stable �
Fairly stable �
Not particularly stable or volatile �
Fairly volatile �
Very volatile �
If your are interested in receiving the final report please state your e-mail address here: _________________
If you have any comments related to the survey, please state them here: _______________
Thank you for answering all the questions in the survey
Your help is greatly appreciated

APPENDIX 4
XI
APPENDIX 4:
Examples of survey invitation mails
MAIL TYPE 1 Att.: Økonomichef Kære (NAVN) Mit navn er Marianna A. Hansen, og jeg er i gang med at skrive speciale ved Handelshøjskolen i Århus, Århus Universitet, hvor jeg foretager en undersøgelse af mellemstore, danske virksomheders behandling af valutariske risici (”Strategic foreign exchange risk management practice of Danish medium sized non-financial companies”). Jeg vil derfor bede dig besvare et kort, elektronisk spørgeskema omhandlende din virksomheds praksis inden for dette område. Spørgeskemaet består af 1, 21 eller 23 afkrydsningsspørgsmål. Antallet af spørgsmål afhænger af hvor mange spørgsmål, der er relevante for din virksomhed (et såkaldt intelligent spørgeskema). Det tager 2-10 minutter at besvare spørgeskemaet. Det elektroniske spørgeskema er formuleret på engelsk, da det er arbejdssproget ved min uddannelse. Hvis du er interesseret i at få tilsendt resultatet af undersøgelsen, er der mulighed for at indtaste din e-mail adresse efter, at du har besvaret spørgsmålene elektronisk. For at deltage i undersøgelsen bedes du klikke på linket nedenfor og indtaste følgende identifikationskode på spørgeskemaets første side. Identifikationskode: Link: Jeg håber, at du har mulighed for at afse tid til det, da det vil betyde meget for validiteten af min undersøgelse. Med venlig hilsen Marianna A. Hansen MSc. studerende i Business og Finance Handelshøjskolen i Århus, Århus Universitet E-mail: [email protected] Tel.: 60 74 55 00

APPENDIX 4
XII
MAIL TYPE 2 Att.: Økonomichef Kære (NAVN) Jeg har skrevet til dig for nogle uger siden og nu skriver jeg til dig igen fordi jeg har brug for din hjælp. Jeg er i gang med at skrive speciale ved Handelshøjskolen i Århus, Århus Universitet, hvor jeg foretager en undersøgelse af mellemstore, danske virksomheders behandling af valutariske risici. Det er meget vigtigt for validiteten af mine resultater at jeg når en vis svarprocent, og derfor beder jeg dig endnu en gang om at bruge 15 minutter på at gennemgå spørgeskemaet. Hvis din virksomhed ikke handler i udenlands valuta, vil du kun blive bedt om at besvare det første spørgsmål i spørgeskemaet. Hvis din virksomhed principielt ikke deltager i spørgeskemaundersøgelser eller af andre grunde ikke kan deltage, beder jeg dig sende mig en kort mail, så jeg ikke forstyrrer dig med flere påmindelsesmails. Det elektroniske spørgeskema er formuleret på engelsk, da det er arbejdssproget ved min uddannelse. Hvis du er interesseret i at få tilsendt resultatet af undersøgelsen, er der mulighed for at indtaste din e-mail adresse efter, at du har besvaret spørgsmålene elektronisk. For at deltage i undersøgelsen bedes du klikke på linket nedenfor og indtaste følgende identifikationskode på spørgeskemaets første side. Identifikationskode: Link: Jeg håber, at du har mulighed for at afse tid til det, da det vil betyde meget for validiteten af min undersøgelse. Med venlig hilsen Marianna A. Hansen MSc. studerende i Business og Finance Handelshøjskolen i Århus, Århus Universitet E-mail: [email protected] Tel.: 60 74 55 00

APPENDIX 5
XIII
APPENDIX 5:
Statistics for the survey answers Source: Screen shoot made from the StudSurvey statistics web page
1. October 2008
2. November

APPENDIX 5
XIV
3. December 2008

APPENDIX 6
XV
APPENDIX 6:
Survey response data
SECTION A
THE DEGREE OF THE COMPANY'S INTERNATIONAL FLEXIBILITY AND INVOLVEMENT IN INTERNATIONAL ACTIVITIES
1. Think about your company's operating revenues, operating costs, operating assets and financial debt. Is at least one of these four categories to any degree denominated in a currency other than DKK?
n
Yes 186
No 182
2. What percentage of your company’s consolidated operating revenues, operating costs, operating assets and financial debt is in foreign currency?
0% 1-20% 21-40% 41-60% 61-80% 81-99% 100%
Operating revenues 11 27 14 29 24 29 3 Operating costs 6 44 30 34 15 8 0 Operating assets 41 45 22 16 8 4 1 Financial debt 41 36 25 22 8 5 0

APPENDIX 6
XVI
3. In which of the following geographic regions does your company receive foreign operating revenues and/or bear foreign operating costs?
Operating
revenues
Operating
costs
EU zone 166 158 Rest Europe 139 102 CIS 62 22 US/Can 90 62 Mex/C&S America 39 22 CA/ ME 61 27 EA/Pacific 79 75 Africa 35 17
4. If you look at the currencies in which your company’s operating revenues and operating costs are denominated, is there a match between them?
n
No match 24
Relatively low match 39
Match to some degree 70
Relatively high match 49
Complete match 4
5. How many foreign subsidiaries does your company have?

APPENDIX 6
XVII
6. What is the number of foreign countries in which your company has subsidiaries?
7. In which of the following geographic regions does your company have foreign subsidiaries?
n
EU zone 82 Rest Europe 72 CIS 12 US/Can 40 Mex/C&S America 10 CA/ ME 8 EA/Pacific 36 Africa 5
SECTION B
STRATEGIC APPROACHES TOWARDS FOREIGN EXCHANGE RISK MANAGEMENT USED IN THE COMPANY
8. In order to manage the impact of exchange rate fluctuations on your company’s operating cash flows or competitive position, how important are the following financial means for your company?
Important Somewhat
important
Neither
important
or
unimportant
Somewhat
unimportant
Unimportant
Shortsighted currency
derivatives 51 52 18 20 45 Longsighted currency
derivatives 10 36 38 32 70 Choice of the currency
of debt denomination 47 47 27 24 41

APPENDIX 6
XVIII
9. In order to manage the impact of exchange rate fluctuations on your company’s operating cash flows or competitive position, how important are the following operational means for your company?
Important Somewhat
important
Neither
important or
unimportant
Somewhat
unimportant
Unimportant
Choice of the appropriate product
mix 5 28 51 18 84 Choice of the appropriate market
and market segments 13 43 40 27 63 Choice of the input sourcing
locations 8 37 51 24 66 Choice of the production locations 12 41 44 16 73 Choice of the pricing strategy 36 65 24 14 47

APPENDIX 6
XIX
10. In order to manage operating exposure to currency fluctuations, what means are important in your opinion, financial or operational ?
n
Financial means are much more important (1) 24
Financial means are more important (2) 44 Financial and operational means are equally important (3) 55
Operational means are more important (4) 48 Operational means are much more important (5) 15
11. If your company's management of operating exposure to currency fluctuations sometimes or frequently does not involve financial means, what are the likely reasons?
Yes No
Currency fluctuations has no significant impact on the company's operating cash flows and competitive position
(1) 106 80 Operating exposure cannot be quantified properly in order to be hedged by financial means (2) 66 120 Operating exposure is better managed by operational means (i.e. choice of sourcing or production locations, pricing strategy etc.) (3) 81 105 The cost of hedging by financial means are too high (4) 70 116 The proper financial instruments are not available on the market (5) 25 161 Lack of knowledge and expertise of operating exposure (6) 36 150 The management of the company believes that in the long run positive and negative exchange rate changes cancel each other out
(7) 66 120

APPENDIX 6
XX
12. If your company's management of operating exposure to currency fluctuations sometimes or frequently does not involve operational means, what are the likely reasons?
Yes No Currency fluctuations has no significant impact on the company's operating cash flows and
competitive position (1) 94 92
The information needed for estimates is unavailable or uncertain (2) 53 133
Operating exposure is better managed by financial means (3) 91 95
The cost of hedging by operational means are too high (4) 65 121
Lack of knowledge and expertise of operating exposure (5) 39 147
The management of the company believes that in the long run positive and negative
exchange rate changes cancel each other out (6) 64 122
13. During the last year, has your company used currency derivatives or issued debt in foreign currency in order to manage foreign exchange risk?
Yes No Shortsighted
currency derivatives 102 84 Longsighted
currency derivatives
47 139 Debt in foreign
currency 92 94
14. At the present time, what is the average time horizon that your company has covered its foreign exchange exposure by using financial means?
n
0-1 months 64
1-3 months 29
3-6 months 28
6-12 months 32
1-2 years 13
2-5 years 10
> 5 years 10

APPENDIX 6
XXI
15. How often does your company’s view/forecast of exchange rates cause your company to take the following financial actions?
Never Some-
times Often
Alter the timing of hedges 79 67 40 Alter the size of hedges 81 70 35 Actively take positions in currency derivatives or issue debt in foreign currency 64 70 52
16. In the past 5 years has your company undertaken any of the following actions partly or fully due to positive or negative developments in exchange rates?
Yes No
Enter a new foreign market where your
company did not have any sales or
operations before (1) 55 131 Shift supplier to foreign locations where it
became cheaper to source due to exchange
rate changes (2) 62 124 Shift production to foreign locations where
it became cheaper to produce due to
exchange rate changes (3) 26 160 Increase capacity, accelerate resource
utilization or extend production in foreign
countries (4) 37 149 Delay entry into a foreign market
(5) 23 163 Abandon a foreign market completely
(6) 14 172 Temporally close or reduce operations in a
foreign market (7) 33 153 Change the set of inputs or processes used for production (8) 27 159 Change the composition of products sold
(change of product mix) (9) 36 150
17. In the following 5 years is it likely that your company will undertake any of the following actions partly or fully due to positive or negative developments in exchange rates?
Yes No
Enter a new foreign market where your
company did not have any sales or
operations before (1) 65 121 Shift supplier to foreign locations where it
became cheaper to source due to exchange
rate changes (2) 69 117 Shift production to foreign locations where
it became cheaper to produce due to
exchange rate changes (3) 36 150 Increase capacity, accelerate resource
utilization or extend production in foreign
countries (4) 49 137 Delay entry into a foreign market
(5) 29 157 Abandon a foreign market completely
(6) 26 160 Temporally close or reduce operations in a
foreign market (7) 38 148 Change the set of inputs or processes used
for production (8) 40 146 Change the composition of products sold
(change of product mix) (9) 56 130

APPENDIX 6
XXII
18. Does your company perform the following types of analysis?
Reg
ular
y
Som
etime
s
Neve
r
Makes short term predictions of future operational cash flows (1) 127 49 10 Makes long term predictions of future operational cash flows (2) 43 85 58 Makes short term predictions of exchange rates (3) 57 70 59 Makes long term predictions of exchange
rates (4) 18 62 106 Analyzes the likely behavior of
competitors to possible changes in future
exchange rates (5) 16 44 126 Analyzes the likely behavior of customers
to possible changes in future exchange
rates (6) 21 58 107 Analyzes the likely behavior of suppliers to possible changes in future exchange
rates (7) 20 71 95
19. Within the last few years, has the degree of attention of your company to the influence of exchange rate fluctuations on your company's operations and operating cash flows changed?
n
Has decreased 17 Has remained the same 88 Has increased 81
20. In your company, are the following departments (or the people responsible for these areas) involved in the management of foreign exchange risk?
Involved
regularly
Involved
to some
extent
Never
involved
Finance 171 11 4 Sales 57 84 45 Marketing 15 28 143 Purchasing 8 46 132 Production 47 84 55

APPENDIX 6
XXIII
21. What are your company's fixed assets in percentage of total assets ?
0% 1-20% 21-40% 41-60% 61-80% 81-99%
1 64 57 40 18 6
22. If you think about the general attitude of your company to foreign exchange risk management, which of the following statements would best describe it?
n
Totally risk averse
64 Fairly risk averse 112 Risk taking 10
23. How would you characterize the general business environment in which your company primarily operates?
n
Very stable 12 Fairly stable 82 Not particularly stable or volatile 35 Fairly volatile 47 Very volatile 10

APPENDIX 7
XXIV
APPENDIX 7: Correlation tables
Table35: Correlation coefficients (whole sample)
The table reports the correlation coefficients for each pair of the independent variables used in the regression analysis for the whole sample of companies. The independent variables are return on equity (ROE), total assets (TOASSET), solvency ratio (SOLV), binary variable that represents if the company is from the group of industrials or from the services (IND), the percentage of fixed assets (FIXASSET), the number of foreign subsidiaries (FRSUB), the number of foreign countries in which a company has subsidiaries (FRCON), the percentage of foreign revenues (FSALE), the percentage of foreign costs (FCOST), the percentage of foreign assets (FASSET), an ordered variable that proxies a company’s risk attitude (RATT), an ordered variable that proxies the volatility of a company’s business environment (ENVR), and a binary variable that shows if both the financial and operational departments are involved in the risk management process or not (DEP).
ROE TOASSET SOLV IND FIXASSET FRSUB FRCON FSALE FCOST FASSET RKATT ENVRVOL DEP
ROE 1,0000
TOASSET 0,0497 1,0000
SOLV -0,0653 0,1135 1,0000
IND -0,0061 -0,1125 0,0125 1,0000
FIXASSET -0,0779 0,0851 -0,0219 0,2440 1,0000
FRSUB 0,1036 0,2863 0,0236 -0,0262 -0,0454 1,0000
FRCON 0,1100 0,2803 0,0053 0,0001 -0,0393 0,9894 1,0000
FSALE -0,1054 0,2356 0,0488 0,0904 -0,0554 0,3686 0,3803 1,0000
FCOST 0,0332 0,2338 0,0607 -0,0886 -0,0669 0,3448 0,3342 0,4486 1,0000
FASSET -0,0266 0,2317 0,0879 -0,0860 0,0077 0,3308 0,3374 0,4840 0,4998 1,0000
RKATT -0,0584 -0,0710 -0,1176 -0,0294 0,0935 0,0849 0,0820 -0,0267 0,0141 0,0799 1,0000
ENVR -0,1265 0,0046 -0,0917 -0,1533 -0,1101 0,0874 0,0823 0,1836 0,1360 0,1227 0,1874 1,0000
DEP -0,0301 0,1395 0,0228 0,1218 0,0562 0,1592 0,1645 0,2259 0,1093 0,1183 0,0264 0,0839 1,0000

APPENDIX 8
XXV
APPENDIX 7: Correlation tables
Table36: Correlation coefficients (industrials)
The table reports the correlation coefficients for each pair of the independent variables used in the regression analysis for the restricted sample consisting of the industrial companies. The independent variables are return on equity (ROE), total assets (TOASSET), solvency ratio (SOLV), binary variable that represents if the company is from the group of industrials or from the services (IND), the percentage of fixed assets (FIXASSET), the number of foreign subsidiaries (FRSUB), the number of foreign countries in which a company has subsidiaries (FRCON), the percentage of foreign revenues (FSALE), the percentage of foreign costs (FCOST), the percentage of foreign assets (FASSET), an ordered variable that proxies a company’s risk attitude (RATT), an ordered variable that proxies the volatility of a company’s business environment (ENVR), and a binary variable that shows if both the financial and operational departments are involved in the risk management process or not (DEP).
ROE TOASSET SOLV FIXASSET FRSUB FRCON FSALE FCOST FASSET RKATT ENVRVOL DEP
ROE 1,0000
TOASSET 0,0725 1,0000
SOLV -0,1122 0,0751 1,0000
FIXASSET -0,0026 0,1629 -0,0202 1,0000
FRSUB 0,0833 0,3711 0,0452 -0,0986 1,0000
FRCON 0,0869 0,3747 0,0310 -0,0840 0,9951 1,0000
FSALE -0,0881 0,0305 0,1353 -0,0899 0,3313 0,3276 1,0000
FCOST 0,0009 0,1230 0,1239 -0,0993 0,2074 0,1974 0,3599 1,0000
FASSET -0,0844 0,2137 0,1171 -0,0332 0,3328 0,3353 0,4420 0,4670 1,0000
RKATT -0,0999 -0,0488 -0,2416 0,0401 -0,0058 0,0004 -0,0127 0,0661 0,0889 1,0000
ENVRVOL -0,1840 0,0282 -0,1289 -0,0890 0,0000 -0,0104 0,0956 0,1393 -0,0032 0,1476 1,0000
DEP 0,0651 0,0897 0,0575 0,0344 0,2240 0,2319 0,2510 0,1387 0,1407 0,0312 0,1601 1,0000

APPENDIX 8
XXVI
Table 37: Correlation coefficients (services)
The table reports the correlation coefficients for each pair of the independent variables used in the regression analysis for the restricted sample consisting of the service companies. The independent variables are return on equity (ROE), total assets (TOASSET), solvency ratio (SOLV), binary variable that represents if the company is from the group of industrials or from the services (IND), the percentage of fixed assets (FIXASSET), the number of foreign subsidiaries (FRSUB), the number of foreign countries in which a company has subsidiaries (FRCON), the percentage of foreign revenues (FSALE), the percentage of foreign costs (FCOST), the percentage of foreign assets (FASSET), an ordered variable that proxies a company’s risk attitude (RATT), an ordered variable that proxies the volatility of a company’s business environment (ENVR), and a binary variable that shows if both the financial and operational departments are involved in the risk management process or not (DEP).
service ROE TOASSET SOLV FIXASSET FRSUB FRCON FSALE FCOST FASSET RKATT ENVR DEP
ROE 1,0000
TOASSET 0,0168 1,0000
SOLV 0,0197 0,1644 1,0000
FIXASSET -0,2069 0,0687 -0,0329 1,0000
FRSUB 0,1408 0,2001 -0,0011 0,0213 1,0000
FRCON 0,1531 0,1839 -0,0276 0,0088 0,9853 1,0000
FSALE -0,1382 0,4559 -0,0513 -0,0704 0,4124 0,4390 1,0000
FCOST 0,0835 0,3275 -0,0103 0,0078 0,4793 0,4830 0,5560 1,0000
FASSET 0,0457 0,2345 0,0637 0,0867 0,3294 0,3460 0,5412 0,5228 1,0000
RKATT 0,0165 -0,1063 0,0593 0,1845 0,1923 0,1870 -0,0375 -0,0529 0,0686 1,0000
ENVRVOL -0,0512 -0,0537 -0,0464 -0,0621 0,1688 0,1840 0,3016 0,1096 0,2095 0,2315 1,0000
DEP -0,2053 0,2346 -0,0298 0,0191 0,0930 0,0814 0,1817 0,1021 0,1232 0,0288 0,0391 1,0000

APPENDIX 9
XXVII
Table 38: Estimated regression models for the importance of financial and operational means (sample of the industrial companies)
The table reports the results of four regression models estimated for each of the ordered dependent variables based on the sample of 105 industrial companies. Panel A – the dependent variable “importance of operational
means”. Panel B – the dependent variable “importance of financial means”. Panel C – the dependent variable “importance of financial or operational means”. For each variable the coefficient and p-value (stated below the coefficient) are presented. The variables that are significant at 1%-level, the 5%-level, and the 10%-level, are marked with *, **, and *** respectively. At the bottom of the table the LR statistics and the p-value (LR) are presented. TOASSET is the natural logarithm of the total assets the company; ROE - the ratio of the net profit of the company to its total assets; SOLV – the ratio of the equity of the company to its total assets; FIXASSET – the percentage of the fixed assets of the company to its total assets; FRCON – the natural logarithm of the number of foreign countries plus 1; FRSUB – the natural logarithm of the number of foreign subsidiaries plus 1; FSALE - the ratio of the foreign revenues to the total revenues of the company; FCOST - the ratio of the foreign costs to the total costs of the company; FASSET – the ratio of the foreign assets to the total assets of the company; RATT – the ordered variable coded as 1=”totally risk averse”, 2=”fairly risk averse” 3=“risk taking”; ENV - the ordered variable coded as 1=”very stable”, 2=”fairly stable”, 3= “not particularly stable or volatile” 4= “fairly volatile” and 5 = “very volatile”; DEP - 1 = both the financial and operational departments are involved in the risk management 0 = only the financial department is involved in the risk management; IND - binary variable: 1= an industrial company, 0= a service company.
PANEL A
PANEL B
PANEL C
IMPORTANCE OF OPERATIONAL MEANS IMPORTANCE OF FINANICAL MEANS
IMPORTANCE OF FINANICAL or OPERATIONAL
MEANS
Regressor Model 1
Model 3
Model 4
Model 1
Model 3
Model 4
Model
1
Model
3
Model 4
TOASSET -0,0154 -0,0754 -0,1124 -0,1691 -0,1815 -0,1727 0,0050 -0,0343 -0,0475
0,9392 0,7129 0,5882 0,4048 0,3786 0,4061 0,9788 0,8688 0,8204
ROE 0,1490 0,1960 0,1799 0,0121 0,1522 0,1633 0,0210 0,0493 0,0454
0,2252 0,1143 0,1613 0,3248 0,2180 0,2017 0,8659 0,6944 0,7100
SOLV 0,1205 0,1486 -0,2142 0,9914 *** 1,0962 ** 1,1447 ** 0,3984 0,3872 0,3728
0,8167 0,7770 0,6995 0,0585 0,0385 0,0393 0,4490 0,4656 0,5035
FIXASSET 0,6705 0,6580 0,8958 *** 0,1000 0,0153 0,0776 -0,1862 -0,2291 -0,2354
0,1913 0,2038 0,0921 0,8435 0,9762 0,8814 0,7123 0,6532 0,6486
FRCON -0,3829 * -0,4531 * -0,4405 * -0,3868 * -0,4357 * -0,4075 * -0,1166 -0,1713 -0,1938
0,0056 0,0013 0,0021 0,0057 0,0022 0,0047 0,4035 0,2305 0,1814
FSALE -0,0651 *** -0,8902 ** -0,8610 ** -1,2534 * -1,2532 * -1,1079 * 0,3309 0,1777 0,0529
0,0879 0,0341 0,0456 0,0011 0,0028 0,0094 0,3862 0,6710 0,9015
FCOST -0,9214 *** -0,8378 -1,3710 * -1,3221 ** -0,6150 -0,6937
0,0702 0,1047 0,0078 0,0114 0,2403 0,1938
FASSET 1,6003 * 1,8864 * 1,1137 *** 1,0758 *** 1,2209 1,3100
0,0063 0,0017 0,0555 0,0680 0,0412 0,0303 **
RKATT -0,5585 * 0,0348 -0,0756
0,0033 0,8521 0,6901
ENVR -0,0081 -0,0614 0,0702
0,9417 0,5755 0,5316
DEP -0,4640 ** -0,4554 ** 0,2691
0,0327 0,0343 0,2220
LR-statistic 20,1813
28,3904
42,1942
31,8919
39,9363
45,2844
2,0200
6,4330 8,7036 p-value 0,0026
0,0000
0,0000
0,0000
0,0000
0,0000
0,91697 0,5988 0,6492
n 105
105
105
105
105
105
105 105 105

APPENDIX 9
XXVIII
Table 39: Estimated regression models for the usage of financial and operational means (sample of the industrial companies)
The table reports the results for the four regression models estimated for each of the ordered dependent variables based on the sample of 105 industrial companies. Panel A – the dependent variable “real actions undertaken”. Panel B – the dependent variable “real actions potential”. Panel C – the dependent variable “shortsighted financial means used”. Panel D – the dependent variable “longsighted financial means used”. For each variable the coefficient and p-value (stated below the coefficient) are presented. The variables that are significant at 1%-level, the 5%-level, and the 10%-level, are marked with *, **, and *** respectively. At the bottom of the table the LR statistics and the p-value (LR) are presented. TOASSET is the natural logarithm of the total assets the company; ROE - the ratio of the net profit of the company to its total assets; SOLV – the ratio of the equity of the company to its total assets; FIXASSET – the percentage of the fixed assets of the company to its total assets; FRCON – the natural logarithm of the number of foreign countries plus 1; FRSUB – the natural logarithm of the number of foreign subsidiaries plus 1; FSALE - the ratio of the foreign revenues to the total revenues of the company; FCOST - the ratio of the foreign costs to the total costs of the company; FASSET – the ratio of the foreign assets to the total assets of the company; RATT – the ordered variable coded as 1=”totally risk averse”, 2=”fairly risk averse” 3=“risk taking”; ENV - the ordered variable coded as 1=”very stable”, 2=”fairly stable”, 3= “not particularly stable or volatile” 4= “fairly volatile” and 5 = “very volatile”; DEP - 1 = both the financial and operational departments are involved in the risk management 0 = only the financial department is involved in the risk management; IND - binary variable: 1= an industrial company, 0= a service company. PANEL A
PANEL B
PANEL C
PANEL D
REAL ACTIONS UNDERTAKEN
REAL ACTIONS POTENTIAL
SHORTSIGHTED FINANCIAL MEANS USED LONGSIGHTED FINANCIAL MEANS USED
Regressor M1 M3 M4 M1 M3 M4 M1 M3 M4 M1 M3 M4
C n/a n/a n/a n/a n/a n/a -1,961 -2,283 -2,208 2,567 3,619 3,052
0,510 0,449 0,472 0,401 0,258 0,350
TOASSET 0,119 0,118 0,124 -0,020 -0,063 -0,078 0,132 0,179 0,168 -0,261 -0,369 -0,360
0,575 0,585 0,572 0,923 0,768 0,720 0,523 0,486 0,516 0,316 0,176 0,189
ROE -0,026 -0,040 -0,010 0,091 0,085 0,154 0,053 0,028 0,038 0,076 0,073 0,078
0,852 0,776 0,945 0,469 0,505 0,249 0,749 0,866 0,826 0,657 0,661 0,643
SOLV -0,534 -0,582 -0,257 -0,424 -0,524 -0,153 -0,412 -0,439 -0,435 -0,570 -0,715 -0,543
0,336 0,298 0,665 0,440 0,342 0,796 0,525 0,505 0,528 0,376 0,282 0,435
FIXASSET 0,999 *** 1,049 *** 0,984 *** 1,015 *** 1,102 ** 1,121 ** -0,371 -0,312 -0,284 0,754 0,873 0,819
0,070 0,058 0,086 0,064 0,046 0,047 0,552 0,622 0,657 0,228 0,169 0,202
FRCON 0,137 0,205 0,179 0,298 ** 0,290 ** 0,294 *** 0,289 *** 0,319 *** 0,322 *** 0,466 * 0,439 ** 0,422 **
0,171 0,161 0,232 0,039 0,049 0,052 0,091 0,069 0,070 0,009 0,016 0,023
FSALE 1,035 ** 1,006 ** 0,935 ** 0,808 ** 0,571 0,456 0,288 0,326 0,298 0,461 -0,102 -0,149
0,012 0,026 0,044 0,045 0,199 0,318 0,533 0,525 0,567 0,322 0,848 0,786
FCOST 0,577 0,424 0,938 *** 0,804 0,729 0,693 1,264 *** 1,230 ***
0,283 0,436 0,080 0,138 0,264 0,297 0,055 0,068
FASSET -0,406 -0,509 -0,048 -0,094 -0,829 -0,776 0,791 0,758
0,500 0,407 0,936 0,877 0,265 0,304 0,275 0,307
RKATT 0,394 ** 0,352 *** -0,051 0,248
0,046 0,073 0,827 0,387
ENVR 0,116 0,158 0,054 -0,013
0,336 0,171 0,701 0,931
DEP 0,514 ** 0,285 0,013 0,222
0,024 0,207 0,962 0,430
LR-statistic 16,0
17,2
28,8
15,7
19,0
27,1
7,4
9,3
8,5
12,3
19,6
21,3
p-value 0,014
0,028
0,002
0,016
0,015
0,004
0,281
0,317
0,575
0,056
0,012
0,030
n 105
105
105
105
105
105
105
105
105
105
105
105

APPENDIX 9
XXIX
Table 40: Estimated regression models for the importance of financial and operational means (sample of the service companies)
The table reports the results of four regression models estimated for each of the ordered dependent variables based on the sample of 81 service companies. Panel A – the dependent variable “importance of operational
means”. Panel B – the dependent variable “importance of financial means”. Panel C – the dependent variable “importance of financial or operational means”. For each variable the coefficient and p-value (stated below the coefficient) are presented. The variables that are significant at 1%-level, the 5%-level, and the 10%-level, are marked with *, **, and *** respectively. At the bottom of the table the LR statistics and the p-value (LR) are presented. TOASSET is the natural logarithm of the total assets the company; ROE - the ratio of the net profit of the company to its total assets; SOLV – the ratio of the equity of the company to its total assets; FIXASSET – the percentage of the fixed assets of the company to its total assets; FRCON – the natural logarithm of the number of foreign countries plus 1; FRSUB – the natural logarithm of the number of foreign subsidiaries plus 1; FSALE - the ratio of the foreign revenues to the total revenues of the company; FCOST - the ratio of the foreign costs to the total costs of the company; FASSET – the ratio of the foreign assets to the total assets of the company; RATT – the ordered variable coded as 1=”totally risk averse”, 2=”fairly risk averse” 3=“risk taking”; ENV - the ordered variable coded as 1=”very stable”, 2=”fairly stable”, 3= “not particularly stable or volatile” 4= “fairly volatile” and 5 = “very volatile”; DEP - 1 = both the financial and operational departments are involved in the risk management 0 = only the financial department is involved in the risk management; IND - binary variable: 1= an industrial company, 0= a service company.
PANEL A PANEL B PANEL C IMPORTANCE OF OPERATIONAL MEANS IMPORTANCE OF FINANICAL MEANS IMPORTANCE OF FINANICAL or OPERATIONAL MEANS
Regressor Model 1
Model 3
Model 4
Model 1
Model 3
Model 4
Model
1
Model
3
Model 4
TOASSET -0,048 -0,095 -0,076 -0,395 *** -0,443 ** -0,456 ** -0,358 *** -0,374 *** -0,383 ***
0,819 0,652 0,730 0,060 0,038 0,041 0,100 0,089 0,097
ROE 0,221 0,254 0,260 -0,138 -0,063 -0,096 0,132 0,156 0,118
0,274 0,218 0,220 0,495 0,760 0,652 0,524 0,459 0,586
SOLV 1,291 ** 1,466 ** 1,530 ** 1,861 * 2,117 * 2,116 * 0,085 0,151 0,154
0,041 0,023 0,018 0,004 0,001 0,001 0,896 0,817 0,814
FIXASSET 0,683 0,846 0,989 *** -0,783 -0,587 -0,577 -0,574 -0,494 -0,470
0,208 0,129 0,082 0,147 0,286 0,306 0,301 0,383 0,416
FRCON -0,368 ** -0,398 * -0,378 ** -0,211 -0,177 -0,145 -0,203 -0,198 -0,160
0,012 0,010 0,017 0,157 0,253 0,361 0,174 0,204 0,319
FSALE -0,371 ** -0,756 -0,930 *** -0,938 ** -0,406 -0,328 0,343 0,510 0,599
0,031 0,134 0,077 0,034 0,431 0,541 0,443 0,329 0,273
FCOST 0,598 0,576 -0,138 -0,240 0,052 -0,049
0,302 0,325 0,812 0,682 0,931 0,936
FASSET -0,827 -0,836 *** -1,049 ** -0,982 *** -0,382 -0,299
0,102 0,100 0,043 0,059 0,466 0,571
RKATT -0,262 -0,129 -0,143
0,257 0,582 0,546
ENVR 0,126 -0,079 -0,083
0,270 0,505 0,482
DEP -0,004 -0,193 -0,224
0,985 0,455 0,396
LR-statistic 27,780
30,820
32,840
30,970
35,743
37,330
6,740
7,290 9,230 p-value 0,000
0,000
0,000
0,000
0,000
0,000
0,645 0,504 0,600
n 81
81
81
81
81
81
81 81 81

APPENDIX 9
XXX
Table 41: Estimated regression models for the usage of financial and operational means (sample of the service companies)
The table reports the results for the four regression models estimated for each of the ordered dependent variables based on the sample of 81 service companies. Panel A – the dependent variable “real actions
undertaken”. Panel B – the dependent variable “real actions potential”. Panel C – the dependent variable “shortsighted financial means used”. Panel D – the dependent variable “longsighted financial means used”. For each variable the coefficient and p-value (stated below the coefficient) are presented. The variables that are significant at 1%-level, the 5%-level, and the 10%-level, are marked with *, **, and *** respectively. At the bottom of the table the LR statistics and the p-value (LR) are presented. TOASSET is the natural logarithm of the total assets the company; ROE - the ratio of the net profit of the company to its total assets; SOLV – the ratio of the equity of the company to its total assets; FIXASSET – the percentage of the fixed assets of the company to its total assets; FRCON – the natural logarithm of the number of foreign countries plus 1; FRSUB – the natural logarithm of the number of foreign subsidiaries plus 1; FSALE - the ratio of the foreign revenues to the total revenues of the company; FCOST - the ratio of the foreign costs to the total costs of the company; FASSET – the ratio of the foreign assets to the total assets of the company; RATT – the ordered variable coded as 1=”totally risk averse”, 2=”fairly risk averse” 3=“risk taking”; ENV - the ordered variable coded as 1=”very stable”, 2=”fairly stable”, 3= “not particularly stable or volatile” 4= “fairly volatile” and 5 = “very volatile”; DEP - 1 = both the financial and operational departments are involved in the risk management 0 = only the financial department is involved in the risk management; IND - binary variable: 1= an industrial company, 0= a service company.
PANEL A
PANEL B
PANEL C
PANEL D
REAL ACTIONS UNDERTAKEN
REAL ACTIONS POTENTIAL
SHORTSIGHTED FINANCIAL MEANS USED LONGSIGHTED FINANCIAL MEANS USED
Regressor
M1 M3 M4 M1 M3 M4 M1 M3 M4 M1 M3 M4
C n/a n/a n/a n/a n/a n/a -11,380 * -11,380 * -12,150 * -0,491 -1,312 -2,207
0,001 0,002 0,002 0,881 0,703 0,567
TOASSET 0,508 ** 0,546 ** 0,518 ** 0,340 0,309 0,266 0,931 * 0,927 0,967 * -0,021 0,060 0,132
0,024 0,017 0,032 0,129 0,173 0,258 0,002 0,002 0,004 0,941 0,843 0,680
ROE -0,301 -0,273 -0,246 -0,418 *** -0,410 *** -0,404 *** 0,249 0,323 0,294 0,774 *** 0,719 *** 0,671
0,152 0,204 0,265 0,055 0,065 0,077 0,452 0,348 0,397 0,061 0,077 0,110
SOLV -0,471 -0,491 -0,477 0,320 0,397 0,428 -0,421 -0,362 -0,426 -1,096 -1,277 -1,311
0,472 0,459 0,473 0,620 0,544 0,515 0,620 0,674 0,623 0,197 0,154 0,144
FIXASSET -0,687 -0,670 -0,713 0,197 0,252 0,275 -0,707 -0,551 -0,643 0,644 0,524 0,467
0,250 0,271 0,252 0,734 0,668 0,645 0,329 0,455 0,396 0,373 0,486 0,544
FRCON 0,387 ** 0,454 * 0,433 * 0,373 ** 0,360 ** 0,377 ** 0,316 0,334 0,306 0,159 0,196 0,199
0,012 0,005 0,010 0,017 0,027 0,027 0,130 0,116 0,167 0,432 0,370 0,039
FSALE 0,024 0,176 0,256 -0,311 -0,209 -0,118 0,435 0,859 0,835 1,819 * 1,641 ** 1,540 **
0,960 0,747 0,654 0,510 0,708 0,840 0,433 0,206 0,246 0,003 0,023 0,041
FCOST -0,829 -0,816 0,305 0,249 -0,120 0,023 -1,003 -0,932
0,182 0,194 0,618 0,687 0,882 0,978 0,234 0,278
FASSET 0,136 0,117 -0,387 -0,368 -0,738 -0,767 1,372 ** 1,397 **
0,800 0,827 0,483 0,506 0,301 0,290 0,045 0,044
RKATT 0,134 -0,045 0,212 0,005
0,592 0,859 0,503 0,988
ENVR -0,045 -0,076 -0,002 0,048
0,712 0,539 0,991 0,777
DEP 0,152 0,060 -0,049 -0,279
0,572 0,823 0,892 0,439
LR-statistic 17,3
19,1
19,8
12,2
12,8
13,3
24,3
25,6
26,1
25,1
29,9
30,6
p-value 0,008
0,014
0,048
0,058
0,119
0,272
0,000
0,001
0,006
0,000
0,000
0,001
n 81
81
81
81
81
81
81
81
81
81
81
81