THESIS FOR THE DEGREE OF LICENTIATE OF ENGINEERING Kinetic Studies of NO Oxidation
60
THESIS FOR THE DEGREE OF LICENTIATE OF ENGINEERING Kinetic Studies of NO Oxidation and Reduction over Silver-Alumina Catalyst MUHAMMAD MUFTI AZIS Department of Chemical and Biological Engineering CHALMERS UNIVERSITY OF TECHNOLOGY Göteborg, Sweden 2013
Transcript of THESIS FOR THE DEGREE OF LICENTIATE OF ENGINEERING Kinetic Studies of NO Oxidation

THESIS FOR THE DEGREE OF LICENTIATE OF ENGINEERING Kinetic Studies of NO Oxidation and Reduction over Silver-Alumina Catalyst MUHAMMAD MUFTI AZIS
Department of Chemical and Biological Engineering CHALMERS UNIVERSITY OF TECHNOLOGY Göteborg, Sweden 2013

ii
Kinetic Studies of NO Oxidation and Reduction over Silver-Alumina Catalyst Muhammad Mufti Azis © MUHAMMAD MUFTI AZIS, 2013 Licentiatuppsatser vid Institutionen för Kemi- och bioteknik Chalmers tekniska högskola Serie nr. 2013: 17 ISSN 1652-943X Department of Chemical and Biological Engineering Chalmers University of Technology SE-41296 Göteborg, Sweden Telephone: +4631 7721000 Printed by: Reproservice Göteborg, Sweden (2013)

iii
Kinetic Studies of NO Oxidation and Reduction over Silver-Alumina Catalyst MUHAMMAD MUFTI AZIS Department of Chemical and Biological Engineering Chalmers University of Technology, Göteborg 2013 Abstract In line with growing concerns to manufacture more environmentally friendly vehicles, the use of internal combustion engines operating with oxygen excess or so called lean-burn engines will continue to be increasingly used. For lean-burn operation, reduction of NOx (NO+NO2) emissions is a major challenge and it is therefore urgently required to develop efficient and reliable NOx reduction aftertreatment systems for a wide variety of lean-burn or diesel engines. The main goal of this thesis is to increase the understanding of the reaction mechanism of selective catalytic reduction (SCR) of NOx with a hydrocarbon (HC) reductant over Ag-Al2O3 catalysts. As an important subsystem in the HC-SCR mechanism, H2 assisted NO oxidation over a monolith-supported Ag-Al2O3 catalyst was investigated by constructing a microkinetic model that accounted for heat and mass transport in the catalyst washcoat. The effect of H2 examined in the kinetic model, was to reduce self-inhibiting surface nitrate species on active sites. A reduced factorial design of the inlet experimental conditions was used to generate transient experimental data. In general, the modelling results could reproduce the transient experimental data well with correct levels of outlet concentrations and time scales for transient responses. When H2 was present in the feed, the kinetic model showed that H2 was consumed rapidly in the front part of the monolith. This indicated that the H2 promotion of the NO oxidation reaction may have been isolated to only a portion of the catalyst. A series of temperature-programmed desorption (TPD) studies of NOx were conducted over Ag-Al2O3 catalysts to quantify and characterize the stability of surface NOx species. Formation of two general groups of surface NOx species were found to be present: a less thermally stable group of so called “low temperature (LT) nitrates” and a more thermally stable group of “high temperature (HT) nitrates”. The LT NOx desorption peak could be attributed to the decomposition of nitrate species formed on the active sites. Elimination or decrease in quantities of these LT nitrates either thermally or by reaction with H2 resulted in higher NO oxidation and NOx reduction conversion. The HT NOx desorption peak primarily corresponded to the decomposition of nitrates on the Al2O3 support and could be considered spectator surface species. It was also found that H2 facilitates formation of nitrate on the Al2O3 support and it was indicative that the mechanism of NOx storage on the Al2O3 support was mainly via NO2 readsorption. From TPD studies of C3H6-SCR in the presence and absence of H2, it was shown that the presence of H2 not only eliminated LT nitrates but also promoted the formation of adsorbed hydrocarbons. Therefore, the dual role of H2 to both eliminate nitrates from active sites and promote NOx storage was elucidated. Keywords: HC-SCR, Silver Alumina, Hydrogen effect, Kinetic modeling, TPD, NOx reduction, NO oxidation.

iv

v
List of Appended Papers This work is based on the work presented in the following papers: I. Microkinetic modeling of H2-assisted NO oxidation over Ag-Al2O3 Muhammad Mufti Azis, Hanna Härelind, Derek Creaser
Chemical Engineering Journal, 221 (2013), 382-397. II. Temperature-programmed desorption studies of NOx over Ag-Al2O3 as lean
NOx reduction catalyst Muhammad Mufti Azis, Hanna Härelind, Derek Creaser Manuscript to be submitted for publication My contribution to the publications
Paper I I prepared the catalyst, performed flow reactor experiments, developed microkinetic model, interpreted the results together with my coworkers and was responsible for writing and submitting the paper. Paper II I partially prepared the catalyst, performed flow reactor experiments, interpreted the results together with my coworkers and was responsible for writing the manuscript.

vi
Table of Contents 1 Introduction………………………………………………………………………………………………………………… 1
1.1 NOx emission abatement from lean-burn engine………………………………………….………….. 1
1.2 Objectives…………………………………………………………………………………………………………………. 4
2 Hydrocarbon-Selective Catalytic Reduction (HC-SCR) over silver alumina catalyst………………………………………………………………………………………………………………............. 5
2.1 General ……………………………………………………………………………………………………………………….. 5
2.2 Silver alumina for HC-SCR ……………………………………………………………………………………………. 5
2.3 Mechanistic studies and H2 effect………………………………………………………………………………… 7
3 Experimental part……………………………………………………………………………………………………….. 10
3.1 Catalyst preparation…………………………………………………………………………………………………….. 10
3.2 Coating of monolith with silver alumina powder………………………………………………………… 10
3.3 Flow reactor experiments……………………………………………………………………………………………. 11
3.4 In-situ DRIFT spectroscopy…………………………………………………………………………………………. 11
4 Kinetic modeling…………………………………………………………………………………………………………. 13
4.1 General………………………………………………………………………………………………………………………… 13
4.2 Types of kinetic models………………………………………………………………………………………………… 13
4.2.1 First principle modeling……………………………………………………………………………………....... 13
4.2.2 Lumped kinetic modeling……………………………………………………………………………………….. 14
4.2.3 Microkinetic modeling……………………………………………………………………………………………. 15
5 Reactor model: Single channel reactor model……………………………………………………………… 18
5.1 General ……………………………………………………………………………………………………………………….. 18
5.2 Modeling of mass and heat balances……………………………………………………………………………. 20
5.3 Modeling mass and heat transport ……………………………………………………………………………… 22
5.4 Matlab implementation: simulation and parameter estimation…………………………………… 23

vii
6 Microkinetic modeling of H2-assisted NO oxidation…………………………………………………….. 25
6.1 General ……………………………………………………………………………………………………………………….. 25
6.2 Kinetic analysis ……………………………………………………………………………………………………………. 26
6.3 Results and discussion…………………………………………………………………………………………………. 27
7 Stability of NOx surface species: in-situ DRIFT spectroscopy and TPD studies……………. 32
7.1 Roles of surface NOx species ………………………………………………………………………………………… 32
7.2 In-situ DRIFT Spectroscopy…………………………………………………………………………………………… 33
7.3 TPD studies of NOx………………………………………………………………………………………………………. 35
7.3.1 Nitrate formation following adsorption of NO-O2, NO-O2-H2 and NO2-O2 gas
mixture over Ag-Al2O3 catalyst………………………………………………………………………………… 35
7.3.2 Mechanistic insight regarding C3H6-SCR and H2 assisted C3H6-SCR………………………….. 39
8 Conclusions and outlook……………………………………………………………………………………………… 44
9 Acknowledgements……………………………………………………………………………………………………. 46
10 Bibliography……………………………………………………………………………………………………………… 47
viii
Nomenclature Roman symbols Description Unit
mass and/or heat transfer area m2
preexponential factor s-1
concentration mol.m-3
heat capacity J.mol-1.K-1
channel diameter m
axial dispersion coefficient m2.s-1
binary diffusivity m2.s-1
effective diffusivity m2.s-1
activation energy kJ.mol-1
molar flow rate mol.s-1
tortuosity factor - ∆ Gibbs free energy of overall gas reaction J.mol-1 ℎ convection heat transfer coefficient J.m-2.K-1 ∆ enthalpy change of elementary step J.mol-1 ∆ enthalpy change of overall gas reaction J.mol-1
rate constant s-1
equilibrium constant -
mass transport coefficient m.s-1
reactor length m ln(kref) natural logarithmic of rate constant at reference temperature
mol.s-1.kg-1
mass of segmental solid material kg
number of ideal tank-in-series -
molar flux mol.m-2.s-1
number of sites mol.kg-1
Peclet number -
heat flux in segmental solid material J.m-2.s-1

ix
reaction rate mol.s-1.kg-1
range for parameter scaling -
gas constant J.mol-1.K-1
sum of the squares of error - ∆ entropy change of overall gas reaction J.mol-1.K-1
time step s
temperature K
superficial gas velocity m.s-1
mass of segmental catalyst kg
diffusion length m ∆ thickness of segmental layer m ∆ the first thickness of first washcoat layer m
molar fraction - ∆ length of segmental tanks m
Greek symbols Description Unit
fitted kinetic parameters -
lumped mass transfer coefficient m3.s-1
fractional surface coverage -
heat conductivity of segmental washcoat W.K-1.m-1
stoichiometric coefficient -
variance of impulse response -
mean residence time s
stoichiometric coefficient of adsorbed species -
Subscript Description
backward reaction
forward reaction
gas
gas component index

x
reaction index
tank index
layer index
reactor
reference condition
solid
scaled parameter
washcoat surface
unscaled parameter
surface component index
axis perpendicular to the gas bulk flow

1
1 Introduction 1.1 NOx emission abatement from lean-burn engine
Improvement of urban air quality is always an important environmental issue particularly with
growing concern to create a sustainable society. Road transportation is a major contributor to
urban air pollution and therefore regulations have been made in several countries to reduce
emissions from road transportation such as the Clean Air Act in the US and European emission
standard EURO [1]. The major air pollutants targeted in the regulations are CO, Nitrogen oxide
(NOx), Hydrocarbon and particulate matter [2]. Since global warming is also an alarming
concern nowadays, very recently CO2 emissions from vehicles have also been regulated for light
duty and heavy duty fleets [2].
NOx is an interesting and important chemical compound in air pollutants in which its
occurrence in the atmosphere is due to exhaust gas produced in combustion engines which is
the most common form of propulsion for vehicles [1]. Emission of NOx to the atmosphere has
severe consequences. Firstly, NOx plays a crucial role in the acid deposition problem [3]. In the
atmosphere, NO readily oxidizes to NO2 (reddish brown gas) and some of the NO2 will react
further with water vapor to from nitric acid and cause acid deposition (acid rain) damaging
trees, soils and lakes. Secondly, NO together with NO2 are responsible for the formation of
photochemical smog. Nitrogen oxides will react with sunlight and volatile organic compounds
(VOC) to form air-borne particles and ground level ozone known as photochemical smog. Smog
usually occurs in large cities with sunny and warm climates packed with heavy road traffic.
Photochemical smog has also serious health effects as it may cause or exacerbate respiratory
related diseases [1, 3].
Most Internal combustion engines (ICE) nowadays use fossil fuel and compressed air. Since air
contains 79% of N2, in a highly oxidative atmosphere N2 can be converted to NOx that is
harmful to the environment. Generally, there are three ways to form NOx during combustion
[1]:

2
• Thermal NOx: the NOx is produced from equilibrium reactions between N2 and O2 at
elevated temperature such as in an ICE. The NOx emissions from an ICE is primarily as
NO. The mechanism of NO formation is described by the Zeldovich mechanism [1]: + ↔ + (1) + ↔ + (2) + ↔ + (3)
• Fuel NOx: The minor source of NOx in emissions originates from nitrogen bound to the
fuel (like oil or coal). During combustion, nitrogen may ionize and form free radicals to
form N2 or NO.
• Prompt NOx: During the initial stage of combustion, atmospheric nitrogen can react
with fragments of hydrocarbons from the fuel forming several intermediates like NH and
CN species. Further oxidation of these species will produce NO. The abundance of
prompt NOx is a subject of scientific debate and it is estimated that prompt NOx is less
dominating.
In the late 70s, the commercial three way catalyst was introduced in the US and functioned
effectively to reduce CO, hydrocarbon and NOx emissions in parallel from gasoline engines. In
an ordinary gasoline engine, the ratio between the air and fuel is near stoichiometric conditions
for complete combustion. In line with the demand to achieve better fuel efficiency, diesel
engines or lean-burn engines will increasingly become the major type of combustion engine in
the future. In a diesel engine or lean-burn engine, the O2 supply (as air) is in excess with respect
to the amount of fuel and this will result in improved power output with lower CO2 emissions
[2, 4]. However, the conventional three way catalyst does not function effectively to clean up
the lean-burn exhaust, particularly NOx emissions. Therefore, a better designed vehicle
emission abatement system must be implemented [4].
There are two broad methods to control NOx emissions from ICE: pollution prevention aiming
to reduce NOx generation (primary technique) and post-combustion treatment aiming to
reduce NOx emissions (secondary technique) [1]. In a primary technique, NOx generation in the

3
ICE is suppressed by decreasing combustion temperature and controlling the oxygen-fuel
concentration. An example of a primary technique is Exhaust Gas Recirculation (EGR). Selective
catalytic reduction is an example of a secondary NOx abatement method.
The catalytic aftertreatment system is a common method to abate vehicle emission from
mobile sources. In a modern diesel engine, the catalytic aftertreatment system often consists of
three main parts: diesel oxidation catalyst (DOC), diesel particulate filter (DPF) and NOx
reduction catalyst as depicted in Figure 1. The main function of the DOC is to oxidize carbon
containing gases and to oxidize NO to NO2. In the following part, the DPF traps solid particulate
matters and NO2 produced upstream in the DOC can be used for passive regeneration of the
DPF. Eventually, a NOx catalyst is installed to convert the existing NOx to N2 before releasing it
to the atmosphere.
Figure 1. General schematic view of after treatment system in a lean-burn or diesel engine
vehicle
For NOx reduction in a lean-burn system, Selective Catalytic Reduction (SCR) is a reliable
method and has been widely installed in both mobile and stationary systems. With the SCR
technique, the NOx is converted to N2 with the aid of reductants. One way to do this is by using
NH3 (or urea solution) as the reducing agent, so called NH3-SCR. Additional installation of a urea
tank is needed onboard and it further requires an injection strategy to achieve better efficiency
in NH3 consumption.
Another technology to catalytically reduce NOx is the lean NOx trap (LNT) pioneered by Toyota
which appeared on the market in 1994 [5]. Here, the NOx is stored on a catalyst (typically a

4
Barium based catalyst) under a lean period and followed by a short period (rich period) to
regenerate the catalyst using a reducing agent. One of the challenges in LNT is deactivation by
sulphur poisoning, where sulphur is converted to strongly bound sulphates and thus decreases
the NOx storage capacity (as nitrates). Several attempts to improve the LNT technique have
been discussed in literature [6]
The third concept of de-NOx technology in a lean-burn engine is hydrocarbon-SCR (HC-SCR).
Here, the goal is to use the diesel fuel itself as a reducing agent and therefore installation of an
additional tank for a reducing agent is not required. One of the potential catalysts for HC-SCR is
silver alumina. Since HC-SCR over silver alumina catalysts will be the main focus of this thesis, it
merits further discussion as presented in the following chapter.
1.2 Objectives
The overall goal of the project is to increase understanding of the reaction mechanism of HC-
SCR over silver alumina catalysts. In this thesis, we have focused on the NO oxidation reaction
as a starting-point for studying HC-SCR. Understanding the activation and formation of surface
NOx species can be useful to elucidate the mechanism of HC-SCR over Ag-Al2O3. To achieve this,
we initially developed a microkinetic model for H2 assisted NO oxidation from transient
experimental data. Subsequently, we conducted a series of TPD experiments to investigate the
stability and characteristic of surface NOx species within the framework of HC-SCR. These
findings may serve as an important basis to further understand the reaction mechanism of HC-
SCR over Ag-Al2O3.

5
2 Hydrocarbon-Selective Catalytic Reduction (HC-SCR) over silver alumina catalyst 2.1 General
Early work on NOx removal in lean-burn or diesel engine exhaust conditions with hydrocarbon-
SCR (HC-SCR) was pioneered by Iwamoto and Yahiro [7] and separate work by Held et al. [8] in
the early 90s. Since then, numerous catalysts have been proposed and tested such as zeolitic
based catalysts, platinum group metal (PGM) catalysts and several base metal oxides [9]. It
appeared eventually that the two most promising candidates for HC-SCR are Cu-ZSM5 (typical
maximum activity at high temperature region around 350°C) and Pt/Al2O3 (typical maximum
activity at low temperature region around 250°C) [4]. However, challenges still remained since a
significant amount of NOx is emitted in a temperature window between 250 and 350°C (quite
common diesel exhaust temperature) which is not effectively covered by either Pt/Al2O3 or Cu-
ZSM5. In addition, one shortcoming with Pt/Al2O3 as a HC-SCR catalyst is its significant
selectivity for production of N2O which is one of the detrimental greenhouse gases and hence
its emission to the atmosphere must be minimized.
Cu-ZSM5 as an alternative candidate for a HC-SCR catalyst unfortunately also has some
limitations. It has been reported in literature that Cu-ZSM5 suffers from poor hydrothermal
durability, where the activity for NOx removal degrades in the presence of water vapor (real
exhaust gas typically contains a H2O concentration >10%) due to de-alumination of the zeolite
framework at high temperature [4, 9]. Several attempts to augment the water resistance of
zeolitic based materials have been reported [10, 11]. However, the main issue related to poor
low temperature activity over Cu-ZSM5 has hindered further development of this catalyst as a
HC-SCR catalyst.
2.2 Silver alumina for HC-SCR
There is considerable interest in developing HC-SCR catalysts with a high activity over a broad
temperature window, good hydrothermal stability, sulphur tolerance, economically competitive
as well as providing potential for a minimal fuel penalty. Silver alumina appears to be a
6
promising candidate for HC-SCR application and has been widely investigated since the
pioneering work by Miyadera in 1993 [12]. However, it is worth mentioning that silver alumina
catalysts have poor performance in the low temperature region, until it was found that the
addition of H2 to the inlet feed gave a substantial increase in the low temperature activity [13,
14]. Since then, numerous studies have been devoted to investigate the role of H2 and the
reaction mechanism of H2-assisted HC-SCR.
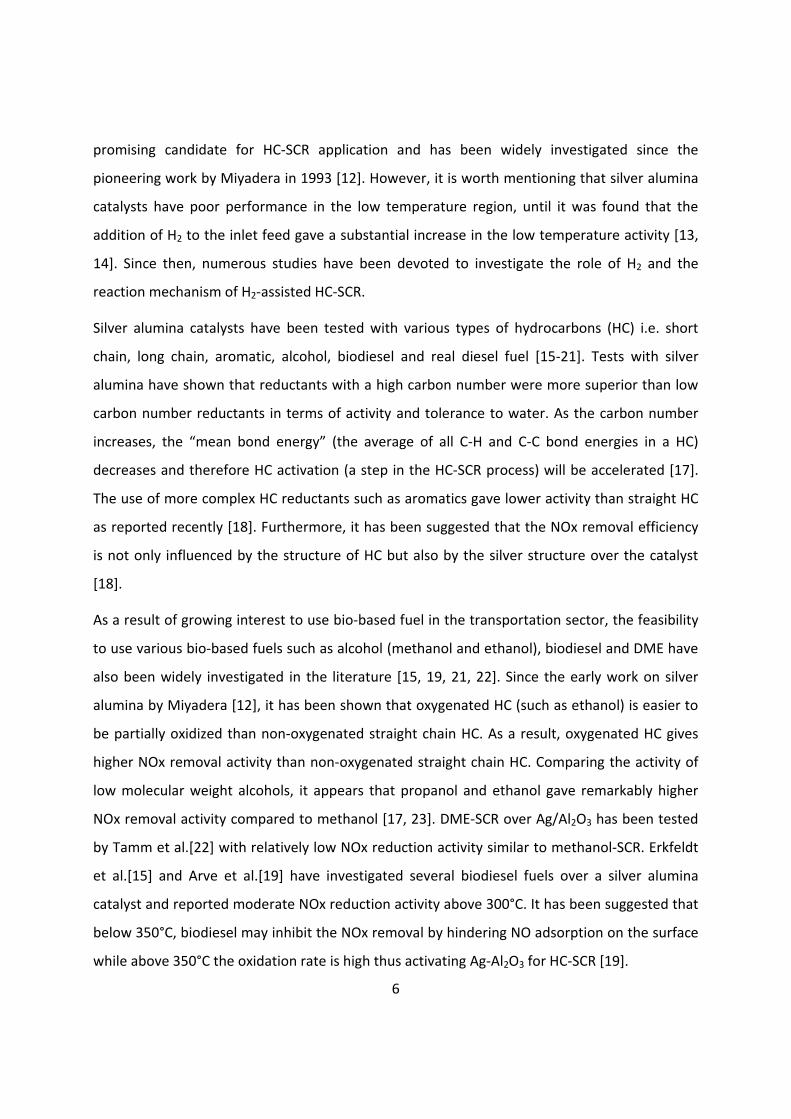
Silver alumina catalysts have been tested with various types of hydrocarbons (HC) i.e. short
chain, long chain, aromatic, alcohol, biodiesel and real diesel fuel [15-21]. Tests with silver
alumina have shown that reductants with a high carbon number were more superior than low
carbon number reductants in terms of activity and tolerance to water. As the carbon number
increases, the “mean bond energy” (the average of all C-H and C-C bond energies in a HC)
decreases and therefore HC activation (a step in the HC-SCR process) will be accelerated [17].
The use of more complex HC reductants such as aromatics gave lower activity than straight HC
as reported recently [18]. Furthermore, it has been suggested that the NOx removal efficiency
is not only influenced by the structure of HC but also by the silver structure over the catalyst
[18].
As a result of growing interest to use bio-based fuel in the transportation sector, the feasibility
to use various bio-based fuels such as alcohol (methanol and ethanol), biodiesel and DME have
also been widely investigated in the literature [15, 19, 21, 22]. Since the early work on silver
alumina by Miyadera [12], it has been shown that oxygenated HC (such as ethanol) is easier to
be partially oxidized than non-oxygenated straight chain HC. As a result, oxygenated HC gives
higher NOx removal activity than non-oxygenated straight chain HC. Comparing the activity of
low molecular weight alcohols, it appears that propanol and ethanol gave remarkably higher
NOx removal activity compared to methanol [17, 23]. DME-SCR over Ag/Al2O3 has been tested
by Tamm et al.[22] with relatively low NOx reduction activity similar to methanol-SCR. Erkfeldt
et al.[15] and Arve et al.[19] have investigated several biodiesel fuels over a silver alumina
catalyst and reported moderate NOx reduction activity above 300°C. It has been suggested that
below 350°C, biodiesel may inhibit the NOx removal by hindering NO adsorption on the surface
while above 350°C the oxidation rate is high thus activating Ag-Al2O3 for HC-SCR [19].

7
The knowledge on the role of active sites over Ag/Al2O3 as a NOx reduction catalyst is still
unclear. Depending on the preparation method, several suggestions have been put forward
mentioning the presence of metallic silver, oxidized silver, isolated ionic silver and silver
aluminate [24, 25]. Furthermore, it has also been suggested that the role of small silver clusters
( ) is important [26]. Although the exact role of each possible silver site is still being
investigated, it is generally accepted that metallic silver has an oxidizing function and is thus
responsible for activation of HC and NOx. Small silver clusters and oxidized silver have been
proposed to activate the NOx reduction activity by partially oxidizing the reductant and
promoting surface nitrate formation. Shimizu and Satsuma have summarized various silver
states as active sites in their review and references therein [17]. The proportion of small silver
clusters and metallic silver depends much on the silver loading and preparation technique. With
impregnation methods, high silver loading tends to produce more metallic silver while low
silver loading gives a higher proportion of small clusters of silver [24]. Sol-gel methods produce
catalysts containing small silver clusters and oxidized silver which are more finely distributed in
the alumina matrix [27].
2.3 Mechanistic studies and H2 effect
One of the most challenging parts in HC-SCR over Ag/Al2O3 catalysts is to understand the
reaction mechanism of NOx reduction, which is particularly complicated by the nature of
hydrocarbons used that contribute to the formation of a number of intermediates (both
spectators and active intermediates) during reaction. Several literature reports have addressed
mechanistic aspects of NOx reduction over Ag/Al2O3 [9, 17, 21, 26, 28].
A general schematic diagram of HC-SCR mechanism over Ag/Al2O3 is shown in Figure 2.
Generally the first step of HC-SCR is activation of NO and HC by O2. NO and O2 will form NOx
surface species (nitrates and nitrites). Strongly adsorbed nitrate is known to self-inhibit the NOx
reduction at low temperature [23, 29]. For activation of HC, the O2 partially oxidizes the HC to
form oxygenated HC surface components. Although the formation of oxygenated HC is
generally agreed to occur, however, the structure and role of oxygenated HC surface
compounds remains a subject of debate in the literature. Different interpretations of HC

8
intermediates can be due to a variety of experimental conditions [17]. In the subsequent part of
the HC-SCR mechanism, the nitrogen containing species are expected to react with oxygenated
HC surface species forming several surface intermediates where the major surface species are
R-NO (nitroso species), R-ONO (nitrite species), R-NO2(nitro species), R-CN (cyanide species), R-
CNO(isocyanate species) and R-NH2 (amine species) [28]. It is believed that cyanide, isocyanate
and amines are the dominant routes to eventually form gaseous N2 during the HC-SCR [30-32].
Figure 2. Schematic diagram of the reaction mechanism of H2-assisted HC-SCR over Ag/Al2O3,
adapted from [28, 33].
Perhaps, the most interesting feature of the silver alumina system for HC-SCR is the fact that
the addition of small amounts of H2 can strongly promote low temperature NOx reduction
activity and therefore result in a wider temperature window for HC-SCR. Another catalyst that
is promoted by H2 for HC-SCR activity is Ag-MFI [34]. Defining the exact role of H2 in HC-SCR
over Ag/Al2O3 is far from trivial. From literature, there are several proposed explanations for
the “H2 effect” including:
• the enhancement of the partial oxidation of the reducing agent [28, 35].
• formation of reactive N species (like –NCO species [36] or gas phase radicals [28]) from the
reducing agent.
• the accelerated formation of active cationic silver clusters [17, 26].
• the destabilization of surface nitrates blocking active silver sites [14, 35, 37-41]
• generation of Ag-hydride leading to formation of hydroperoxy radicals (HO2), peroxide
( ) and superoxide ions ( ) [26, 42].

9
It should also be considered that in a HC-SCR, it is possible that H2 can have multiple roles
among the effects mentioned above [14]. A recent study by Kim et al.[43] classified the roles of
H2 as fast process and slow process. The kinetic effect of H2 was classified as a fast process in
the time range of seconds. Here, H2 activates formation of adsorbed surface species and
chemical change of oxidized silver. Morphological changes such as the formation of silver
clusters is classified as a slow process in the time scale of minutes.
It is important to mention that with addition of H2, NH3-SCR over Ag/Al2O3 was considerably
promoted compared to in the absence of H2 [44]. For this reason, the study of Ag/Al2O3 for HC-
SCR and NH3-SCR has also gained interest.
10
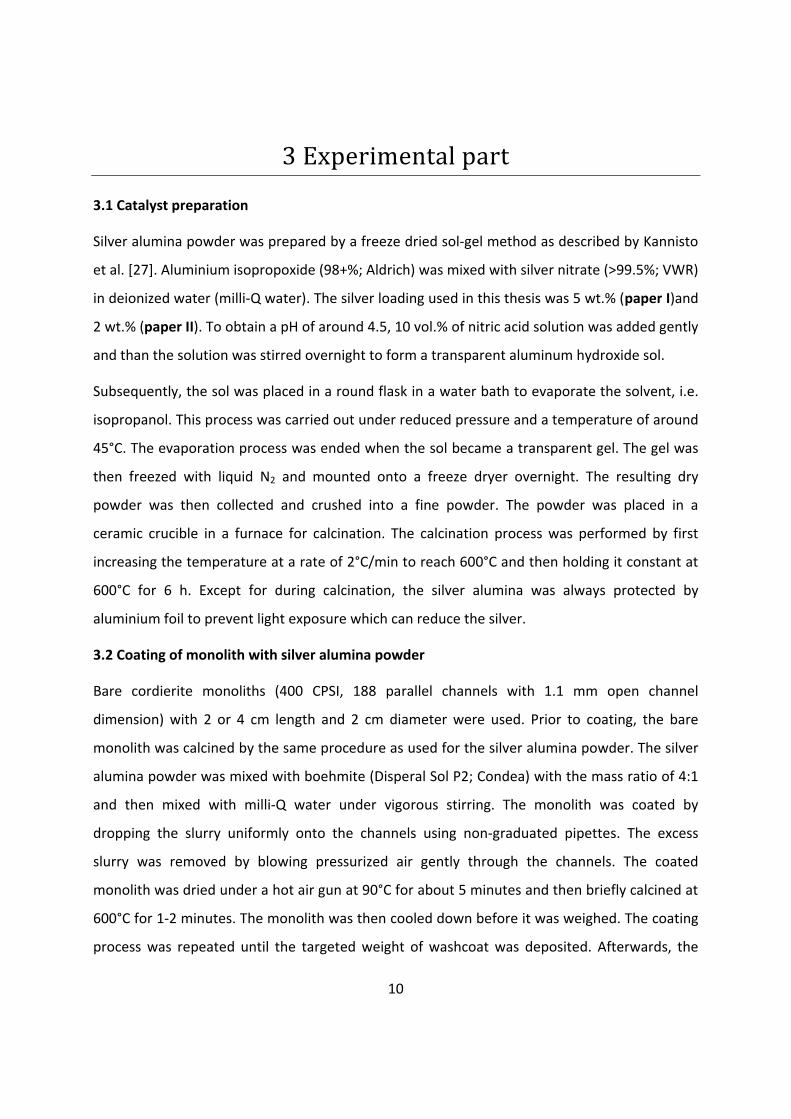
3 Experimental part 3.1 Catalyst preparation
Silver alumina powder was prepared by a freeze dried sol-gel method as described by Kannisto
et al. [27]. Aluminium isopropoxide (98+%; Aldrich) was mixed with silver nitrate (>99.5%; VWR)
in deionized water (milli-Q water). The silver loading used in this thesis was 5 wt.% (paper I)and
2 wt.% (paper II). To obtain a pH of around 4.5, 10 vol.% of nitric acid solution was added gently
and than the solution was stirred overnight to form a transparent aluminum hydroxide sol.
Subsequently, the sol was placed in a round flask in a water bath to evaporate the solvent, i.e.
isopropanol. This process was carried out under reduced pressure and a temperature of around
45°C. The evaporation process was ended when the sol became a transparent gel. The gel was
then freezed with liquid N2 and mounted onto a freeze dryer overnight. The resulting dry
powder was then collected and crushed into a fine powder. The powder was placed in a
ceramic crucible in a furnace for calcination. The calcination process was performed by first
increasing the temperature at a rate of 2°C/min to reach 600°C and then holding it constant at
600°C for 6 h. Except for during calcination, the silver alumina was always protected by
aluminium foil to prevent light exposure which can reduce the silver.
3.2 Coating of monolith with silver alumina powder
Bare cordierite monoliths (400 CPSI, 188 parallel channels with 1.1 mm open channel
dimension) with 2 or 4 cm length and 2 cm diameter were used. Prior to coating, the bare
monolith was calcined by the same procedure as used for the silver alumina powder. The silver
alumina powder was mixed with boehmite (Disperal Sol P2; Condea) with the mass ratio of 4:1
and then mixed with milli-Q water under vigorous stirring. The monolith was coated by
dropping the slurry uniformly onto the channels using non-graduated pipettes. The excess
slurry was removed by blowing pressurized air gently through the channels. The coated
monolith was dried under a hot air gun at 90°C for about 5 minutes and then briefly calcined at
600°C for 1-2 minutes. The monolith was then cooled down before it was weighed. The coating
process was repeated until the targeted weight of washcoat was deposited. Afterwards, the
11
coated monolith was calcined with a heating rate of 2°C/min to 600°C and held constant at
600°C for 3 h.
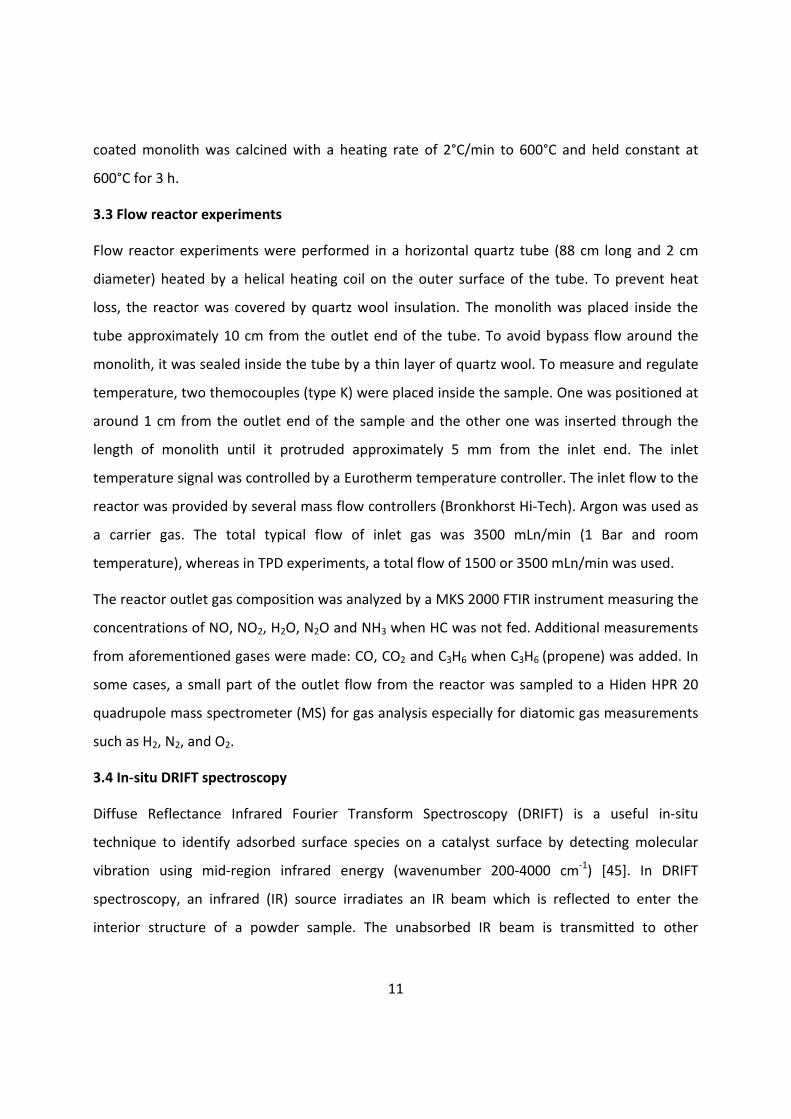
3.3 Flow reactor experiments
Flow reactor experiments were performed in a horizontal quartz tube (88 cm long and 2 cm
diameter) heated by a helical heating coil on the outer surface of the tube. To prevent heat
loss, the reactor was covered by quartz wool insulation. The monolith was placed inside the
tube approximately 10 cm from the outlet end of the tube. To avoid bypass flow around the
monolith, it was sealed inside the tube by a thin layer of quartz wool. To measure and regulate
temperature, two themocouples (type K) were placed inside the sample. One was positioned at
around 1 cm from the outlet end of the sample and the other one was inserted through the
length of monolith until it protruded approximately 5 mm from the inlet end. The inlet
temperature signal was controlled by a Eurotherm temperature controller. The inlet flow to the
reactor was provided by several mass flow controllers (Bronkhorst Hi-Tech). Argon was used as
a carrier gas. The total typical flow of inlet gas was 3500 mLn/min (1 Bar and room
temperature), whereas in TPD experiments, a total flow of 1500 or 3500 mLn/min was used.
The reactor outlet gas composition was analyzed by a MKS 2000 FTIR instrument measuring the
concentrations of NO, NO2, H2O, N2O and NH3 when HC was not fed. Additional measurements
from aforementioned gases were made: CO, CO2 and C3H6 when C3H6 (propene) was added. In
some cases, a small part of the outlet flow from the reactor was sampled to a Hiden HPR 20
quadrupole mass spectrometer (MS) for gas analysis especially for diatomic gas measurements
such as H2, N2, and O2.
3.4 In-situ DRIFT spectroscopy
Diffuse Reflectance Infrared Fourier Transform Spectroscopy (DRIFT) is a useful in-situ
technique to identify adsorbed surface species on a catalyst surface by detecting molecular
vibration using mid-region infrared energy (wavenumber 200-4000 cm-1) [45]. In DRIFT
spectroscopy, an infrared (IR) source irradiates an IR beam which is reflected to enter the
interior structure of a powder sample. The unabsorbed IR beam is transmitted to other
12
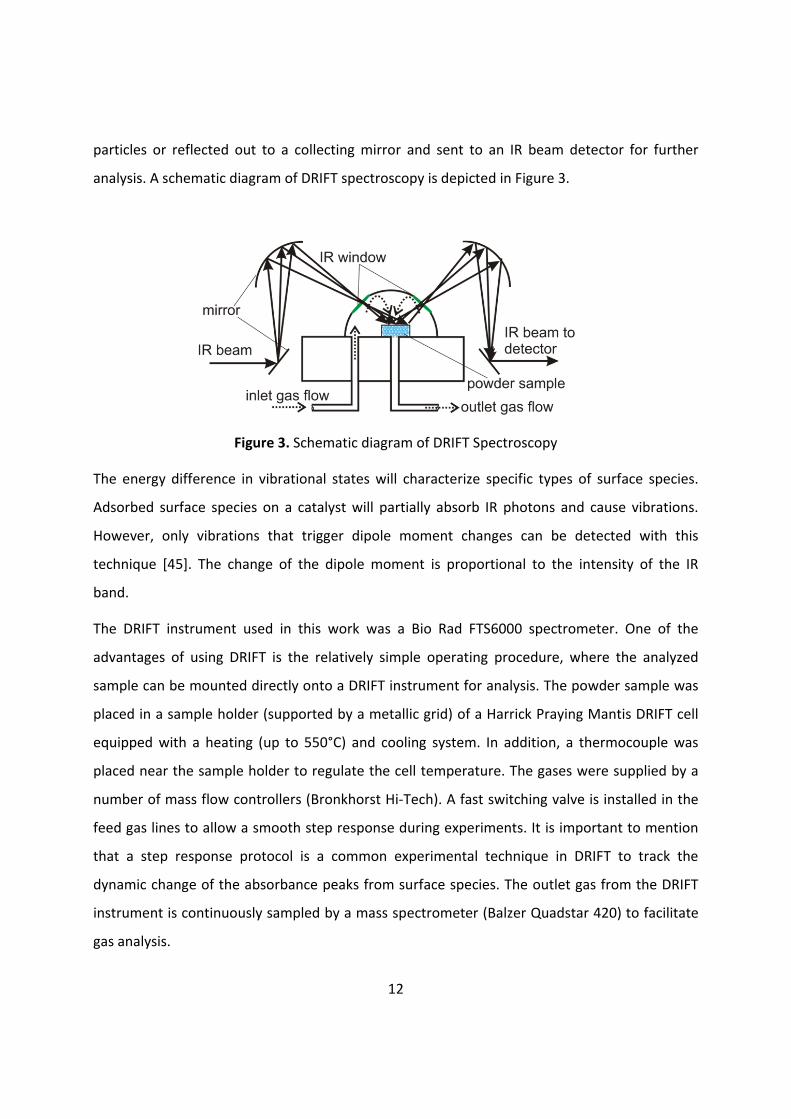
particles or reflected out to a collecting mirror and sent to an IR beam detector for further
analysis. A schematic diagram of DRIFT spectroscopy is depicted in Figure 3.
Figure 3. Schematic diagram of DRIFT Spectroscopy
The energy difference in vibrational states will characterize specific types of surface species.
Adsorbed surface species on a catalyst will partially absorb IR photons and cause vibrations.
However, only vibrations that trigger dipole moment changes can be detected with this
technique [45]. The change of the dipole moment is proportional to the intensity of the IR
band.
The DRIFT instrument used in this work was a Bio Rad FTS6000 spectrometer. One of the
advantages of using DRIFT is the relatively simple operating procedure, where the analyzed
sample can be mounted directly onto a DRIFT instrument for analysis. The powder sample was
placed in a sample holder (supported by a metallic grid) of a Harrick Praying Mantis DRIFT cell
equipped with a heating (up to 550°C) and cooling system. In addition, a thermocouple was
placed near the sample holder to regulate the cell temperature. The gases were supplied by a
number of mass flow controllers (Bronkhorst Hi-Tech). A fast switching valve is installed in the
feed gas lines to allow a smooth step response during experiments. It is important to mention
that a step response protocol is a common experimental technique in DRIFT to track the
dynamic change of the absorbance peaks from surface species. The outlet gas from the DRIFT
instrument is continuously sampled by a mass spectrometer (Balzer Quadstar 420) to facilitate
gas analysis.

13
4 Kinetic modeling 4.1 General
The role of a kinetic model is to consolidate available experimental data with theoretical
principles. It is hoped that a realistic kinetic model can capture the physical and chemical
phenomena on the catalyst and hence it can give essential insights in the development of a
catalyst. In a modern catalysis research cycle, development of a catalyst is not merely
attributed to the knowledge of catalyst synthesis and surface science, but also uses kinetic
modeling to elucidate the important steps in a reaction network (see Figure 4). According to
Thybaut and Marin [46] , there are three interconnected aspects i.e. synthesis, performance
and design are all important to create a successful catalyst for industrial applications. A better
understanding of kinetic information will improve the synthesis and design aspects of the
catalyst to obtain the best performance of a catalyst.
Figure 4. Schematic diagram of modern catalysis development. Adapted from [46]
4.2 Types of kinetic models
The level of kinetic modeling varies and generally can be classified as follow:
4.2.1 First principle modeling
First principle studies investigate how atoms react on a well defined surface. The rapid growth
of computational technology has facilitated first principle studies based on quantum mechanics
to give information about binding energies and electronic structures. The common method
used nowadays is Density Functional Theory (DFT). The results of DFT calculations can be useful
to support detailed kinetic modeling studies to approximate reasonable limits of kinetic

14
parameters (typically activation energies and preexponential factors). DFT modeling is not
covered in this thesis and thus interested readers in DFT simulation studies over Ag/Al2O3
catalysts are referred to other literature [47].
4.2.2 Lumped kinetic modeling
Power law models are one of the simplest lumped kinetic models, based on the overall
expression of a chemical reaction. Generally, a power law model can be written as: = (4)
Power law models may be quite practical to use, especially for industrial applications. However,
the applicability of the model is usually limited to a very narrow range of species
concentrations, temperature and catalyst composition. Therefore, extrapolation to different
catalysts and operating conditions is not very effective. A more detailed kinetic model needs to
be employed, if one is interested in investigating reaction mechanisms.
A Global kinetic model is another type of lumped kinetic model that is used to describe
heterogeneous catalytic reactions. Here, the description of the kinetic model considers
adsorption, surface reaction and desorption steps of reacting species. An example of a common
mechanism adopted in global kinetic modeling is Langmuir-Hinshelwood mechanisms where
the adsorbed species react on the catalyst surface followed by desorption of products into the
gas phase. Another mechanism available is Eley Rideal and Mars-Van-Kravelen. In an Eley Rideal
mechanism, gas phase reactants may react directly with adsorbed species to form chemical
reaction products as adsorbed species or gas phase species. In a Mars-Van-Kravelen
mechanism, the catalyst surface experiences a redox cycle during chemical process.
In a global kinetic modeling, one way to resolve the kinetic rate expression is by assuming that
one of the steps (can be adsorption, surface reaction or desorption) is the rate determining
step and all remaining steps in quasi-equilibrium. Generally, kinetic rate expressions of global
kinetic models can then be written as a function of gas phase properties as shown in equation
(5) [46].

15
= ( ) ∙ ( − )( ) (5)
In the early work of catalytic aftertreatment processes in vehicles, an empirical global kinetic
model was developed for NO, CO and hydrocarbon oxidation by Voltz [48]. This model is still
widely used today, although often in somewhat expanded forms. It is noteworthy that one of
the drawbacks of this method is the lack of physical interpretation of the kinetic parameters
and therefore its range of predictability is limited [49]. Several challenges and limitations
involved in obtaining a reliable kinetic model in automotive catalysis have been discussed by
Olsson and Andersson [49]. For further assessment of kinetic analysis in heterogeneous
catalysis, see a review by Lynggard et al.[50].
4.2.3 Microkinetic modeling
Microkinetic analysis is a tool to investigate the reaction mechanism over heterogeneous
catalysis by assembling several elementary steps without pre-assuming that any step is the rate
determining step or intermediate surface species most abundant [51]. Microkinetic analysis will
typically generate a large number of elementary steps and form a highly correlated and non-
linear mathematical system. Since a wide range of kinetic parameters may fit the experimental
data, determination of kinetic parameters should be partially based on theoretical principles
(physically and chemically sound) and other correlations to bridge the gap between the
experimental data and the proposed microkinetic model.
A mean-field approximation is commonly used in a microkinetic model to describe the catalyst
surface which assumes [52]:
a. distribution of particle size and shape are equal.
b. distribution of active sites is equal.
c. the distance effect between two different active sites is neglected and will be lumped within
the effect of kinetic parameters.
d. adsorbed species are evenly distributed on the surface, i.e. islands of types of adsorbed
species do not form.

16
By putting forward these assumptions, the probability for all active sites (i.e. neglecting
differences between step and terrace sites) to adsorb gas phase reactants is considered equal.
Microkinetic modeling with the mean-field approximation has been used in paper I. A more
detailed work accounting for interaction of surface species on steps and terraces of active sites
by using Monte Carlo simulations can e.g. be found in Olsson et al. [53].
In a microkinetic model, all elementary steps are described as reversible reactions and the rate
of an elementary step as either a forward or backward reaction can be expressed as:
= ∙ . (6)
= ∙ exp (− . ) (7)
From equation (6), it is noteworthy to mention that the order of the reaction with respect to
gas phase or surface species concentration (ν) corresponds to the stoichiometry of the
reaction. Preexponential factors and activation energies are the common kinetic parameters to
estimate. In order to obtain reasonable kinetic parameter values, there are several strategies to
determine kinetic parameters: investigating a sub-system from a larger system and determine
the kinetic parameters independently, information from literature, thermodynamic restrictions,
collision theory, transition state theory, statistical thermodynamics and finally from regression
analysis with experimental data [6]. A combination of these methods can be used to obtain
kinetic information from parameter estimation.
Estimation of preexponential factors for adsorption steps is generally taken from collision
theory. The sticking coefficient at zero coverage is then fixed or estimated from literature
values. For desorption and surface reaction steps, a reasonable limit for preexponential factors
can be obtained from transition state theory [51].
Estimation of activation energies can be approximated from DFT calculation, bond-order
conservation theory (BOC) or via the related but more advanced UBI-QEP (Unity Bond Index-
Quadratic Exponential Potential) calculations and literature values [51]. Literature values of

17
UBI-QEP estimates have been used in paper I to estimate activation energies of desorption
steps [54].
Thermodynamic restrictions based on overall gas phase reactions can also be applied in
microkinetic modeling. Equilibrium of a chemical reaction is related to Gibbs free energy and its
thermodynamic correlation can be written as: ∆ = ∆ − ∆ = − ∙ ∙ ln( ) (8)
Rearranging equation 8 yields:
= ∆ ∙ −∆∙ (9)
The equilibrium constant, K, can also be expressed as a ratio between the rate constants of
forward and backward reactions:
= = ∙ (−( − )∙ ) (10)
Eventually thermodynamic restrictions for all elementary steps can be obtained by combining
equation 9 and 10:
( ) = (∆ ) (11)
∆ = ∙ − ∙ (12)
By implementing thermodynamic restrictions, one preexponential factor and one activation
energy can be estimated for each overall reaction using equations 11 and 12. A more rigorous
method to calculate thermodynamic consistency over a wide range of temperatures has been
demonstrated by Mhadeshwar et al.[55]. Another concept of kinetic modeling for
thermodynamic consistency is “Thermodynamic state variable modeling” by fitting the
temperature dependent thermodynamic parameters (H and S) of the adsorbed species and
transition states and using them in turn to estimate the kinetic parameters [52].

18
5 Reactor model: Single channel reactor model 5.1 General
Monolith-supported catalysts are the common form of catalysts used in the flow reactor
facilities at the Competence Centrum for Catalysis (KCK) at Chalmers. For modeling purposes,
the monolith catalyst or monolith reactor was simulated with a single channel reactor model as
depicted in Figure 5a. This reactor model has been used in a microkinetic modeling
investigation of H2-assisted NO oxidation as demonstrated in paper I.
Figure 5. Single channel monolith model showing the washcoat discretization in axial (a) and
radial direction (b) with arrows indicating mass transport.
As seen in Figure 5, the monolith reactor was modeled as tanks-in-series where the channel
was segmented both in the axial and radial directions. By dividing the washcoat into several
layers (Figure 5b), the reactor model is able to include internal mass transfer phenomena which
is commonly excluded in a conventional kinetic model. In each tank and layer, mass and heat
balance equations were solved for all gas and adsorbed surface species. The theoretical number
of tanks required in the axial direction can be estimated using the dispersion model for laminar
flow in an open-open system (equation 13-16) as described in [56]:
= (13)

19
= + ∙192 ∙ (14)
= ∙ (15)
1 = = 2 + 8 (16)
The theoretical number of tanks-in-series ( ) typically gives a large number of tanks and hence
requires extensive computational time. Therefore, an alternative approach to estimate the
number of tanks-in-series was employed by investigating the effect of varying the number of
tanks and layers on the calculated sum of the squares of error (SSE). This approach is illustrated
in Figure 6.
Figure 6. The effect of varying the number of tanks in series and number of layers on the
weighted sum of the squares (top panel) and simulation time using standard desktop computer
(lower panel). Filled symbols denote the simulation setup used in paper I.

20
As seen in Figure 6, varying the number of tanks and layers has affected the SSE. However,
increasing the number of layers from 4 to 6 only changed the SSE about 1.5% and therefore it
was concluded that 4 layers was sufficient to discretize the washcoat. From the lower panel of
Figure 6, it can be seen that the time required for simulation increased monotonically with the
increase of tanks and layers. From inspection of the gas concentration profiles, 10 tanks with an
appropriate axial distribution were found able to well resolve the axial gas concentration. For
simulation in paper I, 10 tanks and 4 layers has been used and it appeared to be sufficient to
reach grid independence with reasonable computational time. It is also important to mention
that the size of each tank (in axial direction) and layer (in radial direction) increased gradually to
obtain a finer discretization where the concentration gradients were steeper. Figure 7 shows a
schematic diagram of the washcoat depth and axial length discretization in the monolith
reactor as layers and tanks respectively.
Figure 7. The schematic diagram of monolith reactor discretization: radial discretization in each
tank (A) and axial discretization (B).
5.2 Modeling of mass and heat balances
The gas phase mass balance in each tank was modeled as a steady state mass balance between
axial convective flow and radial mass transfer as shown in equation 17. ∙ , , − , , − , , ∙ , , − , , = 0 (17)

21
The mass balance inside the washcoat is developed for each layer and characterized by radial
diffusion (perpendicular to the bulk flow) and reactions. Equation 18 shows the mass balance in
each layer (for layers n≥1)
, , ∙ , , − , , − , , ∙ , , − , , + , ∙ , , ∙ w , , = 0 (18)
The derivation of the overall mass transport coefficient ( ) presented in equation 18 will be
described in the following section.
A microkinetic model in this work was used to describe the transient simulations and therefore
should be able to explain the dynamic change of surface species coverages. The dynamic mass
balance of surface species is dictated by their involvement in reactions and expressed as:
∙ , , = r , , ∙ χ , (19)
The gas phase heat balance in each tank is assumed to be adiabatic and described as: ∙ ∙ , − , − ℎ ∙ ∙ , − , = 0 (20)
Accumulation terms in the mass balances (equations 17 and 18) and the gas phase heat balance
(equation 20) were neglected because the characteristic time constants for these transport
processes is considerably smaller compared to accumulation of surface (equation 19) species
and heat in the solid (catalyst and washcoat).
For the heat balance in the washcoat, heat transfer in the radial direction within the washcoat
was neglected. However, heat accumulation and transport between solid (washcoat and
substrate) and gas in each tank was included. Also, axial heat conduction between solid
segments and heat contribution from reactions in each tank were included. Equation 21 shows
the segmental washcoat heat balance.
, ∙ , , = ℎ , − , − ( − ) + , , ∙ , , ∙ −∆ (21)
The solid heat flux for tank k, , will be described in the following section.

22
5.3 Modeling mass and heat transport
A film model was applied to describe the mass and heat transport from the bulk gas to the
washcoat. The values of and h varied along the axial direction of the channel according to
the empirical correlation given by Hawthorne [57]. The molar flux , , of a gas component
from the bulk-flow to the washcoat surface can be written as:
, , = , ∙ , , − , , (22)
The Molar flux , , of a gas component in the washcoat was explained by the Fickian mass
transport equation. The general mass transport equation can be written as:
, , = − ∙ + ∙ , , (23)
By assuming that equimolar counter-diffusion prevails due to the low species concentrations,
the second term on the right hand side of equation 23 can be neglected which yields:
, , = − , , ∙ , , − , ,0.5 ∙ ∆ (24)
The effective washcoat diffusivity was calculated from the Bosanquet [58] correlation by
including gas diffusivity, Knudsen diffusivity and factor (accounting for porosity and
tortuosity of the washcoat). Gas diffusivity was calculated from the Fuller-Schettlet-Gidding
relationship [59] and corrected for the current segmental washcoat temperature while Knudsen
diffusivity was approximated by using the semi-empirical Knudsen correlation [60].
By equalizing equation (22) and (24) and eliminating the gas concentration on washcoat surface
( , , ), the mass transfer from the gas bulk to the washcoat surface can be expressed as
in equation 25. Here, the lumped mass transfer coefficient ( ) is defined.
, , ∙ = 1, + 0.5 ∙ ∆, , , , − , , = , , ∙ , , − , , (25)
Between all subsequent layers, the mass transfer coefficients are similar and can be defined as:

23
, , ∙ = 0.5 ∙ ∆, , + 0.5 ∙ ∆ , , , , − , , = , , ∙ , , − , , (26)
However for the bottom layer N, , , = 0, inferring no transport to the monolith substrate.
One of the contributors to the heat balance of the segmental washcoat is heat conduction
between solid segments (substrate and washcoat) in the axial direction. The solid heat fluxes
( ) for k=2,…,K-1,K were calculated from equation 27.
= − ∙ , − ,0.5∆ + 0.5∆ (27)
where = 0 for k=1 and K+1
5.4 Matlab implementation: simulation and parameter estimation
The mass and energy balances (equations 17 to 21) were expanded for each gas phase
component, surface component, tank and layer. The solution of these equations gives the
concentrations of gas and surface components, gas and catalyst temperature in each layer and
tank for each measurement time. The resulting differential and algebraic (DAE) equations were
solved using the ODE15s function in Matlab R2008a® and the results were stored in a large
multi-dimensional matrix.
Parameter fitting was performed using the lsqnonlin function in Matlab R2008a®. This function
uses a gradient search method to perform non-linear regression. Prior to the fitting, each
parameter was scaled according to:
= − (28)
The scaling factor called was set so that a scaled parameter value of +1 approximately
doubled the reaction rate from the initial parameter value and a scaled value of -1
corresponded to approximately half the reaction rate. Subsequently, the upper and lower
bounds were determined in accordance with the scaled values. The objective of non-linear
regression was to minimize the sum of the square of error (SSE) where the residuals were
calculated from outlet gas measured and calculated mole fractions.

24
Parameter fitting with numerous parameters as exemplified in paper I is a challenging task. One
way to assess the effect of a parameter on the prediction capability to the overall model is by
performing a sensitivity analysis. This method was used and sensitivities were evaluated from
small perturbations of each kinetic parameter

25
6 Microkinetic modeling of H2-assisted NO oxidation 6.1 General
One approach to investigate a large and complex reaction mechanism as exemplified by HC-SCR
over Ag/Al2O3 catalyst is to divide it into simpler subsystems. As a part of the HC-SCR reaction
mechanism, NO oxidation to NO2 has been investigated as an important sub-reaction within
HC-SCR [25, 61, 62]. It is important to mention that Ag-Al2O3 is considered a poor catalyst for
NO oxidation [25, 63], however the addition of H2 dramatically improves its low temperature
activity even with the presence or absence of H2O in the feed [13, 25, 42, 64, 65]. Therefore, it
is also probable that the mechanism by which H2 promotes low temperature NO oxidation
shares some common features with how H2 promotes low temperature HC-SCR over Ag-Al2O3.
We have chosen to examine a microkinetic model for NO oxidation based on the role of H2 to
remove self-inhibiting nitrate species on the surface. This mechanism is widely addressed in the
literature and it can be represented with rather simple surface chemistry as demonstrated in
paper I [66].
Table 1. The concentration and temperature levels in the DOE of NO oxidation
NO (ppm) O2 (%) NO2 (ppm) H2 (%) T (°C)
low 400 6 0 0 250
centre 600 7 50 0.1 325
high 800 8 100 0.2 400
We investigated the kinetic behavior of NO oxidation over silver alumina using transient data
generated by a reduced factorial Design of Experiments (DOE). DOE has been found to be a
useful method to investigate the influence of several controllable factors on some measurable
effects. Here, the feed concentrations and feed temperature were varied systematically
between low and high levels around a centre point condition. The experiments were performed
in three batches with constant temperatures and transient switches in the feed concentrations

26
of reactants. Table 1 shows the levels of concentrations and temperature used to study the
kinetic behavior of NO oxidation.
6.2 Kinetic analysis
A Langmuir–Hinshelwood based reaction mechanism was used to model the oxidation of NO
and H2 involving 5 gas phase species: NO, O2, NO2, H2 and H2O. Besides, 6 surface components
(NO*, O*, NO2*, NO3*, H* and OH*) were considered in addition to vacant sites (*). Molecular
adsorption was used to characterize the adsorption of NO and NO2, whereas dissociative
adsorption was used for O2, H2 and H2O [67, 68]. There were 5 reversible surface reactions in
the reaction network which explained the formation or consumption of NO2*, the inhibition
effect by NO3* and the effect of H*. In total there are 18 elementary steps used in the
microkinetic model. It is important to mention that the reaction mechanism was also developed
based on multi-linear regression analysis using the steady state results from DOE experiments.
Preexponential factors for adsorption steps of gas components were calculated from kinetic gas
theory. The sticking coefficients of gas components were assumed to be 0.1 except for O2 which
was taken as 10-5. The area of an active site was assumed to be 8.10-2 m2/site. The activation
energies for adsorption steps were assumed to be zero suggesting non-activated adsorption
processes.
Preexponential factors for desorption steps of most gas components were assumed to be 1013
s-1 which is the common values estimated from transition-state-theory. Preexponential factors
for O2 were adopted from a TPD study in literature [69]. An initial estimate of the
preexponential factor for NO desorption, 1016, was used and tuned during regression analysis
while desorption of NO2, O2, H2 and H2O were fixed.
Due to thermodynamic constraints, 4 kinetic parameters were calculated from thermodynamic
restrictions based on the overall reactions of NO and H2 oxidation. As a result, 13 kinetic
parameters were fitted by non-linear regression. For modeling purposes, the rate constant
which follows the Arrhenius expression (equation 7) needed to be modified to decouple the
high correlation between preexponential factors and activation energies. As a result, the fitted

27
parameters were logarithmic values of the rate constant (ln(kref)) at the average experimental
temperature (Tref) and the activation energy ( ) as shown as:
= exp ln(kref) − 1, − 1 (29)Note that the ln(kref) and have completely different orders of magnitude. As presented
earlier in section 5.4, parameter scaling was implemented to give uniform weight of the effect
of parameters on the residuals during regression. The list of all elementary steps, their rate
constants and final kinetic parameter values is presented in table 2.
6.3 Results and discussion
The steady-state results from reduced factorial design experiments were analyzed by multi-
linear regression (MLR) analysis. The current MLR model gave a coefficient of determination of
0.994 and the normalized coefficient plot including their 95% confidence intervals are shown in
Figure 8.
Figure 8. Normalized coefficient plots from MLR with 95% confidence interval bars

28
Table 2. The elementary steps used in the m
icrokinetic model, the rate expressions and kinetic param
eters
Forward reaction
Reactions
Backward reaction
Ai (s-1) †
Ea
(kJ.mol -1)
reaction rate
(s-1)
reaction rate
(s-1)
Ea
(kJ.mol -1)
Ai (s-1) †
1.59 × 10
7 0.00
r1 = k
1 .yN
O(g) .θ
v N
O(g) +
* ⟺ N
O*
r2 = k
2 .θN
O 72
1.75 × 10
17
1.54 × 10
3 0.00
r3 = k
3 .yO
2(g) .θv 2
O2 (g) +
2* ⟺ 2O
* r4 =
k4 .θ
O2
150.00 2.00 ×
1012
1.29 × 10
7 0.00
r5 = k
5 .yN
O2(g) .θ
v N
O2 (g) +
* ⟺ N
O2 *
r6 = k
6 .θN
O2
53.13 1.00 ×
1013
6.15 × 10
7 0.00
r7 = k
7 .yH
2(g) .θv 2
H2 (g) +
2* ⟺ 2H
* r8 =
k8 .θ
H2
20.00 1.00 ×
1013
2.06 × 10
7 0.00
r9 = k
9 .yH
2O(g) .θ
v 2 H
2 O(g) +
2* ⟺ O
H* +
H*
r10 = k
10 .θH
.θO
H 40.00
1.00 × 10
13
1.37 × 10
13 55.62
r11 = k
11 .θN
O .θO
NO
* + O
* ⟺ N
O2 * +
* r12 =
k12 .θ
NO
2 . θv
19.94 2.47 ×
108
2.04 × 10
14 81.11
r13 = k
13 .θN
O2 .θ
O N
O2 * +
O* ⟺
NO
3 * + *
r14 = k
14 .θN
O3. θ
v 114.98
1.10 × 10
9
1.00 × 10
9 36.51
r15 = k
15 .θN
O3 .θ
H N
O3 * +
H* ⟺
NO
2 * + O
H*
r16 = k
16 . θN
O2 .θ
OH
152.77 2.12 ×
1015
1.62 × 10
13 103.43
r17 = k
17 .θH .θ
O H
* + O
* ⟺ O
H* +
* r18 =
k18 .θ
OH . θ
v 292.41
4.71 × 10
11
†calculated from ln(kref) and Ea
=Fixed param
eters
= constrained by thermodynam
ics
= estimated param
eters
29
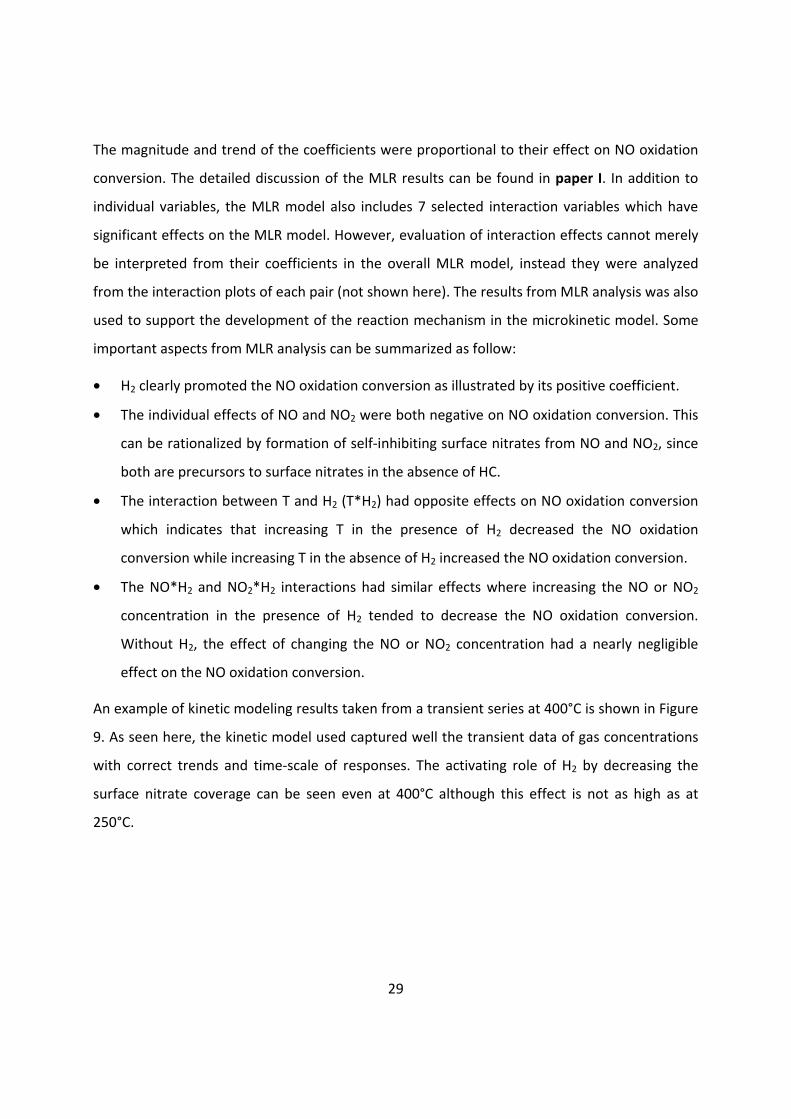
The magnitude and trend of the coefficients were proportional to their effect on NO oxidation
conversion. The detailed discussion of the MLR results can be found in paper I. In addition to
individual variables, the MLR model also includes 7 selected interaction variables which have
significant effects on the MLR model. However, evaluation of interaction effects cannot merely
be interpreted from their coefficients in the overall MLR model, instead they were analyzed
from the interaction plots of each pair (not shown here). The results from MLR analysis was also
used to support the development of the reaction mechanism in the microkinetic model. Some
important aspects from MLR analysis can be summarized as follow:
• H2 clearly promoted the NO oxidation conversion as illustrated by its positive coefficient.
• The individual effects of NO and NO2 were both negative on NO oxidation conversion. This
can be rationalized by formation of self-inhibiting surface nitrates from NO and NO2, since
both are precursors to surface nitrates in the absence of HC.
• The interaction between T and H2 (T*H2) had opposite effects on NO oxidation conversion
which indicates that increasing T in the presence of H2 decreased the NO oxidation
conversion while increasing T in the absence of H2 increased the NO oxidation conversion.
• The NO*H2 and NO2*H2 interactions had similar effects where increasing the NO or NO2
concentration in the presence of H2 tended to decrease the NO oxidation conversion.
Without H2, the effect of changing the NO or NO2 concentration had a nearly negligible
effect on the NO oxidation conversion.
An example of kinetic modeling results taken from a transient series at 400°C is shown in Figure
9. As seen here, the kinetic model used captured well the transient data of gas concentrations
with correct trends and time-scale of responses. The activating role of H2 by decreasing the
surface nitrate coverage can be seen even at 400°C although this effect is not as high as at
250°C.

30
Figure 9. The experimental and simulation results from DOE experiment for varying feed
concentration at 400°C.

31
Besides NO oxidation, H2 oxidation to H2O is an additional reaction that occurs when H2 was
fed. The nature of this reaction is fast and complete conversion of H2 to H2O was always
observed already at 250°C which is also confirmed by the model. According to the model
prediction of the H2 concentration profile, the H2 concentration decreased rapidly at the front
part of monolith to form water due to its fast reaction. In addition, the model predictions as
well as calculation of a Weisz modulus indicated the importance of internal transport
limitations for diffusion of H2 into the washcoat.
Instead of considering only the average surface coverage throughout the monolith, the current
reactor model allows an analysis of the local surface coverage axially along the monolith as well
as through the washcoat depth for each measurement time. In addition, the distribution profile
of gaseous components both throughout the washcoat and axially through the gas phase can
also be analyzed.
According to the modeling results, the enhancing effect of H2 to reduce surface nitrate is
isolated to a relatively small portion of the catalyst due to the fast reaction rate of H2 oxidation
(nearly 100% conversion for all experiments in this study) suggesting that internal transport
resistance may play a role even for H2 assisted HC-SCR with Ag-Al2O3. At high temperature, the
effect of transport resistance is more prevalent causing the portion of the catalyst affected by
H2 to be even smaller. In the absence of H2 in the feed, the gradient of nitrate coverage in the
front part of monolith disappeared and the nitrate coverage became equal throughout the
catalyst.
32
7 Stability of NOx surface species: in-situ DRIFT spectroscopy and TPD studies 7.1 Roles of surface NOx species
As seen in Figure 2, the reaction mechanism of HC-SCR over Ag/Al2O3 is initiated by activation
of NOx and hydrocarbon (HC) by O2. Activation of NOx is characterized by formation of surface
NOx species mainly as nitrate and/or nitrite species. Subsequently, surface NOx species play a
role by reacting with oxygenated HC (a result of HC activation) to form a number of
intermediates which eventually lead to the formation of N2. For this reason, surface NOx
species have been suggested to be important intermediates and therefore it is important to
understand their formation, stability and reactivity to elucidate the mechanism of HC-SCR.
It is interesting to note that H2 may play a dual role in its interaction with nitrate species. On
one hand, H2 has been proposed to promote elimination of nitrates during H2 assisted HC-SCR
[33, 35, 38, 65]. On the other hand, it has also been shown that H2 activates accumulation of
nitrates on the surface, especially during NO oxidation [25, 35, 42, 61]. An additional objective
for studying surface NOx species was to examine whether these seemingly contradictory roles
for H2 could be compatible.
Elimination of surface nitrates from the active silver species by H2 has been proposed as one
probable key step of the “H2-effect” for low temperature HC-SCR [14, 33, 38, 65]. H2 has been
found to promote NO oxidation [13, 25, 42, 64, 65] and our previous study has simulated
reaction steps 1,2 and 4 in Figure 2 to describe H2-assisted NO oxidation [66]. It is important to
mention that H2 has been proposed to have several other roles in HC-SCR which has been
discussed in section 2.3 and shown in Figure 2.
Contradictory to the hydrogen’s proposed role to eliminate nitrates during HC-SCR, in-situ FTIR
studies have been widely presented in the literature showing that H2 plays an important role to
activate the accumulation of surface nitrates following exposure of the catalyst to a NO-O2-H2
gas mixture [25, 35, 42, 61]. With the low silver loadings that are common for Ag/Al2O3

33
catalysts, it is also reasonable to expect that alumina also facilitates adsorption of surface NOx
species. In addition, the existence of both silver nitrate and aluminium nitrate following NOx
adsorption has been proposed [38, 70]. Unfortunately, in-situ IR analysis indicates overlapping
peaks for nitrates over Ag/Al2O3 and bare Al2O3 which makes it difficult to discriminate between
nitrates on the Al2O3 support and on the silver particles [42].
In order to investigate and clarify the characteristics and stability of nitrate species on Ag-Al2O3,
we have conducted a DRIFT study and a series of TPD studies. The work presented in paper II
was mainly based on the TPD studies of NOx adsorption over Ag-Al2O3 and Al2O3 where we have
focused on understanding the role of H2 to modify the surface NOx species in relation to the
promotional effect of H2 for NO oxidation and HC-SCR. Details regarding the experimental
methods used can be found in paper II.
7.2 In-situ DRIFT Spectroscopy
Formation of surface NOx species was monitored by feeding 500 ppm NO and 8 % of O2 at 100-
400°C for 1 h (sufficient to reach steady states). The formation of nitrate species on the surface
is depicted by Figure 10.
Figure 10. DRIFT results following 1 h adsorption of 0.1% NO and 8% O2 over 5wt.% Ag-Al2O3
100°C (red), 200°C (green), 300°C (blue) and 400°C (magenta).

34
Assignment of nitrate species can be found from literature [71] to include: monodentate nitrate
(1530-1480, 1290-1250), bidentate nitrate (1565-1500, 1300-1260) and bridging nitrate (1650-
1600, 1225-1170). The presence of these three types of nitrate species is indicated by Figure 10.
In order to study their stability, periodical exposure to 0.1% H2 pulses at 300°C were conducted
with a 5 min. duration for each pulse. The results from the pulsing experiment are presented in
Figure 11.
Figure 11. DRIFT results by pulsing 0.1% H2 in (on) and out (off) of the feed stream at 300°C
over 5 wt.% Ag-Al2O3. Alternating period is 5 min. Feed composition: 0.1% NO + 8% O2 with
Argon balance.
As seen from Figure 11, introduction of NO and O2 gave assignable peaks to monodentate
nitrate (1302, 1525), probably bidentate nitrate (1576) and bridging nitrate (1610). By pulsing
0.1% H2, it is interesting to note that bidentate and bridging nitrate are the two most affected
surface nitrate species. In a separate flow reactor experiment (not shown), it was found that
the effect of H2 on NO oxidation activity was fast and reversible giving higher NO2 yield when H2
was present and vice versa during its absence. Therefore, the DRIFT study as shown in Figure 11

35
has provided an interesting basis that led us to investigate further the stability and formation of
surface NOx species over Ag-Al2O3 as presented in the following sections.
7.3 TPD studies of NOx
Temperature-programmed desorption (TPD) is a useful technique to investigate the thermal
stability of adsorbed species. TPD studies to investigate the stability of surface NOx species over
Ag/Al2O3 have been reported in the literature [23, 70, 72, 73]. In paper II, a series of TPD
studies of NOx were carried out over Ag-Al2O3 and Al2O3 catalysts to quantify and characterize
the stability of surface NOx species on the catalysts under reaction conditions for NO oxidation
or HC-SCR. This study has also aimed to demonstrate the effect of H2 to modify the quantities
and types of surface NOx species, as it is well-known that H2 promotes both NO oxidation and
C3H6-SCR over a Ag-Al2O3 catalyst. We have focused our work on the low temperature region
200-300°C as it is expected to be favorable for nitrate formation and therefore most relevant to
understand the “H2 effect” for modification of nitrate species.
7.3.1 Nitrate formation following adsorption of NO-O2, NO-O2-H2 and NO2-O2 gas mixtures over
Ag-Al2O3 catalyst.
Figure 12 shows the adsorption and desorption profiles of NOx over Ag-Al2O3 for NO-O2 (a,b),
NO-O2-H2 (c,d) and NO2-O2 (e,f) gas mixtures. It was found that during the adsorption of NO-O2
prior to the TPD (Figure 12a), the activity for NO oxidation was low however increased with
higher temperature up to ca. 4% at 300°C. During the TPD temperature ramp that followed NO-
O2 exposure (Figure 12b), two desorption peaks were observed i.e. a low temperature (LT) peak
at 277-340°C and a high temperature (HT) peak at ca. 440°C. It is noteworthy that the LT peaks
were skewed to higher temperatures with increasing adsorption temperature. As seen from
Figure 12b, the major NOx components desorbed were NO at both LT and HT peaks whereas
NO2 was only observed at the LT peak following adsorption at 200 and 250°C. The increase in
NO oxidation conversion with increasing temperature was accompanied by a decrease in LT
NOx desorption peak.

36
Figure 12. TPD following NO oxidation (a,b), H2-assisted NO oxidation (c,d) and NO2 adsorption
(e,f) over Ag-Al2O3 at adsorption temperatures 200 (red), 250 (green) and 300°C (blue).
Adsorption condition: 500 ppm NO + 4% O2 total flow 1500 mLn/min (a), 500 ppm NO + 4% O2 +
0.1% H2 total flow 1500 mLn/min (c), 150 ppm NO2 + 4% O2 total flow 3500 mLn/min (e). Argon
was used as carrier gas.
With addition of H2, the NO oxidation conversion up to 10% at 300°C was reached during the
adsorption step (Figure 12c). From Figure 12d, during the temperature ramp that followed
adsorption of NO-O2-H2, a strong desorption peak of NO2 was observed at ca.450°C which may
be assigned as the HT peak and observed following NO-O2 adsorption in Figure 12b. Desorption
of O2 (detected from m/z 16 from MS) was also observable and coincided well with the NO2

37
peak. In addition, desorption of low concentrations of NO were observed at ca. 340-350°C and
505°C.
It can be noted that along with higher activity for NO oxidation in the presence of H2, the LT
peak observed from NO-O2 TPD (Figure 12b) was significantly suppressed and shifted towards
the HT peak (Figure 12d). The shift was also accompanied by higher total quantities of NOx
adsorbed and desorbed. Due to the fact that the LT peak decomposed thermally at higher
adsorption temperatures and was suppressed significantly in presence of H2 which both gave
higher NO oxidation conversion, it is therefore reasonable to assign the LT peak as resulting
from decomposition of nitrates on the active sites.
Separate TPD studies of NO-O2 and NO-O2-H2 over Al2O3 (not shown here, but available in
paper II) did not give similar results, instead overall lower quantities of adsorbed NOx with
neither a shift of the NOx desorption peaks nor promotion in NO oxidation activity with H2 were
observed. This suggested that the presence of Ag on Al2O3 was necessary in order for H2 to
interact and modify the adsorbed species.
Figure 12e shows the adsorption step of NO2-O2 TPD over Ag-Al2O3. As seen here, a temporary
formation of NO could be detected during NO2 adsorption. The quantities of NOx uptake
decreased with higher adsorption temperature. It is noteworthy that the NO2-O2 system took
much longer time to reach stable outlet NOx signals during the adsorption step compared to
the NO-O2 system due to the larger formation of surface NOx species on the catalyst.
Formation of NO was observable during the NO2-O2 adsorption over both Ag-Al2O3 and Al2O3.
By integration of the curves in Figure 12e, the average ratio of total NO2 uptake to total NO
yield was 2.62 for Ag-Al2O3 and 3 for Al2O3. Therefore, one can formulate that self-oxidation of
NO2 was likely to dominate during the adsorption according to the following reaction:
2 ( ) → ( ) + ( ) (30)
However also surface oxides were involved as in the following overall reaction [72]:

38
3 ( ) + ( ) → 2 ( ) + ( ) (31)
As seen from reactions (30) and (31), the ratio of NO2 adsorbed and NO released is 2 in reaction
(30) and 3 in reaction (31). The ratios from the integration results fit well and suggest that both
reactions are likely occurring during NO2-O2 adsorption.
Figure 12f shows the desorption profile that followed adsorption of NO2-O2 over Ag-Al2O3. A
substantial release of NO2 was observed that peaked at 440-460°C. A minor desorption of NO
was also detected at higher temperature ~525°C. It is important to mention that a broad
release of O2 was observed peaking at ~450-475°C.
TPD results for NO-O2-H2 (Figure 12d) and NO2-O2 (Figure 12f) were similar, giving a substantial
release of NO2 at a similar temperature range of the HT peaks. During the adsorption of NO-O2-
H2, production of NO2 was always observed and from comparison with Figure 12b and the low
production of NO2 during NO-O2 adsorption, it is apparent that NO2 production is linked to the
formation of the HT nitrate. Further, additional experiments for NO2-O2 TPD on Al2O3 (not
shown here but available in paper II) gave a similar TPD profile for the same adsorption
conditions with Ag-Al2O3 (Figure 12f) suggesting that most of the HT nitrate formed is located
on the Al2O3 support. Therefore, it was evident that the HT nitrate results from NO2 adsorption
and primarily located on the Al2O3 support. It is also then likely that the HT nitrates formed on
the Al2O3 support are spectator surface species. From literature, a mechanism of NOx storage
by a spillover mechanism has been proposed [38, 70]. An alternative mechanism of NOx storage
by NO2 readsorption on the Al2O3 support has also been proposed by Johnson II et al. [39].
Based on the results of these TPD studies, it is indicative that the NO2 readsorption mechanism
is most probable for NOx storage on Al2O3, since formation of the HT nitrate was related to the
presence of gas phase NO2. However, this does not totally negate the possibility for a spillover
mechanism also contributing to NOx storage.
Additional studies on temperature-programmed reduction (TPR) were conducted to investigate
the stability of nitrate species formed on Ag-Al2O3 and Al2O3. Upon introduction of H2 during
the desorption step that followed adsorption of NO-O2-H2 over Ag-Al2O3, the HT NOx

39
desorption peak (Figure 12d) was shifted to significantly lower temperature (not shown here
but available in paper II). Likewise, the shift of the HT NOx desorption peak was also observed
for TPR that followed NO2-O2 adsorption over Ag-Al2O3. The shift of the NOx desorption peaks
to lower temperature clearly occurred over Ag-Al2O3, but to little or no extent over Al2O3.
Hence, these results infer the crucial role of Ag to activate H2 which in turn can destabilize
nitrate species. H2 dissociation over Ag-Al2O3 itself has been proposed as an important initial
step for H2 activation in H2-assisted HC-SCR [74].
7.3.2 Mechanistic insight regarding C3H6-SCR and H2 assisted C3H6-SCR
Figure 13. TPD following C3H6-SCR over Ag-Al2O3 showing adsorption (a) and desorption (b) of
NOx, adsorption (c) and desorption (d) of COx. Adsorption conditions: 500 ppm NO + 4% O2 +
0.1% C3H6 at adsorption temperatures 200 (red), 250 (green) and 300°C (blue). Total flow was
1500 mLn/min with Argon as carrier gas.
Further, a series of TPD studies were conducted to investigate the quantities and nature of
adsorbed NOx and COx species during C3H6-SCR and H2 assisted C3H6-SCR over the Ag-Al2O3
catalyst. Figure 13 presents the NOx and COx adsorption and desorption profiles for reactive
adsorption of C3H6-SCR.

40
During the adsorption step with C3H6-SCR (Figure 13a and 13c), NOx reduction conversion
increased with higher temperature accompanied by the highest C3H6 conversion at 300°C. As
seen in Figure 13b, two remarkable NOx peaks could be observed at ca. 290°C (LT) and 420°C
(HT). It should be noted that following C3H6-SCR adsorption at 200°C a shoulder on the NO peak
at ca.235°C could be seen. The LT NOx desorption quantity decreased with higher adsorption
temperature and became markedly suppressed at the adsorption temperature of 300°C.
It is interesting to note that by comparing the NOx desorption profile for C3H6-SCR (Figure 13b)
and NO oxidation (Figure 12b), both of them have a similar profile with LT and HT NOx
desorption peaks. However, for C3H6-SCR (Figure 13b) the NO2 desorption is very low, probably
due to the presence of adsorbed HC species that reduce the surface NOx species to NO during
their decomposition and desorption. This presence of both LT and HT nitrates in approximately
the same temperature range indicates that NO oxidation and C3H6-SCR share some mechanistic
features.
As shown in Figure 13d, the CO desorption peak was observed between 405 to 426°C while the
CO2 desorption peak was broad with the same rise and decline as the CO profile. In addition,
COx desorption which was observed during the temperature ramp was related to
decomposition and oxidation of adsorbed HC and oxidized HC species. There tended to be more
of these species at higher temperature along with greater NOx reduction activity, suggesting
that they are important intermediate species. Removal of the LT inhibiting nitrate at higher
temperature was likely to allow more formation of these intermediate species for the NOx
reduction process [72].
In order to investigate the influence of H2 on C3H6-SCR, 0.1% H2 was added in the adsorption
step and the desorption profile of NOx and COx are presented in Figure 14. During the
adsorption step for H2 assisted C3H6-SCR (Figure 14a and 14c), higher NOx reduction activity
was observed, reaching up to ~23% at 300°C. As seen in Figure 14b, a small peak of NO at 240°C
and broad desorption peaks reaching a maximum at ~440°C were observed, whereas NO2
desorption was negligible. These NO peaks decreased with higher adsorption temperature. The

41
total quantities of NOx desorbed are higher in the case of H2 addition than in the absence of H2
during C3H6-SCR (comparing Figure 14b and 13b).
Figure 14. TPD following H2 assisted C3H6-SCR over Ag-Al2O3 showing adsorption (a) and
desorption (b) of NOx, adsorption (c) and desorption (d) of COx. Adsorption conditions: 500
ppm NO + 4% O2 + 0.1% C3H6 + 0.1% H2 at adsorption temperatures 200 (red), 250 (green) and
300°C (blue). Total flow was 1500 mLn/min with Argon as carrier gas.
The improvement in NOx reduction activity was also accompanied by a significant decrease in
the LT NOx desorption peak as can be seen by comparing Figure 14b and 13b. At the same time,
the HT NOx desorption peak increased remarkably. Therefore, again removal of the inhibiting
LT nitrate, in this case aided by reaction with H2, improved the NOx reduction activity. Unlike in
the case of NO-O2-H2 (Figure 12d) and NO2-O2 (Figure 12f) TPD, the increase of the HT peak for
H2 assisted C3H6-SCR (Figure 14b) gave mostly NO desorption. The larger production of NO for
H2 assisted C3H6-SCR was probably because the catalyst also contained adsorbed HC which was
oxidized by the adsorbed NOx species during their decomposition and desorption. From Figure
14b, it can also be seen that the HT nitrate peak had a broad shoulder towards lower
temperatures. This shoulder probably results from the presence of the adsorbed HC species
42
acting as reductants and destabilizing the nitrate species to cause some lower temperature NOx
decomposition.
From the desorption profiles of CO and CO2 (Figure 14d), one can see that a CO peak was
observed at ca. 375°C which is at a lower temperature compared to the one in the absence of
H2 (between 405-426°C in Figure 13d). Furthermore, the concentration of COx released was
much higher than in the absence of H2, consistent with the higher conversion of C3H6 obtained
with addition of H2. Higher concentration of desorbed CO and CO2 infers that H2 has a
promotional effect on low temperature C3H6 activation. HC activation to form oxidized HC
species, itself is often suggested as a key step in HC-SCR over Ag-Al2O3 [35, 42]. This greater
formation of surface HC and oxidized HC in the presence of H2 is likely linked to the removal of
inhibiting nitrate species as suggested by the suppression of the LT nitrates also with H2. There
was also a broadening and shift to lower temperature of the COx desorption peaks with the
addition of H2 (compare Figure 14d and 13d) which suggests that a greater quantity of possibly
more reactive adsorbed HC species with lower thermal stabilities were formed. This perhaps
points to the fact that H2 may have other effects to promote the NOx reduction activity in
addition to removal of inhibiting nitrate species.
It is noteworthy from Figure 13d and 14d that the concentration of CO during desorption did
not monotonically increase or decrease with adsorption temperature, but instead peaked at
adsorption temperature 250°C. Greater accumulation of adsorbed COx as temperature higher
indicates that the reactions activating the HC and forming oxygenated HC on the surface have
relatively high activation energies. In other words, the activation energy to partially oxidize HC
to form oxygenated HC species is higher than the activation energy of subsequent reactions
between surface NOx species with oxygenated HC species that lead to formation of N2. Greater
accumulation of oxygenated HC surface species may also be due to less inhibiting nitrates
covering the active sites where oxygenated HC are formed.
In this series of studies, it seems that the promoting role of H2 appears to be almost exclusively
due to the removal of inhibiting nitrates, although it can be argued that the removal of these
nitrates either thermally or by hydrogen reduction does not always result in a proportional

43
increases in either NO oxidation or NOx reduction. As a result the findings here do not preclude
the possibility of other H2 promoting roles as already described in section 2.3. However an
investigation of the merits of other roles for H2 to promote NO oxidation or NOx reduction is
beyond the scope of this study and the methods used here.

44
8 Conclusions and outlook The overall focus of this work was to increase the understanding of the reaction mechanism of
HC-SCR over Ag-Al2O3 catalysts and in particular the promotional effect of H2. As seen in Figure
2, HC-SCR involves a number of reactions and intermediates. One approach to investigate a
large and complex reaction mechanism is to divide it into simpler subsystems.
NO oxidation to NO2 has been suggested as a subsystem within HC-SCR. Paper I focused on
describing the promotional effect of H2 on NO oxidation by its main role to remove strongly
adsorbed nitrate species on the active sites. A combination of flow reactor experiments and
microkinetic modeling were applied in paper I. A single type of active site was used to simplify
the microkinetic model. A reaction network based on the Langmuir-Hinshelwood mechanism
was proposed and it turned out that the modeling results could capture well the experimental
results.
From microkinetic modeling results, it was found that H2 was consumed rapidly in the front part
of the monolith. The predicted concentration profiles of H2 in the radial direction, through the
catalyst washcoat, suggested that only a small proportion of the monolith was exposed to H2.
Complete conversion of H2 was observed from experimental results. Therefore, it would be
interesting to conduct further investigations to experimentally verify the existence of internal
mass transport resistance effects.
Paper II demonstrated the role of H2 to modify surface NOx species during NO oxidation and
C3H6-SCR. Formations of two general groups of surface NOx species were found to be present: a
less thermally stable group of so called “LT nitrates” and a more thermally stable group of “HT
nitrates”. LT nitrate species were more likely related to the formation of inhibiting nitrate
species on active sites. Feeding H2 had been found to eliminate the LT nitrate and subsequently
promote the NO oxidation and C3H6-SCR. In addition, the presence of H2 also promoted the
formation of a greater variety of adsorbed hydrocarbons. This points out that H2 may cause
other effects to promote C3H6-SCR over Ag-Al2O3.

45
It was also found that H2 facilitated the formation of nitrate species on the Al2O3 support. It was
also indicative that the mechanism of NOx storage on the Al2O3 support was mainly via NO2
readsorption. From TPR studies, it was found that Ag also played an important role to activate
H2 and hence react with surface NOx species.
As continuation of this work, involving DRIFT-MS studies to relate the changes in surface
species with gas phase can be a potential route to enhance understanding of the HC-SCR
mechanism. Chansai et al.[36] have highlighted the importance of short time contact to be able
to identify reactive surface species and minimize their interference from spectator surface
species. Repeated fast cycling with H2 pulsing has been carried out recently by Kim et al. [43]
showing effects on the NOx conversion over two different time scales as a function of cycle
time owing possibly to slow morphological changes in silver sites and other faster kinetic
effects. Further clarification and verification by which H2 modifies surface species formation,
combined with morphological changes over Ag-Al2O3, can be an interesting topic to improve
our understanding of HC-SCR.
By having all information from in-situ and flow reactor experiments, one could start thinking of
assembling this entire puzzle into a kinetic model of full H2 assisted HC-SCR system. The use of
low chain HC or oxygenated HC can be an option to decrease the complexity of the studied
system. However, even with a short chain HC one can end up with a large reaction network and
many kinetic parameters, resulting in extensive computational time (see for example ref [75]).
As an alternative, it would be interesting to start building a relatively affordable kinetic model
to simulate the TPD data shown in paper II to involve the role of the Al2O3 support in a chemical
reaction network. Another issue that is important in kinetic modeling is thermodynamic
consistency. A relatively new concept namely “thermodynamic state variable modeling” can
also be an interesting alternative as it primarily relies on bounded thermodynamic parameters
to derive the kinetic parameters.
46
9 Acknowledgements First and the foremost, I would like to thank God almighty as the One who gives me life. This work is financially supported by Swedish Energy Agency and Swedish Research Council. I would like to take this opportunity to express my sincere gratitude to the following people:
My heartfelt acknowledgement goes to Prof. Derek Creaser as my main supervisor. I highly appreciate your encouragement, constant support and inspiration to me. Thanks for giving me the opportunity to conduct PhD study at Chalmers and I am so lucky to have you as my supervisor.
My co-supervisor Assoc. Prof. Hanna Härelind from Competence Centrum for Catalysis (KCK) is greatly acknowledged for your constant support, invaluable input throughout my PhD research.
I would like to thank my examiner Prof. Bengt Andersson at the Division of Chemical Engineering. Special thanks to the head of division Prof. Louise Olsson in particular for good arrangement on my experiments. Prof. Claes Niklasson is greatly acknowledged for introducing me to Sweden and facilitated my master study at Chalmers several years ago. I also would like to thank Marianne Sognell for good administrative arrangement.
I would like to express my gratitude to Dr. Hannes Kannisto and Fredrik Gunnarsson for invaluable help in catalyst preparation. I also would like to thank Dr. Steffanie Tamm and Dr. Djamela Bounechada for your lab skills. Björn Lundberg is greatly acknowledged for practical help with Matlab. Special thanks to Silver-alumina members at KCK group for pleasant discussion and knowledge sharing.
My buddies Xavier Auvray and Dr. Stanislava Andonova, thanks for small and big things that we have shared together. I thank my past office mate Dr. Carolin Wang-Hansen and currently Dr. Chaoquan Hu for creating pleasant atmosphere in our office. Thanks to colleagues at the Division of Chemical Engineering and KCK Chalmers for pleasant working atmosphere.
Special thanks goes to Department of Chemical Engineering at Gadjah Mada University in Indonesia for always being cooperative. I would also like to thank Indonesian friends in Sweden for great friendship. You are my family here and living in Sweden would never be joyful without you.
In a more personal level, I would like to thank my families in Indonesia for endless pray and love to me. Special dedication to my late father, although you are not here you are always in my heart. Last but not least, my ultimate gratitude goes to my wife Afrina and my daughter Ghaisani for your true love and inspiration. Nothing is better than having both of you in my life.

47
10 Bibliography [1] C.A.T. Center, Technical Bulletin: Nitrogen Oxides (NOx), Why and How They Are Controlled, US
Environmental Protection Agency Research Triangle Park, NC, 1999.
[2] T. Johnson, SAE Int. J. Engines 4 (2011) 143-157.
[3] G.T. Miller, Living in the Environment: Principles, Connections and Solutions, Thomson Brooks/Cole, Toronto, Ontario Canada, 2007.
[4] R.M. Heck, Farrauto R. J., Gulati, S.T., Catalytic Air Pollution Control: commercial technology, John Wiley & Sons, Hoboken, N.J., 2009.
[5] S.i. Matsumoto, Catal. Today 29 (1996) 43-45.
[6] L. Olsson, Fundamental Studies of Catalytic NOx removal, Department of Chemical Reaction Engineering, Chalmers University of Technology, Gothenburg, 2002.
[7] M. Iwamoto, H. Yahiro, Catal. Today 22 (1994) 5-18.
[8] W. Held, A. König, T. Richter, L. Puppe, SAE Technical Publications Paper 900496 (1990).
[9] R. Burch, J.P. Breen, F.C. Meunier, Appl. Catal. B-Environ. 39 (2002) 283-303.
[10] Z. Chajar, P. Denton, F. Berthet de Bernard, M. Primet, H. Praliaud, Catal. Lett. 55 (1998) 217-222.
[11] H.-Y. Chen, W.M.H. Sachtler, Catal. Today 42 (1998) 73-83.
[12] T. Miyadera, Appl. Catal. B-Environ. 2 (1993) 199-205.
[13] S. Satokawa, Shibata,J., Shimizu, K.-i., Satsuma, A., Hattori, T., Appl. Catal. B-Environ. 42 (2003) 179-186.
[14] J.P. Breen, R. Burch, Top. Catal. 39 (2006) 53-58.
[15] S. Erkfeldt, A. Palmqvist, M. Petersson, Top. Catal. 54 (2011) 1219-1223.
[16] K.-i. Shimizu, A. Satsuma, T. Hattori, Appl. Catal. B-Environ. 25 (2000) 239-247.
[17] K.-i. Shimizu, A. Satsuma, Phys. Chem. Chem. Phys. 8 (2006) 2677-2695.
[18] H. Kannisto, K. Arve, T. Pingel, A. Hellman, H. Harelind, K. Eranen, E. Olsson, M. Skoglundh, D.Y. Murzin, Catal. Sci. Technol. 3 (2013) 644-653.
[19] K. Arve, J.R.H. Carucci, K. Eränen, A. Aho, D.Y. Murzin, Appl. Catal. B-Environ. 90 (2009) 603-612.
[20] V. Houel, P. Millington, R. Rajaram, A. Tsolakis, Appl. Catal. B-Environ. 77 (2007) 29-34.
[21] H. He, X.L. Zhang, Q. Wu, C.B. Zhang, Y.B. Yu, Catal. Surv. Asia 12 (2008) 38-55.
[22] S. Tamm, H. Ingelsten, M. Skoglundh, A.C. Palmqvist, Top. Catal. 52 (2009) 1813-1816.
[23] S. Kameoka, Y. Ukisu, T. Miyadera, Phys. Chem. Chem. Phys. 2 (2000) 367-372.
[24] N. Bogdanchikova, F.C. Meunier, M. Avalos-Borja, J.P. Breen, A. Pestryakov, Appl. Catal. B-Environ. 36 (2002) 287-297.
[25] S.T. Korhonen, A.M. Beale, M.A. Newton, B.M. Weckhuysen, J. Phys. Chem. C 115 (2011) 885-896.
[26] K.-i. Shimizu, K. Sawabe, A. Satsuma, Catal. Sci. Technol. 1 (2011) 331-341.

48
[27] H. Kannisto, H.H. Ingelsten, M. Skoglundh, J. Mol. Catal. A-Chem. 302 (2009) 86-96.
[28] K. Eränen, F. Klingstedt, K. Arve, L.E. Lindfors, D.Y. Murzin, J. Catal. 227 (2004) 328-343.
[29] M. Yamaguchi, I. Goto, Z.M. Wang, M. Kumagai, Stud. Surf. Sci. Catal. 121 (1999) 371-374.
[30] S. Chansai, R. Burch, C. Hardacre, J. Breen, F. Meunier, J. Catal. 276 (2010) 49-55.
[31] S. Kameoka, T. Chafik, Y. Ukisu, T. Miyadera, Catal. Lett. 55 (1998) 211-215.
[32] F. Thibault-Starzyk, E. Seguin, S. Thomas, M. Daturi, H. Arnolds, D.A. King, Science 324 (2009) 1048-1051.
[33] J.P. Breen, R. Burch, C. Hardacre, C.J. Hill, C. Rioche, J. Catal. 246 (2007) 1-9.
[34] J. Shibata, Y. Takada, A. Shichi, S. Satokawa, A. Satsuma, T. Hattori, J. Catal. 222 (2004) 368-376.
[35] J. Shibata, K.-i. Shimizu, S. Satokawa, A. Satsuma, T. Hattori, Phys. Chem. Chem. Phys. 5 (2003) 2154-2160.
[36] S. Chansai, R. Burch, C. Hardacre, J. Breen, F. Meunier, J. Catal. 281 (2011) 98-105.
[37] D. Creaser, H. Kannisto, J. Sjöblom, H.H. Ingelsten, Appl. Catal. B-Environ. 90 (2009) 18-28.
[38] R. Brosius, K. Arve, M.H. Groothaert, J.A. Martens, J. Catal. 231 (2005) 344-353.
[39] W.L. Johnson II, G.B. Fisher, T.J. Toops, Catal. Today 184 (2012) 166-177.
[40] K. Arve, H. Backman, F. Klingstedt, K. Eränen, D.Y. Murzin, Appl. Catal. A-Gen. 303 (2006) 96-102.
[41] H. Kannisto, H.H. Ingelsten, M. Skoglundh, Top. Catal. 52 (2009) 1817-1820.
[42] P. Sazama, L. Capek, H. Drobna, Z. Sobalik, J. Dedecek, K. Arve, B. Wichterlova, J. Catal. 232 (2005) 302-317.
[43] P.S. Kim, M.K. Kim, B.K. Cho, I.S. Nam, S.H. Oh, J. Catal. 301 (2013) 65-76.
[44] M. Richter, R. Fricke, R. Eckelt, Catal. Lett. 94 (2004) 115-118.
[45] J.W. Niemantsverdriet, Spectroscopy in catalysis: an introduction, Wiley-VCH Verlag GmbH & Co. KGaA, Weinheim, 2007.
[46] J.W. Thybaut, G.B. Marin, Kinetics of Catalyzed Reactions-Heterogeneous, in: I.T. Horváth (Ed.), Encyclopedia of Catalysis, John Wiley & Sons, Inc., 2010.
[47] S. Klacar, Chemical Properties of Oxidized Silver-A Density Functional Theory Study, Institutionen för teknisk fysik, Kemisk fysik, Kompetenscentrum katalys (KCK), Chalmers University of Technology, Gothenburg, 2011.
[48] S.E. Voltz, C.R. Morgan, D. Liederman, S.M. Jacob, Product R&D 12 (1973) 294-301.
[49] L. Olsson, B. Andersson, Top. Catal. 28 (2004) 89-98.
[50] H. Lynggaard, A. Andreasen, C. Stegelmann, P. Stoltze, Prog. Surf. Sci. 77 (2004) 71-137.
[51] J.A. Dumesic, D.F. Rudd, L.M. Aparicio, J.E. Rekoske, A.A. Treviño, The microkinetics of heterogeneous catalysis, ACS, Washington, D.C., 1993.
[52] J. Sjöblom, Parameter estimation in heterogeneous catalysis, Department of Chemical and Biological Engineering, Chalmers University of Technology, Gothenburg, 2009.
[53] L. Olsson, V.P. Zhdanov, B. Kasemo, Surf. Sci. 529 (2003) 338-348.

49
[54] A.B. Mhadeshwar, B.H. Winkler, B. Eiteneer, D. Hancu, Appl. Catal. B-Environ. 89 (2009) 229-238.
[55] A.B. Mhadeshwar, H. Wang, D.G. Vlachos, J. Phys. Chem. B 107 (2003) 12721-12733.
[56] H.S. Fogler, Chapter 14 in Elements of Chemical Reaction Engineering 4th edition ed., Prentice Hall PTR, Westford, 2006.
[57] R. Hawthorne, AIChE Symp. Ser. 70, 1974, p. 428.
[58] G.F. Froment, K.B. Bischoff, J. De Wilde, Chemical Reactor Analysis and Design 3rd edition, John Wiley & Sons, New York, 2010.
[59] E.N. Fuller, P.D. Schettler, J.C. Giddings, Ind. Eng. Chem. 58 (1966) 18-27.
[60] D.D. Do, Adsorption analysis: equilibria and kinetics, Imperial College Press, London, 1998.
[61] U. Bentrup, M. Richter, R. Fricke, Appl. Catal. B-Environ. 55 (2005) 213-220.
[62] J.H. Lee, S.J. Schmieg, S.H. Oh, Appl. Catal. A-Gen. 342 (2008) 78-86.
[63] F.C. Meunier, V. Zuzaniuk, J.P. Breen, M. Olsson, J.R.H. Ross, Catal. Today 59 (2000) 287-304.
[64] R. Burch, J.P. Breen, C.J. Hill, B. Krutzsch, B. Konrad, E. Jobson, L. Cider, K. Eränen, F. Klingstedt, L.E. Lindfors, Top. Catal. 30-31 (2004) 19-25.
[65] Y. Guo, J. Chen, H. Kameyama, Appl. Catal. A-Gen. 397 (2011) 163-170.
[66] M.M. Azis, H. Härelind, D. Creaser, Chem. Eng. J. 221 (2013) 382-397.
[67] H. Backman, K. Arve, F. Klingstedt, D.Y. Murzin, Appl. Catal. A-Gen. 304 (2006) 86-92.
[68] H. Backman, J. Jensén, F. Klingstedt, J. Wärnå, T. Salmi, D.Y. Murzin, Appl. Catal. A-Gen. 273 (2004) 303-307.
[69] G.W. Busser, O. Hinrichsen, M. Muhler, Catal. Lett. 79 (2002) 49-54.
[70] N. Sadokhina, D. Doronkin, P. Pributkov, V. Bukhtiyarov, R. Kvon, A. Stakheev, Top. Catal. 54 (2011) 1190-1196.
[71] H. Härelind, F. Gunnarsson, S.M.S. Vaghefi, M. Skoglundh, P.A. Carlsson, ACS Catal. 2 (2012) 1615-1623.
[72] Y. Guo, M. Sakurai, H. Kameyama, Appl. Catal. B-Environ. 79 (2008) 382-393.
[73] X. She, M. Flytzani-Stephanopoulos, J. Catal. 237 (2006) 79-93.
[74] S. Klacar, H. Grönbeck, Cat. Sci. Technol. 3 (2013) 183-190.
[75] B. Sawatmongkhon, A. Tsolakis, K. Theinnoi, A.P.E. York, P.J. Millington, R.R. Rajaram, Appl. Catal. B-Environ. 111-112 (2012) 165-177.


![An Experimental and Kinetic Modelling Study for Methane Oxidation … · 2017. 8. 28. · Trinchero et al. [19] developed a detailed kinetic model for methane oxidation over single](https://static.fdocuments.in/doc/165x107/610157f34274033f403f3b94/an-experimental-and-kinetic-modelling-study-for-methane-oxidation-2017-8-28.jpg)