Thesis Financial Growth of The Turkish Defense Industry An. · PDF filefinancial growth of the...
74
FINANCIAL GROWTH OF THE TURKISH DEFENSE INDUSTRY: AN EXPLANATORY ANALYSIS A Master Thesis By M. UMUT ÇAKIR Department of Management Bilkent University Ankara September 2003
-
Upload
vuonghuong -
Category
Documents
-
view
225 -
download
2
Transcript of Thesis Financial Growth of The Turkish Defense Industry An. · PDF filefinancial growth of the...
FINANCIAL GROWTH OF THE TURKISH DEFENSE
INDUSTRY:
AN EXPLANATORY ANALYSIS
A Master Thesis
By
M. UMUT ÇAKIR
Department of Management Bilkent University
Ankara September 2003

2
FINANCIAL GROWTH OF THE TURKISH DEFENSE INDUSTRY:
AN EXPLANATORY ANALYSIS
The Institute of Economics and Social Sciences
of
Bilkent University
By
M. Umut ÇAKIR
In Partial Fulfillment of the Requirements for the Degree
of
MASTER OF BUSINESS ADMINISTRATION
in
THE DEPARTMENT OF MANAGEMENT
BİLKENT UNIVERSITY
ANKARA
September 2003

I certify that I have read this thesis and have found that it is fully adequate, in scope
and in quality, as a thesis for the degree of Master of Business Administration.
---------------------------------
Doç. Dr. Can Şımga-MUĞAN
I certify that I have read this thesis and have found that it is fully adequate, in scope
and in quality, as a thesis for the degree of Master of Business Administration.
---------------------------------
Doç. Dr. Zeynep ÖNDER
I certify that I have read this thesis and have found that it is fully adequate, in scope
and in quality, as a thesis for the degree of Master of Business Administration.
---------------------------------
Assist. Prof. Ümit ÖZLALE
Approval of the Institute of Economics and Social Sciences
---------------------------------
Prof. Dr. Kürşat AYDOĞAN
Director

i
ABSTRACT
FINANCIAL GROWTH OF THE TURKISH DEFENSE
INDUSTRY:
AN EXPLANATORY ANALYSIS
Çakır, M. Umut
M.B.A., Department of Management
Supervisor: Doç. Dr. Can Şımga-Muğan
September 2003
The importance of the Turkish defense firms that sell various products to
the Turkish Armed Forces has been gradually increasing in the last decade,
especially after the September 11, 2001. Turkey has to pay more attention to
the national defense industry, because of the threats and serial crisis in the
region. The companies in defense industry have very important role in
economy however; decreasing the defense expenditures will accelerate the rate
of economic growth. As a result, the strategies for the financial growth of
defense firms are very crucial. The purpose of this study is to identify how
Turkish Defense Industry financed growth in sales and assets during the five-
year period and how they should finance growth in order to realize a
respectable sustainable growth rate.
Keywords: Defense Industry, Turkish Defense Industry, And Sustainable
Corporate Growth

ii
ÖZET
TÜRK SAVUNMA SANAYİİNİN FİNANSAL BÜYÜMESİ:
AÇIKLAYICI BİR ANALİZ
M. Umut ÇAKIR
YÜKSEK LİSANS TEZİ, İŞLETME FAKÜLTESİ
Tez Danışmanı: Doç. Dr. Can Şımga-Muğan
Eylül, 2003
Ülkemizde Türk Silahlı Kuvvetlerinin çeşitli ihtiyaçlarına yönelik
üretim yapmakta olan savunma sanayii şirketlerinin önemi gün geçtikçe
artmaktadır. Özellikle 11 Eylül 2001’den sonraki gelişmeler bu önemi daha da
arttırmıştır. Bölgesindeki tehditler ve seri krizler sebebiyle, Türkiye’nin ulusal
savunma sanayiine çok daha fazla önem vermesi gerekmektedir. Savunma
sanayii şirketleri ülke ekonomisinde çok önemli bir role sahip olmakla birlikte
aslında savunma harcamalarının azaltılması ekonomik büyümeyi
hızlandırmaktadır. Bu yüzden savunma sanayii şirketlerinin finansal
büyümelerine yönelik stratejiler büyük önem arz etmektedir. Bu çalışmanın
amacı Türk Savunma Sanayiinin 1997-2001 yılları arasındaki reel ve
sürdürülebilir büyümesini ve etki eden faktörlerini tespit etmek ve büyümenin
nasıl finanse edilmesi gerektiğini incelemektir.
Anahtar Kelimeler: Savunma Sanayii, Türk Savunma Sanayii,
Sürdürülebilir Büyüme
iii
ACKNOWLEDGEMENTS
I am very grateful to Doç. Dr. Can Şımga-Muğan for her supervision,
constructive comments, and patience throughout the study. I also wish to
express my thanks to Dr. Özer Özdinç, Dr. Ümit Özlale and Dr. Zeynep Önder
for their comments on the study. Finally, I am grateful to my wife Meltem and
parents, to whom this thesis is dedicated.

iv
TABLE OF CONTENTS
Abstract ………………………………………………. i
Özet ………………………………………………. ii
Table of Contents ………………………………………. iv
List of Tables ………………………………………. vi
List of Figures ………………………………………. vii
CHAPTER 1: Introduction ………………………………. 1
CHAPTER 2: Turkish Defense Industry………………….…. 6
2.1 Turkey’s National Defense Policy ………………. 6
2.2 Resources of Defense Expenses…………. ……… 8
2.3 Characteristics of Turkish Defense Industry…….. 9
2.4 Defense Research and Technology Projects............. 12
CHAPTER 3: Literature Review …………………………….. 15
3.1 Business Firm Growth …………………………… 15
3.2 Sustainable Growth………………………………. 17
3.3 Higgins Model……………………………………. 19
CHAPTER 4: Data and Methodology ………………………. 24
4.1 Data……………………………………………….. 24
4.2 Methodology ……………………………………… 27
CHAPTER 5: Results ………………………………………….. 31
5.1 Return On Asset Performance ……………………… 31
5.2 Return On Equity Performance ………………….… 34
5.3 Sustainable Growth….…..…………………………... 38
5.4 Panel (Pool) Data Analysis........................................... 42

v
CHAPTER 6: Conclusion and Discussions……………………….. 47
APPENDIX……………………………………………………….. 56
BIBLIOGRAPY …………………………………………………. 57

vi
LIST OF TABLES
Table 1 Sales of Defense Firms
(Unadjusted Percentage Change)………..………………… 25
Table 2 Sales of Defense Firms
(Inflation Adjusted Percentage Change)….……………….. 25
Table 3 Total Assets of Defense Firms
(Unadjusted Percentage Change)…….……………………. 26
Table 4 Total Assets of Defense Firms
(Unadjusted Percentage Change).…………………………. 26
Table 5 Mean and Median of Net Sales and Total Asset
(Unadjusted)...……………………………………………... 27
Table 6 Mean and Median of Net Sales and Total Asset
(Inflation Adjusted)............................................................... 27
Table 7 Annual ROA Performance of Defense Industry…………… .31
Table 8 ROA Performance of Defense Industry
(No Outliers Eliminated)………….………………………. 33
Table 9 ROA Performance of Defense Industry
(Outliers Eliminated)….…………………………………... 33
Table 10 ROE Performance of Defense Industry
(No Outliers Eliminated)………..………………….……… 34
Table 11 ROE Performance of Defense Industry
(Outliers Eliminated)……………..…………….…………. 35
Table 12 Annual Earnings of Defense Firms …...…………………… 37
Table 13 Vertical Analysis…………………………………………… 37
Table 14 Horizontal Analysis…………………………………………37
Table 15 Annual Growth Rate for The Five-Year Period
(No Outliers Eliminated)…………………………………... 39
Table 16 Annual Growth Rate for The Five-Year Period
(Outliers Eliminated)……...………………………….…… 39
Table 17 Descriptive Statistics of Variables …...……………………. 43
Table 18 Fixed-Effects (within) Regression……..…………………... 44

vii
Table 19 Fixed-Effects (within) Regression …………………………45
Table 20 Fixed-Effects (within) Regression …………………………46
Table 21 Fixed-Effects (within) Regression …………………………46
Table 22 Top Defense Firms in 2000 by Defense Sales …..………… 48
Table 23 Procurement and Employment Levels of Turkish Defense
Sector………………………………………………………. 51
Table 24 Arms Procurement and R&D Budgets of Western
Countries…………………………………………………….52
viii
LIST OF FIGURES
Figure 1 Share of Defense Sales by Top 100 Defense Firms Worldwide by National Origin of Company………………...…………. 49

1
CHAPTER 1
INTRODUCTION
Defense industry, which produces strategic and tactical, offensive and
defensive weapon systems, military accessories and plans related services that are
needed to defend a country, is an organization with a group of public and private
companies (Alnıak, 2003).
The geographical position of Turkey, at the heart of the most unstable
“Bermuda Triangle” in the world—the Balkans, Caucasus and the Middle East—
makes it imperative to maintain a strong and modern military. Turkey is expanding
its national defense industry to support its armed forces. Turkey is a member of the
United Nations (UN), North Atlantic Treaty Organization (NATO), Organization for
Security and Cooperation in Europe (OSCE), the Euro-Atlantic Partnership Council
(EAPC) and the Western European Union (WEU) (White Book 2002, p. IV). Being a
strength and balance element in the region, Turkey pays more attention to defense
than some other countries.
The Ministry of National Defense, which plans to modernize the Turkish
Armed Forces, is financed mainly by the national budget and the Defense Industry
Support Fund and partly by foreign military loans and contributions in connection
with the Conventional Forces in Europe Treaty. The budget of The Ministry of
National Defense is approximately 3.6 percent of the GNP on average and around 12
percent in the Consolidated Budget, which is the highest percentage among NATO
2
nations. The average allocation of the Ministry of National Defense’s budget is as
follows (The Ministry of National Defense, 2000):
• Turkish General Staff 7.7 %
• Ministry of National Defense 7.3 %
• Land Forces Command 49.5 %
• Naval Forces Command 13.9 %
• Air Forces Command 21.6 %
The roots of current defense enterprises can be traced back to the transfer of the
limited arms manufacturing capability of the Ottoman Empire to Ankara during the
War of Independence. In the 1920s and 1930s, the defense industry expanded to
meet the internal security requirements of the new Republic. Turkey's entry into the
Western military alliance system after The World War II brought these developments
to a sudden stop. Massive amounts of US arms were poured into the country. The
embryonic aircraft industry was dismantled in 1959, and plans for the manufacture of up-
to-date infantry weapons were postponed. This massive injection of military aid also
ended the policy of diversified arms suppliers. Almost all of the front-line equipment of
the armed forces was of US origin. Some Western aid went into military workshops and
shipyards to produce spare parts and maintain imported equipment (Karasapan, 1987).
The first shock to Turkish confidence in the US came during the 1960 Cuban
missile crisis. Washington's readiness, to trade its missiles in Turkey for Soviet
missiles in Cuba, showed that Turkey was no trusted ally but a mere pawn in the Cold
War. Turkish government was even more affronted in 1964, when Lyndon Johnson

3
informed Prime Minister Ismet Inönü about the impossibility of the usage of the US-
supplied arms in Cyprus (Karasapan, 1987).
These challenges to the Turkish state's esteem and the modernization
requirements of World War II old-model weapons, which were no longer sufficient to
meet the country's needs, created a Re-modernization Plan (REMO I) in 1970 (White
Book 2002, Part XI). The plan reflected not only the political decision to expand arms
production but also the economic reality that foreign grants and concessionary loans
could no longer meet the high-tech, high-cost weaponry needs of the Turkish army.
The US arms embargo following the 1974 Turkish intervention in Cyprus and
later the embargo by some Western powers following the 1980 military coup gave
greater impetus to these moves. Turkish decision-makers saw little choice but to
expand the country's defense industry, to diversify and lessen its dependence on the
outside sources.
Turkish Defense Industry was given a big boost with the establishment of the
Undersecretariat for Defense Industries in 1985 (SSM), which is responsible for the
development and modernization of the Turkish defense industry. Turkey began its
defense-related modernization program in 1986 with co-production of F16 fighter
aircraft, armored infantry fighting vehicles and light transport aircraft. Even though
the development of the Turkish defense industry has not reached the desired level as
of yet, Turkey has been able to export her products to every corner of the earth in the
fields of defense electronics, rockets, aviation and armored vehicles. Turkish
frequency radiotelegraphy and radar are way ahead of their giant competitors in the
Far East. There is now a vast market for Turkish armored vehicles in North Africa
and in the Middle East, which had been previously taken by Turkey’s competitors in
this field (Undersecretariat of Defense Industry, 2000).

4
Being an important part of the economic structure of a country, defense
industry has some differences from other industries as follows (Şimşek, 1997):
• It requires trained manpower
• It needs special quality standards
• It always uses the newest technology, and therefore R&D activities are
crucial
• Defense companies generally do not have the flexibility to transform the
production to civilian products
• More attention is paid to safety and secrecy
• Since there are a few buyers, it requires limited production
• It requires large amount of investment
• The defense firms need to enter to international markets in order to survive
Generally, the defense sector makes use of state-of-the-art-technology and is
a sector often described as the “locomotive power” of the industry (Burçak, 1997).
Besides its strategic importance, defense companies play a major role in the
economy. Therefore, the purpose of this study is to identify, using Higgins’ concept1,
how defense firms financed growth in sales and assets between the years 1997-2001
and how they should finance growth in order to realize an acceptable sustainable
growth rate. Since understanding a firm’s sustainable growth rate provides
information whether the firm is likely to encounter financial distress in the future, it
will be helpful in order to make projections about the financial future of the Turkish
Defense Industry.
1 Higgins’ concept is the most referenced sustainable growth model. Higgins (1970) defines sustainable growth as the annual percentage increase in sales that is consistent with the firm's established financial policies. The firm's established financial policies include the dividend payout ratio and use of debt financing. The model will be explained in more detail in Chapter 3 on page 17.

5
Turkey’s National Defense Policy and the Characteristics of Turkish Defense
Industry are explained in Chapter 2. Then brief information about sustainable growth
is given in Chapter 3. Chapter 4 explains data and methodology. Chapter 5 contains
the results of the studies. Finally conclusion and discussions appear in Chapter 6.

6
CHAPTER 2
TURKISH DEFENSE INDUSTRY
This chapter starts with a brief review of Turkey’s National Defense Policy
and resources of defense expenses. The rest of the discussion focuses on the
Characteristics of The Turkish Defense Industry and the defense research and
technology projects.
2.1 Turkey’s National Defense Policy
The threats and risks that Turkey has confronted with in the post-Cold War
period are rather different from those in the past. At the end of the Cold War, there
was a search for a new world system by the effect of globalization, which also
changed the concepts of threat. The traditional concept of threat has now started to
contain new threats and risks emerging in the form of (White Book 2002, Part IV):
• Regional and ethnic conflicts
• Political and economic instabilities and uncertainties in the countries
• Proliferation of weapons of mass destruction and long-range missiles
• Religious fundamentalism
• Smuggling of drugs and all kinds of weapons
• International terrorism
Turkey is located at the center of the triangle formed by the Balkans,
Caucasus and the Middle East, where new threats and risks are concentrated. Turkey
is placed in a region where the interests of the global powers and formations
intersect. This situation, stemming from Turkey's geostrategic location, has not

7
changed until now and will not change in the twenty-first century. It is evaluated that
the importance of Turkey in the new world system will become even more
strengthened. Turkey's Defense Policy is prepared to protect and preserve national
independence, sovereignty, territorial integrity and vital interests of the country. For
that reason, the following are the targets of Turkey in her National Defense Policy at
the beginning of the twenty-first century as a requirement of the period (White Book
2002, Part IV):
• To contribute to peace and security in the region and to spread this to large
areas
• To become a country producing strategy and security that could influence all
strategies aimed at the region and beyond
• To become an element of power and balance in the region
• To make use of every opportunity and to take initiatives for cooperation,
becoming closer and developing positive relations with global and regional
powers.
The basic principles of the Defense policy determined in the framework of
the principle, "Peace at Home, Peace in the World", set forth by Atatürk, are as
follows:
• To make a maximum contribution to reduce all kinds of international tensions
and provision of just and lasting peace,
• To preserve and protect independence, territorial integrity and the republic,
• To take all measures to prevent crises and conflicts
• To take an active part in collective defense systems and to fulfill the
responsibilities entrusted to it.

8
2.2 Resources of Defense Expenses
The determination of defense expenses and resources are carried out within
the framework of the Planning, Programming and Budgeting System (PPBS) (White
Book 2002, Part IX). When making an evaluation of the probable resources to be
allocated to the Turkish Armed Forces (TAF), the possible amount, magnitude of
resources that could be allocated for defense expenses during the planning period
within the framework of factors such as general economic indicators, growth rate,
foreign trade balance, price and cost increases, foreign aid and loan possibilities,
development plans, government program and the programs and obligations in effect
is determined.
The resources of defense expenses are composed of (Undersecretariat of
Defense Industry, 2002):
• Allocated Resources from the National Defense Budget,
• Resources from the Defense Industry Support Fund (DISF),
• Resources from the TAF Strengthening Foundation (SF),
• Budget of the Gendarmerie General Command,
• Budget of the Coast Guard Command,
• Foreign State or Company Loans Repaid from the Budget of the
Undersecretariat of The Treasury
• Revenues based on the Special Laws of the Ministry of National Defense.
The most important portion of the resources allocated to defense is constituted by the
budget of the Ministry of National Defense. The budget is composed of four parts
according to main service groups (White Book 2002, Part IX):
• Personnel Expenses

9
• Other Current Expenses
• Investments and Transfers.
Personnel expenses reflect all costs that are directly related to personnel and
are determined according to the legislation. Other Current Expenses comprise the
most significant part of the budget. The modernization projects, which are included
in the Strategic Target Plans (STP), allocations of funds for food and clothing of
military personnel as set in by laws, construction, building repairs, duty travel
expenses, fuel, electricity, water, natural gas, treatment and medication needs, fixed
assets, stationery needs, cargo and transportation services, procurement of spare
parts, are provided for in this main service group. Investments are composed of
vehicles procurement, some construction projects and various renovation projects.
Transfers include membership due to international organizations, nationalization,
payment of debts from previous years and social assistance to be made to various
associations, unions, institutions and organizations.
The share of the Ministry of National Defense budget in the Gross National
Product (GNP) is on average 2.5 percent and around 9.7 percent of the Consolidated
Budget. On the other hand, about 30 percent of the Ministry of National Defense
budget is allocated for personnel expenses, 68.9 percent for other current expenses
and the balance for investment and transfer expenses (White Book 2002, Part IX).
2.3 Characteristics of Turkish Defense Industry
The requirements of the Turkish Armed Forces (TAF) are met by direct
purchase from the domestic and foreign markets or by participation in joint
production programs. Direct purchases from the domestic market are the products

10
developed by the domestic producers or manufactured under license (technology
transfer) from foreign countries. There are also products that are obtained as the
result of the joint activities through research and development (R&D) of the TAF and
the domestic producers.
Turkey, which aims to become a self-sufficient country in the field of defense
equipment, has accelerated its activities and concentrated its efforts on this field. The
Turkish Defense Industry, in order to be able to reach the advanced level necessary
in the production of the modern defense equipment, is trying to develop its
production resources and capabilities, either by means of its own resources or by
participating in joint production projects together with the Allied Countries or by
means of technology transfer. In this framework, the cooperation programs carried
out with the Allied Countries in the structure of NATO or the European Union (EU)
have a significant place in Turkey's defense industry activities. As a result, the
development of the Turkish Defense Industry has further accelerated and its sectoral
infrastructure has been completed to a great extent.
On the basis of main weapons systems, 80 percent of the defense equipment
is presently procured from abroad (Undersecretariat of Defense Industry, 2002). It is
targeted to change this ratio and to increase the domestic procurement ratio to levels
that will make Turkey's defense industry sufficient and independent.
Providing all kinds of weapons, vehicles, equipment and materials needed by
the TAF from national resources is very crucial from the aspect of preserving and
strengthening the existing defense industry foundation and of creating employment.
The Main Sectors of the Turkish Defense Industry are classified as follows
(Undersecretariat of Defense Industry, 2002):
• Aviation and Space Industry,

11
• Rocket and Missile Industry,
• Electronics Industry,
• Weapons and Ammunition Industry,
• Military Shipbuilding Industry,
• Military Automotive and Armored Vehicle Industry
• Military Clothing Industry.
A major portion of the companies related to the Turkish Defense Industry is
collected under the roofs of the Defense Industry Manufacturers Association (DIMA)
and the Defense Industrialists Association (DIA). The DIMA and DIA constitute a
bridge between the producers and customers. They analyze and interpret the
information collected and send them to their members and other related parties.
DIMA is also a member of the European Defense Industry Group (EDIG).
Turkey generally faces the same problems of the developing countries while
generating her own defense industry. These problems are (Ministry of National
Defense 2001, p. XII-XIII):
• Defense spendings occupy a major part of GNP but because of low GNP
these spendings are not enough
• Problems in transferring new technology to Turkey
• Insufficiency of current production technology
• High production costs
• Financing problems
• Lack of trained workforce
• Economies of scale
• Dependency on foreign industries
• Regulatory policies

12
• Price has primary importance more than technology and human resources
• Firms concentrate on production, however; there are major problems in
maintenance
The production of high technology war weapons and vehicles in Turkey with
the objective of meeting the needs of the Armed Forces constitutes the foundation of
the Turkish Defense Industry Strategy. Turkey's National Military Strategy (TNMS)
and the Planning and Programming Directive (PPD) are used as a source in the
determination of the Defense Industry Strategy.
The Defense Industry policy envisages the formation of a defense industry
that (White Book 2002, Part IX):
• Is open to the foreign sector as well as the domestic sector,
• Has an export potential and capability to compete internationally,
• Can produce new technology and has a dynamic structure,
• Makes it possible to have balanced defense industry cooperation between
Turkey and other countries and is influenced to a minimum extent by the
changing political conditions
• Can also engage in production for civilian purposes.
2.4 Defense Research and Technology Projects
The defense research and technology projects are collected under the three
main groups specified below (Undersecretariat of Defense Industry, 2002):

13
• System development projects that are carried out for the development of the
existing systems of the TAF. These projects are in the categories of "Must Be
National" and "Critical".
• Technological infrastructure formation projects related to the technologies on
which these systems are based.
• Basic research projects directed to these technologies.
The system development projects are carried out by industrial organizations,
technological infrastructure formation projects are carried out by industrial
organizations and the Scientific and Technical Research Institution of Turkey
(TUBITAK), and basic research projects are carried out by the universities.
Approximately 2 percent of the defense budget is allocated for the financing
of defense research activities in Turkey. Furthermore, the defense industry
organizations allocate 2-10 percent of their annual budgets for research and
development activities (Ministry of National Defense, 2001). However, due to the
defense budget cuts, every country cannot form an adequate infrastructure in all
technological fields and because of the advantages of carrying out joint projects with
other countries, great importance is placed on carrying out joint R&D projects with
the friendly and allied countries.
Turkey participates in the joint research and technology activities in the
structure of NATO and the Western European Union (WEU). Western European
Armament Group (WEAG), which is connected to the European Union, develops
cooperation on the subjects of defense equipment in Europe. Turkey maintains a
close cooperation with Belgium, Denmark, France, Germany, Greece, Italy,
Luxembourg, the Netherlands, Norway, Portugal, Spain and The United Kingdom,
which are the members of WEAG, along with Turkey.

14
The projects in which Turkey participates along with the other WEAG
countries are given below:
• STINGER,
• M483/M864 155 mm Advanced Artillery Ammunition and
• Future Large Aircraft (FLA)
Turkey also participates in the Conference of National Armaments Directors
(CNAD), which is an organization connected to NATO Council and established in
1966 with the objective of coordinating the armaments cooperation among NATO
member countries and takes an active part in both the concept activities and in some
of the joint production and procurement projects. The projects in which Turkey is
presently participating in the scope of the CNAD are specified below
(Undersecretaritat of Defense Industry, 2002):
• Alliance Ground Surveillance (AGS) System,
• Theatre Missile Defense (TMD) System,
• Continuous Acquisition and Lifelong Support (CALS) System,
• Battlefield Information Systems (BICES),
• Tactical Communications Systems (TACOMS-POST 2000) and
• NATO Friend or Foe Identification System (NIS)
In parallel with the rapidly developing defense industry resources and capabilities, it
is aimed for Turkey to engage in cooperation connections based on the principle of
reciprocity with friendly and allied countries and to make concrete cooperation on
the subjects of technology and R&D and also on the joint production and
procurement of defense equipment.

15
CHAPTER 3
LITERATURE REVIEW
In this chapter, business firm growth is covered first as a background. Next, a
brief discussion of sustainable growth literature is presented. The Higgins Model on
sustainable growth concludes the chapter.
3.1 Business Firm Growth
All the managers of firms wish to maximize their profits from investment in
the enterprise itself. They always have great desire to grow and to make profits. That
is why, the main strategies in the firm are related with the growth of the firm.
The term “growth” is often used vaguely, or with a variety of meanings.
People talk of “growth firms”-and of paying more for a growth firm- but their
meaning is not always clear. It sometimes denotes merely increase in amount, output,
exports, sales etc. “At other times, it is used in primary meaning implying an increase
in size or an improvement in quality as a result of a process of development, that is
similar to natural biological processes in which an interacting series of internal
changes lead to increases in size accompanied by changes in the characteristic of
growing object” (Penrose 1995, p.1). However, in most of the academic studies, a
firm’s growth is decomposed into two parts: the growth resulting from the growth in
the markets in which the firm sells its products and the growth that is achieved as a
result of an increased market share. The source of the sales growth, market growth,

16
or share growth may influence the firm’s operating and financial targets, as well as
its stock price relative to other firms in the industry (Clark, Thomas and Gerard,
1989).
Why do firms grow? It is an important question. Yet, economists and
management people have so far failed to answer it convincingly. There are three
main competing theories: The traditional explanation is that firms grow to reap
economies of scale, and to increase their market power. They stop growing once they
reach an optimum size, when they run out of profitable investment opportunities or
become too big and bureaucratic to manage. Secondly, life-cycle theories, which
became popular in the 1970s and 1980s, identify several stages in the growth of
firms, including an entrepreneurial phase, maturity and finally a period of decline. A
third view, currently fashionable, attributes firms' growth to their ``core
competencies''. Admittedly, this is a somewhat nebulous concept. But in essence, it
means that a firm's performance is determined by building on a set of key skills that
distinguish it from its rivals. These might include better technology, a trusted brand
name, or the experience of its employees (The Economist, 1999).
Geroski (1999) determined that companies of different sizes’ growth largely
follow a ``random walk''--an erratic and unpredictable course. There is in fact some
evidence that smaller firms grow faster than larger ones. In particular, very small,
very new firms tend to grow much faster than established ones. More surprisingly,
firms' growth rates are only weakly correlated with that of the economy as a whole
or, indeed, with that of their own industry. Recessions seem to hit only a few firms
badly; most are largely unaffected, while some actually prosper. Geroski's finding is
also consistent with the finding that firms are unlikely to respond to a shock

17
immediately if they plan to restructure soon. They will respond only after enough
pressure has built up to convince them that the shock is permanent and important.
There is an interesting implication for the relation between desire to grow and
the desire to make profits. If profits are a condition of successful growth, but profits
are sought primarily for the sake of the firm that is, to reinvest in the firm rather than
to pay to the owners for the use of their capital, then from the point of investment
policy, growth and profits become equivalent as the criteria for the selection of
investment programs (Penrose, 1995).
There are also other objectives that are often important for the firm such as
power, prestige, public approval or the mere love of the game (Penrose, 1995). It
should be recognized that the attainment of these usually are not associated directly
with the ability to make profits. Firms will never invest in expansion for the sake of
the growth if the return on the investment is negative. Firms will never invest outside
the firm except eventually to increase the funds available for investment in the firm.
Therefore, increasing the total long run profits of the enterprise is equivalent to
increasing the long run rate of growth (Penrose, 1995).
3.2 Sustainable Growth
The concept of "sustainable growth" is well documented in both academic and
practitioner journals, and goes back at least to David Packard explaining how
Hewlett-Packard grew (Klein and Belt, 1994). Specifically, given the firm’s target
dividend payout ratio and financial structure (debt to equity), sustainable growth rate
is the percentage increase in sales that can be maintained without necessitating a
change in financial policy. Understanding a firm’s sustainable growth rate provides

18
information whether the firm is likely to encounter financial distress in the future.
Some writers also have used terms such as "supportable growth" (Kisor, 1964) or
"affordable growth" (Kyd, 1981). The notion of sustainable growth that is, perhaps,
the most referenced version is associated with Higgins. Higgins (1970) defines
sustainable growth as the annual percentage increase in sales "that is consistent with
the firm's established financial policies." The firm's established financial policies
include the dividend payout ratio and use of debt financing. Within Higgins’
framework, a firm experiencing growth has four ways in which to raise the additional
funds needed to finance that growth.
Issue more equity
Reduce the dividend payout ratio
Increase the firm’s debt position
Improve the firm’s operating performance
The debt Higgins refers to include both short and long term liabilities since
both are typically used to finance the assets of the firm. Also, an improvement in the
firm’s operating performance should be reflected in an increase in the firm’s net
income and greater availability of the retained earnings.
A number of researchers have studied the issue of sustainable growth and all
have basically arrived at the idea that growth beyond the sustainable level forces firm
management to make important operating and financing decisions. Sustainable
growth can be defined (see Kisor (1964), Kyd (1981) and Higgins (1989)) as
SUSG = ROE * (1-DPR)
where SUSG is the sustainable growth rate, ROE is the return on equity and DPR is
the dividend payout ratio. Thus, (1-DPR) represents the percentage of net income
retained by a company. Actual growth beyond the sustainable level must be financed

19
in some way, and possibly in a way that requires management to change their set
dividend and leverage policies.
Higgins (1977) states that if a firm's sales are growing at a rate faster than
sustainable growth rate, and if management chooses not to issue new equity, then a
move away from set financial policies will be required to sustain the chosen level of
growth. Typically, the financing method of choice for these faster growing firms is
an increase in leverage. Gupta (1969) provides empirical evidence that supports
Higgins' notions, as does Gup (1980). Furthermore, the presence of inflation will
affect the amount of additional financing needed (Higgins (1977) and (1981); and
Johnson, (1981)) and, thus, the ability of a company to grow. While some researchers
have found that increased borrowing is the typical financing choice employed to
increase growth, others indicate that it is not always the best way to increase growth.
Ellsworth (1983) agrees with Higgins that firms can grow faster by using
proportionately more debt, but he recommends that firms issue new equity from time
to time to relieve financing constraints. Spraakman (1979) finds that a change in
return on investment impacts growth more so than does a change in leverage, at least
for certain lines of business. Pruitt and Gitman (1991), in a survey of financial
managers of the 1000 largest U.S. firms, find that the choice of external financing
(i.e., the issuance of debt or equity) is driven by the level of current investment
expenditures, the degree of financial leverage, interest rate levels, and liquidity.
3.3 Higgins Model
In 1977 and 1981 Higgins demonstrated that the financial policies of many
corporations may be at variance with their growth objective. As a guide for setting

20
compatible financial policies and growth objectives, Higgins developed a formula to
calculate a rate of sustainable growth. In deriving his formula Higgins made the
following assumptions (Clark, Chiang and Olson 1989, p.28):
• Book depreciation is adequate to recapture the value of existing assets;
• Profit margin (P) on new sales (S') corresponds to that of existing sales (S);
hence, the change in sales ( S) equals S'-S;
• Firm has an established financial structure goal that is debt to equity ratio (L)
without the sale of new common stock;
• Firm has an established dividend payout rate (D); thus, the target retention
ratio is (1-D);
• New fixed assets at book value (F) represent a stated proportion of the
change in physical volume of output (real sales);
• New current assets (C) are a stated proportion of sales in nominal
dollars;
• Initial level of sales at the beginning of the period is represented by (S) and
the projected sales during the period by (S');
• T denotes the ratio of total assets to net sales, and the ratio is constant
for new and existing sales;
• J denotes the annual inflation rate;
• Firm will rely on retained earnings for equity financing, and new common
stock will not be issued.
Based upon these assumptions, Higgins describes the derivation of the basic
formula as cited in (Clark, Chiang and Olson 1989, p. 29):

21
“Assuming P and T are the same for new sales as for existing sales, the new
assets required to support increased sales are forecast to be S(T) … On the other
side of the balance sheet, total profits for the year are expected to be (S + S)P and
additions to retained earnings to be (S + S)P(1—D) … because every $1 added
to retained earnings enables the company to borrow $L without increasing its debt to
equity ratio.”
Since assets must equal liabilities plus equity, additions to assets must be
covered by an increase in retained earnings and new debt. Setting the two quantities
equal and solving for S / S yields Expression 1 (Higgins, 1981, p. 37):
(1)
Unless the actual growth rate (g) equals the sustainable growth rate (g*),
the profit margin, dividend payout ratio, debt/equity ratio or total assets/sales ratio
must change or the firm will be compelled to issue new equities. As subsequently
illustrated, the basic formula allows for modifications to assess the effects on sustain-
able growth of changes in prices, tax rates, and business combinations.
Optimal growth is not simply the product of accepting all investments with a
positive net-present value or an internal rate of return greater than a stipulated rate.
Management has to reflect explicitly upon the implications of higher growth rates on
established financial policies, such as dividend payouts, leveraging, and the sale of
equities. These decisions have both financial and managerial control significance (Clark,
Chiang and Olson, 1989).
[ ])1)(1()1)(1(LDPT
LDPSSg
+−−+−
=∆
=∗

22
Expression 1 can be modified to allow for price increases or decreases (inflation).
This yields the following equation (Higgins, 1981, p. 38):
(2)
[ ][ ] [ ])1)(1()1()1(
)1)(1()1(LDPJFCJ
JCLDPJg+−+−++
−+−+=∗
Overall, given the assumptions of the model, an upward trend in prices acts
to reduce real sustainable growth unless it is offset by operating efficiencies. In the
extreme case, inflation induced increases in retained earnings and borrowing are
more than offset by required increases in working capital investment. Higgins
estimates, for example, that real sustainable growth declines by 2.2 percent for
every 5 percent increase in the rate of inflation. He further notes:
“To the extent that depreciation is insufficient to maintain the value of assets .
. sustainable growth is reduced. . . . If newly acquired assets are more profitable than
existing assets in the sense of producing sales with a higher profit margin, offering a
more rapid depreciation rate or generating more sales per dollar of assets . . .
sustainable growth will rise” (Higgins, 1981, p. 36-40).
Similarly the sustainable growth rate (g*) may rise if the firm intensifies
asset utilization by reducing the assets required to support a given level of sales.
Otherwise, the firm can restore its sustainable rate of growth (g*) in an inflationary
environment only by altering accepted financial policies (reducing dividend payout,
increasing leverage, or by selling new equity shares). All things considered, therefore,
inflation has inimical effects on the sustainable rate of growth (g*). A growth rate
higher than (g*) is inconsistent with established financial targets.

23
Long term planning frequently incorporates growth projections on a five- or
ten-year basis. The objective should be to calculate a growth rate which can be
sustained over the planning period and in the process identify the corporate
adjustments necessary to maintain it. These may include changes in the
debt/equity ratio, the dividend payout ratio, asset and manpower productivity, and so
forth. These considerations loom larger in the case of business combinations where
synergistic effects become the measure of success.
The Higgins model provides a starting point to attack these issues. It also
clearly delineates the effects of price changes and tax ratios on sustainable growth
calculated from a given price level. The difficulty with the Higgins model is its heavy
reliance on accounting numbers, which are subject to the exercise of a variety of
options and which have an uncertain link to the market value of the firm's common
stock. Also, accounting numbers are historic in nature and reflect transactions
executed at different price levels. Accounting data lags price trends, on both the upside
and downside (Clark, 1985).

24
CHAPTER 4
DATA AND METHODOLOGY
4.1 Data
In this study, using Higgins’ concept, the real and sustainable growth rate of
defense firms are identified between the years 1997-2001. How defense firms
financed growth in sales and assets during the period is examined. The factors that
affect the growth rate of the defense firms are clarified and the issue of how they
should finance growth in accordance with the sustainable growth rate is discussed.
The sample contains 17 defense companies (annual balance sheets, Income
statements and cash flow statements) during the period 1997 and 2001. Data of 14
defense companies are obtained from The Turkish Armed Forces Foundation and the
other three from ISE. The statistical calculations are made using 85 data points for
the five-year period. Although the sample size seems to be small, it generally reflects
the financial situation of the defense industry since the sample includes major
leading defense companies that Turkish Armed Forces Foundation has shares in. The
sample has 2 firms in weapon and ammunition sector, 3 firms in aircraft
manufacturing, 6 firms in electronic, 5 firms in machine manufacturing and 1 firm in
oil shipping sector. According to Defense Industry Association, about 40% of the
sales of defense firms in Turkey are directly related to defense products. Unadjusted
and inflation adjusted percentage change of the net sales and total assets of defense
firms are given in Table-1, 2 and Table-3, 4. Unadjusted and adjusted mean and
median of sales and total assets of defense firms are shown in Table-5 and Table-6.

25
Table 1: Sales of Defense Firms (Unadjusted Percentage Change) COMPANIES 1997 1998 1999 2000 2001
ALCATEL 100% 204,42% 285,80% 434,35% 873,01%
ASELSAN 100% 173,60% 313,15% 536,56% 997,98%
ASPİLSAN 100% 145,79% 161,85% 276,33% 297,51%
ÇANSAŞ 100% 228,93% 516,04% 532,24% 417,57%
DITAS 100% 157,50% 194,38% 400,19% 756,63%
HAVELSAN RADAR 100% 118,44% 374,59% 405,06% 971,48%
HAVELSAN TEKNOLOJI 100% 324,31% 244,40% 490,81% 576,49%
İŞBİR 100% 159,09% 301,98% 529,22% 525,24%
MERCEDES-BENZ 100% 134,71% 147,50% 345,60% 360,10%
NETAŞ 100% 135,35% 236,38% 368,54% 393,02%
OTOKAR 100% 243,50% 439,88% 661,58% 646,58%
PARSAN 100% 147,94% 168,02% 333,40% 343,97%
PETLAS 100% 194,33% 317,59% 407,80% 498,30%
ROKETSAN 100% 685,76% 590,62% 1458,19% 5216,46%
TAİ 100% 132,12% 188,94% 178,78% 713,98%
TEİ 100% 183,87% 387,80% 832,49% 1989,60%
TUSAŞ - 100% 261,75% 454,87% 937,76%
TOTAL 100% 160,13% 221,89% 408,95% 622,87%
Table 2: Sales of Defense Firms (Inflation Adjusted Percentage Change)
COMPANIES 1997 1998 1999 2000 2001
ALCATEL 100% 118,97% 108,57% 109,18% 135,77%
ASELSAN 100% 101,04% 118,96% 134,87% 155,20%
ASPİLSAN 100% 84,85% 61,48% 69,46% 46,27%
ÇANSAŞ 100% 133,24% 196,03% 68,25% 64,94%
DITAS 100% 91,66% 73,84% 100,59% 117,67%
HAVELSAN RADAR 100% 68,93% 142,30% 101,82% 151,08%
HAVELSAN TEKNOLOJI 100% 188,75% 92,84% 123,37% 89,65%
İŞBİR 100% 92,59% 114,71% 133,02% 81,68%
MERCEDES-BENZ 100% 78,40% 56,03% 86,87% 56,00%
NETAŞ 100% 78,77% 89,79% 92,64% 61,12%
OTOKAR 100% 141,72% 167,10% 166,29% 100,55%
PARSAN 100% 86,10% 63,83% 83,80% 53,49%
PETLAS 100% 113,10% 120,64% 102,51% 77,49%
ROKETSAN 100% 399,11% 224,36% 366,53% 811,25%
TAİ 100% 76,89% 71,77% 44,94% 111,04%
TEİ 100% 107,01% 147,32% 209,26% 309,42%
TUSAŞ - 100% 170,85% 196,45% 250,58%
TOTAL 100% 92,90% 84,29% 102,79% 96,87%

26
Table 3: Total Assets of Defense Firms (Unadjusted Percentage Change)
COMPANIES 1997 1998 1999 2000 2001
ALCATEL 100% 222,53% 396,88% 443,54% 923,01%
ASELSAN 100% 179,44% 328,70% 561,87% 910,23%
ASPİLSAN 100% 154,51% 210,77% 251,06% 337,50%
ÇANSAŞ 100% 195,24% 235,04% 319,70% 526,88%
DITAS 100% 121,45% 305,60% 324,30% 1666,30%
HAVELSAN RADAR 100% 274,88% 359,87% 230,97% 442,64%
HAVELSAN TEKNOLOJİ 100% 39,92% 80,67% 56,06% 119,01%
İŞBİR 100% 167,61% 448,77% 833,50% 788,99%
MERCEDES-BENZ 100% 149,07% 218,26% 308,70% 459,35%
NETAŞ 100% 146,89% 296,20% 379,92% 583,31%
OTOKAR 100% 313,46% 622,74% 805,78% 1503,63%
PARSAN 100% 217,85% 278,48% 507,29% 670,49%
PETLAS 100% 172,51% 245,72% 351,68% 490,62%
ROKETSAN 100% 138,95% 482,05% 837,85% 1615,12%
TAİ 100% 193,55% 493,65% 446,40% 842,52%
TEİ 100% 176,35% 291,43% 506,12% 944,46%
TUSAŞ 100% 521,35% 676,65% 751,48% 939,83%
TOTAL 100% 169,65% 351,32% 500,10% 880,69%
COMPANIES 1997 1998 1999 2000 2001
ALCATEL 100% 129,51% 150,77% 111,49% 143,54%
ASELSAN 100% 104,43% 124,87% 141,23% 141,56%
ASPİLSAN 100% 89,93% 80,07% 63,11% 52,49%
ÇANSAŞ 100% 113,63% 89,29% 80,36% 81,94%
DITAS 100% 70,68% 116,09% 81,52% 259,14%
HAVELSAN RADAR 100% 159,98% 136,71% 58,06% 68,84%
HAVELSAN TEKNOLOJİ 100% 23,24% 30,64% 14,09% 18,51%
İŞBİR 100% 97,55% 170,48% 209,51% 122,70%
MERCEDES-BENZ 100% 86,76% 82,91% 77,59% 71,44%
NETAŞ 100% 85,49% 112,52% 95,50% 90,71%
OTOKAR 100% 182,43% 236,57% 202,54% 233,84%
PARSAN 100% 126,79% 105,79% 127,51% 104,27%
PETLAS 100% 100,40% 93,35% 88,40% 76,30%
ROKETSAN 100% 80,87% 183,12% 210,60% 251,18%
TAİ 100% 112,65% 187,52% 112,21% 131,03%
TEİ 100% 102,64% 110,71% 127,22% 146,88%
TUSAŞ 100% 303,43% 257,04% 188,89% 146,16%
TOTAL 100% 98,74% 133,46% 125,70% 136,96%
Table 4: Total Assets of Defense Firms (Inflation Adjusted Percentage Change)

27
Table 5: Mean and Median of Net Sales and Total Assets (TL millions, Unadjusted) Net Sales Total Assets
Mean Median Mean Median
1997 16.752.732 5.260.607 16.950.548 6.185.830
1998 26.825.677 10.935.458 28.757.076 15.925.309
1999 37.172.032 21.807.016 59.550.814 26.316.963
2000 68.510.066 29.493.337 84.769.286 45.704.354
2001 104.348.203 74.092.618 149.281.526 85.287.654
Table 6: Mean and Median of Net Sales and Total Assets (TL millions, Inflation Adjusted) Net Sales Total Assets
Mean Median Mean Median
1997 28.118 8.829 28.450 10.382
1998 26.205 10.682 28.091 15.557
1999 23.701 13.904 37.969 16.779
2000 28.904 12.443 35.763 19.282
2001 27.237 19.340 38.966 22.262
4.2 Methodology
In this study, first some common ratios in the literature are used and a trend
analysis is made to identify the financial performance of the defense firms for the
five-year period. Then, using Higgins’ concept, the actual and sustainable growth
rate of defense firms are determined and how defense firms financed that growth is
examined. Finally, panel data analysis is used to clarify the determinants of growth
of Turkish Defense Industry. The analysis contains:
• Return-on-asset (ROA) performance of the defense industry for the
five-year period
• Return-on-equity (ROE) performance of the defense industry for the
five-year period

28
• Trend Analysis
• Percentage change in sales for the five-year period
• Percentage change in total assets for the five-year period
• Percentage change in short-term debt for the five-year period
• Percentage change in long-term debt for the five-year period
• Percentage change in total debt for the five-year period
• Percentage change in equity for the five-year period
• Sustainable Growth Rate (without inflation effect) for the five-year
period
• Sustainable Growth Rate (with inflation effect) for the five-year period
• Panel Data analysis to clarify the determinants of growth of defense
industry
ROA Performance: In this section, first the ratio of operating return on sales
is calculated to understand the profitability of sales in defense industry. Then, net
assets (total assets less accounts payable and accruals) to net sales and asset turnover
ratios are calculated to determine how efficiently assets are managed by relating
asset items to sales. Finally, the two analyses are tied together into a return-on-asset
measure to clarify how well management has deployed the assets.
ROE Performance: Initially, the operating income effect that is, operating
return less interest expense and taxes divided by equity, is determined. The analysis
focuses solely on operating activities and excludes all financing factors to gain an
understanding of the profitability of operations; the revenues and costs involved in
the core business of the industry. Second, non-operating income effect that is, gains
and losses from non-operating activities and extraordinary activities, are determined.
Then, return-on-equity ratio and financial leverage ratios (short-term debt to equity
29
and long-term debt to equity) are calculated to clarify the effect of debt financing on
common equity. Finally, a trend analysis is made and the percentage change in sales,
operating and non-operating income are examined between the years 1997-2001.
Wholesale price index (total-general) is used as deflator in the calculations. The
formulas of the selected ratios are given in the appendix.
The Actual and Sustainable Growth: In this section, sustainable growth rate
of defense industry is calculated and the effect of inflation on the sustainable growth
rate is determined first. Then, the actual growth rate on sales, assets, debt and equity
are calculated. The first two items, sales and assets, are used to assess growth. The
next two items, debt and equity, are used to see how defense firms decided to finance
growth that is either higher or lower than the sustainable growth rate. If the
sustainable growth rate is bracketed by actual growth rates for sales and assets, it is
assumed that the defense firms can sustain their actual growth rate without
encountering financial difficulties. If the sustainable rate is less than both the actual
growth rates for sales and assets, it is concluded that without access to new capital,
the defense firms will probably face financial difficulties in the near future. If capital
suppliers dry up, the firms must slow their actual growth, increase their sustainable
growth, or a combination of these two approaches (Gallinger, 2000). If sustainable
growth exceeds both actual growth in sales and assets over two or three consecutive
years, then maybe managers are missing opportunities in the defense firm's markets
to capture more sales, profits and cash flows. The firms are possibly losing market
share to the competitors. If this situation is not corrected, the firms may become the
target of a takeover or merger.

30
Panel (Pool) Data Analysis: A Firm-level panel data analysis (fixed effect
model) is used for assessing the impact of some financial ratios, GNP growth and
inflation on actual growth rate of defense firms.
Outliers: In the study, the financial ratios and growth rates are shown in
tables with/out outliers eliminated. Outliers are detected in SPSS and measurements
that fall beyond a distance of 1,5 interquartile ranges from the hinges are considered
to be outliers. Some companies’ ratios in the sample are considered to be outliers
because of their high losses in changing years.
In the calculations of some ratios and growth rates, the number of data used is
less than 85. For example, in the calculations of sales growth, 83 data points are used
since one company in the sample does not have any sales in 1997. Also, while
calculating the growth in long-term debt, 84 data points are used since an other
company in the sample used TL47 trillion long-term debts in 2001 although it had
used only TL1,7 billion in 2000, so it is considered to be outlier to prevent the whole
sample average being affected by this specific high growth rate in long term-debts.

31
CHAPTER 5
RESULTS
This chapter discusses the results of some common ratios and the sustainable
growth mentioned in the previous chapter. Initially, ROA and ROE performance of
Turkish Defense Firms are examined. Then, a trend analysis is made to identify the
financial performance of the defense firms for the five-year period. Furthermore,
using Higgins’ concept, the actual and sustainable growth rate of defense firms is
determined and how defense firms financed that growth is examined. Consequently,
panel data analysis is used to clarify the determinants of growth of Turkish Defense
Industry.
5.1 Return On Asset Performance
The results of profitability and efficiency in managing assets of defense firms
are given in Table-7.
Table 7: ROA Performance of Defense Industry
YEARS 1997 1998 1999 2000 2001
Mean 0,076 -0,045 0,114 0,038 0,073
OPERATING RETURN ON SALES Median 0,189 0,131 0,105 0,082 0,107
Mean 2,057 1,447 1,961 1,612 1,397
NET ASSETS TO NET SALES Median 1,099 1,085 0,972 0,797 0,971
Mean 1,427 1,675 1,684 1,890 1,284
ASSET TURNOVER RATIO Median 0,910 0,926 1,033 1,260 1,056
Mean 0,150 0,092 0,180 0,097 0,098
RETURN ON ASSETS BEFORE TAXES Median 0,198 0,171 0,136 0,156 0,114
32
The net result of the analysis is that it reveals fluctuating trend in the
operating profitability of defense industry between 1997-2000 and a slightly
downward trend in 2001 compared with 1997- going from an average profit of 0,076
liras per sales TL in 1997 to an average profit of 0,073 liras per sales TL in 2001
(Table-4). This performance is consistent with the net sales (deflated) by defense
firms. In 1997, deflated net sales were TL 478007 million and had declined to
463031 million by 2001.
Defense firms have reduced their investments in net assets-total assets less
accounts payable and accruals- by TL0,66; going from TL2,057 per sales TL in 1997
to TL1,397 per sales TL in 2001. Asset turnover ratio improved between 1997-2000
and declined in 2001. The generally accepted standard for this ratio varies between
businesses and industries. For manufacturing firms, a value between two and four is
acceptable (Bektöre, 1998). Since most of the firms in the sample are manufacturing
ones, their ratios are expected to be between two and four but all the ratios are below
two. So it indicates that defense firms’ assets are not fully employed.
The profit generated by the use of the assets of the business is measured by
ROA ratio. A high ROA ratio indicates good performance or effective use of firm’s
assets by management. Then, a low ROA ratio will indicate poor performance or
ineffective employment of the assets by management (Gill, 1990). While the defense
firms were making a profit of 15% on invested net assets in 1997, it declined to 9,8%
in 2001. Although the decline on operating return on sales is only 0,3% between
1997-2001, the relatively high decline of 5,2% on ROA resulted from the decline of
14% on asset turnover ratio.

33
The overall annual results of defense firms using all data for the five-year
period are given in Table-8 and the results with outliers eliminated are given in
Table-9.
Table 8: ROA Performance of Defense Industry
Max. Min. Mean Median Mode Std. dev.
OPERATING RETURN ON SALES 0,364 -2,273 -0,018 0,108 -0,040 0,460
NET ASSETS TO NET SALES 76,66 0,116 3,443 1,023 0,490 9,692
ASSET TURNOVER RATIO 8,647 0,013 1,517 0,977 0,350 1,609
RETURN ON ASSETS BEFORE TAXES 0,857 -0,761 0,115 0,143 -0,030 0,237
(no outliers eliminated)
Table 9: ROA Performance of Defense Industry
Max. Min. Mean Median Mode Std. dev.
OPERATING RETURN ON SALES 0,36 -0,19 0,128 0,122 -0,040 0,122
NET ASSETS TO NET SALES 1,94 0,116 0,816 0,699 0,490 0,479
ASSET TURNOVER RATIO 3,07 0,013 1,040 0,879 0,350 0,781
RETURN ON ASSETS BEFORE TAXES 0,51 -0,32 0,144 0,167 -0,030 0,158
(outliers eliminated)
34
When the whole data is used in the calculations, the range between the
calculated means and medians are so wide, the standard deviations are so high, and
therefore there are outliers because of the some extreme results of different defense
firms in changing years. Eliminating the outliers, it is seen that the annual return of
defense firms on sales is 12,8%, the annual asset turnover ratio is 1,040 times and the
annual ROA before taxes is 14,4% for the five-year period. Defense firms would
have been better off to turnover the assets more than twice a year. Doing so would
have resulted in a higher return on assets.
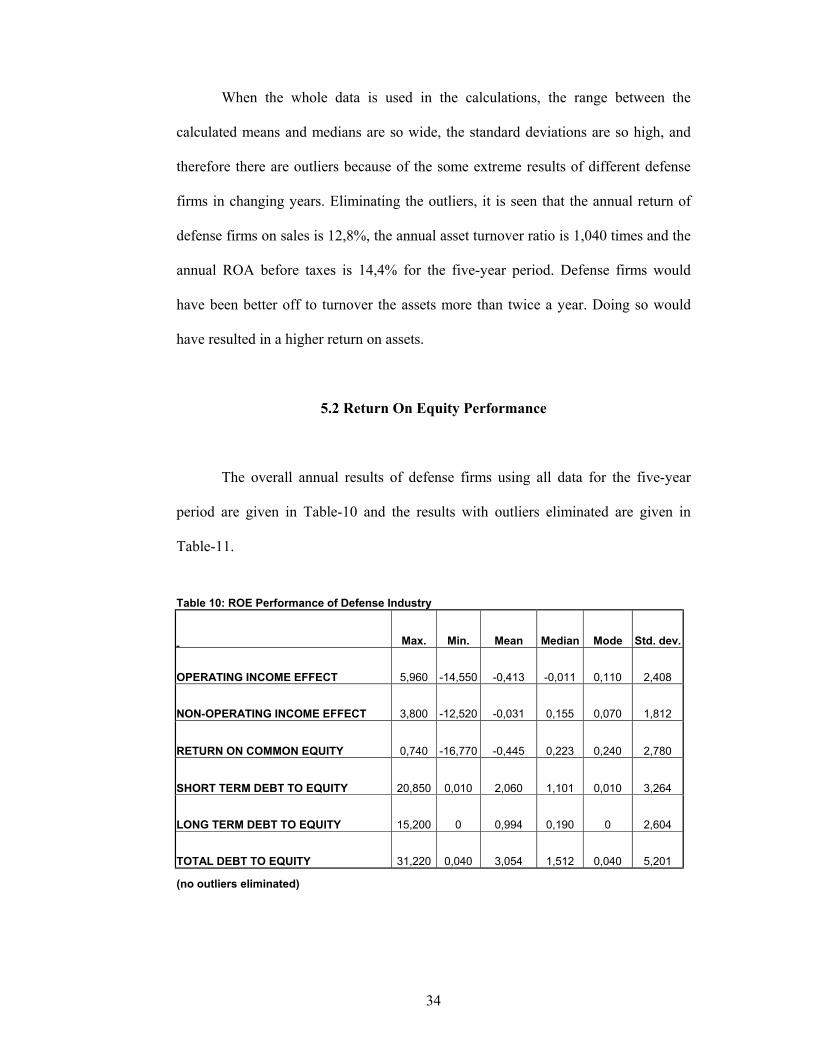
5.2 Return On Equity Performance
The overall annual results of defense firms using all data for the five-year
period are given in Table-10 and the results with outliers eliminated are given in
Table-11.
Table 10: ROE Performance of Defense Industry
Max. Min. Mean Median Mode Std. dev.
OPERATING INCOME EFFECT 5,960 -14,550 -0,413 -0,011 0,110 2,408
NON-OPERATING INCOME EFFECT 3,800 -12,520 -0,031 0,155 0,070 1,812
RETURN ON COMMON EQUITY 0,740 -16,770 -0,445 0,223 0,240 2,780
SHORT TERM DEBT TO EQUITY 20,850 0,010 2,060 1,101 0,010 3,264
LONG TERM DEBT TO EQUITY 15,200 0 0,994 0,190 0 2,604
TOTAL DEBT TO EQUITY 31,220 0,040 3,054 1,512 0,040 5,201
(no outliers eliminated)
35
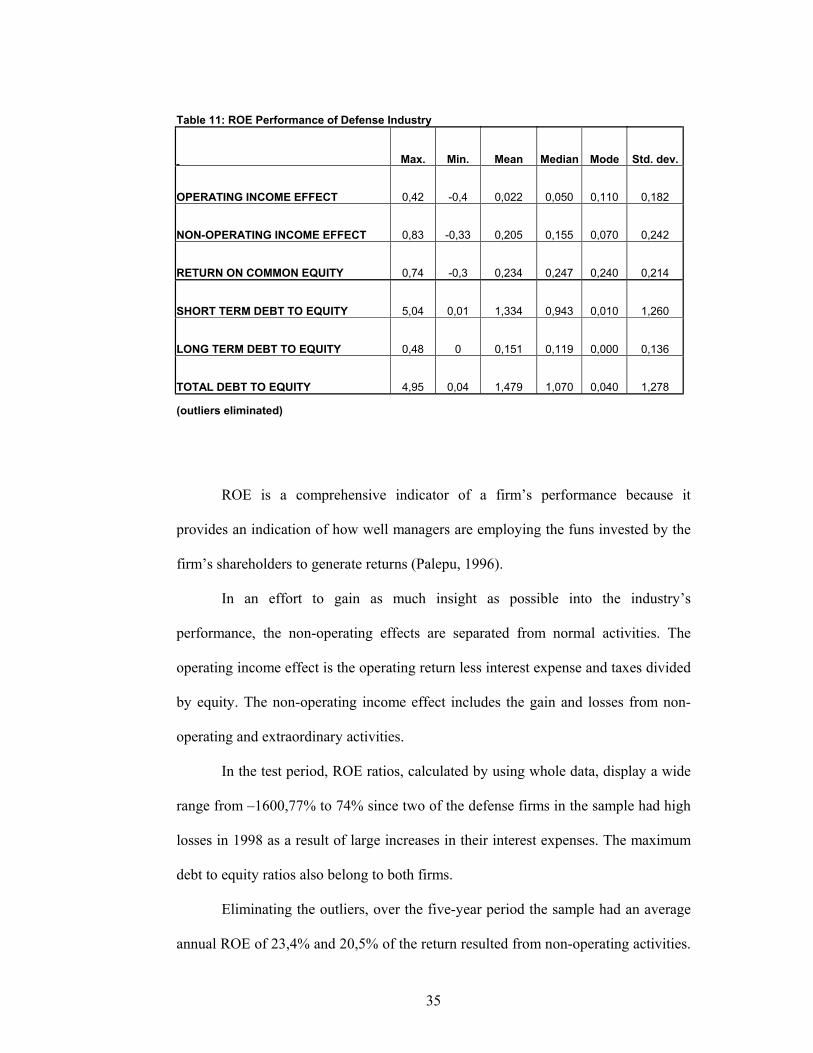
ROE is a comprehensive indicator of a firm’s performance because it
provides an indication of how well managers are employing the funs invested by the
firm’s shareholders to generate returns (Palepu, 1996).
In an effort to gain as much insight as possible into the industry’s
performance, the non-operating effects are separated from normal activities. The
operating income effect is the operating return less interest expense and taxes divided
by equity. The non-operating income effect includes the gain and losses from non-
operating and extraordinary activities.
In the test period, ROE ratios, calculated by using whole data, display a wide
range from –1600,77% to 74% since two of the defense firms in the sample had high
losses in 1998 as a result of large increases in their interest expenses. The maximum
debt to equity ratios also belong to both firms.
Eliminating the outliers, over the five-year period the sample had an average
annual ROE of 23,4% and 20,5% of the return resulted from non-operating activities.
Table 11: ROE Performance of Defense Industry
Max. Min. Mean Median Mode Std. dev.
OPERATING INCOME EFFECT 0,42 -0,4 0,022 0,050 0,110 0,182
NON-OPERATING INCOME EFFECT 0,83 -0,33 0,205 0,155 0,070 0,242
RETURN ON COMMON EQUITY 0,74 -0,3 0,234 0,247 0,240 0,214
SHORT TERM DEBT TO EQUITY 5,04 0,01 1,334 0,943 0,010 1,260
LONG TERM DEBT TO EQUITY 0,48 0 0,151 0,119 0,000 0,136
TOTAL DEBT TO EQUITY 4,95 0,04 1,479 1,070 0,040 1,278
(outliers eliminated)

36
The operating return on equity of 2,2% was too low since the high interest expenses
used in operating activities affected the return unfavorably.
Debt to equity ratio, indicating the firm’s capital structure, is also a measure
of the financial risk associated with the common stocks. This ratio with some
shortcomings is widely used as an indicator of lenders’ risks (Lev, 1974). In general
accepted standard for this ratio is one (Sevilengül, 1993). If the ratio is high, it means
that lenders are having greater risk and firm’s ability to obtain money from outside
resources is limited. On the contrary, if the ratio is low it can be assumed that the
firm has flexibility to get credit and lenders’ have less risk, but still the firm is not
reaching its full profit potential.
The sample had an average annual total debt to equity ratio of 1,479 that is
higher than the general accepted standard of 1 and this resulted from the high level of
short-term debt to equity ratio of 1,334. The average annual long-term debt to equity
ratio over the five-year period is only 0,151. This indicates that the defense firms, as
the other firms in different industries in Turkey, have difficulties in finding long-term
debts and they have to rely on short-term debts heavily to finance their activities and
to be compatible in the market, but this financing strategy make the defense firms
face with financing problems in the following years.
Making an analysis to understand the effect of sole operating activities, a
trend analysis is shown in Table-13 and Table-14. The percentage change in sales,
operating and non-operating income are examined between the years 1997-2001. In
this analysis, earnings from operating activities include sole earnings from operating
activities and earnings from non-operating activities include gains and losses from
non-operating activities and interest expenses. Wholesale price index (total-general)
is used as the deflator in the calculations.

37
Table-12: Annual Earnings (million TL)
INDUSTRY 1997 1998 1999 2000 2001
NET SALES 478007 444084 402910 491360 463031
COST OF GOODS SOLD -340369 -323542 -289165 -375326 -340886
OPERATING EXPENSES -47437 -57451 -69344 -75663 -63935
EARNINGS FROM OPERATING ACT. 90201 63091 44401 40371 58210
EARNINGS FROM NON-OPER. ACT. 10191 23537 31248 4678 -27737
EXTRAORDINARY EARNINGS -3579 -5375 -4897 -2363 -8992
TAXES -45773 -33485 -25013 -18471 -12618
NET EARNINGS AFTER TAXES 51040 47769 45739 24215 8863
Data is deflated by using wholesale price index (1994)
Table-13: Vertical Analysis
INDUSTRY 1997 1998 1999 2000 2001
NET SALES 100% 100% 100% 100% 100%
COST OF GOODS SOLD -71,21% -72,86% -71,77% -76,39% -73,62%
OPERATING EXPENSES -9,92% -12,94% -17,21% -15,40% -13,81%
EARNINGS FROM OPERATING ACT. 18,87% 14,21% 11,02% 8,22% 12,57%
EARNINGS FROM NON-OPER. ACT. 2,13% 5,30% 7,76% 0,95% -5,99%
EXTRAORDINARY EARNINGS -0,75% -1,21% -1,22% -0,48% -1,94%
TAXES -9,58% -7,54% -6,21% -3,76% -2,73%
NET EARNINGS AFTER TAXES 10,68% 10,76% 11,35% 4,93% 1,91%
Table-14: Horizontal Analysis
INDUSTRY 1997 1998 1999 2000 2001
NET SALES 100% 92,90% 84,29% 102,79% 96,87%
COST OF GOODS SOLD 100% 95,06% 84,96% 110,27% 100,15%
OPERATING EXPENSES 100% 121,11% 146,18% 159,50% 134,78%
EARNINGS FROM OPER. ACT. 100% 69,95% 49,22% 44,76% 64,53%
EARNINGS FROM NON-OPER.ACT. 100% 230,96% 306,61% 45,90% -272,16%
EXTRAORDINARY EARNINGS -100% -150,19% -136,84% -66,03% -251,27%
TAXES 100% 73,15% 54,65% 40,35% 27,57%
NET EARNINGS AFTER TAXES 100% 93,59% 89,61% 47,44% 17,36%

38
In the test period, sales of defense firms had a fluctuating trend. Although the
highest sales level of 102,79% occurred in 2000, the least earnings level of 44,76%
from operating activities also occurred in the same year because of the highest costs
of goods sold and operating expenses during the period. Since the defense firms,
especially electronics firms, import raw materials and machines from abroad, the
increase in exchange rates also caused an increase in total costs of the defense firms
and resulted as a decline in profit margins. Although the earnings from operating
activities, with the level of 64,53%, increased slightly in 2001, the net earnings after
taxes had a declining trend over the test period since the earnings from non-operating
activities declined to the negative level of –272,16%. In fact, until 1999, earnings
from non-operating activities had a positive and increasing trend but, after the 1999
crisis, it dropped dramatically to negative levels. This is mainly because of high
interest expenses as a result of short-term debt financing strategy that defense firms
had used before the crisis. The high increase in exchange rates doubled the short-
term debts and interest expenses, therefore, the defense firms could not cover the
interest expenses and found themselves in financial distress. The extraordinary
earnings were in negative values during the five-year period and it declined to the
negative level of –251,27% in 2001. The lowest level of earnings after taxes also
occurred in 2001 with the level of 17,36%.
5.3 Sustainable Growth
The sustainable growth rate of defense industry is calculated and the effect of
inflation on the sustainable growth rate is determined first. Then, the actual growth
rate on sales, assets, debt and equity are calculated. The first two items, sales and

39
assets, are used to assess growth. The next two items, debt and equity, are used to see
how defense firms decided to finance growth that is either higher or lower than the
sustainable growth rate. The sustainable growth rate of defense industry with/out
inflation effect and the actual growth rate on sales, assets, debt and equity are shown
in Table-15 and Table-16.
Table-15: Annual Growth Rate for The Five-Year Period
INDUSTRY Max. Min. Mean Median Mode Std. Dev.
SUSTAINABLE GROWTH (without inflation effect) 2,812 -0,944 0,184 0,183 -0,080 0,526
SUSTAINABLE GROWTH (with inflation effect) 2,264 -0,967 -0,112 -0,127 -0,130 0,439
ACTUAL GROWTH IN SALES* 2,991 -0,515 0,118 0,083 0,240 0,504
ACTUAL GROWTH IN ASSETS* 4,130 -0,770 0,156 0,020 0,160 0,631
ACTUAL GROWTH IN SHORT-TERM DEBT* 5,110 -0,870 0,261 -0,003 -0,870 0,948
ACTUAL GROWTH IN LONG-TERM DEBT* 4,710 -1 0,187 0,142 0 0,733
ACTUAL GROWTH IN TOTAL DEBT* 6,190 -0,900 0,268 0,049 -0,900 0,943
ACTUAL GROWTH IN EQUITY* 2,400 -0,630 0,102 -0,00291 -0,180 0,519 (no outliers eliminated) * Data is deflated by using wholesale price index
Table-16: Annual Growth Rate for The Five-Year Period
INDUSTRY Max. Min. Mean Median Mode Std. dev.
SUSTAINABLE GROWTH (without inflation effect) 0,680 -0,390 0,191 0,188 -0,080 0,238
SUSTAINABLE GROWTH (with inflation effect) 0,280 -0,560 -0,112 -0,123 -0,130 0,171
ACTUAL GROWTH IN SALES* 1,064 -0,515 0,051 0,068 0,240 0,341
ACTUAL GROWTH IN ASSETS* 0,670 -0,570 0,017 -0,003 0,160 0,255
ACTUAL GROWTH IN SHORT-TERM DEBT* 1,330 -0,870 0,062 -0,045 -0,870 0,519
ACTUAL GROWTH IN LONG-TERM DEBT* 0,520 -0,310 0,099 0,142 0 0,183
ACTUAL GROWTH IN TOTAL DEBT* 1,340 -0,900 0,107 0,043 -0,900 0,463
ACTUAL GROWTH IN EQUITY* 0,430 -0,470 -0,038 -0,032 -0,180 0,200
(outliers eliminated) * Data is deflated by using wholesale price index

40
The financial definition of sustainable growth is the rate of growth in sales,
assets, debt and equity that can be sustained indefinitely without management
altering the debt-to-equity relationship, the return-on-equity performance or the
dividend payout rate (Gallinger, 2000). Understanding a firm's sustainable growth
rate provides a peek into whether the firm is likely to encounter financial distress in
the future. Firms that file bankruptcy are the ones, with minor exceptions, which
grow too quickly. The primary reason for these companies' troubles is that their
profits and cash flows failed to follow their strong sales growth.
According to Higgins’ estimation that is based on his research on U.S.
manufacturing in 1974, the real sustainable growth declines by 2.2 percent for
every 5 percent increase in the rate of inflation. Higgins concluded that:
“Roughly speaking, the real sustainable growth rate declines by 2,2% for
every 5% increase in the inflation rate. With approximate 10% inflation rate in
1974, real sustainable growth falls from an inflation-free 10,5% to 6,1%. For
comparison, the actual real growth in manufacturing sales in 1974 was 3,8%, while
figures for the prior two years were 8,2% and 8,4%” (Higgins 1981, p. 38).
Using Higgins’ Formulation (Expression 1), the annual sustainable growth
rate (without inflation effect) of defense industry for the five-year period is 18,4%.
When we consider the effect of inflation on sustainable growth rate, using Higgins’
Formulation (Expression 2), as it is expected, the inflation has an unfavorable effect
on growth and the annual sustainable growth rate of the defense industry declines to
–11,2%. Since the annual inflation rate for the five-year period is 64%, according to
Higgins’ estimation, it should create a decline of 28,2% on sustainable growth rate.
The real decline on the sustainable growth rate of defense firms is 29,6% and that is
approximately consistent with Higgins estimation. Although the real sustainable

41
growth rate of defense industry without inflation effect is acceptable, the high
inflation rate diminishes the real sustainable growth rate of defense industry and
defense firms financially get in trouble to survive.
The real sustainable growth rate of defense industry is less than both the
actual growth for sales and assets in the test period that is, defense industry has
grown faster than its annual sustainable growth rate during the five-year period.
Defense industry could sustain a negative annual growth rate of 11,2% far into the
future without encountering financial difficulties. Actual growth rates exceeded the
-11,2% sustainable rate. This indicates that, without access to new capital, the
defense firms will probably face financial difficulties in the near future. If capital
suppliers dry up, the firms must slow their actual growth, increase their sustainable
growth, or a combination of these two approaches.
The next two items, debt and equity, are used to see how management
decided to finance growth that is either higher or lower than the sustainable growth
rate. Defense firms’ primary source of financing is debt, specifically short-term debt,
to support the higher than sustainable growth rate. The annual actual growth rate in
excess of sustainable growth was supported by a 10,7% annual increase in debt
financing. The annual increase in equity financing of defense firms for the five-year
period is -3,8% that is, defense firms reduced the level of equity financing and used a
large dose of debt financing, compared to equity financing, to support the growth in
sales and assets.
The overall conclusion to draw from the sustainable growth analysis is that
most of the defense firms are facing serious financial distress today and will probably
continue to face financial difficulties in the near future. The firms must slow their
actual growth or increase their sustainable growth and should reduce the level of debt

42
financing; especially short-term debt financing and should increase their equity
financing. Government should also support national defense firms by providing long-
term debt to make them survive in an inflationary environment.
5.4 Panel (Pool) Data Analysis
A Firm-level panel data analysis is used for assessing the impact of some
financial ratios, GNP growth and inflation on actual growth rate of defense firms.
The model to be estimated is:
itiitit ευβα ++Χ+=Υ
for i units, i=1,...,n and for each i, t=1,....,T of which Ti periods are actually
observed. Since we would like to utilize the information that certain sets of
observations came from certain units, the fixed-effects model is used that we are
interested in the coefficients β and α . We also assume that the υi are fixed
quantities. In other words, we model
( ) ititiit εβυα +Χ++=Υ
allowing for different intercepts for our units, but constraining the slopes to be the
same across units.
For assessing the impact of financial ratios, GNP growth and inflation on
growth, the following pooled models are specified. Dummy variables are used to
determine the yearly effect on growth:
(3)
(4)

43
itTAGitLDERitSDERitNOPIitOPIitGRit
εβββββα
++++++=
5
4321
itYYYYYGRit εβββββα ++++++= 54321 0100999897
itINFGNPGRit εββα +++= 21
• GRit represents the real sale growth, the dependent variable,
• OPit is the increase in operating income,
• NOPIit is the increase in non-operating income,
• SDERit is the short-term debt to equity ratio,
• LDERit is the long term debt to equity ratio,
• TAGit is the total asset growth,
• GNPit is the increase in GNP
• INFit is the annual Whole Sale Price Index rate of inflation.
Y98,….,Y01 are the dummy variables used to determine the yearly effect on
growth. The defense firms in the sample are divided into four groups according to
their sales volume: Group-1: sales greater than TL200 trillion; Group-2: between
TL100 and TL200 trillion; Group-3: between TL20 and TL100 trillion; Group-4: less
than TL20 trillion. There are three outliers in sales growth rates of the whole sample
that adversely affect the analysis and thus are dropped. The Stata outputs for the
descriptive statistics of the variables are in Table-17 and test results using fixed
effects model are in Table-18.
(5)

44
In terms of goodness to fit, it is the R-sq within that is directly relevant; our
R-sq is 0,2236. If we use these estimates to fit the overall data, our R-sq is 0,2072.
As it is expected, the operating income has a positive effect on defense
firms’ growth with the coefficient of 0,0319 that is statistically significant. The
coefficient is small since the high interest expense reduces the positive effect of
operating income on growth. The non-operating income also has a positive effect on
growth with the coefficient of 0,0237, however this positive effect is not statistically
significant.
Table-17: Descriptive Statistics of Variables
Variable Obs. Mean Std. dev. Min. Max. GR 80 0,051 0,341 -0,515 1,064
OPI 80 -0,614 4,659 -26,423 13,812
NOPI 80 0,320 2,079 -6,597 8,155
SDER 80 2,113 3,342 0,014 20,847
LDER 80 0,994 2,669 0 15,196
TAG 80 0,137 0,613 -0,768 4,131
GNP 80 0,006 0,071 -0,094 0,083
INF 80 0,640 0,117 0,511 0,821
Table 18: Fixed-effects (within) regression Number of obs = 80 Group variable (i) : id Number of groups = 4 R-sq: within = 0,2236 Obs per group: min = 15 between = 0,0007 avg = 20 overall = 0,2072 max = 23 F(5,71) = 4,09 Prob > F = 0,0025
GR Coef. Std. Err. t P>|t| [95% Conf. Interval] OPI 0,0319 0,0081 3,95 0,000 0,0158 0,0481 NOPI 0,0237 0,0192 1,23 0,222 -0,0146 0,0620 SDER -0,0291 0,0137 -2,12 0,037 -0,0565 -0,0018 LDER 0,0167 0,0184 0,91 0,366 -0,0199 0,0534 TAG 0,0013 0,0626 0,02 0,983 -0,1236 0,1263 cons 0,1081 0,0430 2,51 0,014 0,0222 0,1940

45
The short-term debt to equity ratio has a negative effect on defense firms’
growth with the coefficient of –0,0291 that is statistically significant (p=0,037). The
defense firms relied on short-debt financing and reduced the level of equity
financing; therefore they suffered from the high interest expenses that diminished the
defense firms’ growth in the test period.
The long-term debt to equity ratio and total asset growth have positive effects
on growth, however these effects are not statistically significant. We also wanted to
look at yearly effect by using dummy variables (Table-19). Except the year 2000,
other three years have negative effects on growth, however these effects are not
statistically significant, either. For assessing the impact of both GNP growth and
inflation on defense firms’ growth, we built a regression model and we found that
both items do not have significant effects on growth (Table-20). Since the operating
income has positive effect on growth that is statistically significant, the operating
income of defense firms is used as the dependent variable in a regression model to
examine the effect of GNP growth and inflation on operating income. The Stata
output for the regression model is in Table-21.
Table 19: Fixed-effects (within) regression Number of obs = 80 Group variable (i) : id Number of groups = 4 R-sq: within = 0,0475 Obs per group: min = 15 between = 0,1223 avg = 20 overall = 0,0480 max = 23 F(4,72) = 0,90 Prob > F = 0,4700
GR Coef. Std. Err. t P>|t| [95% Conf. Interval] Y98 -0,0509 0,1246 -0,41 0,684 -0,2993 0,1975 Y99 -0,0182 0,1207 -0,15 0,880 -0,2589 0,2225 Y00 0,0276 0,1207 0,23 0,820 -0,2131 0,2683 Y01 -0,1864 0,1249 -1,49 0,140 -0,4355 0,0627 cons 0,0939 0,0867 1,08 0,282 -0,0789 0,2668

46
Table 20: Fixed-effects (within) regression Number of obs = 80 Group variable (i) : id Number of groups = 4 R-sq: within = 0.0343 Obs per group: min = 15 between = 0.1081 avg = 20 overall = 0.0346 max = 23 F(2,74) = 1,32 Prob > F = 0,2746
GR Coef. Std. Err. t P>|t| [95% Conf. Interval] GNP 0,9974 0,6160 1,62 0,110 -0,2300 2,2248 INF -0,2977 0,3669 -0,81 0,420 -1,0288 0,4333 cons 0,2340 0,2346 1 0,322 -0,2335 0,7017
In terms of interpretation, GNP had a positive effect on operating income in
the test period with the coefficient of 24,0098 that is statistically significant. The
inflation had a negative effect on operating income, however that is not statistically
significant.
Table 21: Fixed-effects (within) regression Number of obs = 80 Group variable (i) : id Number of groups = 4 R-sq: within = 0,1149 Obs per group: min = 15 between = 0,0863 avg = 20 overall = 0,1097 max = 23 F(2,74) = 4,80 Prob > F = 0,0109
OPI Coef. Std. Err t P>t [95% Conf. Interval] GNP 24,0098 7,8305 3,07 0,003 8,4071 39,6125 INF -4,5269 4,6639 -0,97 0,335 -13,8201 4,7661 cons 2,1036 2,9832 0,71 0,483 -3,8406 8,0479

47
CHAPTER 6
CONCLUSION AND DISCUSSIONS
During the last 50 years, the single largest category of spending for many
Western governments was the national defense. That allocation came about in the
course of the Cold War, which rapid technical development and immediate
preparedness were considered more important than economic efficiency. Redundant
capabilities and inefficient practices were tolerated. The analysis of efficient defense
production was not intensively pursued.
In the very different circumstances that now prevail, the industrial
infrastructure that currently builds the systems used by Western military
establishments is in a transition period. The U.S. defense industry saw so many
mergers and acquisitions during the 1990s. This consolidation process was actively
encouraged by the U.S. Government with the aim of reducing procurement costs and
sustaining a viable defense industrial base during a period of declining defense
budgets. In response, companies either specialized in defense or exited the business
altogether (James, 2000). The consolidation process has led to major changes in the
structure of the U.S. defense industry and the industry structure that has emerged is
characterized by considerable concentration. Thus, consolidation has seen the
emergence of three giant defense companies—Lockheed-Martin, Boeing, and
Raytheon—whose overall size and breadth of business activities dwarf their
competitors in the United States and Europe (Table- 22).

48
Table-22: Top Defense Firms in 2000 by Defense Sales
COMPANY DEFENSE SALES IN 2000 ($ Billion)
Lockheed Martin (US) 18.00
Boeing (US) 17.00
Raytheon (US) 14.00
BAE Systems (UK) 13.2
General Dynamics (US) 6.5
Northrop Grumman (US) 5.6
(EADS) (France, Germany & Spain) 4.6
THALES (FR) 4.3
Source: Defense News (2001)
The emergence of the U.S. industry giants has affected European defense
firms to consolidate in an effort to create firms of a size thought necessary to
compete in the new industry structure. The year 1999 saw consolidation in Europe
leading to the emergence of two companies that will rival the leading U.S. companies
in terms of defense sales. The creation of BAE Systems from the merger of British
Aerospace and GEC Marconi Electronic Systems created a UK company with
defense sales of more than $13 billion, making it the fourth largest defense contractor
in the world after Raytheon. Equally, the planned merger of U.S.-German DASA
with Aerospatiale-Matra of France and CASA of Spain to form European
Aeronautics Defence and Space (EADS) will create a company with defense sales of
almost $4,6 billion. These recent consolidation moves mean that three of the eight
largest defense companies in the world are now European. However, the U.S.
defense industry is still the premier global producer of a variety of defense systems,
the clear world leader in key systems integration skills and specialized technologies

49
(Flamm, 2000). It accounts for roughly half of world exports of military equipment.
The United States’ weapons procurement budget exceeds the combined total of all its
European NATO allies (Markusen, 2000). Despite large cutbacks in U.S. military
spending, the U.S. defense industry dominates the global market. American
industrial hegemony in armaments is easily visible in 2000 defense sales data
compiled for the 100 largest defense suppliers worldwide, shown in Figure 1. U.S.
suppliers accounted for almost 60 percent of $141 billion in global sales within this
elite set of companies, compared to roughly one-third for European suppliers, 4.5
percent for Japanese companies, 2.0 percent for Israeli firms, and about 0.2 percent
for Russia.
Figure 1: Share of Defense Sales by Top 100 Defense Firms Worldwide by National Origin of Company
Russia0,18%
India0,48%
Canada0,40%
Non-Nato Europe1,70%
Israel1,58%Australia
0,22%
Japan4,47%
US58,84%
Nato-Europe32,14%
Source: Defense Week (2001)

50
Today the Turkish defense industry, if allocated enough funds, is capable of
meeting a significant part of the requirements of the Turkish Armed Forces. Both
systems produced for the Turkish Armed Forces and the success of Turkish
companies on the international market reveal that Turkish defense technology is
advanced and can compete in the international markets. However, development of
the Turkish defense industry has not reached to the desired level as of yet and has
still crucial problems.
The level of employment in the Turkish Defense Industry is not proportional
with the size of the defense market. When the defense procurement levels are
examined between 1997 and 2001, it is seen that it drops dramatically from $1,2
billion to one third of it, $400 million. However, there is approximately no change in
the employment level (Table-23). Although there is a huge decline in domestic
procurement levels in the five-year period, that is similar to the decline in world
defense market ten years ago, the employment level has a slight change of + 4% and
it is approximately stable with 25000 personnel in the five-year period. This
unreactive behavior in the employment level of defense industry to the defense
market shrinkage shows that while the national defense industry is trying to be
protected, it becomes like a public sector with its high employment levels.
When the employment groups are examined, the number of Engineers is only
1/6 of total employment that is our defense industry does not give importance to the
research and development activities, but it mainly focuses on production-oriented
activities.

51
27,000
1300 1200 1100 1000 900 800 700 600 500 400 300
Table-23: Procurement and Employment Levels of Turkish Defense Sector
Turkey
Defense Sector Employment (Personnel Changes in The Last Three Years)
Engineer : 4270 ± 85 (%2)
Technician : 4400 ± 200 (%2)
Management : 4250 ± 50 (%3)
Worker :12000 ± 650 (%5)
________________ TOTAL 24900 ± 985 (%4)
1205
1074
970
850
27
16
400
1997
27
26
1999 2000 2001
Source: Dr. Faruk Yarman Results of SaSaD Survey
Procurement Level (Million $)
Employment Level (Thousand Person)
1998

52
Thus, R&D budget of defense industry is only $40 million that is less than
1/20 of western countries’ expenses. This indicates that R&D activities of Turkish
defense products are mainly done abroad by the allied countries and as a result, the
basic principle in our defense policies of meeting the defense requirements of Turkey
with domestic equipment whenever possible is not succeeded.
Another indication that can be made from Table-23 is, the number of
management level personnel is approximately equal to the number of engineers. That
reveals another serious question about the management systems efficiency of Turkish
Defense Firms.
When we look at the Table-24, we can see that the R&D budgets of world
defense industries change in a range of ¼ and ¾ of their arms procurement budgets.
Table-24: Arms Procurement and R&D Budgets of Western Countries
Country Arms R&D % Procurement (Billion $)
US 47 35 74
UK 8.2 3.9 48
France 5.2 3.1 60
Germany 3.7 1.2 32
Italy 1.9 0.5 26
Turkey 0.36 0.012 3
Source: Defense News (2002)

53
This result also indicates that Turkey is protecting its production-based
defense industry structure against the fluctuations on national and international
demands but in fact, it should build, improve and protect R&D activities that are
based on national science and technology.
Consequently, national defense sector seems to be production based,
dependent on western countries and inefficient as the public sector. However, it is
possible to change this situation in a short period of time by improving R&D based
activities insistently in a coordination of university-industry cooperation. Only in this
way, the national defense sector can produce the technologies that our defense
strategy needs.
Having a strong defense industry is an important necessity of Turkey.
Moreover, being a strong industry requires an adequate financial performance.
Defense firms could be forced to have good financial performance and this will
develop the national defense industry. Therefore, this study analyzed the financial
performance of defense firms and identified the real and sustainable growth rate of
defense firms by using Higgins’ model between the years 1997-2001. The study also
examined how defense firms financed growth in sales and assets and how they
should finance growth in accordance with the sustainable growth rate. The factors
that affect the growth rate of the defense firms were also clarified.
The financial performance of defense industry had a declining trend in the
five-year period. While the net earnings after taxes was slightly declining by 10,39%
between 1997-1999, it dramatically declined by 52,56% in 2000 and by 82,64% in
2001. This is mainly because of the high interest expenses as a result of short-term
debt financing strategy that defense firms had used heavily before the 1999 crisis.
Although the earnings from operating activities increased in 2001, the net earnings

54
after taxes had declined to its minimum value because of high increases in the
interest expenses. Defense industry has grown faster than its annual sustainable
growth rate during the five-year period. Defense firms’ primary source of financing
is debt, specifically short-term debt, to support the higher than sustainable growth
rate. They reduced the level of equity financing and used a large dose of debt
financing, compared to equity financing, to support the growth in sales and assets.
The defense firms are facing serious financial distress today and will
probably continue to face financial difficulties in the near future. As a result of this
added debt load, some companies now face a declining interest expense coverage ratio.
In order to sustain the business, the defense firms must slow their actual growth or
increase their sustainable growth and should reduce the level of debt financing;
especially short-term debt financing and should increase their equity financing.
Although the real sustainable growth rate of defense industry without inflation effect
is acceptable, the high inflation rate diminishes the real sustainable growth rate of
defense industry to negative values and reduced the sustainable growth rate by
29,6%.
The operating income had a positive effect on defense firms’ growth that is
statistically significant. The short-term debt to equity ratio had a negative effect on
defense firms’ growth that is statistically significant (p=0,037). The defense firms
relied on short-debt financing and reduced the level of equity financing; therefore
they suffered from the high interest expenses that diminished the defense firms’
growth in the test period. Except the year 2000, other three years had negative effects
on growth, however these effects are not statistically significant. GNP growth and
inflation did not have significant effects on growth. Nevertheless, GNP growth had a
positive effect on operating income of the defense firms that is statistically

55
significant in the test period. The inflation had a negative effect on operating income
that is not statistically significant. Therefore, these facts are collectively a warning
primarily for the industry but also for the Government. It is imperative that both
industry and the Government customer work cooperatively to create a healthier
environment and a more stable industrial base. It is essential for both economic and
national security reasons.

56
APPENDIX
(a) Ratios used in ROA Analysis:
SalesNetIncomeOperatingSalesOnturnOperating =Re
SalesNetAccrualsPayableAccountsAssetsTotalSalesNettoAssetsNet −−
=
AssetsNetSalesNetRatioTurnoverAsset =
RatioTurnoverAssetSalesOnturnOperatingTaxesBeforeAssetsOnturn *ReRe =
(b) Ratios Used in ROE Analysis
EquityExpenseInterestTaxesIncomeOperatingEffectIncomeOperating −−
=
EquityExpensesEarningsaryExtraordin
EquityActivitiesOperatingNonFromExpensesEarningsEffectIncomeOperatingNon
)(
)(
−+
−=
EquityEarningsNetEquityCommonOnturn =Re

57
TC MERKEZ BANKASI ELEKTRONİK VERİ DAĞITIM SİSTEMİ Fiyat Endeksi(Toptan Eşya) (1994=100) (DİE) (Aylık) YILLIK,SABİT,Orijinal Gözlem TP.FG.T01.TOP.1 1994 100.2612
1995 186.0358
1996 327.2252
1997 595.8134
1998 1023.7080
1999 1568.4452
2000 2370.3869
2001 3831.1092
2002 5751.1280
2003 6840.7000
SEÇİLEN SERİLERİN AÇIKLAMALARI ==============================
TP.FG.T01.TOP.1: (Toplam)1.GENEL

COMPANIES YEARS SALES GROWTH OPR. INCOME NON-OPR.INCOME SH.T.DEBT/EQ. LG.T. DEBT/EQ. T.ASSETGROWTH GNPGROWTH INFLATION ALCATEL 1997 0,083 1,313 0,412 0,743 0,078 0,069 0,083 0,821 ALCATEL 1998 0,190 -0,466 -0,077 1,258 0,107 0,295 0,039 0,718 ALCATEL 1999 -0,087 -2,568 0,914 2,046 0,297 0,164 -0,061 0,532 ALCATEL 2000 0,006 -0,387 -0,499 2,530 0,480 -0,261 0,063 0,511 ALCATEL 2001 0,244 -1,408 2,220 11,402 1,358 0,288 -0,094 0,616 ASELSAN 1997 0,144 -0,472 4,582 1,537 0,402 0,086 0,083 0,821 ASELSAN 1998 0,010 -0,152 0,003 1,211 0,721 0,044 0,039 0,718 ASELSAN 1999 0,177 0,078 0,247 1,683 0,688 0,196 -0,061 0,532 ASELSAN 2000 0,134 0,167 -1,362 2,436 0,503 0,131 0,063 0,511 ASELSAN 2001 0,151 -1,661 -0,446 2,722 1,855 0,002 -0,094 0,616 ASPİLSAN 1997 0,817 7,758 0,412 0,320 0,087 0,563 0,083 0,821 ASPİLSAN 1998 -0,151 -1,749 0,520 0,357 0,126 -0,101 0,039 0,718 ASPİLSAN 1999 -0,275 -0,080 0,096 0,222 0,141 -0,110 -0,061 0,532 ASPİLSAN 2000 0,130 1,673 -0,692 0,176 0,211 -0,212 0,063 0,511 ASPİLSAN 2001 -0,334 -2,478 0,515 0,185 0,296 -0,168 -0,094 0,616 ÇANSAŞ 1997 -0,164 -1,065 1,337 1,709 0,448 -0,008 0,083 0,821 ÇANSAŞ 1998 0,332 -0,383 3,433 4,064 1,740 0,136 0,039 0,718 ÇANSAŞ 1999 0,471 0,535 0,639 2,278 0,382 -0,214 -0,061 0,532 ÇANSAŞ 2000 -0,318 -0,451 -1,188 2,282 0,027 -0,100 0,063 0,511 ÇANSAŞ 2001 -0,515 -0,058 -2,339 2,700 0,025 0,020 -0,094 0,616 DITAS 1997 0,039 -3,888 0,840 0,509 0,000 0,775 0,083 0,821 DITAS 1998 -0,083 2,634 -0,341 0,187 0,000 -0,293 0,039 0,718 DITAS 1999 -0,194 -1,659 1,584 0,902 0,000 0,642 -0,061 0,532 DITAS 2000 0,362 2,795 -0,924 0,564 0,000 -0,298 0,063 0,511 DITAS 2001 0,170 2,318 -4,086 0,368 4,039 2,179 -0,094 0,616 HAV.RAD. 1997 -0,403 0,543 -0,230 16,160 13,198 -0,178 0,083 0,821 HAV.RAD. 1998 -0,311 -1,630 -6,597 2,013 15,196 0,600 0,039 0,718 HAV.RAD. 1999 1,064 0,657 1,102 0,352 8,772 -0,146 -0,061 0,532 HAV.RAD. 2000 -0,284 0,749 -0,388 0,076 0,190 -0,575 0,063 0,511 HAV.RAD. 2001 0,484 1,944 0,695 0,100 0,197 0,186 -0,094 0,616 HAV.TEK. 1997 -0,368 -0,307 0,358 20,847 10,376 -0,394 0,083 0,821 HAV.TEK. 1998 0,888 -1,078 -0,016 5,787 3,329 -0,768 0,039 0,718 HAV.TEK. 1999 -0,508 4,119 0,837 10,175 0,841 0,319 -0,061 0,532 HAV.TEK. 2000 0,329 0,022 1,289 0,426 0,320 -0,540 0,063 0,511 HAV.TEK. 2001 -0,273 -1,478 1,972 1,050 0,449 0,313 -0,094 0,616 İŞBİR 1997 0,204 1,596 -0,300 2,933 0,126 0,794 0,083 0,821 İŞBİR 1998 -0,074 -0,928 -0,422 2,844 0,142 -0,025 0,039 0,718 İŞBİR 1999 0,239 13,812 4,130 2,766 0,092 0,748 -0,061 0,532 İŞBİR 2000 0,160 -0,821 -0,369 4,795 0,153 0,229 0,063 0,511 İŞBİR 2001 -0,386 -15,052 8,155 5,295 0,254 -0,414 -0,094 0,616

3
COMPANIES YEARS SALESGROWTH OPR. INCOME NON-OPR.INCOME SH.T.DEBT/EQ LG.T.DEBT/EQ T.ASSETGROWTH GNPGROWTH INFLATION Mercedes-Benz 1997 0,215 -0,132 1,986 3,152 0,165 0,202 0,083 0,821 Mercedes-Benz 1998 -0,216 -1,171 0,420 2,235 0,172 -0,132 0,039 0,718 Mercedes-Benz 1999 -0,285 -9,996 -0,127 2,443 0,221 -0,044 -0,061 0,532 Mercedes-Benz 2000 0,550 1,046 -0,092 1,556 0,212 -0,064 0,063 0,511 Mercedes-Benz 2001 -0,355 -26,423 -0,523 2,302 0,280 -0,079 -0,094 0,616 NETAŞ 1997 0,167 0,373 -0,876 0,611 0,119 -0,148 0,083 0,821 NETAŞ 1998 -0,212 -0,582 -4,399 0,532 0,108 -0,145 0,039 0,718 NETAŞ 1999 0,140 -0,749 3,146 1,197 0,162 0,316 -0,061 0,532 NETAŞ 2000 0,032 2,787 -0,252 0,889 0,128 -0,151 0,063 0,511 NETAŞ 2001 -0,340 -0,390 -0,689 1,101 0,093 -0,050 -0,094 0,616 OTOKAR 1997 -0,289 -0,535 -0,611 1,411 0,676 -0,060 0,083 0,821 OTOKAR 1998 0,417 4,862 -2,769 2,650 0,580 0,824 0,039 0,718 OTOKAR 1999 0,179 -0,834 7,345 2,504 0,087 0,297 -0,061 0,532 OTOKAR 2000 -0,005 0,537 0,167 1,547 0,093 -0,144 0,063 0,511 OTOKAR 2001 -0,395 -15,728 2,512 2,201 0,105 0,155 -0,094 0,616 PARSAN 1997 0,239 1,467 0,577 0,418 0,213 0,207 0,083 0,821 PARSAN 1998 -0,139 -0,398 -0,087 0,641 0,215 0,268 0,039 0,718 PARSAN 1999 -0,259 -2,053 1,625 0,597 0,120 -0,166 -0,061 0,532 PARSAN 2000 0,313 1,366 -0,894 0,943 0,107 0,205 0,063 0,511 PARSAN 2001 -0,362 -6,580 1,179 0,933 1,114 -0,182 -0,094 0,616 PETLAS 1997 0,027 -0,527 0,208 0,121 0,000 -0,051 0,083 0,821 PETLAS 1998 0,131 -0,260 0,388 0,049 0,000 0,004 0,039 0,718 PETLAS 1999 0,067 0,806 -1,079 0,055 0,000 -0,070 -0,061 0,532 PETLAS 2000 -0,150 -1,870 -0,099 0,067 0,000 -0,053 0,063 0,511 PETLAS 2001 -0,244 0,285 0,031 0,058 0,000 -0,137 -0,094 0,616 ROKETSAN 1997 0,088 0,881 -0,188 3,896 0,991 4,131 0,083 0,821 ROKETSAN 1998 2,991 31,100 -1,472 1,327 1,646 -0,191 0,039 0,718 ROKETSAN 1999 -0,438 -0,760 1,383 4,665 1,891 1,264 -0,061 0,532 ROKETSAN 2000 0,634 1,028 -2,986 5,036 2,337 0,150 0,063 0,511 ROKETSAN 2001 1,213 -2,230 3,569 3,529 2,982 0,193 -0,094 0,616 TAİ 1997 0,580 3,583 -0,195 1,298 0,214 0,520 0,083 0,821 TAİ 1998 -0,231 -2,765 3,711 0,622 0,448 0,126 0,039 0,718 TAİ 1999 -0,067 -1,961 0,683 1,200 0,431 0,665 -0,061 0,532 TAİ 2000 -0,374 0,271 -0,627 0,539 0,339 -0,402 0,063 0,511 TAİ 2001 1,471 0,708 -0,232 1,082 0,304 0,168 -0,094 0,616 TEİ 1997 0,117 0,709 -0,198 0,302 0,029 0,014 0,083 0,821 TEİ 1998 0,070 -0,082 -0,155 0,247 0,064 0,026 0,039 0,718 TEİ 1999 0,377 -0,177 0,427 0,296 0,042 0,079 -0,061 0,532 TEİ 2000 0,420 1,890 -0,814 0,369 0,046 0,149 0,063 0,511 TEİ 2001 0,479 0,798 2,301 0,283 0,054 0,155 -0,094 0,616
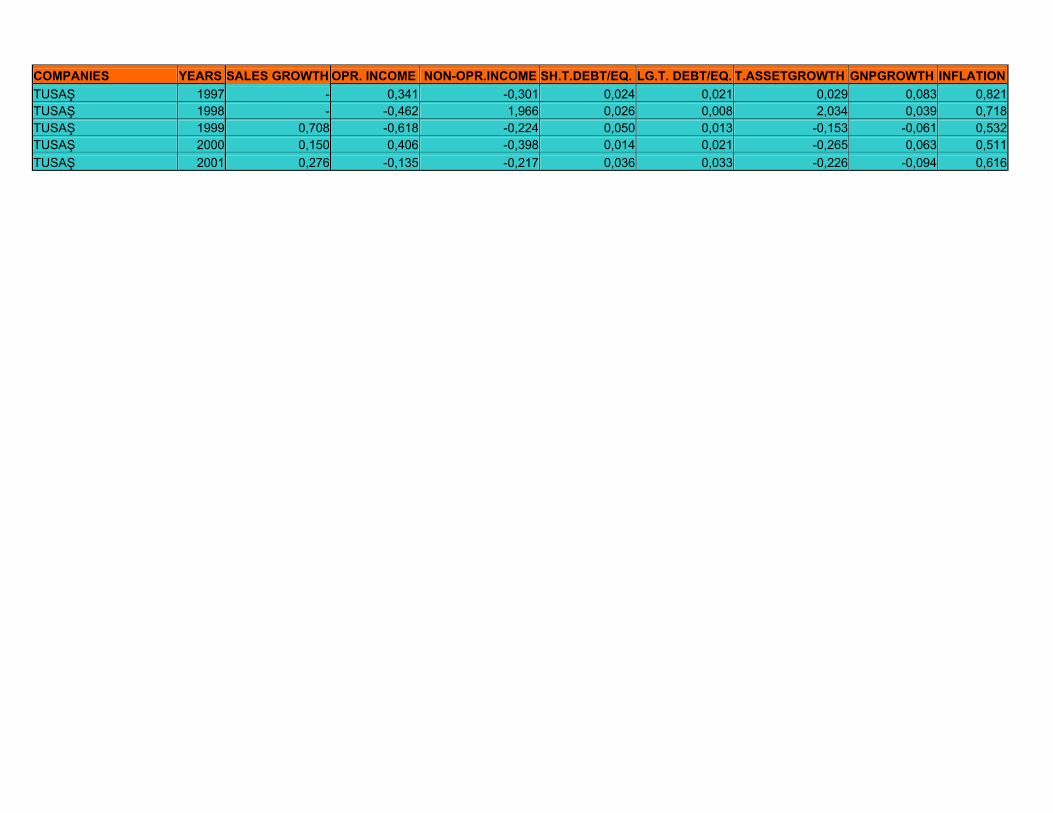
4
COMPANIES YEARS SALES GROWTH OPR. INCOME NON-OPR.INCOME SH.T.DEBT/EQ. LG.T. DEBT/EQ. T.ASSETGROWTH GNPGROWTH INFLATION TUSAŞ 1997 - 0,341 -0,301 0,024 0,021 0,029 0,083 0,821 TUSAŞ 1998 - -0,462 1,966 0,026 0,008 2,034 0,039 0,718 TUSAŞ 1999 0,708 -0,618 -0,224 0,050 0,013 -0,153 -0,061 0,532 TUSAŞ 2000 0,150 0,406 -0,398 0,014 0,021 -0,265 0,063 0,511 TUSAŞ 2001 0,276 -0,135 -0,217 0,036 0,033 -0,226 -0,094 0,616

57
BIBLIOGRAPHY
Alnıak, Oktay, 2003, “Savunma sanayii Hakkında Genel Değerlendirme”, Bilkent Üniversitesi Mühendislik Fakültesi Konferans Notları Akgüç, Öztin, 1987, Finansal Yönetim, İstanbul Üniversitesi Yayını Aktaş, Ramazan, 1997, Mali Başarısızlık Tahmin Modelleri, Türkiye İş Bankası Kültür Yayınları, Ankara Aydın, Nurhan, 1990, İşletmelerin Birleşmesinde Finansal Analiz ve Bir Uygulama Örneği, Türkiye Odalar ve Borsalar Birliği Yayını Bektöre, Sabri and Ferruh Çömlekçi and Halim Sözbilir, 1998, Mali Tablolar Analizi, Eskişehir Clark, John J. and Margaret T. Clark and Andrew G. Verzilli, 1985, “Strategic Planning and Sustainable Growth”, Columbia Journal of World Business, Fall, p.47-51 Clark, John J. and Thomas C. Chiang and Gerard T. Olson, 1989, Sustainable Corporate Growth, Quorum Books, New York Cemalcılar, Ilhan and Doğan Bayar and İnal Aşkun, and Şan Özalp, 1975, İşletmecilik Bilgisi, Eskişehir İktisadi ve Ticari Ilimler Akademisi Yayını Economist, 1999, “The Growth of Firms in Theory and in Practice”, Discussion Paper No: 2092, Vol. 352, Issue 8128, p. 70 Ellsworth, R., 1983, “Subordinate Financial Policy to Corporate Strategy”, Harvard Business Review 63: 170-82. Flamm, Kenneth, 2000, “The Place of Defense Industry in Advanced Industrial Economies”, Cornell University Peace Studies Program Occasional Paper #25 Fraser, Lyn M. and Aileen Ormiston, 1998, Understanding Financial Statements, Prentice Hall, New Jersey Gallinger, George W., 2000, “A Framework for Financial Statement Analysis Part 3”, Business Credit, Vol. 102, Issue 4, p. 33-38 Gönenli, Atilla, 1988, İşletmelerde Finansal Yönetim, İstanbul Matbaası Geroski, Paul, 1999, “The Growth of Firms in Theory and in Practice'', The Economist, Vol. 352, Issue 8128, p. 70
58
Gill, James O., 1990, How to Understand Financial Statements, California, Crisp Publications Inc. Gup, B. E., 1980, “The Financial Consequences of Corporate Growth”, Journal of Finance 35, p. 1257-65 Gupta, M. C., 1969, “The Effect of Size, Growth, and Industry on the Financial Structure of Manufacturing Companies”, Journal of Finance 24, p. 517-29 Higgins, Robert C., 1977, "How Much Growth Can a Firm Afford?”, Financial Management, pp. 7-16, Higgins, Robert C., 1981, "Sustainable Growth Under Inflation”, Financial Management, p. 36-40 Higgins, Robert C., and Roger A. Kevin, 1983, ”Managing the Growth-Financial Policy Nexus in Retailing, Journal of Retailing, p. 19-47 Higgins, Robert C., 1989, “Analysis for Financial Management”, 2nd Edition, Homewood, Illinois: Richard D. Irwin, Inc. Ijiri, Yuri and Herbert A. Simon, 1967, “A Model of Business Firm Growth”, Econometrica, volume 35, Issue 2, p. 348-355 James, Andrew D., 2000, “The Place of the UK Defense Industry in its National Innovation System”, Cornell University Peace Studies Program Occasional Paper #25 Johnson, D. J., 1981, “The Behavior of Financial Structure and Sustainable Growth in an Inflationary Environment”, Financial Management 10, p. 30-34. Karasapan, Ömer, 1987, “Turkish Defense Industries”, Middle East Report, January-February, p. 27-31 Keown, Arthur J. and David F. Scott and John D. Martin, and J. William Petty, 1996, Basic Financial Management, Prentice Hall, New Jersey Ketz, J. Edward and Rajib K. Doogar and David E. Jensen, 1990, A Cross-Industry Analysis of Financial Ratios, Quorum Books, Newyork Kisor, M., Jr., 1964, “The Financial Aspects of Growth”, Financial Analyst Journal 20, p. 4651 Klein Daniel P. and Brian Belt, 1994 ”Sales Growth Above Sustainable Growth”, Review of Financial Economics, vol.3, issue 2, p. 141-155 Kyd, C. W., 1981, “Managing the Financial Demands of Growth”, Management Accounting 63, p. 33-41

59
Levy, Haim and Marshall Sarnat, 1988, Principals of Financial Management, Prentice Hall, New Jersey Makusen, Ann, 2000, “Should We Welcome a Transnational Defense Industry?”, Cornell University Peace Studies Program Occasional Paper #25 Palepu, Krishna G. and Victor L. Bernard and Paul M. Healy, 1996, Business Analysis & Valuation, Cincinnati, Ohio, South Western Publishing Co. Penrose, Edith, 1995, The Theory of The Growth of The Firm, (3rd edition), Oxford University Press Pruitt, S. and L. Gitman, 1991, “The Interactions Between the Investment, Financing, and Dividend Decisions of Major U.S. Firms”, The Financial Review 26, p. 409-429 Savunma Sanayi Sempozyumu Bildiriler Kitabı, 2000, Savunma Sanayii Müsteşarlığı, Ankara Savunma Sanayii Müsteşarlığı Dergisi, 1997, “Interview with Turkish Defense Industry Undersecretary Yalcin Burcak”, Ankara Sevilengül, Orhan, 1993, Bankalarda Kredi Müşterilerinin Finansal Tablolarının Analizi ve Türkiye Uygulamasının Değerlendirilmesi, Ankara Spraakman, G. P., 1979, “The Sensitivity of Earnings Per Share Growth to Some of Its Financial Components”, Financial Management 8, p. 41-46 Şimşek, Göksen, 1997, “Savunma Sanayi Politikası ve Strateji”, Savunma Sanayiindeki Teknolojik Gelişmeler Sempozyumu Bildiriler Kitabı (Cilt-1), Ankara, Kara Harp Okulu, XI-XV Weston, J. Fred and S. Kwang Chung, and Juan V. Siu, 1998, Takeovers, Restructuring and Corporate Governance, Prentice Hall, New Jersey Weston, J. Fred and Eugene F. Brigham, 1987, Essentials of Managerial Finance, The Dryden Press, New York White Book, 2002, Milli Savunma Bakanlığı Yayını, Ankara Yarman, Faruk Aga, 2002, “Ulusal Savunma Sanayilerinde Bilim-Teknoloji Tabanı”, Savtek, ODTÜ, Ankara www.msb.gov.tr www.ssm.gov.tr