Thesis finally finished november 11th 2008
103
145 Chapter 5 DATA ANALYSIS AND DISCUSSION OF THE FINDINGS BASED ON PHASE ONE DATA (BODY DIMENSIONS AND PHOTOGRAPHS) 5.1 INTRODUCTION This study employed manual anthropometric techniques of obtaining body dimensions as the cheapest method available at the time, and because the aim was to identify only a distinctive body shape from the data collected from a small population. This chapter presents the results, discussions and interpretations according to the primary objectives 1, 2 and 3 of this study. The body measurements in this study were taken from 123 career women aged between 25 and 55 years. The specific body measurements that were taken for this study have been explained in chapter 4 paragraph 4.5.1.1 and shown in Figure 4.3, while rules that were observed during the measuring process is also provided as an attached appendix at the end of this thesis (Appendix 3B). 5.2 IDENTIFICATION AND DESCRIPTION OF DISTINCTIVE FEMALE BODY SHAPE(S) OF CAREER WOMEN IN KENYA FROM BODY DIMENSIONS (PRIMARY OBJECTIVE 1 (SUB-OBJECTIVE 1)) Body dimensions have been viewed as the key players in the development of effective sizing systems, and must reflect the height, sizes and body shape proportions of a target population for better-fitting apparel (Beazley, 1998; Gupta & Gangadhar, 2004). Presented in Table 5.1 are the means, range values (maximum and minimum) and standard deviations calculated for the purposes of identifying height and other body characteristics (Tables 5.1 and 5.2) that may affect the fit of apparel. It should be noted that the classifications made in this study were done within the context of the anthropometric data of this study. 5.2.1 Identification of height, bust extension, buttock extension, thigh bulge and the arc dimensions categories The distributions of measurements for variables used in this study which includes; height, bust extension, buttock extension, bust extension, thigh bulge and arc measures, were
Transcript of Thesis finally finished november 11th 2008

145
Chapter 5
DATA ANALYSIS AND DISCUSSION OF THE FINDINGS BASED ON PHASE ONE DATA (BODY DIMENSIONS AND PHOTOGRAPHS)
5.1 INTRODUCTION
This study employed manual anthropometric techniques of obtaining body dimensions as the
cheapest method available at the time, and because the aim was to identify only a distinctive
body shape from the data collected from a small population. This chapter presents the
results, discussions and interpretations according to the primary objectives 1, 2 and 3 of this
study.
The body measurements in this study were taken from 123 career women aged between 25
and 55 years. The specific body measurements that were taken for this study have been
explained in chapter 4 paragraph 4.5.1.1 and shown in Figure 4.3, while rules that were
observed during the measuring process is also provided as an attached appendix at the end
of this thesis (Appendix 3B). 5.2 IDENTIFICATION AND DESCRIPTION OF DISTINCTIVE FEMALE BODY
SHAPE(S) OF CAREER WOMEN IN KENYA FROM BODY DIMENSIONS (PRIMARY OBJECTIVE 1 (SUB-OBJECTIVE 1))
Body dimensions have been viewed as the key players in the development of effective sizing
systems, and must reflect the height, sizes and body shape proportions of a target population
for better-fitting apparel (Beazley, 1998; Gupta & Gangadhar, 2004). Presented in Table 5.1
are the means, range values (maximum and minimum) and standard deviations calculated
for the purposes of identifying height and other body characteristics (Tables 5.1 and 5.2) that
may affect the fit of apparel. It should be noted that the classifications made in this study
were done within the context of the anthropometric data of this study.
5.2.1 Identification of height, bust extension, buttock extension, thigh bulge and the
arc dimensions categories The distributions of measurements for variables used in this study which includes; height,
bust extension, buttock extension, bust extension, thigh bulge and arc measures, were

146
summarized by use of the calculated central tendencies (mean values), dispersion (range
values) and the degrees of dispersions (standard deviation) (Tables 5.1 and 5.2). The
variables were placed into different categories as reflected by the degree of deviation (SD)
from the mean value. The standard deviation reflected the degree to which the values in a
distribution deviated from the arithmetic mean. Standard deviation is usually presented in
tandem with the mean (MMeeaann ±± SSDD)), because it is difficult to determine it’s meaning in the
absence of the mean (Bryman & Cramer, 1997:80-85).
TABLE 5.1: PERCENTAGE DISTRIBUTIONS OF HEIGHT, BUST EXTENSION,
BUTTOCK EXTENSION AND THIGH BULGE CATEGORIES (n = 123)
HEIGHT
Univariate analysis of height dimensions Mean SD Maximum Minimum
161.6 cm 5.6 cm 176.0 cm 148.0 cm
HHeeiigghhtt CCaatteeggoorriieess MMeeaann ±± SSDD CCoouunntt ((%%))
Short 148.8 cm to < 156.0 12 (10%)
Medium ≥ 156.0 cm to ≤ 167.6 cm 93 (75%)
Tall >167.6 cm to 176.0 cm (Max*) 18 (15%)
BUST EXTENSION Univariate analysis of bust extension Mean SD Maximum Minimum
16.0 cm 3.0 cm 23.0 cm 10.0 cm
BBuusstt eexxtteennssiioonn CCaatteeggoorriieess MMeeaann ±± SSDD CCoouunntt ((%%))
Small/flat 10.0cm (Min*) to < 13 cm 1 (0.8%)
Medium ≥ 13.0 cm to ≤ 19.0 cm) 24 (19.6%)
Large > 19.0 cm to ≤ 23.0cm (Max*) 98 (79.6%)
BUTTOCK EXTENSION Univariate analysis of buttock extension Mean SD Maximum Minimum
16.0 cm 3.0 cm 23.0 cm 9.0 cm
Buttock extension categories MMeeaann ±± SSDD CCoouunntt ((%%))
Small/flat 9.0 cm (Min*) to < 13 cm 3 (2%)
Medium ≥ 13.0 cm to ≤ 19.0 cm 36 (29%)
Large > 19.0 cm to ≤ 23.0cm (Max*) 84 (69%)
* Min = Minimum range value; Max = Maximum range value
Height: It has been reported as one of the critical dimensions when designing and
distributing apparel items to the correct marketplaces (Winks, 1997; Beazley, 1998; Gupta &
Gangadhar, 2004; Chun, 2007). The population in this study was classified into the three
different height groups, while body characteristics such as the bust, the buttocks, the thigh
bulge, shoulders and the body balance were each also classified into three categories on the
basis of how the range values deviated from the standard deviation (Table 5.1).

147
The different height categories were obtained by calculating the degree to which the values
in a distribution deviated from the arithmetic mean. Short category was arrived at by sorting
out all the values that fell below (<) the (Mean ± SD); the medium category was obtained by
identifying all the values that were equal (=) to the (Mean ± SD) and the tall category was
achieved by sorting out all the values that fell above (>) the (Mean ± SD) (Table 5.1) (Bryman
& Cramer, 1997:80-85; Gupta & Gangadhar, 2004). This classification technique was applied
in Beazley’s (1998) and Gupta and Gangadhar’s (2004) studies. Results about Height
categories (Table 5.1) show that the majority (75%) of the participants were in the medium
height category. It is important that the apparel industry take note of this percentage when
deciding on relative quantities in the different size/height categories in the design and
manufacture of ready-made apparel.
Bust and buttocks extensions: Circumferential dimensions such as the bust and the hips
are one-dimensional in character, and therefore it is difficult to assess the extent of the
protrusion of these features (bust/breasts and buttocks/derriere) from the measurements.
Therefore, bust and buttock depth dimensions were deemed necessary in this study to
determine the extension of the breasts size as well as the buttocks/derriere, respectively.
The prominence (degrees of extension) of the bust and the buttocks is known to affect the fit
of apparel at the bust and hip regions (Rasband & Liechty, 2006:194, 324).
FIGURE 5.1: BUST AND BUTTOCKS EXTENSIONS
The trunk line/side seam line (Figure 5.1) must be identified before commencing the
measurement exercise (also refer to Chapter 4, paragraph 4.5.1.1 and Figure 4.3). The
bust and the buttock extension measurements were taken with a segmometer instrument
(Figure 4.4) from the trunk line to the breast tips and the edge of the buttocks respectively.
Sliding callipers can also be used to obtain the same measurement.

148
The different bust and buttock extension categories were obtained by calculating the degree
to which the values in a distribution differ from the arithmetic mean. Small bust/buttock
extension = < (Mean ± SD); Medium bust/buttock extension category = (Mean ± SD) and the
large bust/buttock extension = > (Mean ± SD) ((Table 5.1) (Bryman & Cramer). The results
regarding buttock extension and thigh bulge categories in Table 5.1 also demonstrate that
the majority of the participants had a large bust (81%) and large buttocks (69%). The large
buttocks have fit implications around the hip, thigh and crotch line, while the large bust could
affect the fit of the garment around the bust region.
Thighs: Heavy or bulging thighs may be positioned and/or shaped differently, thus affecting
the fit of the apparel item either vertically or horizontally. If the thighs are fuller or thinner than
average, pants/skirts with a close fit will tend to either sag (form folds) as a result of very
loose fit, or will form wrinkles as a result of a tight fit (Rasband & Liechty, 2006:340). To
determine the thigh bulge dimension, the subjects were measured on two positions of the hip
region: one was taken at the normal hip position (trochanterion region) and the second hip
dimension was obtained at a position of approximately 10 cm below the normal hipline
(Figure 4.3).
The thigh bulge (Table 5.2) was determined by subtracting the hip circumference dimension
at the normal (trochantrion region) position from the measurement over (circumference) the
broadest region of the hips (highest thigh position) at approximately 10 cm below the normal
hip position. The different categories (Table 5.2) were obtained by calculating the degree to
which the values in the distribution differed from the arithmetic mean. In this study, small
thigh bulge = < (Mean ± SD); Medium thigh bulge = (Mean ± SD) and the large thigh bulge =
> (Mean ± SD) (Table 5.2) (Bryman & Cramer).
Shoulders: Shoulders act as the apparel’s “hanger", facilitating an aesthetic appearance as
the apparel drapes gracefully over the body. The size of the shoulders in relation to other
parts of the body, and their shape, will affect the fit of the apparel (Rasband, 1994:68-72).
The shoulder slope dimension was obtained by subtracting the shoulder height (shoulder to
ground) dimension from the nape to ground dimension.
The different shoulder categories were obtained by calculating the degree to which the
values in the distribution differed from the arithmetic mean. In this study, slopped shoulders =
< (Mean ±± SSDD));; normally shaped shoulders = (Mean ±± SSDD)) aanndd the squared shoulders = >
(Mean ±± SSDD)).. Results about shoulder shape categories (Table 5.2) clearly show that the
majority (67%) of the participants’ shoulders were normally shaped, which indicates that they
may possibly experience minimal shoulder fit problems

149
TABLE 5.2: PERCENTAGE DISTRIBUTIONS OF THIGH BULGE, SHOULDER CATEGORIES AND ARC AT KEY REGIONS (N = 123)
THIGH BULGE Univariate analysis of thigh bulge Mean SD Maximum Minimum
2.5 cm 2.0cm 6.0 cm 0.0 cm
Thigh bulge categories MMeeaann ±± SSDD CCoouunntt ((%%))
Small thigh bulge < 1.0 cm 1 (0.8%)
Medium thigh bulge ≥1.0 cm to ≤ 5.0 cm 102 (83%)
Large thigh bulge > 5.0 cm to ≤ 6.0 cm (Max*) 20 (16.2%)
SHOULDERS Univariate analysis of shoulder drop/shape Mean SD Maximum Minimum
3.5 cm 1.5 cm 7.0 cm 0.0 cm
Shoulder shape categories MMeeaann ±± SSDD CCoouunntt ((%%))
Squared < 3.5 cm 18 (14%) Normal ≥ 3.5 cm to ≤ 5.5 cm 81 (67%) Sloped > 5.5 cm to 7.0 cm (Max*) 24 (19%)
BALANCE/ARC Univariate analysis of arc dimensions MMeeaann SSDD MMaaxxiimmuumm MMiinniimmuumm
Front bust arc subtract back arc 8.0 cm 3.5 cm 22.0 cm 2.0 cm
Front waist arc subtract back waist arc 2.0 cm 3.0 cm 17.0 cm 0.0 cm
Back hip arc subtract front hip arc 9.0 cm 4 cm 28. 0 cm 0.0 cm
AArrcc ddiimmeennssiioonnss ccaatteeggoorriieess MMeeaann ±± SSDD CCoouunntt ((%%))
Small front bust 2.0 cm to < 4.5 cm 22 (17%)
Medium front bust ≥ 4.5 cm to ≤ 11.5 cm 81 (67%) BBuusstt lliinnee aarrccss
Large front bust > 11.5 cm to ≤ 22.0 cm (Max*) 20 (16%)
Small front waist < 0 cm (Min*) 2 (1.6%)
Medium front waist ≥ 0 cm to ≤ 5 cm 112 (91.1%) WWaaiissttlliinnee aarrccss
Large front waist > 5 cm to ≤ 17 cm (Max*) 9 (7.3%)
Small back 0 to < 5.0 cm 11 (9%)
Medium back ≥ 5 cm to ≤ 13.0 cm 103 (82%) HHiipplliinnee aarrccss
Large back > 13.0 cm to ≤ 28.0 cm (Max*) 11 (9%)
* Min = Minimum range value; Max = Maximum range value
Results regarding thigh bulge in Table 5.2 indicate that the majority (85%) of the participants
had moderately large thighs, which could result with fit problem around the hip, thigh and
crotch line.
Balance: A correct posture assumes a balanced alignment of all the parts of the body (back
and front) over each other, and could influence the physical attractiveness of apparel
(Rasband, 1994:13). The trunk line/side seam, also known as the balancing line, must be
identified before commencing the exercise (refer to Chapter 4, paragraph 4.5.1.1 and
Figure 4.3). Arc dimensions (measurements taken from the right-side trunk line to the left-

150
side trunk line, either at the front or the back) were taken at the key regions (bust, waist and
hip), to establish whether the postures/body shapes were balanced at these regions.
Ashdown, Choi, Milke and Raymond (2004) warn that body shapes with excessive lordosis
(swayback) or excessive kyphosis (hump back) cannot achieve the balanced side profile
view. Excessive fat deposits on any part of the body could also cause body imbalance. The
front part, for example, could contain more fat deposits than the back region, causing the
figure to assume a backward stance in an attempt to counteract the weight balance.
As for all the other body characteristics, the different arc categories were obtained by calculating the degree to which the values in the distribution deviated from the arithmetic
mean. Small arc = < (Mean ±± SSDD));; medium arc = (Mean ±± SSDD)) aanndd the large arc = > (Mean ±±
SSDD)).. Results about body’s balance categories at key body regions (Table 5.2): indicate that
the front bust (65%) and front waist (92.5%) arcs were moderately larger than the back arc at
the bust line and waistline regions, with strong correlations (r = 0.86) of both the back and
front arc dimensions at the bust line and the waistline back and front arc dimensions (r =
0.94). The back hip arc was moderately (82%) larger than the front hip arc, with also strong
correlations (r = 0.82) between the back arc and front arc measurements at hip regions. The
large upper torso’s front bust and waist imply that apparel worn by a woman with such shape
characteristics is likely to pull towards the front making the side seam skewed. At the hip
region, the apparel is likely to pull towards the back, thereby making the side seam skewed
towards the back. Statistically, the three back arc dimensions and the front arc dimension
showed no significant (0.0001< 0.05) associations.
TABLE 5.3: PERCENTAGE DISTRIBUTION OF BUST CUP CATEGORIES (n = 107)
CCuupp ccaatteeggoorriieess SSttaannddaarrddss wwiitthhiinn rraannggee vvaalluueess CCoouunntt ((%%))
A 0 to < 5.0 cm 0 (0%)
B ≥ 5.0 cm to < 7.0 cm 1 (1%)
C ≥ 7.0 cm to < 9.0 cm 6 (6%)
D ≥ 9.0 cm to < 11.0 cm 36 (33%)
DD ≥ 11.0 cm to < 14.0 cm 42 (39%)
E and above ≥ 14.0 cm to ≤ 28 cm 23 (21%)
Bust cup (Table 5.3): Cup size and brassière size are determined by the size of the breasts.
The dimension determining cup size is obtained by subtracting the under-bust dimension
from the bust circumference dimension at the fullest part (Solinger, 1988:77; Spillane,
1995:85). In this study, the differences between the under-bust dimension and the bust
dimension ranged from 5.00 cm to 28.00 cm. The cup sizes (Table 5.3) were then
categorised according to standards given by Spillane (1995:85), but within the range values
obtained by subtracting the under-bust dimension.

151
The results presented in Table 5.3 show that participants with cup size DD (39%) and above
(21%) were in the majority (60%), followed by participants with cup size D (33%).
Participants with cup size C and B were least represented. These figures may suggest that
Kenya’s career women experience tight fit problems at the bust region. Comparisons were
made between bust depth and cup size to determine whether they would yield similar results.
From the bust extension, there were 81% participants with large busts, while 60% of the
participants had cup size DD and above. However, both the techniques of identifying bust
size indicated that the majority of the participants had large bust sizes.
5.2.2 Body shape identification
Body shapes have in the past been classified into the prevalent five figure types (hourglass,
triangle, rectangular, apple and inverted triangle) by drop values. A drop value is the
difference between the hip circumference and the bust circumference or the difference
between the bust and the waist (Chun-Yoon & Jasper, 1993; Winks, 1997; Beazley, 1998;
Gupta & Gangadhar, 2004; Yu, 2004:185). In this study, the different body shapes were
defined based on the key dimensions: bust for the upper torso, waist for both upper and
lower torso, and the hip for the lower torso. However, since body shapes and proportions
vary with different countries and even regions within countries (Zwane & Magagula, 2006;
Shin & Istook, 2007; Honey & Olds, 2007), it was necessary to understand the parameters
from the literature that define and describe the five prevalent body shapes (hourglass,
triangle, rectangular, apple and inverted triangle). The identified descriptions were then used
to determine standards within the maximum and minimum (range values) dimensions of the
drop values calculated (Table 5.4) for the purpose of identification of the distinctive body
shape(s) of this study.
Specific drop values used for the categorisation of body shapes in this study are given in
(Table 5.4). Shin and Istook (2007) reported that the rectangular shape’s waist measures
nine inches (23 cm) less than the bust. Rasband and Liechty (2006:25-26) state that the
waist of the hourglass body shape measures over 10 inches (25 cm) less than the hip or the
bust. Using the range (maximum and minimum) dimensions of the drop values, in
combination with Shin and Istook’s (2007) and Rasband and Liechty’s (2006)
recommendations, it was possible to identify the different body shapes as presented in Table 5.4.

152
TABLE 5.4: PERCENTAGE DISTRIBUTION OF BODY SHAPES (n = 123)
BBOODDYY SSHHAAPPEE CATEGORIES Triangular and inverted triangle body shape categories
1st step: Triangle and Inverted triangle depend on bust and hip relationship and are opposite each other. Once these two body shapes were sorted out, they were not subjected further to waist and bust relationship
Univariate analysis of drop values Mean SD Maximum Minimum
Hip subtract the bust 5.6 cm 8.8 cm 26.0 cm -8.0 cm
Mean (5.6) +SD (8.8) = ≥ 14.0 cm to ≤ 26.0 cm (Max*) Triangle (Large hips)
Mean (5.6) - SD (8.8) = -8.0 cm (Min*) to > 3.2 cm
Inverted triangle (large bust)
2 (1.5%)
Apple, Rectangular and Hourglass shape
2nd step: Apple, Rectangular and Hourglass shape rely on bust and waist relationship, Rectangular = Waist 23.00cm less than the bust (Shin & Istook, 2007), Hourglass = waist 25 cm less than the bust (Rasband & Liechty, 2006). Categories were guided by the standards within the range values
Univariate analysis of Bust subtract the waist drop values 6.0 cm 13.0 cm 36.0 cm -13.0 cm
SSttaannddaarrddss wwiitthhiinn tthhee mmaaxxiimmuumm aanndd mmiinniimmuumm ddiimmeennssiioonnss ooff tthhee ddrroopp vvaalluueess BBooddyy sshhaappee CCoouunntt ((%%))
-13.0 cm (Min*) to ≤ 4.7 cm Apple (Large waist) 2 (1.5%)
> 23.0 cm to 36.0 cm (Max*) Hourglass (Narrow waist) 2 (1.5%)
> 4.7 cm to ≤ 23.0 cm Rectangular/
Straight (Average waist) 93 (74%)
* Min = Minimum range value; Max = Maximum range value
Table 5.4 clearly portrays that the rectangular body shape was the most (74%) prevalent
body shape in the sample, followed by the triangle body shape (21.5%). The other body
shapes (apple, hourglass and the inverted triangle) had the least representation of 1.5%
each. Since most ready-made apparel is manufactured based on the hourglass body shape
proportions, Kenya’s career women are therefore likely to experience fit problems with ready-
made apparel.
5.2.3 Height proportions
The ideal shape (fit model) used as a design base by the apparel industry has a well-
proportioned/well-balanced body, both horizontally and vertically. Although height proportions
are used mostly by artists and illustrators, imbalanced height proportions could also lead to fit
problems. Figure 5.2 illustrates height proportions in relation to the full height (Lyle &
Brinkley, 1983:63; Le Pechoux & Ghosh, 2002:4).

153
FIGURE 5.2: IDEAL BODY SHAPE’S HEIGHT PROPORTIONS
(Adapted from: Lyle & Brinkley, 1983:63)
Using the height proportional relationship concept from Lyle and Brinkley (1983:63) and Le
Pechoux and Ghosh (2002:4), the results of the height proportions of this study are
presented in Table 5.5.
TABLE 5.5: PERCENTAGE DISTRIBUTION OF HEIGHT PROPORTIONS (n = 123)
HHeeiigghhtt pprrooppoorrttiioonnss EExxaacctt ccoouunntt ((%%)) AAbboovvee ccoouunntt ((%%)) BBeellooww ccoouunntt ((%%)) Under-bust height (¾ height) 0 0 123 (100%)
Waist height (⅝ height) 0 103 (84%) 20 (16%)
Hip height (½ height) 6 (5%) 102 (83%) 15 (12%)
Knee height (¼ height) 0 123 (100%) 0
The results presented in Table 5.5 above indicate that all (100%) the participants’ bust height
dimensions were below the ¾ standard of the ideal figure’s normal bust position. This may
therefore affect the size of the armhole, as well as the dart positions and style lines of a
foundation pattern. The majority (84%) of the participants’ waist heights were above the ⅝
height standard of the ideal figure’s normal waist position, while only 16% of the participants’
waist heights were below the ideal figure’s waist position. This means that the majority of the
participants’ waistlines were situated higher than the ideal body’s normal position, which may
require re-identification of the waist dart positions and style lines in a base pattern.
Concerning the hip height, the results also indicate that the majority (83%) of the participants’
hip height dimensions were above the ½ standard (ideal figure’s) height position, while only
12% had hip heights below the standard. Only 5% of the participants had hip heights at
Bust line is midway between shoulders and waistline (¾ of the full height)
Waistline is midway between the bust line and the hipline (⅝ of the full height from the apex of the head to the ground).
Hipline is the mid-point of the total figure’s height (½ full height dimensions from the apex of the head to the ground).
Knee line is the mid-point between the hipline and the ground (¼ of the human’s full height from the apex of the head to the ground).

154
exactly ½ the standard height position of the ideal figure. This implies that the majority of the
participants had their hiplines situated above the ideal figure’s normal position, a typical
characteristic of a Western rectangular shape (Rasband & Liechty, 2006:25). However, this
could affect the style lines and side seam shaping in a foundation pattern. Concerning the
knee height, all (100%) the participants’ knee heights were above the standard ¼ heights,
indicating that the majority of the participants’ lower parts of their legs were longer than the
ideal figure’s normal position. The knee height position does not affect the fit of an apparel
item, but could be used as a style guide point. It should be noted that these calculations were
based on the exact standards stated above, and no tolerance allowance was provided.
5.2.4 Summary of body shape identification from body dimensions (Primary objective 1 (Sub-objective 1))
In summary, this study found that the majority of the participants were of medium height
(75%) and had a distinctive rectangular body shape (74%). Participants with a triangle/pear
body shape were the second most common type (20.5%) although they were less
represented. Other characteristics that prevailed with the distinct body shapes (rectangular
and triangle), were the large buttocks (69%), large thigh bulge (85%), large bust as indicated
by the bust extension (81%), and large cup size (60%). The body shape was also
characterised by a larger front arc at the bust and waistline regions, whereas the back arc
dimension was large at the hip region. The body shape’s height proportions showed that
waistline, hip-line and knees were higher than the normal, ideal figure’s height positions,
whereas the bust line was situated below the normal height position.
5.3 IDENTIFICATION AND DESCRIPTION OF THE DISTINCTIVE FEMALE BODY SHAPE (S) OF PROFESSIONAL WOMEN IN KENYA FROM PHOTOGRAPHS (OBJECTIVE 1 (SUB-OBJECTIVE 2))
Photographs were taken from 89 career women within the ages of 25-55. Their ages were
categorised into three groups namely: young adults aged between 25 and 32 years, a middle
group aged between 33 and 40 years, and mature group aged 41 years and above. The
middle-aged (33–40) were highly (43%) represented, while the young adults (25–32) were
the secondly (32%) represented. The mature group (41 years and above) had the lowest
(25%) representation. All the digital images were transferred to the computer for the
purposes of cleaning, refining and organising them for evaluations.
In this study, it was decided that a Kappa statistic of 0.75 was the cut-off point for acceptable
155
agreement between the two trained professional evaluators. This implied that all the
evaluations with the Kappa statistic of ≥ 0.75, and significant (p ≤ 0.05) agreements between
the two evaluators, were accepted, while evaluated attributes with Kappa < 0.75 were
rejected, but were further subjected to a group of professional expert evaluators to assess
and to reach consensus on a given characteristic for final decisions. The categories of body
features and body shape identified are presented according to the sequence of the body
shape assessment scale (Appendix 3D).
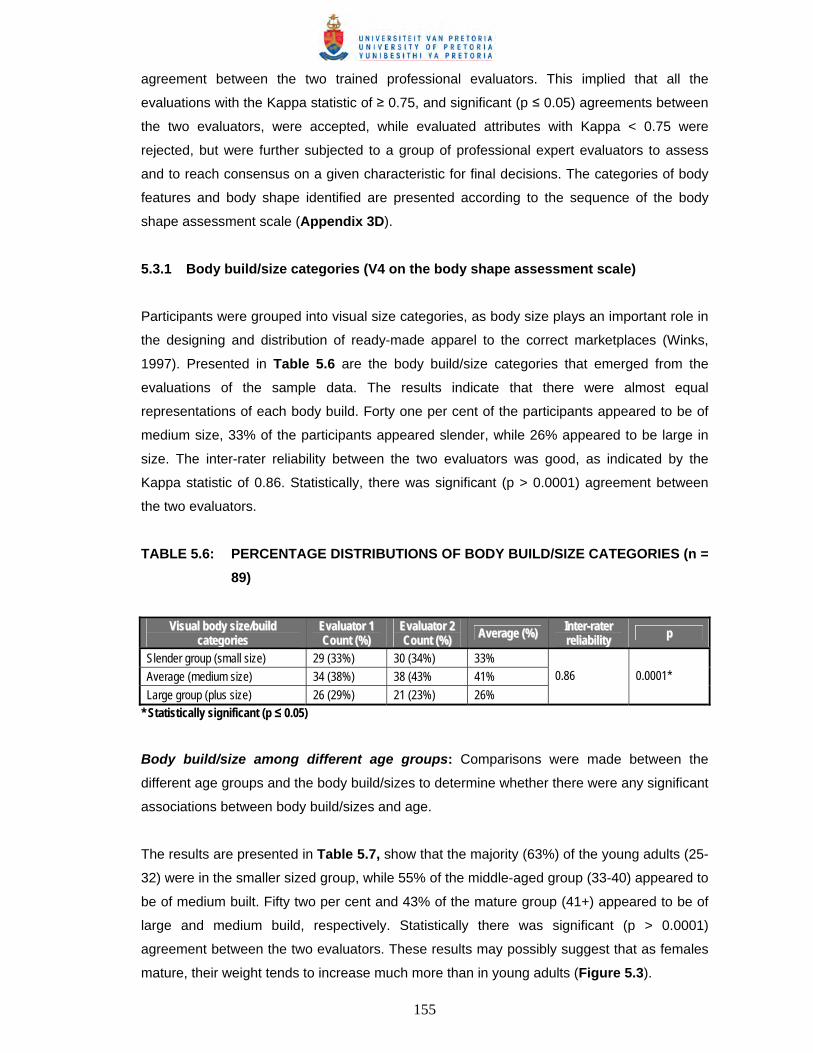
5.3.1 Body build/size categories (V4 on the body shape assessment scale)
Participants were grouped into visual size categories, as body size plays an important role in
the designing and distribution of ready-made apparel to the correct marketplaces (Winks,
1997). Presented in Table 5.6 are the body build/size categories that emerged from the
evaluations of the sample data. The results indicate that there were almost equal
representations of each body build. Forty one per cent of the participants appeared to be of
medium size, 33% of the participants appeared slender, while 26% appeared to be large in
size. The inter-rater reliability between the two evaluators was good, as indicated by the
Kappa statistic of 0.86. Statistically, there was significant (p > 0.0001) agreement between
the two evaluators.
TABLE 5.6: PERCENTAGE DISTRIBUTIONS OF BODY BUILD/SIZE CATEGORIES (n = 89)
VViissuuaall bbooddyy ssiizzee//bbuuiilldd ccaatteeggoorriieess
EEvvaalluuaattoorr 11 CCoouunntt ((%%))
EEvvaalluuaattoorr 22 CCoouunntt ((%%)) AAvveerraaggee ((%%)) IInntteerr--rraatteerr
rreelliiaabbiilliittyy pp
Slender group (small size) 29 (33%) 30 (34%) 33%
Average (medium size) 34 (38%) 38 (43% 41%
Large group (plus size) 26 (29%) 21 (23%) 26%
0.86 0.0001*
* Statistically significant (p ≤ 0.05)
Body build/size among different age groups: Comparisons were made between the
different age groups and the body build/sizes to determine whether there were any significant
associations between body build/sizes and age.
The results are presented in Table 5.7, show that the majority (63%) of the young adults (25-
32) were in the smaller sized group, while 55% of the middle-aged group (33-40) appeared to
be of medium built. Fifty two per cent and 43% of the mature group (41+) appeared to be of
large and medium build, respectively. Statistically there was significant (p > 0.0001)
agreement between the two evaluators. These results may possibly suggest that as females
mature, their weight tends to increase much more than in young adults (Figure 5.3).

156
TABLE 5.7: BODY BUILD/SIZE AMONG DIFFERENT AGE GROUPS
SSmmaallll ((%%)) MMeeddiiuumm ((%%)) LLaarrggee ((%%))
AAGG
EE (( YY
EE AA R
R SS ))
EE vv aa
ll uuaa tt
oo rr
11
EE vv aa
ll uuaa tt
oo rr
22
AAvv ee
rr aagg ee
(( %%
))
pp
EE vv aa
ll uuaa tt
oo rr
11
EE vv aa
ll uuaa tt
oo rr
22
AAvv ee
rr aagg ee
(( %%
))
pp
EE vv aa
ll uuaa tt
oo rr
11
EE vv aa
ll uuaa tt
oo rr
22
AAvv ee
rr aagg ee
(( %%
))
pp
25-3
2 (n
=
29)
61 64 63 % 28 25 26% 11 11 11%
33-4
0 (n
=
38)
17 17 17% 0.0001* 48 62 55% 0.0001* 34 21 28% 0.0001*
41 +
(n
= 22
)
5 5 5% 41 45 43% 54 50 52%
*Statistically significant (p ≤ 0.05)
Young
Middle-aged Young /smaller body build Middle-aged /medium to fuller body build
Middle-aged
Older Middle-aged /medium to fuller body build Older /fuller body build
FIGURE 5.3: BODY BUILD/SIZE VERSUS AGE

157
5.3.2 Bust/shoulder width versus hip width appearance, and waist size versus hip width (V5 and V6 on the assessment scale)
When using body dimensions, body shape classifications are based on a derived parameter
drop value (Winks, 1997; Beazley, 1998; Gupta & Gangadhar, 2004). However, visual
analysis does not use the drop values as in the case of dimensions, but uses visual analysis
to provide an estimate of how the bust/shoulder and waist sizes compare to each other. The
two attributes were subjected to a group of professional expert evaluations because inter-
rater reliability was below the Kappa statistic of ≥ 0.75 (0.66 and 0.68). The results are
presented in Table 5.8. TABLE 5.8: PERCENTAGE DISTRIBUTION OF THE BUST/SHOULDER AND WAIST
SIZE APPEARANCE VERSUS THE HIP WIDTH APPEARANCE (n = 89)
CCaatteeggoorriieess EEvvaalluuaattiioonnss bbyy aa ggrroouupp ooff pprrooffeessssiioonnaall eexxppeerrttss ((%%)) PPoossssiibbllee bbooddyy sshhaappee
Narrow 12 (13%) Triangle/Pear
Similar 74 (83%)* Rectangular, Hourglass or Apple
BBuu ss
tt // ss hh
oo uull dd
ee rr
ss iizz ee
vv ee
rr ssuu ss
hhii pp
ss ii
zz ee
Wider 3 (3%) Inverted triangle/Barrel
Narrow 8 (11%) Hourglass
Similar 62 (84%) Rectangular
WWaa ii
ss tt ss
ii zzee
vv eerr ss
uu ss hh
ii pp
ss iizz ee
Wider 4(5%) Apple * Subjected to waist size versus hip size
Table 5.8 clearly demonstrates that 83% of the participants’ bust/shoulder sizes appeared
similar in width to their hip sizes, suggesting the possibility of rectangular, apple or hourglass
body shapes. Participants with bust/shoulders appearing narrower than the hips were 13%
(this could suggest the possibility of pear/triangular shapes). The least represented group
(6%) were those with busts appearing wider than the hip size, suggesting a possible inverted
triangular/barrel shape. At this stage, it was unclear as to whether the majority of the
participants could possibly be identified with the rectangular, hourglass, or apple body shape.
To isolate the rectangular shape from the hourglass and the apple body shapes, the waist
thickness was further compared to the hip width appearance (V6 on the body shape assessment scale) – only on the 74 (83%) participants with waist size similar to bust size.
The results indicate that the majority of the participants with waist size appearing similar to
the hip size were 84% (signifying a possible rectangular body shape). The participants
whose waist size appeared narrower than the hip size were 11% (indicating a possibility of
an hourglass body shape). Participants whose waist size appeared wider than their hip size

158
were 5% (suggesting a possible apple shape). This indicates that the majority of the
participants had a rectangular body shape.
5.3.3 Stomach and buttocks appearances (V7 and V8 on the body shape assessment scale)
Stomach size and shape plays an important role in the design of apparel items. Its size,
shape and position would affect the fit of the apparel item around the waist region. Its size
could also affect the crotch line as well as the hang of apparel (Rasband, 1994:66, 68).
Buttocks size and shape is also an important body characteristic that affects the fit of apparel
around the hip region, the crotch line and even the drape (Rasband & Liechty, 2006:324).
Results of visual stomach and buttocks shape evaluations are presented in Table 5.9.
TABLE 5.9: PERCENTAGE DISTRIBUTION OF COMMON STOMACH AND BUTTOCKS SHAPES (n = 89)
CCaatteeggoorriieess EEvvaalluuaattoorr 11 AAvveerraaggee ((%%))
EEvvaalluuaattoorr 22 AAvveerraaggee ((%%)) AAvveerraaggee ((%%)) pp IInntteerr--rraatteerr
rreelliiaabbiilliittyy
“D” 65 (73%) 59 (66%) 70%
“b” 15 (17%) 19 (21%) 19%
VV ii ss
uu aall ss
hh aapp ee
ooff
tt hhee
ss ttoo mm
aa cchh
Flat 9 (8%) 11 (13%) 11%
0.0001* 0.81
“d” (large) 81 (91%) 81 (91.5%) 91%
No “d”(Average 8 (9%) 8 (8.5%) 9%
VV ii ss
uu aall ss
hh aapp ee
ooff
tt hhee
bb uutt tt o
o cckk ss
Flat 0 (0%) 0 (0%) 0 (0%)
0.0001* 0.94
*Statistically significant (p ≤ 0.05)
The stomach “D” shape is defined from the body’s profile view, where the front part of the
body is characterised by an extension of fullness appearing like a letter “D” from below the
bust line extending down to the crotch line. Stomach “b” shape is defined from the body’s
profile view, where the stomach’s fullness (roundness) begins below the waistline, appearing
like a letter “b”. Table 5.9 clearly depicts that the majority (70%) of the participants had
stomach protrusions appearing similar to the letter “D”. The inter-rater reliability for these
evaluations was good, as indicated by a Kappa statistic of 0.81. Statistically there was
significant (p > 0.0001) agreement between the two evaluators. Participants with stomach
protrusions appearing similar to the letter “b” and flat were only 19% and 11% respectively.
The results suggest that Kenya’s career women are likely to experience tight fit problems
with ready-made apparel along their front torsos.

159
The buttocks’ “d” shape is defined from the body’s profile view, with the buttock distinction or
conspicuity that appears like the letter “d” as it stands out or extends at the lower back
section. Table 5.9 clearly shows that the majority (91%) of the participants appeared to have
large buttocks appearing like the letter “d”. Participants whose buttocks did not appear like
the letter “d” were 9%, while none of the participants appeared to have flat buttocks. The
inter-rater reliability for the evaluations was good, as indicated by a Kappa statistic of 0.94,
while there was significant (p > 0.0001) agreement between the two evaluators. The results
suggest that Kenya’s career women are likely to experience tight fit problems around the hip
and the crotch lines of apparel.
Stomach shape among different age groups: Comparisons were made between the
different age groups and the stomach prominence to determine whether there were any
associations between stomach shapes and the different age groups. The “b” stomach
shapes were combined with flat stomach shapes, because from Table 5.9, the “b” and flat
stomach shapes were least represented (30%). They were also grouped together because
they appeared similar. The results are presented in Table 5.10.
TABLE 5.10: PERCENTAGE DISTRIBUTION OF COMMON STOMACH SHAPES ACCORDING TO AGE GROUPS (n = 89)
AAggee ((yyeeaarrss)) SSttoommaacchh ““DD”” sshhaappee AAvveerraaggeedd ((%%))
SSttoommaacchh ““bb”” aanndd ffllaatt sshhaappee AAvveerraaggeedd ((%%))
pp
25-32 (n = 29) 50 % 50%
33-40 (n = 38) 91% 9%
41 + (n = 22) 93% 7%
0.0001*
* Statistically significant (p ≤ 0.05)
Table 5.10 shows that the majority (93%) of the mature age group and the majority (91%) of
the middle-aged group had stomach protrusions that appeared like the letter “D”, while only
50% of the young adults had stomach protrusions appearing like the letter “D”. Among the
young adults, 50% had stomach protrusions appearing like the letter “b”. Statistically, there
were significant (0.0001 ≤ 0.05) associations between age group and the presence of the
stomach shape “D”. It is possible that the mature females’ fat deposits tend to spread all over
the front torso much more than in the younger group, as shown in Figure 5.4.
5.3.4 Upper back curvature and the back waist curvature/shape (V9 and V10 on the
body shape assessment scale)
Upper back and the back waist curvatures are important characteristics that would affect the
fit of apparel items around the shoulder blades, the midriff region at the back as well as the

160
balance of an apparel item from the profile view. Inter-rater reliability for these two variables
between the two evaluators was lower (0.69 and 0.68) than the Kappa statistic of 0.75, and
therefore, they were subjected to a group of professionals’ expert assessment. The results
are presented in Table 5.11.
TABLE 5.11: PERCENTAGE DISTRIBUTION OF THE UPPER BACK AND THE BACK WAIST CURVATURES (n = 89)
TThhrreeee eexxppeerrtt eevvaalluuaattoorrss CCaatteeggoorriieess
FFrreeqquueennccyy PPeerrcceennttaaggee ((%%))
Fully rounded upper back 70 79%
Moderately rounded upper back 13 15%
UUpp pp
ee rr
bb aacc kk
ss hh
aa ppee
cc uurr vv
aa ttuu rr
ee
Straight upper back 6 6%
Deep hollow waist 67 75%
Moderately hollow waist 19 21%
BBaa cc
kk ww
aa iiss tt
cc uu
rr vvaa tt
uu rree
Straight/flat/non-hollow waist 3 4%
Table 5.11 above shows that the majority (79%) of the participants appeared to have a fully
rounded upper back, while the moderately rounded upper backs and flat backs were least
represented. It is also apparent that the majority (75%) of the participants had a deep hollow
back waist, while participants with a moderate hollow back waist and a straight back waist
were least represented. It appears that the pronounced rounded upper back and the large
buttocks (Table 5.9) result in the deep hollow back waistline. However, a consumer with the
rounded upper back in combination with a hollow waistline is likely to experience tight fit
problems at the shoulder blade region and loose fit (sagginess) around the waistline. The
balance of the apparel is also likely to be affected as a result of this body configuration.
Upper back and back waist curvatures among different age groups (Table 5.12):
Comparisons of the upper back and the back waist curvatures were made between the
different age groups to determine whether there were any significant associations between
the upper back and back waist curvatures among the different age groups. The results are
represented in Table 5.12.
The results (Table 5.12) show that there were more (59%) of the young adults (25-32) with
fully rounded upper back, followed by the middle-aged (33-40) group (53%) with fully
rounded upper backs, and only 34% in the mature group had rounded upper backs.
However, more (55%) of the mature (41+) and about half (47%) of the middle-aged (33-40)
groups had moderately rounded upper backs, while only few (38%) of the young adults (25-
32) had moderately rounded upper backs. From these results, it may be reasoned that as the
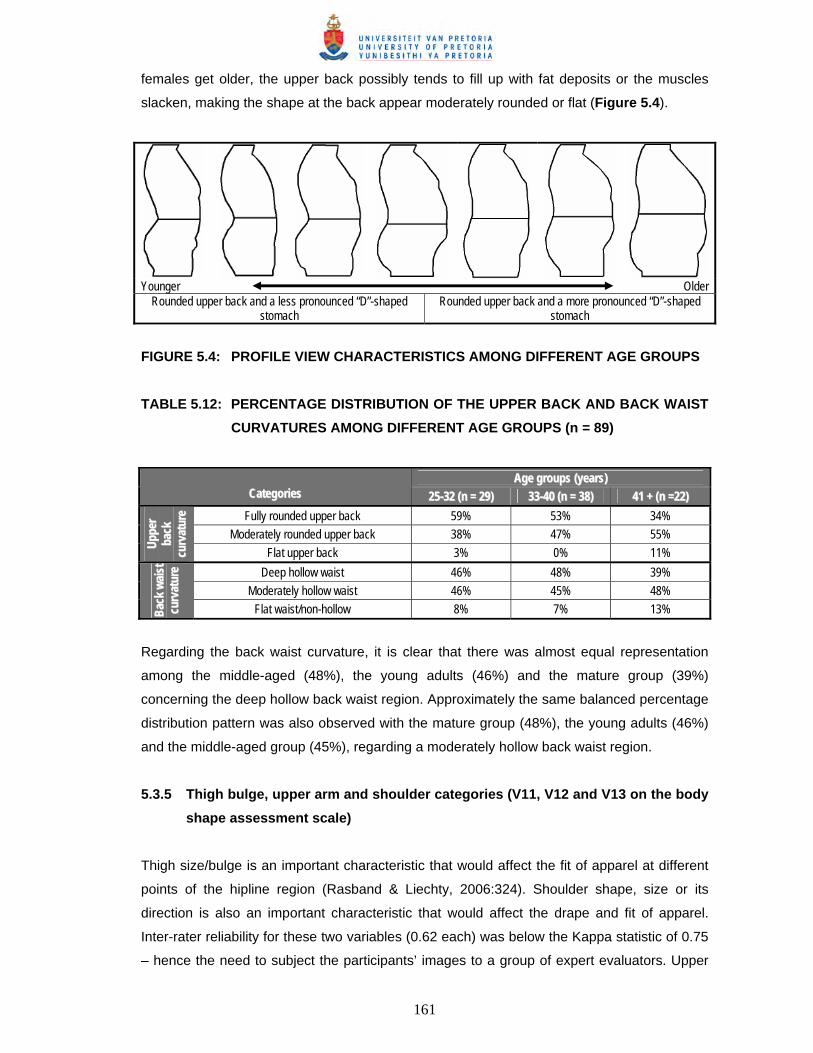
161
females get older, the upper back possibly tends to fill up with fat deposits or the muscles
slacken, making the shape at the back appear moderately rounded or flat (Figure 5.4).
Younger Older
Rounded upper back and a less pronounced “D”-shaped stomach
Rounded upper back and a more pronounced “D”-shaped stomach
FIGURE 5.4: PROFILE VIEW CHARACTERISTICS AMONG DIFFERENT AGE GROUPS TABLE 5.12: PERCENTAGE DISTRIBUTION OF THE UPPER BACK AND BACK WAIST
CURVATURES AMONG DIFFERENT AGE GROUPS (n = 89)
AAggee ggrroouuppss ((yyeeaarrss)) CCaatteeggoorriieess 2255--3322 ((nn == 2299)) 3333--4400 ((nn == 3388)) 4411 ++ ((nn ==2222))
Fully rounded upper back 59% 53% 34%
Moderately rounded upper back 38% 47% 55%
UUpp pp
ee rr
bb aacc kk
cc uu
rr vvaa tt
uu rree
Flat upper back 3% 0% 11%
Deep hollow waist 46% 48% 39%
Moderately hollow waist 46% 45% 48%
BBaa cc
kk ww
aa iiss tt
cc uu
rr vvaa tt
uu rree
Flat waist/non-hollow 8% 7% 13%
Regarding the back waist curvature, it is clear that there was almost equal representation
among the middle-aged (48%), the young adults (46%) and the mature group (39%)
concerning the deep hollow back waist region. Approximately the same balanced percentage
distribution pattern was also observed with the mature group (48%), the young adults (46%)
and the middle-aged group (45%), regarding a moderately hollow back waist region.
5.3.5 Thigh bulge, upper arm and shoulder categories (V11, V12 and V13 on the body shape assessment scale)
Thigh size/bulge is an important characteristic that would affect the fit of apparel at different
points of the hipline region (Rasband & Liechty, 2006:324). Shoulder shape, size or its
direction is also an important characteristic that would affect the drape and fit of apparel.
Inter-rater reliability for these two variables (0.62 each) was below the Kappa statistic of 0.75
– hence the need to subject the participants’ images to a group of expert evaluators. Upper

162
arm size affects the fit of apparel items at the sleeve’s upper arm or at the crown region
(Rasband, 1994:106-108), thus the need to understand consumers’ upper arm sizes. The
results of the thigh bulge, shoulder and upper arm categories are presented in Table 5.13.
TABLE 5.13: PERCENTAGE DISTRIBUTION OF THE UPPER ARM, THIGH BULGE AND SHOULDER SHAPE CATEGORIES (n = 89)
CCaatteeggoorriieess EEvvaalluuaattoorr 11 AAvveerraaggee ((%%))
EEvvaalluuaattoorr 22 AAvveerraaggee ((%%))
AAvveerraaggee ffrroomm aa ggrroouupp ooff
pprrooffeessssiioonnaall eexxppeerrtt eevvaalluuaattoorrss
((%%))
PP IInntteerr--rraatteerr rreelliiaabbiilliittyy
Thin 0 (0%) 1 (0%) 0%
Average 38 (43%) 34 (38%) 41%
UUpp pp
ee rr aa
rr mm ss
ii zzee
Full 51 (57%) 54 (61%) 59%
0.0001* 0.86
Large - - 38 (43%)
Moderate - - 30 (33%)
TT hhii gg
hh bb uu
ll ggee
Flat - - 21 (24%)
Three expert evaluators
Normal - - 52 (58%)
Squared 22 (25%)
SS hh oo
uu lldd ee
rr ss ss
hh aapp ee
Sloped - - 15 (17%)
Three expert evaluators
*Statistically significant (p ≤ 0.05); (-) not applicable
Table 5.13 indicates that the majority (59%) of the participants had full biceps/upper arms,
while participants with moderate/average biceps/top arm were 41%. No participants had thin
upper arms. The inter-rater reliability for the evaluations was good, as indicated by a Kappa
statistic of 0.86. Statistically there was significant (p > 0.0001) agreement between the two
evaluators. This implies that Kenya’s career women are likely to encounter tight fit problems
around the biceps region. Concerning the thigh bulge, it is clear that the largest group (43%) of the participants had
large thigh bulges, while 33% participants appeared to have moderate thigh bulges. Only
24% of the participants had flat thighs. Large thigh bulges in combination with large buttocks
would exaggerate fit problems around the hip and crotch line of apparel. Regarding the

163
shoulder shape, the majority (58%) of the participants had normal shoulder shapes. Only
25% and 17% had squared and sloped shoulders respectively. These results suggest that
Kenya’s career women are likely to encounter minimal shoulder fit problems.
5.3.6 Body shape form (variable 14 on the body shape assessment scale)
Body shape form has been seen as a solution to the fit problems of ready-made apparel
(Simmons, Istook & Devarajan, 2004a; Simmons, Istook & Devarajan, 2004b; Connell et al.,
2006). On the body shape assessment scale, the last question required a holistic (profile and
silhouette) description of the body shape and possibly a category within the five prevalent
types (hourglass, rectangle, triangle, apple and inverted triangle) to be assigned to each
shape evaluated. The inter-rater reliability from the two expert evaluators for this variable
was a Kappa statistic of 0.42 – below the 0.75 cut-off point. Therefore it was subjected to a
group of professionals’ expert evaluations. The results are presented in Table 5.14.
TABLE 5.14: PERCENTAGE DISTRIBUTIONS OF BODY SHAPE CATEGORIES (n = 89)
BBooddyy sshhaappee ccaatteeggoorriieess FFrreeqquueennccyy PPeerrcceennttaaggee ((%%))
Rectangular/straight 62 70%
Pear / triangle 12 13%
Hourglass 8 9%
Barrel / inverted triangle 3 3.5%
Apple 4 4.5%
It is clear from Table 5.14 that the majority (70%) of participants appeared to have a
rectangular body shape, while participants who appeared to have a pear body shape were
13%. The rest of the body shapes were hardly represented. The predominant body shape
that emerged from the evaluations was the rectangular body shape. Although the
pear/triangle body shape was less represented in this study, it emerged as the second most
distinctive body shape. Considering that ready-made apparel designs are based on the
hourglass body shape, Kenya’s career women with their rectangular shape are therefore
likely to encounter fit problems.

164
5.4 DESCRIBING ASSOCIATIONS BETWEEN THE DISTINCTIVE SHAPES EMERGING FROM BODY DIMENSIONS AND THOSE EMERGING FROM THE PHOTOGRAPHS OF THE CAREER WOMEN (OBJECTIVE 1 (SUB-OBJECTIVE 3))
Figure 5.5 represents the results of the comparisons of the distinctive body shapes obtained
from the body dimensions and those obtained from the photographs, calculated as
percentages.
0
20
40
60
80
Perc
enta
ge (%
)
Emerging body shapes
Shape from measurements (n =123)
74 21.5 1.5 1.5 1.5
Shape from photographs (n =89)
70 13 9 4.5 3.5
Rectangle
Triangle Hourglass
Apple Inverted triangle
FIGURE 5.5: EMERGING BODY SHAPES FROM THE DIMENSIONS AND EVALUATIONS
Figure 5.5 above indicates that the rectangular body shape was the most distinct body
shape emerging from both the dimensions (74%) and the evaluations of the photographs
(70%). The second most distinct body shape emerging from both the dimensions (21.5%)
and the evaluations of the photographs (13%) was the triangle body shape – although the
percentage representation differs. The rest of the body shapes were least represented.
5.4.1 Comparing the characteristics of the distinctive body shape emerging from the body dimensions and from the evaluations of the photographs
Considering that body dimensions are one-dimensional elements, it would not be possible to
isolate contours and precisely locate the positions of body characteristics such as buttocks
and bust contours along circumferential dimensions. Images taken from different angles
facilitate comprehensive scrutiny on the size/depth of any contours and any outlines that
appear on the body. It is therefore possible to segregate body characteristics with the use of
two body shape identification techniques, namely using body dimensions and evaluations of
165
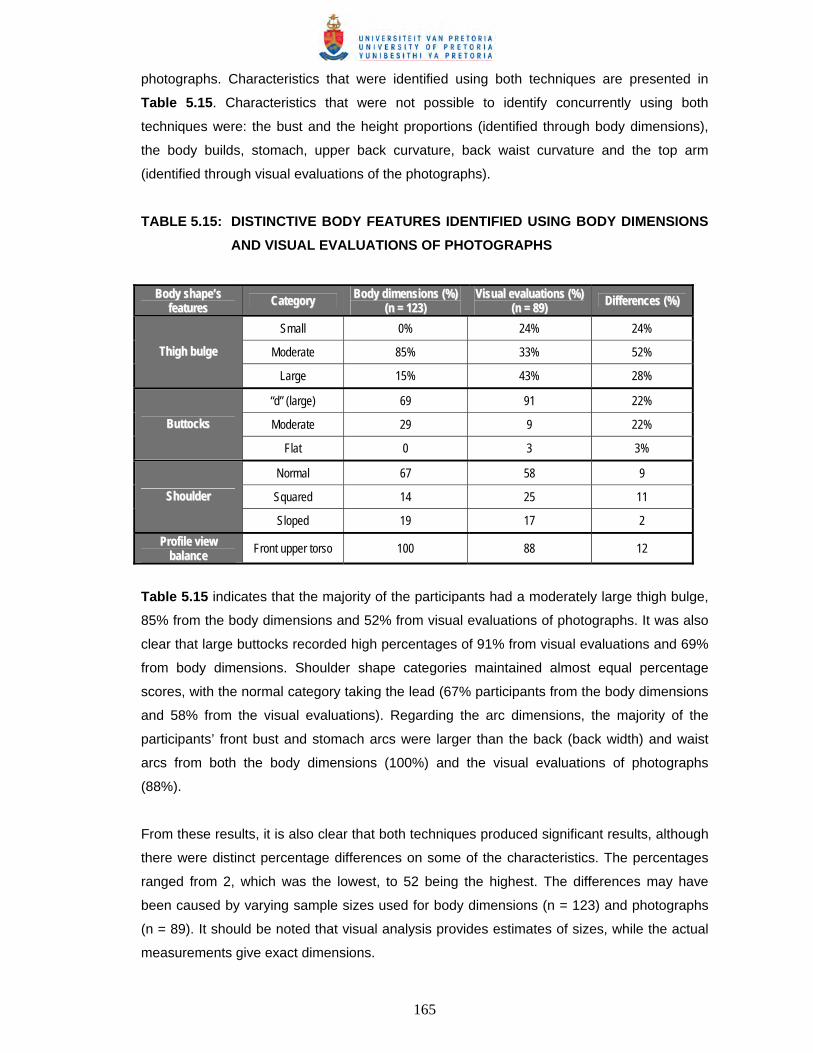
photographs. Characteristics that were identified using both techniques are presented in
Table 5.15. Characteristics that were not possible to identify concurrently using both
techniques were: the bust and the height proportions (identified through body dimensions),
the body builds, stomach, upper back curvature, back waist curvature and the top arm
(identified through visual evaluations of the photographs).
TABLE 5.15: DISTINCTIVE BODY FEATURES IDENTIFIED USING BODY DIMENSIONS
AND VISUAL EVALUATIONS OF PHOTOGRAPHS
BBooddyy sshhaappee’’ss ffeeaattuurreess CCaatteeggoorryy BBooddyy ddiimmeennssiioonnss ((%%))
((nn == 112233)) VViissuuaall eevvaalluuaattiioonnss ((%%))
((nn == 8899)) DDiiffffeerreenncceess ((%%))
Small 0% 24% 24%
Moderate 85% 33% 52% TThhiigghh bbuullggee
Large 15% 43% 28%
“d” (large) 69 91 22%
Moderate 29 9 22% BBuuttttoocckkss
Flat 0 3 3%
Normal 67 58 9
Squared 14 25 11 SShhoouullddeerr
Sloped 19 17 2
PPrrooffiillee vviieeww bbaallaannccee
Front upper torso 100 88 12
Table 5.15 indicates that the majority of the participants had a moderately large thigh bulge,
85% from the body dimensions and 52% from visual evaluations of photographs. It was also
clear that large buttocks recorded high percentages of 91% from visual evaluations and 69%
from body dimensions. Shoulder shape categories maintained almost equal percentage
scores, with the normal category taking the lead (67% participants from the body dimensions
and 58% from the visual evaluations). Regarding the arc dimensions, the majority of the
participants’ front bust and stomach arcs were larger than the back (back width) and waist
arcs from both the body dimensions (100%) and the visual evaluations of photographs
(88%).
From these results, it is also clear that both techniques produced significant results, although
there were distinct percentage differences on some of the characteristics. The percentages
ranged from 2, which was the lowest, to 52 being the highest. The differences may have
been caused by varying sample sizes used for body dimensions (n = 123) and photographs
(n = 89). It should be noted that visual analysis provides estimates of sizes, while the actual
measurements give exact dimensions.

166
5.4.2 Summary on the identification of body shapes through body dimensions as well as evaluation of photographs
The study demonstrated that the prevalent body shape that emerged from the body
dimensions and evaluation of the photographs was the rectangular body shape, which is
typified by medium height, large buttocks, large thighs and large stomachs appearing like the
letter “D”. It is further characterised by a rounded upper back and a hollow back waist
(lordosis curve) – making the shape appear imbalanced from the side view (Figure 5.10).
However, more of the mature females appeared larger (Figure 5.3), with protruding
stomachs (“D”), and a moderately rounded upper back (Figure 5.4). The majority of the
younger females appeared smaller, with fully rounded upper backs and half of them had “D”-
shaped stomachs, while the other half had “b”-shaped stomachs (Figures 5.3 and 5.4).
The results from both the body dimensions and the evaluations of the photographs further
demonstrate that both techniques when combined yield even better results which can
address apparel fit problems more closely. However, it is almost impossible to identify all the
body shape characteristics using one method only. Considering that body scan technology is
not popular in developing countries due to its cost and the technology involved (Xu et al.,
2002; Ashdown & Dunne, 2006), it may be reasoned that in the meantime, both the body
shape identification techniques (from the dimensions as well as visual evaluations of
photographs) could be used simultaneously to produce reasonably reliable results.
5.5 DISTINGUISHING AND DESCRIBING DIFFERENCES BETWEEN THE EMERGING DISTINCTIVE BODY SHAPES (FROM DIMENSIONS AND PHOTOGRAPHS) AND THE WESTERN DISTINCTIVE BODY SHAPE (PRIMARY OBJECTIVE 2)
The rectangular body shape is the prevalent female body shape among Kenyan career
women. This finding is consistent with Istook’s (2005) study in the United States of America.
Figures 5.6, 5.7, 5.8, 5.9 and 5.10 compare the body shapes that emerged from this study
with similar data from the USA. It should be noted that this study used only three basic
dimensions (bust, waist and hips) for defining body shape, while the FFIT© software used by
Devarajan and Istook (2004) to classify America’s female shapes, used six dimensions (bust,
waist, hips, high hip, abdomen and stomach). Based on the differences in classification
techniques applied in the two studies and the different sample sizes, it would be unrealistic to
make any conclusive comparisons.

167
FIGURE 5.6: COMPARISON OF DISTINCTIVE FEMALE BODY SHAPES IN KENYA AND THE UNITED STATES OF AMERICA
True Hourglass Bottom hourglass Triangle Rectangle Spoon Apple
FIGURE 5.7: AMERICA’S BODY SHAPES (Simmons, Istook and Devarajan, 2004b)
The results of this study (Figure 5.6) show that the rectangular body shape is the strikingly
distinctive body shape found in both America and Kenya. In contrast, the triangle body shape
is the second most common body shape occurring in Kenya’s career women, while
America’s second most distinctive body shape is the spoon shape, which did not feature at
all in this study.
0
10
20
30
40
50
60
70
80
Per
cent
age
(%)
Kenya's versus USA female body shapes
Kenya (n = 123) 74 21.5 1.5 1.5 1.5
USA (n =6,300) 46 2 8 0 14 21 5 4
Rectangle Triangle Hourglass AppleInverted triangle
SpoonTop
hourglassBottom
hourglass

168
Hourglass Triangle Rectangle Inverted triangle Apple
FIGURE 5.8: KENYA’S BODY SHAPES (Source: Present study)
The Western rectangular body shape, according to Rasband and Liechty (2006:25), has a
strong ribcage and upper hip tapering a little towards the waist, or sometimes not tapering at
all. The shoulder width appears similar to the hip measurement, with very little waist
indentation. Waist circumference measures 9 inches (23 cm) less than the hip or bust
circumference (Shin & Istook, 2007), the bust is small and there is no thigh bulge. The side
view characteristics mentioned are the large stomach and a more flat back curvature: right
from the upper back to the buttocks appears like the apple body shape’s profile (Figure 5.9).
Rasband and Liechty report that once a rectangular shape attains more weight, it results in
an apple shape (Rasband & Liechty, 2006:25-26).
FIGURE 5.9: SIDE VIEW CHARACTERISTICS OF AN APPLE SHAPE ASSUMED TO BE AN APPROXIMATE REPRESENTATION OF THE SIDE VIEW CHARACTERISTICS OF THE RECTANGULAR BODY SHAPE (Source: Simmons, Istook & Devarajan, 2004b)

169
In this study (Figure 5.10), the emerging rectangular front view shape is characterised by a
shoulder width that is similar to the width of the hips, and a small waist indentation of less
than 9 inches (23 cm). The thighs on the side bulge out beyond the hip width and are full at
the inside (crotch), in contrast to the Western body shape. A rounded upper back
characterises the profile view, with more roundness concentrated just below the shoulder line
and the chest. The back curvature tapers narrowly towards the waistline and abruptly meets
the full buttock contour, resulting in a deep hollow waist region (lordosis curve). The front
side of the profile view is characterised by a high abdominal contour that begins to protrude
just below the bust line. It begins to curve round almost instantly, and increases as it leads
down to the crotch at the centre of the body, resulting in a “D” appearance. A brief
description of this kind of body shape would be a curvy, rectangular female body shape.
Front view Profile view
FIGURE 5.10: CURVY RECTANGULAR BODY SHAPE
The second most prevalent shape in this study (Figure 5.11) is the triangular body shape,
which differs from the second most prevalent spoon body shape of America. As mentioned
earlier, it would be unrealistic to make conclusive comparisons because of the different sizes
of population samples, techniques used to obtain body dimensions and methods of
identifying body shapes by the two studies.

170
Front view Profile view
FIGURE 5.11: CURVY TRIANGULAR BODY SHAPE
Although the triangular body shape was less (21.5%) represented in this study (Figure 5.11),
the emerging triangular front view shape is characterised by narrow shoulders and hips. The
shoulder, bust width and waistline region appear to be similar in width. The body immediately
curves outward from the waistline downward to the hip line and further to the thigh region.
The thighs on the side bulge out beyond the hip width and are full at the inside. A rounded
upper back characterises the profile view, with more roundness concentrated just below the
shoulder line and the chest. The back curvature tapers down narrowly towards the waistline
and abruptly meets the full buttock contour, resulting in a deep hollow waist region (lordosis
curve). The front profile view is characterised by a low abdominal contour that begins to
protrude just below the waistline, curving round instantly and increasing as it leads down to
the crotch at the centre of the body. A brief description of this kind of body shape would be a
curvy, triangular female body shape.
5.6 SCRUTINISING AND DESCRIBING FIT IMPLICATIONS ASSOCIATED WITH THE EMERGING DISTINCTIVE RECTANGULAR BODY SHAPE OF CAREER WOMEN (PRIMARY OBJECTIVE 3)
Ready-made apparel items are designed based on the Western hourglass body shape that is
viewed as the ideal shape (Ashdown & Dunne, 2006; Shin & Istook, 2007). Most sizing
systems used in developing countries are just adaptations of the Western sizing systems
(Zwane & Magagula, 2006). The latest anthropometric data collected in the USA (2003) as
well as the United Kingdom has not been analysed and implemented by apparel industries
as sizing systems (Devarajan & Istook, 2004; Newcomb & Istook, 2004b; Simmons, Istook &

171
Devarajan, 2004a; Istook, 2005). This then calls attention to the Western sizing systems that
are currently in use to facilitate comprehensive comparisons with the findings of this study.
Newcomb and Istook (2004a) confirmed that junior and misses standards were based on the
hourglass body shape, which is viewed as an ideal shape – a phenomenon that is supported
by various studies (Zwane & Magagula, 2006; Pisut & Connell, 2007). Therefore, it is
appropriate that the rectangular body shape found to be prevalent in this study, be compared
to the hourglass body shape (fit model) in order to facilitate a deeper understanding of the fit
problems experienced by Kenya’s career women.
5.6.1 Fit implications for apparel associated with the curvy female rectangular body shape
The study revealed that critical fit points of the distinct rectangular body shape of the career
women in Kenya deviate from the fit points of the well-proportioned fit model’s
characteristics. The varied critical fit points common to the distinct body shape of this study,
are the large buttocks, the thighs, the curvy back profile shape, the large stomach,
unproportional key height points (bust, waist, hip and knee) and the large, low bust. The fit
implications of these critical fit points associated with the rectangular distinctive body shape
of this study are discussed below.
5.6.1.1 Fit implications associated with the size of the buttocks/derriere and the thighs
The buttocks and thighs are situated around the hip region and therefore influence the
circumferential dimensions around the hipline. These may have similar or closely related fit
implications for the apparel. Although the hipline (trochanterion) was positioned above the
normal hipline (½ height) for most participants (Table 5.5), nonetheless, it is a typical
characteristic of a Western rectangular shape. The broadest hip position (thigh bulge)
situated at approximately 10 cm below the normal hipline, could possibly affect the fit of an
apparel item more than the high hip position.
The buttocks/derriere: The findings of this study indicated that there were 91% and 69% of
the participants with large buttocks according to visual evaluations and body dimensions,
respectively. This suggests that the majority of the participants are likely to experience tight
fit problems around the hip region and the crotch line. Over-sized buttocks that curve
outwards more than the ideal shape’s buttocks, can cause fit problems around the buttocks,
hip and crotch lines. The fabric width, and the length or the curved shaping in an apparel
item may not be sufficient enough to accommodate the fullness of the buttocks comfortably
and attractively. The fabric is likely to be strained and pulled tight across the buttocks,

172
causing the side seam to bow backward at the hipline level, while the skirt hemline is likely to
pull up at the back and hang down longer at the front. The shallow area above the buttocks
may cause excess fabric to form layers of folds as the apparel item rides up (Rasband,
1994:134-135; Rasband & Liechty, 2006:314, 324, 336). This may result in tight diagonal
ripples forming towards the buttock curve on skirts, and towards the crotch on pants. The
waistband may be pulled down at the back for pants, and may generally affect the length of
the skirt.
The bulging thighs: In this study there were 76% career women with large thighs, as judged
from the visual evaluations. This suggests that the heavy thighs (inside and outside) could
have fit implications due to the size and position in comparison with the ideal shape’s size
and position. Heavy/bulging thighs positioned lower than the normal position of the ideal
shape will affect the way that pants and skirts fit. There will be less fabric width to go round
the thighs, leading to tight horizontal ripples or folds forming round the upper thigh just below
the hipline. There will be horizontal ripples radiating from the crotch line towards the outside
thigh and the fabric may “cup” under the thighs and the buttocks. Skirts’ hemlines will tend to
pull on the sides (Rasband & Liechty, 2006: 340).
All the participants’ knee height positions were above the normal position (¼ height) of the
ideal figure (Table 5.5). Although there is a disparity with the ideal shape’s height
proportions, fit problems are unlikely to occur but may only affect style line position (shaping).
5.6.1.2 Fit implications associated with the large stomach size
The study indicated that the majority (70%) of the Kenyan career women had a high
abdomen, appearing like the letter “D” from the visual evaluations. This suggests that the
stomach protrusion exceeds the shape of the ideal shape. Apparel made on the basis of the
ideal shape’s proportions will therefore have less fabric length and width or even insufficient
curved shaping to fit comfortably and nicely over the abdomen. In skirts and dresses, tight
horizontal folds are likely to form above the abdomen as the apparel item rides up. The side
seams will tend to bow forward between the hip and the waist, while angled ripples may also
form towards the stomach curve. With fitted skirts or dresses, the hemline may be pulled up
in front, causing a “poke out” at the centre. On pants, wrinkles may form between the crotch
and abdomen. The crotch seam is likely to be pulled up uncomfortably and to cut tightly
through the body (Rasband & Liechty, 2006:206, 296, 304; Reader’s Digest, 2002:53).
Most (84%) of the participants’ waist height positions were above the normal position (⅝
height) (Table 5.5). A dress made on the basis of the ideal shape’s height proportions is

173
likely to fit tightly at the midriff region, as style lines and darts positions would not be in
harmony with the shape underneath the dress.
5.6.1.3 Fit implications associated with the large bust
In this study, there were 81% participants with large busts and 60% with cup “DD” and above
brassieres’ categories. This indicates that the majority of Kenya’s career women have a large
bust, which implies that they are likely to experience fit problems with apparel designs that
have been based on the ideal shape. According to Rasband and Liechty (2006:194), the
ideal shape’s bust cup is “B”, and the participants’ bust sizes (DD) as observed in this study
were much larger than the ideal shape’s size. An apparel item based on the ideal shape’s
cup size “B” would therefore contain too little fabric and curved shaping to accommodate the
larger bust. This may result in wrinkles forming around the bust line between the armhole
and the bust tip, or radiating from the bust tip to the armhole and the waist. The bodice side
seam may bow forward, while the waistline may pull up at the centre front (Rasband,
1994:86; Rasband & Liechty, 2006:194, 198).
The bust line height positions of all the participants were below the normal position (¾
height) (Table 5.5). A dress made on the basis of the ideal shape’s height proportions will
likely fit tightly at the armhole region and the bust region, as the positions of the darts and
style lines would not be in harmony with the positions of the bust lines and breasts of the
wearer. It should be noted that no tolerance allowances were given above or below the
standards used. If tolerance allowances were given, fewer fit problems would be predicted,
as more shapes would be accommodated within the allowed tolerances.
5.6.1.4 Fit implications associated with the rounded upper back, the hollow back waist and the imbalanced back and front features
The results of this study showed that 79% and 75% of the sample of Kenyan career women
had a fully rounded upper back and a deep hollow back waist, respectively. This suggests
that the majority of the participants are likely to experience fit problems with ready-made
apparel designed on the basis of the ideal shape. The entire back curvature would affect the
fit of an apparel item if the body shape differs from the back curvature of the ideal shape.
The rounded upper back: The upper back part of the body shape curves outward more
than the ideal shape does. Apparel items designed for the ideal shape will therefore have too
little fabric for the length or for the curved shaping in the upper back area to contain the
fullness. Consequently, the apparel may pull tight in the upper back area; diagonal wrinkles

174
may also form between the neck and armhole, while the waist at the centre back may pull
upwards.
The hollow waist: The back curvature tapers sharply to a hollow section at the waist region
– more than for the ideal shape. Apparel items meant for the ideal shape will therefore have
excess fabric length and curved shaping in the lower back waist area. The apparel is
therefore likely to sag, forming vertical folds just below the shoulder blades region (Readers’
Digest, 2002:50; Rasband & Liechty, 2006:154).
Balanced postures: This refers to the alignment of the different parts of the body and the
manner in which the frame is carried (Liechty et al., 1992:37). A correct posture assumes a
balanced alignment of all the body parts over each other and could influence the physical
attractiveness of apparel items (Rasband, 1994:13). Excessively incorrect posture or non-
proportional body characteristics could be termed as a figure variation as it would cause fit
problems (Rasband & Liechty, 2006:29). It was observed in this study that the career
women’s front upper torsos (profile view) were larger than the back upper torso. This means
that the side seams of the ready-made apparel are likely to pull forward to accommodate the
excess fullness at the front. The lower torso from the hipline is imbalanced with all the
participants’ back arc being larger than the front. This implies that the apparel item’s side
seam is likely to pull towards the back to contain the extra width at the lower back.
5.6.1.5 Fit implications associated with the large top arm
The findings of this study demonstrated that the majority of the Kenyan career women in the
sample had large top arms as identified by the visual analysis. This suggests that the
majority of the career women are likely to experience fit problems with the sleeves of ready-
made apparel items. The top arm muscle of these women is larger or carries more weight
than the top arm of the ideal shape. This means that sleeves may not contain adequate
fabric to fit comfortably and attractively around the biceps region, resulting in horizontal
ripples or wrinkles forming around the upper part of the arm. The front and back armhole
may pull towards the arm, while a short sleeve hemline may tend to poke out in the middle
(Rasband, 1994:106-108).
175
5.7 CONCLUSIONS REGARDING FIT IMPLICATIONS ASSOCIATED WITH THE CURVY RECTANGULAR BODY SHAPE
Considering that ready-made apparel items are designed based on the ideal (hourglass)
body shape (Loker et al., 2005; Zwane & Magagula, 2006; Shin & Istook, 2007), career
women in Kenya with the rectangular body shape are likely to be dissatisfied with the fit of
ready-made apparel. This is because their body shapes differ not only from the Western
ideal shape, but also from the Western rectangular shape. The following fit problems may be
expected to be experienced by a woman with a curvy rectangular shape:
Tight fit at the hip region, crotch line and thighs, which may lead to wrinkles and ripples
forming around the affected area. The apparel item could tend to poke out at either
center back or front due to the tight fit.
Tight fit at the waistline that could lead to wrinkles on the waist region, apparel riding
up, and inappropriate style and dart positions due to a waistline that is higher than
normal (⅝ height) or larger than average. Apparel items such as blouses and jackets
are likely to sag loosely, forming vertical folds at the back waist region due to the
hollow waistline
Tight bust line, tight armhole and tight pull in the upper back area, which could result in
diagonal wrinkles forming between the neck and armhole region (bust region and
shoulder blades) due to the large bust, rounded upper back and lower bust line
position than the normal (¾ height) position.
Tight upper arm could result in apparel with horizontal ripples or wrinkles forming
around the upper part of the sleeve.
The knee height position above the normal height position (¼ height) may result in
pants’ style lines (shaping) being inappropriately positioned, and apparel could be tight
around the knee region.
Having looked at the critical fit points and scrutinised the fit implications associated with the
curvy rectangular shape, it has become clear that it would be unrealistic for apparel
industries to continue manufacturing styles that are suitable for the hourglass body shape (fit
model), and expect to fit the curvy rectangular shape appropriately. The quality of apparel in
respect of its fit can only be determined collectively, through dress forms, fit models and
sizing systems, which all have to represent the target population’s sizes and body shapes
(Salusso-Deonier, 1989; Ashdown, Loker & Adelson, 2004; Bougourd in Ashdown, 2007:130,
133).

176
Data analysis and discussion of the findings based on phase two (questionnaire) data, are
presented in Chapter 6.

177
Chapter 6 DATA ANALYSIS AND DISCUSSION OF THE FINDINGS BASED ON PHASE TWO DATA
(QUESTIONNAIRE) 6.1 INTRODUCTION
The focus of this chapter is the statistical analyses of data, interpretation of the results and
the discussion of the findings obtained from evaluating primary objectives 4, 5 and 6 of this
study. In presenting the results, interpretations and discussion of the findings, this chapter
attempts to direct the attention to the stated research objectives and the concomitant sub-
objectives, where applicable.
6.2 DEMOGRAPHIC ANALYSIS OF THE POPULATION (Questions 1 and 2)
The analysis of the demographics of the population served as background for the
examination and interpretation of the findings. The demographic information gathered from a
group of career women in Kenya consisted of their ages and professional backgrounds, as
presented below. These women were questioned about their perception of general fit
problems with ready-made apparel, their knowledge about the communication of size (key
dimensions) and fit (body shapes), and their preferences for differently fitted jackets and
skirts in Kenya.
6.2.1 Age distribution (Question 1)
There were 201 respondents who completed the questionnaire. Their ages were categorised
into three groups, namely: young adults aged between 25 and 32 years, a middle group aged
between 33 and 40 years, and a mature group aged 41 years and above. The middle-aged
(33-40) group had the highest representation (43%), while the young adult group (25-32)
represented 33%. The mature (41+) group had the lowest representation (24%). The majority
of the respondents were middle-aged women, and therefore likely to be more aware of the
dynamics of fashion and more familiar with and critical about the fit of apparel items.

178
6.2.2 Career women’s professional background in Home Science and/or Clothing and Textiles (Question 2)
The data on the career women’s professional backgrounds in the fields of Home Science
and/or Clothing and Textiles, which are thought to adequately equip individuals with skills in
size and fit issues, indicates a balanced distribution between the numbers of respondents.
There were 54% (n =107) with professional backgrounds in Home Science and/or Clothing
and Textiles, and 46% (n = 91) without a professional background in Home Science and/or
Clothing and Textiles. The assumption made here is that respondents with a professional
background in Home Science and/or Clothing and Textiles would be more knowledgeable in
size and fit issues and therefore more likely to experience fewer fit problems, as opposed to
the respondents without a professional background in Home Science and/or Clothing and
Textiles. It was also assumed that respondents without a professional background in Home
Science and/or Clothing and Textiles were uninformed about size and fit issues and so more
likely to encounter problems while making apparel selection in terms of styles and sizes.
6.3 ANALYSIS AND INTERPRETATION OF THE RESEARCH OBJECTIVES 4, 5 AND
6 Note: Primary objectives 1, 2 and 3 were presented and discussed in Chapter 5. Therefore
the order of the objectives in this chapter will not necessarily be in line with their sequence in
the chapter. Considering that this chapter deals with Objectives 4, 5 and 6 only, they are
presented in the order in which they occur throughout this study.
6.3.1 Primary objective 4: To assess and describe career women’s self-perceived fit issues with the ready-made apparel in Kenya (Questions 3, 4)
6.3.1.1 Sub-objective 4.1: To investigate career women’s perception of fit with different
apparel categories that are sold in various retail stores in Kenya (Question 3
and 4)
Questions 3 and 4 measured career women’s perception of fit with the ready-made apparel
from different sources and the ready-made apparel sold through different retail stores. The
investigation was to highlight which ready-made apparel categories were perceived to have
major fit problems, and to pinpoint which retail stores were perceived to sell apparel with
good fit. The results analysed are presented in Figures 6.1 and 6.2 below.

179
010
2030
40
5060
70
80
Perc
enta
ge (%
)
Fit quality of apparel categories
Good fit 78 72 65 30
Fair fit 20 24 31 44
Poor fit 2 4 4 26
Imported (n = 197)
Custom-made (n = 199)
Second-hand (n =194) Local (n = 195)
FIGURE 6.1: QUALITY OF APPAREL CATEGORIES
In Figure 6.1 above it is clear that the imported, custom-made and second-hand apparel
categories are perceived to have the best fit, as indicated by 78%, 72%, and 65% responses,
respectively. Responses concerning good fit in the local ready-made apparel category
counted for 30%, which is far below the imported custom-made and imported second-hand
categories. On fair fit of the ready-made apparel, imported new scored 20%, custom-made
24%, imported second-hand 31%, while the majority (44%) of the respondents maintained a
fair fit view on local ready-made apparel. The majority (26%) of the respondents reported that
the local ready-made apparel category had poor fit, which is a sharp contrast to the imported
new with a score of 2%, and the custom-made and imported second-hand with responses of
4% each. These results imply that Kenya’s career women perceive imported new, custom-
made and imported second-hand ready-made apparel categories as having better fit than the
local ready-made apparel.
The results regarding apparel categories that are sold in various retail stores (Figure 6.2),
indicate that apparel sold in the boutiques, chain stores and second-hand stores had good fit,
as reflected by 84%, 70% and 66% responses respectively. Apparel sold in market stalls
recorded responses of 52%, trade fairs 47%, supermarkets 46%, and factory outlets with the
lowest 22%. Regarding fair fit, factory outlets and supermarkets scored 46% and 42%
responses, respectively, while market stalls recorded 36%, trade fairs 33% and second-hand
stores 29%. Boutiques and chain stores had responses of 15% and 11% respectively.

180
0
1 0
2 0
3 0
4 0
5 0
6 0
7 0
8 0
9 0
1 0 0
Per
cen
tag
e (%
)
F it o f a ppa r e l sold in d if fe r e nt r e ta il stor e s
unde cide d 0 .5 1 9 1 6 1 8 3 2 0Poor f it 0 .5 0 4 6 2 9 1 2Fa ir f it 1 5 1 1 2 9 3 6 3 3 4 2 4 6Good f it 8 4 7 0 6 6 5 2 4 7 4 6 2 2
Bout ique Cha in Se cond Ma r k e t Tr a de Supe r Fa ctor y
Boutiques (n = 196), Chain = Chain stores (n = 180), Second = Second-hand stores (n = 193), Market = Market stalls (n = 190), Trade = Trade fairs (n = 184), Super = Supermarkets (n = 198), Factory = Factory outlets (n = 173)
FIGURE 6.2: FIT QUALITY OF READY-MADE APPAREL SOLD AT DIFFERENT RETAIL
STORES
As for poor fit, Figure 6.2 further show that factory outlets had 12%, supermarkets 9%, and
the rest of the retail stores had responses of between 2% and 6% each. The inference is
that, according to Kenya’s career women, factory outlets sell ready-made apparel with poor
fit, while boutiques, chain stores and second-hand stores sell apparel items with good fit.
6.3.1.2 Sub-objective 4.2: To describe fit problems that career women in Kenya
encounter regarding the specific critical fit points of different parts of their bodies (Question 22)
Question 22 solicited career women’s responses on how they experience fit problems at their
critical fit points. For the purposes of data management and presentation, the body was split
into the upper and the lower torso and the arms. Tables 6.1, 6.2 and 6.3 present the fit
problems encountered at the upper and lower torso and the arms.
Form Table 6.1, it is clear that Kenya’s career women experienced fit problems (too tight or
too loose) – as indicated by percentage responses that range from 58% to 65% – on all the
critical fit points of the upper torso. Regarding problems of tight fit, the bust region had the
highest number of reports, with 37% of the responses. As far as problems of loose fit are

181
concerned, the neckline region had the highest number of responses (43%). For the
problems of length, the highest (41%) number of responses were reports of
normal/acceptable fit.
TABLE 6.1: FIT PROBLEMS ENCOUNTERED AT THE UPPER PART OF THE TORSO
FFiitt PPooiinntt FFiitt pprroobblleemm FFrreeqquueennccyy PPeerrcceennttaaggee
Tight 29 15
Loose Fit problems
87 43 58
Neckline
Normal/acceptable 85 42
Tight 50 25 Loose
Fit problems 71 35
60 Shoulders
Normal/acceptable 80 40
Tight 53 27
Loose Fit problems
69 34 61
Back width
Normal/acceptable 79 39
Tight 75 37
Loose Fit problems
56 28 65
Bust
Normal/acceptable 70 35
Short 64 32
Long Fit problems
54 27 59 Bodice back, nape to
waist Normal/acceptable 83 41
Short 60 30
Long Fit problems
58 29 59 Bodice front, neck to
waist Normal/acceptable 83 41
The inference that may be drawn from the results presented in Table 6.1, here is that most
Kenyan career women experienced fit problems with the widths of ready-made apparel, that
were reported as either too tight or too loose. On average, 61% of the Kenyan career women
reported problems with fit, which is more than the 39% that reported acceptable fit. However,
loose fit problems reported at the upper torso particularly around the back width, shoulders
and neckline, indicate that most of the participants’ upper body’s characteristics deviate from
what the industry use as a base pattern. This confirms the critical fit points of the curvy
rectangular body shape’s upper torso observed in Chapter 5 (paragraph 5.6). Common
body characteristics that could accelerate fit problems within the upper torso of the curvy
rectangular shape include the rounded upper back, the large bust, and the large and high
stomach that is positioned above the ideal figure’s normal waist position.
The lower torso’s critical fit points (Table 6.2) were more prominent than those of the upper
torso. This could have contributed to fewer respondents (26%) reporting problems with tight
fit than those (35%) reporting problems of loose fit with the upper torso’s critical fit points. As
in the case of the stated width fit problems, it is also obvious that more Kenyan career

182
women (59%) encountered problems with length (too short or too long), than those who felt
that the lengths were acceptable (fine). As observed in Chapter 5 (paragraph 5.2), the
majority of the respondents (74%) were in the medium height category, and the majority
(84%) had waist lines positioned higher than the ideal figure’s normal waist position (⅝
height) (Table 5.5). These could have contributed to the more (41%) responses of
acceptable length than the reported shorter (31%) or longer (28%) length fitting problems.
TABLE 6.2: FIT PROBLEMS ENCOUNTERED AT THE LOWER TORSO
FFiitt PPooiinntt FFiitt pprroobblleemm FFrreeqquueennccyy PPeerrcceennttaaggee
Tight 60 30
Loose Fit problems
89 44 74 Waist
Normal/acceptable 52 26
Tight 87 43
Loose Fit problems
46 23 66 Stomach
Normal/acceptable 68 34
Tight 109 54
Loose Fit problems
49 25 79 Hip
Normal/acceptable 43 21
Tight 78 39
Loose Fit problems
42 21 60 Crotch
Normal/acceptable 81 40
Tight 86 43
Loose Fit problems
49 24 67 Buttocks
Normal/acceptable 66 33
Tight 87 43
Loose Fit problems
46 23 66 Thighs
Normal/acceptable 68 34
Short 60 30
Long Fit problems
62 31 61 Skirt length
Normal/acceptable 79 39
Short 55 28
Long Fit problems
71 35 63 Pants Length
Normal/acceptable 75 37
In Table 6.2 above it is clear that Kenyan career women experience more (67%) fit problems
(tight or loose fit) on average, at the lower torso, than acceptable fit (33%). As for problems
with tight fit at the lower torso, the hip region had the highest number of responses (54%),
followed by the stomach and thigh regions, with equal (43%) responses each. The waist
region scored the highest (44%) number of responses for problems with loose fit. For length
problems, there were almost equal representations on the reported longer skirts and pants’
lengths (31% and 35%) and the reported shorter skirts and pants’ lengths (30% and 28%),
which may imply that Kenya’s career women experienced fewer fit problems with length.

183
As in the case of the upper torso, it is also clear that more (69%) Kenyan career women
experience fit problems at their lower torsos’ critical fit points than are satisfied with a normal
or acceptable fit (31%). It is further confirmed that Kenyan career women experience more
(69%) fit problems with the lower torso’s critical fit points than (61%) they experience at the
upper torso. However, among the reported fit problems, generally Kenyan career women
experienced more tight fit problems with the lower torso (42%) than with their upper torso
(26%). These results confirm the critical fit points of the curvy rectangular body shape’s lower
torso that were observed in Chapter 5 (paragraph 5.6). Common body characteristics that
could accelerate fit problems within the lower torso region of the curvy rectangular shape
include the large buttocks, the large thighs and the large stomach that is positioned above
the ideal figure’s normal waist position. These characteristics were more prominent than the
upper torso’s characteristics, which may further confirm the more tight fit problems reported
at the lower torso than at the upper torso.
It is also apparent that there were more (62%) length problems experienced with the lower
torso than the reported acceptable lengths (38%). However, there were almost equal
representations on the reported short (30%), longer (31%) and acceptable (38%) skirts’ and
pants’ lengths, which may confirm that the majority of the respondents (Table 5.2) were in
the medium height category and therefore they were likely to experience fewer length
problems. Length is also dictated by fashion trends, and thus length preference could vary
with different consumers.
TABLE 6.3: FIT PROBLEMS ENCOUNTERED AT THE ARMS
Fit Point Fit problem Frequency Percentage
Tight 67 33
Loose Fit problems
57 28 61 Armscye
(armhole) Normal/acceptable 77 39
Tight 83 41
Loose Fit problems
50 25 66
Upper arm
Normal/acceptable 68 34
Tight 61 30
Loose Fit problems
49 24 54
Elbow
Normal/acceptable 91 46
Tight 44 22
Loose Fit problems
61 30 52
Below elbow
Normal/acceptable 96 48
Short 65 32
Long Fit problems
59 29 61
Sleeve length
Normal/acceptable 77 39

184
In Table 6.3 it is evident that more Kenyan career women (59%), on average, experience
problems (tight or loose) with the arms’ critical fit points than those who do not experience fit
problems (41%). However, 41% of the Kenyan career women reported experiencing
problems of tight fit at their upper arm, which confirms the findings observed in Chapter 5
(Table 5.13) that the majority (59%) of the respondents had full/large biceps regions. The
Kenyan career women also reported experiencing more (61%) problems with the length of
sleeves than those who expressed satisfaction with acceptable length (39%). This could
possibly be attributed to pattern grading processes in the apparel industry, which assume
that the larger the size, the longer the sleeves (Loker et al., 2005; Schofield in Ashdown,
2007:180-188).
6.3.1.3 Sub-objective 4.3: To describe career women’s degree of satisfaction with the
process of finding appropriate ready-made apparel items in Kenya (Question 21)
Question 21 was used to determine consumers’ satisfaction with the process of finding
apparel that fit well, in terms of the search process, the availability of suitable styles and
appropriate sizes, and the availability of fashionable apparel items in appropriate sizes and
styles for the consumers’ body sizes and shapes. The results are presented in Figure 6.3.
0
10
20
30
40
50
60
Perc
enta
ge (%
)
Consumers' satisfaction with the ready-made apparel (n = 200)
Frequent 56 36 26
Less frequent 35 57 50
Never 7.5 6 21
Undecided 1.5 1 3
Problems getting right sizes Satisfied with fit Latest fashion
available
FIGURE 6.3: CAREER WOMEN’S SATISFACTION WITH THE PROCESS OF FINDING
APPROPRIATE READY-MADE APPAREL The results (Figure 6.3) indicate that 91% (56% - frequent + 35% - less frequently)

185
respondents experienced problems getting the right sizes and styles that fit their shapes and
sizes appropriately. Respondents who reported that the latest fashions were less frequently
available in their sizes were 71% (50% - less frequently available + 21% - never available).
Respondents who were less satisfied with the way most ready-made apparel fit their sizes
and their body shapes were 63% (57% - less frequently satisfied + 6% - never satisfied). This
implies that Kenyan career women were not satisfied with the fit and availability of the latest
fashions. Their dissatisfaction with the fit of ready-made apparel was confirmed by 65% (on
average) reporting fit problems experienced at their bodies’ critical fit points (Tables 6.1 and
6.2). The fit implications associated with the distinct curvy rectangular shape of the Kenyan
career women such as tight fit around the hipline, bust line and stomach region (Chapter 5
(paragraph 5.5 and 5.6), may also confirm career women’s dissatisfaction with the fit of
ready-made apparel.
6.3.1.4 Sub-objective 4.4: To explore career women’s self-perceived sources of fit problems with apparel in Kenya (Question 20)
Question 20 asked whether the career women felt that the apparel industry or their body
shapes were the sources of the fit problems they encountered. The results are presented in
Figure 6.4 below.
0
10
20
30
40
50
60
70
80
90
Perc
enta
ge (%
)
Perceived source of fit problems
Agree 89 78
Disagree 10 22
Undecided 1 0
Apparel industry (n=199) Own body shape (n=200)
FIGURE 6.4: CAREER WOMEN’S PERCEIVED SOURCES OF FIT PROBLEMS

186
As Figure 6.4 shows, respondents chose both the options of the apparel industry and own
body shapes as sources of fit problems. Eighty nine per cent identified the apparel industry,
and 78% identified their own body shapes as the source of fit problems. Statistically, there
were significant (0.002 < 0.05) associations between body shape and the apparel industry as
perceived sources of fit problems. This may suggest a possibility that career women in
Kenya were confused regarding the sources of the fit problems they were experiencing with
apparel.
6.3.2 Primary objective 5: To determine and describe Kenyan career women’s knowledge about the communication of size (key body dimensions) and fit (body shapes)
6.3.2.1 Sub-Objective 5.1: To explore Kenyan career women’s knowledge about the
communication of size (Question 6, 13, 14, 15, 16, 17 and 18)
Familiarity with and perceived effectiveness of the size labels: Question 15 was used to
determine from the career women’s viewpoints, which size labels (size description systems)
among the provided types, were familiar to them, while question 18 attempted to ascertain
career women’s perceptions regarding the effectiveness of size labels. The results in this
regard are presented in Figure 6.5.
01 02 03 04 05 06 07 08 09 0
1 0 0
Per
cen
tag
e (%
)
Size la be l's fa m ilia r ity a nd e f fe ct iv e ne ss ( n = 2 0 1 )
Fa m ilia r la be l 9 8 9 8 .5 9 5 3 5 7 3Non- fa m ilia r 2 1 .5 5 6 5 9 3 9 7Ef fe ct iv e la be ls 4 9 6 0 4 4 9 9 9 9 9 8I ne f fe ct iv e la be ls 5 1 4 0 5 6 1 1 2
XL 8 to 2 4 3 2 to 5 0 Code + Pict + Wor dle ss
XL = Extra large lettered label, 8 to 20 = Numbered size codes, 32 to 50 = Numbered (inches) size codes, Code + = Numbered size code and key dimensions, Pict + = Pictogram and key dimensions, Wordless = wordless pictogram (illustrated body shape) FIGURE 6.5: FAMILIARITY WITH AND PERCEIVED EFFECTIVENESS OF SIZE LABELS

187
It is clear from Figure 6.5 that informative size labels, which comprise a code and
measurements, pictogram and measurements, or the wordless pictogram, were less familiar
size labels to the Kenyan career women, as indicated by 35%, 7% and 3% responses
respectively. However, these informative labels scored 98.5% on average, as effective size
labels. As for the uninformative size labels, comprising numbered (8-24), lettered (S-XL) and
numbered (32-50) labels, they were the most familiar size labels, with 98.5%, 98% and 95%
responses respectively. The uninformative labels on average were ranked as effective by
only 51% responses, which is far lower than the responses on informative size labels.
It appears from the results that familiarity with and perceived effectiveness of size labels are
two separate issues that seem to have no association with each other. There were no
significant (0.21 > 0.05) associations between the women’s familiarity with size label terms
and their knowledge in this regard. This possibly suggests that their familiarity with size
labels did not guarantee appropriate and informed apparel selection, as the size labels’
meanings were not understood by the consumers.
Career women’s knowledge about size labels: Questions 16 and 17 were used to
examine the career women’s knowledge about the size labels used on women’s ready-made
apparel. Respondents were supposed to give a correct interpretation of a given size in terms
of the key dimension it represents in a given apparel item. The results are presented in
Figure 6.6.
0
10
20
30
40
50
60
70
80
90
Perc
enta
ge (%
)
Consumers' knowledge on the meaning of size labels (n = 201)
Answered incorrectly 86.5 76.5 75 75 72 76 77 77
Answered correctly 13.5 23.5 25 25 28 24 23 23
Jackt size 16
Jackt size 42
Jackt size XL
Pant size 16
Pant size 42
Pant size XL
Skirt size 16
Skirt size 42
Jacket = Jacket FIGURE 6.6: CAREER WOMEN’S KNOWLEDGE ABOUT SIZE LABELS

188
The results show that the majority of the respondents described the different size labels that
are used on jackets, pants and skirts, incorrectly. The scores on incorrect descriptions of the
different labels ranged from 72% to 86.5%, while scores on correct description of the size
labels ranged from 13.5% to 28%, which is a sharp contrast. An average of 77% respondents
described different size labels incorrectly. This suggests that Kenya’s career women lack
knowledge about the meaning of size labels.
It was assumed that the older the consumers become, the more experienced and
knowledgeable they become, in terms of size labels and appropriate apparel selection.
Apparently, there was no significant (0.21 > 0.05) association between the different age
groups of the respondents and their knowledge about size labels. It is also likely that
consumers’ long experience with size labels does not necessarily guarantee certain
knowledge about size labels. Ignorant consumers end up getting frustrated and confused as
they flip through several assortments of styles and sizes in a retail environment without any
guiding base, as they do not understand the meaning of the size codes presented to them.
Comparisons were made on the interpretation of the size codes on the size labels between
professionals in Home Science/Clothing and the non-professionals, to establish whether their
level of knowledge differed in this regard. There were significant (0.0136 < 0.05) associations
between the knowledge of the professionals in Home Sciences and the size labels’ contents.
The professional Home Scientists scored higher on correct descriptions of size codes and
size labels’ contents than the non-professionals in Home Science. It seems therefore that
formal information on size and fit can equip learners with knowledge regarding the sizing of
apparel.
Career women’s knowledge on their key dimensions: Question 6 asked the respondents
for their key dimensions of bust, waist and hip, and these were compared with the actual
measurements (obtained from them). The aim was to establish whether the career women
were informed about their key dimensions, which are so necessary for identifying correct
sizes. The results are presented in Figures 6.7, 6.8 and 6.9.
Figure 6.7 indicates a generally linear relationship between the bust dimensions reported
and those measured. However, there are outlying individuals outside the general trend. This
illustrates that the reported bust dimensions had a moderate relationship with the obtained
bust dimension as indicated by the coefficient of correlation (r = 0.55). Statistically, this
relationship was significant (0.0001< 0.05).

189
Actual bust dimensions versus reported bust dimensions
75
85
95
105
115
125
135
75 85 95 105 115 125 135
Actual bust dimensions
Rep
orte
d bu
st d
imen
sion
s
FIGURE 6.7: SCATTER PLOT COMPARING REPORTED BUST DIMENSIONS WITH OBTAINED BUST DIMENSIONS
The nature of the relationship shown in Figure 6.7 show that there were a few respondents
who accurately reported their bust dimensions; therefore one could say that Kenya’s career
women were partially knowledgeable about their bust dimensions.
Figure 6.8 clearly shows that there is a generally linear relationship between the reported
waist dimension and the actual waist dimension. However, there are more outlying
individuals in this instance. The career women’s reported waist measurement and their
actual waist dimension indicated a partial relationship (r = 0.52). Statistically, there was a
significant (0.0001 < 0.05) relationship between the reported waist dimensions and the actual
waist dimensions – suggesting that the career women were also moderately knowledgeable
about their waist dimensions, as for their bust dimensions.
(r = 0.55, p < 0.0001)

190
Reported waist dimensions versus actual waist dimensions (n = 123)
60
70
80
90
100
110
120
130
60 70 80 90 100 110 120 130
Actual waist dimensions
Rep
orte
d w
iast
dim
ensi
ons
FIGURE 6.8: SCATTER PLOT COMPARING REPORTED WAIST DIMENSIONS AND
OBTAINED WAIST DIMENSIONS
Reported hip dimensions versus measured hip dimensions (n = 123)
80
90
100
110
120
130
140
150
80 90 100 110 120 130 140 150
Actual hip dimensions
Rep
orte
d hi
p di
men
sion
s
FIGURE 6.9: SCATTER PLOT COMPARING REPORTED HIP DIMENSIONS WITH
OBTAINED HIP DIMENSIONS Figure 6.9 above indicates a generally linear relationship between the reported and the
measured hip dimensions. However, there are a few outlying individuals outside the general
trend. This illustrates that the reported hip dimensions had a strong relationship with the
obtained hip dimension, as indicated by the coefficient of correlation (r = 0.68). Statistically,
there was a significant (0.0001 < 0.05) relationship between the reported hip dimension and
the actual (obtained) hip dimension. The majority of the career women reported their hip
(r = 0.53, p > 0.001)
(r = 0.52, p > 0.0001)

191
dimensions more accurately than their bust and waist dimensions; hence they were more
knowledgeable about their hip measurements.
Career women’s knowledge about their sizes: Questions 13 and 14 solicited responses
concerning career women’s own sizes, expressed in even numbers 8 to 24 and 32 to 50,
respectively. The actual key dimensions of the bust, the waist and the hips obtained from
respondents were used to compare with their reported sizes (bust and hips). The reported
sizes were converted to bust, waist and hip measurements according to Kenyan size
standards (Appendix 4A), to facilitate comparisons with the corresponding actual body
dimensions for the reported sizes. For the purposes of brevity, examples of visual
representation of correlations between reported sizes in designations of even numbers (8 to
24) and in designations of even numbers (32 to 50) are presented in Figures 6.10 and 6.11.
Reported jacket sizes versus actual bust dimensions in sizes designation (12 -24) (n = 123)
75
85
95
105
115
125
75 85 95 105 115 125
Actual bust dimensions
Rep
orte
d ja
cket
siz
es
FIGURE 6.10: SCATTER PLOT COMPARING REPORTED JACKET SIZES (BUST) WITH
THE OBTAINED BUST DIMENSIONS IN SIZE DESIGNATION OF 12 TO 24 Figure 6.10 shows a generally linear relationship between reported jacket sizes and the
measured (actual) bust dimensions, although there are some outlying individuals outside the
general trend. This illustrates that the reported jacket size had a moderate relationship with
the obtained bust dimension, as indicated by the coefficient of correlation (r = 0.53).
Statistically, there was a significant (0.0001 < 0.05) relationship between the reported jacket
sizes and the obtained bust dimensions. As in the case of the reported jacket sizes in size
designation of even numbers (12-24), the other reported apparel sizes maintained a similar
pattern of linear relationship with some outlying individuals outside the general trend line
(r = 0.68, p < 0.0001)

192
Reported jacket sizes versus obtained bust dimensins in sizes designation (32-50)
75
85
95
105
115
125
75 85 95 105 115 125
Obtained bust dimensions
Rep
orte
d ja
cket
siz
es
(Figure 6.10). There were moderate relationships between the reported apparel sizes and
the obtained (actual) dimensions of bust and hip: reported dress sizes (bust) (r = 0.51, p >
0.001), reported skirt size (hip) (r = 0.58, p > 0.0001), and the reported trousers size (hip) (r =
0.56, p > 0.0001). Statistically, the relationships were significant (p < 0.005). The inference
that can be drawn is that Kenya’s career women were moderately knowledgeable about their
sizes, designated in even numbers 12 to 24.
An example of the visual representation of the correlations between the reported sizes in
designations of even numbers (32 to 50) is presented in Figure 6.11.
FIGURE 6.11: SCATTER PLOT COMPARING REPORTED JACKET SIZES (BUST) WITH THE OBTAINED BUST DIMENSIONS IN SIZE DESIGNATION OF 32 TO 50
Figure 6.11 demonstrates that, although there is a generally linear relationship between
reported the jacket sizes and the measured (actual) bust dimensions, there are more outlying
individuals outside the general trend. This illustrates that the reported jacket size had a poor
relationship with the obtained bust dimension, as indicated by the coefficient of correlation (r
= 0.32). Statistically, there was a significant (0.0033 < 0.05) relationship between the
reported jacket size and the obtained bust dimensions. As in the case of the reported jacket
in size designation of even numbers (32-50), all the other reported apparel sizes had
similarly poor relationships between the reported apparel size (bust or hip) and the obtained
dimensions (bust or hip): reported dress sizes (bust) (r = 0.32, p > 0.0041), reported skirt size
(r = 0.32, p > 0.0033)

193
(hip) (r = 0.44, p > .0001), and the reported trousers size (hip) (r = 0.45, p > 0.001).
Statistically, there were significant relationships between the reported sizes and the obtained
measurements. It appears that Kenya’s career women were moderately knowledgeable
about their sizes designated with even numbers 12 to 24, but were poorly knowledgeable
about their sizes designated with even numbers 32 to 50.
6.3.2.2 Sub-objective 5.2: To explore Kenyan career women’s knowledge about the communication of fit (Questions 5, 7, 8, 9, 10, 11 and 12)
The meaning of the terms used on size labels to represent established body shapes has
been explained in chapter 3 (paragraph 3.2.2.1). Question 5 had two sections. Section one
was used to determine whether the career women were familiar with the terms used on size
labels to represent established body shapes, while the second section was to examine
whether the respondents understood the meaning of those terms. Answers were accepted as
correct based on a brief description of the height, approximate age and body width
characteristics according to the literature (Chapter 3 (paragraph 3.2.2.1)). The results on
both the respondents’ familiarity with and their knowledge about the terms used on size
labels are presented in Figures 6.12.
0102030405060708090
100
Perc
enta
ge (%
)
Carreer women's familiarity with and knowledge about terms used to represent body shapes (n = 201)
Unfamiliar terms 79 76 73 61 56
Familiar terms 29 24 27 39 44
Incorrectly described 97 99 97 96 100
Correctly described 3 1 3 4 0
Women's-petite Misses Misses-
petite Women's Junior
FIGURE 6.12: CAREER WOMEN’S FAMILIARITY WITH AND KNOWLEDGE ABOUT TERMS THAT REPRESENT BODY/FIGURE SHAPES
Regarding the respondents’ familiarity with the terms that represent body shapes, the results

194
show that women’s-petites, misses and misses-petites were reported as unfamiliar by 79%,
76% and 73% responses, respectively, while women’s and junior labels were reported as
unfamiliar by 61% and 56% respondents, respectively. On average, all the terms were
reported as unfamiliar by 69% responses, which is in sharp contrast to the terms reported as
familiar (31%). Therefore, this suggests that terms used on size labels to indicate different
body shapes were less familiar to Kenya’s career women.
As for the respondents’ knowledge about the terms that represent body shapes (Figure 6.12), it is clear that 100% and 99% of the respondents, respectively, described junior and
misses labels incorrectly. Misses-petites and women’s petites were each incorrectly
described by 97% of the respondents, while 96% respondents incorrectly described the
women’s label. On average, 98% respondents incorrectly described all the terms, suggesting
a high level of ignorance/lack of knowledge about body shape terms represented on size
labels. There was a statistically significant (0.0001 < 0.05) association between consumers’
familiarity with the size label terms (representing body shapes) and their knowledge. The
nature of the association was that consumers scored higher on the familiar terms than on the
unfamiliar terms. There was no statistically significant (0.63 > 0.05) association between their
familiarity with size label terms and a professional background in Home Science/Clothing and
Textiles, but statistically significant (0.02 < 0.05) associations were found between their
knowledge and their professional background. Respondents with a Home Science/Clothing
and Textiles professional background had higher scores on description of some familiar
terms than those without such a professional background. The deduction could be made that
a professional background in Home Science/Clothing and Textiles could possibly influence
consumers’ knowledge about the terms used on size labels to represent body shapes.
It was assumed that older career women would be more knowledgeable about body shape
terms than the younger women. There was no statistically significant (0.42 > 0.05)
association between career women’s age and their knowledge about size label terms used to
describe body shapes. This may suggest that the longer experience of the older group does
not guarantee knowledge about the size label terms.
Career women’s knowledge about illustrated body shapes: Question 8 was used to
determine whether the career women could physically identify and describe the different
illustrated figures within the five prevalent established body types (Triangle, Inverted triangle,
Apple, Rectangle and Hourglass). Figure 6.13 below presents the results.

195
0
10
20
30
40
50
60
70
Perc
enta
ge (%
)
Consumers knowledge about illustrated body shapes (n = 201)
Incorrect description 67 67 65 59 50
Correct description 33 33 35 41 50
Pear Barrel Apple Rectangle Hourglass
FIGURE 6.13: CAREER WOMEN’S DESCRIPTION OF THE PREVALENT ILLUSTRATED
BODY SHAPES
Figure 6.13 shows that the pear and barrel body shapes were both incorrectly described by
67% of the respondents, while 65%, 59% and 50% of the respondents respectively,
described the apple, rectangle and hourglass body shapes incorrectly. On average, the
majority (62%) of the respondents described all the body shapes incorrectly. As in the case
of size label terms that represent body shapes (Figure 6.13), Kenyan career women were
also ignorant of the five prevalent body shapes.
Career women’s knowledge about their own body shapes: Question 7 was used to
determine whether the career women’s self-reported own body shapes were the true
representation of their body shapes. Illustrations of different figures were presented for them
to select one that they felt was an approximate representation of their own body shapes. To
authenticate their knowledge, the self-reported body shapes were compared with their actual
figure types that emerged from the measurements and photographs.
The results presented in Figure 6.14 indicate that respondents with a rectangular body
shape were 74%, while only 14% of the respondents reported the rectangle body shape as
their own. From the measurements, there were 21.5% Triangular body shapes, but 24% of
the respondents self-reported the pear body shape as their own. Respondents with apple,
hourglass and inverted triangular body shapes from the body measurements were least
represented (1.5%).

196
0
10
20
30
40
50
60
70
80
Perc
enta
ge (%
)
Body shape from measurements versus self-reported body shape
Body shape from themeasurements (n = 123)
74 21.5 1.5 1.5 1.5
Participants' self-reported bodyshape (n = 183)
14 24 16 37 9
Rectangle Triangle Apple Hourglass Inverted triangle
FIGURE 6.14: CAREER WOMEN’S SELF-REPORTED BODY SHAPE VERSUS THEIR ACTUAL FIGURES FROM MEASUREMENTS
From Table 6.14, it also shows that 37% of the respondents self-reported the hourglass body
shape as their own, which is a higher percentage than the other self-reported shapes, which
scored between 9% and 24%. Again, it is clear that the Kenyan career women were not only
uninformed about the different body shapes (Figures 6.12 and 6.13), but were also
uninformed and unrealistic about their own body shapes. The majority of them gave the
impression that they perceive their shapes as the hourglass body shape.
Career women’s application of body shape assessment techniques: Question 9 was
used to further explore whether the consumers’ knowledge about their own figures had been
enhanced by self-evaluative techniques learnt through reading, observing or any other
medium.
Shown in Figure 6.15 the results depicts that, except for the use of a mirror (64%) and the
key dimensions (50%) as reported body shape assessment techniques applied by the
respondents, all the rest of the techniques were least applied by the majority of the
respondents. On average, 74% of the respondents did not apply self-evaluation techniques
to determine their body shape.

197
0
10
20
30
40
50
60
70
80
90
100
Perc
enta
ge (%
)
Body shape assessment techniques applied by career women (n = 198)
Not applied 94 94 94 94 76 50 36
Applied 6 6 6 6 24 50 64
Trace Told Yard Photos Comp Measure Mirror
Trace = Tracing body outline against the wall, Told = told by friends, Yard = use of yardstick, photos = use of
photographs, Comp = Comparing with established illustrations, Measure = use of key body dimensions, and Mirror
= use of mirror in minimal apparel
FIGURE 6.15: BODY SHAPE ASSESSMENT TECHNIQUES APPLIED BY KENYAN
CAREER WOMEN
The results (Figure 6.15) is evident that the majority of Kenyan career women apply
inadequate body shape assessment techniques. These findings therefore confirm the
participants’ ignorance about the prevalent rectangular body shape, or their own shapes as
observed in this study (Figures 6.13 and 6.14).
Career women’s knowledge about appropriate styles for their perceived own body
shapes: Question 12 was used to further establish career women’s knowledge of their own
body shapes. The question asked respondents to select appropriate styles for their perceived
own body shapes from different styles that were provided. Answers given were accepted as
correct if the respondents chose styles corresponding to each body shape as given in Table 6.4. The styles assigned to each body shape underwent the professional experts’ scrutiny.

198
TABLE 6.4: APPROPRIATE APPAREL STYLES FOR DIFFERENT BODY SHAPES
1
2
3
4
5
J A C K E T S
Triangle (Pear) Hourglass
Apple Hourglass Rectangular Inverted triangle
Inverted triangle
1
2
3
4
5
S K I R T S
Triangle (Pear) Hourglass
Apple
Hourglass Triangle (Pear)
Inverted triangle Rectangular
Inverted triangle Rectangular Hourglass
Inverted triangle Apple
1
2
3
4
5
P A N T S
Rectangular Inverted triangle
Apple Triangle (Pear)
Triangle (Pear) Hourglass
Rectangular Inverted triangle Hourglass
Results on selected styles are presented in Figure 6.16 below. It is clear from the results
presented in Figure 6.16, that 63%, 58% and 56% of the respondents selected inappropriate
styles for their self-reported rectangular, pear and apple body shapes, respectively. Forty-
nine per cent and 47% of the respondents selected inappropriate styles for their self-reported
hourglass and barrel body shapes. On average, 54% of the respondents selected incorrect
styles for their reported (perceived) body shapes. As was shown in Figures 5.2 in Chapter 5
and 6.14, the most prevalent body shape in this study was rectangular (74%); however, only
37% of the respondents were able to select appropriate styles for this figure. Therefore it is
once again observed that Kenyan career women were ignorant and unrealistic about their
body shapes (Figures 6.13), but were also ignorant and unrealistic about suitable styles for
their perceived body shape as well as their actual body shape.

199
0
10
20
30
40
50
60
70
Perc
enta
ge (%
)
Consumers' selected styles for self-reported body shape (n = 180)
Inappropriate styles 63 58 56 49 47
Appropriate styles 37 42 44 51 53
Rectangle Triangle Apple Hourglass Inverted triangle
FIGURE 6.16: SELECTED STYLES FOR THE REPORTED OWN FIGURE TYPE
Career women’s perceived ideal body shape: Question 10 was used to determine the
career women’s perceived ideal body shape and to find out whether they considered their
own body shapes as ideal. The results are presented in Figure 6.17.
0
10
20
30
40
50
60
70
80
Perc
enta
ge (%
)
Ideal body shape versus self-reported body shape
Ideal shape (n = 200) 76 14.5 8 0 1.5
Self-reported shape (n =183) 37.5 24 15.5 14 9
Hourglass Triangle Inverted triangle Rectangle Apple
FIGURE 6.17: CAREER WOMEN’S PERCEIVED IDEAL BODY SHAPE VERSUS REPORTED OWN BODY SHAPE
The results indicate that 76% respondents reported the hourglass body shape as their ideal
shape. However, 37.5% respondents also reported the hourglass body shape as their own

200
shape. Only 14.5% respondents reported the triangular shape as their ideal shape, while
24% reported the triangular body shape as their own body shape. Eight per cent of the
respondents reported the inverted triangle body shape as the ideal shape, and 15.5%
selected the inverted triangle body shape as their own shape. There were 1.5% respondents
selecting the apple as the ideal shape, but 9% respondents selected the apple as their own
shape. Kenyan career women were therefore not only unrealistic about their own body
shapes, but they also did not perceive their own shapes as the ideal body. This could
possibly indicate that Kenyan career women were dissatisfied with their own shapes (body
cathexis). If apparel styles selected were not providing the expected appearance on one’s
body shape, as observed with the perceived ideal shape, it may generate a negative feeling
towards one’s body rather than to the apparel. Ultimately, one’s body is blamed for the poor
fit of the apparel.
6.3.3 Primary objective 6: To determine and describe how career women’s preferences for differently fitted skirts and jackets may contribute to fit problems with apparel (Question 19)
Question 19 was used to explore the Kenyan career women’s fit preferences for differently
fitted apparel items (skirts and jackets), and to compare their fit preferences with the critical
fit points of their distinctive rectangular body shape (Chapter 5 (Figure 5.10)), as well as
their selected styles (Figure 6.16), in order to establish how their fit preferences could
contribute to the fit problems they were experiencing.
The results are presented in Figure 6.18, which clearly demonstrate that the majority of the
Kenyan career women preferred to wear fitted and semi-fitted skirts and jackets often, and
sometimes to work. Contrary to their preferences for the fitted and the semi-fitted skirts and
jackets, the majority of the respondents prefer never to wear loose fitting skirts and jackets to
work. This suggests that the majority of Kenya’s career women prefer fitted and semi-fitted
skirts while they least prefer loosely fitted skirts to work.
The fit preferences for differently fitted skirts and jackets were examined among different age
groups of the career women. Statistically there were no significant associations between age
and the fit preferences for fitted skirts (0.0652 > 0.05), semi-fitted skirts (0.8966 > 0.05) or
loosely fitted skirts (0.9817 > 0.05). This may possibly imply that a fit preference for
differently fitted skirts is not influenced by the age of the consumers.

201
0
10
20
30
40
50
60
70
80
90
100
Percentage (%)
Consumers' fit preferences
Undecided 2 1 2 4 11 10 Never 9 12 13 9 45 33 Sometimes 23 36 33 33 25 32 Often 66 51 52 54 19 25
Fitted skirt (n = 173)
Fitted jacket (n = 166)
Semi-fitted skirt (n =168)
Semi-fitted jacket (n = 166)
Loosely fitted skirt (n = 152)
Loosely fitted jacket (n = 167)
FIGURE 6.18: CAREER WOMEN’S FIT PREFERENCES FOR DIFFERENTLY FITTED
SKIRTS AND JACKETS
There were also no significant associations between age and fit preferences for fitted jackets
(0.0652 > 0.05) or semi-fitted jackets (0.1445 > 0.05). There was a tendency (p < 0.1) of
association between fit preferences for fitted jackets and the younger age group. There were
significant (0.0247 < 0.05) associations between the mature age group and the fit preference
for loosely fitted jackets. This may suggest that some of the older women prefer loosely fitted
jackets, while the younger age group prefers the jackets with a tighter fit. Comfortable
apparel items are possibly more important to the older group, while stylish fashion and not
necessarily comfort could be a driving force for the younger group.
Kenyan career women’s fit preference versus the critical fit points for their distinctive
rectangular body and chosen styles: It is clear that Kenyan career women prefer to wear
fitted and semi-fitted skirts and jackets to work (Figures 6.18). The critical fit points for the
rectangular body shape deviate from those for the so-called ideal body shape. As observed
in Chapter 5, the majority of the participants had large thighs (76%), large buttocks (91%)
and large stomachs (70%), a fully rounded upper back (70%) and a large bust (60%). Where
body shape characteristics are not considered in the manufacturing of ready-made apparel, a

202
person with such prominent critical fit points is likely to experience tight fit problems around
those prominent body features. If the majority of the available designs were based on the
understanding of the curvy rectangular body shape, fitted skirts and jackets would be made
to cater for their preferred apparel. Where no body shape characteristics are considered in
the manufacturing of ready-made apparel, the curvy rectangular body shape could be
accommodated more comfortably and pleasingly by loosely fitted apparel, as it contains
enough ease of design (style) and wearing (comfort). In such instances, the fit problems
encountered could be ascribed to inappropriate fit preferences that do not take into account
consumers’ body shapes and the critical fit points associated with those shapes.
Statistically, there were significant (0.048 < 0.05) associations between the fit preferences for
a fitted skirt and the acceptable fit at the stomach region, and significant (0.0208 < 0.05)
associations between the fit preferences for a semi-fitted skirt and the fit problem of tightness
experienced at the thigh region. Respondents who reported having acceptable fit at the
stomach region preferred a fitted skirt, while those with fit problems of tightness at the thigh
region preferred a semi-fitted skirt. There were significant (0.0011 < 0.05) associations
between the fit preferences for a semi-fitted jacket and the fit problem of tightness
experienced over the bust region. Respondents who reported fit problems of tightness over
the bust region preferred a semi-fitted jacket. These results may suggest that the comfort
required around the stomach, the thighs and the bust regions could determine the degree of
ease/comfort necessary in the skirts and jackets for some Kenyan career women.
6.4 OVERALL DISCUSSION OF THE RESEARCH OBJECTIVES
6.4.1 Assessing and describing career women’s self-perceived fit issues with the ready-made apparel in Kenya (Primary objective 4)
The highly rated quality of imported new (78%), custom-made (72%) and imported second-
hand (65%) ready-made apparel in terms of good fit, may be explained in terms of appealing
characteristics compounded in imported apparel such as a variety of styles, good
workmanship, quality fabrics and brand names (Mason, 1998:90; McCormick et al., 2002),
rather than in stipulations of excellent fit. The consumers’ “ego” associated with imported
apparel could also be seen as an issue affecting their purchasing of imported new and used
apparel as opposed to the local apparel, which recorded highest poor fit responses and the
lowest good fit responses (Li & Gallup, 1995; Hansen, 1999:359; Mhango & Niehm, 2005).
By virtue of imported and sometimes branded labels attached to the apparel, consumers may
not even reflect on any of the other necessary considerations such as fit, before purchasing

203
the apparel item (Agbonifoh & Elimimian, 1999). De Klerk and Tselepis (2007) observed that
consumers may use extrinsic aspects to select apparel items that would not necessarily
satisfy their fit needs but that would rather satisfy their emotional needs.
The good fit of custom-made apparel could be ascribed to the fact that tailors gain
experience through constant interaction with the body shapes and dimensions of their
consumers. Tailors’ frequent interaction with and observations of different body shapes and
dimensions facilitate a continuous learning process, enabling them to make better-fitting
apparel. Kenya’s locally made apparel was ranked last in terms of good fit and recorded the
highest poor fit (26%) responses, higher than all the other categories. The poor fit could be
ascribed to poorly skilled personnel in the apparel industry, inadequate and outdated
machinery and lack of quality raw materials in Kenya’s apparel industries, as observed by
Mason (1998) and McCormick et al. (2001). Other reasons could also be the
unrepresentative sizing systems in terms of the body shapes and dimensions of the current
population (Zwane & Magagula, 2006; Shin & Istook, 2007; Honey & Olds, 2007).
As for the fit of imported apparel, new and ready-made imported apparel items are sold in
boutiques and chain stores, which respectively scored 84% and 70% responses on good fit.
The second-hand stores recorded 66% responses on good fit, as they sell imported
exclusive, second-hand, ready-made apparel. Although apparel items available in boutiques
and second-hand stores may be limited in varied sizes, they do offer unique and good-quality
apparel in terms of materials/workmanship (Mhango & Niehm, 2005). In addition to offering
unique and good-quality apparel, chain stores ensure customer satisfaction, as highlighted
by Otieno et al. (2005).
Market stalls were ranked fourth, with 52% responses, while supermarkets and trade fairs
were ranked fifth and sixth with 47% and 46% responses respectively. It should be noted that
the market stalls, supermarkets and trade fairs sell mixed apparel merchandise, ranging from
local ready-made, imported new and imported second-hand apparel. The quality of the
apparel varies from fair to poor, depending on the categories available in each case. Most of
these stores have inadequate fitting rooms and therefore the consumers cannot adequately
assess the fit of apparel items before purchasing. All these factors explain the quality of
apparel sold. A factory outlet, which was ranked last (22%), sells locally made apparel items
of poor quality. According to Rasband (2001a:8), the apparel merchandise in a factory outlet
is cheap and is usually made of low-grade materials and shows poor workmanship.
Contrary to the Kenyan career women’s perceived good fit of the imported new and second-
hand ready-made apparel, as well as of the ready-made apparel items sold in boutiques,

204
chain stores and second-hand stores, they expressed dissatisfaction with the way that ready-
made apparel items fit their critical fit points. On average, the majority (65%) of the career
women in the sample reported more problems with either tight or loose fit than they reported
an acceptable fit (35%) at the various fit points of the upper and the lower torsos.
Considering that most ready-made apparel items are based on the hourglass body shape,
which is considered ideal in the apparel industry (Newcomb & Istook, 2004a & 2004b; Zwane
& Magagula, 2006), such fit problems are inevitable because Kenya’s distinctive body shape
is a curvy rectangle type (Chapter 5, paragraph 5.2.3.2), with body characteristics that do
not match those of the well-proportioned ideal body shape. Therefore, apparel items
produced with grading based on standard linear surface increments (Schoefield & LaBat,
2005a & 2005b) would not fit these career women’s distinctive shape with their unique
features. Regarding fit problems with length, it is also apparent that more of the Kenyan
career women (61%) encountered length-fitting problems (reported too short or too long),
than those who felt that the lengths were acceptable (39%). As in the case of width
problems, the length problem points in most cases to the linear proportional grading theory
that underlie most pattern development systems, and have been cited as the major
contributing factor to length fit problems (Bye & Delong, 1994; Loker et al., 2005; Schofield,
2007 in Ashdown, 2007:180, 188).
Finding apparel items that fit well can be time-consuming and frustrating, particularly to
female consumers who often have to try on several assortments before finding one item that
fits (Ashdown, 1998; Workman & Lentz, 2000). When the respondents were asked whether
they were generally satisfied with the fit of ready-made apparel (Figure 6.3), 75% of the
career women expressed dissatisfaction with the fit of ready-made apparel – generally in
terms of the search process, the available styles and the latest fashion in appropriate styles
and sizes. These results concur with the findings of Kurt Salmon Associates (1996) in the
United States of America and Otieno et al. (2005) in the United Kingdom, that over 50%
female consumers were dissatisfied with the fit of ready-made apparel. The dissatisfaction
with ready-made apparel may be due to frustrations and confusions encountered during a
search for apparel. Female consumers flip through several assortments of styles and sizes
trying to get apparel items that may fit correctly (Ashdown, 1998; Workman & Lentz, 2000;
Otieno et al., 2005). Frustration in their search for apparel are thought to be brought about by
non-standardised sizes between styles, designers and manufacturers that employ different
body measurement techniques, marketing gimmicks and varied quality control practices
(Hudson, 1980; LaBat & DeLong, 1990; Solomon & Rabolt, 2004:10-11). The different size
codes are also not instructive enough to guide the consumers while selecting apparel, but
are rather confusing as many size codes do not directly relate to female body dimensions
(Workman, 1991; Chun-Yoon & Jasper, 1995 & 1996; Holzman, 1996). In this study, the

205
group of career women also lacked knowledge about the meaning of the terms used on size
labels (Figures 6.6 & 6.10), which could actually serve as useful guides in the selection of
apparel.
Inadequate understanding, worsened by confusion, could result in apparel items failing to
meet the specific needs of the consumer (Mitchell & Papavassiliou, 1999). Experienced
consumers are adept at forming choice-sets. Experience helps to make potential consumers
selectively observant. Kenya’s career women’s perceptions concerning the sources of the fit
problems they are experiencing (Figure 6.4), demonstrated that the majority of them felt that
both the apparel industry (89%) and their body shapes (78%) were the sources of fit
problems.
Informed consumers with adequate knowledge about the products they buy, have a better
chance to locate the locus of the cause of the problem and perhaps link the apparel
manufacture with the fit problems. Because of the Kenyan career women’s lack of knowledge
about size (77%) and fit (98%) issues (Figures 6.6 and 6.12), they may be confused
concerning the source of fit problems common to the ready-made apparel, and hence
attribute the locus of the problem externally by blaming the industry or internally by blaming
their own bodies (Weiner, 1986). However, if the consumers blamed their bodies for the fit
problems, they would negatively direct their disappointing experience encountered with
apparel to their bodies, rather than to the apparel items, as stated by LaBat (1990), Fiore and
Kimle (1997:30) and Yu , 2004:33). In cases where the consumers blame their bodies for fit
problems, they would probably experience their bodies negatively, while they suffer financial
loss and exploitation by the industry. They would also possibly develop emotional distress
resulting from the continuous purchasing of substandard apparel items. Mitchell and
Papavassiliou (1999) observed that inadequate, ambiguous, conflicting and misleading
information often lead to consumers’ confusion, whereas confusion can affect both their
rights and the quality of their decisions. Confused consumers are less able to process
information and are more vulnerable to making less than optimally appropriate choices in
apparel styles and sizes. Ultimately, they end up with inappropriately fitting apparel.
6.4.2 Determining and describing Kenyan career women’s knowledge about the
communication of size (key body dimensions) and fit (body shapes) (Primary objective 5)
A size label is supposed to communicate size to the consumers, with clearly indicated body
dimensions, as it is a manufacturer-to-consumer communication channel to enable
consumers to make efficient purchase decisions (Chun in Ashdown, 2007:220). Misleading

206
information often leads to consumers’ confusion, and confusion can affect the quality of
consumers’ decisions (Mitchell & Papavassiliou, 1999; Mason, De Klerk, Sommervile &
Ashdown, 2008). It was therefore necessary to explore which size labels were familiar to the
group of Kenyan career women to establish whether the information displayed on size labels
was useful enough to the consumers. The findings of this study (Figure 6.5) indicate that
uninformative/tacit labels were on average familiar to the majority (97%) of these women, but
were ranked as effective by only 51% of the respondents. The informative labels were much
less familiar (7%), but overwhelmingly, 99% respondents ranked them as effective. It
appears that Kenya’s apparel industries continue to use the tacit labels contrary to KEBS
(2001:8)/Appendix 4B recommendations, and regardless of the inadequacy of the
information to guide consumers in their selecting and purchasing of ready-made apparel. A
size label is supposed to communicate sizes and body types to the consumers, with clearly
indicated body dimensions and a description of the body type that the apparel item was
designed to fit (KEBS, 2001:8; Faust et al., 2006). It should specify whether the person is tall
with large/small bust and large/small hips, short with large/small bust and large/small hips, or
regular (medium height) with large/small bust and large/small hips (Glock & Kunz, 1995:108;
Chun-Yoon & Jasper, 1995; Chun-Yoon & Jasper, 1996).
With the majority of the career women in the group ranking the informative labels as
effective, this validates that each apparel item should bear a label that is well understood by
the consumers and that will require minimal explanation to the consumers – regardless of the
price, type of apparel or even the manufacturer. The Kenyan career women’s preference for
informative size labels affirms the findings of Chun-Yoon and Jasper’s (1995) study that the
majority of consumers prefer the wordless pictogram, which is self-explanatory. These
findings also support the recommendations by KEBS (2001:7) and Faust et al. (2006) that
size labels should be adequate, legible and durable to serve as future reference for the
consumers.
It was necessary to gauge whether career women’s knowledge concerning different labels
was adequate to provide for an informed and appropriate apparel selection. However, the
results (Figure 6.6) clearly demonstrated that career women lacked knowledge about size
labels, with the majority of them (77%) giving incorrect meanings for the size codes and size
contents. This highlights the fact that the size labels that are familiar to the Kenyan career
women were not instructive enough to provide useful guidance for them when selecting
appropriate apparel sizes.
Workman (1991), Desmarteau (2000) and Brown and Rice (2001:147-148) underline the
importance of consumers’ knowing their own key dimensions, and also which body

207
dimensions are necessary for the selection of specific apparel items. It was clear (Figures 6.7, 6.8 and 6.9) that the Kenyan career women in the group were only partially
knowledgeable about their bust and waist dimensions, but they were more knowledgeable
about their hip dimensions. These findings concur with Alexander, Connell and Ulrich’s
(2005) findings (in the United States of America) that women understood their hip
measurement better than their bust and waist dimensions. An observation from this study
(Chapter 5 (Table 5.9)) was that the majority (91%) of the respondents had large buttocks,
which are directly related to the hip dimensions. Problems with a tight fit over the hips (54%),
the buttocks (43%) and the thighs (43%), were reported (Table 6.2) – again confirming that
these regions may call for closer attention.
A consumer with a prominent hip region is most likely to experience problems of tight fit,
which may aggravate her desire to understand the measurements associated with it. Chun
(in Ashdown, 2007:226) emphasises that consumers have to know their body dimensions to
identify their apparel size and to be able to make appropriate size and style selections.
Accurate knowledge about one’s body dimensions can also facilitate a thorough and
accurate assessment of apparel sizes. If size labels were informative (self-explanatory) it
would be easy for the consumers to compare the information provided on them with their
own key dimensions. Uninformative labels combined with consumers’ ignorance about the
meanings attached to the labels can contribute to consumers’ confusion and inappropriate
apparel selection. In the event that the consumers understand the meaning of the codes
used on size labels and their contents, their knowledge about the key body dimensions
becomes useful for the selection of appropriate styles and sizes (Mason et al., 2008).
Participants’ knowledge about their sizes in different size designations (Figures 6.10 and
6.11) indicated that Kenya’s career women were moderately knowledgeable about their sizes
designated with numbers 8 to 24, but were poorly knowledgeable about sizes designated
with the even numbers 32 to 50. These findings substantiate Yoon and Radwin’s (1994)
results that consumers’ estimations of their body sizes were not accurate. Zwane and
Magagula (2006) report that most developing countries in Africa use adapted versions of the
British sizing systems that cannot reflect the true picture of the intended consumers in
developing countries.
It has also been observed that the lack of standardisation in sizing systems occurs not only
with apparel of different brands and styles, but also within apparel items of the same
numbered sizes within the same brands and styles (LaBat & DeLong, 1990; Workman &
Lentz, 2000; Brown & Rice, 2001), resulting in what Keiser and Garner (2003:304) refer to as
size migration, where one consumer fits into a range of three or more different sizes.
Depending on the cut of the apparel items or the manufacturer’s sizes, a consumer’s size

208
keeps migrating between smaller and larger sizes. A practical example of such a migrating
size is in vanity sizing with large dimensions being reflected in a smaller size designation
(Tamburrino, 1992a & 1992b; Ashdown & DeLong, 1995; Glock & Kunz, 1995:111; Keiser &
Garner, 2003:304; Faust et al., 2006; Shin & Istook, 2007). Because of the non-standardised
sizing systems used by apparel industries, it may be difficult to draw conclusions from the
consumers’ reported sizes, as it is not possible to isolate sizing systems that are currently
being used in Kenya.
Body shape acts as a framework for apparel, and a size label is suppose to communicate
sizes and body types to the consumers, with clearly indicated body dimensions and a
description of the body type that the apparel item was designed to fit (Faust et al., 2006).
Although manufacturers/retailers hardly include body shape as a communication of fit, it was
deemed necessary in this study to determine whether terms used on size labels to represent
body shapes, were familiar and comprehensible to Kenya’s career women. As in the case of
familiarity with effective (informative) labels, the findings on body shape terms represented
on size labels (Figure 6.12) demonstrated that the majority (69%) of the respondents were
unfamiliar with female body shape terms that are represented on size labels/tags. One could
speculate that apparel industries in Kenya are neglecting the recommendation by KEBS
(2001:7)/Appendix 4B, to use instructive labels. This is consistent with the study of Faust et
al. (2006), carried out in Canada. A lack of these terms on size labels/tags therefore would
mean inappropriate apparel selection by the consumers, as they have nothing to guide them
or to refer to (Mason et al., 2008). A size label should not only indicate key dimensions but
also a description of the body type that the apparel item has been designed for (Glock &
Kunz, 1995:108; Chun-Yoon & Jasper, 1995). It is also obvious from the results (Figure 6.12) that almost all the respondents (98%) could not describe the size label terms
representing female body shapes. Consumers’ lack of knowledge about the terms
representing female body shapes suggests that the consumers were uninformed about the
important terms which could indicate to them the suitability of apparel items for different body
shapes (Brown, 1992:54-55; Glock & Kunz, 1995:110; Brown & Rice, 2001:146; Faust et al.,
2006; Chun in Ashdown, 2007:226).
Consumers have to know the various body shapes to ease their search for appropriate styles
suitable for different body shapes. When career women were asked to describe the five
prevalent body shapes presented as illustrations (Figure 6.13), 66% of the respondents, on
average, were unable to describe the shapes correctly. This suggests that Kenya’s career
women were ignorant about the established body shapes. However, correct descriptions of
the hourglass figure scored 50%. This could be due to the hourglass body shape being a
household name in fashion marketing. The ideal figure, which is basically a slim hourglass

209
body shape, is featured in all fashion magazines, modelling and catwalk scenarios, making it
popular and a regular shape in the daily lives of the consumers (Ashdown & DeLong,
1995:48; Yu in Fan et al., 2004).
Since a body shape is a framework for proportioning apparel, it must be well understood by
users in terms of their body proportions. For an apparel item to attain a good fit, the body and
the apparel selected must be in a harmonious relationship. A consumer without knowledge
could assume that all people have bodies similar to that of the fit model or to their perceived
ideal shape (Mason et al., 2008). These assumptions could lead to them purchasing apparel
suitable for the fit model or the perceived ideal shape, rather than based on their own shape.
A consumer who is ignorant about the elements of good fit is also likely to select apparel
based on other factors such as colour, style and current fashion, leading to physically
attractive apparel as it is displayed in the retail environment, and a disappointing look when
worn on the actual body. Knowledge about the different body shapes would facilitate
comparison of the proportions between different body shapes, and would ultimately ease
apparel selection. When one compares the group of consumers’ perceived (self-reported)
body shapes with their identified body shapes, it is apparent (Figure 6.14) that they do not
perceive their own body shapes realistically – possibly due to a confusion regarding different
body shapes. The state of confusion and unrealistic self-identity could possibly be the cause
of their inappropriate apparel selection (Mason et al., 2008).
The self-reported hourglass body shape by the majority of the respondents could have been
attributed to its fame in the fashion world and in the marketing of fashion (Ashdown &
DeLong, 1995:48; Yu in Fan et al., 2004). In the Alexander, Connell & Ulrich (2005) study
done in the USA, about 50% of the women self-reported their body shapes as an hourglass,
and yet the majority of them had rectangular figures. It may be reasoned that continuous
apparel production and promotions based on the ideal hourglass body shape continue to
deprive the consumers of their true identity. Persistent advertisements based on the
hourglass shape deny consumers a chance to see themselves more realistically – and hence
they dress inappropriately. A basic knowledge about the elements and principles of design
applicable to the various body shapes would enable consumers to select more suitable styles
and sizes of apparel.
As in the case of the key dimensions necessary for identifying appropriate size, consumers
must also be able to identify their body shapes accurately in order to select suitable apparel
items. There are several ways that consumers could acquire knowledge about their body
shapes. Keen retailers, through magazines and marketing pamphlets, could sensitise their
clients by providing information on different ways to establish their own figure types. It is

210
believed that, if a consumer could apply several techniques for the assessment of her own
body shape, then her chances of selecting appropriate apparel would be high. The
application of several techniques enhances a deeper understanding of one’s body shape and
of how the body’s proportions relate to one another (Lyle & Brinkley, 1983:58-60; Reader’s
Digest, 1988: 46-47, 82-83; Liechty et al., 1992:33-38).
Respondents were asked to report the body shapes assessment techniques that they had
applied, to establish whether their knowledge about their own body’s shapes had been
enhanced by self-evaluative techniques learnt through reading, observations or any other
medium. It is believed that when individuals are more informed about self-assessment
techniques to determine body shape, they will be more accurate in identifying their own body
shapes – and hence be more skilled to select appropriate and suitable apparel items. Apart
from the use of a mirror for the assessment of the body shape by the majority (64%) of the
respondents, other methods of body shape evaluation have been scantily used, as confirmed
in this study (Figure 6.15). The use of a mirror alone is inadequate to facilitate a
comprehensive assessment and a deeper understanding of the characteristics of one’s body
and the proportions that contribute to the actual body shape. More than seven evaluation
techniques have been reported to enhance a thorough knowledge about body shapes and
hence, skills in appropriate selection of ready-to-wear apparel. For example, tracing the body
outline against the wall; using a yardstick to compare hips, bust and shoulders; dressing in
minimal clothing and assessing the shape using a long mirror; studying photos taken in
minimal apparel; comparing the body shape with established types; and asking
friends/experts to analyse your shape (Lyle & Brinkley, 1983:58-60; Reader’s Digest,
1988:46-47, 82-83; Liechty et al., 1992:33-38; Rasband, 2001b: 20-23, 31-32;). These
findings showed that Kenya’s career women hardly apply any body shape evaluation
techniques for the assessment of their own body shapes, and confirms their ignorance about
their own body shapes (Figure 6.14) – hence their selection of inappropriate apparel.
Inappropriate apparel styles distract attention, emphasise a figure problem and undermine
the confidence of the wearer. A well-fitted style hides a body shape’s problems, and directs
attention away from the problem areas, thus contributing to the psychological and social well-
being of the wearer (Rasband & Liechty, 2006: 8). Apparel styles should alter the negatively
perceived proportions of the body and provide a sense of satisfaction to individuals who do
not fit within the cultural ideals of size and weight (Fiore & Kimle, 1997:331). When
consumers understand the different body shapes, their own body shapes and the elements
and principles of design appropriate for the different shapes, they would wear satisfactory
apparel styles. In this study, respondents were asked to select appropriate styles from
different styles that were provided based on the five prevalent body shapes (hourglass,

211
apple, triangle, rectangle and inverted triangle). It was reasoned that if the respondents were
able to select appropriate styles for their reported body shapes from the three categories
provided (jackets, skirts and trousers), it would also be possible that they were
knowledgeable concerning their own body shapes and the appropriate selection of well-fitting
apparel styles. The findings of this study (Figure 6.16) illustrate that 54% respondents were
not knowledgeable about the appropriate selection of suitable apparel styles for their self-
reported body shapes. Only 37% of the respondents were able to select appropriate styles
for the distinct rectangular shape that emerged in this study. As in the case of knowledge
about the illustrated prevalent body shapes, Kenya’s career women were not only ignorant
about their own body shapes, but also about suitable styles for their body shapes – and
therefore, they would likely experience fit problems with apparel.
The physical structure of the ideal body shape may be quite familiar to most consumers, but
they may not understand what characterises the ideal shape and how their own shapes
deviate from it. Consumers’ lack of knowledge about the various body shapes and about
their own body shape, as observed in this study, may highlight their inability to comprehend
proportional comparisons between the ideal body shape and any other shape. The
consumers assume that the commonly presented ideal shape represents all the other
shapes, and therefore they perceive it as the only perfect one. This has an implication with
the fit of apparel because a consumer will purchase apparel items that are suitable for their
perceived ideal body shape rather than for their own shape. In this study (Figure 6.17), the
results indicated that the majority (76%) of this group of Kenyan career women perceived the
hourglass body shape as an ideal figure, but they did not perceive their self-reported body
shapes or their distinct rectangular shape (from dimensions and photos) as the ideal body
shape. The perception of the hourglass shape as the ideal shape may be attributed to the
fact that the current marketing of fashion uses it for advertisements. This, according to Fiore
and Kimle (1997:3), provides a symbol of expectation for women and has negative
implications, as the women purchase apparel items that would look attractive on the ideal
body shape – but looks disappointing on their own body shapes. When a woman tries to
dress her body with the available apparel items, the comparison to the ideal is inevitable, and
this signals to the woman that something is wrong with her body, rather than with the apparel
itself. This may undermine the confidence of the wearer and cause unnecessary emotional
suffering for an individual.

212
6.4.3 Determining and describing how career women’s fit preferences for differently fitted skirts and jackets may contribute to fit problems in Kenya (Primary objective 6)
Fit preference is subjective and varies from one person to another. The comfort or ease that
a person requires in an apparel item depends on the physical characteristics of that
individual’s body (critical fit points) as well as internal influences such as personal
preferences, expectations and the look that that individual desires (Alexander, Connell &
Presley, 2005). Kenya’s career women’s preferences for differently fitted skirts and jackets
(Figure 6.18) indicate that the majority of the respondents prefer fitted and semi-fitted skirts
and jackets, while they least prefer loosely fitted skirts and jackets. An observation made in
this study (Chapter 5)) indicates that large buttocks, stomachs, thighs and bust characterise
the distinct rectangular shape. The loose fit problems experienced around the shoulders, the
back width and neck line regions also highlights that the upper torsos of the career women in
Kenya were smaller than the base pattern used in the apparel industry. These characteristics
deviate from the characteristics of the so-called ideal shape that is used for pattern design
and apparel creation. Consumers with these prominent body characteristics and wearing
fitted or semi-fitted skirts and jackets are likely to experience problems with tight fit at the
area of prominence. The consumer’s preferred needs regarding fit would be catered for If the
available designs were based on the prominent characteristics of this specific body type
(curvy rectangular body shape). In the absence of the distinctive body shape as a design
guide, the curvy rectangular body shape could be accommodated more comfortably and
pleasingly by loosely fitted apparel as they contain enough wearing (comfort) and design
(style) ease. It is possible that consumers’ fit preferences are dictated by fashion trends
rather than their knowledge about appropriate apparel styles for their shapes and their critical
fit points. In such instances, fit problems encountered could be ascribed to consumers’
inappropriate fit preferences that do not take into account their body shapes and the critical
fit points associated with their shapes.
The body’s size and shape and the perceived needs of the consumer determine appropriate
apparel styles and sizing in terms of the fabric’s properties, the amount of ease required for
comfort, movement and an attractive appearance (Huck, et al., 1997; DeLong et al., 1993).
The fit preferences of the consumers must therefore be synchronised into overall suitable
and accepted styles. Regarding the chosen styles, the majority (63%) of the respondents
were unable to select suitable styles for the distinctive rectangular body shape, but about half
(51%) of them were able to select styles for their perceived body shape (hourglass). These
findings may suggest that fit problems encountered by the Kenyan career women could be
ascribed to their fit preferences that do not take into account their body’s actual

213
characteristics. Considering that consumers were able to select suitable apparel for the
hourglass shape (fit model), it reveals that Kenya’s career women’s fit preferences could be
influenced by fashion trends rather than by the comfort needed from fashionable apparel.
Internal influences such as fashion trends, expectations and the look that one desires also
influence consumers’ fit preferences (Alexander, Connell & Presley, 2005). Physical
(aesthetic) characteristics or the emotional experience that the consumers expect or get from
purchasing certain apparel may also contribute to their preference for a certain degree of fit
in specific apparel rather than considering the body’s actual characteristics (Pisut & Connell,
2007; De Klerk & Tselepis, 2007). It should be recognised that body-hugging apparel items
were in fashion at the time of data collection and are still currently in fashion. In this respect,
problems encountered at critical fit points could be attributed to consumers’ inappropriate fit
preferences that do not take their critical fit points into consideration. Consumers’ ignorance
on the appropriate degree of fit required in different apparel styles, and the basic elements
and principles of design applicable for different body shapes, could also lead to inappropriate
fit preferences and consequently, fit problems.
214
Chapter 7
CONCLUSIONS, EVALUATIONS, CONTRIBUTIONS TO THEORY AND RECOMMENDATIONS
7.1 INTRODUCTION
The aim of this research was two-fold. The first phase had three objectives (1, 2 and 3) with
the aim of:
Identifying and describing distinctive female body shapes of career women in Kenya,
using body dimensions and photographs;
Describing the differences between the emerging distinctive body shapes (from
measurements and photographs) and the Western distinctive shapes; and
Describing and analysing the fit implications associated with the emerging distinctive
body shapes of Kenya’s career women.
The second aim (phase two) entailed three objectives (4, 5 and 6) aimed at:
Assessing and describing career women’s self-perceived fit issues with the ready-
made apparel in Kenya;
Determining and describing Kenyan career women’s knowledge about the
communication of size (key body dimensions) and fit (body shapes); and
Determining and describing career women’s fit preferences for differently fitted apparel
items in Kenya.
A quantitative approach was used throughout the study. In the first phase, a body
measurement form was used to record the body measurements obtained from the
participants. An assessment scale was also used to record visual assessment data from the
photographs. For the second phase, a structured questionnaire was used to collect data for
the purposes of assessing and describing perceptions regarding general fit problems with the
ready-made apparel in Kenya, determining and describing career women’s knowledge about
the communication of size (key body dimensions) and fit (body shapes), and describing
career women’s fit preferences for differently fitted apparel items in Kenya.

215
7.2 GENERAL CONCLUSIONS REGARDING PHASE ONE DATA
7.2.1 Conclusions regarding the distinctive female body shape of career women in Kenya (Objective 1)
It can be concluded that the most dominant body shape that emerged from this study is a
curvy rectangular shape. Although the most prevalent body shape in Western society is also
rectangular, Kenya’s rectangular body shape differs significantly from the Western shape.
The Western rectangular shape is nearly straight when viewed from the side, front and back.
Contrary to the Western body shape, Kenya’s rectangular shape is curvier, particularly from
the side view, with large buttocks (“d”) and a rounded upper back region, giving rise to a well-
defined hollow back waist region. The front is typified by a well-pronounced stomach, similar
to the letter “D” (Figure 5.5). As observed in this study, the round upper back regions tend to
become less pronounced, while the stomach gets more rounded (“D”), as the female matures
(Figures 5.3 and 5.4 in Chapter 5). The rounded upper back and the “D” stomach shape
were significant with the older women, while the well-defined hollow waists were not
significant in or confined to any specific age group only.
7.2.2 Conclusions regarding differences between the distinctive body shapes of
Kenya’s career women and the Western (American) distinctive body shapes (Objective 2)
In conclusion, it is clear that the rectangular body shape is the most prevalent body shape,
both in this study and in the United States of America. The second most prevalent shape in
this study is the triangular shape, which differs from the American second most prevalent
spoon shape (Figure 7.1). As discussed earlier, in Chapter 5 (paragraph 5.5), this study
used only three measurements (bust, waist and hips) for defining body shape, while
America’s classified female shapes used six measurements (bust, waist, hips, high hip,
abdomen and stomach), hence a comparison cannot be done on all aspects. However, as
seen in Figure 7.1, the American rectangular shape appears straight, all the way from the
shoulders to the hip line. The distance between the hip and waistline appears shorter, with
no clearly defined hipline or waist indentation. Kenya’s rectangular shape –contrary to the
American shape – appears curvier, particularly around the hip and thigh areas. The waist to
hipline distance appears longer, with a well-defined thigh bulge. It should be noted (Figure 7.1) that the American figures are standing with the legs apart; thus the appearance of the
hip outline shape is not realistic. Since the second most distinctive body shape in America
differs from Kenya’s second most distinctive body shape, critical comparisons will not be

216
made, although from the pictures given (Figure 7.1), one could say that both body shapes
(Spoon & Triangle) have wider hips than bust and shoulders.
America’s distinctive female body shapes Kenya’s distinctive female body shapes
(Source: Simmons et al., 2004)
(Source: Present study)
Rectangular body shape (46%)
Spoon body shape (21%) Rectangular body shape (74%)
Triangular body shape (21.5%)
FIGURE 7.1: DISTINCTIVE FEMALE BODY SHAPES IN AMERICA AND KENYA
A side view characteristic found with the American distinctive rectangular body shape is the
large stomach, which could be “D”-, “B”- or “b”-shaped, as observed by Connell et al. (2006).
It is also characterised by flat back curvature, right from the upper back to the buttocks,
appearing like an apple body shape’s profile view (Figure 7.2) (Simmons et al., 2004).
Rasband and Liechty (2006:25-26) report that once a rectangular shape attains more weight,
it results in an apple shape (Rasband & Liechty, 2006:25-26). The front view of Kenya’s
distinctive rectangular shape is characterised by a similar width over hips and shoulders, with
a small waist indentation. The thighs bulges out on the side beyond the hip width and are full
on the inside (at the crotch), in contrast to the Western body shape. A rounded upper back
characterises the profile view, with more roundness concentrated just below the shoulder line
and the chest. The back curvature tapers narrowly towards the waistline and abruptly meets
the full buttock contour, resulting in a deep hollow waist region. The front view in profile is
characterised by a high abdominal contour that begins to protrude just below the bust line. It
begins to curve round almost immediately and increases as it leads down to the crotch at the
centre of the body, resulting in a “D” appearance (Figure 7.2).

217
America’s rectangular body shape’s side view
characteristics
Kenya’s rectangular body shape’s side view
characteristics
Smooth and gently curved back, almost straight with
less rounded upper back and gently curved buttocks.
The front is characterised by a “D”-shaped stomach.
Curved back straight with rounded upper back,
hollow waistline and rounded buttocks (“d”-shaped).
The front is characterised by “D”-shaped stomach.
FIGURE 7.2: SIDE VIEW CHARACTERISTICS OF AMERICA’S AND KENYA’S DISTINCTIVE RECTANGULAR BODY SHAPES
7.2.3 Conclusions regarding apparel fit problems associated with the distinctive body shapes of Kenya’s career women (Objective 3)
Apparel based on the hourglass body shape as a fit model used for the production of ready-
made apparel (Alexander et al., 2005; Zwane & Magagula, 2006), makes fit problems such
as tight hips, crotch, bust and stomach experienced by Kenya’s career women, inevitable. A
curvy rectangular body shape with well-pronounced body characteristics such as large
buttocks, rounded upper back, hollow waistline and “D”-shaped stomach, is likely to
experience fit problems around these regions.
As predicted in Chapter 5 (paragraph 5.6), major fit problems that could be expected to be
experienced by a woman with a curvy rectangular shape could include tight fit at the hip
region, crotch line and thighs, which may lead to wrinkles and ripples forming around the
affected area, a tight fit at the waistline that could lead to wrinkles around the waist region,
apparel riding up, and inappropriate style and dart positions due to a large stomach (“D”),
tight bust line, tight armholes and tight pull in the upper back area. Diagonal wrinkles may
also form around the prominent regions of the body.

218
In confirmation of the predicted fit problems, the Kenyan career women expressed
dissatisfaction with the way that ready-made apparel items fit their critical fit points. The
majority of the career women reported fit problems more than they reported acceptable fit at
the various fit points of the upper and the lower torsos. There were problems of tight fit
reported at the lower torso’s critical fit points (hip/buttocks and thigh regions), and also
problems of tight fit reported at the bust line region, which integrates fit problems around the
rounded upper back and the large bust. With the confirmation of the predicted fit problems, it
becomes apparent that it would be unrealistic for apparel industries to continue
manufacturing styles and sizes that are suitable for the hourglass body shape (fit model), and
expect to fit the curvy rectangular shape appropriately. Having observed the differences
between both the distinctive rectangular shapes (America’s and Kenya’s), it also became
obvious that the body shapes indeed do differ, and that there is a need to evaluate and
understand body shapes of different market segments rather than make-do with estimates.
The quality of apparel regarding its fit, can only be attained collectively, through dress forms,
fit models and sizing systems, which must represent the target population’s sizes and body
shapes (Salusso-Deonier, 1989; Ashdown et al., 2004).
It can be concluded that the apparel industry’s ignorance about the distinctive body shape’s
characteristics would lead to inappropriate design features and inappropriate fit quality
strategies employed in the industry. The body shape serves as a design guide for the
production of suitable styles, using appropriate fabrics and suitable sewing techniques and
notions. Understanding the prevalent body shape and body features of a population in a
specific market, could serve as a guide to the apparel industry’s designs, fit models and
dress forms for fit-testing strategies, and for distributing correct sizes and styles accurately to
the marketplaces. The Western view of the hourglass body shape as ideal shape or
representing all body shapes, can lead to designing and distribution of apparel that will not fit
the consumers appropriately.
7.3 GENERAL CONCLUSIONS REGARDING PHASE TWO DATA
7.3.1 Conclusions concerning career women’s self-perceived fit issues with the
ready-made apparel in Kenya (Objective 4)
Kenya’s career women consumers expressed dissatisfaction with the unavailability of
appropriate styles for their sizes and shapes. The critical fit points of Kenya’s career
women’s curvy rectangular bodies (buttocks, thighs, upper back, hollow waist, stomach, bust
and non-proportional height positions) deviate significantly from the so-called ideal figure’s

219
(hourglass) body characteristics. Consumers’ dissatisfaction with the fit of ready-made
apparel is further confirmed by the many reported fit problems encountered at the different
critical fit points of the consumers’ bodies. The reported problems of tight fit at the hip/thighs,
buttocks, upper arm and bust regions also confirm the prominent buttocks, thighs, bust,
upper arm and the rounded upper back regions that are common to the distinctive shape in
this study. Since most of the ready-made apparel items are based on the “perfect”
(hourglass) figure, the fit problems encountered by Kenya’s career women are inevitable on
a body shape with features that do not match the proportions of the ideal figure.
Dissatisfaction with the fit of apparel could also be attributed to frustrations encountered
during an apparel search. Inadequate information given on Kenyan garment labels would
likely contribute to consumers’ frustrating dilemma during apparel selection. Women
consumers in Kenya lack knowledge about the meaning of tacit labels and cannot
comprehend and link the meaning of the labels to the given size codes and their own
measurements. Although Kenya’s career women perceive the fit of imported, custom-made
and second-hand ready-made apparel categories as good, the actual fit of imported, custom-
made and second-hand apparel could be worse than reported, as confirmed by their
expressed dissatisfaction with the unavailability of appropriate styles and sizes. The personal
attention and fitting processes involved while garments are constructed may result in women
perceiving the fit of custom-made apparel as better. Extrinsic features such as emotional
satisfaction, rather than the intrinsic (fit) aspects of apparel, may contribute to the positive
perception of fit with both imported and second-hand apparel – rather than its actual fit (De
Klerk & Tselepis, 2007). Kenya’s career women’s “ego” drive towards the imported apparel
could be the main reason behind the perceived good fit (Agbonifoh & Elimimian, 1999;
Hansen, 1999:359; Mhango & Niehm, 2005). In practice, the lack of a representative
anthropometric database (size tables and body shapes), and the unrepresentative and
uninformative communication of size and fit are the major sources of fit problems (Salusso-
Deornier, 1989; Ashdown, 2000).
Significantly, Kenya’s career women perceive both their body shapes and the apparel
industry as the source of the fit problems, thereby confirming their state of confusion.
Confusion regarding the source of the fit problems could attribute the locus of the problem
externally by blaming the apparel industry, and internally by blaming their bodies in a
negative way (Weiner 1986). Consumers, who are equipped with adequate knowledge about
the products they are buying, are likely to link the cause of the problem to the manufacturer.
Confused and unskilled consumers are less able to process information and are more
vulnerable to making less than optimum apparel style and size choices.

220
7.3.2 Conclusions regarding Kenyan career women’s knowledge about the communication of size (key body dimensions) and fit (body shapes) (Objective 5)
Although Kenya’s career women preferred informative size labels, it can be concluded from
this research that Kenya’s career women lack knowledge about the meanings of various size
descriptions that are familiar to them. They are partially knowledgeable about their bust and
waist dimensions, but are more knowledgeable about their hip dimensions. Problems with
tight fit reported at the regions of the hips, the buttocks and the thighs of the consumers,
confirm that these regions are calling for closer attention. A consumer with a prominent hip
region is likely to experience problems with tight fit, which may aggravate her desire to
understand the dimensions around it. Various factors may contribute to consumers’ problems
with regard to the fit of their clothes and to their problems regarding the finding of suitable
sizes that fit their bodies. According to Ashdown (2000), these factors may be the
population’s measurements, the design features, the fit issues and the communication of
sizing and fit – in other words, the information that is communicated to consumers and that
they can interpret and use as knowledge when purchasing apparel items. In the case of the
Kenyan consumer of female apparel, the lack of knowledge (which implies that there is no
meaningful communication between the apparel industry and the consumer), is probably an
important contributing factor to her problems with getting the right size and her dissatisfaction
with the fit of apparel.
Familiar size labels showed no significant associations with consumers’ knowledge about the
meaning of size labels and the age (experience) of the consumers. Being familiar with, and
long experience of size labels or apparel selection, and being knowledgeable about size
codes, are clearly different concepts, implying that being exposed to information in the
consumer socialisation process does not automatically result in an informed consumer who
has the knowledge needed when trying to make informed decisions. With this, it can be
concluded that getting information and being familiar with the way that it is presented, do not
automatically mean correct interpretation of the information, to the extent that it can be
viewed as meaningful knowledge that can successfully be applied in a decision-making
situation. It can also be concluded that, although they prefer the more informative and
descriptive size labels, female Kenyan apparel consumers are familiar with most of the non-
informative descriptive size labels that are currently used to indicate the sizes of most female
apparel items.
As in the case of tacit labels, the apparel industries in Kenya are neglecting the
recommendations by KEBS (2001:7) to use instructive labels. The lack of body shape terms

221
on size labels/tags would mean inappropriate apparel selection by the consumers, as they
have nothing to guide them. A size label should not only indicate key dimensions but also
describe the body type that the apparel item was designed for (Glock & Kunz, 1995:108;
Chun-Yoon & Jasper, 1995). Although manufacturers/retailers hardly include body shape as
a communication of fit, size label terms that represent body shapes were not familiar or
comprehensible to Kenya’s career women. This means that career women in Kenya cannot
relate their own shapes to the available ready-made apparel styles. Unawareness of their
own shapes could possibly indicate ignorance about the basic elements and principles of
design, which would be useful in the selection of appropriate apparel styles. Kenya’s career
women’s preference for the hourglass body shape is also a signal that they view their shapes
unrealistically – and hence their inappropriate apparel selection. Consumers who are
knowledgeable about their own body shapes and skilled in the application of the basic
elements and principles of design, are likely to make effective selection of appropriate
apparel items, while they would also express satisfaction with their body shapes. Presenting
uninformative size labels to ignorant consumers on size and fit may create a state of
confusion regarding the sources of fit problems and maintain their lack of skills to tackle the
problems. However, if size labels were informative, then women would possibly measure
themselves more carefully and perhaps get to internalise their key dimensions and
understand their shapes. There was a significant relationship between consumers’
professional background and their familiarity with size labels and knowledge about the
meaning of body shape terms. Some of the terms used to represent body shape on the size
labels were familiar to professional home scientists who also understood the terms. It must
therefore be appreciated that formal education on size and fit issues could equip learners
with useful knowledge.
A consumer’s knowledge plays, from an expectancy disconfirmation point of view, an
important role in the expectations that the consumer forms about a product, in this case
apparel products. Knowledge also plays an important role when the consumer has to
evaluate the apparel item at the point of purchase, and again when she wears the garment
and has to decide whether she is satisfied or dissatisfied, and where the cause of the
problem lies. A consumer with inadequate knowledge, in this case inadequate knowledge
about sizing and fit, would not be able to make informed decisions regarding the size and fit
of a garment – thus she stands a better chance to make the wrong choice. Without adequate
knowledge of her own body measurements, knowledge of how a garment is sized, and an
understanding of the meaning of the terms used on the size label, the consumer would also
not be able to know why a garment does not fit properly and would therefore be unable to
correct the problem in future purchases.
222
Oumlil, Williams and Oumlil (2000) underline the need for, and the value of, consumer
education, and state that it can become an effective and viable tool through which marketing
strategies can be implemented, to the extent that it can become a form of self-promotion and
advertising. Professional background in Home Science had significant associations with
consumers’ knowledge on size labels and terms that represent body shape, signifying that
formal education on size and fit could equip learners with useful knowledge. As suggested by
Oumlil et al. (2000), education should be part of any company or retailer’s competitive
strategy, with the advantage that it would help to obtain, and keep, satisfied customers,
would contribute to a favourable attitude formed amongst the consumers and would help to
reduce confrontations between customers and apparel suppliers.
7.3.3 Conclusions regarding Kenyan career women’s fit preferences for differently fitted apparel items in Kenya (Objective 6)
With reference to the fit preferences of Kenya’s career women, it may be concluded that they
prefer fitted and semi-fitted skirts and jackets. The predominant rectangular body shape of
the Kenyan career women can be fitted comfortably and appealingly with more fitted apparel,
if the majority of the available designs were based on this specific body type. The curvy
rectangular body shape’s prominent characteristics such as the large buttocks, the rounded
upper back, hollow waistline, large upper arms and large bust should therefore be well
understood by the apparel industry so as to cater for their preferred needs. It is also possible
that consumers’ fit preferences are dictated by fashion trends rather than by a knowledge of
the appropriate apparel styles for their shapes or their critical fit points. Where no body shape
considerations are considered while manufacturing ready-made apparel, the curvy
rectangular body shape could be accommodated more comfortably and pleasingly by loosely
fitted apparel as it contains enough wearing (comfort) and design (style) ease. Significantly,
those who reported acceptable fit at the stomach region preferred fitted skirts, while those
who reported tight fit at the thigh and bust regions preferred semi-fitted skirts and jackets,
respectively. This may indicate that comfort required around the stomach, bust and thigh
regions could determine the degree of ease necessary in skirt and jacket for some career
women in Kenya. Fit problems encountered could therefore be ascribed to the unavailability
of appropriate styles designed for the curvy rectangular shape, and inappropriate fit
preferences that do not take into account consumers’ curvy rectangular body shape and its
critical fit points.

223
7.4 OVERALL CONCLUSION OF THE STUDY
The given framework (Figure 7.3) will be used to direct the overall conclusions drawn from
this study.
FIGURE 7:3: FACTORS THAT MAY CONTRIBUTE TO WOMEN’S DISSATISFACTION
WITH THE FIT OF APPAREL
The framework (Figure 7.3) was developed with the theory (Ashdown, 2000), the objectives
and the findings of the study in mind, and it serves as a means to understand the various
Body shape categories Hourglass, Triangle, Apple, Inverted triangle,
Rectangle, Spoon, Top hourglass, Bottom hourglass and others (e.g. curvy rectangular
shape of this study) (Design features (2) and Fit issues (3))
Body shapes’ classification techniques
(Population measures (1))
Body images/photographs
(Population measures (1))
Size labels
Uninformative
Numerical code Lettered code
Informative
Wordless Pictograms Code and key dimensions Wordless pictogram + dimensions
Sizing issues Fit issues
Established body shape terms
Junior misses, misses-petites, women’s, and women’s-petites
Consumers’ fit preferences
Fitted (skirt, jacket/blouse) Semi-fitted (skirt, jacket/blouse) Loosely fitted (skirt, jacket/blouse)
FIT PROBLEMS WITH THE READY-MADE APPAREL
Consumer’s knowledge about size and fit
(Communication of sizing and fit (4))
Body dimensions (Population measures
(1))
Perceived fit problems
Body shapes’ critical fit points (upper torso, lower torso and the arm)
Satisfaction with ready-made apparel (apparel search, available styles and sizes)
Perceived sources of fit problems (apparel industry and own body shape)
Consumers’ knowledge about their own body
shapes and own key body dimensions
Hourglass body shape (Idealized body shape) (Design features (2) and fit issues (3))
Consumer’s fit preference for Hourglass-idealized
body shape)

224
factors that contribute to women’s dissatisfaction with the fit of apparel in Kenya and other
parts of the world. These overall conclusions will revolve around Ashdown’s (2000) model
which includes four major factors, namely, population measures, design features, fit issues
and communication of size and fit. Overall conclusions will also include consumers’
perspective on matters that could affect apparel’s size and fit, such as knowledge about
communication of size and fit, preference for an hourglass body shape, fit preferences and
perceived fit problems.
After the overall conclusions, it will be followed by an evaluation of the limitations and
success of the quantitative research style, data collection methods, sample selection, data
analysis, the quality of the study and the achievement of the objectives. The study’s
contribution to the existing theory is also discussed, while recommendations are made to the
apparel industry (manufacturers and retailers), the government and the consumers.
7.4.1. Overall conclusions based on Ashdown’s (2000) four major factors revolving
around sizing systems 7.4.1.1. Population measures and the distinctive body shape
Population measurements as one of the four major components of Ashdown’s (2000) model
demand that the body dimensions should be obtained from the three-dimensional body in an
explicit way that will facilitate body shape classifications. Accurate reflection of the three-
dimensional body’s characteristics would be achieved when the apparel has been made
based on all the elements of fit (grain, set, line, balance and ease) and dressed on the body
(Erwin et al., 1979). It can be concluded that Kenya’s apparel industry, as well as foreign
companies that export their apparel merchandise to Kenya, do not understand Kenya’s
distinctive curvy rectangular female body shape, nor its representative body measurements. Most sizing systems available in Kenya do not include a classification of body shapes, which
is the core component of a successful sizing system (Chun-Yoon & Jasper, 1996; Istook &
Hwang, 2001). According to Kenya’s sizing standards (KEBS, 2001), anthropometric data
was last collected in 1975, which means it is outdated. Zwane and Magula (2006) report that
most apparel industries in developing countries actually adapt western sizing systems
without considering variability of body shapes and sizes that exist in their markets. Fit
problem in Swaziland has also been found to be as a result of mismatch between the actual
measurements of Swazi women and the key dimensions of existing size charts. As observed
in this study, Swaziland women’s body shapes also do not conform to the Western idealized
hourglass body shape and measurements (Zwane & Magula, 2006).

225
A sizing system entails the assignment of body dimensions to a group of body shapes
representing a market segment (Ashdown, 2000; Keiser & Garner, 2003:30; Salusso-
Deonier, 2005; Petrova, 2007:57). It has been reported that a sizing system that sets out to
satisfy its target market must be up to date, precise in its measurements and body shape
classification (proportions) and must represent the population it was designed for (Salusso-
Deonier, 1989; Delk & Casill, 1999; Schofield, et al., 2006). Apparently, size and fit problems
is an international outcry. Studies carried out in developed countries (USA, UK and Canada)
also indicate that sizing systems used are as old as the 1940s’ and 1950s’. Although national
anthropometric surveys have been carried out recently in most of these developing countries,
most apparel industries are still reluctant to implement the data as sizing systems and hence
persistent fit problems (Newcomb & Istook, 2004a; Otieno, et al., 2005; Ashdown & Dunne,
2006; Faust et al., 2006; Shin & Istook, 2007).
7.4.1.2. Design features and the distinctive body shape
Design features, being the second most important factor highlighted in Ashdown’s (2000)
model, necessitate that the body’s framework (three-dimensional characteristics) be rightfully
translated into patterns for the construction of well-fitting apparel. Lewis (2007:319) states
that the body shape and the apparel silhouette worn become attached and united so that the
body shape beneath the apparel enhances the aesthetic appeal of that particular apparel,
while the apparel silhouette enhances the aesthetic appeal of the entire person. Considering
that the body measurement tables in Kenya are based on an outdated anthropometric
database in combination with a lack of classified body shapes, it is possible that sizing
systems currently in use could be an adaptation of the 1975 data, borrowed or adapted from
other countries. This means that apparel items available in the Kenyan markets are based on
estimations rather than on facts. Body shape terms represented on the size labels are not
familiar to Kenya’s consumers, clearly indicating that size labels attached to the garments
before being dispatched, do not indicate the body shape of the intended consumers. Without
body shape as a design guide, it is possible that the styles produced are based on
approximations and arbitrary distributions to the market place, thus confirming consumers’
dissatisfaction with the fit of ready-made apparel.
Apparel is the product of a design process and the fabric’s properties, and its quality is
measured by its appearance and comfort on the body shape. The body shape functions as a
frame for the apparel (Salluso-Deonier, 2005), and the fabric’s properties and the apparel’s
style must be in harmony to produce aesthetically pleasing, comfortable and well-fitting
apparel. Currently, media and apparel companies worldwide use a well proportioned but
relatively slim hourglass body shape for their fashion shows and catwalks (Brown & Rice,

226
2001:154; Yu, 2004:33; Loker et al., 2005). This is viewed in Western society as ideal (Yu,
2004:33; Zwane & Magagula, 2006; Pisut & Connell, 2007). Armstrong, (1995:33) define the
ideal figure female body structure with well-balanced features. The perfect body is assumed
to provide a silhouette that will fulfil everyone’s desired image of perfection, but in reality it
denies the consumers with diverse body shapes and sizes, the opportunity to see and
understand their body structures sensibly (Lewis, 2007:319). Apparel designed, modelled
and sized according to this idealized body shape would certainly not fit consumers with
varied body shapes and sizes. As earlier mentioned the reluctance by most apparel
industries to implement anthropometric data into useful sizing systems, size and fit problems
inevitably continues to bother consumers irrespective of regions and countries.
7.4.1.3. Fit issues and the distinctive body shape
The fit issues being the third important part of Ashdown’s (2000) model involve fit quality
management strategies that call for certain fit testing techniques such as the use of fit
models and dress forms. Fit is the apparel’s silhouette and size, and these have to be right
for the humans’ body shapes and dimensions (Kadolph, 1998:550; Keiser & Garner,
2003:315; Solomon & Rabolt, 2004:196). Therefore, the fit models and/or the dress forms
used for fit testing must conform to the body characteristics of the distinctive figures and
sizes of the target market. It may be concluded therefore that, without representative body
measurements or an identified body shape, it would be almost impossible to formulate and
administer fit quality strategies.
Representative anthropometric data and identification of distinctive body shapes of any
specific target market form the foundation of the successful production and distribution of
ready-made apparel. Understanding prominent body characteristics of a prevalent body
shape plays an important role in the production and distribution of appropriate and correct
numbers of apparel styles and sizes to a specific marketplace. The body shape serves as a
design guide for the pattern development and consequently, well fitting apparel. It is
therefore critical to analyse and understand the body proportions of the dominant shape in
any country rather than the assumptions that all shapes are ideal (Hourglass), as these
determine the overall design values that can be incorporated into garment production, the
development and implementation of quality assurance measures right from illustration stage
(style decision), pattern creation, fabric selection and dispatch.

227
7.4.1.4. Communication of sizing and fit, the distinctive body shape and the key body dimensions
Communication of sizing and fit, being the fourth important factor in Ashdown’s (2000)
model, requires that measurements and body shapes indicated on the size labels reflect the
true picture of the target market (population). The garments made in the industry require that
body measurements be translated from a body measurement table into patterns, and finally
into garments. Size labels are attached to the garments whilst in the assembly process. The
information given on the labels must therefore reflect the correct original dimensions and
body shape that they purport to represent. Failing this, the apparel item will land on
consumers whose dimensions and body shapes differ – hence, fit problems.
It can be concluded that uninformative size labels are presented on Kenya’s ready-made
apparel – labels that are not instructive and cannot be useful during garment selection.
Although Kenya’s female consumers prefer the more informative, descriptive size labels, the
uninformative size labels are familiar to them. Istook (2002:65) highlights the importance for
manufacturers to communicate to their consumers, how each apparel item was designed to
fit. This communication is an indispensable step in meeting the fit expectations of
consumers. Misleading information often leads to consumers’ confusion, which can affect the
quality of consumers’ purchase decisions (Mitchell & Papavassiliou, 1999). Continuous
presentation of the uninformative labels in Kenya may be viewed as deliberate refusal by the
apparel industry to adhere to the recommendations by KEBS (2001:7). Also observed in
Canada (Faust et al., 2006), USA (Newcomb & Istook, 2005; Shin & Istook, 2007) and
Swaziland (Zwane & Magagula, 2006), apparel industries do not adhere to measurements
assigned to the recommended size codes.
The lack of body shape terms on size labels/tags would mean inappropriate apparel
selection by the consumers, as they have nothing to guide them. A size label should not only
indicate the key dimensions but also a description of the body type that the apparel item was
designed for (Glock & Kunz, 1995:108; Chun-Yoon & Jasper, 1995). Consumers have a right
to clear and understandable information regarding the product that they are buying, and this
should appear on the product itself. It is therefore advisable for the apparel retailers to clearly
indicate the body dimensions and body shapes of their target consumers and to ensure that
size labels attached to the garments are communicating the correct information effectively. In
other words, there must be a plausible relationship between anthropometric data, the size
charts and the sizes presented on the apparel. Informative size labels based on
representative anthropometric data inform the consumer about the dimensions used, and
about the body shape that the apparel will fit best. In conclusion therefore, obsolete sizing

228
systems and ignorance about the prevalent body shape in Kenya are leading to the use of
vague size labels that do not only confuse the consumers, but also do not represent their
true measurements and body shapes.
Variations that exist between apparel sized with the same codes from one company or
different companies could be traced to the use of obsolete and/or wrong measurements,
either initiated by the manufacturer or the retailer. Methods of obtaining body dimensions are
not standardised amongst stakeholders (manufacturers and retailers), thereby creating
leeway for most apparel industries (manufacturer/retailer) not to adhere to the suggested
(voluntary) standard size communication systems (Faust et al., 2006). The pattern
development, grading, fabric spreading, cutting and assembling procedures employed by
different manufactures are inconsistent, resulting in confusing sizing systems in the
marketplace (Hudson, 1980:112; Solinger, 1988:128; Brown, 1992:29; Glock & Kunz,
1995:390). Failure of quality control measures due to lack of guidance provided by
representative size tables and body shapes could easily permit errors to slip through from
one section of apparel processing to the other, ending up in consumers’ hands in a retail
environment.
It is clearly the responsibility of the retailer and the manufacturer collectively to work together
in ensuring that body shapes and body dimensions used in the construction of the apparel,
are effectively communicated through size labels to the consumers. Retailers are direct
customers of the manufacturers, as they provide size and style specifications to the
manufacturers. Manufacturers have the responsibility of producing the apparel as per these
specifications. Since retailers are the order initiators, they are required to give size and style
specifications based on accurate shapes and sizes of the target market.
7.4.2 Overall conclusions based on Consumers’ perspective regarding matters
that could affect apparel’s size and fit
7.4.2.1 Consumer’s lack of knowledge about the communication of sizing and fit
It can be concluded from this research that female Kenyan apparel consumers lack
knowledge of their own and different body shapes, the meanings of various size descriptions
used on labels, and also lack knowledge of their own key body dimensions which serve as
indicators of appropriate sizes. Various factors may contribute to consumers’ problems with
regard to the fit of their clothes and to their problems regarding the finding of suitable sizes
that fit their bodies. According to Ashdown (2000), one of the factors affecting size and fit is
the communication of sizing and fit – in other words, the information that is communicated to

229
consumers that they can interpret and use as knowledge when purchasing apparel items.
Workman (1991), Desmarteau (2000) and Brown and Rice (2001) underline the importance
of consumers’ knowledge of their own measurements, and of which body measurements are
necessary when choosing certain garments. In the case of the Kenyan female apparel
consumer, the lack of knowledge (which implies that there is no meaningful communication
between the apparel industry and the consumer) is probably an important contributing factor
to her problems with getting the right size and also her dissatisfaction with the fit of clothes.
7.4.2.2 Consumers’ preference for an hourglass body shape The body, as frame structure for proportioning apparel, must be well understood by the user
in terms of shape and proportions. A consumer without knowledge could assume that all
people have bodies similar to that of the fit model or to that of the perceived ideal shape.
Career women consumers in Kenya perceive the hourglass body shape as ideal, and as a
reflection of their own body shapes; therefore they select apparel styles that are suitable for
the hourglass body shape. They are not only uninformed about their own and others shapes,
but are also unrealistic about their own shapes. Unrealistic perception of the self could lead
to purchasing apparel suitable for the fit model or for the perceived ideal shape – rather than
for the own actual body shape. Consumers who are unaware about the different body
shapes are likely to also be ignorant about the elements of good fit, and hence will select
apparel based on other factors such as colour, style and current fashion, eventually
purchasing apparel with fit problems. Knowledge about the different body shapes facilitates a
comparison of the proportions between different body shapes, which ultimately eases
apparel selection.
7.4.2.3 Consumers’ fit preferences
The study has shown that Kenya’s career women prefer fitted and semi-fitted skirts and
jackets. This could be influenced by fashion trends rather than the comfort needed from
fashionable apparel, as confirmed by the selection of styles that are suitable for the
hourglass shape (fit model) rather than for their actual shapes. Physical (aesthetic)
characteristics or emotional experience that the consumers expect or get from purchasing
certain apparel may also contribute to a preference for a certain degree of fit in specific
apparel (Pisut & Connell, 2007; De Klerk & Tselepis, 2007). If the available designs were
based on the curvy rectangular body shape’s prominent characteristics, the consumer’s
preferred fit needs would be catered for. In this respect, problems encountered at the critical
fit points would be attributed to inappropriate fit preferences that do not consider the
distinctive body shape’s critical fit points. Consumers’ lack of knowledge about the
230
appropriate degree of fit required in any apparel style, and the basic elements and principles
of design applicable for different body shapes could also lead to inappropriate fit preferences
– and consequently, fit problems.
7.4.2.4 Consumers’ perceived fit problems
It may be concluded that Kenyan career women perceived fit of the imported new and
second-hand ready-made apparel as good, although they are generally dissatisfied with the
way the ready-made apparel items fit their critical fit points. The Majority of the career
women, however, report more problems with either tight or loose fit than they report
acceptable fit at the various fit points of the upper and the lower torsos. Consumers’
dissatisfaction confirms the fact that the distinctive Kenyan female body shape (curvy
rectangle) in deed differs, not only from the idealised ideal hourglass figure, but also the
western rectangle figure (Newcomb & Istook, 2004a & 2004b; Zwane & Magagula, 2006). As
reported by Kurt Salmon Associates (1996) in the United States of America, Otieno et al.
(2005) in the United Kingdom and Faust et al. (2006) in Canada, it appears therefore that
consumers’ dissatisfaction with apparel’s fit is becoming a global problem.
As observed through out this study, fit problems arise from:
Lack of distinctive body shape and body dimensions necessary for designing and
distributing appropriate styles and sizes to a specific market from which the shapes
and sizes were obtained
Use of uninformative size labels presented on garments, which are not understood and
not preferred by the consumers
Consumers’ lack of knowledge – not only about the size codes, but also about their
dimensions and body shapes, and therefore they will make the inappropriate apparel
selection
Inappropriate style choices based on the perceived ideal figure rather than on the
actual body shape
Consumers’ lack of knowledge about the appropriate degree of fit required in any
apparel style, and about the basic elements and principles of design applicable for
different body shapes, and their inappropriate fit preferences that do not consider a
distinctive body shape’s critical fit points

231
7.4.2.5. Consumer’s perceived sources of fit problems Kenya’s career women are confused about the source of fit problems, so they attribute the
locus of the problem externally by blaming the apparel industry, and internally by blaming
their bodies in a negative way (Weiner, 1986). Informed consumers with adequate
knowledge about the products they buy are likely to link the cause of the problem to the
manufacturer. Confused consumers are less able to process information and are more
vulnerable to making less than optimum apparel style and size choices. As female
consumers continuously purchase substandard apparel fostered by their state of confusion,
they could get emotionally distressed, incur financial losses and be exploited by the apparel
industry (Mitchell & Papavassiliou, 1999). A consumer who believes that the manufacturer or
retailer is responsible for the fit problem would probably direct negative emotions to the
apparel industry. This also has negative consequences for the manufacturer because the
consumer would probably engage in negative post-purchase complaint behaviour, such as
boycotting the retailer, switching to another brand and even telling friends (Laufer, 2002).
7.5 EVALUATION OF THE STUDY
Evaluation is necessary for the purposes of follow-up and could serve as a guideline for
similar future studies. This study is hereby evaluated in terms of the quantitative research
style (sample selection, data collection and data analysis), the quality of the data and the
achievement of the objectives.
7.5.1 Research strategy Phase one: Generally speaking, this study was exploratory and descriptive in nature
because researching body shape, size and fit issues is new in Kenya. In quantitative
research, reliability is exceedingly important, objective facts are measured with the emphasis
placed on certain variables. The research has to be value-free, independent of the context
and the researcher has to be detached, thus enhancing the objectivity of the study. In this
phase of the study, the aim was to identify and describe Kenya’s career women’s distinctive
body shapes from body dimensions and photographs, distinguishing how they differ from the
Western distinctive body shapes, and to analyse the fit problems associated with those
shapes.
This part of the study focused on the variables contained in the body dimensions form
(Appendix 3A), and the body assessment scale (Appendix 3D), for purposes of identifying

232
and describing a distinctive Kenyan career women’s body shape. According to Neumann
(2000:126), variables are central to quantitative research; these variables were identified in
the literature (anthropometric studies, standards and body shape assessment training
manual), and measured by using relative dimensions and indicators presented in the body
dimensional form and body shape assessment scales. The quantitative research style
ensured that the researcher was objective when analysing the distinctive body shape and
distinct body features. The body dimensions, according to the body measurement form, were
much more than required for identification of the body shape. It took a long time to obtain
accurate measurements – exhausting the participants as well as the measurer. It would be
recommended that photographs be taken first as a prerequisite step for the key body
dimensions. A thorough scrutiny of the photographs will serve as a guide for the necessary
elements required for the study. Expert evaluators could be involved in the decision-making
process of identifying and sorting out only the essential key dimensions.
Phase two: The second phase of the study employed a quantitative research style, focusing
on the variables obtained from the fit problems of apparel, the communication of size and fit,
and fit preferences. A structured questionnaire was used to get the broader picture of the
respondents’ perceived fit problems, their knowledge about the communication of size and
fit, as well as their fit preferences for differently fitted apparel items. The questionnaire
measured specific dimensions of apparel fit problems, communication of size and fit, as well
as fit preferences, as explained in the literature review (Chapters 2 and 3), and clearly
indicated in a schematic framework (Figure 3.24). The questionnaire measured objective
aspects, for instance, rating the fit of different apparel categories in Kenya, reporting fit
problems experienced at critical fit points of the body, and reporting the meaning of size
codes. Questions relating to consumers’ knowledge about terms used on size labels,
representing different body shapes, and consumers’ fit preferences for differently fitted skirts
and jackets were asked. This part of the study focused on the variables obtained from
apparel’s fit problems, the communication of size and fit and fit preferences. According to
Neumann (2000:126), variables are central to quantitative research, which were identified in
the literature (Ashdown’s model (Figure 2.1) and the schematic framework (Figure 3.24)).
These variables were measured by using relative dimensions and indicators and were
presented in a language that was more comprehensible to the respondents.
Being an exploratory study, a structured self-administered questionnaire was the best option
as respondents could complete it without any outside influence. The researcher and/or
research assistant could solve unclear issues arising from the questionnaire. Although the
researcher and the assistant were available, some of the questions were left unanswered.
The respondents felt that some questions were too long. This method can be time-

233
consuming to initiate, but meaningful information can be acquired from many respondents in
a relatively shorter time if the questionnaire is much shorter.
7.5.1.1 Choice of the research sample for the study
Initially, probability-sampling techniques were used for both phases of the study, but due to
the sensitive nature of phase one data, non-probability sampling (snowball technique)
emerged within the already probability-sampled group (see paragraph 4.5.5).
Phase one: Although it is recommended that the sample size for a quantitative research
study should be representative of the entire population (Mouton, 1996:136; Wimmer &
Domnick, 2000: 94), non-probability sampling techniques could be used in a preliminary or
pilot study. In such instance the results cannot be generalised to a larger population, but
should rather be viewed as indicative of the specific group tested (Wimmer & Domnick,
2000:82-83). Although the intended sample size for phase one was 301, 123 and 89
participants were measured and photographed respectively. The smaller number of
participants in this study can be attributed to the sensitive nature of obtaining body
dimensions and photographs from women who are almost nude. These smaller numbers
were reached through persistent negotiations and persuading the participants (see Chapter 4, paragraph 4.4.5.). The snowball sampling method applied was considered to be
adequate. Non-probability sampling techniques will still be applicable for any follow-up
studies of this nature, since taking body measurements and photographs are manually
executed and remain sensitive. Given adequate time, skills, funds and the use of body scan
technology, it is possible that probability-sampling techniques could be applied with a larger
sample. A feasibility study on the acceptance of body scan technology should be carried out
while socio-cultural issues of the target market need to be understood and considered (Fiore
& Kimle, 1997:86; Marshal et al., 2004:94).
Phase two: The second phase of this study, which involved the use of a questionnaire, had
201 (67% of the initial 301 sample size) respondents. The sample size was selected using
probability sampling techniques and hence was thought to be adequate for data analysis.
7.5.1.2 The choice and application of the data collection techniques Since willing respondents increase the reliability of the study, as observed by Mouton
(1996:145), no respondents were forced to take part in the study. A research permit from
Kenya’s Ministry of Education was shown to the gatekeepers (Head teachers) as well as the
participants at every school visited. The researcher further explained the aim and importance

234
of the study to the gatekeepers as well as the participants before commencing the fieldwork.
Appropriate ethical measures were taken to ensure that participants’ rights were not violated
in any manner.
Phase one: Before the research commenced, the researcher consulted professional
anthropometrists from the Company of Ergonomic Technologies (Ergotech), South Africa, for
training in body measuring techniques, particularly in identifying and locating landmarks on
the body, and how to take the measurements accurately. The training was based on the
standardised anthropometric measuring techniques using appropriate, recommended
measuring instruments (Beazley, 1996; ISO, 1990; RMSS, 1994-Ergotech). The researcher
completed an Anthropometry Accreditation Course (AAC) – level one (Appendix 3C). The
course consisted of both theory and practical sessions on landmarking and measuring the
human body. The techniques used were based on the International Standards for
Anthropometric Assessment (ISAK, 2001). The measurements selected for the study were
carefully prepared (after consultation with various professionals in the field of apparel,
namely study leaders and Ergotech experts, and consulting relevant literature and different
anthropometric standards). Traditional anthropometric measurements have been used in
many studies (as stipulated in most sizing standards), ensuring reliability and validity of the
studies (Winks, 1997; Beazley, 1998; Simmons & Istook, 2003). The same approach was
adopted in this study, strengthening its reliability and validity. Instruments that were used,
such as the standing anthropometer, underwent quality testing and were recommended by
the anthropometrist.
A specific literature search on anthropometric studies and female body shapes was done.
This enabled the researcher to develop a comprehensive body measurement form and body
shape assessment scale for the purposes of data collection. As stated earlier, it was difficult
to take body dimensions and photographs of career women in minimal clothing. In their
reluctance to participate in the study, they cited cultural and religious beliefs as their main
concern. Continuous persuasion, negotiations and even the use of incentives were
sometimes used to convince participants to participate in the exercise. The body dimensions
form, and the policies laid down for the purposes of photographing, were subjected to
rigorous scrutiny by both study leaders before the fieldwork commenced. That enhanced the
reliability and validity of the study. The body shape assessment scale was also developed
based on a thorough literature review and after scrutinising the photographs. It was peer-
reviewed by professional experts in the field of apparel design to ensure that evaluations
made on the body shapes were valid and reliable.

235
Before commencement of the fieldwork, the researcher also underwent photography training,
which was administered by a professional photographer. To obtain reliable photographs for
the purposes of identifying and describing the distinctive body shapes of the Kenyan career
women, participants were photographed using standardised methods while dressed in
minimal apparel (body suits/leotards), and assuming/taking different positions/views (front,
back and side/profile). The use of an assessment scale with well-defined variables (body
shapes and distinct features) facilitated proficient judgements on the overall body shape and
body units/components that are critical to the fit of apparel (Gazzuolo et al., 1992; Kuma,
1999:39; Anderson et al., 2001; Ashdown, Loker & Adelson, 2004). It was very difficult to
keep the participants still in their posture while photographing, which forced the
researcher/photographer to operate between focusing the camera and helping the
participants to keep them motionless before photographing them. These movements could
be reduced with automated photographing, if a studio setting was stationed with all the
equipment placed in a booth. The body dimensions obtained and the evaluations made with
the use of the body shape assessment scale were seen as relevant and reliable. All the body
dimensions that were taken were recorded, while trained professional experts guided by the
body shape assessment scale, adequately did the evaluations of the photographs. Phase two: Theoretical clarity and descriptions of relevant aspects that were identified
through the literature search, helped to recognise appropriate measures to facilitate the
development of a comprehensive questionnaire covering all concepts of the study. Some
questions that had previously been used in related research were adapted in this study.
Questions that aimed at measuring consumers’ satisfaction with fit had been used by LaBat
(1989), Kurt Salmon Associates (1996) and Otieno et al. (2005). Measurement of consumers’
fit preferences and self-reporting of key body dimensions had been used by Anderson et al.
(2001) and Alexander et al. (2005). The questionnaire’s top page had the University of
Pretoria’s logo (letterhead) and an introductory letter stating the purpose of the research,
giving an assurance of anonymity, an appeal to participate in the study and an
acknowledgement of participation.
Before the research commenced, the questionnaire had been scrutinised by the researcher’s
study-leader, the co-study leader, a statistician and the subject specialised lecturers at the
Department of Consumer Science, University of Pretoria (peer evaluation). The
questionnaire was also pilot-tested on twenty third-year students enrolled for Apparel
Management at the University of Pretoria, and while in the field (in Kenya), the questionnaire
was further pilot-tested on 10 career women to enhance its quality and reliability. Except for
two questions (questions 11 and 22) that were answered poorly, the questions were all
relevant. The participants reported that the two questions were too long. The theory

236
(literature) used helped the researcher to understand and describe the emerging distinct
body shapes and certain characteristics emerging from the objectives highlighted in the
questionnaire.
7.5.1.3 Choice of statistical methods employed
The data was analysed using acknowledged statistical tests that were chosen after
examining the body dimensions obtained, the body shape assessment scale and the
questionnaire. The number of variables involved the measurement scales that were used,
and the nature of relations between variables (Agburu, 2001:85). Statistics were used to
investigate whether distributions of categorical variables differed from one another. The
statistical analysis of data, a characteristic of quantitative research, was adequate for the
study. In some cases, hypotheses were tested, while in others, hypotheses could not be
tested due to the fact that there were sparse cells in some categories (Chapter 4, paragraph 4.6 (Tables 4.3 and 4.4)). Hypothesis testing was done at the 5% level of significance. The
statistical methods used and the boundaries set at the 5% level of significance by specific
statistical tests, helped the researcher to determine when the results were statistically
significant. The research problem was solved when logical deductions, derived from the
theory, were linked to concrete evidence obtained from the results.
Phase one: The selection of appropriate drop values (from the body dimensions) and the
statistical methods used for identification of the body shapes were based on a thorough
literature review, and hence considered reliable, as they had been applied in other similar
studies (Beazley, 1997; Winks, 1997; Gupta & Gagandhar, 2004). The body dimensions
were summarised by the use of descriptive statistics, thereby enabling comparison across
the variables (Trochim, 2005:212). Range values measured the dispersion of variables, while
the mean values measured the central tendencies of variables. The standard deviation used
in conjunction with the mean value reflected the degree to which the values in a distribution
differed from the mean, thereby facilitating categorisation of variables such as large bust,
medium bust and small bust or short, medium and tall (Bryman & Cramer, 1997:85; Bryman
& Bell, 2007:359-360). The distinctive curvy rectangular shape emerged from the study as
the dominant body shape, as it had the highest representation from the measurements (74%)
and photographs (70%).
Assessments from the trained professional evaluators were also subjected to inter-rater
reliability tests (Kappa), for the purposes of analysing the strength of agreement between
different evaluators. This was to further enhance the reliability of this study (Ashdown &
DeLong, 1995; Landis & Koch, 1977). Statistical analysis of the body measurements

237
alongside expert evaluations of the photographs produced almost identical results, which
enhanced the triangulation of phase one data, and ensured that the results were reliable.
Phase two: The approach of the study was judged successful because the researcher
conducted a thorough literature search on specific concepts of the study that guided the
researcher to make logical deductions and develop appropriate measurement scales. The
first step was to define the concepts that were to be measured, and then potential scale
items were created to determine indicators around the fit of apparel, knowledge about the
communication of size and fit, and fit preferences. The questionnaire measurement scales
included nominal (yes or no) type questions and categorical (Likert-type) scales that directed
the decision to use specific statistical methods. Chi-Square statistics were used to
investigate the disparity of categorical variables between two independent groups, such as
comparing size and fit knowledge between Home Science professionals and non-
professionals. Pearson’s correlation coefficient was used to measure the degree or extent of
relationship between variables such as consumers’ self-reported key body dimensions
versus their actual key dimensions.
7.5.2 Quality of the data 7.5.2.1 Quality of phase one data (body dimensions and photographs)
As part of preparation for the research, the researcher consulted a professional
anthropometrist, undertook training in anthropometric studies and did a short course in
photography. Instruments used for obtaining measurements and techniques recommended
by international standards were observed, as discussed in Chapter 4 (paragraph 4.5.1.1).
Standardised photographing setting and guiding principles were also observed, as explained
in Chapter 4 (Paragraph 4.5.1.1 (Figure 4.6).
The researcher also selected and screened the professional evaluators for the purposes of
evaluating the body shapes based on their long-term professional skills and experience,
thereby ensuring the trustworthiness of the outcome of the study. A comprehensive training
manual and assessment scale were compiled based on an extensive literature search, and a
thorough study and scrutinising of field photos. The training manual and assessment scale
were tested and subjected to experts’ assessment prior to their implementation in this study.
Statistical analysis of body measurements alongside expert evaluations of photographs
produced almost identical results, thus enhancing the triangulation of phase one data.

238
7.5.2.2 Quality of phase-two data (Questionnaire) Validity: In order to ensure that each measurement accurately reflected the concept it
intended to measure (measurement validity), the following different types of validity were
observed in the questionnaire instrument:
Face validity: The instruments were pre-tested by a group of experts and were also
pilot-tested on third-year apparel design students and a small group of career women
in Kenya. This was to ensure that the measurement instruments actually measured
what they purported to measure. Only instruments purporting to measure fit issues of
women’s ready-made apparel, the communication of sizing and fit, and fit preferences
were used.
Content validity: To ensure content validity, all the concepts presented in the
conceptual framework (Figure 3.24) were specified in a construct definition. This
facilitated the development of indicators (questions and statements) from all the parts
of the definitions (relating to the objectives of the study), as recommended by
Neumann (2000:142-143) and Babbie and Mouton (2001: 122-123).
Criterion validity: Being the pilot study, there was no standardised criterion known to
measure the construct validity accurately, to permit comparison with the
measurements for this study. However, some of the questions that had been used
successfully in related studies were adapted for this study.
Construct validity: To determine the degree to which instruments used for this study,
successfully measured the theoretical construct they were intended to measure,
definitions with clearly specified conceptual boundaries were provided (Figure 3.24
and Table 4.1), in order to isolate the convergent validity. Evidence obtained from the
results that link to the theory indicates the degree to which the instruments were
successful.
Reliability: According to Neumann (2000:164), reliability is an indicator of dependability or
consistency. It indicates the likelihood that a given measurement technique will repeatedly
yield the same description of a given phenomenon (Mouton, 1996:144). In this study, the
following strategies were applied to ensure reliability:
The questions used in the questionnaire were predominantly closed questions. Some
of them had been previously used in related studies.
The questionnaire was pre-tested by a group of experts and pilot-tested on career
women.
A research permit from Kenya’s Ministry of Education was obtained (Appendix 1C,
while the questionnaire’s top page had the University of Pretoria’s logo (letterhead)

239
and an introductory letter stating the purpose of the research.
Well-established methods of data collection were used and standard statistical coding
methods were also applied.
Hypothesis testing was done at the 5% level of significance.
A non-probability sampling technique (snowball) was used in this study. It used a
smaller sample size, but this technique is acceptable in this case because it is a
preliminary study and Kenya’s career women were difficult to access due to the
sensitive nature of the study (Chapter 4, paragraph 4.4.2). The results therefore are
indicative of Kenya’s career women in the western (Eldoret and Kisumu) and central
(Nairobi) regions.
7.5.3 Achievement of the objectives of the study
In order to solve the research problem stated in Chapter 1, primary objectives and sub-
objectives were set for the study. Each primary objective and concomitant sub-objectives
were addressed in the body dimensions form, the body shape assessment scale and the
questionnaire used in the study. The results indicate that valuable data related to the primary
objectives and sub-objectives was collected. The data enabled the researcher to interpret the
results and draw conclusions related to the different objectives. The results, their
interpretation and eventually the conclusions drawn also made it possible to make
recommendations to the apparel industry as the manufacturers and marketers of ready-made
apparel, and to governmental agencies and private consumer-oriented organisations as
service providers (consumer rights activists), so as to serve effectively the needs of the
career women segment in Kenya.
From the discussion and interpretation of the results, general conclusions and overall
conclusions (Figure 7.3), it is evident that the researcher successfully achieved the primary
objectives and sub-objectives stated. Information that was obtained from the results can
contribute to the existing theory on issues around apparel sizing and fit, the relevant research
methodology and consumer education theory.
7.6 THE CONTRIBUTIONS OF THE STUDY TO EXISTING THEORY
The value of the quantitative research style used in this study is that it enables the
researcher to quantify the data and to link the data to the specific concepts used in the study.
The value of research can be increased when the results are meaningfully linked to the

240
concepts of the established theory related to the research. The findings of this study can
contribute to theory in the following fields:
the theory of fit
Ashdown’s sizing systems theory
the theory of size labels
research methodology theory
consumer education theory
7.6.1 The theory of fit
Dissatisfaction with apparel’s fit is one of the most frequently stated problems with garment
purchases. Women have been reported to be the most dissatisfied consumers (DeLong et
al., 1993; Otieno et al., 2005; Alexander et al., 2005). Body shape is a framework for
proportioning apparel (Salusso-Deonier, 2005). This study confirms that different markets
have different body shapes and unique characteristics that affect the fit of apparel. Therefore,
researchers and apparel manufacturers – upon understanding prevalent and unique body
characteristics – should develop sizing systems that can address the fit problems of different
markets.
Issues of pattern and garment alterations could improve as design values required for
different body shapes are developed. It would, for example, enable manufacturers to
understand and identify the underlying factors between the standard (hourglass) body
shape’s hip or buttocks size and the prevalent body shape in any market environment. Also,
relating fit models and dress stands to the dominant body shape in a specific market and
ensuring that fit tests are carried out, would be a vast improvement.
7.6.2 Ashdown’s sizing systems theory
Ashdown (2000) sees sizing systems as the focus around which all the other factors
concerning sizing and fit evolve. She has identified the main factors affecting sizing systems
and consequently the fit of ready-made apparel to be: the population measurements (body
measurements), the design features (construction of the apparel), the fit issues (fit quality
management), and the communication of sizing and fit (size labelling). This study has
identified specifically body shape as another important component affecting fit. The body
shape should stand out as one of the major factors revolving around sizing systems, in the
same way that population measurements stand out. It could also feature under population
measures, pointing out both the body measurements and body shape as the core

241
components. As mentioned throughout this study, population measurements, as one of the
factors highlighted in Ashdown’s (2000) model, require that the three-dimensional body
(shape) be accurately measured for the purposes of developing size tables and classification
of body shapes, which must serve as guides for design, pattern and apparel development.
The design features being the second most important aspect in Ashdown’s (2000) model
involve using the body shape for design, style development and correct distribution of styles
to the correct market. The fit, as a third important factor, demands that the body shape
characteristics are understood for the purposes of formulating quality assurance strategies,
such as identifying fit models representing prevalent shapes in a market, identifying
appropriate dress forms for fit testing and draping. Communication of sizing and fit being the
fourth component in Ashdown’s (2000) model, it demands that the sizes and body shapes
communicated should represent the actual measurements and the body shapes.
7.6.3 Theory of size labels
Chun-Yoon and Jasper (1996) and Glock and Kunz (1995) state that a size label is a tool
that should not only indicate the dimensions it was sized for, but should also describe the
body type that the garment was designed for. This study realised that familiar information on
size labels were tacit and less preferred by consumers as a means of size communication.
For the female Kenyan apparel consumer, being familiar with something and having
knowledge about something are clearly two different things. The implication is that being
exposed to information in the consumer socialisation process does not automatically result in
an informed consumer with the knowledge that is needed when trying to make informed
decisions.
Consumers have a right to clear and understandable information regarding what they are
buying, and preferably such information should appear on the product itself. It is therefore not
only about who is to be blamed for consumers’ lack of knowledge about important sizing and
fit issues or their misinterpretation of current labelling systems, but also what the types of
size labels are presenting to the consumer. Consumers prefer instructive size labels, but
ironically, existing sizing systems are not only non-standardised and vague, but also do not
make sense to the consumers. The addition to this theory is to highlight that size labels,
whether informative or non-informative, first must be representative of the target market, and
secondly, should be understood by the consumers. The apparel industries in any
marketplace should focus not only on presenting consumers with information, but on
assisting them to understand the information, and providing them with the skills to utilise the
information.

242
7.6.4 Research methodology theory
In this study, body assessments were done through visual sensory evaluations done in five
different steps. Sensory evaluation is the assessment using a human’s good judgement or
the sensitivity of human senses, which implies the evaluation of selected characteristics of a
product under controlled conditions by a panel of judges (ASTM, 1981:3; Leibowitz & Post
1982:4; Lyon, Menneer, McEwan, Metheringaham & Lallemand, 2000:1). In this regard, this
study has contributed to the existing sensory evaluation theory in that the techniques devised
in this study provided an orderly framework to evaluate perceived physical characteristics
within different body shapes.
From the raw photographs, it was almost impossible to extract all the details as exhaustively
as possible, and therefore the researcher formulated unique methods that eased the process
of evaluation. Microsoft Office tools photo editor made it possible to get an edged shape
(Figure 4.10 in Chapter 4) from the photo negatives (obtained by right-clicking on an icon in
a left-hand corner of the photo). The resulting body shapes and body features had clearer
outlines, which permitted more auxiliary scrutiny. The IGRAFX Designer 5 software was used
to extract only the pre-determined/-identified and important characteristics from the photos,
making the assessment of the photos even clearer.
The body shape identification technique, using both body measurements and assessments
of photos, can be viewed as more reliable, as it enhances the triangulation of the study.
Anthropometric studies uses standardised methods and instruments, which can sometimes
be unavailable due to various reasons. This study used an improvised and quality-tested,
standing anthropometer for all the height measurements (Figures 4.4 and 4.5). The
photographing studio setting (paragraph 4.6), and the rules set for the photographing were
uniquely designed for this study. Obtaining bust extension and buttocks extension
measurements, for example, were exceptional for this study.
7.6.5 Consumer education theory
According to Yeatts et al. (1992), in order to use a product effectively, consumers must have
knowledge of the products and the intent to use them. Apparel marketers and public agency
directors can educate career women in the areas of sizing and fit so that they could select
appropriately fitting apparel items. Career women consumers in particular, would have
potentially much to gain from well-orchestrated consumer education efforts jointly endorsed
by all the concerned parties (apparel marketers, government agencies as well as consumer-
oriented organisations). Consumer education programmes can provide significant benefits,

243
including identification of market information, complaint and consumer redress procedures,
and understanding a more technology-based consumer environment (Oumlil & Williams,
2000).
It was evident in this study that the career women in the group lacked knowledge about size
and fit. Skills in identifying body shapes, size labels’ contents as well as key dimensions to
identify a size would help consumers to be perceptive about size and fit issues and hence
save time spent on apparel selection. Loker et al. (2005) observed that participants were
able to give accurate dimensions when instructions on how to take body measurements were
given as opposed to when instructions were not provided. Consumer education and
counselling programmes may also include information about and referral services for
wardrobe planning, wardrobe management and strategies for dressing different female body
shapes. Advantages of viewing consumer education as part of a competitive strategy has
been seen to help retailers obtain and keep satisfied customers, contribute to the favourable
attitude formed among consumers toward a product or company, and to help reduce
confrontations with consumer advocates.
7.7 GENERAL RECOMMENDATIONS Although the conclusions made in this study cannot be generalised to a broad population,
certain recommendations can be made at this stage to:
the ready-made apparel marketers (industry) in Kenya and the foreign companies that
export their apparel items to Kenya
government agencies such as the Kenya Bureau of Standards as well as consumer-
oriented organisations
7.7.1 The ready-made apparel industry (manufacturers and retailers)
Apparel designers must distinguish how the Kenyan career women’s curvy rectangular
shape differs from the Western rectangular body shape, and furthermore, how it deviates
from the so-called ideal (hourglass) body shape. Understanding the underlying differences in
body shape could help designers to translate the distinct body characteristics of the curvy
rectangular shape into better-fitting apparel items for the Kenyan career women. Fit models
as well as dress forms chosen for fit testing and modelling in the apparel industry, should
reflect the characteristics of the prevalent curvy rectangular shape. It could also be
recommended that apparel manufacturers adjust their current sizing systems to cater for the
Kenyan career women’s distinctive curvy rectangular body shape, rather than continue with

244
the production of inappropriate apparel meant for the ideal (hourglass) shape. Although this
was a study in Kenya, it may be reasoned that most developing African nations lack a
classification of their body shapes and therefore experience challenges with apparel fit. A
country such as South Africa with people of diverse cultures also needs to follow the
example set out in this study.
It is further recommended that apparel industries in Kenya and other developing nations
ensure that their sizing systems are representative of their target populations’ sizes and body
shapes. This could be updated through collecting anthropometric data from their target
markets, or adapting their existing size systems to suit their consumers’ sizes and body
shapes. They should also ensure that size labels used are in accordance with consumers’
preferences and the recommendations by KEBS (2001)/Appendix 4B, and Faust et al.
(2006). Since retailers and manufacturers use size labels for product differentiation,
consumers should therefore be educated on what size labels presented on their apparel
mean and how the size labels relate to their body dimensions and shapes.
Communication to the consumer through labelling should contain sizing and fit information
that is clear, informative and understandable – information that is currently not given through
the non-informative, lettered and numbered size codes in use. This means that the consumer
should be able to easily identify the size of the garment. It could include size symbols, such
as the pictogram, that would quickly communicate to the consumer the key body dimensions
that the garment was designed to fit. Secondly, keeping women consumers’ lack of
knowledge regarding their own key body dimensions in mind, retailers and companies would
benefit by also providing their customers with the skills to utilise the information. In addition to
understanding the sizing code on the label, apparel consumers should know which body
dimensions are used to size a garment, and also how to determine their own body
dimensions, in order to make an appropriate size choice. This would call for a creative, but
not impossible, joint attempt by retailers and their consumer advisors – an initiative that could
not only benefit the apparel consumer, but also the specific company and/or retailer, and
ultimately the industry as a whole.
Although this was a case of the Kenyan female apparel consumer’s lack of knowledge
regarding important sizing and fit issues, concern about female consumers’ many problems
regarding the fit of their clothes is not restricted to Kenya, while the plea that the apparel
industry should at least try to address some of these problems (amongst which, the
communication of sizing through informative size labels), is a worldwide phenomenon.

245
Confusion can affect both consumers’ rights and the quality of consumers’ decisions.
Confused consumers are less able to process information and hence more vulnerable to
making less than optimum choices. Therefore, marketers within the apparel sector need to
identify the effects associated with confusion, consumer reaction to confusion and how
marketing issues could be used to counteract this. Consumers who are knowledgeable about
size and fit would therefore be able to select well-fitting apparel and would be able to identify
the sources of fit problems, and act accordingly. Therefore, it is recommended that consumer
education on size and fit be used as part of apparel industries’ promotional strategies to win
and retain consumers, while the consumers become equipped with knowledge.
While the apparel industry is expected to produce apparel within the consumers’ fit
preferences, the consumers on the other hand should be equipped with skills essential for
dressing appropriately. It is acknowledged that fit preference is subjective and varies from
one person to another. It is also sometimes influenced by internal factors such as personal
preferences, expectations and the fashion trend (Alexander et al., 2005). However, the
comfort or ease that a person requires in an apparel item depends mainly on that individual’s
body’s physical characteristics (critical fit points). Apparel designers must therefore
incorporate consumers’ fit preferences within their designs, and that could result in
appropriate fashionable styles for the curvy rectangular Kenyan body shape that was
identified, or any other prevalent shape identified in any market environment. Since comfort
is one of the attributes of fit, fabric stretch characteristics could be incorporated into the
consumers’ preferred fitted skirts and jackets to provide comfort, while the closer fit required
by the consumers could still be maintained.
Since the majority of apparel industries use the hourglass shape for marketing purposes
(LaBat & DeLong, 1990; Fiore & Kimle, 1997:30; Alexander & Connell, 2005), it could be
recommended that more realistic expectations of the consumers in any market be taken into
consideration, by presenting models with the predominant body shape in a full range of the
sizes available within the target market.
7.7.2 Government agencies and consumer-oriented organisations
To serve effectively the needs of the career women segment, governmental agencies and
private consumer-oriented organisations such as service providers must understand the
barriers that prevent the consumers from exercising their rights. Being a pilot study in Kenya,
this research project highlights many other areas of potential study. It would be
recommended to the Kenyan government (Kenya Bureau of Standards) that a national
anthropometric survey be carried out. Alternatively, anthropometric surveys could be carried

246
out on a small-scale basis, covering specific market regions for the purposes of establishing
representative sizing systems (size tables as well as body shape categories) applicable to
those regions. Kenya’s Bureau of Standards needs to adjust their current sizing systems to
cater for the curvy rectangular body shape.
The advantages of consumer education as part of a competitive strategy are perceived to
help obtain and keep satisfied customers, to contribute to the favourable attitude formed
among consumers toward a product or company, and to help reduce confrontations with
consumer advocates. Consumer education and counselling programmes that should also
include information and referral services need to be developed to equip the consumers with
the appropriate knowledge that could help them make informed purchasing decisions.
It has been observed that knowledgeable consumers are adept at forming choice-sets (De
Klerk & Tselepis, 2007). Skills in decoding size labels and the key dimensions in order to
identify a size would help consumers in selecting apparel with the correct size and fit. Loker
et al. (2005) observed that participants were able to give accurate dimensions when
instructions were given on how to take measurements, as opposed to when instructions were
not provided. Through counselling and educating consumers on the meaning of the different
size codes, and identifying their key dimensions and own body shapes, consumers would be
able to link different size codes to their measurements and shapes, and finally select
appropriate apparel styles and sizes.
Consumer education and counselling programmes may also include information and referral
services such as wardrobe planning and management strategies that give instructions on
appropriate dressing for different body shapes. Issues such as body cathexis/self-esteem
could also be incorporated into the education programmes to help the consumers appreciate
their shapes/images, and to dress accordingly.
7.8 LIMITATIONS OF THE STUDY AND SUGGESTIONS FOR FUTURE STUDIES
It should be noted that there are certain limitations to this research that also provide a basis
for further research. Studying apparel’s size and fit problems as regards the female body
shape is a new phenomenon in Kenya. The most striking limitation of this study was access
to the participants. The sensitive nature of measuring and photographing women in minimal
clothing demands understanding their culture and beliefs. It also requires sufficient financial
means to give the participants incentives, a longer time for negotiations (persuasion) and a
more versatile studio setting. However, if sensitising programmes were administered ahead
247
of time and alongside with the use of modern and efficient technology, more participants
would likely participate.
The results on the distinctive body shape (phase one) were based on only 123 measured
and 89 photographed career women of only two regions of Kenya. It is suggested that similar
research be conducted on a larger sample, and perhaps using modern technology such as
body scanners. The results on the questionnaire (phase two) were only based on the
opinions of the high school female teachers within two regions of Kenya, assumed to
represent career women in Kenya. Again, it is suggested that similar research be conducted
in all the regions and with a more representative sample.
Finally, the aim of this study was to identify the distinctive female body shape of Kenyan
career women and to analyse apparel’s fit problems associated with it. It was also to assess
career women’s perceptions regarding general fit problems with the ready-made apparel,
explore their knowledge about the communication of size and fit and to determine their fit
preferences for differently fitted apparel. These factors were used to establish how they could
contribute to fit problems of the ready-made apparel in Kenya. In spite of the limitations
mentioned, and possibilities for improvement of the methodology, the results of this study
should be used as a pilot study to improve the size and fit of apparel in Kenya as well as
other developing African countries.