thesis ebook bhojani - Universiteit Gent
236
Transcript of thesis ebook bhojani - Universiteit Gent


Faculty of Medicine and Health Sciences Department of Public Health
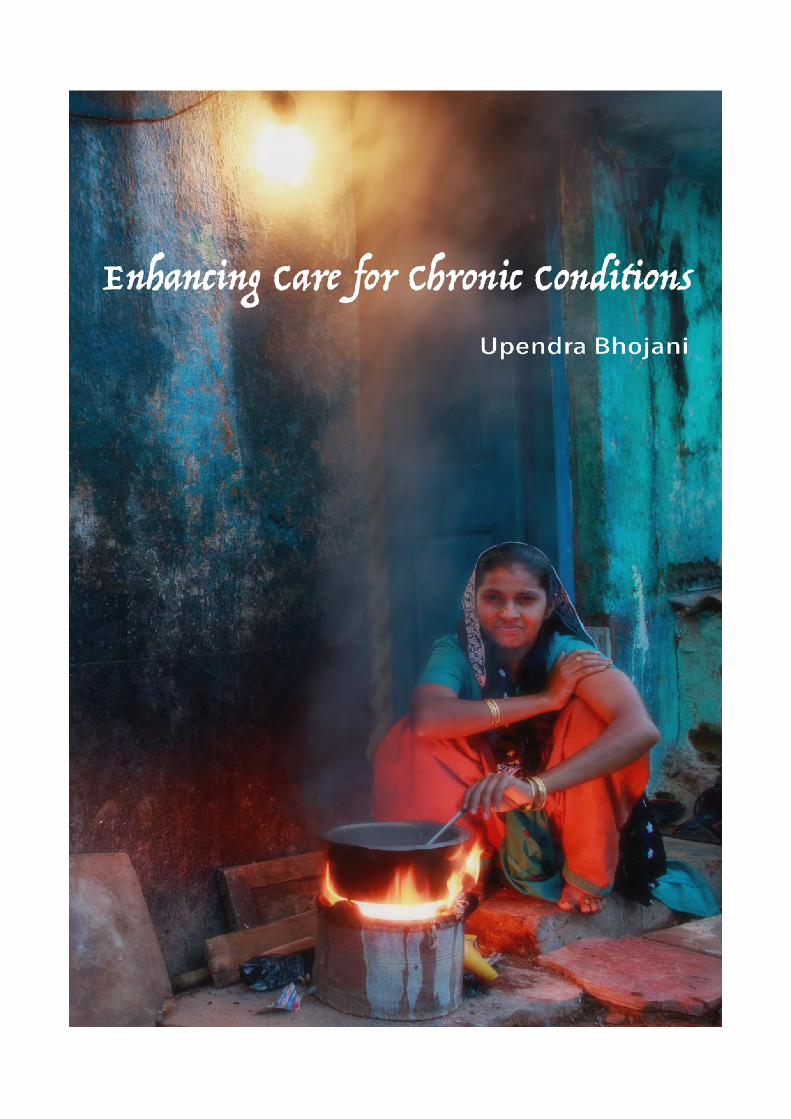
Enhancing care for urban poor living with chronic conditions: role of local health systems
Upendra Bhojani
Thesis submitted in fulfillment of the requirements for the degree of Doctor of Health Sciences
Promoters:
Prof. Stefaan De Henauw (promoter) Ghent University, Ghent, Belgium
Prof. Patrick Kolsteren (co-promoter) Ghent University, Ghent, Belgium
Dr. N Devadasan (co-promoter) Institute of Public Health, Bangalore, India
ISBN: 9789078344445
Legal Deposit Number: D/2016/4531/2
Appeared in the series Monographs of the Department of Public Health, Ghent University
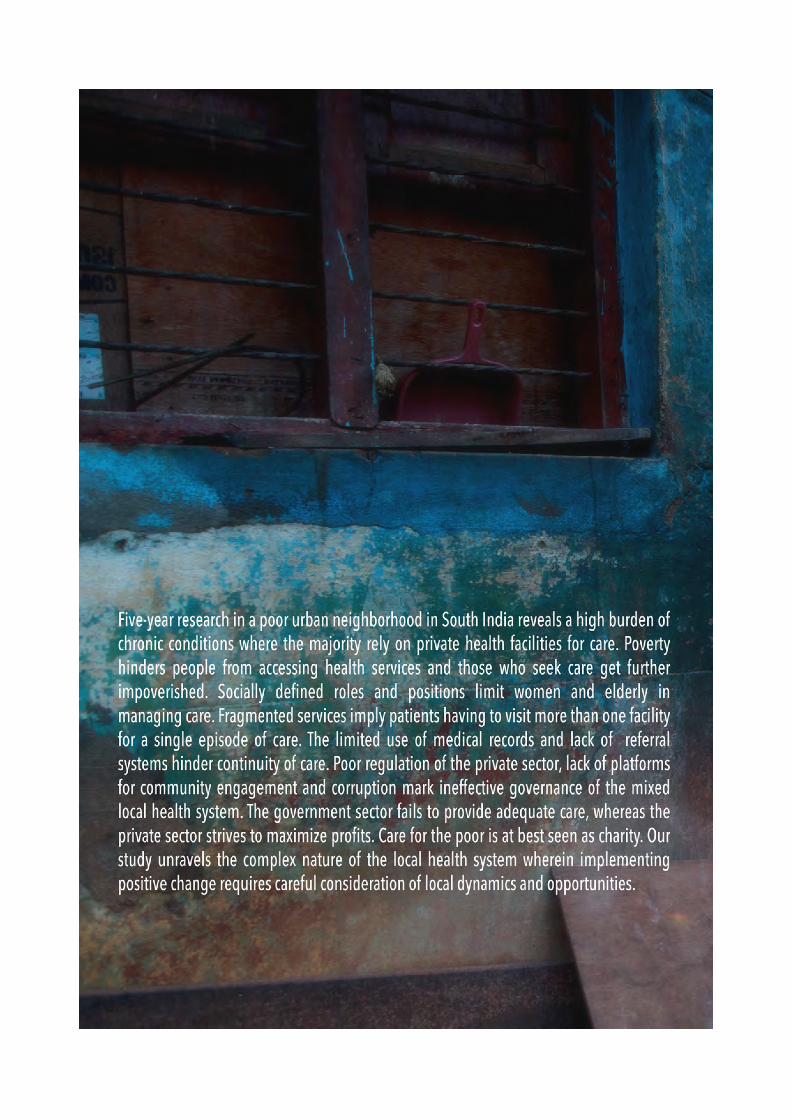
Photos including on the cover are by Bhargav Shandilya


Chair Prof. Koen Van Herck Department of Public Health, Ghent University, Ghent, Belgium
Members Prof. Sara Willems Department of Family Medicine and Primary Health Care, Ghent University, Ghent, Belgium
Prof. Lucas Van Bortel Clinical Pharmacology Research Unit, Heymans Institute of Pharmacology, Ghent University, Ghent, Belgium
Prof. Bruno Lapauw Department of Endocrinology, Ghent University, Ghent, Belgium
Prof. Jean Macq Faculty of Public Health, Dean, Institut de recherche santé et société, Université catholique de Louvain, Brussels, Belgium
Prof. C A K Yesudian Retired as Dean, School of Health System Studies, Tata Institute of Social Sciences, Mumbai, India

PREFACE
My decision to embark on a PhD journey has a lot to do with the Institute of Public Health (IPH), a not-for-profit organization based in Bangalore, engaged in public health research, training and advocacy. After working as a dentist at a teaching–hospital in western India, I decided to go for a Master in Public Health at the Deakin University (Australia) in 2005. Joining IPH upon my return to India was my official entry into public health practice. Since my dentistry days, I have taken great interest in promoting tobacco control as a researcher and an activist, in addition to my work on health systems.
In 2008 the issues of urban poverty and intra-urban inequities in access to healthcare surfaced in the Indian public debate with the national government proposing a flagship program – the National Urban Health Mission – to provide healthcare to the urban poor. While the Mission would take a few more years to materialize, some of us at IPH already started to engage in this debate. In Bangalore, we would routinely witness pockets of visibly poor areas in an otherwise sprawling metropolis. After initial exchanges with other organizations engaged in working with urban poor and a few exploratory visits to poor urban quarters in the city, IPH launched a long-term project in KG Halli, a poor neighborhood situated in one of the administrative units of Bangalore city. The purpose was to explore meaningful ways of working with local residents, healthcare providers and health authorities in order to improve people’s access to quality healthcare. As no data was available on the population and its health profile, we started with the organization of a house-to-house survey of the entire neighborhood, eventually covering 9 299 households. We tracked demographic details, self-reported illness profiles, health seeking practices and healthcare expenditures. This survey was conducted with the help of a small group of women from the neighborhood itself. These ladies would gradually become local community health workers, the very backbone of the project.
The survey revealed that residents commonly reported chronic conditions like hypertension and diabetes, which were previously considered to be problems mainly affecting the wealthy. It is at this stage that my interest in tobacco-related diseases and health systems converged. I seized the opportunity of a “sandwich” PhD program, as part of the institutional collaboration between IPH and the Institute of Tropical Medicine (ITM) in Antwerp. In consultation with my KG Halli project colleagues, I decided to go for a study of the role of local health systems in improving healthcare for urban poor facing chronic conditions. The groundbreaking initial work of my colleagues not only helped me to frame my PhD research (the survey substantially contributed to measuring the burden of chronic conditions in the neighborhood), but they would eventually also turn into co-researchers making it possible for us to conduct a number of other studies in KG Halli. The project is still ongoing, integrating results from my PhD, but also incorporating actions on other challenges of the harsh community life in KG Halli.
This collaborative PhD research between IPH (Bangalore), ITM (Antwerp) and the Ghent University (Ghent) adds to (limited) existing evidence on the management of chronic conditions at local health system level in India. I hope it will stimulate further interest in local health systems and contribute to providing useful insights in the implementation of government
initiatives aimed at improving care for chronic conditions in India, specifically targeting the urban poor.
At my home institute, IPH Bangalore, we look forward to continuing this work on chronic conditions at two levels. Firstly, at policy level, we are currently exploring the impact of non-health sectors on the prevention and management of chronic conditions. And secondly, at the operational level, we aim to investigate and test models for integrated (health and social) care of chronic conditions.
Upendra Bhojani Antwerp 03/09/2016
ACKNOWLEDGEMENTS
After an intensive long period of six years that I spent working on this thesis, the day finally comes, when I am writing the last piece – a thank you note.
This journey has taught me a lot, both at professional and personal level. The thesis has had a huge impact on me. But this became possible through guidance and support of the many people who helped me, in small and big ways, throughout this period.
First and foremost, my deepest gratitude goes to the urban health project team in KG Halli – Roopa Devadasan, Thriveni S Beerenahally, Amruthavalli S and Munegowda CM, later joined by Mrunalini Gowda – for their immense support and acceptance, and for being an active part of this journey, which otherwise would have been impossible. A special thanks to Roopa for the insightful dialogues we always had while on the two-wheeler journeys to KG Halli. They made me wiser. A team of wonderful women community health workers, the backbone of the KG Halli project, not only made data collection possible but also contributed in framing the work through their life experiences. So, my sincere thanks to Nagarathna, Leelavathi, Tabassum, Josefien, Revathi, Sujatha and Anthoniyamma.
Of course, this work would not have been possible without the residents of KG Halli, and particularly the diabetes patients, who welcomed us to their homes and shared their lives with us. Similarly, the local healthcare providers played an equally important role. They welcomed us in their consultation rooms and shared their views. As I count their names in my mind to protect their privacy, my deep gratitude goes to them.
Particular thanks goes to Dr. N Devadasan of the Institute of Public Health (IPH). In some sense, he was ‘Deva’ to me, a name he likes to be called as, which also means a deity in Hinduism. Quite naturally I went to him when I got this crazy idea of doing a PhD, and when my scholarship ran out, and every time I was in a difficult situation. He was there, always. His vast experience helped me keep my work firmly rooted in the Indian context.
I thank Prof. Patrick Kolsteren of the Institute of Tropical Medicine (ITM), who put faith in me and supported my candidature for a PhD. His inputs in selecting research design and methods were vital. He gave me courage to not to give up on the intervention study and encouraged me to write more.
My deep gratitude to Prof. Stefaan De Henauw of Ghent University for agreeing to supervise my work, even though I was probably not the best fit in his unit. But he saw meaning in the kind of work I was into. He not only helped me on the scientific front, but also ensured that I navigated and met several university requirements while being in India for most of the time.
I sincerely thank Prof. Bart Criel, who encouraged me to take up a PhD in the first place and supported my candidature at ITM. For all practical purposes, he was one of my supervisors. His experiential insights on health systems organization were crucial in shaping my work. It was always refreshing to visit his place in Bazel every now and then, where Goedele would lovingly ensure that I get my quota of yummy Belgian ice cream every time.

I want to thank Werner Soors for countless things. He has been a mentor and a true friend. His place in Antwerp has been a home away from home. He has a played a major role not only in my PhD but also in shaping my career in public health.
My thanks to Arima Mishra, who gently and ably introduced me to the world of sociology and anthropology.
The interactions with my colleagues and friends over time helped directly or indirectly in this work. Thanks to colleagues at IPH for their inputs. Thanks to Prashanth N S for providing useful inputs on my writings. At ITM I would like to thank Roos Verstraeten, Valéria Campos Da Silveira, Josefien Van Olmen, Carl Lachat, Bruno Marchal, Kimberley Bouckaert, Fahdi Dkhimi and Dominique Roberfroid. At Nature Conservation Foundation: Suhel Quader and Umesh Srinivasan. Thanks also to colleagues who worked with me on several projects at IPH during my PhD time. They gave me space to work on PhD by sharing my project responsibilities.
Thanks to Isa Bogaert, Renilde Everaert, Lieve De Greef, Jos Assayag, Monique Ceulemans, Ann Verlinden, Rita Verlinden, Linde De Kinder, Fiona Robertson, Patricia Braat, Helga Bödges, Annelies Croon, Mia Bellemans, Kristien Debrock, Gajalakshmi and Mallesh for their secretarial and logistic support over time. Thanks to Dhaval Majithia for the editing help.
I thank the jury members whose comments enhanced my thesis to a great extent. Their interest in my work, their very useful suggestions, and encouragement on continuing such work were humbling.
It would not have been possible to do this work without generous scholarship from ITM supported by the Belgian Directorate-general Development Cooperation and Humanitarian Aid (DGD). Thanks also to Misereor, Medico International and the Sir Dorabji Tata Trust for their financial support to the urban health project in KG Halli, parts of which contributed to PhD.
Last, but certainly not least, I thank Lord Swaminarayan and my guru for their grace and mercy. I am indebted to my parents, who supported me to go to unknown lands for education, even though it was not their first preference for me. My wife and a dear friend, Dipalee deserves this PhD degree as much as I do. She provided unconditional support and encouraged me to embark on this journey, despite knowing well that it would affect my family commitments. Thanks to my sister and her family as well as my in-laws who supported my wife during my long PhD outings.
And to those I forgot: my sincere apologies.
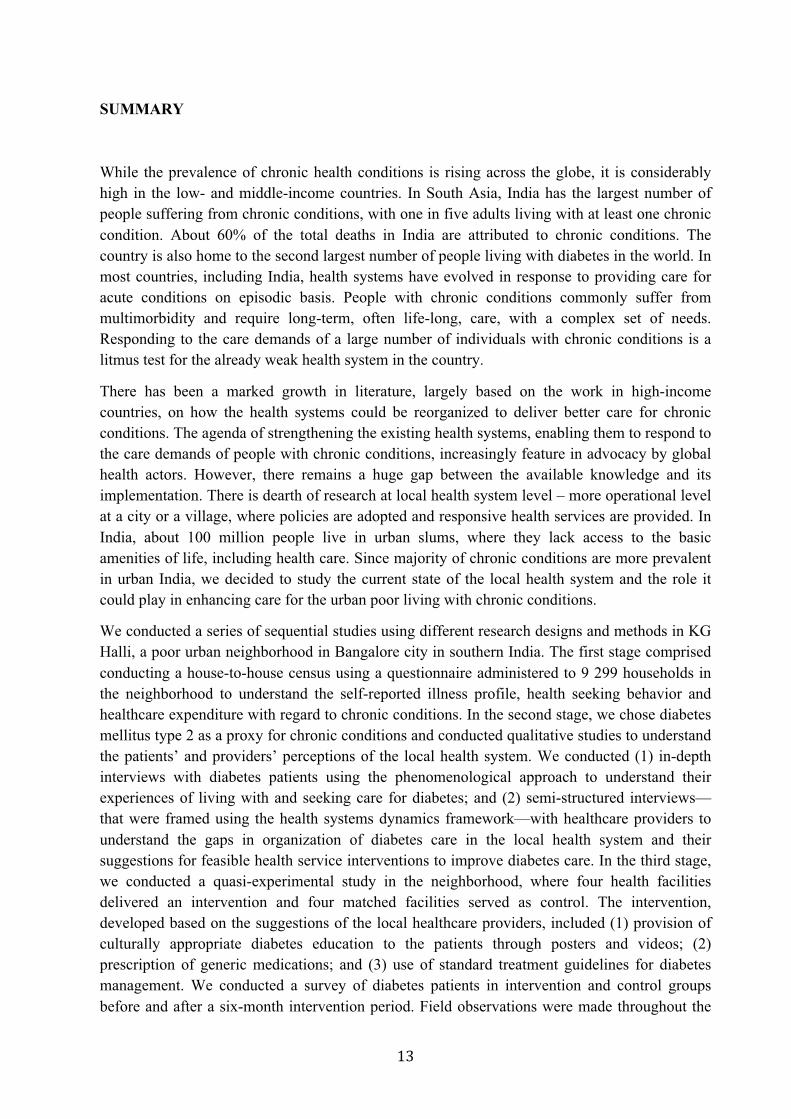
SUMMARY
While the prevalence of chronic health conditions is rising across the globe, it is considerably high in the low- and middle-income countries. In South Asia, India has the largest number of people suffering from chronic conditions, with one in five adults living with at least one chronic condition. About 60% of the total deaths in India are attributed to chronic conditions. The country is also home to the second largest number of people living with diabetes in the world. In most countries, including India, health systems have evolved in response to providing care for acute conditions on episodic basis. People with chronic conditions commonly suffer from multimorbidity and require long-term, often life-long, care, with a complex set of needs. Responding to the care demands of a large number of individuals with chronic conditions is a litmus test for the already weak health system in the country.
There has been a marked growth in literature, largely based on the work in high-income countries, on how the health systems could be reorganized to deliver better care for chronic conditions. The agenda of strengthening the existing health systems, enabling them to respond to the care demands of people with chronic conditions, increasingly feature in advocacy by global health actors. However, there remains a huge gap between the available knowledge and its implementation. There is dearth of research at local health system level – more operational level at a city or a village, where policies are adopted and responsive health services are provided. In India, about 100 million people live in urban slums, where they lack access to the basic amenities of life, including health care. Since majority of chronic conditions are more prevalent in urban India, we decided to study the current state of the local health system and the role it could play in enhancing care for the urban poor living with chronic conditions.
We conducted a series of sequential studies using different research designs and methods in KG Halli, a poor urban neighborhood in Bangalore city in southern India. The first stage comprised conducting a house-to-house census using a questionnaire administered to 9 299 households in the neighborhood to understand the self-reported illness profile, health seeking behavior and healthcare expenditure with regard to chronic conditions. In the second stage, we chose diabetes mellitus type 2 as a proxy for chronic conditions and conducted qualitative studies to understand the patients’ and providers’ perceptions of the local health system. We conducted (1) in-depth interviews with diabetes patients using the phenomenological approach to understand their experiences of living with and seeking care for diabetes; and (2) semi-structured interviews— that were framed using the health systems dynamics framework—with healthcare providers to understand the gaps in organization of diabetes care in the local health system and their suggestions for feasible health service interventions to improve diabetes care. In the third stage, we conducted a quasi-experimental study in the neighborhood, where four health facilities delivered an intervention and four matched facilities served as control. The intervention, developed based on the suggestions of the local healthcare providers, included (1) provision of culturally appropriate diabetes education to the patients through posters and videos; (2) prescription of generic medications; and (3) use of standard treatment guidelines for diabetes management. We conducted a survey of diabetes patients in intervention and control groups before and after a six-month intervention period. Field observations were made throughout the

intervention and interviews were conducted with the doctors at the intervention facilities. We used the RE-AIM framework to understand the reach, effectiveness, adoption, implementation, and maintenance of the intervention beyond the study period.
Overall, the prevalence of self-reported chronic conditions was 13.8% among adults, with hypertension (10%) and diabetes (6.4%) being the most commonly reported conditions. Older people and women were more likely to report chronic conditions. Our study indicated reversal in socioeconomic gradient for chronic conditions: people living in below-the-poverty-line households had three times greater odds of reporting chronic conditions compared to the people living in above-the-poverty-line households. Private healthcare providers managed over 80% of patients. Income had positive association with the use of private health care facilities. However, elderly patients, people living in below-the-poverty-line households, and those seeking care from hospitals were more likely to use government services.
One in three households made out-of-pocket payments on outpatient care for chronic conditions. One in six households suffered financial catastrophe because of spending more than 10% of their household income on chronic condition care. Our study, probably first time in India, revealed that the poor were spending a higher share of their income on outpatient care for chronic conditions compared to the least poor. In one-month duration, number of people with chronic conditions living in below-the-poverty-line households doubled with deepening of their poverty due to out-of-pocket payments on chronic condition care. A majority of households had to dip into their savings, while some resorted to borrowing money, and selling or mortgaging their assets to cope with treatment cost.
Despite the abundance of healthcare facilities in the vicinity, the patients’ narratives revealed myriad challenges in accessing healthcare. These challenges include financial hardships, negative attitudes and ineffective communication by the healthcare providers, and inadequate care offered by fragmented healthcare services. The strongly defined gender-based family roles restricted the women’s mobility and autonomy to access healthcare. The prevailing nuclear family structure and inter-generational conflicts limited support and care for elderly adults.
There were major gaps in delivering quality diabetes care. The inadequate use of medical records and lack of referral system hindered the continuity of care. Lack of standard treatment protocol affected clinical decision-making. The poor regulation of the private sector, lack of coordination across healthcare providers and healthcare delivery platforms, widespread practice of bribery, and absence of platforms for patient engagements marked ineffective leadership and governance. There was trust deficit among patients and healthcare providers. The private sector, with a majority of healthcare providers lacking adequate training, operates to maximize profit. Healthcare for the poor is at best seen as charity.
The intervention study revealed complex health-seeking patterns affecting the reach of the health service intervention when delivered via a few health facilities. Furthermore, the implementation of the intervention was poor, mainly due to the resistance from private doctors in adopting the intervention. The intervention did not have a statistically and clinically significant impact on the knowledge, healthcare expenditure and glycemic control of the patients. However, the doctors at the intervention sites perceived improvements in the patients’
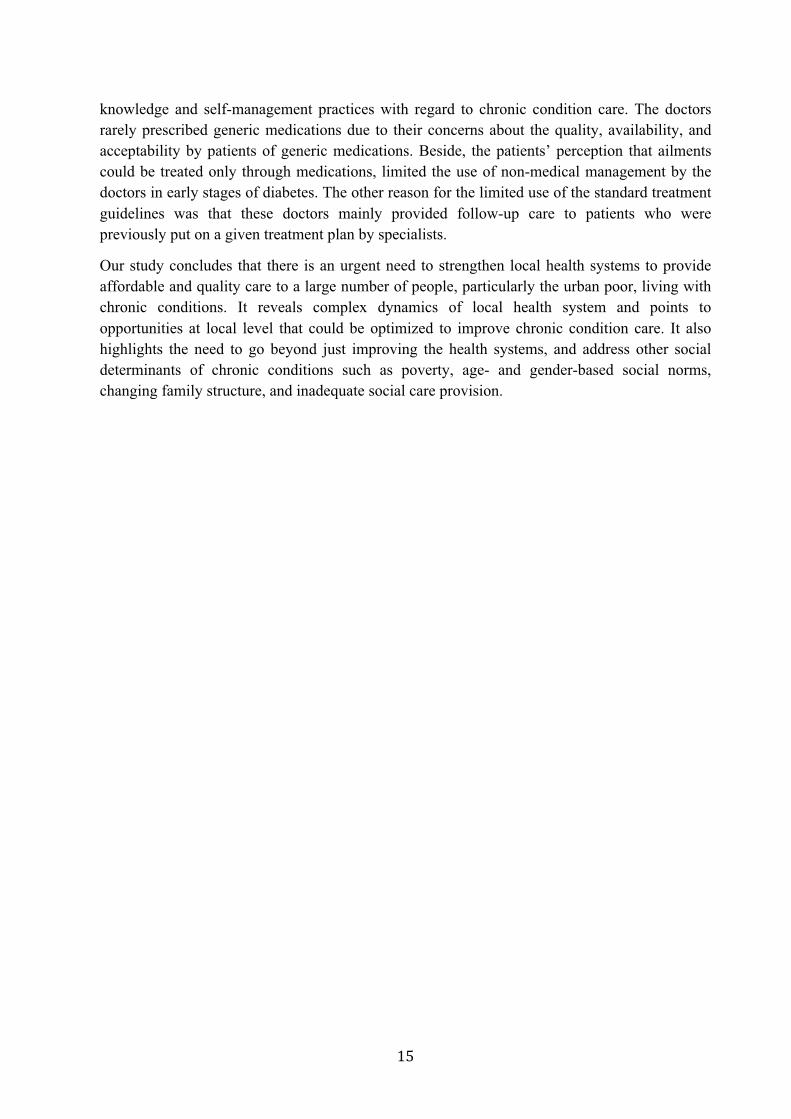
knowledge and self-management practices with regard to chronic condition care. The doctors rarely prescribed generic medications due to their concerns about the quality, availability, and acceptability by patients of generic medications. Beside, the patients’ perception that ailments could be treated only through medications, limited the use of non-medical management by the doctors in early stages of diabetes. The other reason for the limited use of the standard treatment guidelines was that these doctors mainly provided follow-up care to patients who were previously put on a given treatment plan by specialists.
Our study concludes that there is an urgent need to strengthen local health systems to provide affordable and quality care to a large number of people, particularly the urban poor, living with chronic conditions. It reveals complex dynamics of local health system and points to opportunities at local level that could be optimized to improve chronic condition care. It also highlights the need to go beyond just improving the health systems, and address other social determinants of chronic conditions such as poverty, age- and gender-based social norms, changing family structure, and inadequate social care provision.

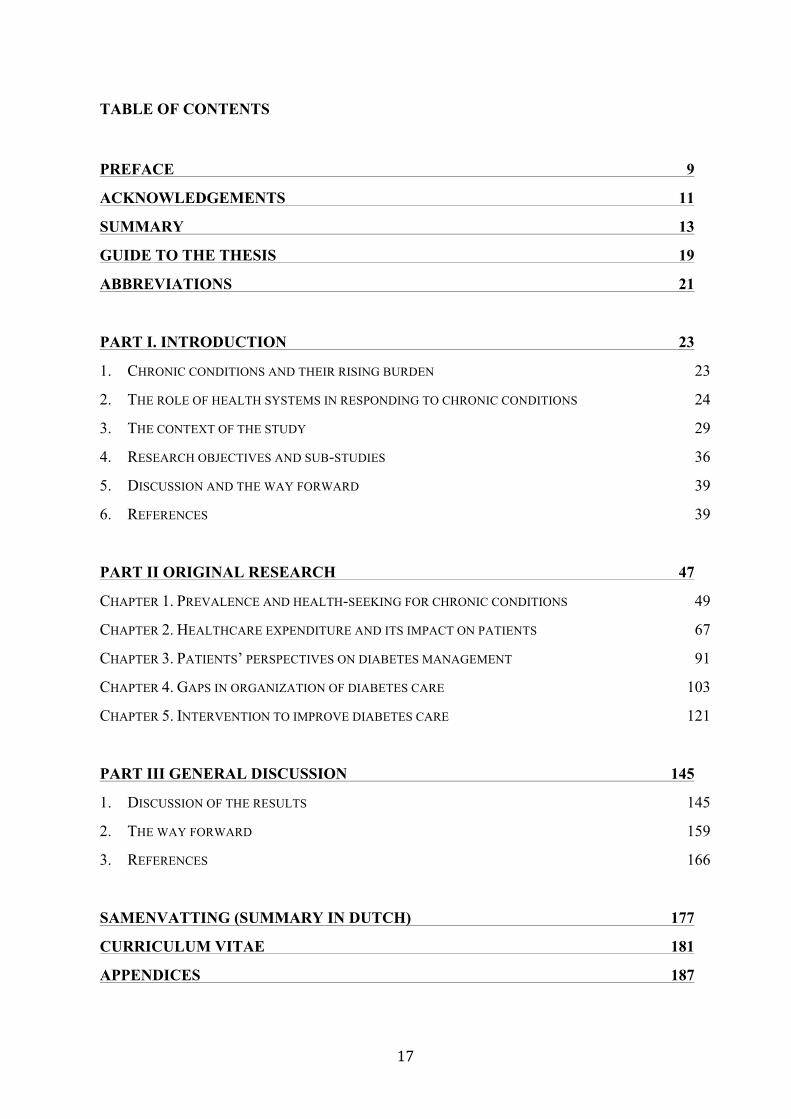
TABLE OF CONTENTS
PREFACE 9
ACKNOWLEDGEMENTS 11
SUMMARY 13
GUIDE TO THE THESIS 19
ABBREVIATIONS 21
PART I. INTRODUCTION 23
1. CHRONIC CONDITIONS AND THEIR RISING BURDEN 23
2. THE ROLE OF HEALTH SYSTEMS IN RESPONDING TO CHRONIC CONDITIONS 24
3. THE CONTEXT OF THE STUDY 29
4. RESEARCH OBJECTIVES AND SUB-STUDIES 36
5. DISCUSSION AND THE WAY FORWARD 39
6. REFERENCES 39
PART II ORIGINAL RESEARCH 47
CHAPTER 1. PREVALENCE AND HEALTH-SEEKING FOR CHRONIC CONDITIONS 49
CHAPTER 2. HEALTHCARE EXPENDITURE AND ITS IMPACT ON PATIENTS 67
CHAPTER 3. PATIENTS’ PERSPECTIVES ON DIABETES MANAGEMENT 91
CHAPTER 4. GAPS IN ORGANIZATION OF DIABETES CARE 103
CHAPTER 5. INTERVENTION TO IMPROVE DIABETES CARE 121
PART III GENERAL DISCUSSION 145
1. DISCUSSION OF THE RESULTS 145
2. THE WAY FORWARD 159
3. REFERENCES 166
SAMENVATTING (SUMMARY IN DUTCH) 177
CURRICULUM VITAE 181
APPENDICES 187

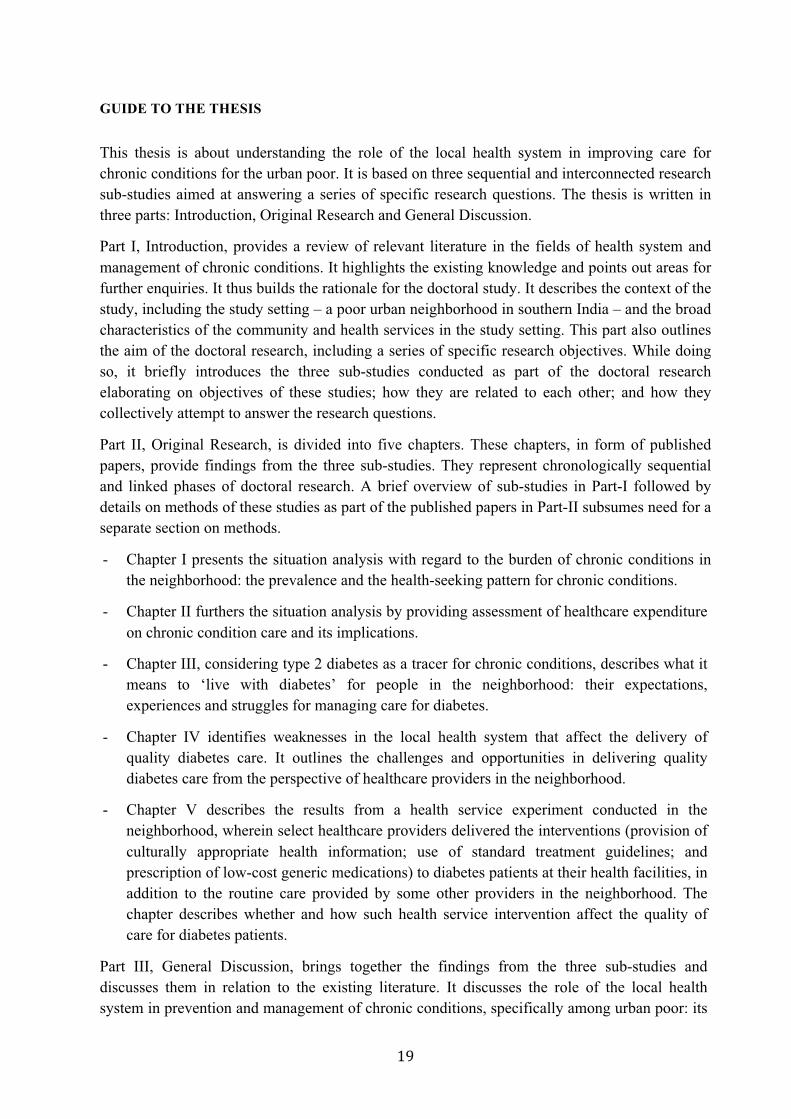
GUIDE TO THE THESIS
This thesis is about understanding the role of the local health system in improving care for chronic conditions for the urban poor. It is based on three sequential and interconnected research sub-studies aimed at answering a series of specific research questions. The thesis is written in three parts: Introduction, Original Research and General Discussion.
Part I, Introduction, provides a review of relevant literature in the fields of health system and management of chronic conditions. It highlights the existing knowledge and points out areas for further enquiries. It thus builds the rationale for the doctoral study. It describes the context of the study, including the study setting – a poor urban neighborhood in southern India – and the broad characteristics of the community and health services in the study setting. This part also outlines the aim of the doctoral research, including a series of specific research objectives. While doing so, it briefly introduces the three sub-studies conducted as part of the doctoral research elaborating on objectives of these studies; how they are related to each other; and how they collectively attempt to answer the research questions.
Part II, Original Research, is divided into five chapters. These chapters, in form of published papers, provide findings from the three sub-studies. They represent chronologically sequential and linked phases of doctoral research. A brief overview of sub-studies in Part-I followed by details on methods of these studies as part of the published papers in Part-II subsumes need for a separate section on methods.
- Chapter I presents the situation analysis with regard to the burden of chronic conditions in the neighborhood: the prevalence and the health-seeking pattern for chronic conditions.
- Chapter II furthers the situation analysis by providing assessment of healthcare expenditure on chronic condition care and its implications.
- Chapter III, considering type 2 diabetes as a tracer for chronic conditions, describes what it means to ‘live with diabetes’ for people in the neighborhood: their expectations, experiences and struggles for managing care for diabetes.
- Chapter IV identifies weaknesses in the local health system that affect the delivery of quality diabetes care. It outlines the challenges and opportunities in delivering quality diabetes care from the perspective of healthcare providers in the neighborhood.
- Chapter V describes the results from a health service experiment conducted in the neighborhood, wherein select healthcare providers delivered the interventions (provision of culturally appropriate health information; use of standard treatment guidelines; and prescription of low-cost generic medications) to diabetes patients at their health facilities, in addition to the routine care provided by some other providers in the neighborhood. The chapter describes whether and how such health service intervention affect the quality of care for diabetes patients.
Part III, General Discussion, brings together the findings from the three sub-studies and discusses them in relation to the existing literature. It discusses the role of the local health system in prevention and management of chronic conditions, specifically among urban poor: its
importance and how to strengthen the same. While making specific recommendations for enhancing chronic condition care, it also outlines areas that require further research in order to better understand and frame the health systems’ response to chronic conditions.
ABBREVIATIONS
FBS Fasting Blood Sugar GDP Gross Domestic Product INR Indian Rupee
LMIC Low- and middle-income countries PPBS Post-Prandial Blood Sugar PPP Purchasing Power Parity STG Standard Treatment Guidelines UNGA United Nations General Assembly
USD US Dollar WHO World Health Organization

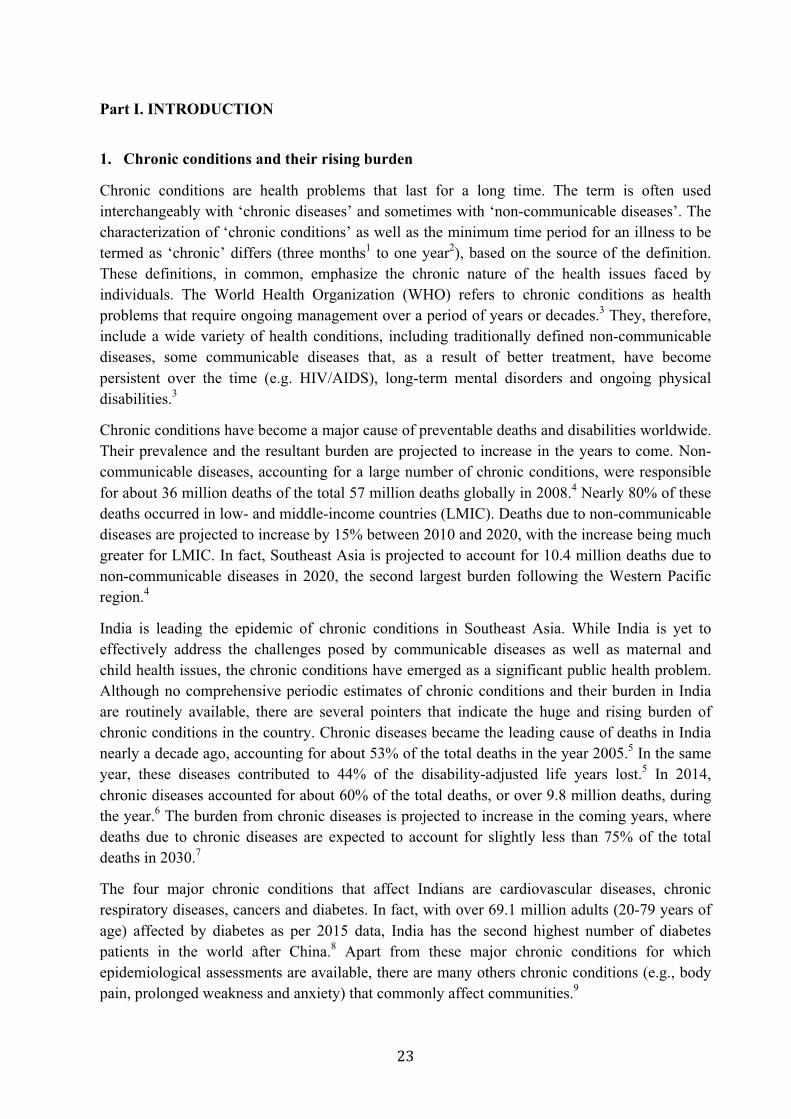
Part I. INTRODUCTION
1. Chronic conditions and their rising burden
Chronic conditions are health problems that last for a long time. The term is often used interchangeably with ‘chronic diseases’ and sometimes with ‘non-communicable diseases’. The characterization of ‘chronic conditions’ as well as the minimum time period for an illness to be termed as ‘chronic’ differs (three months1 to one year2), based on the source of the definition. These definitions, in common, emphasize the chronic nature of the health issues faced by individuals. The World Health Organization (WHO) refers to chronic conditions as health problems that require ongoing management over a period of years or decades.3 They, therefore, include a wide variety of health conditions, including traditionally defined non-communicable diseases, some communicable diseases that, as a result of better treatment, have become persistent over the time (e.g. HIV/AIDS), long-term mental disorders and ongoing physical disabilities.3
Chronic conditions have become a major cause of preventable deaths and disabilities worldwide. Their prevalence and the resultant burden are projected to increase in the years to come. Non-communicable diseases, accounting for a large number of chronic conditions, were responsible for about 36 million deaths of the total 57 million deaths globally in 2008.4 Nearly 80% of these deaths occurred in low- and middle-income countries (LMIC). Deaths due to non-communicable diseases are projected to increase by 15% between 2010 and 2020, with the increase being much greater for LMIC. In fact, Southeast Asia is projected to account for 10.4 million deaths due to non-communicable diseases in 2020, the second largest burden following the Western Pacific region.4
India is leading the epidemic of chronic conditions in Southeast Asia. While India is yet to effectively address the challenges posed by communicable diseases as well as maternal and child health issues, the chronic conditions have emerged as a significant public health problem. Although no comprehensive periodic estimates of chronic conditions and their burden in India are routinely available, there are several pointers that indicate the huge and rising burden of chronic conditions in the country. Chronic diseases became the leading cause of deaths in India nearly a decade ago, accounting for about 53% of the total deaths in the year 2005.5 In the same year, these diseases contributed to 44% of the disability-adjusted life years lost.5 In 2014, chronic diseases accounted for about 60% of the total deaths, or over 9.8 million deaths, during the year.6 The burden from chronic diseases is projected to increase in the coming years, where deaths due to chronic diseases are expected to account for slightly less than 75% of the total deaths in 2030.7
The four major chronic conditions that affect Indians are cardiovascular diseases, chronic respiratory diseases, cancers and diabetes. In fact, with over 69.1 million adults (20-79 years of age) affected by diabetes as per 2015 data, India has the second highest number of diabetes patients in the world after China.8 Apart from these major chronic conditions for which epidemiological assessments are available, there are many others chronic conditions (e.g., body pain, prolonged weakness and anxiety) that commonly affect communities.9
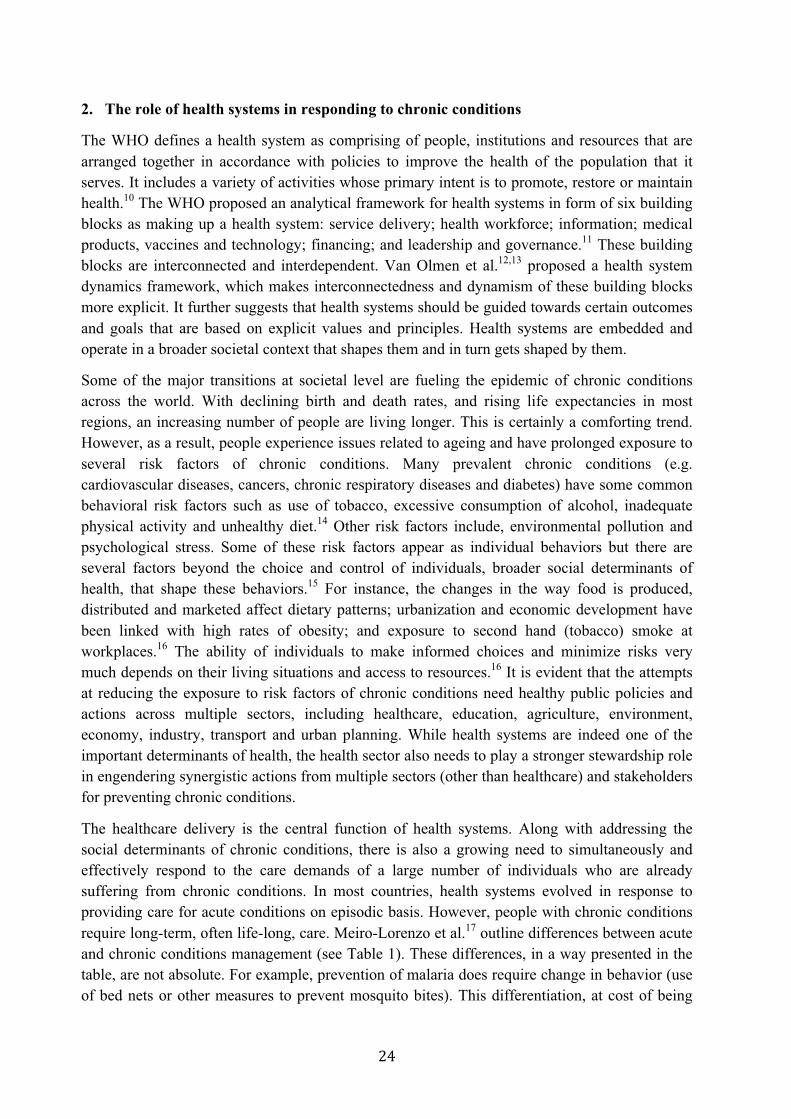
2. The role of health systems in responding to chronic conditions
The WHO defines a health system as comprising of people, institutions and resources that are arranged together in accordance with policies to improve the health of the population that it serves. It includes a variety of activities whose primary intent is to promote, restore or maintain health.10 The WHO proposed an analytical framework for health systems in form of six building blocks as making up a health system: service delivery; health workforce; information; medical products, vaccines and technology; financing; and leadership and governance.11 These building blocks are interconnected and interdependent. Van Olmen et al.12,13 proposed a health system dynamics framework, which makes interconnectedness and dynamism of these building blocks more explicit. It further suggests that health systems should be guided towards certain outcomes and goals that are based on explicit values and principles. Health systems are embedded and operate in a broader societal context that shapes them and in turn gets shaped by them.
Some of the major transitions at societal level are fueling the epidemic of chronic conditions across the world. With declining birth and death rates, and rising life expectancies in most regions, an increasing number of people are living longer. This is certainly a comforting trend. However, as a result, people experience issues related to ageing and have prolonged exposure to several risk factors of chronic conditions. Many prevalent chronic conditions (e.g. cardiovascular diseases, cancers, chronic respiratory diseases and diabetes) have some common behavioral risk factors such as use of tobacco, excessive consumption of alcohol, inadequate physical activity and unhealthy diet.14 Other risk factors include, environmental pollution and psychological stress. Some of these risk factors appear as individual behaviors but there are several factors beyond the choice and control of individuals, broader social determinants of health, that shape these behaviors.15 For instance, the changes in the way food is produced, distributed and marketed affect dietary patterns; urbanization and economic development have been linked with high rates of obesity; and exposure to second hand (tobacco) smoke at workplaces.16 The ability of individuals to make informed choices and minimize risks very much depends on their living situations and access to resources.16 It is evident that the attempts at reducing the exposure to risk factors of chronic conditions need healthy public policies and actions across multiple sectors, including healthcare, education, agriculture, environment, economy, industry, transport and urban planning. While health systems are indeed one of the important determinants of health, the health sector also needs to play a stronger stewardship role in engendering synergistic actions from multiple sectors (other than healthcare) and stakeholders for preventing chronic conditions.
The healthcare delivery is the central function of health systems. Along with addressing the social determinants of chronic conditions, there is also a growing need to simultaneously and effectively respond to the care demands of a large number of individuals who are already suffering from chronic conditions. In most countries, health systems evolved in response to providing care for acute conditions on episodic basis. However, people with chronic conditions require long-term, often life-long, care. Meiro-Lorenzo et al.17 outline differences between acute and chronic conditions management (see Table 1). These differences, in a way presented in the table, are not absolute. For example, prevention of malaria does require change in behavior (use of bed nets or other measures to prevent mosquito bites). This differentiation, at cost of being
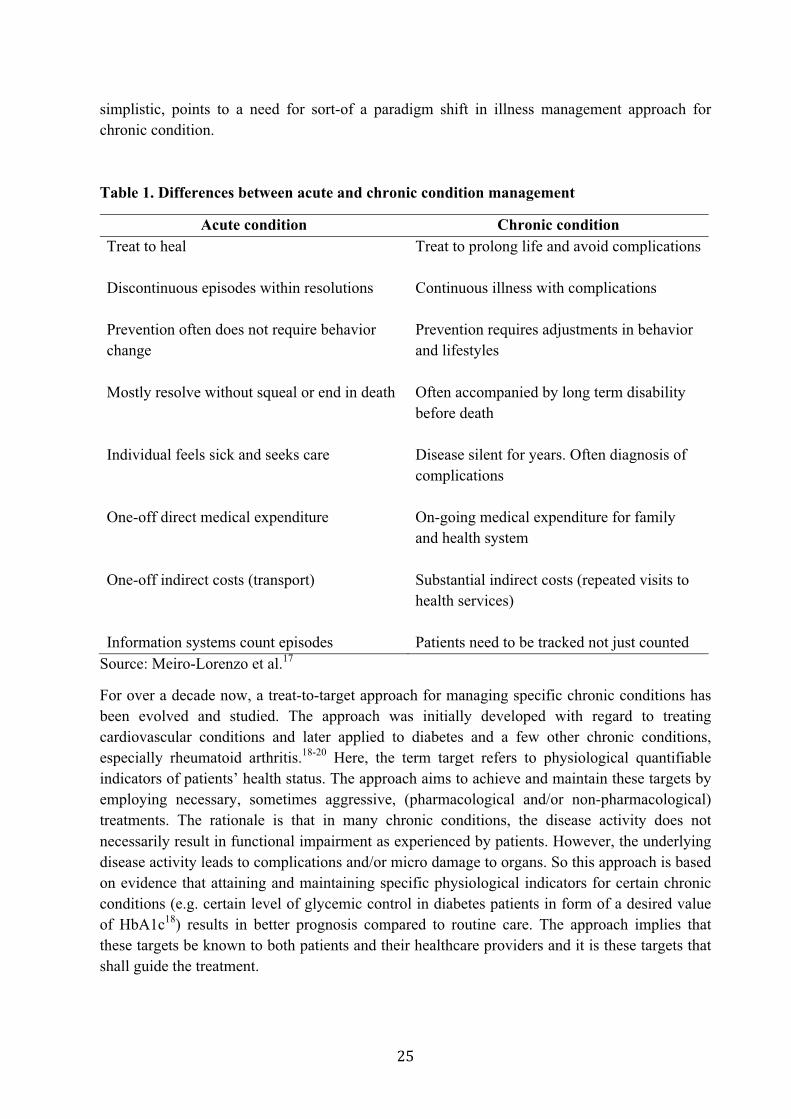
simplistic, points to a need for sort-of a paradigm shift in illness management approach for chronic condition.
Table 1. Differences between acute and chronic condition management
Acute condition Chronic condition Treat to heal Treat to prolong life and avoid complications Discontinuous episodes within resolutions
Continuous illness with complications
Prevention often does not require behavior change
Prevention requires adjustments in behavior and lifestyles
Mostly resolve without squeal or end in death Often accompanied by long term disability before death
Individual feels sick and seeks care Disease silent for years. Often diagnosis of complications
One-off direct medical expenditure On-going medical expenditure for family and health system
One-off indirect costs (transport) Substantial indirect costs (repeated visits to health services)
Information systems count episodes Patients need to be tracked not just counted Source: Meiro-Lorenzo et al.17
For over a decade now, a treat-to-target approach for managing specific chronic conditions has been evolved and studied. The approach was initially developed with regard to treating cardiovascular conditions and later applied to diabetes and a few other chronic conditions, especially rheumatoid arthritis.18-20 Here, the term target refers to physiological quantifiable indicators of patients’ health status. The approach aims to achieve and maintain these targets by employing necessary, sometimes aggressive, (pharmacological and/or non-pharmacological) treatments. The rationale is that in many chronic conditions, the disease activity does not necessarily result in functional impairment as experienced by patients. However, the underlying disease activity leads to complications and/or micro damage to organs. So this approach is based on evidence that attaining and maintaining specific physiological indicators for certain chronic conditions (e.g. certain level of glycemic control in diabetes patients in form of a desired value of HbA1c18) results in better prognosis compared to routine care. The approach implies that these targets be known to both patients and their healthcare providers and it is these targets that shall guide the treatment.
In practice, many patients do not achieve such targets.20-22 Apart from need for better evidence for suitability of such approach to many chronic conditions, barriers related to health services (healthcare providers not adopting this approach in practice; availability and affordability of required healthcare services) and related to patients (comprehension of treat-to-target protocols; mismatch in patients’ expectations and the objective targets) affect its implementation.21,22 The shared decision making that involves high level of patient participation becomes important. To this end, the attempts at understanding patients’ perspectives about this approach as well as developing patient versions (or shared versions) of treat-to-target protocols/recommendations for specific chronic conditions are useful.23,24
In 1991, before the development of treat-to-target approach, Mold and colleagues25 put forward the need for a shift from problem- (or disease-) oriented care to what they called goal-oriented care in context of caring for chronic conditions and some physiological events (pregnancy, deaths). They argued that the focus on problem-based care model has achieved a lot in terms of defining and classifying diseases and researching them and their clinical treatments. However, this is rather suitable for acute and curable illnesses, but it does not work well with long-term and often non-curable illnesses, where patients and their physicians might differ in defining the problem, modalities of care and the very outcomes expected from care. They advocated for an approach that focuses on greater involvement of patients in their healthcare through stronger patient-physician relationship, development of individual treatment goals and strategies, role of an interdisciplinary healthcare team, and considering the patient as evaluator of the progress and success. De Maeseneer26 reiterated the need for this approach in the context of increasing multi-morbidity among people with chronic conditions, where patients present multiple care demands and the need to make multiple adjustments in their lives.
Interestingly, a recent position paper on organization of care for people with chronic conditions in Belgium defined chronic condition in reference to the care demands that such patients have in common. It stated that a person with chronic disease is the one with a set of needs along different dimensions (i.e. biological, psychological, social, spiritual, and healthcare services needs), in a more-or-less complex and individually specific combination, that are prolonged or permanent and evolving over time.27 It emphasized the need for patient empowerment by putting the patients’ needs and expectations at the center of planning the care and acknowledging the role played by patients, their caregivers and families. In line with the earlier discussion, it advocated for a shift from disease-based to (patients’) need-based approach in organizing care for people with chronic conditions. Hence, it can be said that the health system clearly needs reorganization, including new orientation, skills and resources to effectively respond to care demands of people with chronic conditions.
2.1. Global response to reorganize and strengthen the health systems
Globally, the political commitment to address chronic conditions is building up. In September 2011, the United Nations General Assembly (UNGA) convened a high-level meeting on the prevention and control of non-communicable diseases. This meeting was the second of its kind in focusing on a health issue in United Nations’ history, with the earlier one focusing on HIV/AIDS. The declaration adopted at this meeting acknowledged the problems posed by non-communicable diseases and affirmed the commitment to a range of actions to be taken at
different levels for prevention and control of these diseases.28 Prior to this meeting, the UNGA had adopted a global strategy for prevention and control of non-communicable diseases (2000)14 and the action plan (2008)29 to implement the same. The strategy called for health system reforms, while the action plan charted out various measures to be taken in order to reorient and strengthen the existing healthcare systems, enabling them to respond to the care demands of people with non-communicable diseases in a better way.
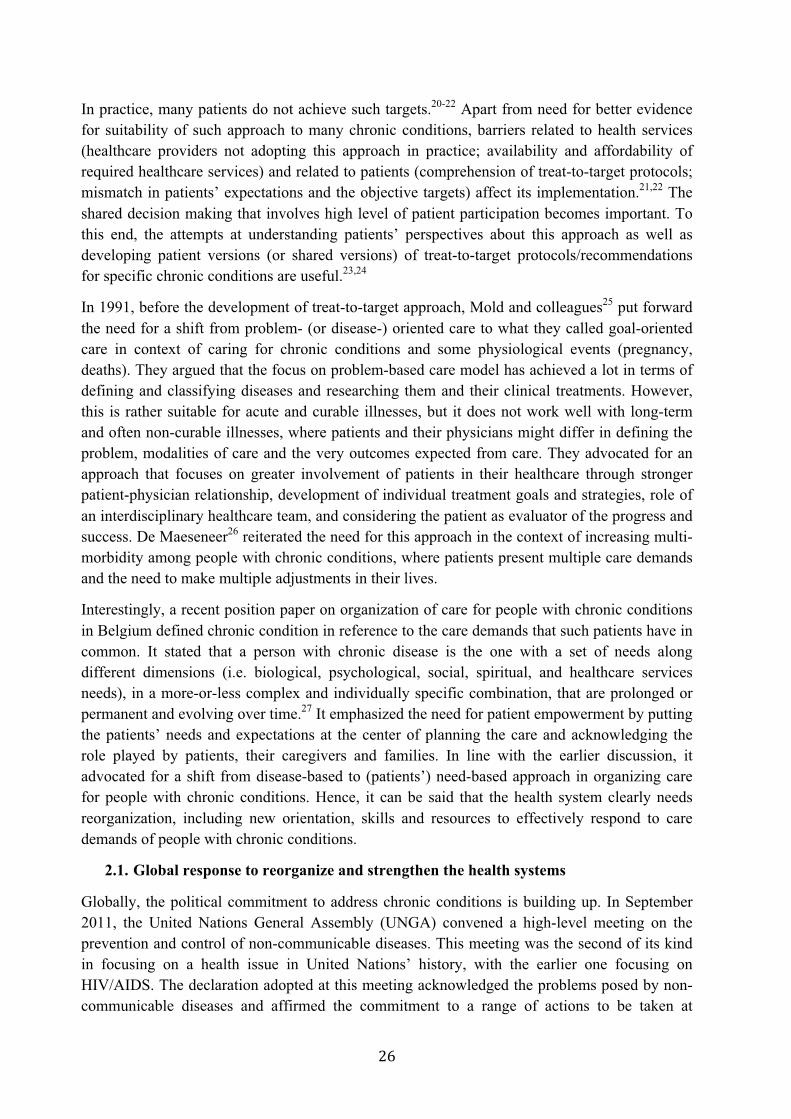
There has been a marked growth in literature, largely based on the work in high-income countries, on how health systems should be reorganized to deliver better chronic conditions care. The most popular has been the evolution of Chronic Care Model in the mid-1990s by the MacColl Center for Health Care Innovation that was subsequently used in varied contexts, and refined over time.30,31 The model proposed reorganization of health systems where the delivery system design promotes self-management support to patients, while enhanced clinical information and decision support systems for healthcare providers make care efficient, scientific and effective. It also envisaged enhanced involvement of patients and communities, optimizing community resources as well as advocacy for healthier policies. Later, in 2002, the WHO expanded this model, emphasizing the broader policy environment that surrounds patients, their families, communities and healthcare organizations. It refined the model and created the Innovative Care for Chronic Conditions Framework (see Figure 1.1).3 Several other adaptations of the chronic care model, based on its applications in different contexts, exist32, including the expanded chronic care model33 that adds focus on population-level scope, and healthy public policies, bringing it closer to the concepts in the innovative care for chronic conditions framework.
Figure 1.1. Innovative Care for Chronic Conditions Framework
Source: World Health Organization3
2.2. Role for primary healthcare and local health systems
The Alma-Ata declaration in 1978 suggested primary healthcare as the key strategy to achieve health for all.34 However, there were subsequent departures from it, with emergence of a selective primary healthcare, focusing on technical solutions to select diseases.35 There has now been a renewed focus on the importance of primary healthcare within the discourse about strengthening of health systems. The World Health Report 2008, titled “Primary health care – Now more than ever” is the best example of this renewed focus.36 It reflected on the role of primary care teams and put primary care at the center of health system as the ‘hub of coordination’.37 The role of the primary care team then is to mediate between the community and other levels of healthcare services, including the players outside the health system, helping people navigate through complex health system and coordinate care for them. This is unlike the traditional conception of organization of healthcare services, wherein the referral hospitals are at the top of the triangle and primary care providers at its base, with little, if any, influence on the way those hospitals and other players function and contribute towards healthcare for people. The challenge of rising chronic conditions in LMIC has further echoed the need to strengthen primary healthcare in these countries. There is a growing consensus for the need to strengthen existing health systems with a focus on primary healthcare so that they deliver integrated care, considering multiple and ongoing care demands of the people with chronic conditions.38-40
The WHO developed a package of cost-effective interventions for prevention and control of major chronic conditions (coronary heart disease, stroke, diabetes, cancer and asthma) that could be integrated into primary healthcare in resource-poor settings.41 In addition to cost-effectiveness, it is also desirable from the equity point of view to focus on primary healthcare, as such a system would ensure that affordable care is provided, as far as possible, closer to people and coordinated in a way that considers individuals’ life circumstances and overall needs.42,43
While strengthening health systems and integrating effective interventions into primary care is desirable, there is a dearth of knowledge on how to achieve this in resource-poor settings. Sanders and Haines44 highlight this gap between the available knowledge and the implementation of this knowledge. They argue that this gap is attributed to the low priority given to health system research, especially implementation research, that studies the implementation approaches and processes as well as focus on ‘how to’ transform the available knowledge into practice within health systems.44 Despite the growing attention by global actors on the need for strengthening health systems and the significance of health systems (and policy) research for the same, there is dearth of research on how local health systems could be strengthened. The role of the local health system – defined as all organizations, people and actions that primarily intend to promote, restore, or maintain health at more operational level at a city or a village – is key to the overall performance of the health system. At this level, policies are adopted and implemented, responsive health services are provided and programs are executed.
In India, apart from the general health services, the Ministry of Health and Family Welfare (Government of India) has put in place several programs for prevention and management of chronic conditions: National Cancer Control Program; National Mental Health Program; Revised National Tuberculosis Program; National Program for Control of Blindness; National
Program for Prevention and Control of Deafness; National Program for Prevention and Control of Cancer, Diabetes, Cardiovascular Diseases and Stroke; National Tobacco Control Program; National Program for Palliative Care; National Oral Health Program; National Program for Prevention and Control of Fluorosis; and National Program for Healthcare of Elderly. Some of these programs are long-standing ones with nationwide coverage, while others are more recent ones with very limited population coverage. Many researchers as well as governments believe that there is a growing need to build synergies across various disease-specific programs and promote their integration into existing health systems, especially at the local (district) level.45-47 At the same time, the effective implementation of these programs is also essential.46,48,49 This calls for strengthening of local health systems that represent a crucial level of health service planning and management in India.
We would, therefore, like to understand how a local health system could be strengthened to deliver quality care for people with chronic conditions. We prefer to study a local health system in urban India, especially the one catering to urban poor. This is because the urban poor constitute a very vulnerable group not only in terms of burden of chronic conditions but also in terms of access to healthcare.
3. The context of the study
3.1. India
The republic of India is situated in South Asia, bounded by Pakistan in the west; by China, Nepal and Bhutan in the northeast; by Burma and Bangladesh in the east; by the Indian Ocean in the south; and by the Arabian Sea in the southwest. India is the seventh largest country in the world in terms of area and the second largest in terms of population (over 1.2 billion in 2011).50 About 68.8% of the country’s population lives in rural areas. Following British colonial rule, India got independence in 1947. India is the world’s largest democracy with multi-party system and parliamentary form of constitutional democracy. There are 29 states and seven union territories. India represents high geographic, cultural and linguistic diversity. While there is no one national language, a large part of the population speaks Hindi, an official language for the Government of India, and there are 22 officially recognized languages in the Indian constitution. The census of India 2001, however, recognized 122 major languages with speakers’ strength of 10 000 and more. India is today among the world’s fastest growing economies, with the average annual growth rate of the Gross Domestic Product (GDP) of 5.8% over the last two decades. The gross national income per capita in 2013 was 5 350 international dollars at purchasing power parity (PPP).51
India is also a country of contrasts. The world’s largest number of poor (as per the World Bank’s international poverty line) resides in India. In 2011, about 59.2% of population lived below two international dollars (at PPP) a day.52 The life expectancy at birth was 66 years in 2013.53 The maternal mortality remains high at 190 maternal deaths per 100 000 live births in 2013.54 Similarly, the infant mortality rate remains high at 41 infant deaths per 1000 live births in 2013.55 Nearly half of India’s children are underweight.56 There remain huge disparities in health status across rural and urban areas as well as across the Indian states.57 For example, the
infant mortality rate in Kerala (12) is much lower than that in Madhya Pradesh and Assam (54).57
The healthcare delivery system in India is characterized by coexisting government health services and relatively unregulated private health services. There is an elaborate network of government healthcare facilities in rural India. There are women community health volunteers/workers, called Accredited Social Health Activist for each village serving as a link between communities and formal healthcare services. At lowest level, there are ‘Health Sub Centers’ manned by Auxiliary Nurse Midwives catering to a population of approximately 3000 to 5000 individuals. These front line health workers coordinate and provide preventive and promotive healthcare as well as some basic medications and referrals to higher level. The next level is ‘Primary Health Centre’ catering to about 20 000 to 30 000 population and is the first contact for communities with a qualified medical doctor. It provides primary care with laboratory and pharmacy support and possibility for minor operative procedures. Catering to four of the primary health centers and about 80 000 to 120 000 population is a ‘Community Health Centre’ providing referral and specialist care. Ideally, a community health center shall have about 30 inpatient beds and five specialists including a physician, a surgeon, a pediatrician and an obstetrician or a gynecologist. Community health centers have operation theatres, laboratory, x-ray facility and pharmacy support. Some of these Community Health Centers and/or other existing facilities such as district and sub-divisional hospitals are made into fully functional ‘First Referral Units’ providing round-the-clock emergency care and blood storage facility. As on March 31 2015, there were 153 655 health sub centers, 25 308 primary health centers and 5 396 community health centers functioning in the country.58 There are medical schools attached with hospitals in large cities providing super-specialty care.
In urban India, there is no uniform network of government healthcare facilities comparable to one in rural India. The government healthcare provision in cities remains variable in scale and manner ranging from two-tier system of primary care facilities and referral care facilities to just having primary care facilities.
As per the constitutional mandate, the state governments in India are responsible for organizing and delivering healthcare services to their population while the central government looks after national disease control and family planning programs, medical education, prevention of food adulteration, and regulations concerning manufacturing of drugs. There are several disease specific programs by national government, some of which, mentioned earlier (section 2.2), are aimed at prevention and management of chronic conditions. In principle, there is universal coverage by government health facilities that provide care for free or for nominal user charges. However, in practice, there are several barriers to access care in government facilities and many patients end up spending out-of-pocket and/or seeking care from private health sector. For example, lack of adequate human resource is one of many barriers. As on March 2015, 8.1% of primary health centers were not having doctors while lack of pharmacists and laboratory technicians was reported for 38.1% and 21.9% of primary health centers respectively.58 At community health center level, there was an average shortfall of 81.2% specialists.58
Post independence, the private sector grew at a fast pace and now provides nearly 80% of all outpatient care and about 60% of all inpatient care. The private sector is heterogeneous. The
stand-alone single doctor clinics represent majority of providers providing primary care on outpatient basis. There are hospitals of varying sizes including growing presence of corporate entities providing primary and referral care. The private sector predominantly works on fee-for-service basis.
The total health expenditure per capita (USD 62) and the government spending on health (1.04% of GDP) remains very low. As per the national health accounts for the year 2004–05, healthcare was primarily financed through out-of-pocket expenditure by the households (71.1%), followed by government funding—mainly tax-based spending (19.7%)—and a very small part from other sources.59 Estimates based on a nationally representative survey in 2004 suggest that over 63.2 million Indians were pushed below the poverty line during the year due to out-of-pocket payments for healthcare.60
3.2. Urban poor, a vulnerable population group in India
India is urbanizing at a rapid pace. The urban population, as part of the total population in India, has increased from 18% in 1961 to 31.2% in 2011.50 As per the Census of India 2011, over 65.4 million urban Indians lived in slums.61 The census refers to slum as “a compact area of at least 300 population or about 60–70 households or poorly-built congested tenements, in unhygienic environment, usually with inadequate infrastructure and lacking in proper sanitary and drinking water facilities” or any other areas that have been recognized as slums by certain government agencies.61 A very crude projection suggests that the slum population might grow to over 104.6 million by 2017.62 It has been argued that these numbers are a gross underestimation of the actual slum population, mainly due to the issues related to the definition and methods of slum estimation.62,63 As per the poverty estimates of 2011–12, about 13.7% of urban Indians lived below the poverty line.64 This estimates stood at 25.7% in 2004–05 and the reduction is partly due to the revision in the national poverty line that now stands at meager INR 1000 per capita per month (roughly USD 0.5 per person per day).64 Slums are probably the most visible representation of urban poverty, but not the only one. Analysis of the National Family Health Survey of 2005–06 for eight cities revealed that a significant portion of people belonging to the poorest wealth quartile did not live in slums.63
The major chronic conditions in India, including coronary heart disease and diabetes, are significantly more prevalent in the urban areas than in the rural areas.65,66 Some of the studies in the recent years have shown a high prevalence of chronic conditions, such as cardiovascular diseases67–69, diabetes69–71, asthma and chronic bronchitis72, among the urban poor.
There are huge intra-urban inequities in access to basic services, including healthcare. Households within the poorest wealth quartile of the urban population and those in slums had far less access to piped water supply and toilet facilities compared to those in non-slum areas and the rest of the urban population.63 Many key health indicators, such as the mortality rate among children less than five years of age, the coverage of immunization services among children, the coverage of antenatal care, and birth assistance among pregnant women were poorer among those in the poorest quartile and slums compared to the rest of the urban population.63 Around 26% of the households in slums had no access to arrangements for waste disposal system, and about 18% had no access to adequate drinking water.73 Ironically, nearly 75% of the households
in slums had not received any benefits from several government initiatives for poverty alleviation.73
The healthcare services in poor urban areas remain inadequate and weak. In general, poor coordination across multiple healthcare providers, inadequate infrastructure and reach by government health services, prominent presence of informal (less/unqualified) private providers, huge out-of-pocket expenditure leading to impoverishment, barriers in accessing health services despite its proximity, and preference for private providers among the urban poor for various reasons (e.g. favorable opening hours, lesser indirect costs and negative attitude of the providers in government healthcare, etc.) are some of the recognized aspects of health systems catering to the urban poor.74–77
Realizing the long-term neglect of the health of the urban poor, the Government of India recently launched a National Urban Health Mission77—later merged with a decade long National Rural Health Mission, forming the National Health Mission78—to revamp the urban health system and, especially, to improve access to quality healthcare services for the urban poor. It is in this context of already weak health system and growing political will to improve the health of the urban poor, that the rising burden of chronic conditions could be seen as both a challenge to the existing health system and an opportunity as well as an entry point for strengthening the system to improve care for chronic conditions and healthcare in general for the urban poor.
3.3. KG Halli – the study site
Kadugondanahalli (KG Halli), one of the 198 administrative units in Bangalore city (also called Bengaluru), was chosen as the study site. Bangalore, with a population of over 9.6 million, is the capital city of the south Indian state of Karnataka. In 2011, it was reported that over 3.2 million people in Karnataka lived in slum areas.61As per the Karnataka Slum Development Board, there are about 2804 slums in the state, of which 597 are in Bangalore.79 KG Halli is a poor urban neighborhood with one such slum area (Figure 1.2). KG Halli was chosen as a study site owing to the fact that the Institute of Public Health, an organization that the doctoral student is affiliated with, has been implementing a health project in the area since 2009. The aim of the project is to improve the residents’ access to quality healthcare through working with local healthcare providers, health authorities at the city and provincial level, and KG Halli residents. Initial work undertaken for this project gave basic understanding about the context and the actors in the area, making it relatively easier to frame and conduct a long-term research on health system in the area.

Figure 1.2. Indicative location of the Study Site – KG Halli
Community life in KG Halli
As per the records of the municipal government, KG Halli had a population of 34 842 people in the year 2014, residing in an area of just 0.7 square kilometer.80 A census conducted in KG Halli during 2009–2010, as part of the project implemented by the Institute of Public Health, shed more light on the demographics of the people in KG Halli.81 The majority of the population follows Islam (65.5%), followed by Hinduism (21%) and Christianity (11.2%). The population of KG Halli is relatively young, with about three-fourth of the population below the age of 37 years and the median age of the population being 25 years. KG Halli is home to migrants from the neighboring states. Consequently, at least three languages (Kannada, Urdu and Tamil) are commonly spoken in the area. Most of the people earn their living through manual and semi-skilled labor, small businesses and factory jobs.
The images in Figure 1.3 provide glimpses of the community life in KG Halli. The residents of the area have poor access to some of the basic necessities of life. In 2010, about 12.7% households had no water supply in their premises, and had to depend on public water supply connection in the neighborhood or on private water suppliers. Even for those with provision of water supply in their premises, the supply was available for only a few minutes in a few days or weeks depending on the time of the year.
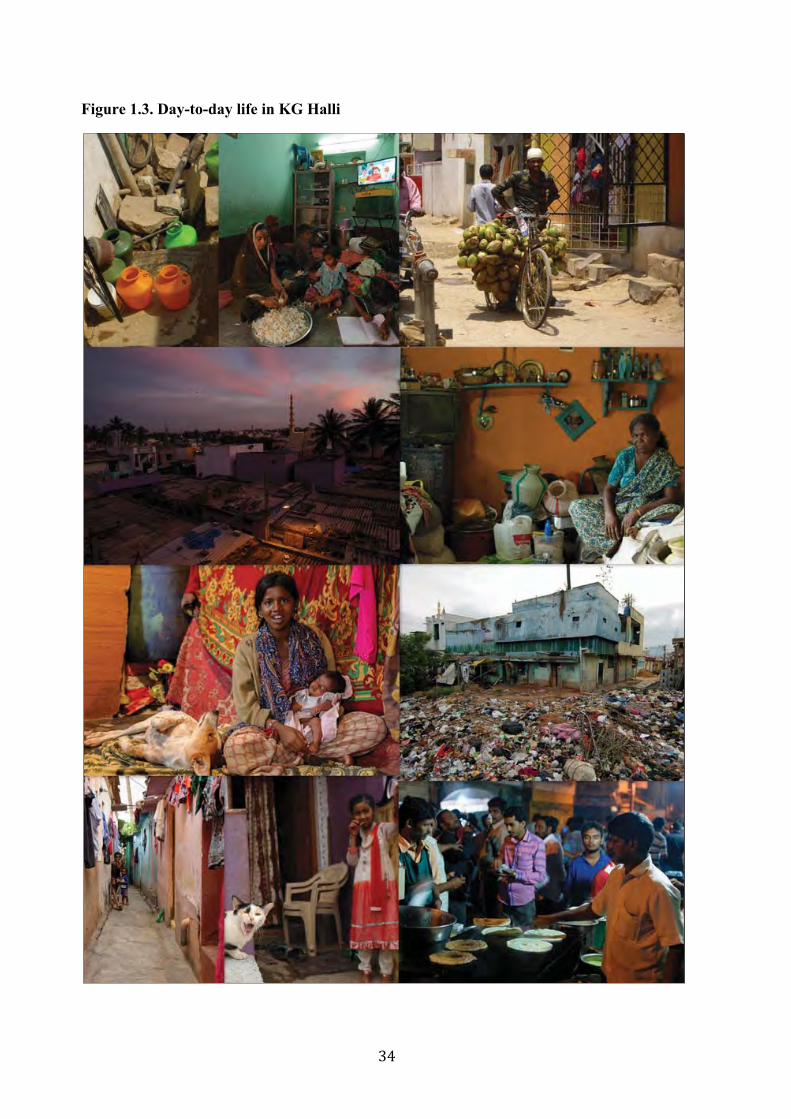
Figure 1.3. Day-to-day life in KG Halli
A few households (2.7%) lacked toilets in their premises and some of the toilets were not in functional state. While 61.8% households used liquefied petroleum gas, about 36.4% used kerosene and 1% used firewood as cooking fuel. The average per capita income of KG Halli residents was INR 2 200 per month (i.e., a little over one USD a day). In India, ration card—a document issued by government authorities to the citizens of India—is used to purchase essential commodities at subsidized rates. Apart from providing this benefit, the ration card is also an important identity proof for households. It indicates the households’ official poverty status (i.e., above- or below-the-poverty line) and is a basic necessity to access many welfare schemes offered by government bodies. Going by the status in ration card, about 10.5% households fell below the poverty line in KG Halli. In fact, nearly 39.2% households in KG Halli did not possess a ration card, implying their inability to access government welfare schemes, including social health protection programs.
Healthcare services in KG Halli
KG Halli has a mixed healthcare delivery system, with three government health facilities and at least 32 private health facilities. The state government runs a community health center, providing primary care and limited specialist care. The municipal government runs one health center providing primary care and one dispensary providing primary care for tuberculosis patients. These facilities offer services at no cost to people living below the poverty line, and charge a nominal fee for selected services to other patients.
A majority of the private health facilities in KG Halli are single-doctor clinics, providing primary care on outpatient basis. There are four private hospitals with inpatient facilities, and many private pharmacies and laboratories in the area. The private providers mainly work on fee-for-service basis and are trained in different traditions of medicine: Unani, Ayurveda and Allopathy (modern medicine). This pluralistic nature of the healthcare delivery system is a characteristic feature of the Indian health system.82 Other private healthcare facilities nearby KG Halli include a private medical school with a hospital attached to it. Figure 1.4 captures routine health facilities in KG Halli.
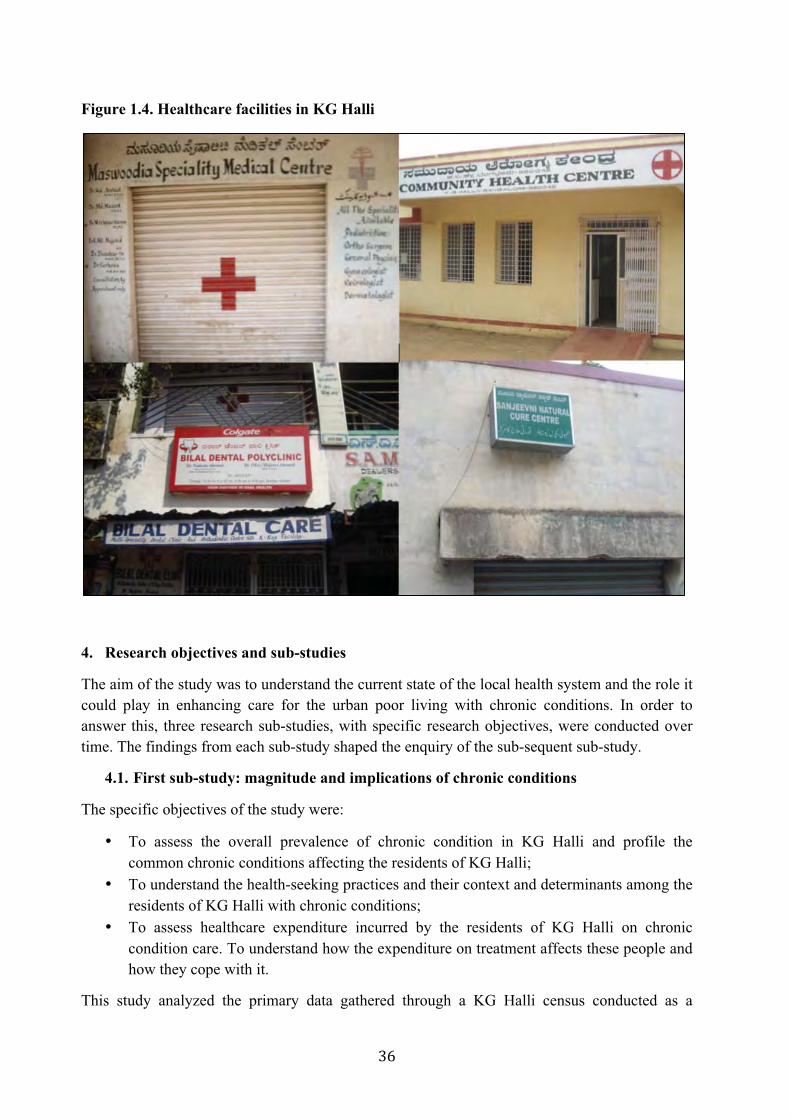
Figure 1.4. Healthcare facilities in KG Halli
4. Research objectives and sub-studies
The aim of the study was to understand the current state of the local health system and the role it could play in enhancing care for the urban poor living with chronic conditions. In order to answer this, three research sub-studies, with specific research objectives, were conducted over time. The findings from each sub-study shaped the enquiry of the sub-sequent sub-study.
4.1. First sub-study: magnitude and implications of chronic conditions
The specific objectives of the study were:
• To assess the overall prevalence of chronic condition in KG Halli and profile thecommon chronic conditions affecting the residents of KG Halli;
• To understand the health-seeking practices and their context and determinants among theresidents of KG Halli with chronic conditions;
• To assess healthcare expenditure incurred by the residents of KG Halli on chroniccondition care. To understand how the expenditure on treatment affects these people andhow they cope with it.
This study analyzed the primary data gathered through a KG Halli census conducted as a
baseline for the health project initiated by the Institute of Public Health, Bangalore. The doctoral student was part of the team that worked on this project that aimed at improving the quality of healthcare for KG Halli residents by working with local healthcare providers, health authorities as well as the residents of KG Halli. The census, a house-to-house survey, was conducted between June 2009 and March 2010. Five trained data collectors, who came from KG Halli and adjoining areas and later became community health workers in that project, administered a structured field-tested questionnaire at the household level. The questionnaire was framed to collect data on socio-demography, self-reported illness profile, health-seeking behavior and healthcare expenditures.
In total, data related to 44 514 individuals from 9 299 households in KG Halli were collected. In this study, the census data were analyzed to assess the prevalence of self-reported chronic conditions. The data were analyzed to understand the health-seeking behavior of the residents: type of health services (government or private) and the level of health services (clinics/health center, hospitals, or super-specialty hospitals) sought by people with chronic conditions. Multivariable logistic regression models were used to understand predictors of self-reported prevalence and health-seeking for overall chronic conditions as well as for hypertension and diabetes (the two most commonly reported conditions) in particular. Finally, occurrence and magnitude of out-of-pocket payments for chronic condition care were assessed. Impact of out-of-pocket payments on healthcare was assessed through the resultant financial catastrophe and impoverishment among people with chronic conditions in KG Halli. The detailed methods and findings are provided in Chapter I, and Chapter II of the Part II of this thesis.
4.2. Second sub-study: analysis of the local health system
The specific objectives of the study were:
• To understand how people with diabetes (a proxy for chronic conditions) in KG Halli manage care for their condition. To understand the patients’ perspectives about the barriers faced in managing diabetes and their suggestions/expectations in regard to healthcare services.
• To analyze the local health system in KG Halli with regard to delivery of diabetes care. To understand the constraints and opportunities within local health services to improve diabetes care from the perspective of healthcare providers.
The first sub-study (see under 4.1) revealed high prevalence of self-reported chronic conditions in KG Halli. Diabetes and hypertension were the two most common self-reported chronic conditions. India is in fact leading the epidemic of diabetes in the world with over 69.1 million adults affected by diabetes.8 The healthcare providers in KG Halli were also concerned about how diabetes has increased in last few years and has become a common ailment among people in KG Halli. Considering the frequency of the condition, providers’ interest, and the need to be specific enough and somehow reduce complexity of studying many conditions together, diabetes was taken as a proxy for common chronic conditions for this study.
In-depth interviews were conducted with diabetes patients using the phenomenological approach to understand patients’ lived experiences with diabetes: living with the condition;
seeking and managing care for the condition; and expectations from healthcare services. Diabetes patients were approached through help from community health workers working in KG Halli for over three years. The community health workers, from their respective work areas, helped in identifying patients who were willing to be part of the study and who would represent both the sexes and different stages of diabetes and diabetes treatment. Our interview guide contained broad enquiry areas that were refined over time. Sampling of respondents was continued till data saturation was achieved. In total, 16 respondents (seven women and nine men) were interviewed. The data were analyzed without using any particular model but considering a broad enquiry of understanding how patients perceive, frame and manage their illness. The patients’ narratives pointed to various themes defining constraints that they face in managing their condition in day-to-day life. Please refer to Chapter III of Part II of this thesis for details.
In order to understand the organization of diabetes care in KG Halli, semi-structured interviews were conducted with the healthcare providers delivering diabetes care in and around KG Halli. The health system dynamics framework developed by Van Olmen et al.12,13 was used to shape the research enquiry. This framework provided an analytical lens to look at the local health system as made up of ten interactive elements: goals and outcomes; values and principles; service delivery; the population; the context; leadership and governance; and the organization of resources (finances, human resources, infrastructure and supplies, knowledge and information). As diabetes care was largely provided by non-specialist healthcare providers as part of their general practice and as there were obvious gaps in chronic care provision, we preferred to use a framework meant to assess general health system instead of a framework specific to chronic condition care. We did considered elements of Innovative Care for Chronic Conditions Framework, especially ones related to healthcare organization while using health system dynamics framework. All the health facilities located in KG Halli (health centers, clinics, hospitals) that claimed to be offering care to diabetes patients were sampled. Additionally, we sampled health facilities located within two-kilometer radius (easy-to-travel distance) from KG Halli that were used by more than 50 diabetes patients from KG Halli as per the data from the first sub-study. Doctors (specialist or non-specialists) at these facilities, who primarily treated diabetes patients, were interviewed. We also sampled, one of each from the frequently used private pharmacies and private laboratories. In total, 19 respondents (three specialist doctors, 13 non-specialist doctors, two pharmacists and one laboratory technician) were interviewed. Apart from conducting interviews, the researcher maintained a field diary to record observations made at sampled healthcare facilities. The data collected from interviews and field diary were analyzed using thematic analysis, and the major recurring themes were grouped into four categories representing four of the ten elements of the health system dynamics framework: health service delivery; knowledge and information; leadership and governance; and values and principles. Chapter IV in Part II of this thesis provides detailed methods and results.
4.3. Third sub-study: health service intervention to improve diabetes care
The specific objectives of the study were:
• To understand whether and how the provision of culturally appropriate health information, use of standard treatment guidelines and that of low-cost generic
medications as part of the local health services improve the quality of diabetes care for patients in KG Halli.
As part of the second sub-study (see under 4.2), suggestions were sought from the local healthcare providers on how to improve the quality of healthcare for diabetes patients. They were also asked if they would be interested in implementing these suggestions in their health facilities and be part of the third sub-study.
We conducted a quasi-experimental study in KG Halli where four health facilities delivered the intervention that, beyond the usual care, included display of posters and videos on culturally appropriate diabetes education and the use of generic medications and standard treatment guidelines for diabetes management by doctors. Four matching health facilities were used as control sites that delivered the usual care. Cohorts comprising 163 diabetes patients, who visited the intervention facilities, and 154 patients who visited control facilities in their last healthcare visit were used to assess the impact of the intervention. Pre- and post-intervention surveys of the diabetes patients visiting the intervention and control sites, researcher’s field observations and interviews of doctors at the intervention sites were used for data collection. The RE-AIM (reach, efficacy, adoption, implementation, maintenance) framework83 was used for the evaluation of the intervention. Chapter V in Part II of this thesis provides detailed results.
5. Discussion and the way forward
In Part III of the thesis, we bring together the findings from these three sub-studies and discuss them in relation to the existing literature. We discuss the role of the local health system in prevention and management of chronic conditions, specifically among urban poor: its importance and how to strengthen the same. While making specific recommendations for enhancing chronic condition care, we outline areas that require further research in order to better understand and frame the health systems’ response to chronic conditions.
6. References
1. National Center for Health Statistics, Jabin TB. Repoting chronic conditions in the National Health Interview Survey - a review of tendencies from evaluation studies and methodological test. Vital and Health Statistics. Series 2, No. 105. DHHS Pub. No. (PHS) 87-1379. Public Health Service. Washington: U.S. Government Printing Office; 1987. Available from: http://www.cdc.gov/nc1 hs/data/series/sr_02/sr02_105.pdf [accessed on 19.07.2015]
2. Robert Wood Johnson Foundation, John Hopkins Bllomberg School of Public Health. Chronic care : Making the case for ongoing care. Princeton: Robert Wood Johnson Foundation; 2010.
Available from: http://www.rwjf.org/content/dam/farm/reports/reports/2010/rwjf54583. [accessed on 19.07.2015]
3. World Health Organization. Innovative care for chronic conditions: building blocks foraction. Geneva: World Health Organization; 2002.
4. World Health Organization. Global status report on noncommunicable diseases 2010.Geneva: World Health Organization; 2011. Available from:http://whqlibdoc.who.int/publications/2011/9789240686458_eng.pdf?ua=1 [accessed on19.07.2015]
5. Reddy KS, Shah B, Varghese C, Ramadoss A. Responding to the threat of chronicdiseases in India. Lancet 2005;366(9498):1744–9.
6. World Health Organization. India: World Health Organization - NoncommunicableDiseases (NCD) Country Profiles; 2014 Available from:http://www.who.int/nmh/countries/ind_en.pdf?ua=1 [accessed on 19.07.2015]
7. Patel V, Chatterji S, Chisholm D, Ebrahim S, Gopalakrishna G, Mathers C, et al. Chronicdiseases and injuries in India. Lancet 2011;377(9763):413–28.
8. International Diabetes Federation. IDF Diabetes Atlas update poster. (7th edition).Brussels, Belgium; 2015. Available from: http://www.diabetesatlas.org [accessed on29.12.2015]
9. Bang A. Aarogya-Swaraj: an empowerment model of health care. Available from:http://nhsrcindia.org/biodata/Aarogya-Swaraj.ppt [accessed on 19.07.2015]
10. World Health Organization. The World Health Report 2000 Health systems: improvingperformance. Geneva: World Health Organization; 2000. Available from:http://www.who.int/entity/whr/2000/en/whr00_en.pdf?ua=1 [accessed on 19.07.2015]
11. World Health Organization. Everybody’s business: Strengthening health systems toimprove health outcomes. WHO's framework for action. Geneva: World HealthOrganization; 2007
12. Van Olmen J, Criel B, Bhojani U, Marchal B, Van Belle S, Chenge MF, et al. The healthsystem dynamics framework: the introduction of an analytical model for health systemanalysis and its application to two case-studies. Heal Cult Soc 2012;2(1):1–21.
13. Van Olmen J, Criel B, Van Damme W, Marchal B, Van Belle S, Van Dormael M, et al.Analysing health systems to make them stronger. Antwerp: ITG Press; 2010.
14. World Health Organization. Global strategy for the prevention and control ofnoncommunicable diseases. Report by the Director-General. Fifty-third World HealthAssembly; 2000. Available from:http://apps.who.int/gb/archive/pdf_files/WHA53/ea14.pdf?ua=1 [accessed on 19.07.2015]
15. Wilkinson R, Marmot M (editors) Social determinants of health: the solid facts. (2nd
edition) Denmark: World Health Organization; 2003.
16. Rasanathan K, Krech R. Action on social determinants of health is essential to tackle noncommunicable diseases. Bull World Health Organ 2011;89:775–6. Available from: http://www.who.int/bulletin/volumes/89/10/11-094243/en/ [accessed on 29.12.2015]
17. Meiro-Lorenzo M, Villafana TL, Harrit MN. Effective responses to non-communicable diseases: embracing action beyond the health sector. Health, Nutrition and Population (HNP) Discussion Paper. Washington; The World Bank; 2011. Available from: http://siteresources.worldbank.org/HEALTHNUTRITIONANDPOPULATION/Resources/281627-1095698140167/EffectiveResponsestoNCDs.pdf [accessed on 19.07.2015]
18. Wangnoo SK, Sethi B, Sahay RK, John M, Ghosal S, Sharma SK. Treat-to-target trials in diabetes. Indian J Endocrinol Metab 2014;18(2):166–74.
19. Tan NC, Ho S. Treat-to-target approach in managing modifiable risk factors of patients with coronary heart disease in primary care in Singapore: what are the issues? Asia Pac Fam Med 2011;10(12).
20. Solomon DH, Bitton A, Katz JN, Radner H, Brown EM, Fraenkel L. Treat to target in rheumatoid arthritis: fact, fiction, or hypothesis? Arthritis Rheumatol 2014;66(4):775–82.
21. Lee KKC, Lee VWY, Chan WK, Lee BSC, Chong ACY, Wong JCL, et al. Cholesterol goal attainment in patients with coronary heart disease and elevated coronary risk: results of the Hong Kong hospital audit study. Value Heal 2008;2(Suppl 1):S91–8.
22. Lewis SJ. An urgent matter-identifying your patients’ cardiovascular risk and improving their outcomes. Low-density lipoprotein cholesterol and coronary heart disease: the importance of reaching target goals with statin therapy. J Fam Pract 2009;58(2):S32–40.
23. Curtis JR, Shan Y, Harrold L, Zhang J, Greenberg JD, Reed GW. Patient perspectives on achieving treat-to-target goals: a critical examination of patient-reported outcomes. Arthritis Care Res 2013;65(10):1707–12.
24. De Wit MPT, Smolen JS, Gossec L, van der Heijde DMFM. Treating rheumatoid arthritis to target: the patient version of the international recommendations. Ann Rheum Dis 2011;70:891–5.
25. Mold JW, Blake GH, Becker LA. Goal-oriented medical care. Fam Med 1991;23(1):46–51.
26. De Maeseneer J. James Mackenzie Lecture 2011: multimorbidity, goal-oriented care, and equity. Br J Gen Pract 2012;62(600):e522–44. Available from: http://www.ncbi.nlm.nih.gov/pmc/articles/PMC3381278/ [accessed on 19.07.2015]
27. Paulus D, Van den Heede K, Mertens R, editors. Position paper: organisation of care for chronic patients in Belgium. Brussels: Balgian Health Care Knowledge Centre (KCE). KCE Reports 190C. D/2012/10.273/84; 2012.
28. United Nations General Assembly. Political declaration of the high-level meeting of the general assembly on the prevention and control of non-communicable diseases. General Assembly Sicty-sixth session; 2012 Available from:

http://www.who.int/nmh/events/un_ncd_summit2011/political_declaration_en.pdf [accessed on 19.07.2015]
29. World Health Organization. Prevention and control of noncommunicable diseases: implementation of the global strategy. Sixty-first World Health Assembly; 2008 Available from: http://www.who.int/nmh/NCD%20Action%20Plan%20Resolution.pdf [accessed on 19.07.2015]
30. Wagner EH, Austin BT, Davis C, Hindmarsh M, Schaefer J, Bonomi A. Improving chronic illness care: translating evidence into action. Health Aff 2001;20(6):64–78.
31. The Chronic Care Model. Improving Chronic Illness Care. Available from: http://www.improvingchroniccare.org/index.php?p=The_Chronic_Care_Model&s=2 [accessed on 19.07.2015]
32. The Chronic Care Model - chronic care model gallery. Improving Chronic Illness Care. Available from: http://www.improvingchroniccare.org/index.php?p=CCM_Gallery&s=149 [accessed on 19.07.2015]
33. Barr V, Robinson S, Marin-Link B, Underhill L, Dotts A, Ravensdale D, et al. The expanded Chronic Care Model: an integration of concepts and strategies from population health promotion and the Chronic Care Model. Hosp Q 2003;7(1):73–82.
34. Declaration of Alma-Ata. International Conference on Primary Health Care. Alma-Ata; 1978. Available from: http://www.euro.who.int/__data/assets/pdf_file/0009/113877/E93944.pdf [accessed on 19.07.2015]
35. Cueto M. The origins of primary health care and selective primary health care. Am J Public Health 2004;94(11):1864–74.
36. World Health Organization. The World Health report 2008: Primary health care - now more than ever. Geneva: World Health Organization; 2008.
37. World Health Organization. Primary care: putting people first. The World Health Report 2008: Primary health care - Now more than ever. Geneva: World Health Organization; 2008.
38. Dans A, Ng N, Varghese C, Tai ES, Firestone R, Bonita R. The rise of chronic non-communicable diseases in southeast Asia: time for action. Lancet 2011;377:680–9.
39. Samb B, Desai N, Nishtar S, Mendis S, Bekedam H, Wright A, et al. Prevention and management of chronic disease: a litmus test for health-systems strengthening in low-income and middle-income countries. Lancet 2010;376:1785–97.
40. Beaglehole R, Epping-jordan J, Patel V, Chopra M, Ebrahim S, Kidd M, et al. Improving the prevention and management of chronic disease in low-income and middle-income countries: a priority for primary health care. Lancet 2008;372:940–9.
41. World Health Organization. Package of Essential Noncommunicable (PEN) disease interventions for primary health care in low-resource settings. Geneva: World Health Organization; 2010.
42. Starfield B, Shi L, Macinko J. Contribution of primary care to health systems and health. Milbank Q 2005;83(3):457–502.
43. Kruk ME, Porignon D, Rockers PC, Van Lerberghe W. The contribution of primary care to health and health systems in low- and middle-income countries: a critical review of major primary care initiatives. Soc Sci Med 2010;70:904–11.
44. Sanders D, Haines A. Implementation research is needed to achieve international health goals. PLoS Med 2006 Jun;3(6):e186. Available from: http://journals.plos.org/plosmedicine/article?id=10.1371/journal.pmed.0030186 [accessed on 19.07.2015]
45. Kar SS, Thakur JS. Integration of NCD programs in India : Concepts and health system perspective. Int J Med Public Heal 2013;3(4):215–8.
46. Shriraam V, Mahadevan S, Anitharani M, Sathiyasekaran B. National health programs in the field of endocrinology and metabolism – miles to go. Indian J Endocrinol Metab 2014;18(1):7–12.
47. Reddy K. Prevention and control of non-communicable diseases: status and strategies. Working Paper No. 104. New Delhi: Indian Council for Research on International Economic Relations; 2003 Available from: http://icrier.org/pdf/WP104.pdf [accessed on 19.07.2015]
48. Sogarwal R, Bachani D. Policies and priorities to combat NCD challenges in India. BMC Health Serv Res 2014;14(Suppl 2):P114. Available from: http://www.ncbi.nlm.nih.gov/pmc/articles/PMC4122958/pdf/1472-6963-14-S2-P114.pdf [accessed on 19.07.2015]
49. Bhatia V, Sahoo J, Subba SH. Epidemic of non communicable diseases: its burden and implications for India. Med Sci 2014;6(19):9–14.
50. Census of India. Primary census abstract data highlights - 2011 (India & States/UTs) Chapter-1 (Population, Size and Decadal Change). New Delhi; 2011 Available from http://www.censusindia.gov.in/2011census/PCA/PCA_Highlights/PCA_Data_highlight.html [accessed on 19.07.2015]
51. World Bank Group. Data: GNI per capita, PPP (current international $); 2015. Available from: http://data.worldbank.org/indicator/NY.GNP.PCAP.PP.CD [accessed on 19.07.2015]
52. World Bank Group. Data: Poverty headcount ratio at $1.25 a day (PPP) (% of population); 2015. Available from: http://data.worldbank.org/indicator/SI.POV.2DAY/countries [accessed on 19.07.2015]
53. World Bank Group. Data: Life expectancy at birth , total (years); 2015. Available from:http://data.worldbank.org/indicator/SP.DYN.LE00.IN [accessed on 19.07.2015]
54. World Bank Group. Data: Maternal Mortality Ratio (per 100,000 live births); 2015.Available from: http://data.worldbank.org/indicator/SP.DYN.IMRT.IN [accessed on19.07.2015]
55. World Bank Group. Data: Infant mortality rate (per 1000 live births) both sexes. 2015.Available from: http://data.worldbank.org/indicator/SP.DYN.IMRT.IN [accessed on19.07.2015]
56. Gragnolati M, Shekar M, Gupta MD, Bredenkamp C, Lee Y. India’s undernourishedchildren: a call for reform and action. Washington: The World Bank; 2005 Avaibalefrom:https://openknowledge.worldbank.org/bitstream/handle/10986/7241/368050REVISED0101OFFICIAL0USE0ONLY1.pdf?sequence=1 [accessed on 19.07.2015]
57. Ministry of Health and Family Welfare. National Health Policy 2015 Draft (placed inpublic domain for comments, suggestions, feedback); 2015 Available from:http://www.mohfw.nic.in/showfile.php?lid=3014 [accessed on 19.07.2015]
58. Rural Health Statistics 2015. Part 1 Rural health care system in India: Health ManagementInformation System. Ministry of Health and Family Welfare, Government of India; 2015.Available from:https://nrhmmis.nic.in/Pages/RHS2015.aspx?RootFolder=%2FRURAL%20HEALTH%20STATISTICS%2F%28A%29RHS%20%202015&FolderCTID=&View={C50BC181-07BB-4F78-BE6F-FCE916B64253} [accessed on 19.07.2015]
59. National Health Accounts Cell. National Health Accounts - India 2004-05. Health (SanFrancisco). New Delhi: Ministry of Health and Family Welfare, Government of India;2009. Available from:https://nrhmmis.nic.in/PubOther_Publications/National%20Health%20Accounts%202004-05.pdf [accessed on 19.07.2015]
60. Berman P, Ahuja R, Bhandari L. The impoverishing effect of healthcare payments inIndia: new methodology and findings. Econ Polit Wkly 2010;xlv(16):65–71.
61. Census of India. Primary census abstract for slum. Office of the Registrat General &Census Commissioner, India; 2013. Available from: http://www.censusindia.gov.in/2011-Documents/Slum-26-09-13.pdf [accessed on 19.07.2015]
62. Government of India. Report of the committee on slum statistics/census. New Delhi:Ministry of Housing and Urban Poverty Alleviation, Government of India; 2010Available from: http://www.mhupa.gov.in/W_new/Slum_Report_NBO.pdf [accessed on19.07.2015]
63. Agarwal S. The state of urban health in india; comparing the poorest quartile to the rest ofthe urban population in selected states and cities. Environ Urban 2011;23(1):13–28.

64. Planning Commission of India. Press note on poverty estimates, 2011-12. New Delhi: Press Information Bureau, Government of India; 2013 Available from: http://planningcommission.nic.in/news/pre_pov2307.pdf [accessed on 19.07.2015]
65. Gupta A, Ahuja R. Disease burden in urban India. In Forgia G La, Rao KD (editors) India Health Beat. Public Health Foundation of India & Health, Nutrition and Population Unit of the World Bank 2010;4(9). Available from: https://www.phfi.org/images/pdf/policy_notes_vol_4_no_9.pdf [accessed on 19.07.2015]
66. Mohan V, Mathur P, Deepa R, Deepa M, Joshi PP, Mahanta J, et al. Urban rural differences in prevalence of self-reported diabetes in India — The WHO – ICMR Indian NCD risk factor surveillance. Diabetes Res Clin Pract 2008;80:159–68.
67. Kar SS, Thakur JS, Virdi NK, Jain S, Kumar R. Risk factors for cardiovascular diseases: Is the social gradient reversing in nothern India? Natl Med J India 2010;23(4):206–9.
68. Pawar A, Bansal R, Bharodiya P, Panchal S, Patel H, Padariya P, et al. Prevalence of hypertension among elderly women in slums of Surat city. Natl J Community Med 2010;1(1):39–40.
69. Deepa M, Anjana RM, Manjula D, Narayan KV, Mohan V. Convergence of prevalence rates of diabetes and cardiometabolic risk factors in middle and low income groups in urban India: 10-year follow-up of the Chennai Urban Population Study. J Diabetes Sci Technol 2011;5(4):918–27.
70. Mohan V, Mathur P, Deepa R, Deepa M, Shukla DK, Menon GR, et al. Urban rural differences in prevalence of self-reported diabetes in India--the WHO-ICMR Indian NCD risk factor surveillance. Diabetes Res Clin Pract 2008;80(1):159–68.
71. Misra A, Pandey RM, Devi JR, Sharma R, Vikram NK, Khanna N. High prevalence of diabetes, obesity and dyslipidaemia in urban slum population in northern India. Int J Obes 2001;25:1722–9.
72. Brashier B, Londhe J, Madas S, Vincent V, Salvi S. Prevalence of self-reported respiratory symptoms, asthma and chronic bronchitis in slum area of a rapidly developing Indian city. Open J Respir Dis 2012;02:73–81.
73. Steering Committee on Urbanization. Report of the working group on urban poverty, slums, and service delivery system. New Delhi: Planning Commission; 2011 Available from: http://planningcommission.nic.in/aboutus/committee/wrkgrp12/hud/wg_Final_Urb_Pvt.pdf [accessed on 19.07.2015]
74. Yadav K, Nikhil S, Pandav CS. Urbanization and health challenges: Need to fast track launch of the National Urban Health Mission. Indian J community Med 2011;36(1):3–7.
75. Agarwal S, Sangar K. Need for dedicated focus on urban health within National Rural Health Mission. Indian J Public Health 2005;49(3):141–51.
76. Ergler CR, Sakdapolrak P, Bohle H-G, Kearns RA. Entitlements to health care: why is there a preference for private facilities among poorer residents of Chennai, India? Soc Sci Med 2011;72(3):327–37.
77. Ministry of Health and Family Welfare. National Urban Health Mission: Framework for implementation. Government of India; 2013 Available from: www.pbnrhm.org/docs/nuhm_framework_implementation.pdf [accessed on 19.07.2015]
78. Ministry of Health and Family Welfare. National Health Mission: Framework for implementation 2012-2017. New Delhi: Ministry of Health and Family Welfare, Government of India. Avalable from: http://nrhm.gov.in/images/pdf/NHM/NRH_Framework_for_Implementation__08-01-2014_.pdf [accessed on 19.07.2015]
79. Karnataka Slum Development Board. Slum details at glance. Available from: http://ksdb.kar.nic.in/slums.asp [accessed on 19.07.2015]
80. Bruhat Bengaluru Mahanagara Palika. Kadugondanahalli Ward (Ward No:30). Available from: http://www.vigeyegpms.in/bbmp/?module=public&action=wardinfo&wardid=52 [accessed on 19.07.2015]
81. Institute of Public Health. Socio-demography and basic facilities in KG Halli. Bangalore: Institute of Public Health; 2012
82. Department of AYUSH. About the systems - AYUSH, Department of Ayush, Ministry of Health & Family Welfare, Government of India; 2010. Available from: http://www.indianmedicine.nic.in/index1.asp?lang=1&linkid=17&lid=40 [accessed on 19.07.2015]
83. Glasgow RE, Vogt TM, Boles SM. Evaluating the Public Health Impact of Health Promotion Interventions : The RE-AIM Framework. Am J Public Health 1999;89(9):1322–7.

Part II ORIGINAL RESEARCH
This part of the thesis brings to light findings from the three sub-studies representing chronologically sequential and linked phases of doctoral research. The findings are subdivided into five chapters. Each chapter uses a manuscript published in peer-reviewed journal.

Chapter 1. Prevalence and health-seeking for chronic conditions
This chapter is based on the paper:
Bhojani U, Beerenahalli TS, Devadasan R, Munegowda CM, Devadasan N, Criel B, Kolsteren P. No longer diseases of the wealthy: prevalence and health-seeking for self-reported chronic conditions among urban poor in Southern India. BMC Health Service research 2013;13:306.
RESEARCH ARTICLE Open Access
No longer diseases of the wealthy: prevalenceand health-seeking for self-reported chronicconditions among urban poor in Southern IndiaUpendra Bhojani1,2,3*, Thriveni S Beerenahalli1, Roopa Devadasan1†, CM Munegowda1†, Narayanan Devadasan1†,Bart Criel2† and Patrick Kolsteren2†
Abstract
Background: The burden of chronic conditions is high in low- and middle-income countries and poses asignificant challenge to already weak healthcare delivery systems in these countries. Studies investigating chronicconditions among the urban poor remain few and focused on specific chronic conditions rather than providingoverall profile of chronic conditions in a given community, which is critical for planning and managing serviceswithin local health systems. We aimed to assess the prevalence and health- seeking behaviour for self-reportedchronic conditions in a poor neighbourhood of a metropolitan city in India.
Methods: We conducted a house-to-house survey covering 9299 households (44514 individuals) using a structuredquestionnaire. We relied on self-report by respondents to assess presence of any chronic conditions, includingdiabetes and hypertension. Multivariable logistic regression was used to analyse the prevalence and health-seekingbehaviour for self-reported chronic conditions in general as well as for diabetes and hypertension in particular. Thepredictor variables included age, sex, income, religion, household poverty status, presence of comorbid chronicconditions, and tiers in the local health care system.
Results: Overall, the prevalence of self-reported chronic conditions was 13.8% (95% CI = 13.4, 14.2) among adults,with hypertension (10%) and diabetes (6.4%) being the most commonly reported conditions. Older people andwomen were more likely to report chronic conditions. We found reversal of socioeconomic gradient with peopleliving below the poverty line at significantly greater odds of reporting chronic conditions than people living abovethe poverty line (OR = 3, 95% CI = 1.5, 5.8). Private healthcare providers managed over 80% of patients. A majorityof patients were managed at the clinic/health centre level (42.9%), followed by the referral hospital (38.9%) and thesuper-specialty hospital (18.2%) level. An increase in income was positively associated with the use of privatefacilities. However, elderly people, people below the poverty line, and those seeking care from hospitals were morelikely to use government services.
Conclusions: Our findings provide further evidence of the urgent need to improve care for chronic conditions forurban poor, with a preferential focus on improving service delivery in government health facilities.
Keywords: Chronic conditions, Slum, Healthcare seeking, Prevalence, Non-communicable diseases, Urban poor, India
* Correspondence: [email protected]†Equal contributors1Institute of Public Health, 250, 2 C Cross, 2 C Main, Girinagar, First Phase,Bangalore 560085, Karnataka, India2Department of Public Health, Institute of Tropical Medicine, Nationalestraat155, 2000 Antwerp, BelgiumFull list of author information is available at the end of the article
© 2013 Bhojani et al.; licensee BioMed Central Ltd. This is an Open Access article distributed under the terms of the CreativeCommons Attribution License (http://creativecommons.org/licenses/by/2.0), which permits unrestricted use, distribution, andreproduction in any medium, provided the original work is properly cited.
Bhojani et al. BMC Health Services Research 2013, 13:306http://www.biomedcentral.com/1472-6963/13/306
BackgroundThe rising burden of chronic conditions has drawn the at-tention of public health researchers and policy makersworldwide. Estimates indicate that chronic conditions willcause 41 million deaths in 2015 [1]. The chronic conditionburden is very high in low- and middle-income countries,where over 80% of deaths from chronic conditions havebeen estimated to occur [1]. In India, chronic conditionsare the leading cause of death. These conditions have beenestimated to have caused 53% of all deaths in India in2005 and are projected to account for 66.7% of all deathsby 2020 [2,3].In an era of worsening health inequities, it is import-
ant to highlight the issues faced by vulnerable communi-ties. Recent studies report a high burden from chronicconditions and chronic condition risk factors among theurban poor in low- and middle-income countries,including India [4-9]. The unfavourable social determi-nants in health and inequities in access to healthcareleave the urban poor in India with dismal health indica-tors [10]. With rapid urbanisation, the number of urbanpoor, including slum dwellers, is also on rise. Accordingto the most recent estimates available for the urbanIndian population, 26.3% of urban Indians live in slumsand 25.7% live below the poverty line [11,12]. However,studies investigating chronic conditions among theurban poor remain few in India, particularly for thesouthern part of the country.Furthermore, most of the studies in India report the
prevalence of specific chronic conditions. Very few stud-ies provide an overall prevalence and profile of chronicconditions in a given community [13,14]. Such informa-tion is critical for planning and managing services withinlocal health systems, particularly when desirable healthsystem characteristics for the effective prevention andmanagement of any chronic condition are known (e.g.,continuity of care, financial protection, active involve-ment of patients) [15,16].In this study, we aimed to assess the prevalence and
health-seeking behaviour for self-reported chronic condi-tions in general as well as for diabetes and hypertension inparticular, in a poor neighbourhood of a metropolitan cityin South India. We also examined the association of theseoutcomes with several predictor variables.
MethodsStudy settingThis study was conducted in Kadugondanahalli (KGHalli), one of the 198 administrative units of Bangalorecity, the metropolitan capital of the state of Karnataka.Municipal government records indicate that KG Hallihas a population of nearly 35000 people in an area of 0.7square kilometres. KG Halli has one recognised slumarea. The population in KG Halli is comprised of natives
as well as migrants from other Indian states. The popu-lation is comprised of people who speak five differentlanguages and represent all major religions in India.KG Halli has a mixed healthcare delivery system with
two government health centres and at least 32 privatehealth facilities. Private health facilities are composed ofsingle-doctor clinics and hospitals. Private providers workon fee-for-service basis and have been trained in differentsystems of medicines: Unani, Ayurveda and modern allo-pathic medicine [17]. This pluralistic nature of the healthcare delivery system is a characteristic feature of theIndian health system. Irrespective of the training received,the majority of KG Halli private providers either practicemodern medicine or a mix of systems. The provincial andmunicipal governments run two health centres in KGHalli that mainly provide outpatient care and outreachservices. The services provided by these two health centresare free for people living below the poverty line, withnominal user-fees for selected services for other patients.
Data collection and measurementsWe conducted a house-to-house survey in KG Halli be-tween June 2009 and March 2010 to establish a baselinefor the Urban Health Action Research Project (UHARP).This project is being implemented by the Institute ofPublic Health Bangalore. The UHARP aims to work withresidents of KG Halli, local health services (governmentand private) and health authorities to improve the qual-ity of healthcare for the residents of KG Halli.A structured questionnaire, initially developed in English
and later translated into the local language (Kannada), wasused to collect data on socio-demography, self-reportedillness profile, health-seeking behaviour, and healthcareexpenditures. The questionnaire was field-tested on 50households and subsequently refined. Five trained data col-lectors who were fluent in languages commonly spoken inthe area administered the questionnaire at the householdlevel. As most adults in the area would go out for work formost of the day, any family member aged 18 years or abovewas considered an eligible respondent.For the analysis of the prevalence of chronic conditions,
three binary outcome variables were defined. These werethe ‘absence’ (coded as ‘0’) or ‘presence’ (coded as ‘1’) ofthe following: i) any chronic condition, ii) diabetes, and iii)hypertension. A chronic condition is defined as an illnessor impairment that lasts for a long duration. The mini-mum time period for an illness to be considered chronicvaries depending on the source of the definition, rangingfrom three months to one year [18,19]. We considered achronic condition to be present when a respondentreported taking medications on a daily basis for at leastthe 30 days preceding the survey. Respondents oftenreported cases where their family members were pre-scribed regular medication by a healthcare provider but
Bhojani et al. BMC Health Services Research 2013, 13:306 Page 2 of 10http://www.biomedcentral.com/1472-6963/13/306
were unable to take the medication for various reasons.We recorded such instances as the presence of chronicconditions. The names of chronic conditions were initiallyrecorded using the lay terms reported by respondents andlater revised by researchers to categorise them, to the ex-tent possible, into specific conditions (e.g., diabetes wasoften referred to as ‘sugar’). Based on the names of thereported chronic conditions, the presence or absence ofdiabetes and hypertension were also recorded.Predictor variables were chosen based on earlier evi-
dence, theoretical knowledge, and the availability of thevariables in the KG Halli house-to-house survey. Earlierstudies have associated the prevalence of self-reportedchronic conditions with age, sex, income, education, andreligion [13,20,21]. As predictor variables, we includedsex (‘male’ or ‘female’), age (in years and transformedinto three age groups: ‘≤19’, ‘20-39’, ‘≥40’ year), per capitaincome per month (as income quintiles), religion (‘Islam’,‘Hinduism’, and ‘Christianity’), and the household povertystatus (‘above’ or ‘below’ the poverty line), as established bythe type of ration card possessed by the household. A rationcard is a document issued to households by governmentauthorities to enable access to essential commodities atsubsidised rates and has also become an important identitycard for the official poverty status of households in India.For the analysis of the health-seeking behaviour, three
binary outcome variables were defined. These were typeof health services sought (‘private’ coded as ‘0’, ‘govern-ment’ coded as ‘1’) for the following: i) a chronic condi-tion, ii) diabetes, and iii) hypertension. However, in India,patients often use government and private health facilitiessimultaneously, even for a single episode of a chronic con-dition. For this study, we coded the outcome variablebased on the nature of the health facility through whichthe patient “entered” the health system. In other words,we coded the variable based on the nature of the health fa-cility where the first consultation occurred. For example,when a person with a chronic condition approaches agovernment health centre for a first consultation, he/shemight be asked to buy medicines from a private pharmacyif the prescribed medicines are not available at that centre.In such a case, the health-seeking behaviour would becoded as ‘1’ (‘government health service’).All the predictor variables described earlier, in case of
prevalence estimation, were included with a revised cod-ing by individual age (‘<40’, ‘40-49’, ‘50-59’, and ‘>60’ years)that took into consideration the skewed age distributionamong individuals who reported chronic conditions. Inaddition, two more predictor variables were included: i.e.,the ‘presence’ or ‘absence’ of more than one chronic con-dition (comorbidity), and the tier of the healthcare ser-vices sought. Three tiers of healthcare services weredefined based on where the person with a chronic condi-tion was being managed at the time of the survey: i)
‘clinics/health centres’, ii) ‘referral hospitals’ with in-patientfacilities, and iii) ‘super-specialty hospitals’ attached tomedical schools. Though there are overlaps in theprovision of services across clinics/health centres, referralhospitals, and super-specialty hospitals, they roughly cor-respond to primary, secondary and tertiary healthcare ser-vices, respectively.
Ethics statementAt the time of this study, the Institute of Public Health,Bangalore did not have an Institutional Ethics Commit-tee, and a policy requiring a formal ethics approval fornon-clinical survey research. However, we followed eth-ical principles set for such research.Due to the low literacy level and perceived reserva-
tions about signing documents among the KG Halli resi-dents, an informed verbal consent was sought beforedata collection. Respondents received an explanationabout the purpose of the survey, the voluntary nature oftheir participation, the privacy of data, and the anonym-ity of respondents and family members in a languagethat they were comfortable with.
Data analysisThe data were entered using EpiData Entry software(The EpiData Association, Odense, Denmark). Data wereexternally validated through revisiting the householdsand confirming the responses for 20% of randomly se-lected completed questionnaires. The data were checkedfor errors and missing values before being analysedusing STATA 11.2 (StataCorp, Texas, USA).The prevalence of self-reported chronic conditions is
reported as a percentage with 95% confidence interval.To identify the predictors of self-reported chronic condi-tions, a multivariable logistic regression model was devel-oped using all aforementioned predictors. The interactionbetween predictor variables was checked and two-wayinteraction terms that were significant at p < 0.05 were in-cluded in a multivariable model. Similar to a backwardelimination technique, the predictors that were not signifi-cant at p < 0.05 were then dropped individually, and the re-sultant models were compared for goodness of fit (using alikelihood-ratio test) until no further improvement waspossible. A similar process was used to develop the finalmultivariable models for all other outcome variables. Wechecked for and excluded the presence of multi-colinearityusing post-estimation commands. The final models arepresented with the adjusted odds ratio (OR), 95% confi-dence interval, and p values.
ResultsWe received responses from 98.5% (9299) of households(44514 individuals). Non-response was either due torefusal to respond (0.3%) or the absence of household
Bhojani et al. BMC Health Services Research 2013, 13:306 Page 3 of 10http://www.biomedcentral.com/1472-6963/13/306
members (1.2%) on the follow-up visit by data collectors.The socio-demographic characteristics of the samplepopulation are presented in Table 1.The prevalence of various self-reported chronic con-
ditions in KG Halli is presented in Figure 1. The preva-lence of self-reported chronic conditions was 8.6%(95% CI = 8.4, 8.9) in the general population and 13.8%(95% CI = 13.4, 14.2) among adults (age ≥20 years). Thetwo most commonly reported conditions were hyper-tension and diabetes, with a self-reported prevalence of10.0% and 6.4%, respectively, among adults. Overall,4.5% (95% CI = 4.3, 4.8) of people reported having atleast two chronic conditions. The presence of an add-itional chronic condition was reported by 57.4% of peoplewith diabetes and 43% of people with hypertension.The results of the multivariable logistic regression for
chronic conditions are presented in Table 2. Womenwere 3.2 times more likely to report a chronic conditionthan men (p < 0.001). People in older age groups weremore likely to report chronic conditions than people19 years old or younger (p < 0.001). Increases in per capitaincome had an inverse graded relationship with the overallprevalence of self-reported chronic conditions. A similartrend was observed for diabetes, but the association wasnot statistically significant. In the case of self-reportedhypertension, the reduction in prevalence was significant
only for the two uppermost income quintiles (p < 0.05).While people living in households below the poverty linewere more likely to report the presence of a chroniccondition (including hypertension) compared with house-holds above the poverty line (p < 0.005), it was the oppos-ite pattern for diabetes reports (p < 0.001).Some two-way interactions between predictor variables
were significant (Table 2). A gender-stratified multivari-able analysis (detailed data not presented in this paper) re-vealed that religion was a significant predictor of chronicconditions overall and of hypertension among women.Muslim women were more likely to report chronic condi-tions compared with Hindu (OR = 0.6, p < 0.001) andChristian (OR = 0.7, p < 0.001) women. Although percapita income was not a significant predictor for self-reported diabetes prevalence among the population, percapita income did turn out to be a significant predictor formen, with poor men being at higher risk of reporting dia-betes (p < 0.05). Similarly, a multivariable analysis stratifiedby age groups revealed that the per capita income was asignificant positive predictor for self-reported diabetesprevalence but only for patients 40 years old and older(OR = 1.4, p = 0.001).The socio-demographic information and self-reported
health-seeking behaviour for people with chronic condi-tions is summarised in Table 3. Overall, 80.6% (95% CI =79.3, 81.8) of people with chronic conditions sought carefrom private healthcare providers, while 19.4% (95% CI =18.1, 20.7) sought care from government health services.A similar trend was found for diabetes and hypertension.The majority of people with a chronic condition receivedcare from clinics/health centres (42.9%, 95% CI = 41.5,44.5), followed by referral hospitals (38.9%, 95% CI = 37.3,40.4) and super-specialty hospitals (18.2%, 95% CI = 17.0,19.5). A similar trend was observed with hypertension,while in the case of diabetes, care was most commonlysought from referral hospitals, followed by clinics/healthcentres and super-specialty hospitals.People in older age groups were more likely to report
to seek care from government health services (Table 4).For diabetes, the likelihood of seeking care from govern-ment health services increased consistently throughoutthe age groups (p < 0.05). In the case of hypertension,this increase was statistically significant only for peopleaged 60 years or above. With an increase in per capitaincome, people were more likely to report seeking carefrom private providers, except for people seeking diabetescare. People were more likely to report seeking care fromgovernment services when they utilised referral hospitalsand super-specialty hospitals, compared with thoseutilising clinics/health centres. In general, people livingbelow the poverty line were more likely to report the util-isation of government health services. Such an associationbetween poverty and utilisation of government services
Table 1 Socio-demographic characteristics of the samplepopulationSex n(%)
Male 22702 (51.0)
Female 21801 (49.0)
Age groups n(%)
≤19 years 17335 (39.0)
20-39 years 17140 (38.5)
≥40 years 10013 (22.5)
Per capita income per month in INR Median (inter-quartile range)
First quintile 1200 (1000, 1285.7)
Second quintile 1625 (1500, 1750)
Third quintile 2000 (2000, 2250)
Fourth quintile 2875 (2531.3, 3200)
Fifth quintile 5000 (4000, 6142.9)
Religion n(%)
Islam 30481 (68.7)
Hinduism 9317 (21.0)
Christianity 4569 (10.3)
Household poverty status* n(%)
Above the poverty line 23442 (52.7)
Below the poverty line 4783 (10.7)
n = 44514 individuals. *Total does not add up to 100 because 36.6%individuals (their households) did not possess a ration card.
Bhojani et al. BMC Health Services Research 2013, 13:306 Page 4 of 10http://www.biomedcentral.com/1472-6963/13/306
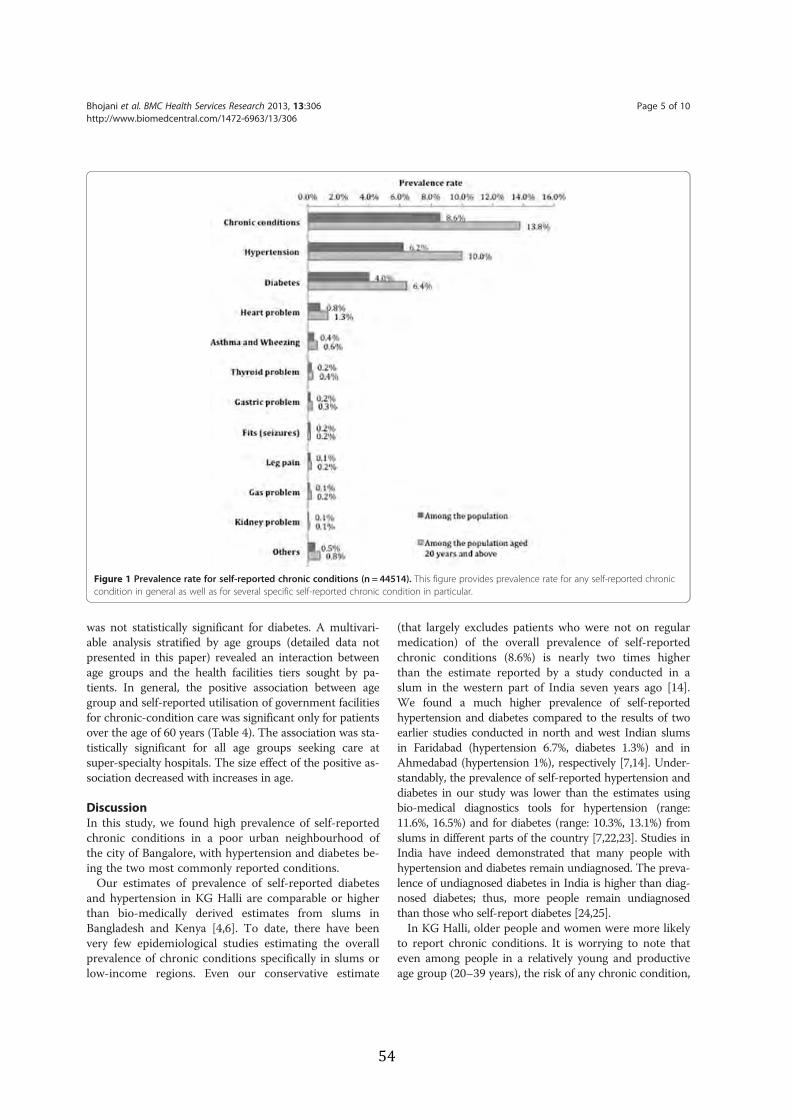
was not statistically significant for diabetes. A multivari-able analysis stratified by age groups (detailed data notpresented in this paper) revealed an interaction betweenage groups and the health facilities tiers sought by pa-tients. In general, the positive association between agegroup and self-reported utilisation of government facilitiesfor chronic-condition care was significant only for patientsover the age of 60 years (Table 4). The association was sta-tistically significant for all age groups seeking care atsuper-specialty hospitals. The size effect of the positive as-sociation decreased with increases in age.
DiscussionIn this study, we found high prevalence of self-reportedchronic conditions in a poor urban neighbourhood ofthe city of Bangalore, with hypertension and diabetes be-ing the two most commonly reported conditions.Our estimates of prevalence of self-reported diabetes
and hypertension in KG Halli are comparable or higherthan bio-medically derived estimates from slums inBangladesh and Kenya [4,6]. To date, there have beenvery few epidemiological studies estimating the overallprevalence of chronic conditions specifically in slums orlow-income regions. Even our conservative estimate
(that largely excludes patients who were not on regularmedication) of the overall prevalence of self-reportedchronic conditions (8.6%) is nearly two times higherthan the estimate reported by a study conducted in aslum in the western part of India seven years ago [14].We found a much higher prevalence of self-reportedhypertension and diabetes compared to the results of twoearlier studies conducted in north and west Indian slumsin Faridabad (hypertension 6.7%, diabetes 1.3%) and inAhmedabad (hypertension 1%), respectively [7,14]. Under-standably, the prevalence of self-reported hypertension anddiabetes in our study was lower than the estimates usingbio-medical diagnostics tools for hypertension (range:11.6%, 16.5%) and for diabetes (range: 10.3%, 13.1%) fromslums in different parts of the country [7,22,23]. Studies inIndia have indeed demonstrated that many people withhypertension and diabetes remain undiagnosed. The preva-lence of undiagnosed diabetes in India is higher than diag-nosed diabetes; thus, more people remain undiagnosedthan those who self-report diabetes [24,25].In KG Halli, older people and women were more likely
to report chronic conditions. It is worrying to note thateven among people in a relatively young and productiveage group (20–39 years), the risk of any chronic condition,
Figure 1 Prevalence rate for self-reported chronic conditions (n = 44514). This figure provides prevalence rate for any self-reported chroniccondition in general as well as for several specific self-reported chronic condition in particular.
Bhojani et al. BMC Health Services Research 2013, 13:306 Page 5 of 10http://www.biomedcentral.com/1472-6963/13/306
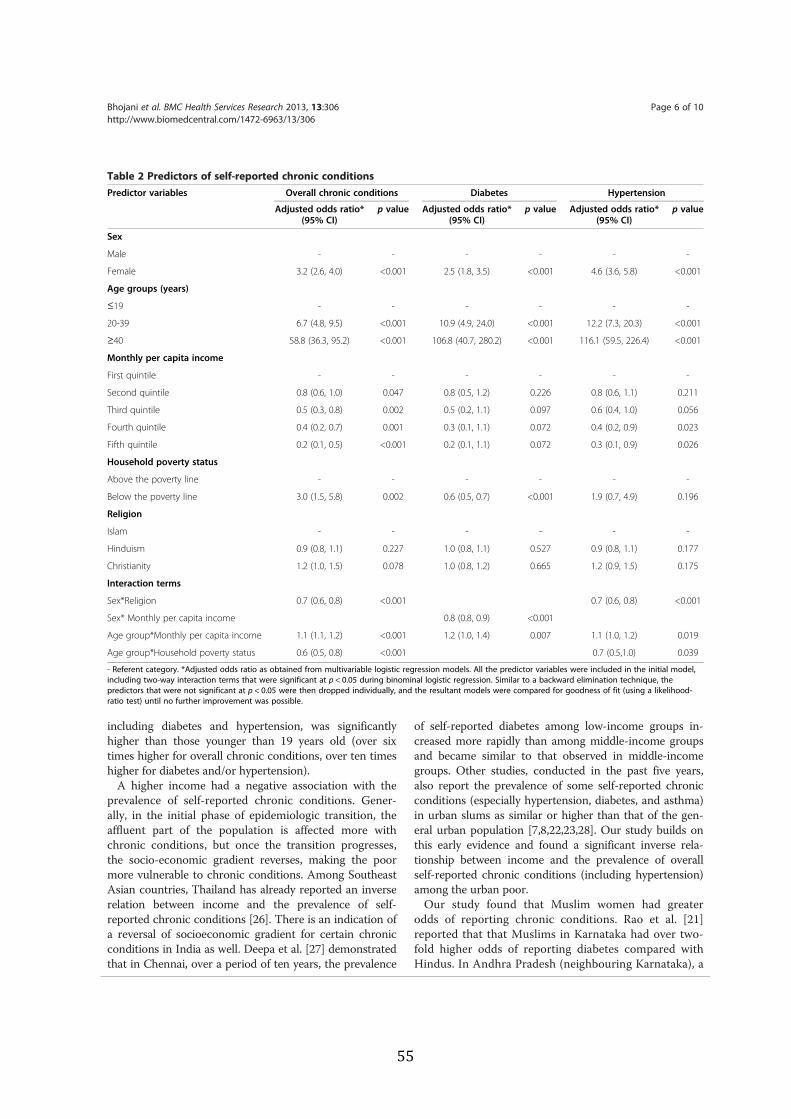
including diabetes and hypertension, was significantlyhigher than those younger than 19 years old (over sixtimes higher for overall chronic conditions, over ten timeshigher for diabetes and/or hypertension).A higher income had a negative association with the
prevalence of self-reported chronic conditions. Gener-ally, in the initial phase of epidemiologic transition, theaffluent part of the population is affected more withchronic conditions, but once the transition progresses,the socio-economic gradient reverses, making the poormore vulnerable to chronic conditions. Among SoutheastAsian countries, Thailand has already reported an inverserelation between income and the prevalence of self-reported chronic conditions [26]. There is an indication ofa reversal of socioeconomic gradient for certain chronicconditions in India as well. Deepa et al. [27] demonstratedthat in Chennai, over a period of ten years, the prevalence
of self-reported diabetes among low-income groups in-creased more rapidly than among middle-income groupsand became similar to that observed in middle-incomegroups. Other studies, conducted in the past five years,also report the prevalence of some self-reported chronicconditions (especially hypertension, diabetes, and asthma)in urban slums as similar or higher than that of the gen-eral urban population [7,8,22,23,28]. Our study builds onthis early evidence and found a significant inverse rela-tionship between income and the prevalence of overallself-reported chronic conditions (including hypertension)among the urban poor.Our study found that Muslim women had greater
odds of reporting chronic conditions. Rao et al. [21]reported that that Muslims in Karnataka had over two-fold higher odds of reporting diabetes compared withHindus. In Andhra Pradesh (neighbouring Karnataka), a
Table 2 Predictors of self-reported chronic conditionsPredictor variables Overall chronic conditions Diabetes Hypertension
Adjusted odds ratio*(95% CI)
p value Adjusted odds ratio*(95% CI)
p value Adjusted odds ratio*(95% CI)
p value
Sex
Male - - - - - -
Female 3.2 (2.6, 4.0) <0.001 2.5 (1.8, 3.5) <0.001 4.6 (3.6, 5.8) <0.001
Age groups (years)
≤19 - - - - - -
20-39 6.7 (4.8, 9.5) <0.001 10.9 (4.9, 24.0) <0.001 12.2 (7.3, 20.3) <0.001
≥40 58.8 (36.3, 95.2) <0.001 106.8 (40.7, 280.2) <0.001 116.1 (59.5, 226.4) <0.001
Monthly per capita income
First quintile - - - - - -
Second quintile 0.8 (0.6, 1.0) 0.047 0.8 (0.5, 1.2) 0.226 0.8 (0.6, 1.1) 0.211
Third quintile 0.5 (0.3, 0.8) 0.002 0.5 (0.2, 1.1) 0.097 0.6 (0.4, 1.0) 0.056
Fourth quintile 0.4 (0.2, 0.7) 0.001 0.3 (0.1, 1.1) 0.072 0.4 (0.2, 0.9) 0.023
Fifth quintile 0.2 (0.1, 0.5) <0.001 0.2 (0.1, 1.1) 0.072 0.3 (0.1, 0.9) 0.026
Household poverty status
Above the poverty line - - - - - -
Below the poverty line 3.0 (1.5, 5.8) 0.002 0.6 (0.5, 0.7) <0.001 1.9 (0.7, 4.9) 0.196
Religion
Islam - - - - - -
Hinduism 0.9 (0.8, 1.1) 0.227 1.0 (0.8, 1.1) 0.527 0.9 (0.8, 1.1) 0.177
Christianity 1.2 (1.0, 1.5) 0.078 1.0 (0.8, 1.2) 0.665 1.2 (0.9, 1.5) 0.175
Interaction terms
Sex*Religion 0.7 (0.6, 0.8) <0.001 0.7 (0.6, 0.8) <0.001
Sex* Monthly per capita income 0.8 (0.8, 0.9) <0.001
Age group*Monthly per capita income 1.1 (1.1, 1.2) <0.001 1.2 (1.0, 1.4) 0.007 1.1 (1.0, 1.2) 0.019
Age group*Household poverty status 0.6 (0.5, 0.8) <0.001 0.7 (0.5,1.0) 0.039
- Referent category. *Adjusted odds ratio as obtained from multivariable logistic regression models. All the predictor variables were included in the initial model,including two-way interaction terms that were significant at p < 0.05 during binominal logistic regression. Similar to a backward elimination technique, thepredictors that were not significant at p < 0.05 were then dropped individually, and the resultant models were compared for goodness of fit (using a likelihood-ratio test) until no further improvement was possible.
Bhojani et al. BMC Health Services Research 2013, 13:306 Page 6 of 10http://www.biomedcentral.com/1472-6963/13/306
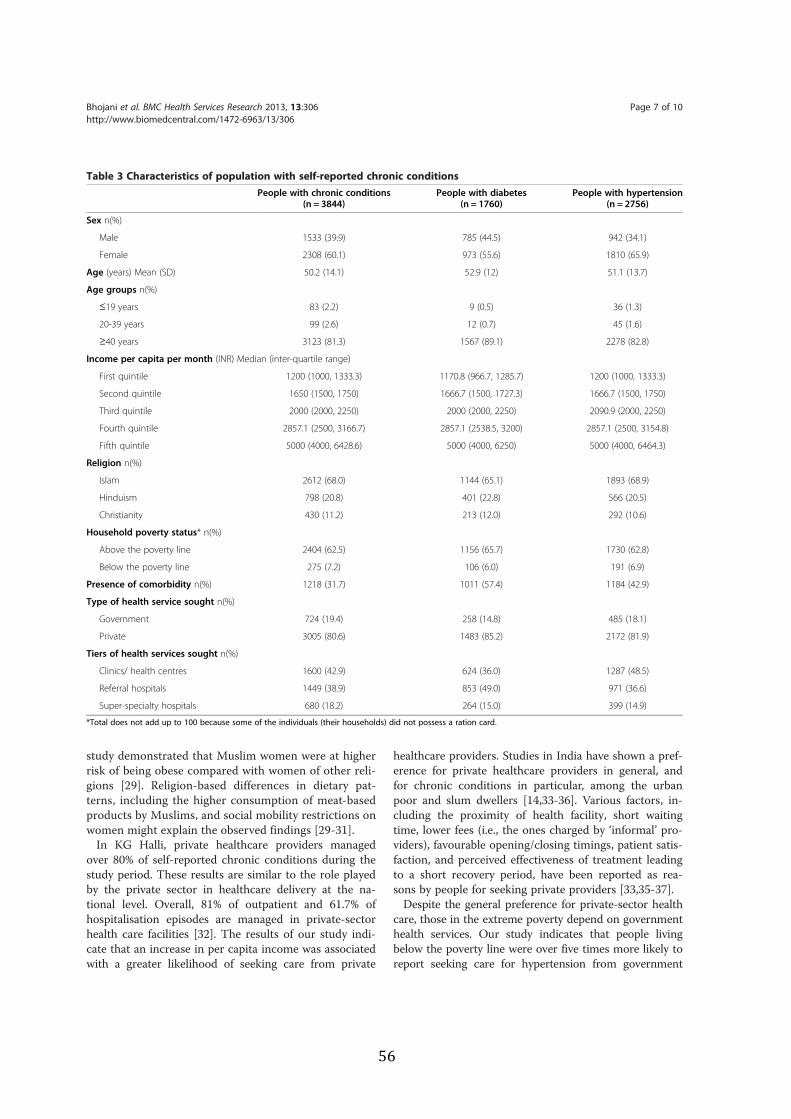
study demonstrated that Muslim women were at higherrisk of being obese compared with women of other reli-gions [29]. Religion-based differences in dietary pat-terns, including the higher consumption of meat-basedproducts by Muslims, and social mobility restrictions onwomen might explain the observed findings [29-31].In KG Halli, private healthcare providers managed
over 80% of self-reported chronic conditions during thestudy period. These results are similar to the role playedby the private sector in healthcare delivery at the na-tional level. Overall, 81% of outpatient and 61.7% ofhospitalisation episodes are managed in private-sectorhealth care facilities [32]. The results of our study indi-cate that an increase in per capita income was associatedwith a greater likelihood of seeking care from private
healthcare providers. Studies in India have shown a pref-erence for private healthcare providers in general, andfor chronic conditions in particular, among the urbanpoor and slum dwellers [14,33-36]. Various factors, in-cluding the proximity of health facility, short waitingtime, lower fees (i.e., the ones charged by ‘informal’ pro-viders), favourable opening/closing timings, patient satis-faction, and perceived effectiveness of treatment leadingto a short recovery period, have been reported as rea-sons by people for seeking private providers [33,35-37].Despite the general preference for private-sector health
care, those in the extreme poverty depend on governmenthealth services. Our study indicates that people livingbelow the poverty line were over five times more likely toreport seeking care for hypertension from government
Table 3 Characteristics of population with self-reported chronic conditionsPeople with chronic conditions
(n = 3844)People with diabetes
(n = 1760)People with hypertension
(n = 2756)
Sex n(%)
Male 1533 (39.9) 785 (44.5) 942 (34.1)
Female 2308 (60.1) 973 (55.6) 1810 (65.9)
Age (years) Mean (SD) 50.2 (14.1) 52.9 (12) 51.1 (13.7)
Age groups n(%)
≤19 years 83 (2.2) 9 (0.5) 36 (1.3)
20-39 years 99 (2.6) 12 (0.7) 45 (1.6)
≥40 years 3123 (81.3) 1567 (89.1) 2278 (82.8)
Income per capita per month (INR) Median (inter-quartile range)
First quintile 1200 (1000, 1333.3) 1170.8 (966.7, 1285.7) 1200 (1000, 1333.3)
Second quintile 1650 (1500, 1750) 1666.7 (1500, 1727.3) 1666.7 (1500, 1750)
Third quintile 2000 (2000, 2250) 2000 (2000, 2250) 2090.9 (2000, 2250)
Fourth quintile 2857.1 (2500, 3166.7) 2857.1 (2538.5, 3200) 2857.1 (2500, 3154.8)
Fifth quintile 5000 (4000, 6428.6) 5000 (4000, 6250) 5000 (4000, 6464.3)
Religion n(%)
Islam 2612 (68.0) 1144 (65.1) 1893 (68.9)
Hinduism 798 (20.8) 401 (22.8) 566 (20.5)
Christianity 430 (11.2) 213 (12.0) 292 (10.6)
Household poverty status* n(%)
Above the poverty line 2404 (62.5) 1156 (65.7) 1730 (62.8)
Below the poverty line 275 (7.2) 106 (6.0) 191 (6.9)
Presence of comorbidity n(%) 1218 (31.7) 1011 (57.4) 1184 (42.9)
Type of health service sought n(%)
Government 724 (19.4) 258 (14.8) 485 (18.1)
Private 3005 (80.6) 1483 (85.2) 2172 (81.9)
Tiers of health services sought n(%)
Clinics/ health centres 1600 (42.9) 624 (36.0) 1287 (48.5)
Referral hospitals 1449 (38.9) 853 (49.0) 971 (36.6)
Super-specialty hospitals 680 (18.2) 264 (15.0) 399 (14.9)
*Total does not add up to 100 because some of the individuals (their households) did not possess a ration card.
Bhojani et al. BMC Health Services Research 2013, 13:306 Page 7 of 10http://www.biomedcentral.com/1472-6963/13/306
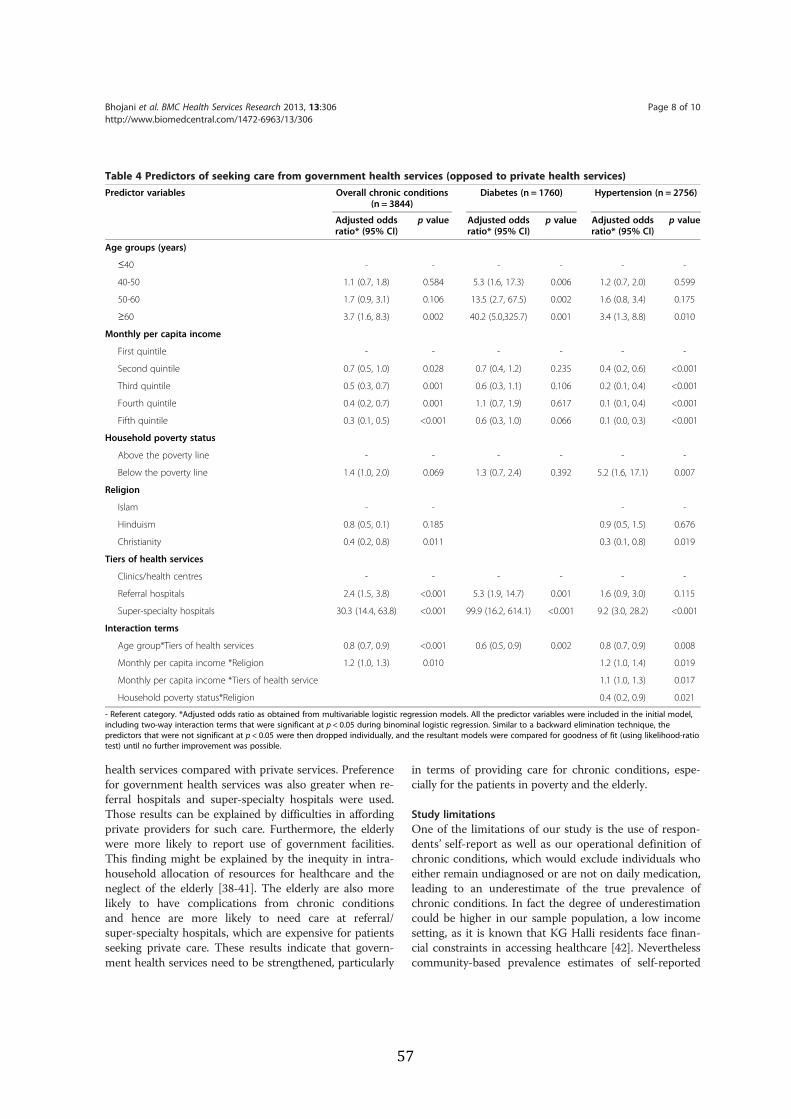
health services compared with private services. Preferencefor government health services was also greater when re-ferral hospitals and super-specialty hospitals were used.Those results can be explained by difficulties in affordingprivate providers for such care. Furthermore, the elderlywere more likely to report use of government facilities.This finding might be explained by the inequity in intra-household allocation of resources for healthcare and theneglect of the elderly [38-41]. The elderly are also morelikely to have complications from chronic conditionsand hence are more likely to need care at referral/super-specialty hospitals, which are expensive for patientsseeking private care. These results indicate that govern-ment health services need to be strengthened, particularly
in terms of providing care for chronic conditions, espe-cially for the patients in poverty and the elderly.
Study limitationsOne of the limitations of our study is the use of respon-dents’ self-report as well as our operational definition ofchronic conditions, which would exclude individuals whoeither remain undiagnosed or are not on daily medication,leading to an underestimate of the true prevalence ofchronic conditions. In fact the degree of underestimationcould be higher in our sample population, a low incomesetting, as it is known that KG Halli residents face finan-cial constraints in accessing healthcare [42]. Neverthelesscommunity-based prevalence estimates of self-reported
Table 4 Predictors of seeking care from government health services (opposed to private health services)Predictor variables Overall chronic conditions
(n = 3844)Diabetes (n = 1760) Hypertension (n = 2756)
Adjusted oddsratio* (95% CI)
p value Adjusted oddsratio* (95% CI)
p value Adjusted oddsratio* (95% CI)
p value
Age groups (years)
≤40 - - - - - -
40-50 1.1 (0.7, 1.8) 0.584 5.3 (1.6, 17.3) 0.006 1.2 (0.7, 2.0) 0.599
50-60 1.7 (0.9, 3.1) 0.106 13.5 (2.7, 67.5) 0.002 1.6 (0.8, 3.4) 0.175
≥60 3.7 (1.6, 8.3) 0.002 40.2 (5.0,325.7) 0.001 3.4 (1.3, 8.8) 0.010
Monthly per capita income
First quintile - - - - - -
Second quintile 0.7 (0.5, 1.0) 0.028 0.7 (0.4, 1.2) 0.235 0.4 (0.2, 0.6) <0.001
Third quintile 0.5 (0.3, 0.7) 0.001 0.6 (0.3, 1.1) 0.106 0.2 (0.1, 0.4) <0.001
Fourth quintile 0.4 (0.2, 0.7) 0.001 1.1 (0.7, 1.9) 0.617 0.1 (0.1, 0.4) <0.001
Fifth quintile 0.3 (0.1, 0.5) <0.001 0.6 (0.3, 1.0) 0.066 0.1 (0.0, 0.3) <0.001
Household poverty status
Above the poverty line - - - - - -
Below the poverty line 1.4 (1.0, 2.0) 0.069 1.3 (0.7, 2.4) 0.392 5.2 (1.6, 17.1) 0.007
Religion
Islam - - - -
Hinduism 0.8 (0.5, 0.1) 0.185 0.9 (0.5, 1.5) 0.676
Christianity 0.4 (0.2, 0.8) 0.011 0.3 (0.1, 0.8) 0.019
Tiers of health services
Clinics/health centres - - - - - -
Referral hospitals 2.4 (1.5, 3.8) <0.001 5.3 (1.9, 14.7) 0.001 1.6 (0.9, 3.0) 0.115
Super-specialty hospitals 30.3 (14.4, 63.8) <0.001 99.9 (16.2, 614.1) <0.001 9.2 (3.0, 28.2) <0.001
Interaction terms
Age group*Tiers of health services 0.8 (0.7, 0.9) <0.001 0.6 (0.5, 0.9) 0.002 0.8 (0.7, 0.9) 0.008
Monthly per capita income *Religion 1.2 (1.0, 1.3) 0.010 1.2 (1.0, 1.4) 0.019
Monthly per capita income *Tiers of health service 1.1 (1.0, 1.3) 0.017
Household poverty status*Religion 0.4 (0.2, 0.9) 0.021
- Referent category. *Adjusted odds ratio as obtained from multivariable logistic regression models. All the predictor variables were included in the initial model,including two-way interaction terms that were significant at p < 0.05 during binominal logistic regression. Similar to a backward elimination technique, thepredictors that were not significant at p < 0.05 were then dropped individually, and the resultant models were compared for goodness of fit (using likelihood-ratiotest) until no further improvement was possible.
Bhojani et al. BMC Health Services Research 2013, 13:306 Page 8 of 10http://www.biomedcentral.com/1472-6963/13/306
chronic conditions, including diabetes and hyperten-sion, are a crucial starting point in understanding theburden of these conditions. Such estimates are hardlyavailable for poor neighborhoods in India. In fact, inresource-constrained settings, self-reported morbidityhas been shown to be an important and valid measureof health [43].For this study, we used a simple measure of health-
seeking behaviour, i.e., the type of healthcare facility thatwas the initial location of healthcare consultation. How-ever, it is important to remember that this is merely theentry point in the healthcare system. In reality, people’shealth-seeking behaviour is complex and involves themixed use of different provider systems during the treat-ment of a single episode of illness. For example, a personwho uses a government health centre for medical con-sultation might (have to) use a private pharmacy or aprivate laboratory for respective services when seekingcare for his/her episode of chronic condition. Finally, al-though our study findings from KG Halli might not bestrictly and statistically generalised to all the other urbanpoor areas in the country, they indeed point towards apossible high burden of chronic conditions among urbanpoor in general and provide analytical guidance whilestudying such groups in India and in the region. Incontext of KG Halli, our findings would inform andshape the future strategies of the UHARP to improvethe healthcare for KG Halli residents.In general, our findings point to the need to improve
the management of chronic conditions, including preven-tion, as part of the offerings of health services in urbanpoor areas. Unfortunately, the National Urban HealthMission proposed to be implemented between 2008–2012by the federal government to revamp urban health sys-tems, and especially to improve access of urban poor tohealth care services, remains yet to be implemented [44].
ConclusionsWe report a high prevalence of self-reported chronicconditions in the poor urban neighbourhood of KG Halliin the city of Bangalore. Our study builds on earlier evi-dence of a reversal of socio-economic gradient for chronicconditions by revealing a graded inverse relationship be-tween per capita income and chronic conditions, with thepoor suffering a greater burden of chronic conditions. Ourresults indicated a preference for private providers by pa-tients seeking care for chronic conditions among theurban poor in KG Halli. This preference increases whenincome rises. However, those in the extreme levels of pov-erty and the elderly still rely on government facilities, indi-cating a profound schism in the Indian health system. Inaddition, government facilities are preferred for secondaryand tertiary care. Our findings provide further evidence ofthe urgent need to improve care for chronic conditions
among the urban poor, with a preferential focus on im-proving service delivery in government health facilities.
AbbreviationsKG Halli: Kadugondanahalli; OR: Odds ratio; UHARP: Urban health actionresearch project.
Competing interestsUB, BST, RD and CMM are involved in implementation of the Urban HealthAction Research Project. The authors declare that they have no competinginterests.
Authors’ contributionsND and RD conceptualised the overall study (house-to-house survey) anddesigned the questionnaire. UB, RD, TSB, and CMM supervised the datacollection and did data validation. UB and TSB, with inputs from PK,prepared the dataset for analysis. UB conceptualised the analytical approachused in this paper, analysed the data and wrote the draft manuscript. ND,PK, BC, RD and TSB reviewed and commented on the manuscript. UB revisedthe manuscript. All the authors read and approved the final manuscriptsubmitted to the journal.
AcknowledgementsWe are very thankful to Nagarathna, Revathi, Leelavathi, Sujatha, andAnthoniyamma for their help in data collection and validation. We alsowould like to acknowledge the help of Srinivasa, Balu, Manjunath, Saras, andAishwarya in the data entry process. We are thankful to Suhel Quader andUmesh Srinivasan for their help in data analysis. We would also like to thankCarl Lachat, NS Prashanth, and Roos Verstraeten for their useful commentson the manuscript.
Author details1Institute of Public Health, 250, 2 C Cross, 2 C Main, Girinagar, First Phase,Bangalore 560085, Karnataka, India. 2Department of Public Health, Institute ofTropical Medicine, Nationalestraat 155, 2000 Antwerp, Belgium. 3Departmentof Public Health, Ghent University, De Pintelaan 185, Block A, B- 9000 Ghent,Belgium.
Received: 30 November 2012 Accepted: 9 August 2013Published: 13 August 2013
References1. Strong K, Mathers C, Leeder S, Beaglehole R: Preventing chronic diseases:
how many lives can we save? Lancet 2005, 366(9496):1578–1582.2. Reddy KS, Shah B, Varghese C, Ramadoss A: Responding to the threat of
chronic diseases in India. Lancet 2005, 366(9498):1744–1749.3. Murray C, Lopez A: Global Health Statistics. Global Burden of Diseases and
Injury Series. Boston: Harvard School of Public Health; 1996.4. Oti S, Kyobutungi C: P2-232 cardiovascular disease conditions:
prevalence, awareness, treatment and control among the urban poor inNairobi [abstract]. J Epidemiol Community Health 2011, 65:A285.
5. Riley LW, Ko AI, Unger A, Reis MG: Slum health: diseases of neglectedpopulations. BMC Int Health Hum Rights 2007, 7:2.
6. Rahim M, Vaaler S, Keramat Ali S, Khan A, Hussain A, Nahar Q: Prevalence oftype 2 diabetes in urban slums of Dhaka, Bangladesh. Bangladesh MedRes Counc Bull 2004, 30(2):60–70.
7. Anand K, Shah B, Yadav K, Singh R, Mathur P, Paul E, Kapoor SK: Are theurban poor vulnerable to non-communicable diseases? A survey of riskfactors for non-communicable diseases in urban slums of Faridabad.Natl Med J India 2007, 20(3):115–120.
8. Brashier B, Londhe J, Madas S, Vincent V, Salvi S: Prevalence of self-reported respiratory symptoms, asthma and chronic bronchitis in slumarea of a rapidly developing Indian city. Open Journal of RespiratoryDiseases 2012, 2(3):73–81.
9. Mohan V, Mathur P, Deepa R, Deepa M, Shukla DK, Menon GR, Anand K,Desai NG, Joshi PP, Mahanta J, Thankappan KR, Shah B: Urban ruraldifferences in prevalence of self-reported diabetes in India–the WHO-ICMR Indian NCD risk factor surveillance. Diabetes Res Clin Pract 2008,80(1):159–168.
Bhojani et al. BMC Health Services Research 2013, 13:306 Page 9 of 10http://www.biomedcentral.com/1472-6963/13/306
10. Agarwal S: The state of urban health in India; comparing the poorestquartile to the rest of the urban population in selected states and cities.Environ Urban 2011, 23(1):13–28.
11. Government of India: Report of the committee on slum statistics/census. NewDelhi, India: Ministry of Housing and Urban Poverty Alleviation; 2010.Available from: www.mhupa.gov.in/W_new/Slum_Report_NBO.pdf(Accessed on 01/10/2012).
12. Government of India: Report of the expert group to review the methodologyfor estimation of poverty. New Delhi, India: Planning Commission of India;2009. Available from: www.planningcommission.nic.in/reports/genrep/rep_pov.pdf (Accessed on 01/10/2012).
13. Minh HV, Ng N, Juvekar S, Razzaque A, Ashraf A, Hadi A, Soonthornthada K,Bich TH, Kanungsukkasem U, Byass P: Self-reported prevalence of chronicdiseases and their relation to selected sociodemographic variableso: astudy in INDEPTH Asian sites, 2005. Prev Chronic Dis 2008, 5(3):5–9.
14. Puwar TI, Kumpavat B, Trivedi KN: Pattern of morbidity and health seekingbehavior in a slum area of Ahmedabad city in India. Internet J Health2009, 9(2).
15. Samb B, Desai N, Nishtar S, Mendis S, Bekedam H, Wright A, Hsu J, MartiniukA, Celletti F, Patel K, Adshead F, McKee M, Evans T, Alwan A, Etienne C:Prevention and management of chronic disease: a litmus test for health-systems strengthening in low-income and middle-income countries.Lancet 2010, 376:1785–1797.
16. World Health Organization: Innovative care for chronic conditions: buildingblocks for action. Geneva, Switzerland: World Health Organization; 2002.
17. Department of AYUSH: About The Systems – AYUSH. http://www.indianmedicine.nic.in/index1.asp?lang=1&linkid=17&lid=40(Accessed on 01/10/2012).
18. Johns Hopkins University, Robert Wood Johnson Foundation: ChronicConditions: Making the Case for Ongoing Care (September 2004 Update).Robert Wood Johnson Foundation; 2004. Available from: http://www.partnershipforsolutions.org/DMS/files/chronicbook2004.pdf (Accessed on01/10/2012).
19. National Center for Health Statistics, Jabin TB: Repoting chronic conditions inthe National Health Interview Survey - A review of tendencies from evaluationstudies and methodological test, Vital and Health Statistics Series 2, No. 105.DHHS Pub. No. (PHS) 87–1379. Public Health Service. Washington: U.S.Government Printing Office; 1987.
20. Agrawal S, Ebrahim S: Prevalence and risk factors for self-reporteddiabetes among adult men and women in India: findings from anational cross-sectional survey. Public Health Nutr 2011, 15(6):1065–1077.
21. Rao CR, Kamath VG, Shetty A, Kamath A: A study on the prevalence of type 2diabetes in coastal Karnataka. Int J Diabetes Dev Ctries 2010, 30(2):80–85.
22. Thankappan KR, Shah B, Mathur P, Sarma PS, Srinivas G, Mini GK, DavidanamM, Soman B, Vasan RS: Risk factor profile for chronic non- communicablediseases: results of a community-based study in Kerala, India. Indian JMed Res 2010, 131:53–63.
23. Misra A, Pandey RM, Devi JR, Sharma R, Vikram NK, Khanna N: Highprevalence of diabetes, obesity and dyslipidaemia in urban slumpopulation in northern India. Int J Obes 2001, 25:1722–1729.
24. Mohan V, Sandeep S, Deepa R, Shah B, Varghese C: Epidemiology of type 2diabetes: Indian scenario. Indian J Med Res 2007, 125(3):217–230.
25. Deepa M, Pradeepa R, Anjana R, Mohan V: Noncommunicable diseases riskfactor surveillance: experience and challenge from India. Indian JCommunity Med 2011, 36(Suppl 1):S50–S56.
26. Yiengprugsawan V, Lim LL, Carmichael GA, Sidorenko A, Sleigh AC:Measuring and decomposing inequity in self-reported morbidity andself- assessed health in Thailand. Int J Equity Health 2007, 6:23.
27. Deepa M, Anjana RM, Manjula D, Narayan KV, Mohan V: Convergence ofprevalence rates of diabetes and cardiometabolic risk factors in middleand low income groups in urban India: 10-year follow-up of the Chennaiurban population study. J Diabetes Sci Technol 2011, 5(4):918–927.
28. Kar SS, Thakur JS, Virdi NK, Jain S, Kumar R: Risk factors for cardiovasculardiseases: is the social gradient reversing in nothern India? Natl Med JIndia 2010, 23(4):206–209.
29. Griffiths PL, Bentley ME: The nutrition transition is underway in India.J Nutr 2001, 131(10):2692–2700.
30. Williams R, Bhopal R, Hunt K: Coronary risk in a British Punjabipopulation: comparative profile of non-biochemical factors. Int JEpidemiol 1994, 23(1):28–37.
31. Daniel CR, Prabhakaran D, Kapur K, Graubard BI, Devasenapathy N,Ramakrishnan L, George PS, Shetty H, Ferrucci LM, Yurgalevitch S, ChatterjeeN, Reddy KS, Rastogi T, Gupta PC, Mathew A, Sinha R: A cross- sectionalinvestigation of regional patterns of diet and cardio-metabolic risk inIndia. Nutrition journal 2011, 10(12):1–13.
32. National Sample Survey Organization: Morbidity, health care and thecondition of aged NSS 60th round (January-June 2004). New Delhi, India:National Sample Survey Organization; 2006.
33. Barua N, Pandav CS: The allure of the private practitioner: is this the onlyalternative for the urban poor in India? Indian J Public Health 2011,55(2):107–114.
34. Mili D: Migration and healthcareo: access to healthcare services bymigrants settled in Shivaji Nagar Slum of Mumbai, India. The Health 2011,2(3):82–85.
35. Yadav K, Nikhil S, Pandav CS: Urbanization and health challenges: need tofast track launch of the national urban health mission. Indian JCommunity Med 2011, 36(1):3–7.
36. Banerjee A, Jadhav S, Khedkar D, Bhawalkar J, Rathod H: Access to healthservices among slum dwellers in an industrial township and surroundingrural areas: a rapid epidemiological assessment. J Fam Med Primary Care2012, 1(1):20–26.
37. Ergler CR, Sakdapolrak P, Bohle H-G, Kearns RA: Entitlements to health care:why is there a preference for private facilities among poorer residents ofChennai, India? Soc Sci Med 2011, 72:327–337.
38. Kochar A: Evaluating familial support for the elderly: the intrahouseholdallocation of medical expenditures in rural Pakistan. Econ Dev CultChange 1999, 47(3):620–656.
39. Lena A, Ashok K, Padma M, Kamath V, Kamath A: Health and socialproblems of the elderly: a cross-sectional study in Udupi taluk,karnataka. Indian J Community Med 2009, 34(2):131–134.
40. Chokkanathan S, Lee AEY: Elder mistreatment in urban India: acommunity based study. J Elder abuse Negl 2005, 17(2):45–61.
41. Sundar R, Sharma A: Morbidity and utilisation of healthcare services: asurvey of urban poor in Delhi and Chennai. Econ Pol Wkly 2002,37(47):4729–4740.
42. Bhojani U, Thriveni BS, Devadasan R, Munegowda CM, Devadasan N,Kolsteren P, et al: Out-of-pocket healthcare payments on chronicconditions impoverish urban poor in Bangalore, India. BMC Publ Health2012, 12:990.
43. Subramanian SV, Subramanyam MA, Selvaraj S, Kawachi I: Are self-reportsof health and morbidities in developing countries misleading? Evidencefrom India. Soc Sci Med 2009, 68(2):260–265.
44. Ministry of Health and Family Welfare: National Urban Health Misison (2008–2012): Meeting the health challenges of urban population especially the uebanpoor (with special focus on urban slums) - Draft for discussion. New Delhi, India:Ministry of Health and Family Welfare; 2008. Available from: www.uhrc.in/downloads/Reports/NUHM-Draft.pdf (Accessed on 01/10/2012).
doi:10.1186/1472-6963-13-306Cite this article as: Bhojani et al.: No longer diseases of the wealthy:prevalence and health-seeking for self-reported chronic conditionsamong urban poor in Southern India. BMC Health Services Research2013 13:306.
Submit your next manuscript to BioMed Centraland take full advantage of:
• Convenient online submission
• Thorough peer review
• No space constraints or color figure charges
• Immediate publication on acceptance
• Inclusion in PubMed, CAS, Scopus and Google Scholar
• Research which is freely available for redistribution
Submit your manuscript at www.biomedcentral.com/submit
Bhojani et al. BMC Health Services Research 2013, 13:306 Page 10 of 10http://www.biomedcentral.com/1472-6963/13/306
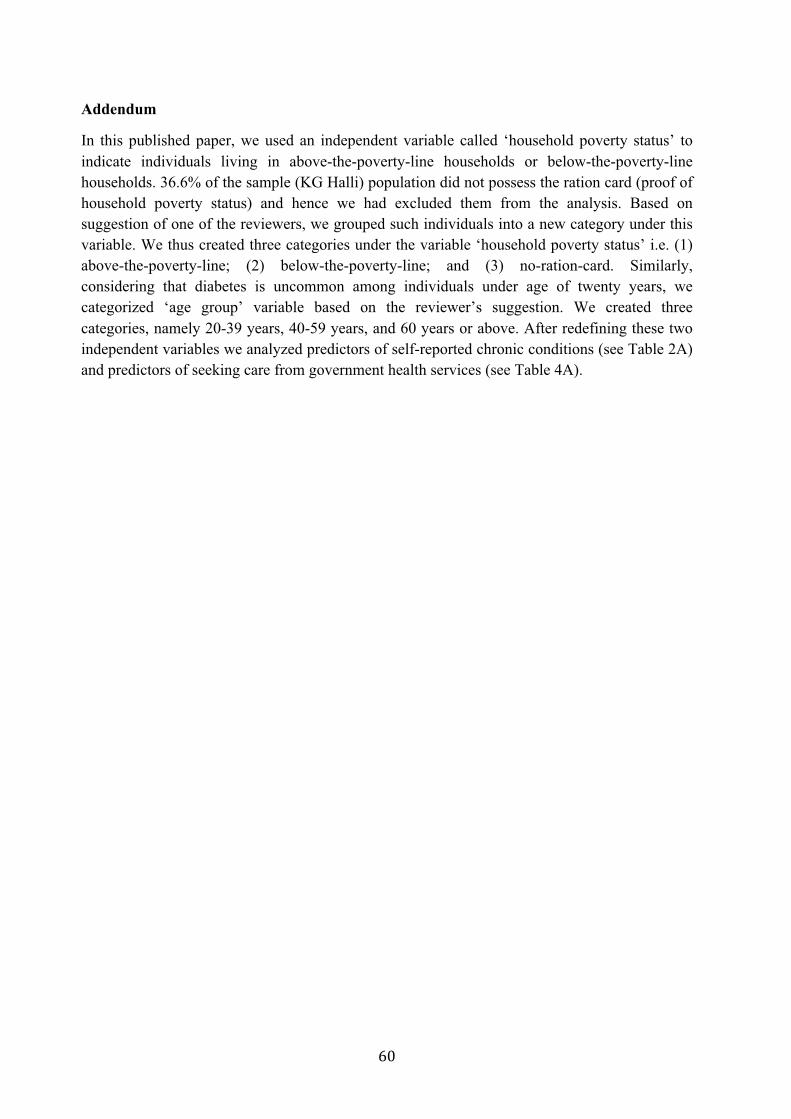
Addendum
In this published paper, we used an independent variable called ‘household poverty status’ to indicate individuals living in above-the-poverty-line households or below-the-poverty-line households. 36.6% of the sample (KG Halli) population did not possess the ration card (proof of household poverty status) and hence we had excluded them from the analysis. Based on suggestion of one of the reviewers, we grouped such individuals into a new category under this variable. We thus created three categories under the variable ‘household poverty status’ i.e. (1) above-the-poverty-line; (2) below-the-poverty-line; and (3) no-ration-card. Similarly, considering that diabetes is uncommon among individuals under age of twenty years, we categorized ‘age group’ variable based on the reviewer’s suggestion. We created three categories, namely 20-39 years, 40-59 years, and 60 years or above. After redefining these two independent variables we analyzed predictors of self-reported chronic conditions (see Table 2A) and predictors of seeking care from government health services (see Table 4A).
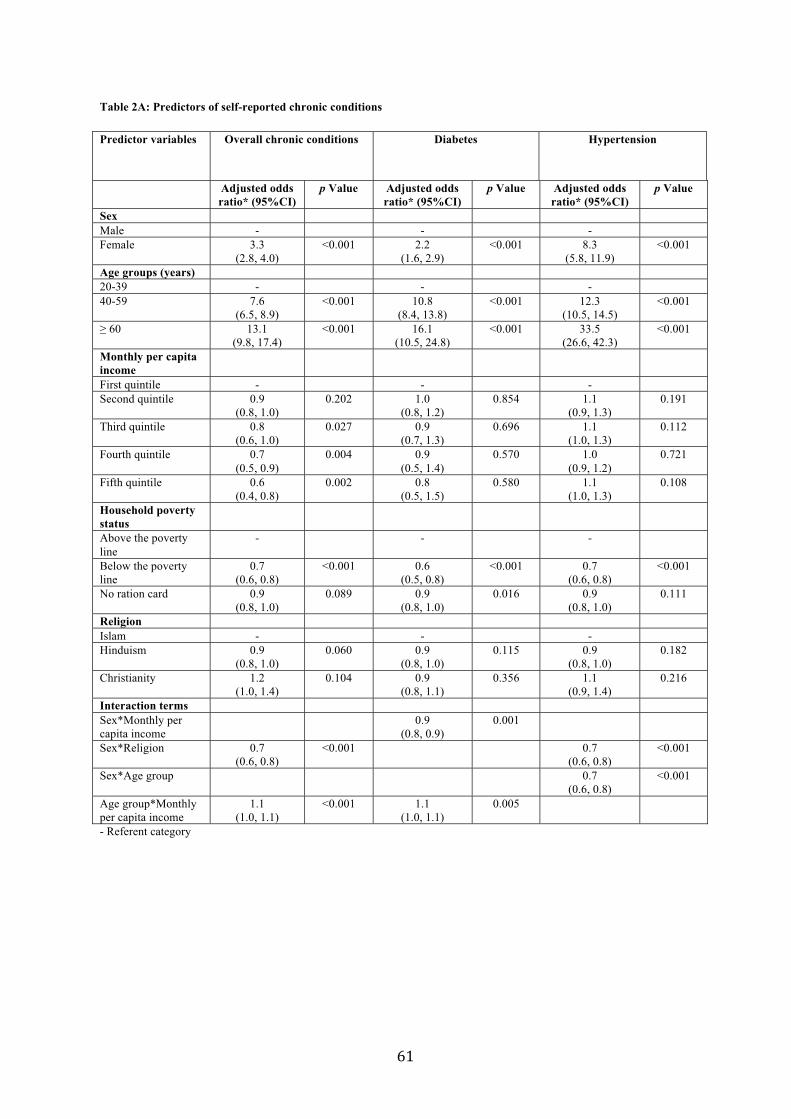
Table 2A: Predictors of self-reported chronic conditions Predictor variables Overall chronic conditions Diabetes Hypertension
Adjusted odds ratio* (95%CI)
p Value Adjusted odds ratio* (95%CI)
p Value Adjusted odds ratio* (95%CI)
p Value
Sex Male - - - Female 3.3
(2.8, 4.0) <0.001 2.2
(1.6, 2.9) <0.001 8.3
(5.8, 11.9) <0.001
Age groups (years) 20-39 - - - 40-59 7.6
(6.5, 8.9) <0.001 10.8
(8.4, 13.8) <0.001 12.3
(10.5, 14.5) <0.001
60 13.1 (9.8, 17.4)
<0.001 16.1 (10.5, 24.8)
<0.001 33.5 (26.6, 42.3)
<0.001
Monthly per capita income
First quintile - - - Second quintile 0.9
(0.8, 1.0) 0.202 1.0
(0.8, 1.2) 0.854 1.1
(0.9, 1.3) 0.191
Third quintile 0.8 (0.6, 1.0)
0.027 0.9 (0.7, 1.3)
0.696 1.1 (1.0, 1.3)
0.112
Fourth quintile 0.7 (0.5, 0.9)
0.004 0.9 (0.5, 1.4)
0.570 1.0 (0.9, 1.2)
0.721
Fifth quintile 0.6 (0.4, 0.8)
0.002 0.8 (0.5, 1.5)
0.580 1.1 (1.0, 1.3)
0.108
Household poverty status
Above the poverty line
- - -
Below the poverty line
0.7 (0.6, 0.8)
<0.001 0.6 (0.5, 0.8)
<0.001 0.7 (0.6, 0.8)
<0.001
No ration card 0.9 (0.8, 1.0)
0.089 0.9 (0.8, 1.0)
0.016 0.9 (0.8, 1.0)
0.111
Religion Islam - - - Hinduism 0.9
(0.8, 1.0) 0.060 0.9
(0.8, 1.0) 0.115 0.9
(0.8, 1.0) 0.182
Christianity 1.2 (1.0, 1.4)
0.104 0.9 (0.8, 1.1)
0.356 1.1 (0.9, 1.4)
0.216
Interaction terms Sex*Monthly per capita income
0.9 (0.8, 0.9)
0.001
Sex*Religion 0.7 (0.6, 0.8)
<0.001 0.7 (0.6, 0.8)
<0.001
Sex*Age group 0.7 (0.6, 0.8)
<0.001
Age group*Monthly per capita income
1.1 (1.0, 1.1)
<0.001 1.1 (1.0, 1.1)
0.005
- Referent category
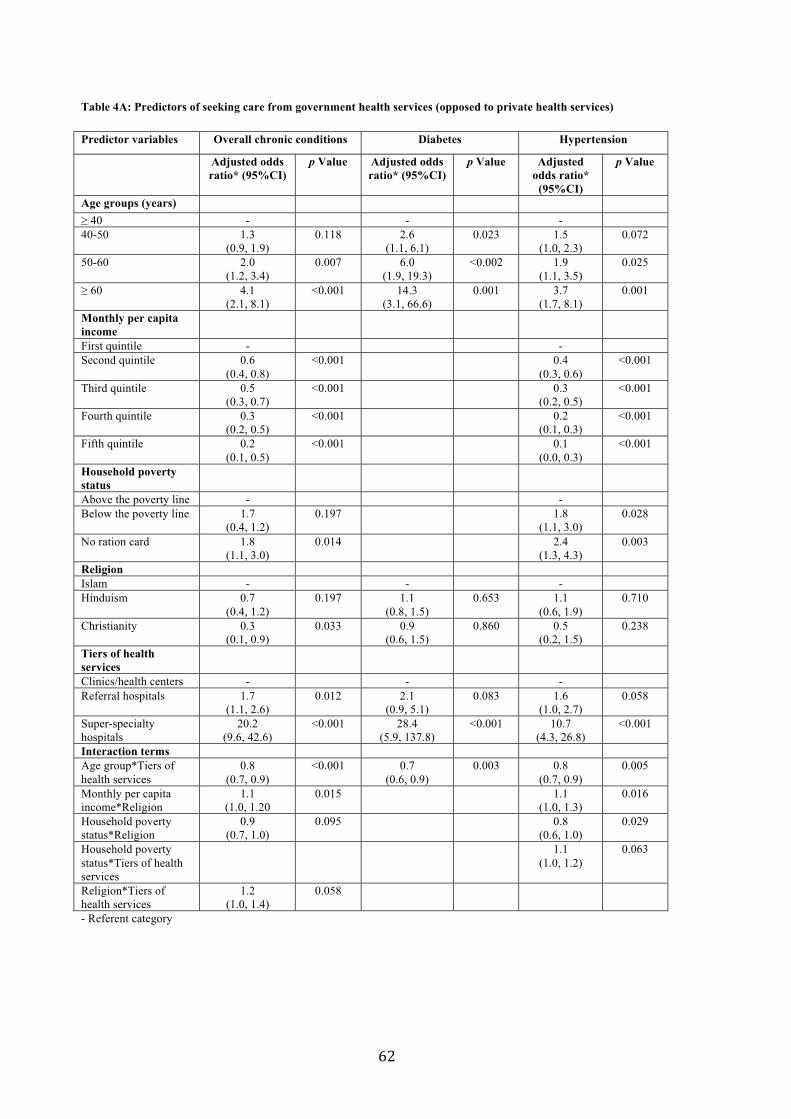
Table 4A: Predictors of seeking care from government health services (opposed to private health services)
Predictor variables Overall chronic conditions Diabetes Hypertension
Adjusted odds ratio* (95%CI)
p Value Adjusted odds ratio* (95%CI)
p Value Adjusted odds ratio*
(95%CI)
p Value
Age groups (years) 40 - - -
40-50 1.3 (0.9, 1.9)
0.118 2.6(1.1, 6.1)
0.023 1.5(1.0, 2.3)
0.072
50-60 2.0 (1.2, 3.4)
0.007 6.0(1.9, 19.3)
<0.002 1.9(1.1, 3.5)
0.025
60 4.1 (2.1, 8.1)
<0.001 14.3(3.1, 66.6)
0.001 3.7(1.7, 8.1)
0.001
Monthly per capita income First quintile - - Second quintile 0.6
(0.4, 0.8) <0.001 0.4
(0.3, 0.6) <0.001
Third quintile 0.5 (0.3, 0.7)
<0.001 0.3 (0.2, 0.5)
<0.001
Fourth quintile 0.3 (0.2, 0.5)
<0.001 0.2 (0.1, 0.3)
<0.001
Fifth quintile 0.2 (0.1, 0.5)
<0.001 0.1 (0.0, 0.3)
<0.001
Household poverty status Above the poverty line - - Below the poverty line 1.7
(0.4, 1.2) 0.197 1.8
(1.1, 3.0) 0.028
No ration card 1.8 (1.1, 3.0)
0.014 2.4 (1.3, 4.3)
0.003
Religion Islam - - -Hinduism 0.7
(0.4, 1.2) 0.197 1.1
(0.8, 1.5) 0.653 1.1
(0.6, 1.9) 0.710
Christianity 0.3 (0.1, 0.9)
0.033 0.9(0.6, 1.5)
0.860 0.5(0.2, 1.5)
0.238
Tiers of health services Clinics/health centers - - - Referral hospitals 1.7
(1.1, 2.6) 0.012 2.1
(0.9, 5.1) 0.083 1.6
(1.0, 2.7) 0.058
Super-specialty hospitals
20.2 (9.6, 42.6)
<0.001 28.4(5.9, 137.8)
<0.001 10.7(4.3, 26.8)
<0.001
Interaction terms Age group*Tiers of health services
0.8 (0.7, 0.9)
<0.001 0.7(0.6, 0.9)
0.003 0.8(0.7, 0.9)
0.005
Monthly per capita income*Religion
1.1 (1.0, 1.20
0.015 1.1 (1.0, 1.3)
0.016
Household poverty status*Religion
0.9 (0.7, 1.0)
0.095 0.8 (0.6, 1.0)
0.029
Household poverty status*Tiers of health services
1.1 (1.0, 1.2)
0.063
Religion*Tiers of health services
1.2 (1.0, 1.4)
0.058
- Referent category
We conducted a census covering all the households in KG Halli and all the individuals within those households. We used OLS regression to analyze predictors of prevalence of self-reported chronic conditions without consideration for design defects. However, as pointed by one of the reviewers, the sampling could be seen as one-stage cluster sample where households are primary sampling units and individuals within households are elementary sampling units. We analyzed data further to account for clustering at household level. We did this using two separate techniques: (1) using survey commands in STATA (11.2) where dataset is defined as one-stage clustered sample; and (2) using multilevel mixed-effect modeling. Table 2B, Table 2C and Table 2D provide side-by-side presentation of regression results from OLS regression, survey commands in STATA (11.2) and multilevel modeling in STATA (11.2) with regard to predictors of self-reported chronic conditions, diabetes and hypertension respectively. There are minor variations in estimates (more so for standard errors, p values) after adjusting for clustering. The overall results remain similar and effects are in the same directions.
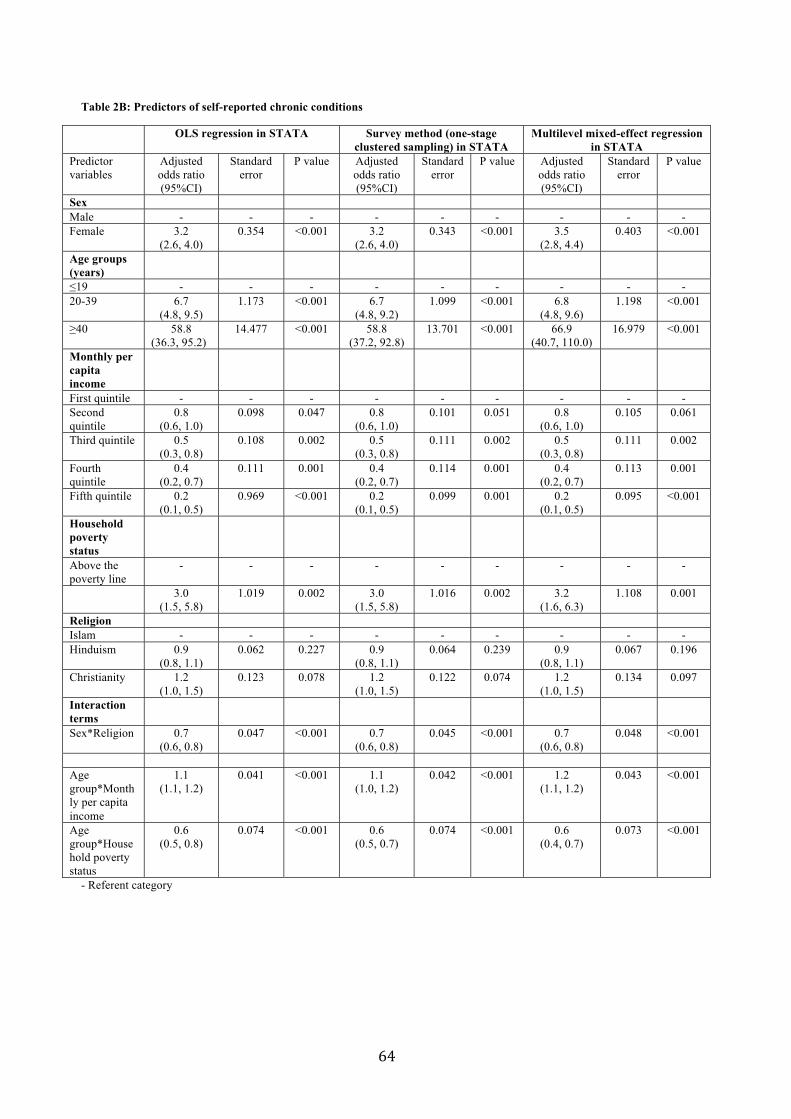
Table 2B: Predictors of self-reported chronic conditions
OLS regression in STATA Survey method (one-stage clustered sampling) in STATA
Multilevel mixed-effect regression in STATA
Predictor variables
Adjusted odds ratio (95%CI)
Standard error
P value Adjusted odds ratio (95%CI)
Standard error
P value Adjusted odds ratio (95%CI)
Standard error
P value
Sex Male - - - - - - - - - Female 3.2
(2.6, 4.0) 0.354 <0.001 3.2
(2.6, 4.0) 0.343 <0.001 3.5
(2.8, 4.4) 0.403 <0.001
Age groups (years)
19 - - - - - - - - - 20-39 6.7
(4.8, 9.5) 1.173 <0.001 6.7
(4.8, 9.2) 1.099 <0.001 6.8
(4.8, 9.6) 1.198 <0.001
40 58.8 (36.3, 95.2)
14.477 <0.001 58.8 (37.2, 92.8)
13.701 <0.001 66.9 (40.7, 110.0)
16.979 <0.001
Monthly per capita income
First quintile - - - - - - - - - Second quintile
0.8 (0.6, 1.0)
0.098 0.047 0.8 (0.6, 1.0)
0.101 0.051 0.8 (0.6, 1.0)
0.105 0.061
Third quintile 0.5 (0.3, 0.8)
0.108 0.002 0.5 (0.3, 0.8)
0.111 0.002 0.5 (0.3, 0.8)
0.111 0.002
Fourth quintile
0.4 (0.2, 0.7)
0.111 0.001 0.4 (0.2, 0.7)
0.114 0.001 0.4 (0.2, 0.7)
0.113 0.001
Fifth quintile 0.2 (0.1, 0.5)
0.969 <0.001 0.2 (0.1, 0.5)
0.099 0.001 0.2 (0.1, 0.5)
0.095 <0.001
Household poverty status
Above the poverty line
- - - - - - - - -
3.0 (1.5, 5.8)
1.019 0.002 3.0 (1.5, 5.8)
1.016 0.002 3.2 (1.6, 6.3)
1.108 0.001
Religion Islam - - - - - - - - - Hinduism 0.9
(0.8, 1.1) 0.062 0.227 0.9
(0.8, 1.1) 0.064 0.239 0.9
(0.8, 1.1) 0.067 0.196
Christianity 1.2 (1.0, 1.5)
0.123 0.078 1.2 (1.0, 1.5)
0.122 0.074 1.2 (1.0, 1.5)
0.134 0.097
Interaction terms
Sex*Religion 0.7 (0.6, 0.8)
0.047 <0.001 0.7 (0.6, 0.8)
0.045 <0.001 0.7 (0.6, 0.8)
0.048 <0.001
Age group*Monthly per capita income
1.1 (1.1, 1.2)
0.041 <0.001 1.1 (1.0, 1.2)
0.042 <0.001 1.2 (1.1, 1.2)
0.043 <0.001
Age group*Household poverty status
0.6 (0.5, 0.8)
0.074 <0.001 0.6 (0.5, 0.7)
0.074 <0.001 0.6 (0.4, 0.7)
0.073 <0.001
- Referent category

Table 2C: Predictors of self-reported diabetes
OLS regression in STATA Survey method (one-stage clustered sampling) in STATA
Multilevel mixed-effect regression in STATA
Predictor variables
Adjusted odds ratio (95%CI)
Standard error
P value Adjusted odds ratio (95%CI)
Standard error
P value Adjusted odds ratio (95%CI)
Standard error
P value
Sex Male - - - - - - - - -
Female 2.5 (1.8, 3.5)
0.432 <0.001 2.5 (1.8, 3.5)
0.435 <0.001 2.6 (1.8, 3.8)
0.486 <0.001
Age groups (years)
19 - - - - - - - - - 20-39 10.9
(4.9, 24.0) 4.389 <0.001 10.9
(4.9, 23.9) 4.359 <0.001 10.6
(4.8, 23.5) 4.312 <0.001
40 106.8 (40.7, 280.2)
52.565 <0.001 106.8 (40.6, 281.3)
52.753 <0.001 116.9 (44.1, 309.9)
58.160 <0.001
Monthly per capita income
First quintile - - - - - - - - - Second quintile
0.8 (0.5, 1.2)
0.171 0.226 0.8 (0.5, 1.2)
0.173 0.232 0.8 (0.5, 1.2)
0.178 0.243
Third quintile 0.5 (0.2, 1.1)
0.205 0.097 0.5 (0.2, 1.1)
0.206 0.098 0.5 (0.2, 1.1)
0.207 0.097
Fourth quintile
0.3 (0.1, 1.1)
0.204 0.072 0.3 (0.1, 1.1)
0.205 0.074 0.3 (0.1, 1.1)
0.203 0.072
Fifth quintile 0.2 (0.1, 1.1)
0.191 0.072 0.2 (0.1, 1.1)
0.191 0.072 0.2 (0.1, 1.1)
0.187 0.069
Household poverty status
Above the poverty line
- - - - - - - - -
Below the poverty line
0.6 (0.5, 0.7)
0.066 <0.001 0.6 (0.5, 0.7)
0.069 <0.001 0.6 (0.4, 0.7)
0.070 <0.001
Religion Islam - - - - - - - - -
Hinduism 1.0 (0.8, 1.1)
0.070
0.527 1.0 (0.8, 1.1)
0.074 0.545 1.0 (0.4, 0.7)
0.080 0.550
Christianity 1.0 (0.8, 1.2)
0.093 0.665 1.0 (0.8, 1.2)
0.098 0.0682 1.0 (0.8, 1.2)
0.105 0.686
Interaction terms
Sex*Religion - - - - - - - - - Sex*Monthly
per capita income
0.8 (0.8, 0.9)
0.039 <0.001 0.8 (0.8, 0.9)
0.038 <0.001 0.8 (0.8, 0.9)
0.040 <0.001
Age group*Monthly per capita
income
1.2 (1.0, 1.4)
0.078 0.007 1.2 (1.1, 1.4)
0.078 <0.001 1.2 (1.1, 1.4)
0.080 0.006
- Referent category
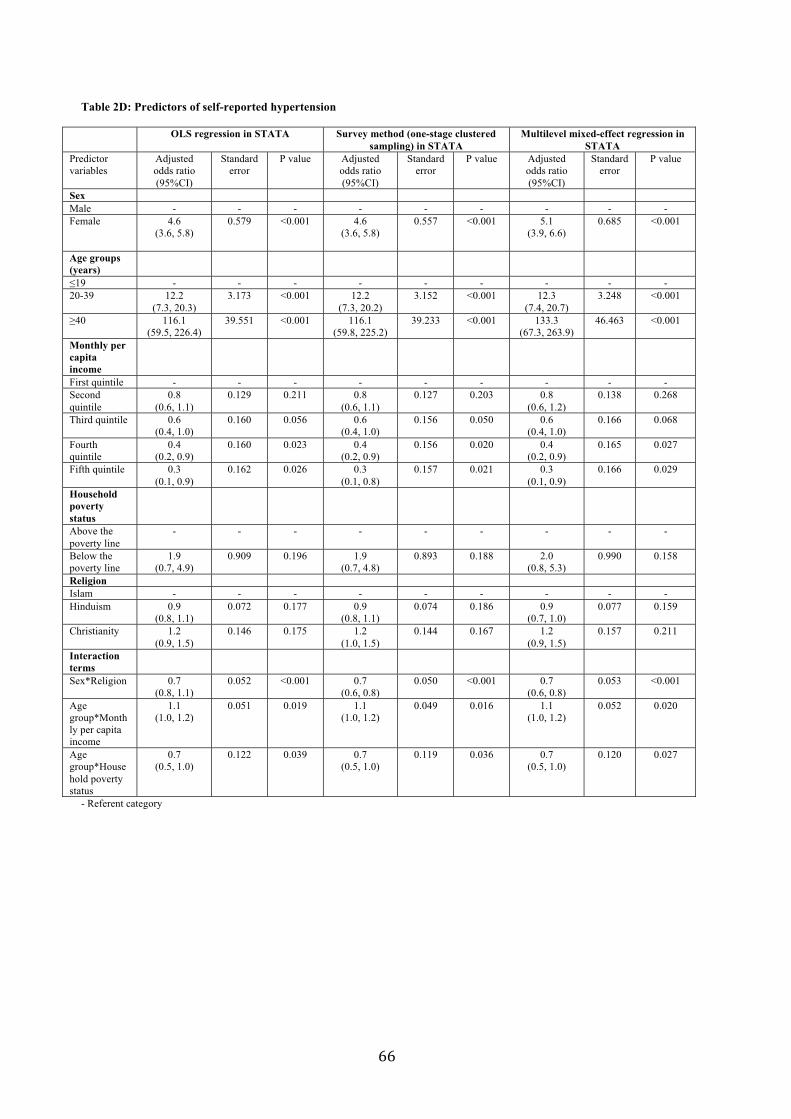
Table 2D: Predictors of self-reported hypertension
OLS regression in STATA Survey method (one-stage clustered sampling) in STATA
Multilevel mixed-effect regression in STATA
Predictor variables
Adjusted odds ratio (95%CI)
Standard error
P value Adjusted odds ratio (95%CI)
Standard error
P value Adjusted odds ratio (95%CI)
Standard error
P value
Sex Male - - - - - - - - -Female 4.6
(3.6, 5.8) 0.579 <0.001 4.6
(3.6, 5.8) 0.557 <0.001 5.1
(3.9, 6.6) 0.685 <0.001
Age groups (years)
19 - - - - - - - - -20-39 12.2
(7.3, 20.3) 3.173 <0.001 12.2
(7.3, 20.2) 3.152 <0.001 12.3
(7.4, 20.7) 3.248 <0.001
40 116.1 (59.5, 226.4)
39.551 <0.001 116.1 (59.8, 225.2)
39.233 <0.001 133.3 (67.3, 263.9)
46.463 <0.001
Monthly per capita income First quintile - - - - - - - - -Second quintile
0.8 (0.6, 1.1)
0.129 0.211 0.8 (0.6, 1.1)
0.127 0.203 0.8 (0.6, 1.2)
0.138 0.268
Third quintile 0.6 (0.4, 1.0)
0.160 0.056 0.6 (0.4, 1.0)
0.156 0.050 0.6 (0.4, 1.0)
0.166 0.068
Fourth quintile
0.4 (0.2, 0.9)
0.160 0.023 0.4 (0.2, 0.9)
0.156 0.020 0.4 (0.2, 0.9)
0.165 0.027
Fifth quintile 0.3 (0.1, 0.9)
0.162 0.026 0.3 (0.1, 0.8)
0.157 0.021 0.3 (0.1, 0.9)
0.166 0.029
Household poverty status Above the poverty line
- - - - - - - - -
Below the poverty line
1.9 (0.7, 4.9)
0.909 0.196 1.9 (0.7, 4.8)
0.893 0.188 2.0 (0.8, 5.3)
0.990 0.158
Religion Islam - - - - - - - - -Hinduism 0.9
(0.8, 1.1) 0.072 0.177 0.9
(0.8, 1.1) 0.074 0.186 0.9
(0.7, 1.0) 0.077 0.159
Christianity 1.2(0.9, 1.5)
0.146 0.175 1.2 (1.0, 1.5)
0.144 0.167 1.2 (0.9, 1.5)
0.157 0.211
Interaction terms Sex*Religion 0.7
(0.8, 1.1) 0.052 <0.001 0.7
(0.6, 0.8) 0.050 <0.001 0.7
(0.6, 0.8) 0.053 <0.001
Age group*Monthly per capita income
1.1 (1.0, 1.2)
0.051 0.019 1.1 (1.0, 1.2)
0.049 0.016 1.1 (1.0, 1.2)
0.052 0.020
Age group*Household poverty status
0.7 (0.5, 1.0)
0.122 0.039 0.7 (0.5, 1.0)
0.119 0.036 0.7 (0.5, 1.0)
0.120 0.027
- Referent category
Chapter 2. Healthcare expenditure and its impact on patients
This chapter is based on the paper:
Bhojani U, Thriveni BS, Devadasan R, Munegowda CM, Devadasan N, Kolsteren P, Criel B. Out-of-pocket healthcare payments on chronic conditions impoverish urban poor in Bangalore, India BMC Public Health 2012;12:990.
Out-of-pocket healthcare payments on chronicconditions impoverish urban poor in Bangalore,IndiaBhojani et al.
Bhojani et al. BMC Public Health 2012, 12:990http://www.biomedcentral.com/1471-2458/12/990
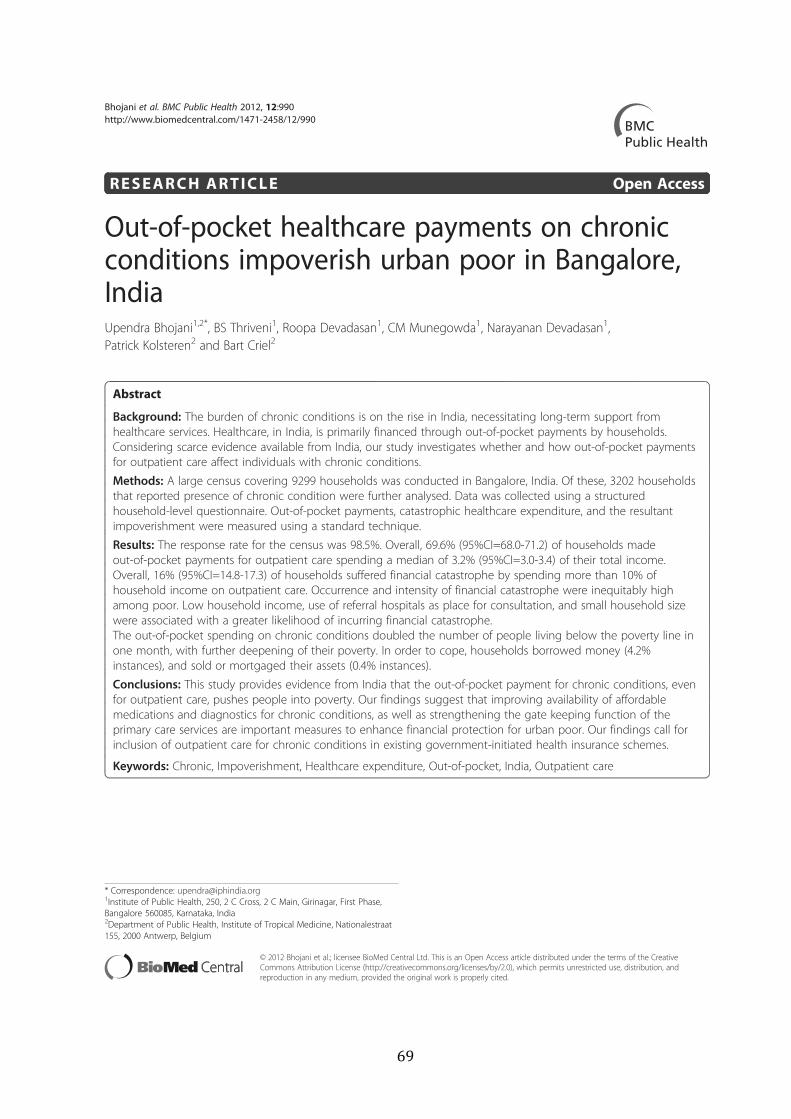
RESEARCH ARTICLE Open Access
Out-of-pocket healthcare payments on chronicconditions impoverish urban poor in Bangalore,IndiaUpendra Bhojani1,2*, BS Thriveni1, Roopa Devadasan1, CM Munegowda1, Narayanan Devadasan1,Patrick Kolsteren2 and Bart Criel2
Abstract
Background: The burden of chronic conditions is on the rise in India, necessitating long-term support fromhealthcare services. Healthcare, in India, is primarily financed through out-of-pocket payments by households.Considering scarce evidence available from India, our study investigates whether and how out-of-pocket paymentsfor outpatient care affect individuals with chronic conditions.
Methods: A large census covering 9299 households was conducted in Bangalore, India. Of these, 3202 householdsthat reported presence of chronic condition were further analysed. Data was collected using a structuredhousehold-level questionnaire. Out-of-pocket payments, catastrophic healthcare expenditure, and the resultantimpoverishment were measured using a standard technique.
Results: The response rate for the census was 98.5%. Overall, 69.6% (95%CI=68.0-71.2) of households madeout-of-pocket payments for outpatient care spending a median of 3.2% (95%CI=3.0-3.4) of their total income.Overall, 16% (95%CI=14.8-17.3) of households suffered financial catastrophe by spending more than 10% ofhousehold income on outpatient care. Occurrence and intensity of financial catastrophe were inequitably highamong poor. Low household income, use of referral hospitals as place for consultation, and small household sizewere associated with a greater likelihood of incurring financial catastrophe.The out-of-pocket spending on chronic conditions doubled the number of people living below the poverty line inone month, with further deepening of their poverty. In order to cope, households borrowed money (4.2%instances), and sold or mortgaged their assets (0.4% instances).
Conclusions: This study provides evidence from India that the out-of-pocket payment for chronic conditions, evenfor outpatient care, pushes people into poverty. Our findings suggest that improving availability of affordablemedications and diagnostics for chronic conditions, as well as strengthening the gate keeping function of theprimary care services are important measures to enhance financial protection for urban poor. Our findings call forinclusion of outpatient care for chronic conditions in existing government-initiated health insurance schemes.
Keywords: Chronic, Impoverishment, Healthcare expenditure, Out-of-pocket, India, Outpatient care
* Correspondence: [email protected] of Public Health, 250, 2 C Cross, 2 C Main, Girinagar, First Phase,Bangalore 560085, Karnataka, India2Department of Public Health, Institute of Tropical Medicine, Nationalestraat155, 2000 Antwerp, Belgium
© 2012 Bhojani et al.; licensee BioMed Central Ltd. This is an Open Access article distributed under the terms of the CreativeCommons Attribution License (http://creativecommons.org/licenses/by/2.0), which permits unrestricted use, distribution, andreproduction in any medium, provided the original work is properly cited.
Bhojani et al. BMC Public Health 2012, 12:990http://www.biomedcentral.com/1471-2458/12/990

BackgroundWith an epidemiological transition underway in India,the burden of chronic and non-communicable diseasesis on the rise. In 2005, these conditions were responsiblefor 53% of all deaths, and their proportional impact isexpected to increase to 67% in 2020 [1]. Chronic condi-tions, which include most non-communicable diseasesbut also some communicable diseases, require continu-ous medical care complemented by long-term supportfrom healthcare services. Responding to the caredemands of people with chronic conditions is a chal-lenge in most low- and middle-income countries, includ-ing India, where the health system is weak and remainsprimarily oriented towards the management of infectiousdiseases, and maternal and child healthcare [1-3]. Healthsystem strengthening is increasingly advocated as a cen-tral strategy in the endeavour to improve care forchronic conditions in these countries [2,4].Health financing is one of the building blocks of health
systems [5,6]. Health systems, ideally, should be financedin a way that people can use healthcare services withoutfinancial hardship [5]. In India, 71.1% of healthcare isfinanced through out-of-pocket (OOP) payments byhouseholds at the time and point of healthcare use [7].In 2004–2005, 64.4% of households in India had to incurOOP payments for healthcare [8]. OOP payments act asthe primary barrier to access healthcare services in India,and lead to significant impoverishment among thosewho use the services [8,9]. In fact, Berman and collea-gues [10] reported that in 2004, approximately 6.2% ofIndians fell below the poverty line due to OOP paymentsfor healthcare; a greater proportion of them for out-patient care (4.9%) than for inpatient care (1.3%), whileexpenditure for medications constituted the greatestshare (71.2%). We hypothesise that people with chronicconditions are likely to incur higher OOP payments foroutpatient care, as they need periodic outpatient visitsand regular medication on a long-term basis. Such pay-ments may impoverish them and even push them belowthe poverty line.Despite several recent studies examining OOP pay-
ments for healthcare in India, very few of them reportfindings disaggregated by type of care (outpatient/in-patient), location (urban/rural) and type of ailments(acute/chronic). Only one study from West Bengalreported some findings on OOP payments for chronicdisease care, and its impact on households [11,12]. Thisstudy showed that households spent 4.1% of their annualexpenditure on chronic disease care. It also indicatedthat the OOP payments for outpatient care were morestrongly associated with financial catastrophe than thosefor inpatient care.The purpose of this study is to contribute to this
knowledge gap by investigating whether and how OOP
payments for outpatient care affect individuals withchronic conditions in Kadugondanahalli (KG Halli), apoor urban neighbourhood in South India.
ContextKG Halli, a site of this study, is one of the 198 administra-tive units of Bangalore city, a metropolitan capital ofKarnataka. KG Halli has a population of more than 44,500individuals spread over 0.7 square kilometre [13]. KG Halliincludes an area classified as a slum, and the median in-come of KG Halli residents is INR 73.3 (USD 1.5) percapita per day [13]. A ‘slum’ is a compact settlement ofpoorly built tenements with inadequate sanitary anddrinking water facilities [14]. The population in KG Halliis a social mix, with people speaking five different lan-guages and representing all major religions of the country.KG Halli also has pluralistic healthcare services.
Government provides care through an urban healthcentre and a community health centre, run by the muni-cipal and provincial governments, respectively. These fa-cilities provide outpatient care and outreach servicesusing allopathic (or ‘modern’) medicine. These healthcentres provide free care to people living below the pov-erty line, whereas other users need to pay nominal userfees for some of the services. Additionally, there are atleast 32 private healthcare providers (excluding dentistsand paramedics) from various systems of medicine (pri-marily Unani, Ayurveda, Allopathy and Homeopathy)[13]. Private healthcare provision is through severalsingle-doctor clinics and four private hospitals. All of theprivate facilities provide outpatient care, but only thehospitals provide inpatient facilities, with their capacityranging from 50 to 100 beds. There are several privatepharmacies and laboratories in KG Halli. Private sec-tor is largely unregulated and works on fee-for-servicebasis [13].KG Halli is the field site for the Urban Health Action
Research Project (UHARP) of the Institute of PublicHealth (IPH), Bangalore, since 2009 [15]. KG Halli waspurposefully selected for the UHARP to study how ac-cess to quality healthcare could be improved in a poorurban community with a pluralistic healthcare system.The residents as well as healthcare providers in KG Hallihave identified difficulties in affording healthcare as oneof the major issues in the area.The specific objectives of the present study were
therefore to assess the i) incidence and extent of theOOP payments on outpatient care for chronic condi-tions; ii) incidence of the financial catastrophe due toOOP payments; and iii) resultant impoverishmentamong residents of KG Halli. The result of this studywould feed into UHARP and serve as an avenue for dis-cussion and action by stakeholders in the area to im-prove affordability of chronic condition care.
Bhojani et al. BMC Public Health 2012, 12:990 Page 2 of 13http://www.biomedcentral.com/1471-2458/12/990
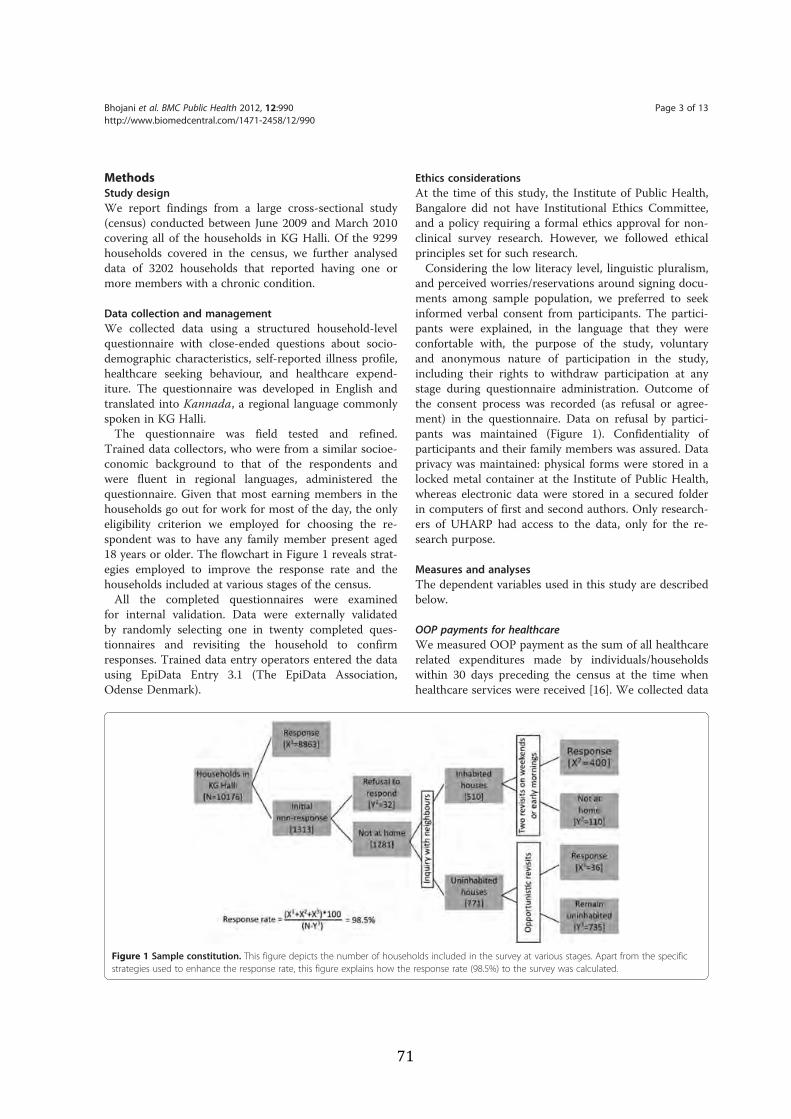
MethodsStudy designWe report findings from a large cross-sectional study(census) conducted between June 2009 and March 2010covering all of the households in KG Halli. Of the 9299households covered in the census, we further analyseddata of 3202 households that reported having one ormore members with a chronic condition.
Data collection and managementWe collected data using a structured household-levelquestionnaire with close-ended questions about socio-demographic characteristics, self-reported illness profile,healthcare seeking behaviour, and healthcare expend-iture. The questionnaire was developed in English andtranslated into Kannada, a regional language commonlyspoken in KG Halli.The questionnaire was field tested and refined.
Trained data collectors, who were from a similar socioe-conomic background to that of the respondents andwere fluent in regional languages, administered thequestionnaire. Given that most earning members in thehouseholds go out for work for most of the day, the onlyeligibility criterion we employed for choosing the re-spondent was to have any family member present aged18 years or older. The flowchart in Figure 1 reveals strat-egies employed to improve the response rate and thehouseholds included at various stages of the census.All the completed questionnaires were examined
for internal validation. Data were externally validatedby randomly selecting one in twenty completed ques-tionnaires and revisiting the household to confirmresponses. Trained data entry operators entered the datausing EpiData Entry 3.1 (The EpiData Association,Odense Denmark).
Ethics considerationsAt the time of this study, the Institute of Public Health,Bangalore did not have Institutional Ethics Committee,and a policy requiring a formal ethics approval for non-clinical survey research. However, we followed ethicalprinciples set for such research.Considering the low literacy level, linguistic pluralism,
and perceived worries/reservations around signing docu-ments among sample population, we preferred to seekinformed verbal consent from participants. The partici-pants were explained, in the language that they wereconfortable with, the purpose of the study, voluntaryand anonymous nature of participation in the study,including their rights to withdraw participation at anystage during questionnaire administration. Outcome ofthe consent process was recorded (as refusal or agree-ment) in the questionnaire. Data on refusal by partici-pants was maintained (Figure 1). Confidentiality ofparticipants and their family members was assured. Dataprivacy was maintained: physical forms were stored in alocked metal container at the Institute of Public Health,whereas electronic data were stored in a secured folderin computers of first and second authors. Only research-ers of UHARP had access to the data, only for the re-search purpose.
Measures and analysesThe dependent variables used in this study are describedbelow.
OOP payments for healthcareWe measured OOP payment as the sum of all healthcarerelated expenditures made by individuals/householdswithin 30 days preceding the census at the time whenhealthcare services were received [16]. We collected data
Figure 1 Sample constitution. This figure depicts the number of households included in the survey at various stages. Apart from the specificstrategies used to enhance the response rate, this figure explains how the response rate (98.5%) to the survey was calculated.
Bhojani et al. BMC Public Health 2012, 12:990 Page 3 of 13http://www.biomedcentral.com/1471-2458/12/990
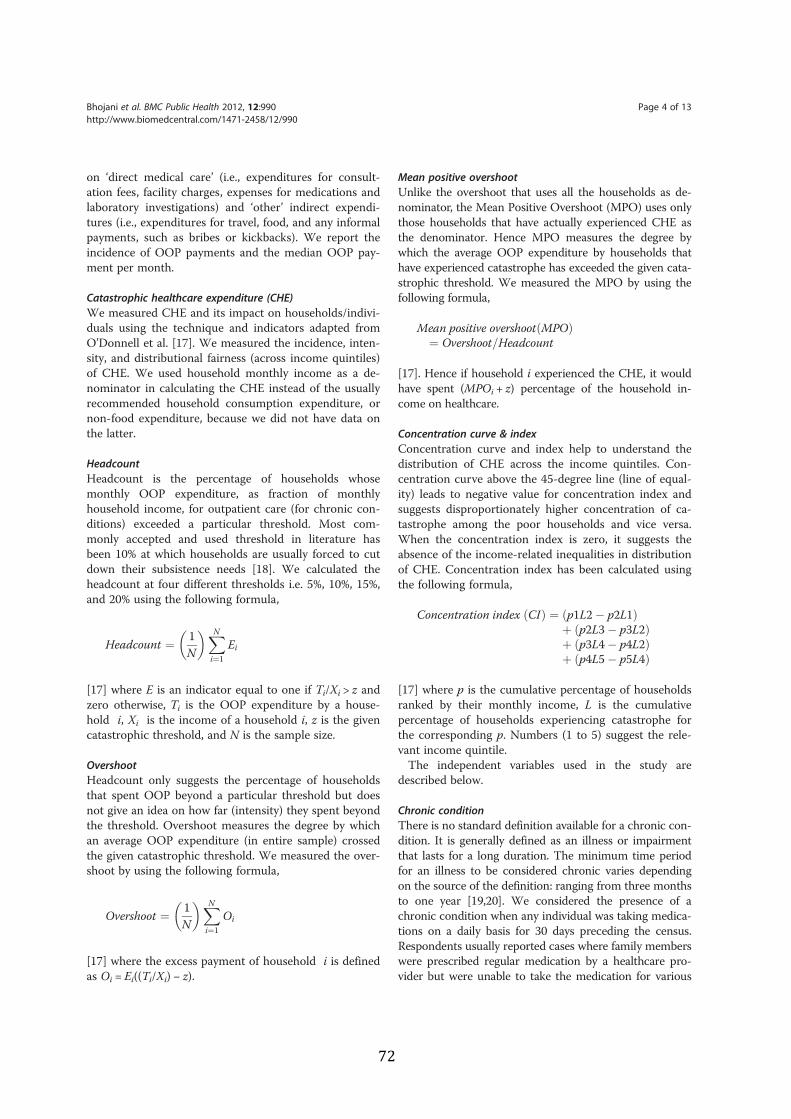
on ‘direct medical care’ (i.e., expenditures for consult-ation fees, facility charges, expenses for medications andlaboratory investigations) and ‘other’ indirect expendi-tures (i.e., expenditures for travel, food, and any informalpayments, such as bribes or kickbacks). We report theincidence of OOP payments and the median OOP pay-ment per month.
Catastrophic healthcare expenditure (CHE)We measured CHE and its impact on households/indivi-duals using the technique and indicators adapted fromO’Donnell et al. [17]. We measured the incidence, inten-sity, and distributional fairness (across income quintiles)of CHE. We used household monthly income as a de-nominator in calculating the CHE instead of the usuallyrecommended household consumption expenditure, ornon-food expenditure, because we did not have data onthe latter.
HeadcountHeadcount is the percentage of households whosemonthly OOP expenditure, as fraction of monthlyhousehold income, for outpatient care (for chronic con-ditions) exceeded a particular threshold. Most com-monly accepted and used threshold in literature hasbeen 10% at which households are usually forced to cutdown their subsistence needs [18]. We calculated theheadcount at four different thresholds i.e. 5%, 10%, 15%,and 20% using the following formula,
Headcount ¼ 1N
! "XN
i¼1
Ei
[17] where E is an indicator equal to one if Ti/Xi > z andzero otherwise, Ti is the OOP expenditure by a house-hold i, Xi is the income of a household i, z is the givencatastrophic threshold, and N is the sample size.
OvershootHeadcount only suggests the percentage of householdsthat spent OOP beyond a particular threshold but doesnot give an idea on how far (intensity) they spent beyondthe threshold. Overshoot measures the degree by whichan average OOP expenditure (in entire sample) crossedthe given catastrophic threshold. We measured the over-shoot by using the following formula,
Overshoot ¼ 1N
! "XN
i¼1
Oi
[17] where the excess payment of household i is definedas Oi = Ei((Ti/Xi) − z).
Mean positive overshootUnlike the overshoot that uses all the households as de-nominator, the Mean Positive Overshoot (MPO) uses onlythose households that have actually experienced CHE asthe denominator. Hence MPO measures the degree bywhich the average OOP expenditure by households thathave experienced catastrophe has exceeded the given cata-strophic threshold. We measured the MPO by using thefollowing formula,
Mean positive overshoot MPOð Þ¼ Overshoot=Headcount
[17]. Hence if household i experienced the CHE, it wouldhave spent (MPOi + z) percentage of the household in-come on healthcare.
Concentration curve & indexConcentration curve and index help to understand thedistribution of CHE across the income quintiles. Con-centration curve above the 45-degree line (line of equal-ity) leads to negative value for concentration index andsuggests disproportionately higher concentration of ca-tastrophe among the poor households and vice versa.When the concentration index is zero, it suggests theabsence of the income-related inequalities in distributionof CHE. Concentration index has been calculated usingthe following formula,
Concentration index CIð Þ ¼ p1L2$ p2L1ð Þþ p2L3$ p3L2ð Þþ p3L4$ p4L2ð Þþ p4L5$ p5L4ð Þ
[17] where p is the cumulative percentage of householdsranked by their monthly income, L is the cumulativepercentage of households experiencing catastrophe forthe corresponding p. Numbers (1 to 5) suggest the rele-vant income quintile.The independent variables used in the study are
described below.
Chronic conditionThere is no standard definition available for a chronic con-dition. It is generally defined as an illness or impairmentthat lasts for a long duration. The minimum time periodfor an illness to be considered chronic varies dependingon the source of the definition: ranging from three monthsto one year [19,20]. We considered the presence of achronic condition when any individual was taking medica-tions on a daily basis for 30 days preceding the census.Respondents usually reported cases where family memberswere prescribed regular medication by a healthcare pro-vider but were unable to take the medication for various
Bhojani et al. BMC Public Health 2012, 12:990 Page 4 of 13http://www.biomedcentral.com/1471-2458/12/990
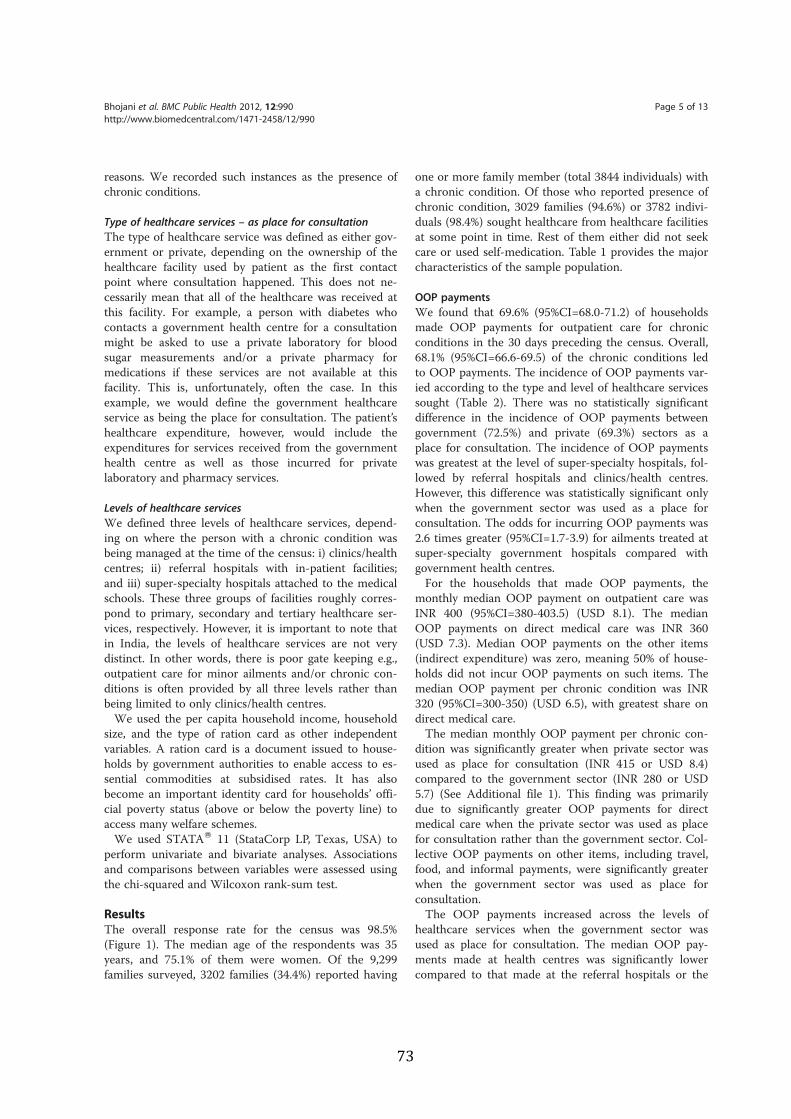
reasons. We recorded such instances as the presence ofchronic conditions.
Type of healthcare services – as place for consultationThe type of healthcare service was defined as either gov-ernment or private, depending on the ownership of thehealthcare facility used by patient as the first contactpoint where consultation happened. This does not ne-cessarily mean that all of the healthcare was received atthis facility. For example, a person with diabetes whocontacts a government health centre for a consultationmight be asked to use a private laboratory for bloodsugar measurements and/or a private pharmacy formedications if these services are not available at thisfacility. This is, unfortunately, often the case. In thisexample, we would define the government healthcareservice as being the place for consultation. The patient’shealthcare expenditure, however, would include theexpenditures for services received from the governmenthealth centre as well as those incurred for privatelaboratory and pharmacy services.
Levels of healthcare servicesWe defined three levels of healthcare services, depend-ing on where the person with a chronic condition wasbeing managed at the time of the census: i) clinics/healthcentres; ii) referral hospitals with in-patient facilities;and iii) super-specialty hospitals attached to the medicalschools. These three groups of facilities roughly corres-pond to primary, secondary and tertiary healthcare ser-vices, respectively. However, it is important to note thatin India, the levels of healthcare services are not verydistinct. In other words, there is poor gate keeping e.g.,outpatient care for minor ailments and/or chronic con-ditions is often provided by all three levels rather thanbeing limited to only clinics/health centres.We used the per capita household income, household
size, and the type of ration card as other independentvariables. A ration card is a document issued to house-holds by government authorities to enable access to es-sential commodities at subsidised rates. It has alsobecome an important identity card for households’ offi-cial poverty status (above or below the poverty line) toaccess many welfare schemes.We used STATAW 11 (StataCorp LP, Texas, USA) to
perform univariate and bivariate analyses. Associationsand comparisons between variables were assessed usingthe chi-squared and Wilcoxon rank-sum test.
ResultsThe overall response rate for the census was 98.5%(Figure 1). The median age of the respondents was 35years, and 75.1% of them were women. Of the 9,299families surveyed, 3202 families (34.4%) reported having
one or more family member (total 3844 individuals) witha chronic condition. Of those who reported presence ofchronic condition, 3029 families (94.6%) or 3782 indivi-duals (98.4%) sought healthcare from healthcare facilitiesat some point in time. Rest of them either did not seekcare or used self-medication. Table 1 provides the majorcharacteristics of the sample population.
OOP paymentsWe found that 69.6% (95%CI=68.0-71.2) of householdsmade OOP payments for outpatient care for chronicconditions in the 30 days preceding the census. Overall,68.1% (95%CI=66.6-69.5) of the chronic conditions ledto OOP payments. The incidence of OOP payments var-ied according to the type and level of healthcare servicessought (Table 2). There was no statistically significantdifference in the incidence of OOP payments betweengovernment (72.5%) and private (69.3%) sectors as aplace for consultation. The incidence of OOP paymentswas greatest at the level of super-specialty hospitals, fol-lowed by referral hospitals and clinics/health centres.However, this difference was statistically significant onlywhen the government sector was used as a place forconsultation. The odds for incurring OOP payments was2.6 times greater (95%CI=1.7-3.9) for ailments treated atsuper-specialty government hospitals compared withgovernment health centres.For the households that made OOP payments, the
monthly median OOP payment on outpatient care wasINR 400 (95%CI=380-403.5) (USD 8.1). The medianOOP payments on direct medical care was INR 360(USD 7.3). Median OOP payments on the other items(indirect expenditure) was zero, meaning 50% of house-holds did not incur OOP payments on such items. Themedian OOP payment per chronic condition was INR320 (95%CI=300-350) (USD 6.5), with greatest share ondirect medical care.The median monthly OOP payment per chronic con-
dition was significantly greater when private sector wasused as place for consultation (INR 415 or USD 8.4)compared to the government sector (INR 280 or USD5.7) (See Additional file 1). This finding was primarilydue to significantly greater OOP payments for directmedical care when the private sector was used as placefor consultation rather than the government sector. Col-lective OOP payments on other items, including travel,food, and informal payments, were significantly greaterwhen the government sector was used as place forconsultation.The OOP payments increased across the levels of
healthcare services when the government sector wasused as place for consultation. The median OOP pay-ments made at health centres was significantly lowercompared to that made at the referral hospitals or the
Bhojani et al. BMC Public Health 2012, 12:990 Page 5 of 13http://www.biomedcentral.com/1471-2458/12/990
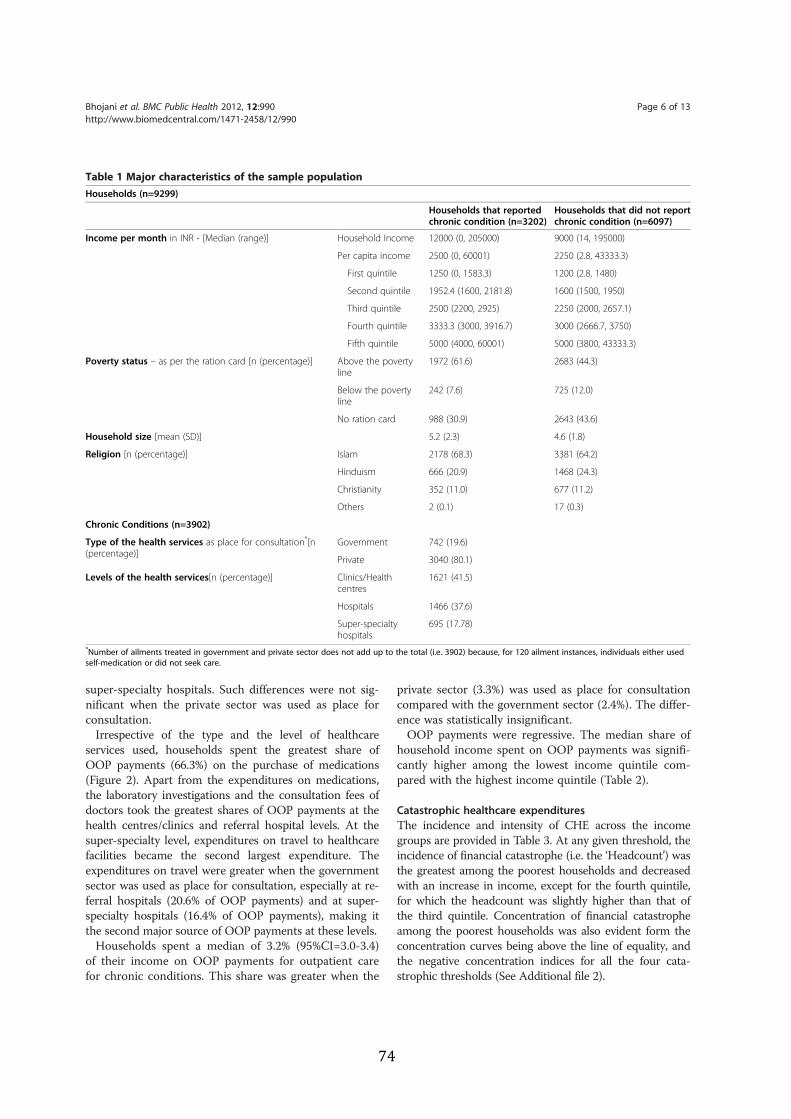
super-specialty hospitals. Such differences were not sig-nificant when the private sector was used as place forconsultation.Irrespective of the type and the level of healthcare
services used, households spent the greatest share ofOOP payments (66.3%) on the purchase of medications(Figure 2). Apart from the expenditures on medications,the laboratory investigations and the consultation fees ofdoctors took the greatest shares of OOP payments at thehealth centres/clinics and referral hospital levels. At thesuper-specialty level, expenditures on travel to healthcarefacilities became the second largest expenditure. Theexpenditures on travel were greater when the governmentsector was used as place for consultation, especially at re-ferral hospitals (20.6% of OOP payments) and at super-specialty hospitals (16.4% of OOP payments), making itthe second major source of OOP payments at these levels.Households spent a median of 3.2% (95%CI=3.0-3.4)
of their income on OOP payments for outpatient carefor chronic conditions. This share was greater when the
private sector (3.3%) was used as place for consultationcompared with the government sector (2.4%). The differ-ence was statistically insignificant.OOP payments were regressive. The median share of
household income spent on OOP payments was signifi-cantly higher among the lowest income quintile com-pared with the highest income quintile (Table 2).
Catastrophic healthcare expendituresThe incidence and intensity of CHE across the incomegroups are provided in Table 3. At any given threshold, theincidence of financial catastrophe (i.e. the ‘Headcount’) wasthe greatest among the poorest households and decreasedwith an increase in income, except for the fourth quintile,for which the headcount was slightly higher than that ofthe third quintile. Concentration of financial catastropheamong the poorest households was also evident form theconcentration curves being above the line of equality, andthe negative concentration indices for all the four cata-strophic thresholds (See Additional file 2).
Table 1 Major characteristics of the sample populationHouseholds (n=9299)
Households that reportedchronic condition (n=3202)
Households that did not reportchronic condition (n=6097)
Income per month in INR - [Median (range)] Household Income 12000 (0, 205000) 9000 (14, 195000)
Per capita income 2500 (0, 60001) 2250 (2.8, 43333.3)
First quintile 1250 (0, 1583.3) 1200 (2.8, 1480)
Second quintile 1952.4 (1600, 2181.8) 1600 (1500, 1950)
Third quintile 2500 (2200, 2925) 2250 (2000, 2657.1)
Fourth quintile 3333.3 (3000, 3916.7) 3000 (2666.7, 3750)
Fifth quintile 5000 (4000, 60001) 5000 (3800, 43333.3)
Poverty status – as per the ration card [n (percentage)] Above the povertyline
1972 (61.6) 2683 (44.3)
Below the povertyline
242 (7.6) 725 (12.0)
No ration card 988 (30.9) 2643 (43.6)
Household size [mean (SD)] 5.2 (2.3) 4.6 (1.8)
Religion [n (percentage)] Islam 2178 (68.3) 3381 (64.2)
Hinduism 666 (20.9) 1468 (24.3)
Christianity 352 (11.0) 677 (11.2)
Others 2 (0.1) 17 (0.3)
Chronic Conditions (n=3902)
Type of the health services as place for consultation*[n(percentage)]
Government 742 (19.6)
Private 3040 (80.1)
Levels of the health services[n (percentage)] Clinics/Healthcentres
1621 (41.5)
Hospitals 1466 (37.6)
Super-specialtyhospitals
695 (17.78)
*Number of ailments treated in government and private sector does not add up to the total (i.e. 3902) because, for 120 ailment instances, individuals either usedself-medication or did not seek care.
Bhojani et al. BMC Public Health 2012, 12:990 Page 6 of 13http://www.biomedcentral.com/1471-2458/12/990
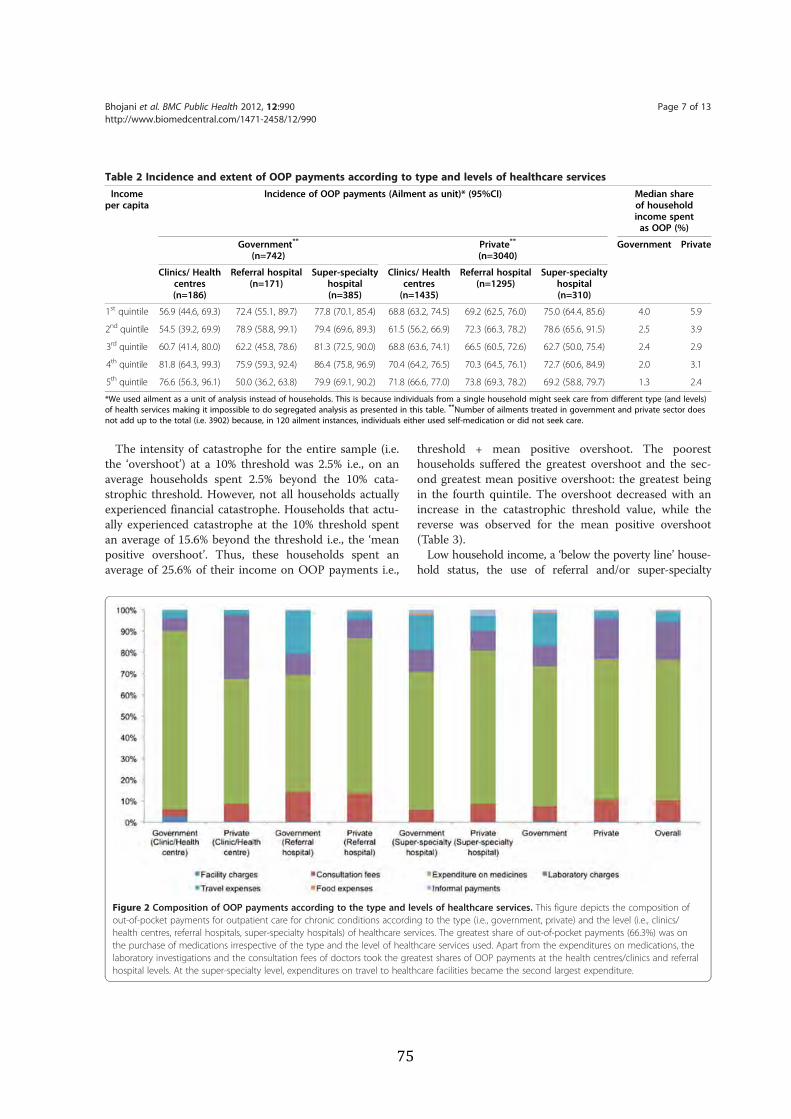
The intensity of catastrophe for the entire sample (i.e.the ‘overshoot’) at a 10% threshold was 2.5% i.e., on anaverage households spent 2.5% beyond the 10% cata-strophic threshold. However, not all households actuallyexperienced financial catastrophe. Households that actu-ally experienced catastrophe at the 10% threshold spentan average of 15.6% beyond the threshold i.e., the ‘meanpositive overshoot’. Thus, these households spent anaverage of 25.6% of their income on OOP payments i.e.,
threshold + mean positive overshoot. The pooresthouseholds suffered the greatest overshoot and the sec-ond greatest mean positive overshoot: the greatest beingin the fourth quintile. The overshoot decreased with anincrease in the catastrophic threshold value, while thereverse was observed for the mean positive overshoot(Table 3).Low household income, a ‘below the poverty line’ house-
hold status, the use of referral and/or super-specialty
Table 2 Incidence and extent of OOP payments according to type and levels of healthcare servicesIncome
per capitaIncidence of OOP payments (Ailment as unit)* (95%CI) Median share
of householdincome spentas OOP (%)
Government**
(n=742)Private**
(n=3040)Government Private
Clinics/ Healthcentres(n=186)
Referral hospital(n=171)
Super-specialtyhospital(n=385)
Clinics/ Healthcentres(n=1435)
Referral hospital(n=1295)
Super-specialtyhospital(n=310)
1st quintile 56.9 (44.6, 69.3) 72.4 (55.1, 89.7) 77.8 (70.1, 85.4) 68.8 (63.2, 74.5) 69.2 (62.5, 76.0) 75.0 (64.4, 85.6) 4.0 5.9
2nd quintile 54.5 (39.2, 69.9) 78.9 (58.8, 99.1) 79.4 (69.6, 89.3) 61.5 (56.2, 66.9) 72.3 (66.3, 78.2) 78.6 (65.6, 91.5) 2.5 3.9
3rd quintile 60.7 (41.4, 80.0) 62.2 (45.8, 78.6) 81.3 (72.5, 90.0) 68.8 (63.6, 74.1) 66.5 (60.5, 72.6) 62.7 (50.0, 75.4) 2.4 2.9
4th quintile 81.8 (64.3, 99.3) 75.9 (59.3, 92.4) 86.4 (75.8, 96.9) 70.4 (64.2, 76.5) 70.3 (64.5, 76.1) 72.7 (60.6, 84.9) 2.0 3.1
5th quintile 76.6 (56.3, 96.1) 50.0 (36.2, 63.8) 79.9 (69.1, 90.2) 71.8 (66.6, 77.0) 73.8 (69.3, 78.2) 69.2 (58.8, 79.7) 1.3 2.4
*We used ailment as a unit of analysis instead of households. This is because individuals from a single household might seek care from different type (and levels)of health services making it impossible to do segregated analysis as presented in this table. **Number of ailments treated in government and private sector doesnot add up to the total (i.e. 3902) because, in 120 ailment instances, individuals either used self-medication or did not seek care.
Figure 2 Composition of OOP payments according to the type and levels of healthcare services. This figure depicts the composition ofout-of-pocket payments for outpatient care for chronic conditions according to the type (i.e., government, private) and the level (i.e., clinics/health centres, referral hospitals, super-specialty hospitals) of healthcare services. The greatest share of out-of-pocket payments (66.3%) was onthe purchase of medications irrespective of the type and the level of healthcare services used. Apart from the expenditures on medications, thelaboratory investigations and the consultation fees of doctors took the greatest shares of OOP payments at the health centres/clinics and referralhospital levels. At the super-specialty level, expenditures on travel to healthcare facilities became the second largest expenditure.
Bhojani et al. BMC Public Health 2012, 12:990 Page 7 of 13http://www.biomedcentral.com/1471-2458/12/990
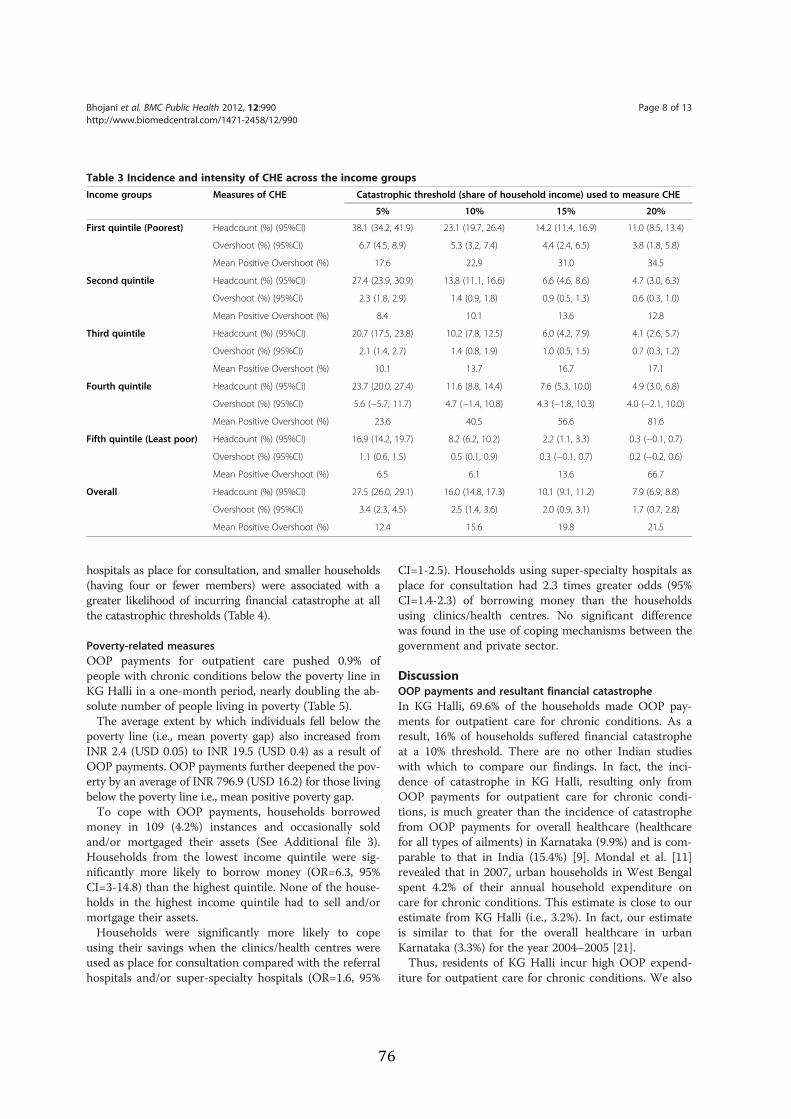
hospitals as place for consultation, and smaller households(having four or fewer members) were associated with agreater likelihood of incurring financial catastrophe at allthe catastrophic thresholds (Table 4).
Poverty-related measuresOOP payments for outpatient care pushed 0.9% ofpeople with chronic conditions below the poverty line inKG Halli in a one-month period, nearly doubling the ab-solute number of people living in poverty (Table 5).The average extent by which individuals fell below the
poverty line (i.e., mean poverty gap) also increased fromINR 2.4 (USD 0.05) to INR 19.5 (USD 0.4) as a result ofOOP payments. OOP payments further deepened the pov-erty by an average of INR 796.9 (USD 16.2) for those livingbelow the poverty line i.e., mean positive poverty gap.To cope with OOP payments, households borrowed
money in 109 (4.2%) instances and occasionally soldand/or mortgaged their assets (See Additional file 3).Households from the lowest income quintile were sig-nificantly more likely to borrow money (OR=6.3, 95%CI=3-14.8) than the highest quintile. None of the house-holds in the highest income quintile had to sell and/ormortgage their assets.Households were significantly more likely to cope
using their savings when the clinics/health centres wereused as place for consultation compared with the referralhospitals and/or super-specialty hospitals (OR=1.6, 95%
CI=1-2.5). Households using super-specialty hospitals asplace for consultation had 2.3 times greater odds (95%CI=1.4-2.3) of borrowing money than the householdsusing clinics/health centres. No significant differencewas found in the use of coping mechanisms between thegovernment and private sector.
DiscussionOOP payments and resultant financial catastropheIn KG Halli, 69.6% of the households made OOP pay-ments for outpatient care for chronic conditions. As aresult, 16% of households suffered financial catastropheat a 10% threshold. There are no other Indian studieswith which to compare our findings. In fact, the inci-dence of catastrophe in KG Halli, resulting only fromOOP payments for outpatient care for chronic condi-tions, is much greater than the incidence of catastrophefrom OOP payments for overall healthcare (healthcarefor all types of ailments) in Karnataka (9.9%) and is com-parable to that in India (15.4%) [9]. Mondal et al. [11]revealed that in 2007, urban households in West Bengalspent 4.2% of their annual household expenditure oncare for chronic conditions. This estimate is close to ourestimate from KG Halli (i.e., 3.2%). In fact, our estimateis similar to that for the overall healthcare in urbanKarnataka (3.3%) for the year 2004–2005 [21].Thus, residents of KG Halli incur high OOP expend-
iture for outpatient care for chronic conditions. We also
Table 3 Incidence and intensity of CHE across the income groupsIncome groups Measures of CHE Catastrophic threshold (share of household income) used to measure CHE
5% 10% 15% 20%
First quintile (Poorest) Headcount (%) (95%CI) 38.1 (34.2, 41.9) 23.1 (19.7, 26.4) 14.2 (11.4, 16.9) 11.0 (8.5, 13.4)
Overshoot (%) (95%CI) 6.7 (4.5, 8.9) 5.3 (3.2, 7.4) 4.4 (2.4, 6.5) 3.8 (1.8, 5.8)
Mean Positive Overshoot (%) 17.6 22.9 31.0 34.5
Second quintile Headcount (%) (95%CI) 27.4 (23.9, 30.9) 13.8 (11.1, 16.6) 6.6 (4.6, 8.6) 4.7 (3.0, 6.3)
Overshoot (%) (95%CI) 2.3 (1.8, 2.9) 1.4 (0.9, 1.8) 0.9 (0.5, 1.3) 0.6 (0.3, 1.0)
Mean Positive Overshoot (%) 8.4 10.1 13.6 12.8
Third quintile Headcount (%) (95%CI) 20.7 (17.5, 23.8) 10.2 (7.8, 12.5) 6.0 (4.2, 7.9) 4.1 (2.6, 5.7)
Overshoot (%) (95%CI) 2.1 (1.4, 2.7) 1.4 (0.8, 1.9) 1.0 (0.5, 1.5) 0.7 (0.3, 1.2)
Mean Positive Overshoot (%) 10.1 13.7 16.7 17.1
Fourth quintile Headcount (%) (95%CI) 23.7 (20.0, 27.4) 11.6 (8.8, 14.4) 7.6 (5.3, 10.0) 4.9 (3.0, 6.8)
Overshoot (%) (95%CI) 5.6 (−5.7, 11.7) 4.7 (−1.4, 10.8) 4.3 (−1.8, 10.3) 4.0 (−2.1, 10.0)
Mean Positive Overshoot (%) 23.6 40.5 56.6 81.6
Fifth quintile (Least poor) Headcount (%) (95%CI) 16.9 (14.2, 19.7) 8.2 (6.2, 10.2) 2.2 (1.1, 3.3) 0.3 (−0.1, 0.7)
Overshoot (%) (95%CI) 1.1 (0.6, 1.5) 0.5 (0.1, 0.9) 0.3 (−0.1, 0.7) 0.2 (−0.2, 0.6)
Mean Positive Overshoot (%) 6.5 6.1 13.6 66.7
Overall Headcount (%) (95%CI) 27.5 (26.0, 29.1) 16.0 (14.8, 17.3) 10.1 (9.1, 11.2) 7.9 (6.9, 8.8)
Overshoot (%) (95%CI) 3.4 (2.3, 4.5) 2.5 (1.4, 3.6) 2.0 (0.9, 3.1) 1.7 (0.7, 2.8)
Mean Positive Overshoot (%) 12.4 15.6 19.8 21.5
Bhojani et al. BMC Public Health 2012, 12:990 Page 8 of 13http://www.biomedcentral.com/1471-2458/12/990
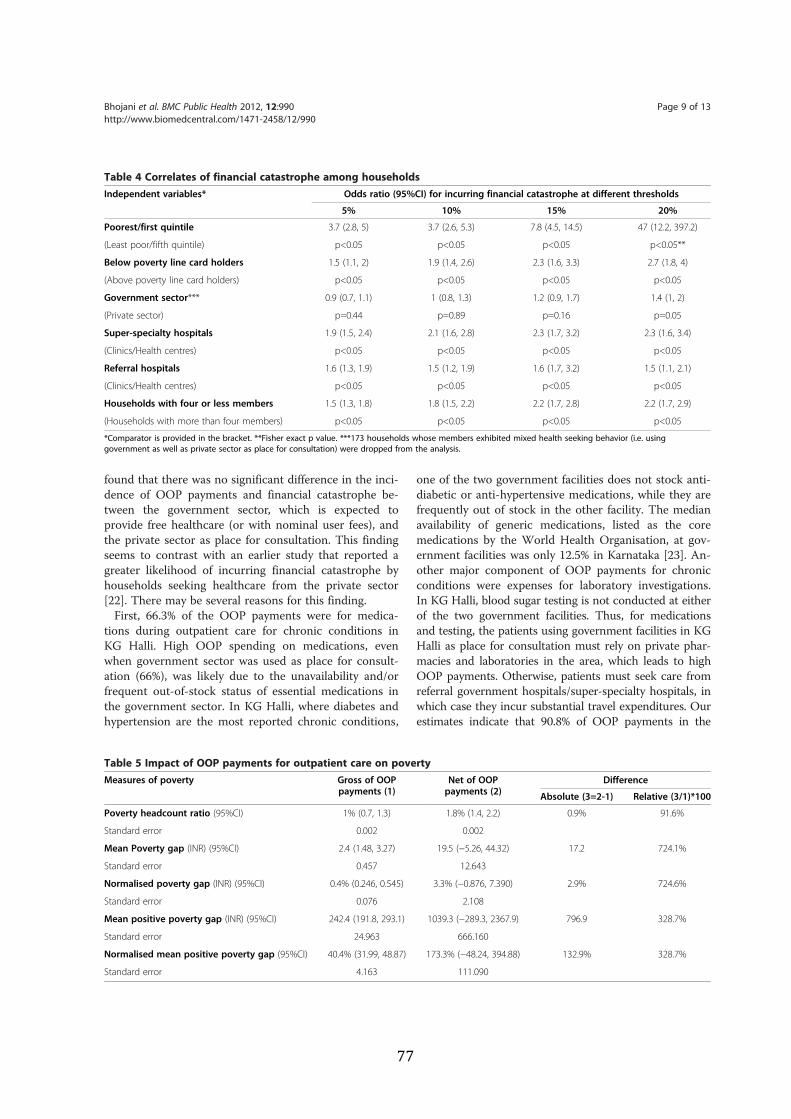
found that there was no significant difference in the inci-dence of OOP payments and financial catastrophe be-tween the government sector, which is expected toprovide free healthcare (or with nominal user fees), andthe private sector as place for consultation. This findingseems to contrast with an earlier study that reported agreater likelihood of incurring financial catastrophe byhouseholds seeking healthcare from the private sector[22]. There may be several reasons for this finding.First, 66.3% of the OOP payments were for medica-
tions during outpatient care for chronic conditions inKG Halli. High OOP spending on medications, evenwhen government sector was used as place for consult-ation (66%), was likely due to the unavailability and/orfrequent out-of-stock status of essential medications inthe government sector. In KG Halli, where diabetes andhypertension are the most reported chronic conditions,
one of the two government facilities does not stock anti-diabetic or anti-hypertensive medications, while they arefrequently out of stock in the other facility. The medianavailability of generic medications, listed as the coremedications by the World Health Organisation, at gov-ernment facilities was only 12.5% in Karnataka [23]. An-other major component of OOP payments for chronicconditions were expenses for laboratory investigations.In KG Halli, blood sugar testing is not conducted at eitherof the two government facilities. Thus, for medicationsand testing, the patients using government facilities in KGHalli as place for consultation must rely on private phar-macies and laboratories in the area, which leads to highOOP payments. Otherwise, patients must seek care fromreferral government hospitals/super-specialty hospitals, inwhich case they incur substantial travel expenditures. Ourestimates indicate that 90.8% of OOP payments in the
Table 4 Correlates of financial catastrophe among householdsIndependent variables* Odds ratio (95%CI) for incurring financial catastrophe at different thresholds
5% 10% 15% 20%
Poorest/first quintile 3.7 (2.8, 5) 3.7 (2.6, 5.3) 7.8 (4.5, 14.5) 47 (12.2, 397.2)
(Least poor/fifth quintile) p<0.05 p<0.05 p<0.05 p<0.05**
Below poverty line card holders 1.5 (1.1, 2) 1.9 (1.4, 2.6) 2.3 (1.6, 3.3) 2.7 (1.8, 4)
(Above poverty line card holders) p<0.05 p<0.05 p<0.05 p<0.05
Government sector*** 0.9 (0.7, 1.1) 1 (0.8, 1.3) 1.2 (0.9, 1.7) 1.4 (1, 2)
(Private sector) p=0.44 p=0.89 p=0.16 p=0.05
Super-specialty hospitals 1.9 (1.5, 2.4) 2.1 (1.6, 2.8) 2.3 (1.7, 3.2) 2.3 (1.6, 3.4)
(Clinics/Health centres) p<0.05 p<0.05 p<0.05 p<0.05
Referral hospitals 1.6 (1.3, 1.9) 1.5 (1.2, 1.9) 1.6 (1.7, 3.2) 1.5 (1.1, 2.1)
(Clinics/Health centres) p<0.05 p<0.05 p<0.05 p<0.05
Households with four or less members 1.5 (1.3, 1.8) 1.8 (1.5, 2.2) 2.2 (1.7, 2.8) 2.2 (1.7, 2.9)
(Households with more than four members) p<0.05 p<0.05 p<0.05 p<0.05
*Comparator is provided in the bracket. **Fisher exact p value. ***173 households whose members exhibited mixed health seeking behavior (i.e. usinggovernment as well as private sector as place for consultation) were dropped from the analysis.
Table 5 Impact of OOP payments for outpatient care on povertyMeasures of poverty Gross of OOP
payments (1)Net of OOPpayments (2)
Difference
Absolute (3=2-1) Relative (3/1)*100
Poverty headcount ratio (95%CI) 1% (0.7, 1.3) 1.8% (1.4, 2.2) 0.9% 91.6%
Standard error 0.002 0.002
Mean Poverty gap (INR) (95%CI) 2.4 (1.48, 3.27) 19.5 (−5.26, 44.32) 17.2 724.1%
Standard error 0.457 12.643
Normalised poverty gap (INR) (95%CI) 0.4% (0.246, 0.545) 3.3% (−0.876, 7.390) 2.9% 724.6%
Standard error 0.076 2.108
Mean positive poverty gap (INR) (95%CI) 242.4 (191.8, 293.1) 1039.3 (−289.3, 2367.9) 796.9 328.7%
Standard error 24.963 666.160
Normalised mean positive poverty gap (95%CI) 40.4% (31.99, 48.87) 173.3% (−48.24, 394.88) 132.9% 328.7%
Standard error 4.163 111.090
Bhojani et al. BMC Public Health 2012, 12:990 Page 9 of 13http://www.biomedcentral.com/1471-2458/12/990
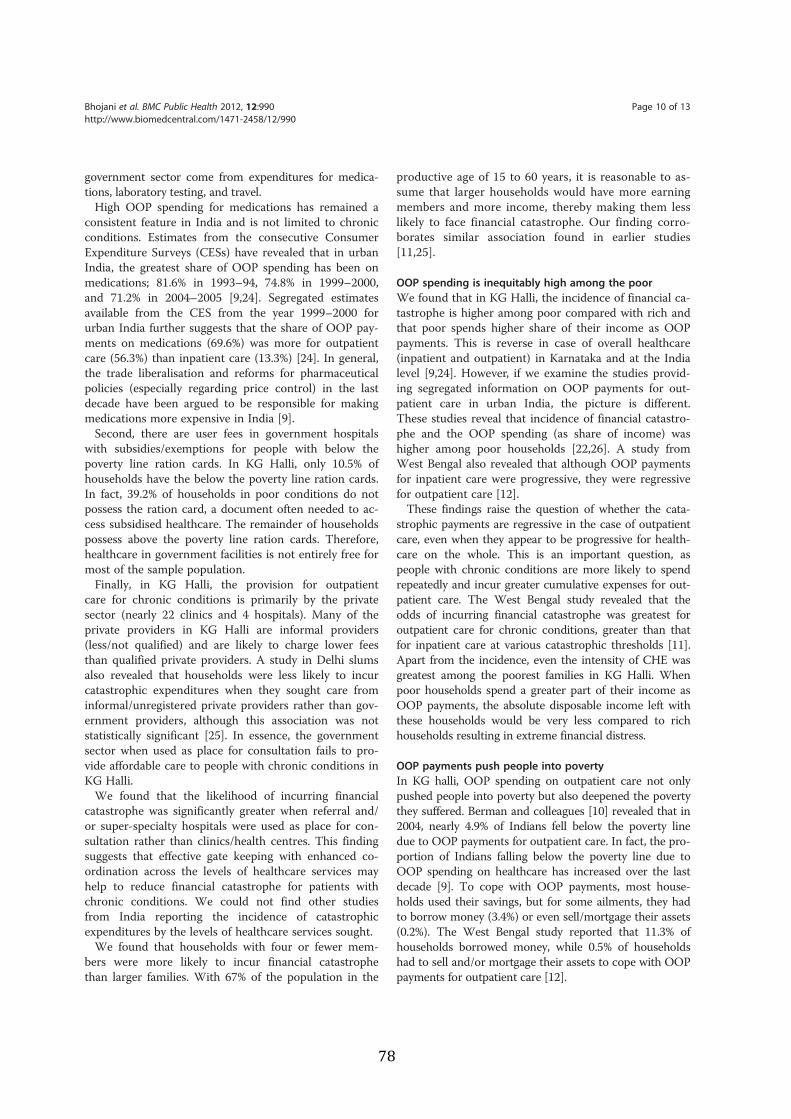
government sector come from expenditures for medica-tions, laboratory testing, and travel.High OOP spending for medications has remained a
consistent feature in India and is not limited to chronicconditions. Estimates from the consecutive ConsumerExpenditure Surveys (CESs) have revealed that in urbanIndia, the greatest share of OOP spending has been onmedications; 81.6% in 1993–94, 74.8% in 1999–2000,and 71.2% in 2004–2005 [9,24]. Segregated estimatesavailable from the CES from the year 1999–2000 forurban India further suggests that the share of OOP pay-ments on medications (69.6%) was more for outpatientcare (56.3%) than inpatient care (13.3%) [24]. In general,the trade liberalisation and reforms for pharmaceuticalpolicies (especially regarding price control) in the lastdecade have been argued to be responsible for makingmedications more expensive in India [9].Second, there are user fees in government hospitals
with subsidies/exemptions for people with below thepoverty line ration cards. In KG Halli, only 10.5% ofhouseholds have the below the poverty line ration cards.In fact, 39.2% of households in poor conditions do notpossess the ration card, a document often needed to ac-cess subsidised healthcare. The remainder of householdspossess above the poverty line ration cards. Therefore,healthcare in government facilities is not entirely free formost of the sample population.Finally, in KG Halli, the provision for outpatient
care for chronic conditions is primarily by the privatesector (nearly 22 clinics and 4 hospitals). Many of theprivate providers in KG Halli are informal providers(less/not qualified) and are likely to charge lower feesthan qualified private providers. A study in Delhi slumsalso revealed that households were less likely to incurcatastrophic expenditures when they sought care frominformal/unregistered private providers rather than gov-ernment providers, although this association was notstatistically significant [25]. In essence, the governmentsector when used as place for consultation fails to pro-vide affordable care to people with chronic conditions inKG Halli.We found that the likelihood of incurring financial
catastrophe was significantly greater when referral and/or super-specialty hospitals were used as place for con-sultation rather than clinics/health centres. This findingsuggests that effective gate keeping with enhanced co-ordination across the levels of healthcare services mayhelp to reduce financial catastrophe for patients withchronic conditions. We could not find other studiesfrom India reporting the incidence of catastrophicexpenditures by the levels of healthcare services sought.We found that households with four or fewer mem-
bers were more likely to incur financial catastrophethan larger families. With 67% of the population in the
productive age of 15 to 60 years, it is reasonable to as-sume that larger households would have more earningmembers and more income, thereby making them lesslikely to face financial catastrophe. Our finding corro-borates similar association found in earlier studies[11,25].
OOP spending is inequitably high among the poorWe found that in KG Halli, the incidence of financial ca-tastrophe is higher among poor compared with rich andthat poor spends higher share of their income as OOPpayments. This is reverse in case of overall healthcare(inpatient and outpatient) in Karnataka and at the Indialevel [9,24]. However, if we examine the studies provid-ing segregated information on OOP payments for out-patient care in urban India, the picture is different.These studies reveal that incidence of financial catastro-phe and the OOP spending (as share of income) washigher among poor households [22,26]. A study fromWest Bengal also revealed that although OOP paymentsfor inpatient care were progressive, they were regressivefor outpatient care [12].These findings raise the question of whether the cata-
strophic payments are regressive in the case of outpatientcare, even when they appear to be progressive for health-care on the whole. This is an important question, aspeople with chronic conditions are more likely to spendrepeatedly and incur greater cumulative expenses for out-patient care. The West Bengal study revealed that theodds of incurring financial catastrophe was greatest foroutpatient care for chronic conditions, greater than thatfor inpatient care at various catastrophic thresholds [11].Apart from the incidence, even the intensity of CHE wasgreatest among the poorest families in KG Halli. Whenpoor households spend a greater part of their income asOOP payments, the absolute disposable income left withthese households would be very less compared to richhouseholds resulting in extreme financial distress.
OOP payments push people into povertyIn KG halli, OOP spending on outpatient care not onlypushed people into poverty but also deepened the povertythey suffered. Berman and colleagues [10] revealed that in2004, nearly 4.9% of Indians fell below the poverty linedue to OOP payments for outpatient care. In fact, the pro-portion of Indians falling below the poverty line due toOOP spending on healthcare has increased over the lastdecade [9]. To cope with OOP payments, most house-holds used their savings, but for some ailments, they hadto borrow money (3.4%) or even sell/mortgage their assets(0.2%). The West Bengal study reported that 11.3% ofhouseholds borrowed money, while 0.5% of householdshad to sell and/or mortgage their assets to cope with OOPpayments for outpatient care [12].
Bhojani et al. BMC Public Health 2012, 12:990 Page 10 of 13http://www.biomedcentral.com/1471-2458/12/990
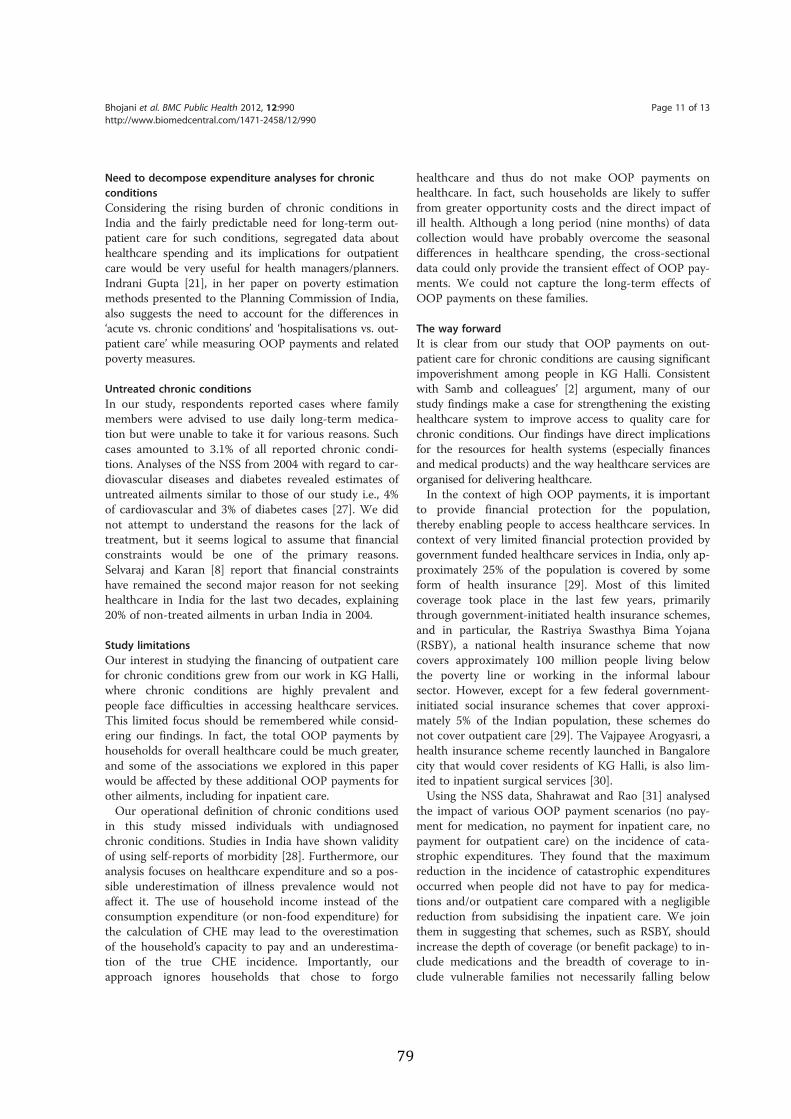
Need to decompose expenditure analyses for chronicconditionsConsidering the rising burden of chronic conditions inIndia and the fairly predictable need for long-term out-patient care for such conditions, segregated data abouthealthcare spending and its implications for outpatientcare would be very useful for health managers/planners.Indrani Gupta [21], in her paper on poverty estimationmethods presented to the Planning Commission of India,also suggests the need to account for the differences in‘acute vs. chronic conditions’ and ‘hospitalisations vs. out-patient care’ while measuring OOP payments and relatedpoverty measures.
Untreated chronic conditionsIn our study, respondents reported cases where familymembers were advised to use daily long-term medica-tion but were unable to take it for various reasons. Suchcases amounted to 3.1% of all reported chronic condi-tions. Analyses of the NSS from 2004 with regard to car-diovascular diseases and diabetes revealed estimates ofuntreated ailments similar to those of our study i.e., 4%of cardiovascular and 3% of diabetes cases [27]. We didnot attempt to understand the reasons for the lack oftreatment, but it seems logical to assume that financialconstraints would be one of the primary reasons.Selvaraj and Karan [8] report that financial constraintshave remained the second major reason for not seekinghealthcare in India for the last two decades, explaining20% of non-treated ailments in urban India in 2004.
Study limitationsOur interest in studying the financing of outpatient carefor chronic conditions grew from our work in KG Halli,where chronic conditions are highly prevalent andpeople face difficulties in accessing healthcare services.This limited focus should be remembered while consid-ering our findings. In fact, the total OOP payments byhouseholds for overall healthcare could be much greater,and some of the associations we explored in this paperwould be affected by these additional OOP payments forother ailments, including for inpatient care.Our operational definition of chronic conditions used
in this study missed individuals with undiagnosedchronic conditions. Studies in India have shown validityof using self-reports of morbidity [28]. Furthermore, ouranalysis focuses on healthcare expenditure and so a pos-sible underestimation of illness prevalence would notaffect it. The use of household income instead of theconsumption expenditure (or non-food expenditure) forthe calculation of CHE may lead to the overestimationof the household’s capacity to pay and an underestima-tion of the true CHE incidence. Importantly, ourapproach ignores households that chose to forgo
healthcare and thus do not make OOP payments onhealthcare. In fact, such households are likely to sufferfrom greater opportunity costs and the direct impact ofill health. Although a long period (nine months) of datacollection would have probably overcome the seasonaldifferences in healthcare spending, the cross-sectionaldata could only provide the transient effect of OOP pay-ments. We could not capture the long-term effects ofOOP payments on these families.
The way forwardIt is clear from our study that OOP payments on out-patient care for chronic conditions are causing significantimpoverishment among people in KG Halli. Consistentwith Samb and colleagues’ [2] argument, many of ourstudy findings make a case for strengthening the existinghealthcare system to improve access to quality care forchronic conditions. Our findings have direct implicationsfor the resources for health systems (especially financesand medical products) and the way healthcare services areorganised for delivering healthcare.In the context of high OOP payments, it is important
to provide financial protection for the population,thereby enabling people to access healthcare services. Incontext of very limited financial protection provided bygovernment funded healthcare services in India, only ap-proximately 25% of the population is covered by someform of health insurance [29]. Most of this limitedcoverage took place in the last few years, primarilythrough government-initiated health insurance schemes,and in particular, the Rastriya Swasthya Bima Yojana(RSBY), a national health insurance scheme that nowcovers approximately 100 million people living belowthe poverty line or working in the informal laboursector. However, except for a few federal government-initiated social insurance schemes that cover approxi-mately 5% of the Indian population, these schemes donot cover outpatient care [29]. The Vajpayee Arogyasri, ahealth insurance scheme recently launched in Bangalorecity that would cover residents of KG Halli, is also lim-ited to inpatient surgical services [30].Using the NSS data, Shahrawat and Rao [31] analysed
the impact of various OOP payment scenarios (no pay-ment for medication, no payment for inpatient care, nopayment for outpatient care) on the incidence of cata-strophic expenditures. They found that the maximumreduction in the incidence of catastrophic expendituresoccurred when people did not have to pay for medica-tions and/or outpatient care compared with a negligiblereduction from subsidising the inpatient care. We jointhem in suggesting that schemes, such as RSBY, shouldincrease the depth of coverage (or benefit package) to in-clude medications and the breadth of coverage to in-clude vulnerable families not necessarily falling below
Bhojani et al. BMC Public Health 2012, 12:990 Page 11 of 13http://www.biomedcentral.com/1471-2458/12/990
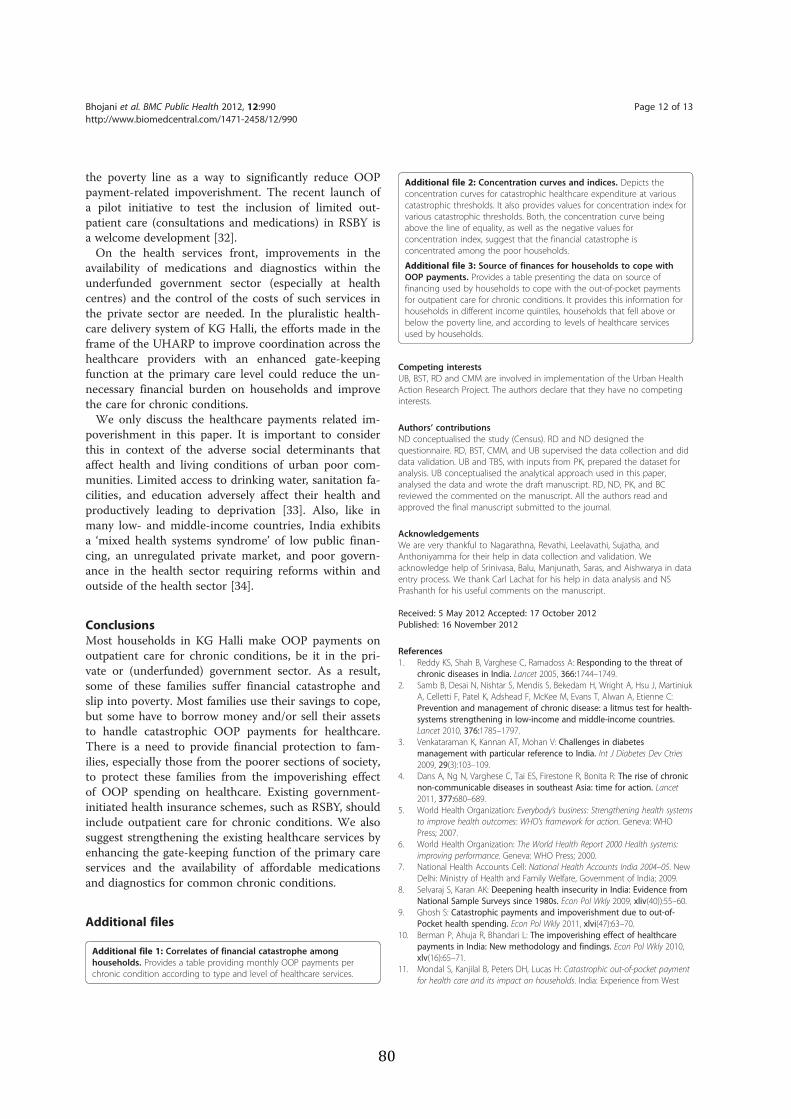
the poverty line as a way to significantly reduce OOPpayment-related impoverishment. The recent launch ofa pilot initiative to test the inclusion of limited out-patient care (consultations and medications) in RSBY isa welcome development [32].On the health services front, improvements in the
availability of medications and diagnostics within theunderfunded government sector (especially at healthcentres) and the control of the costs of such services inthe private sector are needed. In the pluralistic health-care delivery system of KG Halli, the efforts made in theframe of the UHARP to improve coordination across thehealthcare providers with an enhanced gate-keepingfunction at the primary care level could reduce the un-necessary financial burden on households and improvethe care for chronic conditions.We only discuss the healthcare payments related im-
poverishment in this paper. It is important to considerthis in context of the adverse social determinants thataffect health and living conditions of urban poor com-munities. Limited access to drinking water, sanitation fa-cilities, and education adversely affect their health andproductively leading to deprivation [33]. Also, like inmany low- and middle-income countries, India exhibitsa ‘mixed health systems syndrome’ of low public finan-cing, an unregulated private market, and poor govern-ance in the health sector requiring reforms within andoutside of the health sector [34].
ConclusionsMost households in KG Halli make OOP payments onoutpatient care for chronic conditions, be it in the pri-vate or (underfunded) government sector. As a result,some of these families suffer financial catastrophe andslip into poverty. Most families use their savings to cope,but some have to borrow money and/or sell their assetsto handle catastrophic OOP payments for healthcare.There is a need to provide financial protection to fam-ilies, especially those from the poorer sections of society,to protect these families from the impoverishing effectof OOP spending on healthcare. Existing government-initiated health insurance schemes, such as RSBY, shouldinclude outpatient care for chronic conditions. We alsosuggest strengthening the existing healthcare services byenhancing the gate-keeping function of the primary careservices and the availability of affordable medicationsand diagnostics for common chronic conditions.
Additional files
Additional file 1: Correlates of financial catastrophe amonghouseholds. Provides a table providing monthly OOP payments perchronic condition according to type and level of healthcare services.
Additional file 2: Concentration curves and indices. Depicts theconcentration curves for catastrophic healthcare expenditure at variouscatastrophic thresholds. It also provides values for concentration index forvarious catastrophic thresholds. Both, the concentration curve beingabove the line of equality, as well as the negative values forconcentration index, suggest that the financial catastrophe isconcentrated among the poor households.
Additional file 3: Source of finances for households to cope withOOP payments. Provides a table presenting the data on source offinancing used by households to cope with the out-of-pocket paymentsfor outpatient care for chronic conditions. It provides this information forhouseholds in different income quintiles, households that fell above orbelow the poverty line, and according to levels of healthcare servicesused by households.
Competing interestsUB, BST, RD and CMM are involved in implementation of the Urban HealthAction Research Project. The authors declare that they have no competinginterests.
Authors’ contributionsND conceptualised the study (Census). RD and ND designed thequestionnaire. RD, BST, CMM, and UB supervised the data collection and diddata validation. UB and TBS, with inputs from PK, prepared the dataset foranalysis. UB conceptualised the analytical approach used in this paper,analysed the data and wrote the draft manuscript. RD, ND, PK, and BCreviewed the commented on the manuscript. All the authors read andapproved the final manuscript submitted to the journal.
AcknowledgementsWe are very thankful to Nagarathna, Revathi, Leelavathi, Sujatha, andAnthoniyamma for their help in data collection and validation. Weacknowledge help of Srinivasa, Balu, Manjunath, Saras, and Aishwarya in dataentry process. We thank Carl Lachat for his help in data analysis and NSPrashanth for his useful comments on the manuscript.
Received: 5 May 2012 Accepted: 17 October 2012Published: 16 November 2012
References1. Reddy KS, Shah B, Varghese C, Ramadoss A: Responding to the threat of
chronic diseases in India. Lancet 2005, 366:1744–1749.2. Samb B, Desai N, Nishtar S, Mendis S, Bekedam H, Wright A, Hsu J, Martiniuk
A, Celletti F, Patel K, Adshead F, McKee M, Evans T, Alwan A, Etienne C:Prevention and management of chronic disease: a litmus test for health-systems strengthening in low-income and middle-income countries.Lancet 2010, 376:1785–1797.
3. Venkataraman K, Kannan AT, Mohan V: Challenges in diabetesmanagement with particular reference to India. Int J Diabetes Dev Ctries2009, 29(3):103–109.
4. Dans A, Ng N, Varghese C, Tai ES, Firestone R, Bonita R: The rise of chronicnon-communicable diseases in southeast Asia: time for action. Lancet2011, 377:680–689.
5. World Health Organization: Everybody’s business: Strengthening health systemsto improve health outcomes: WHO's framework for action. Geneva: WHOPress; 2007.
6. World Health Organization: The World Health Report 2000 Health systems:improving performance. Geneva: WHO Press; 2000.
7. National Health Accounts Cell: National Health Accounts India 2004–05. NewDelhi: Ministry of Health and Family Welfare, Government of India; 2009.
8. Selvaraj S, Karan AK: Deepening health insecurity in India: Evidence fromNational Sample Surveys since 1980s. Econ Pol Wkly 2009, xliv(40)):55–60.
9. Ghosh S: Catastrophic payments and impoverishment due to out-of-Pocket health spending. Econ Pol Wkly 2011, xlvi(47):63–70.
10. Berman P, Ahuja R, Bhandari L: The impoverishing effect of healthcarepayments in India: New methodology and findings. Econ Pol Wkly 2010,xlv(16):65–71.
11. Mondal S, Kanjilal B, Peters DH, Lucas H: Catastrophic out-of-pocket paymentfor health care and its impact on households. India: Experience from West
Bhojani et al. BMC Public Health 2012, 12:990 Page 12 of 13http://www.biomedcentral.com/1471-2458/12/990

Bengal; http://www.chronicpoverty.org/uploads/publication_files/mondal_et_al_health.pdf, (accessed 1 April 2012).
12. Kanjilal B, Mukherjee M, SIngh S, Mondal S, Barman D, Mandal A: Health,equity and poverty: exploring the links in West Bengal. India: ResearchMonograph India Series Future Health Systems; 2007:1–53. http://futurehealthsys.squarespace.com/storage/WP420final1.pdf, (accessed1 April 2012.
13. Institute of Public Health: KG Halli Census: preliminary findings. Bangalore:Institute of Public Health; 2010.
14. National Building Organisation: Report of the committee on slum statistics/census. New Delhi: Ministry of Housing and Urban Poverty, Government ofIndia; 2010. www.mhupa.gov.in/W_new/Slum_Report_NBO.pdf, (accessed1 April 2012).
15. Institute of Public Health: Action research on urban health. Bangalore:Institute of Public Health; http://www.iphindia.org/research-4/health-service/urban-health-2.
16. Xu K, Evans DB, Kawabata K, Zeramdini R, Klavus J, Murray CJL: Householdcatastrophic health expenditure: a multicountry analysis. Lancet 2003,362(9378):111–117.
17. O’Donnell O, Van Doorslaer E, Wagstaff A, Lindelow M: Analyzing healthequity using household survey data: A guide to techniques and theirimplementation. Washington DC: The World Bank; 2008.
18. Van Doorslaer E, O’Donnell O, Rannan-Eliya RP, Somanathan A, Adhikari SR,Garg CC, Harbianto D, Herrin AN, Huq MN, Ibragimova S, Karan A, Ng CW,Pande BR, Racelis R, Tao S, Tin K, Tisayaticom K, Trisnantoro L, Vasavid C,Zhao Y: Effect of payments for health care on poverty estimates in 11countries in Asia: an analysis of household survey data. Lancet 2006, 368(9544):1357–1364.
19. Robert Wood Johnson Foundation: Johns Hopkins University: ChronicConditions: Making the Case for Ongoing Care; 2004. Update. [http://www.rwjf.org/files/research/Chronic%20Conditions%20Chartbook%209-2004.ppt],(accessed 1 April 2012).
20. National Center for Health Statistics, Jabin TB: Repoting chronic conditionsin the National Health Interview Survey: A review of tendencies fromevaluation studies and methodological test. In Vital and Health StatisticsData Evaluation and Methods Research Series 2, No. 105. Washington: DHHSPub. No. (PHS) 87–1379. U.S. Government Printing Office; 1987:1–45.
21. Gupta I: Out-of-pocket expenditures and poverty: Estimates from NSS 61st
round. www.planningcommission.nic.in/reports/genrep/indrani.pdf,(accessed 1 April 2012).
22. Vaishnavi SD, Dash U: Catastrophic payments for health care amonghouseholds in urban Tamil Nadu, India. J Int Dev 2009, 21:169–184.
23. Kotwani A, Ewen M, Dey D, Iyer S, Lakshmi PK, Patel A, Raman K, Singhal GL,Thawani V, Tripathi S, Laing R: Prices & availability of common medicinesat six sites in India using a standard methodology. Indian J Med Res 2007,125(5):645–654.
24. Garg CC, Karan AK: Reducing out-of-pocket expenditures to reducepoverty: a disaggregated analysis at rural–urban and state level in India.Health Policy Plan 2009, 24:116–128.
25. Chowdhury S: Health shocks and urban poor: a case study of slums inDelhi. In 5th Annual Conference on Economic Growth and Development. NewDelhi: Indian Statistical Institute; 2009. http://www.isid.ac.in/~pu/conference/dec_09_conf/Papers/SamikChowdhury.pdf, (accessed 1 April 2012).
26. Yip W, Mahal A: The health care systems of China and India: performanceand future challenges. Health Aff 2008, 27(4):921–932.
27. Rao KD, Bhatnagar A, Murphy A: Socio-economic inequalities in thefinancing of cardiovascular & diabetes inpatient treatment in India.Indian J Med Res 2011, 133(1):57–63.
28. Subramanian SV, Subramanyam MA, Selvaraj S, Kawachi I: Are self-reportsof health and morbidities in developing countries misleading? Evidencefrom India. Soc Sci Med 2009, 68(2):260–265.
29. Reddy S, Selvaraj S, Rao KD, Chokshi M, Kumar P, Arora V, Bhokare S,Ganguly I: A critical assessment of the existing health insurance models inIndia. www.planningcommission.nic.in/reports/sereport/ser/ser_heal1305.pdf, (accessed 1 April 2012).
30. Staff reporter: Vajpayee Arogyasri extended to BBMP areas. The Hindu. http://www.thehindu.com/news/cities/bangalore/article2745177.ece, (accessed 1April 2012).
31. Shahrawat R, Rao KD: Insured yet vulnerable: out-of-pocket payments andIndia's poor. Health Policy Plan; 2011:1–9. http://heapol.oxfordjournals.org/
content/early/2011/04/12/heapol.czr029.full.pdf+html, (accessed1 April 2012).
32. Providing outpatient healthcare to complement Rashtriya Swasthya BimaYojana (RSBY): India’s National Health Insurance Scheme. http://rsby.gov.in/Documents.aspx?ID=16#sub84, (accessed 1 April 2012).
33. Agarwal S: The state of urban health in India: comparing the poorestquartile to the rest of the urban population in selected states and cities.Environ Urban 2011, 23(1):13–28.
34. Nishtar S: The mixed health systems syndrome. Bull World Health Organ2010, 88(1):74–75.
doi:10.1186/1471-2458-12-990Cite this article as: Bhojani et al.: Out-of-pocket healthcare payments onchronic conditions impoverish urban poor in Bangalore, India. BMCPublic Health 2012 12:990.
Submit your next manuscript to BioMed Centraland take full advantage of:
• Convenient online submission
• Thorough peer review
• No space constraints or color figure charges
• Immediate publication on acceptance
• Inclusion in PubMed, CAS, Scopus and Google Scholar
• Research which is freely available for redistribution
Submit your manuscript at www.biomedcentral.com/submit
Bhojani et al. BMC Public Health 2012, 12:990 Page 13 of 13http://www.biomedcentral.com/1471-2458/12/990
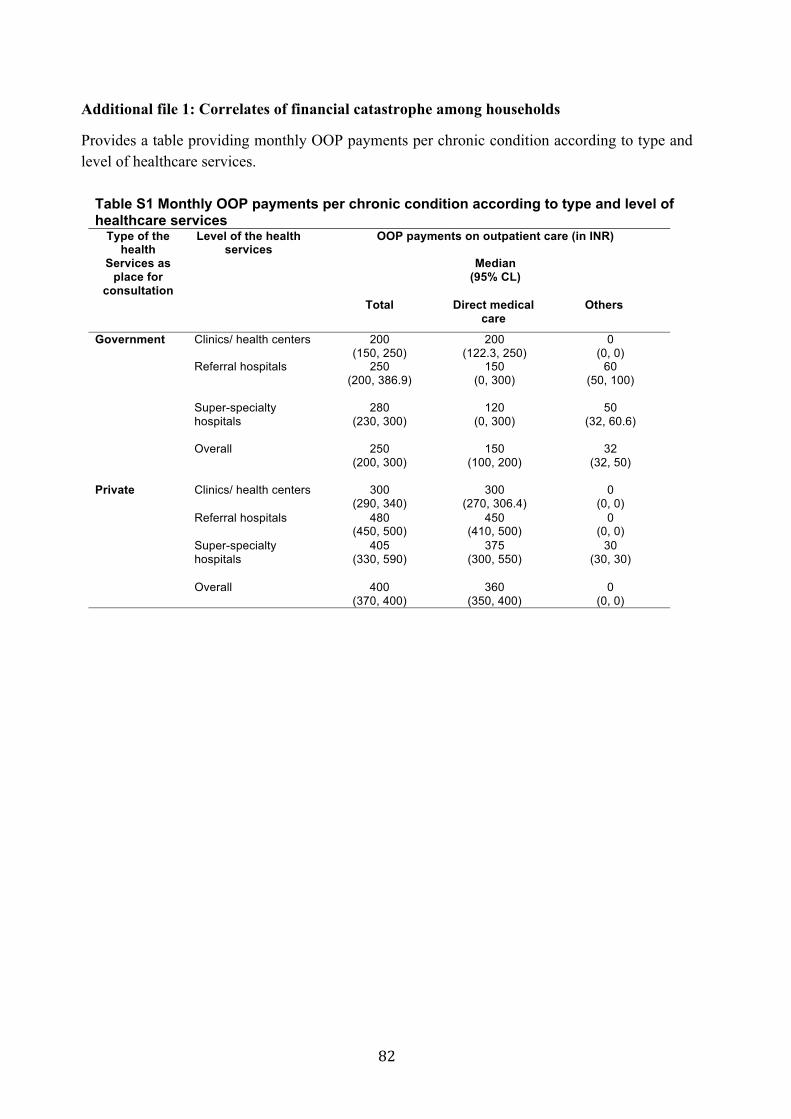
Additional file 1: Correlates of financial catastrophe among households
Provides a table providing monthly OOP payments per chronic condition according to type and level of healthcare services.
Table S1 Monthly OOP payments per chronic condition according to type and level of healthcare services
Type of the health
Services as place for
consultation
Level of the health services
OOP payments on outpatient care (in INR)
Median (95% CL)
Total Direct medical care
Others
Government Clinics/ health centers 200 (150, 250)
200 (122.3, 250)
0 (0, 0)
Referral hospitals 250 (200, 386.9)
150 (0, 300)
60 (50, 100)
Super-specialty hospitals
280 (230, 300)
120 (0, 300)
50 (32, 60.6)
Overall 250 (200, 300)
150 (100, 200)
32 (32, 50)
Private Clinics/ health centers 300 (290, 340)
300 (270, 306.4)
0 (0, 0)
Referral hospitals 480 (450, 500)
450 (410, 500)
0 (0, 0)
Super-specialty hospitals
405 (330, 590)
375 (300, 550)
30 (30, 30)
Overall 400(370, 400)
360 (350, 400)
0 (0, 0)
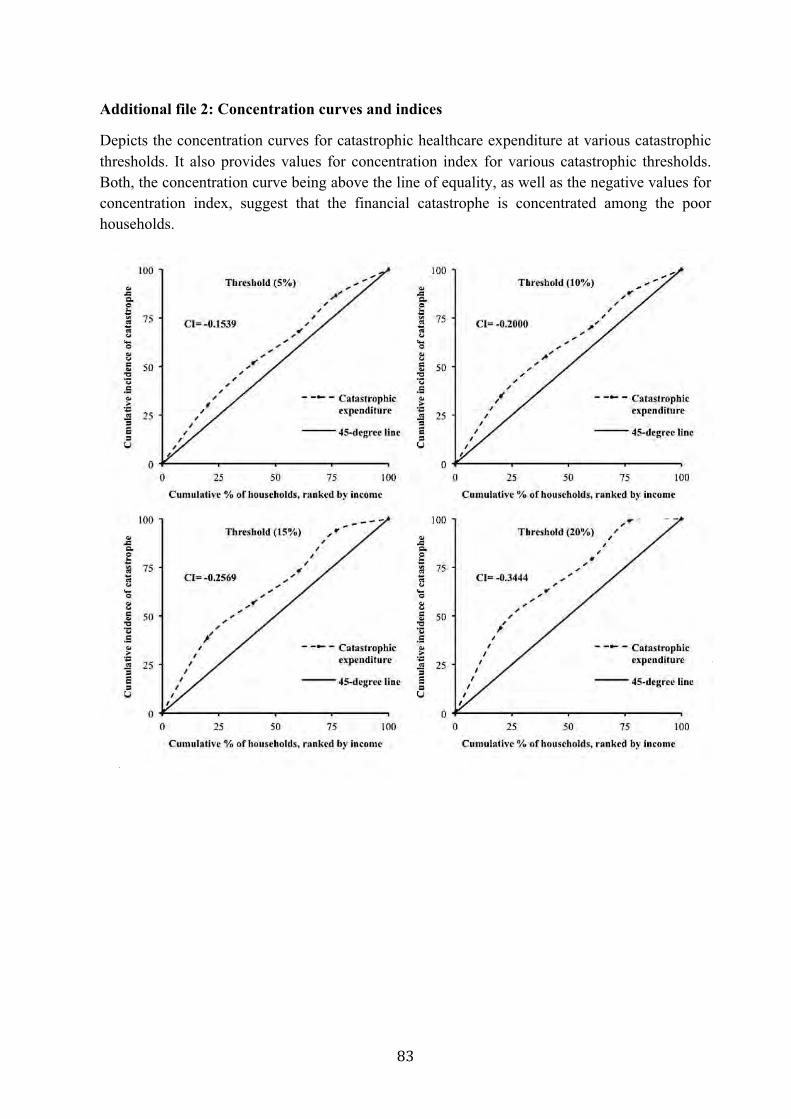
Additional file 2: Concentration curves and indices
Depicts the concentration curves for catastrophic healthcare expenditure at various catastrophic thresholds. It also provides values for concentration index for various catastrophic thresholds. Both, the concentration curve being above the line of equality, as well as the negative values for concentration index, suggest that the financial catastrophe is concentrated among the poor households.

Additional file 3: Source of finances for households to cope with OOP payments
Provides a table presenting the data on source of financing used by households to cope with the out-of-pocket payments for outpatient care for chronic conditions. It provides this information for households in different income quintiles, households that fell above or below the poverty line, and according to levels of healthcare services used by households.
Table S2 Source of finances for households to cope with OOP payments Independent variables Percentage distribution of households
according to source of finance [n (%)]* From
savings From
borrowing money
From selling or mortgaging of
assets
Income 1st quintile 449 (91.5) 41 (8.4) 4 (0.8)
2nd quintile 457 (96) 23 (4.8) 2 (0.4)
3rd quintile 487 (97) 15 (3) 1 (0.2)
4th quintile 426 (97) 14 (3.2) 1 (0.2)
5th quintile 621 (98.9) 9 (1.4) 0 (0)
Type of the health services as place for consultation
Government 484 (94) 29 (5.6) 4 (0.8)
Private 2001 (96.5) 80 (3.9) 5 (0.2)
Levels of the health services
Clinics/Health centers
1035 (97) 36 (3.4) 3 (0.3)
Hospitals 972 (96.7) 35 (3.5) 4 (0.4)
Super-specialty hospitals
478 (92.6) 38 (7.5) 2 (0.4)
Overall 2494 (96) 109 (4.2) 9 (0.4)
*Total may cross 100% due to multiple responses (sources of finance) by single household.
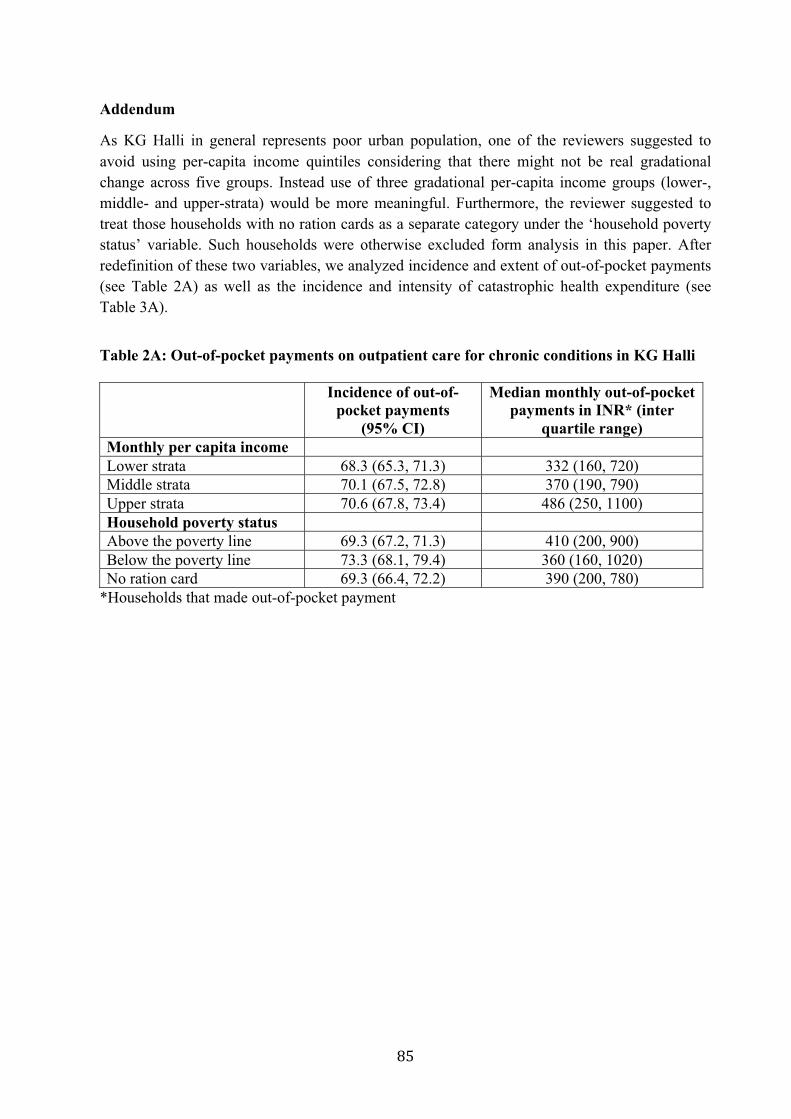
Addendum
As KG Halli in general represents poor urban population, one of the reviewers suggested to avoid using per-capita income quintiles considering that there might not be real gradational change across five groups. Instead use of three gradational per-capita income groups (lower-, middle- and upper-strata) would be more meaningful. Furthermore, the reviewer suggested to treat those households with no ration cards as a separate category under the ‘household poverty status’ variable. Such households were otherwise excluded form analysis in this paper. After redefinition of these two variables, we analyzed incidence and extent of out-of-pocket payments (see Table 2A) as well as the incidence and intensity of catastrophic health expenditure (see Table 3A).
Table 2A: Out-of-pocket payments on outpatient care for chronic conditions in KG Halli Incidence of out-of-
pocket payments (95% CI)
Median monthly out-of-pocket payments in INR* (inter
quartile range) Monthly per capita income Lower strata 68.3 (65.3, 71.3) 332 (160, 720) Middle strata 70.1 (67.5, 72.8) 370 (190, 790) Upper strata 70.6 (67.8, 73.4) 486 (250, 1100) Household poverty status Above the poverty line 69.3 (67.2, 71.3) 410 (200, 900) Below the poverty line 73.3 (68.1, 79.4) 360 (160, 1020) No ration card 69.3 (66.4, 72.2) 390 (200, 780)
*Households that made out-of-pocket payment
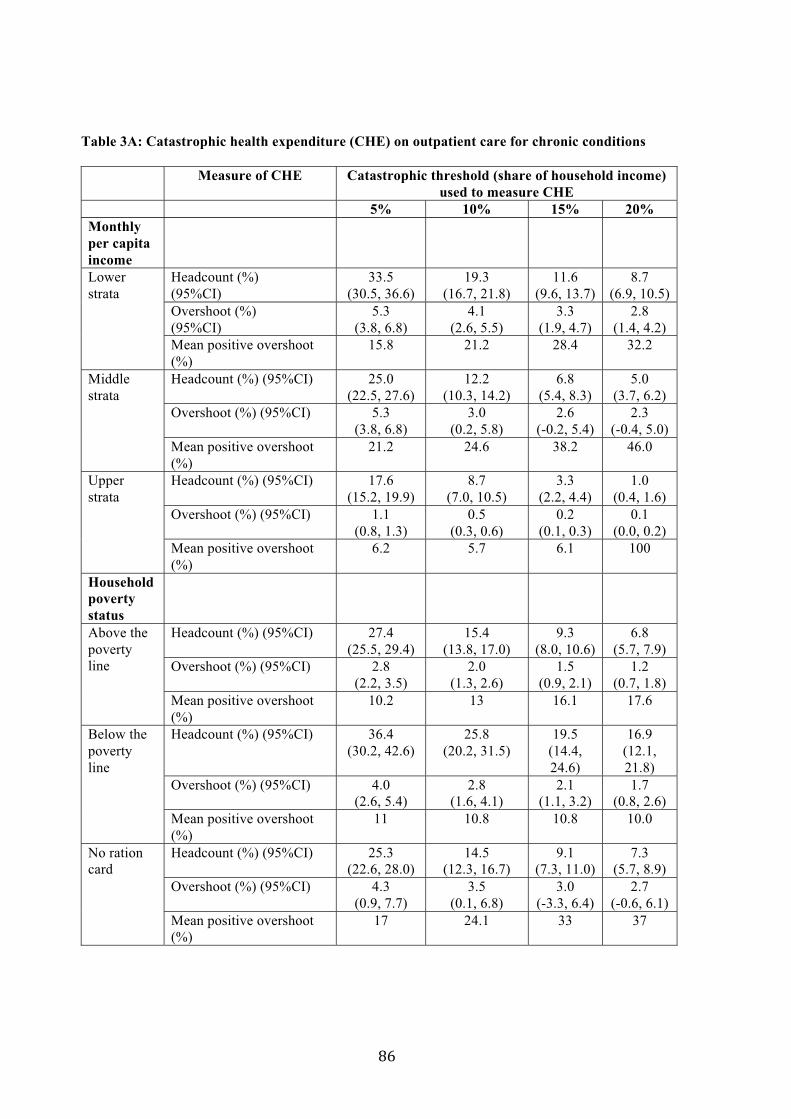
Table 3A: Catastrophic health expenditure (CHE) on outpatient care for chronic conditions
Measure of CHE Catastrophic threshold (share of household income) used to measure CHE
5% 10% 15% 20%Monthly per capita income Lower strata
Headcount (%) (95%CI)
33.5 (30.5, 36.6)
19.3 (16.7, 21.8)
11.6 (9.6, 13.7)
8.7 (6.9, 10.5)
Overshoot (%) (95%CI)
5.3 (3.8, 6.8)
4.1 (2.6, 5.5)
3.3 (1.9, 4.7)
2.8 (1.4, 4.2)
Mean positive overshoot (%)
15.8 21.2 28.4 32.2
Middle strata
Headcount (%) (95%CI) 25.0 (22.5, 27.6)
12.2 (10.3, 14.2)
6.8 (5.4, 8.3)
5.0 (3.7, 6.2)
Overshoot (%) (95%CI) 5.3 (3.8, 6.8)
3.0 (0.2, 5.8)
2.6 (-0.2, 5.4)
2.3 (-0.4, 5.0)
Mean positive overshoot (%)
21.2 24.6 38.2 46.0
Upper strata
Headcount (%) (95%CI) 17.6 (15.2, 19.9)
8.7 (7.0, 10.5)
3.3 (2.2, 4.4)
1.0 (0.4, 1.6)
Overshoot (%) (95%CI) 1.1 (0.8, 1.3)
0.5 (0.3, 0.6)
0.2 (0.1, 0.3)
0.1 (0.0, 0.2)
Mean positive overshoot (%)
6.2 5.7 6.1 100
Household poverty status Above the poverty line
Headcount (%) (95%CI) 27.4 (25.5, 29.4)
15.4 (13.8, 17.0)
9.3 (8.0, 10.6)
6.8 (5.7, 7.9)
Overshoot (%) (95%CI) 2.8 (2.2, 3.5)
2.0 (1.3, 2.6)
1.5 (0.9, 2.1)
1.2 (0.7, 1.8)
Mean positive overshoot (%)
10.2 13 16.1 17.6
Below the poverty line
Headcount (%) (95%CI) 36.4 (30.2, 42.6)
25.8 (20.2, 31.5)
19.5 (14.4, 24.6)
16.9 (12.1, 21.8)
Overshoot (%) (95%CI) 4.0 (2.6, 5.4)
2.8 (1.6, 4.1)
2.1 (1.1, 3.2)
1.7 (0.8, 2.6)
Mean positive overshoot (%)
11 10.8 10.8 10.0
No ration card
Headcount (%) (95%CI) 25.3 (22.6, 28.0)
14.5 (12.3, 16.7)
9.1 (7.3, 11.0)
7.3 (5.7, 8.9)
Overshoot (%) (95%CI) 4.3 (0.9, 7.7)
3.5 (0.1, 6.8)
3.0 (-3.3, 6.4)
2.7 (-0.6, 6.1)
Mean positive overshoot (%)
17 24.1 33 37

In this paper, we analyzed healthcare expenditure for households having one or more persons living with chronic condition. There was a high level of comorbidity associated with diabetes and hypertension, two commonly reported ailments in KG Halli. The presence of an additional chronic condition was reported by 57.4% of people with diabetes and 43% of people with hypertension. The self reported healthcare expenditure captured in our survey was for a single visit to care provider and associated diagnostic and medications for 30 days, not differentiated for specific ailments in case of comorbidities. Furthermore, the indicators such as catastrophic health expenditure is calculated using household as a unit – and so in some cases there will be additional expenditure incurred by family member on a chronic condition other than diabetes or hypertension reflected in healthcare expenditure by households reporting diabetes. This would lead to overestimation of such indicator. Hence, it is primarily due to imitations in our data and methodological issues that we did not analyze expenditure separately for diabetes and hypertension in this paper.
However, keeping these limitations in mind and based on suggestion of one of the reviewers, we have now analyzed out-of-pocket payment and catastrophic health expenditure separately for households reporting diabetes and hypertension. See Table 2B (incidence of and median out-of-pocket payments for diabetes and hypertension), and Table 3B (incidence of catastrophic health expenditure for diabetes and hypertension).
Table 2B: Out-of-pocket payments on outpatient care for diabetes and hypertension in KG Halli Incidence of out-of-
pocket payments (95% CI)
Median monthly out-of-pocket payments in INR*
(inter quartile range)
Dia
bete
s
Monthly per capita income Lower strata 75.9 (71.7, 80.1) 530 (300, 980) Middle strata 73.8 (70.1, 77.5) 500 (300, 1075) Upper strata 72.6 (68.8, 76.3) 750 (400, 1450) Household poverty status Above the poverty line 73.1 (70.3, 75.8) 650 (340, 1200) Below the poverty line 70.4 (71.2, 87.6) 540 (300, 1180) No ration card 73.9 (69.8, 78.0) 514 (300, 1080)
Hyp
erte
nsio
n
Monthly per capita income Lower strata 65.9 (62.4, 69.4) 300 (150, 750) Middle strata 68.8 (65.7, 71.2) 370 (190, 800) Upper strata 71.0 (67.7, 74.3) 470 (250, 1100) Household poverty status Above the poverty line 67.9 (65.6, 70.3) 400 (200, 930) Below the poverty line 72.1 (65.3, 78.9) 330 (150, 1025) No ration card 68.5 (65.1, 71.9) 340 (180, 780)
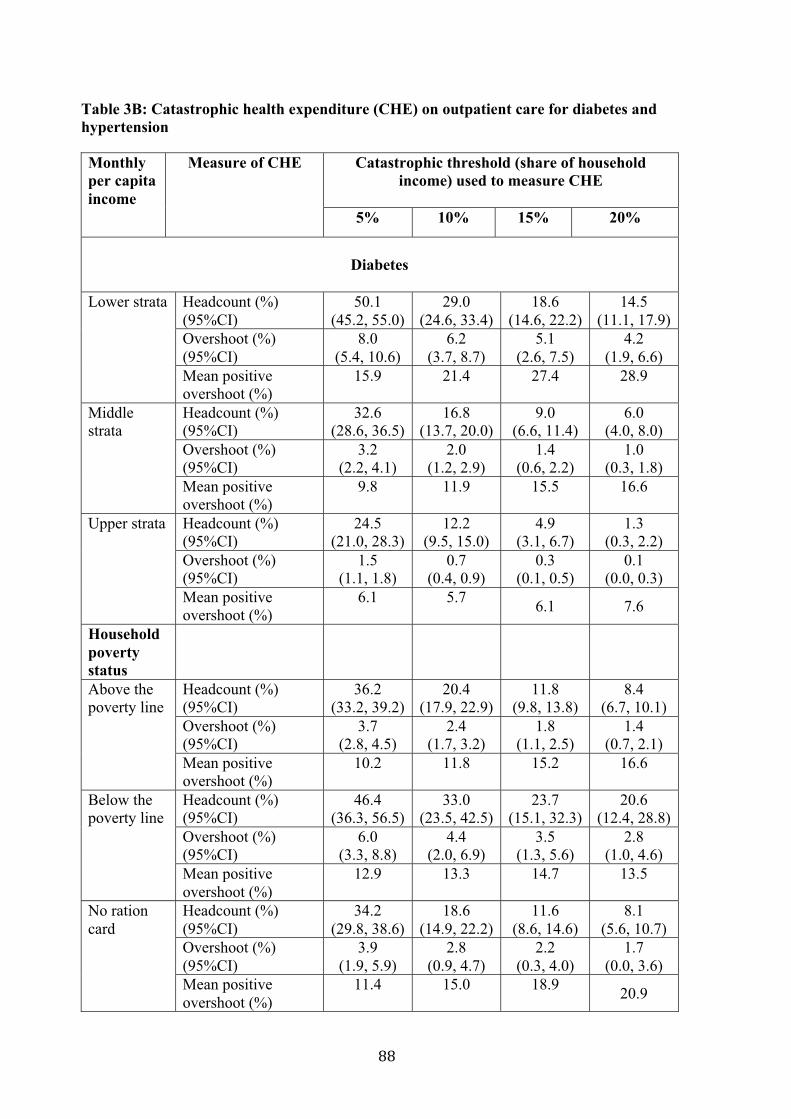
Table 3B: Catastrophic health expenditure (CHE) on outpatient care for diabetes and hypertension Monthly per capita income
Measure of CHE Catastrophic threshold (share of household income) used to measure CHE
5% 10% 15% 20%
Diabetes
Lower strata Headcount (%)
(95%CI) 50.1
(45.2, 55.0) 29.0
(24.6, 33.4) 18.6
(14.6, 22.2) 14.5
(11.1, 17.9) Overshoot (%) (95%CI)
8.0 (5.4, 10.6)
6.2 (3.7, 8.7)
5.1 (2.6, 7.5)
4.2 (1.9, 6.6)
Mean positive overshoot (%)
15.9 21.4 27.4 28.9
Middle strata
Headcount (%) (95%CI)
32.6 (28.6, 36.5)
16.8 (13.7, 20.0)
9.0 (6.6, 11.4)
6.0 (4.0, 8.0)
Overshoot (%) (95%CI)
3.2 (2.2, 4.1)
2.0 (1.2, 2.9)
1.4 (0.6, 2.2)
1.0 (0.3, 1.8)
Mean positive overshoot (%)
9.8 11.9 15.5 16.6
Upper strata Headcount (%) (95%CI)
24.5 (21.0, 28.3)
12.2 (9.5, 15.0)
4.9 (3.1, 6.7)
1.3 (0.3, 2.2)
Overshoot (%) (95%CI)
1.5 (1.1, 1.8)
0.7 (0.4, 0.9)
0.3 (0.1, 0.5)
0.1 (0.0, 0.3)
Mean positive overshoot (%)
6.1 5.7 6.1 7.6
Household poverty status
Above the poverty line
Headcount (%) (95%CI)
36.2 (33.2, 39.2)
20.4 (17.9, 22.9)
11.8 (9.8, 13.8)
8.4 (6.7, 10.1)
Overshoot (%) (95%CI)
3.7 (2.8, 4.5)
2.4 (1.7, 3.2)
1.8 (1.1, 2.5)
1.4 (0.7, 2.1)
Mean positive overshoot (%)
10.2 11.8 15.2 16.6
Below the poverty line
Headcount (%) (95%CI)
46.4 (36.3, 56.5)
33.0 (23.5, 42.5)
23.7 (15.1, 32.3)
20.6 (12.4, 28.8)
Overshoot (%) (95%CI)
6.0 (3.3, 8.8)
4.4 (2.0, 6.9)
3.5 (1.3, 5.6)
2.8 (1.0, 4.6)
Mean positive overshoot (%)
12.9 13.3 14.7 13.5
No ration card
Headcount (%) (95%CI)
34.2 (29.8, 38.6)
18.6 (14.9, 22.2)
11.6 (8.6, 14.6)
8.1 (5.6, 10.7)
Overshoot (%) (95%CI)
3.9 (1.9, 5.9)
2.8 (0.9, 4.7)
2.2 (0.3, 4.0)
1.7 (0.0, 3.6)
Mean positive overshoot (%)
11.4 15.0 18.9 20.9
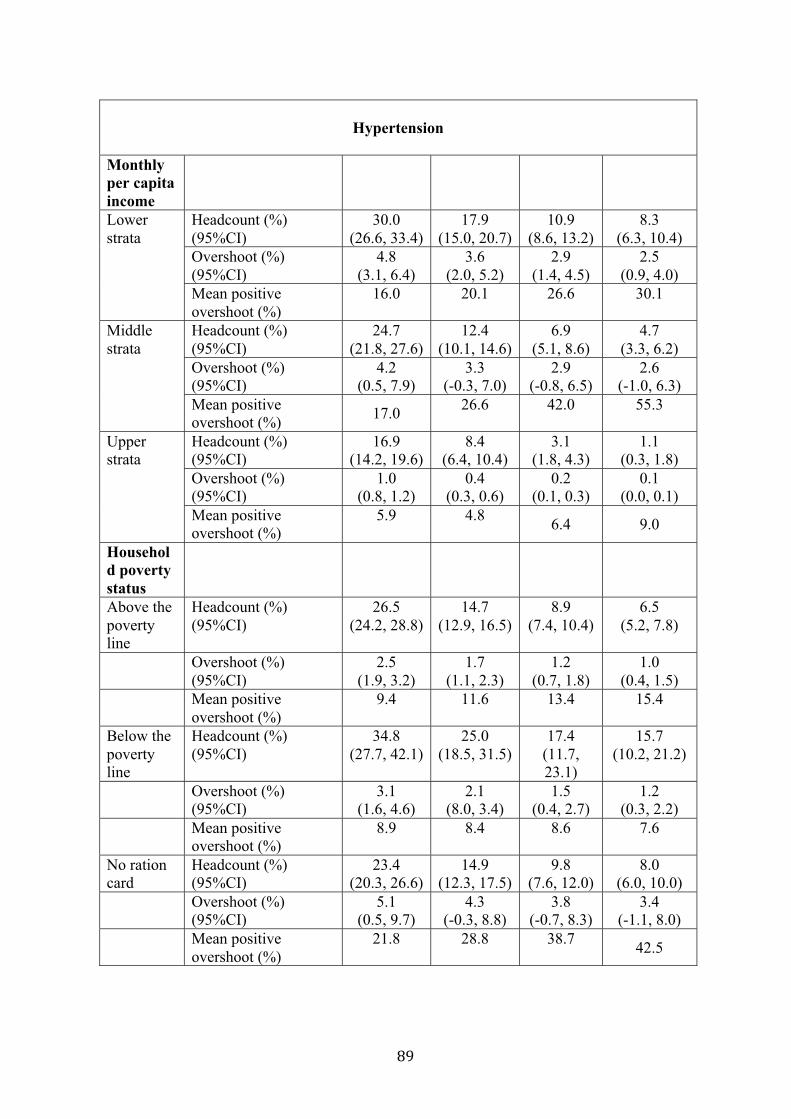
Hypertension
Monthly per capita income Lower strata
Headcount (%) (95%CI)
30.0 (26.6, 33.4)
17.9 (15.0, 20.7)
10.9 (8.6, 13.2)
8.3 (6.3, 10.4)
Overshoot (%) (95%CI)
4.8 (3.1, 6.4)
3.6 (2.0, 5.2)
2.9 (1.4, 4.5)
2.5 (0.9, 4.0)
Mean positive overshoot (%)
16.0 20.1 26.6 30.1
Middle strata
Headcount (%) (95%CI)
24.7 (21.8, 27.6)
12.4 (10.1, 14.6)
6.9 (5.1, 8.6)
4.7 (3.3, 6.2)
Overshoot (%) (95%CI)
4.2 (0.5, 7.9)
3.3 (-0.3, 7.0)
2.9 (-0.8, 6.5)
2.6 (-1.0, 6.3)
Mean positive overshoot (%) 17.0 26.6 42.0 55.3
Upper strata
Headcount (%) (95%CI)
16.9 (14.2, 19.6)
8.4 (6.4, 10.4)
3.1 (1.8, 4.3)
1.1 (0.3, 1.8)
Overshoot (%) (95%CI)
1.0 (0.8, 1.2)
0.4 (0.3, 0.6)
0.2 (0.1, 0.3)
0.1 (0.0, 0.1)
Mean positive overshoot (%)
5.9 4.8 6.4 9.0
Household poverty status Above the poverty line
Headcount (%) (95%CI)
26.5 (24.2, 28.8)
14.7 (12.9, 16.5)
8.9 (7.4, 10.4)
6.5 (5.2, 7.8)
Overshoot (%)(95%CI)
2.5 (1.9, 3.2)
1.7 (1.1, 2.3)
1.2 (0.7, 1.8)
1.0 (0.4, 1.5)
Mean positiveovershoot (%)
9.4 11.6 13.4 15.4
Below the poverty line
Headcount (%) (95%CI)
34.8 (27.7, 42.1)
25.0 (18.5, 31.5)
17.4 (11.7, 23.1)
15.7 (10.2, 21.2)
Overshoot (%)(95%CI)
3.1 (1.6, 4.6)
2.1 (8.0, 3.4)
1.5 (0.4, 2.7)
1.2 (0.3, 2.2)
Mean positiveovershoot (%)
8.9 8.4 8.6 7.6
No ration card
Headcount (%) (95%CI)
23.4 (20.3, 26.6)
14.9 (12.3, 17.5)
9.8 (7.6, 12.0)
8.0 (6.0, 10.0)
Overshoot (%)(95%CI)
5.1 (0.5, 9.7)
4.3 (-0.3, 8.8)
3.8 (-0.7, 8.3)
3.4 (-1.1, 8.0)
Mean positiveovershoot (%)
21.8 28.8 38.7 42.5

Chapter 3. Patients’ perspectives on diabetes management
This chapter is based on the paper:
Bhojani U, Mishra A, Amruthavalli S, Devadasan N, Kolsteren P, De Henauw S, Criel B. Constraints faced by urban poor in managing diabetes care: patients’ perspectives from South India. Global Health Action 2013;6:22258.
Constraints faced by urban poor in managing diabetescare: patients’ perspectives from South India
Upendra Bhojani1,2,3*, Arima Mishra4, Subramani Amruthavalli1,Narayanan Devadasan1, Patrick Kolsteren2, Stefaan De Henauw3 andBart Criel2
1Institute of Public Health, Bengaluru, India; 2Department of Public Health, Institute of TropicalMedicine, Antwerp, Belgium; 3Department of Public Health, Ghent University, Ghent, Belgium;4Health, Nutrition and Development Initiative, Azim Premji University, Bengaluru, India
Background: Four out of five adults with diabetes live in low- and middle-income countries (LMIC). India hasthe second highest number of diabetes patients in the world. Despite a huge burden, diabetes care remainssuboptimal. While patients (and families) play an important role in managing chronic conditions, there is adearth of studies in LMIC and virtually none in India capturing perspectives and experiences of patients inregard to diabetes care.Objective: The objective of this study was to better understand constraints faced by patients from urban slumsin managing care for type 2 diabetes in India.Design: We conducted in-depth interviews, using a phenomenological approach, with 16 type 2- diabetespatients from a poor urban neighbourhood in South India. These patients were selected with the help of fourcommunity health workers (CHWs) and were interviewed by two trained researchers exploring patients’experiences of living with and seeking care for diabetes. The sampling followed the principle of saturation.Data were initially coded using the NVivo software. Emerging themes were periodically discussed among theresearchers and were refined over time through an iterative process using a mind-mapping tool.Results: Despite an abundance of healthcare facilities in the vicinity, diabetes patients faced severalconstraints in accessing healthcare such as financial hardship, negative attitudes and inadequate commu-nication by healthcare providers and a fragmented healthcare service system offering inadequate care.Strongly defined gender-based family roles disadvantaged women by restricting their mobility and autonomyto access healthcare. The prevailing nuclear family structure and inter-generational conflicts limited supportand care for elderly adults.Conclusions: There is a need to strengthen primary care services with a special focus on improving theavailability and integration of health services for diabetes at the community level, enhancing patientcentredness and continuity in delivery of care. Our findings also point to the need to provide social services inconjunction with health services aiming at improving status of women and elderly in families and society.
Keywords: access to care; diabetes; chronic illness; slum; healthcare service; patients’ perspective
*Correspondence to: Upendra Bhojani, Institute of Public Health, 250, 2C Main, 2C Cross, Girinagar 1stPhase, Bengaluru 560085, India, Tel: 00919342349121, Fax: 00918026421929, Email: [email protected]
Received: 17 July 2013; Revised: 13 September 2013; Accepted: 13 September 2013; Published: 3 October 2013
Globally, over 371 million adults had diabetes in
the year 2012, and four out of five adults with
diabetes lived in low- and middle-income coun-
tries (LMIC) (1). Southeast Asia accounts for nearly one-
fifth of diabetes patients in the world. India alone has 63
million diabetes patients (1). In most countries, the preva-
lence of diabetes, its risk factors, and adverse outcomes is
higher among poor adults, with recent evidence suggesting
a similar trend in India (1!3, unpublished data).
Despite the huge burden, diabetes care remains sub-
optimal in LMIC. Studies from India reveal a huge gap
between the recommended and actual diabetes care,
resulting in poor health outcomes (4!7). A study from
South India revealed that 20.1% of type 2 diabetes
patients did not receive any treatment while 71.2% had
poor glycaemic control (5). An earlier study from the
region showed that only 25% of type 2 diabetes patients
adhered to prescribed medication (6). Another study
(page number not for citation purpose)
!ORIGINAL ARTICLE
Global Health Action 2013.# 2013 Upendra Bhojani et al. This is an Open Access article distributed under the terms of the Creative Commons Attribution-Noncommercial 3.0 Unported License (http://creativecommons.org/licenses/by-nc/3.0/), permitting all non-commercial use, distribution, and reproductionin any medium, provided the original work is properly cited.
1
Citation: Glob Health Action 2013, 6: 22258 - http://dx.doi.org/10.3402/gha.v6i0.22258

from Delhi revealed poor glycaemic control; 79.4% ofpatients did not adhere to the prescribed medicationand 41.4% did not visit a primary care provider in theprevious year (4). One multicentre study in India revealedsimilar results (7).
Effective management of diabetes, or of any chroniccondition, requires coordinated efforts from the health-care team, patients, families, and other partners in thelocal community, including a favourable environment thatallows for and promotes a coordinated response (8). Whilethere are some anthropological and sociological studiescapturing patients’ perspectives, such studies from LMIC,including India, are conspicuously absent. In fact, poortreatment outcomes are commonly attributed to a lack of‘knowledge’ and poor treatment ‘compliance’ by patients.Furthermore, the specificity of context that plays a majorrole in shaping social interpretation and response to anillness does not allow for a ready transfer of availableknowledge in high-income countries to other contexts.A few researchers have studied socio-cultural issues inLMIC while exploring associations between stress, de-pression and diabetes, suggesting the need to complementthe biomedical approach for diabetes management with apsychosocial approach (9!12). However, there is a lack ofin-depth studies exploring patient experiences in mana-ging diabetes care from a health service perspective.
Patients’ experiences could highlight how specific con-straints or facilitators to access healthcare are constructedwithin the lived realities of the patients. Such insights arecrucial in reforming health services so that care systemswould becomemore patient centred by enhancing patients’satisfaction and participation in decision making, treat-ment compliance, and other parameters of quality of care(13). These insights may also help to decipher seeminglycontrasting observations made by some surveys in India.For example, glycaemic control and utilisation of pre-ventive services are poor among relatively wealthy patientgroups in Indian metropolitan cities, despite greaterawareness about diabetes and the availability of healthfacilities in these cities (4, 5).
In this article, we aim to better understand constraintsfaced by patients from urban slums in South India inmanaging care for type 2 diabetes. We also report thesuggestions of these patients to improve diabetes care.
MethodsWe conducted a cross-sectional study using in-depthinterviews with self-reported type 2 diabetes patients. Weused a phenomenological approach to explore and under-stand patients’ detailed accounts of living with disease,healthcare-seeking behaviour, and expectations fromhealth services. A phenomenological approach, widelyused in medical sociology and anthropology, enables aresearcher to understand the embodied and lived experi-ences of patients (14). These accounts also offer a window
into the local community’s world of shared meanings
around health and illness in general and diabetes inparticular. This approach has been used in this study to
understand patients’ lived experiences of chronic illnessconditions focusing on diabetes.
We conducted this study in Kadugondanahalli (KGHalli), a poor urban neighbourhood with a designated
slum area in a metropolitan capital (Bengaluru) of Indianstate of Karnataka. KG Halli has a population of over
44,500 people. Over 75% of population lives below twoUSD (INR 110) a day. Most people earn their livingthrough manual labour, small businesses, and factory
jobs. Majority (68.7%) of the population is Muslim.Hindus (21%) and a small minority of Christians (10.3%)
are the next most common religious groups. KG Halli isalso a home to migrants from the neighbouring states
and at least three languages are commonly spoken in thearea. KG Halli has two government health centres thatprovide free care and at least 32 private facilities
providing care on a fee-for-service basis. The privatehealthcare delivery sector is highly utilised and unregu-
lated. Most private facilities are single-doctor clinics withtrained or untrained healthcare providers who offer care
in different systems of medicine (mainly modern medi-cine, Ayurveda and Unani). This pluralistic nature of thehealthcare delivery system, with several healing traditions
(especially Ayurveda, Yoga, Naturopathy, Unani, Siddha,Homeopathy) operating next to modern medicine, is a
major feature of the Indian health system (15). There arefour private hospitals in the area with varying capacities
and many private pharmacies and laboratories.This study followed an earlier survey delineating a high
burden of diabetes among KGHalli residents (16, 17). Weselected type 2 diabetes patients with the help of the four
community health workers (CHWs) who have been work-ing in KG Halli for the past 3 years as part of the Urban
Health Action Research Project. The aim of this project isto improve quality of healthcare for KGHalli residents by
working with healthcare providers, health authorities, andresidents of KG Halli. The CHWs are women from KGHalli and adjoining neighbourhoods. They received train-
ing on basic health issues and they make periodic visits tohouseholds in KG Halli creating awareness on health
issues and linking patients with appropriate healthcareresources in the area under supervision of the project staff.
As a result, CHWs have build rapport with patients andresidents inKGHalli and theymaintain a diary about theirencounters with patients. After explaining the purpose of
the study, CHWs were asked to suggest potential respon-dents residing in their respective sub-areas. Use of CHWs
as informants enabled the identification of patients willingto share their personal experience and allowed to respect
minimal sampling criteria (i.e. patients from both sexespresenting different stages of disease and treatment). Thepurposive sampling of respondents continued until gross
Upendra Bhojani et al.
2(page number not for citation purpose)
Citation: Glob Health Action 2013, 6: 22258 - http://dx.doi.org/10.3402/gha.v6i0.22258
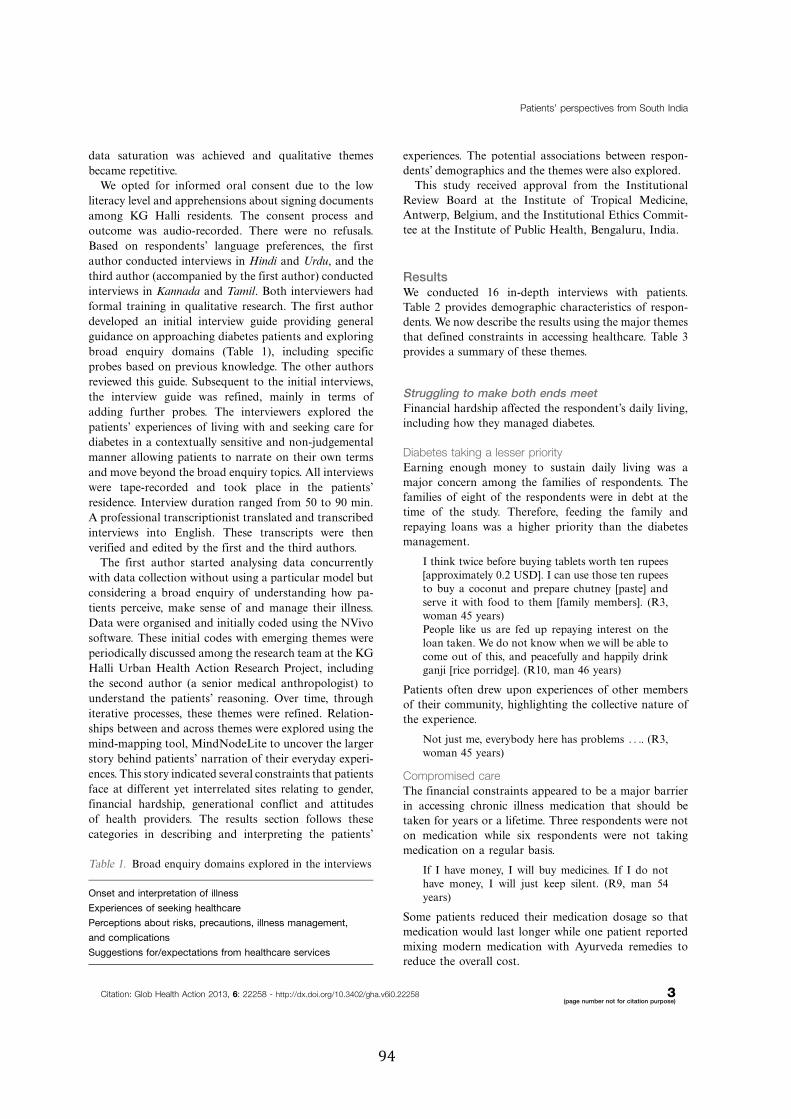
data saturation was achieved and qualitative themes
became repetitive.We opted for informed oral consent due to the low
literacy level and apprehensions about signing documents
among KG Halli residents. The consent process and
outcome was audio-recorded. There were no refusals.
Based on respondents’ language preferences, the first
author conducted interviews in Hindi and Urdu, and the
third author (accompanied by the first author) conducted
interviews in Kannada and Tamil. Both interviewers had
formal training in qualitative research. The first author
developed an initial interview guide providing general
guidance on approaching diabetes patients and exploring
broad enquiry domains (Table 1), including specific
probes based on previous knowledge. The other authors
reviewed this guide. Subsequent to the initial interviews,
the interview guide was refined, mainly in terms of
adding further probes. The interviewers explored the
patients’ experiences of living with and seeking care for
diabetes in a contextually sensitive and non-judgemental
manner allowing patients to narrate on their own terms
and move beyond the broad enquiry topics. All interviews
were tape-recorded and took place in the patients’
residence. Interview duration ranged from 50 to 90 min.
A professional transcriptionist translated and transcribed
interviews into English. These transcripts were then
verified and edited by the first and the third authors.The first author started analysing data concurrently
with data collection without using a particular model but
considering a broad enquiry of understanding how pa-
tients perceive, make sense of and manage their illness.
Data were organised and initially coded using the NVivo
software. These initial codes with emerging themes were
periodically discussed among the research team at the KG
Halli Urban Health Action Research Project, including
the second author (a senior medical anthropologist) to
understand the patients’ reasoning. Over time, through
iterative processes, these themes were refined. Relation-
ships between and across themes were explored using the
mind-mapping tool, MindNodeLite to uncover the larger
story behind patients’ narration of their everyday experi-
ences. This story indicated several constraints that patients
face at different yet interrelated sites relating to gender,
financial hardship, generational conflict and attitudes
of health providers. The results section follows these
categories in describing and interpreting the patients’
experiences. The potential associations between respon-dents’ demographics and the themes were also explored.This study received approval from the Institutional
Review Board at the Institute of Tropical Medicine,Antwerp, Belgium, and the Institutional Ethics Commit-tee at the Institute of Public Health, Bengaluru, India.
ResultsWe conducted 16 in-depth interviews with patients.Table 2 provides demographic characteristics of respon-dents. We now describe the results using the major themesthat defined constraints in accessing healthcare. Table 3provides a summary of these themes.
Struggling to make both ends meetFinancial hardship affected the respondent’s daily living,including how they managed diabetes.
Diabetes taking a lesser priorityEarning enough money to sustain daily living was amajor concern among the families of respondents. Thefamilies of eight of the respondents were in debt at thetime of the study. Therefore, feeding the family andrepaying loans was a higher priority than the diabetesmanagement.
I think twice before buying tablets worth ten rupees[approximately 0.2 USD]. I can use those ten rupeesto buy a coconut and prepare chutney [paste] andserve it with food to them [family members]. (R3,woman 45 years)People like us are fed up repaying interest on theloan taken. We do not know when we will be able tocome out of this, and peacefully and happily drinkganji [rice porridge]. (R10, man 46 years)
Patients often drew upon experiences of other membersof their community, highlighting the collective nature ofthe experience.
Not just me, everybody here has problems . . .. (R3,woman 45 years)
Compromised careThe financial constraints appeared to be a major barrierin accessing chronic illness medication that should betaken for years or a lifetime. Three respondents were noton medication while six respondents were not takingmedication on a regular basis.
If I have money, I will buy medicines. If I do nothave money, I will just keep silent. (R9, man 54years)
Some patients reduced their medication dosage so thatmedication would last longer while one patient reportedmixing modern medication with Ayurveda remedies toreduce the overall cost.
Table 1. Broad enquiry domains explored in the interviews
Onset and interpretation of illness
Experiences of seeking healthcare
Perceptions about risks, precautions, illness management,
and complications
Suggestions for/expectations from healthcare services
Patients’ perspectives from South India
Citation: Glob Health Action 2013, 6: 22258 - http://dx.doi.org/10.3402/gha.v6i0.22258 3(page number not for citation purpose)
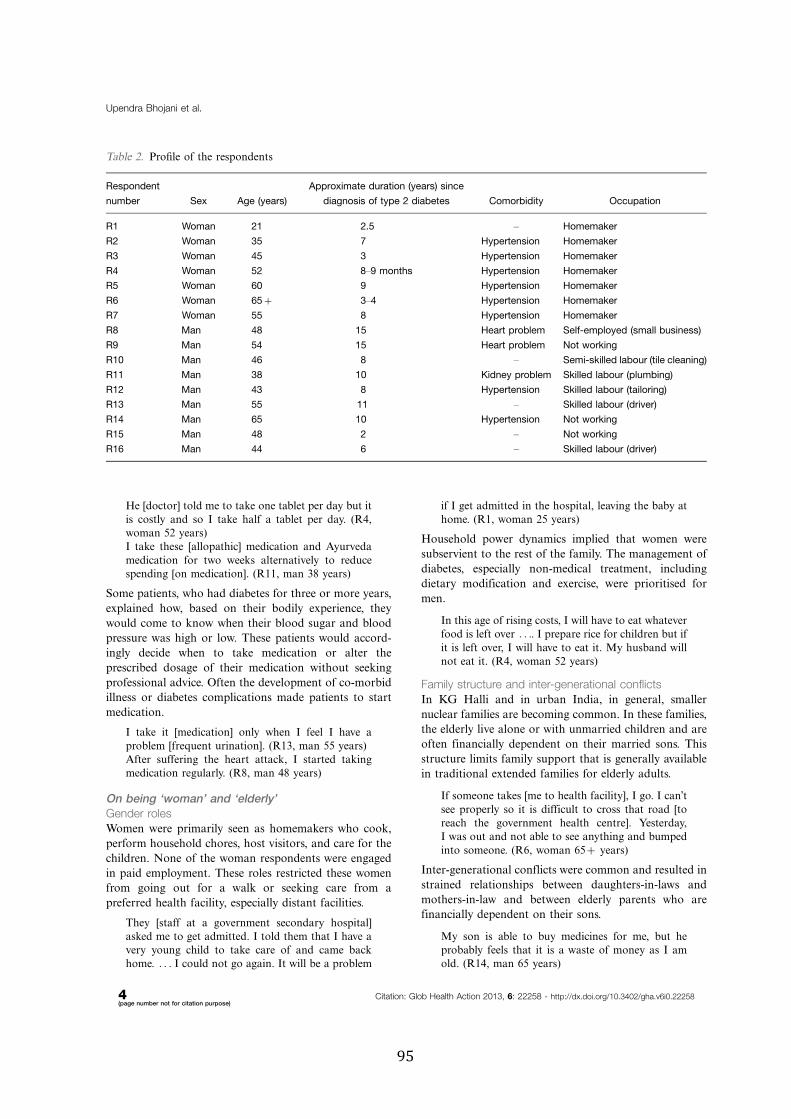
He [doctor] told me to take one tablet per day but itis costly and so I take half a tablet per day. (R4,woman 52 years)I take these [allopathic] medication and Ayurvedamedication for two weeks alternatively to reducespending [on medication]. (R11, man 38 years)
Some patients, who had diabetes for three or more years,explained how, based on their bodily experience, theywould come to know when their blood sugar and bloodpressure was high or low. These patients would accord-ingly decide when to take medication or alter theprescribed dosage of their medication without seekingprofessional advice. Often the development of co-morbidillness or diabetes complications made patients to startmedication.
I take it [medication] only when I feel I have aproblem [frequent urination]. (R13, man 55 years)After suffering the heart attack, I started takingmedication regularly. (R8, man 48 years)
On being ‘woman’ and ‘elderly’Gender rolesWomen were primarily seen as homemakers who cook,perform household chores, host visitors, and care for thechildren. None of the woman respondents were engagedin paid employment. These roles restricted these womenfrom going out for a walk or seeking care from apreferred health facility, especially distant facilities.
They [staff at a government secondary hospital]asked me to get admitted. I told them that I have avery young child to take care of and came backhome. . . . I could not go again. It will be a problem
if I get admitted in the hospital, leaving the baby athome. (R1, woman 25 years)
Household power dynamics implied that women weresubservient to the rest of the family. The management ofdiabetes, especially non-medical treatment, includingdietary modification and exercise, were prioritised formen.
In this age of rising costs, I will have to eat whateverfood is left over . . .. I prepare rice for children but ifit is left over, I will have to eat it. My husband willnot eat it. (R4, woman 52 years)
Family structure and inter-generational conflictsIn KG Halli and in urban India, in general, smallernuclear families are becoming common. In these families,the elderly live alone or with unmarried children and areoften financially dependent on their married sons. Thisstructure limits family support that is generally availablein traditional extended families for elderly adults.
If someone takes [me to health facility], I go. I can’tsee properly so it is difficult to cross that road [toreach the government health centre]. Yesterday,I was out and not able to see anything and bumpedinto someone. (R6, woman 65" years)
Inter-generational conflicts were common and resulted instrained relationships between daughters-in-laws andmothers-in-law and between elderly parents who arefinancially dependent on their sons.
My son is able to buy medicines for me, but heprobably feels that it is a waste of money as I amold. (R14, man 65 years)
Table 2. Profile of the respondents
Respondent
number Sex Age (years)
Approximate duration (years) since
diagnosis of type 2 diabetes Comorbidity Occupation
R1 Woman 21 2.5 ! Homemaker
R2 Woman 35 7 Hypertension Homemaker
R3 Woman 45 3 Hypertension Homemaker
R4 Woman 52 8!9 months Hypertension Homemaker
R5 Woman 60 9 Hypertension Homemaker
R6 Woman 65" 3!4 Hypertension Homemaker
R7 Woman 55 8 Hypertension Homemaker
R8 Man 48 15 Heart problem Self-employed (small business)
R9 Man 54 15 Heart problem Not working
R10 Man 46 8 ! Semi-skilled labour (tile cleaning)
R11 Man 38 10 Kidney problem Skilled labour (plumbing)
R12 Man 43 8 Hypertension Skilled labour (tailoring)
R13 Man 55 11 ! Skilled labour (driver)
R14 Man 65 10 Hypertension Not working
R15 Man 48 2 ! Not working
R16 Man 44 6 ! Skilled labour (driver)
Upendra Bhojani et al.
4(page number not for citation purpose)
Citation: Glob Health Action 2013, 6: 22258 - http://dx.doi.org/10.3402/gha.v6i0.22258

What happens, she [daughter-in-law] cooks andsends food to me. Now what to say to her? [Pauseand sigh]. If my daughter would be there, I wouldnot have to even tell her. She would have cookedaccordingly [without adding sugar and salt]. Mydaughter-in-law stays nearby but does not take care[of me]. At my house, a neighbour comes to washmy clothes and will make me a bath. (R6, woman65" years)
Providers’ attitudes and communicationInadequate communicationPatients expressed major concerns about the attitude ofhealthcare providers and inadequate communication dur-ing a consultation. Poor patients hesitated to ask lingeringquestions about their health conditions and management.
He [doctor] does not explain anything. As soon asI go there, he will write a prescription, take his fees
Table 3. Dominant themes defining constraints to diabetes care
Struggling to make both ends meet
Diabetes taking a lesser priority
I think twice before buying tablets worth ten rupees [approximately 0.2 USD]. I can use those ten rupees to buy a coconut and prepare
chutney [paste] and serve it with food to them [family members]. (R3, woman 45 years)
Compromised care
He [doctor] told me to take one tablet per day but it is costly and so I take half a tablet per day. (R4, woman 52 years)
Self-adjustments of medication
I take it [medication] only when I feel I have a problem [frequent urination]. (R13, man 55 years)
On being ‘woman’ and ‘elderly’
Gender-based family roles
They [staff at a government secondary hospital] asked me to get admitted. I told them that I have a very young child to take care of and
came back home. . . . I could not go again. It will be a problem if I get admitted in the hospital, leaving the baby at home. (R1, woman
25 years)
Nuclear family structure
If someone takes [me to health facility], I go. I can’t see properly so it is difficult to cross that road [to reach the government health centre].
Yesterday, I was out and not able to see anything and bumped into someone. (R6, woman 65" years)
Inter-generational conflicts
My son is able to buy medicines for me, but he probably feels that it is a waste of money as I am old. (R14, man 65 years)
Providers’ attitudes and communication
Inadequate communication
He [doctor] does not explain anything. As soon as I go there, he will write a prescription, take his fees and send us away . . .. Only if he tells
us not to eat this, or to eat only that, we will know about it. But if he himself doesn’t tell us, what will we know? We are uneducated, so we
will simply sit quietly. (R2, woman 35 years)
Negative attitudes
We would have left the children at home, and at the hospital we will keep thinking about home, family etc. that we would have left behind
and come to the hospital . . .. When we go to the hospital in this state of mind, they should talk properly to us and tell us that this is the
problem . . .. (R8, man 48 years)
About ‘good’ doctors
By the grace of Allah, after we started going to this doctor, the sugar level is under control and the doctor also explains everything properly.
Even if we have to spend a little more money, it gives me peace of mind. (R5, woman 60 years)
Approaching the health system
Fragmented primary care
At XXX [a government centre], they say that I have to get [my] blood checked at some other place [private laboratory], and take the report to
them to get the medication. I do not want it in that manner . . .. If you want to help poor people, all the facilities should be there at one place.
(R7, woman 55 years)
‘Free’ health camps
One more thing is, to become popular, the politicians put up boards and organise camps for eye testing and diabetes, once in a year . . ..
There, they [doctors] check, and tell us to come to their hospitals for medication . . .. If we go there [hospitals], they will charge a minimum of
one thousand rupees [approximately 18.2 USD] for the treatment. (R3, woman 45 years)
Tertiary care
The treatment there [a tertiary government hospital] is free of cost, but we will be made to do a lot of running around. For this one problem
[kidney problem], I was running around for eight days . . .. If you go to a doctor once, he will not be there when you go there for the second
time. There will be some other doctor. This doctor will ask us to get some other test done. If each doctor says something different, what shall
I do? (R9, man 54 years)
Patients’ perspectives from South India
Citation: Glob Health Action 2013, 6: 22258 - http://dx.doi.org/10.3402/gha.v6i0.22258 5(page number not for citation purpose)
and send us away . . .. Only if he tells us not to eatthis, or to eat only that, we will know about it. Butif he himself doesn’t tell us, what will we know?We are uneducated, so we will simply sit quietly.(R2, woman 35 years)
Some patients found that doctors were rude and lackedconsideration for the patient’s social and emotionalcircumstances. Patients expected the doctors to providereassurance to patients and families rather than creatingfear or blame.
When we went to XXX [a government tertiaryhospital], the doctor said there is a problem andnothing can be done. An operation is not requiredas the patient is very weak. They also created fear inour mind by saying that all human beings have todie one day . . .. We would have left the children athome, and at the hospital we will keep thinkingabout home, family etc. that we would have leftbehind and come to the hospital . . .. When we go tothe hospital in this state of mind, they should talkproperly to us and tell us that this is the problem . . .(R8, man 48 years)
Patients expressed these concerns about doctors in boththe public and private sectors and across the differentlevels of the healthcare system.
On ‘good’ doctorsSome patients immediately recounted their interactionswith ‘rare’ doctors in the private sector who exhibitedempathy and sympathetic listening. These characteristicsof the doctors were highly valued by patients whopreferred to seek care from these doctors, even at thecost of longer waiting times or relatively higher fees.
By the grace of Allah, after we started going to thisdoctor, the sugar level is under control and thedoctor also explains everything properly. Even if wehave to spend a little more money, it gives me peaceof mind. (R5, woman 60 years)
Approaching the health systemThe patients described difficulties accessing care on along-term basis for diabetes and other chronic conditionsat multiple levels of the healthcare system.
Fragmented primary careAt the primary care level (government health centres andprivate clinics), patients had to visit multiple locationsto receive care for a single medical encounter. The localgovernment health centre did not offer blood sugarexamination, and most private clinics lacked laboratoryand pharmacy services within their facilities.
At XXX [a government centre], they say that I haveto get [my] blood checked at some other place[private laboratory], and take the report to themto get the medication. I do not want it in that
manner . . .. If you want to help poor people, all thefacilities should be there at one place. (R7, woman55 years)
‘Free’ health campsOften, patients were diagnosed with diabetes at healthcamps or community outreach programmes, which weregenerally free of cost. However, such services were mainlyad-hoc diagnostic initiatives that were not linked to long-term, free healthcare services. In fact, some patients notedthat private hospitals used these ‘free’ camps to markettheir services and recruit patients while politicians hostedthese camps during election time to appease voters.
One more thing is, to become popular, the politi-cians put up boards and organise camps for eyetesting and diabetes, once in a year . . .. There, they[doctors] check, and tell us to come to theirhospitals for medication . . .. If we go there [hospi-tals], they will charge a minimum of one thousandrupees [approximately 18.2 USD] for the treatment.(R3, woman 45 years)
Tertiary carePatients visited these facilities when they experiencedcomplications or when primary care providers referredthem there. Common concerns about these large hospi-tals, which were mainly public sector facilities, includedthe need for repeat visits, long wait times, poor avail-ability of doctors, frequent rotation of doctors, lack ofcoordination between doctors resulting in differentopinions, and high opportunity cost due to long traveltime and forgone wages.
The treatment there [a tertiary government hospital]is free of cost, but we will be made to do a lot ofrunning around. For this one problem [kidneyproblem], I was running around for eight days . . ..If you go to a doctor once, he will not be there whenyou go there for the second time. There will be someother doctor. This doctor will ask us to get someother test done. If each doctor says somethingdifferent, what shall I do? (R9, man 54 years)
DiscussionOur study provides the perspectives of patients as theysought diabetes care. Despite an abundance of healthcarefacilities in the vicinity, the patients faced several barriersto care. These barriers included financial and familialconstraints, the negative attitudes of providers, inade-quate communication, and the limited and fragmentednature of the existing healthcare system.
For more than three decades, financial constraintshave remained the second most common reason for notseeking healthcare in India (18). A recent study fromDelhi revealed that poor diabetes patients avoided ordelayed healthcare due to financial constraints (9). Anearlier survey in KG Halli revealed that 69.6% of familiesincurred out-of-pocket expenses for outpatient care for
Upendra Bhojani et al.
6(page number not for citation purpose)
Citation: Glob Health Action 2013, 6: 22258 - http://dx.doi.org/10.3402/gha.v6i0.22258
chronic conditions, nearly doubling the poverty rate every
month (17). The largest share of out-of-pocket spendingon healthcare, in general, and for chronic conditions, in
particular, has been on medication (19, 20). Our findingsreinforce this fact explaining the reasons: the unavail-
ability of medication and diagnostics within governmentprimary care facilities and the need for patients to visit
different facilities for different components of care withinthe expensive private sector. Hence, integrating theseservices in one location in the public sector and control-
ling costs in the private sector could help reduce the costof diabetes care for patients. In the interim, there is also a
need to provide financial protection to patients against ahuge impoverishing out-of-pocket healthcare costs.
The ‘free’ diabetes camps that are often organised in
poor urban areas are ethically questionable, as theseinitiatives lead to diagnose people with diabetes without
offering them free or subsidised follow-up care. In fact,mainly private healthcare providers use these camps as amarketing strategy where they bank upon turning an
undiagnosed burden of diabetes into new patients fortheir clinics/hospitals. Political leaders, with the support
from healthcare providers, consider these camps as aconvenient tool to appeal to masses in pre-election times.
These so-called charitable or sympathetic activities arebluntly overlooking people’s life circumstances and the
many constraints diabetes patients face in their searchfor proper care. We suggest that such camps provide
subsidised follow-up care or, at the very least, that theyfacilitate patients’ access to affordable healthcare in their
surroundings.Considering the overall financial struggle for daily
existence that defines the lives of the urban poor, themeasures to provide financial protection for health to this
group need to be complemented and integrated withbroader social protective measures that promote liveli-
hoods and other social services. In this view, the linkagesenvisaged between the forthcoming National Urban
Health Mission, a flagship programme by the Govern-ment of India aimed at enhancing health of urban poor,
and the already existing schemes addressing issues ofurban development, employment, and child developmentneed to be contextualised and strengthened (21).
The self-prescription and adjustment of medication
dosages based on bodily experience by patients in ourstudy mainly appears to be a coping response to limited
access to affordable medication. This practice also reflectsan acquired understanding of how one’s body reacts to
a change in the status of a disease/medication. Studiesexploring the perspectives of patients with diabetes and
epilepsy reveal that patients often assert their control overtheir disease by deviating from the prescribed dosageand self-adjusting their medication (22, 23). Our study
reflected this notion but the prominence of financialconstraints in shaping medication use was evident in our
study. It is important that healthcare providers attempt to
explore and understand these varied notions that definemedication practices by patients rather than merely
labelling patients as ‘non-compliant’.Doing this requires that providers spend time commu-
nicating with patients to understand their perspectives.
However, in our study, patients felt that doctors hardlygave time to patients and that the consultation was
not comforting to patients. Other studies in India haveshown that the average consultation time in primary care
settings has remained pitiably short (from 2.5 min to amaximum of 5 min) (24!26). Patients were quite dis-
satisfied that doctors did not explain or discuss care withthem (24!27). Clearly, our study points to the need for
providers to understand a patient’s context and perspec-tive and add a human dimension to medical care. That is,
care should be more patient centred.In the absence of a functional social welfare system, the
family remains a major source of support for the elderly inIndia andmanyother LMIC.However, the transition from
a traditional extended family structure to a nuclear familystructure has isolated the elderly, reducing their access to
healthcare (28, 29). In 2004, 20.2% of elderly adults inIndia had no family support (i.e. living without a son or
daughter under the same roof) (28). Sridhar and colleagueshighlight the impact of the nuclear family structure
showing that the majority of diabetes patients primarilydepended on their spouses and, to a much lesser extent,
their children, for support to cope with their diabetes (10,11). The demographic transition, with rapidly increasing
numbers of elderly in India !over 100million in 2012 (30) !will only make matters worse. These observations reiterate
the need to enhance outreach and community-basedhealth services in conjunction with provision of social
services for the elderly to improve their health.Another important contribution of our study is that
it demonstrates the gendered nature of diabetes care in
India. Gender-based family roles negatively affectedwomen’s access to healthcare by restricting their mobility
and autonomy. The role of gender is widely recognised toaffect health and healthcare in general, including treat-
ment of chronic conditions (31). A few studies in India thatassessed depression, anxiety, energy levels, and positivewellbeing in patients with diabetes revealed that men faredbetter than women (12, 32). Our study findings could help
health providers to better understand patient practicesand accordingly tailor their advice and treatment. Thesefindings also imply a need for non-health interventions
that contribute to promote social norms enhancingwomen’s status and autonomy within families and society.
We plan to use our study findings to formulate health
service interventions that might improve the quality ofdiabetes care in KG Halli. A limitation of our study is
that while use of CHWs helped to locate respondentswith desirable profile, we might have missed patients who
Patients’ perspectives from South India
Citation: Glob Health Action 2013, 6: 22258 - http://dx.doi.org/10.3402/gha.v6i0.22258 7(page number not for citation purpose)
were out of reach of CHWs. Furthermore, while theposition of interviewers (doctor and staff of the ongoingproject in the area) facilitated familiarity and connectwith the patients, it would have affected the patientsnarratives that tend to emphasise ‘medical’ problems andsolutions (that a ‘doctor’ or ‘health project’ can under-stand/address). Our findings could not be readily general-ised to all the urban poor areas in India or in the region.However, our study highlights the need to understand thepatients’ experiences and perspectives in studying dia-betes care and offer analytical guidance while studyingsuch groups in India and in the region.
ConclusionsOur study shows that, despite the abundance of healthcarefacilities in the vicinity, diabetes patients in poorer urbanareas face several constraints in accessing formal health-care services. These constraints included financial barriers,the negative attitudes and inadequate communicationof healthcare providers, and the limited and fragmentednature of the existing healthcare services. Our study dem-onstrated a gender disadvantage for women in diabetescare. The prevailing nuclear family structure and inter-generational conflicts limited support and care for theelderly.
There is need to strengthen primary care services withspecial focus on improving availability and integration ofhealth services for diabetes at the community level,promoting patient-centred care, and improving continuityin delivery of diabetes care. Our findings also point to theneed to provide social services in conjunction with healthservices aiming at improving status of women and elderlyin families and society.
Acknowledgements
This study was funded through a PhD scholarship grant received bythe first author from the Institute of Tropical Medicine, Antwerp(August 2010!July 2014). The authors are grateful to Josefien,Leelavathi, Nagarathna, and Nageena for their help in facilitatingidentification of the respondents and scheduling interviews withthem. They are indebted to the respondentswho gave time and sharedtheir experiences with them. They thank Prashanth NS, RoopaDevadasan, and Thriveni BS for their comments on the manuscript.They also thank anonymous reviewers for their useful comments.
Conflict of interest and funding
The authors have not received any funding or benefitsfrom industry.
References
1. International Diabetes Federation. IDF diabetes atlas. 5th ed.Brussels: International Diabetes Federation; 2013.
2. Misra A, Pandey RM, Devi JR, Sharma R, Vikram NK,Khanna N. High prevalence of diabetes, obesity and dyslipi-
daemia in urban slum population in northern India. Int J Obes2001; 25: 1722!9.
3. Anand K, Shah B, Yadav K, Singh R, Mathur P, Paul E, et al.Are the urban poor vulnerable to non-communicable diseases?A survey of risk factors for non-communicable diseases in urbanslums of Faridabad. Natl Med J India 2007; 20: 115!20.
4. Nagpal J, Bhartia A. Quality of diabetes care in the middle- andhigh-income group populace: the Delhi Diabetes Community(DEDICOM) survey. Diabetes Care 2006; 29: 2341!8.
5. Ramachandran A, Mary S, Sathish C, Selvam S, Catherin SeeliA, Muruganandam M, et al. Population based study of qualityof diabetes care in southern India. J Assoc Physicians India2008; 56: 513!6.
6. Shobhana R, Begum R, Snehalatha C, Vijay V, RamachandranA. Patients’ adherence to diabetes treatment. J Assoc PhysiciansIndia 1999; 47: 1173!5.
7. Raheja B, Kapur A, Bhoraskar A, Sathe S, Jorgensen L,Moorthy SR, et al. DiabCare Asia-India Study: diabetescare in India ! current status. J Assoc Physicians India 2001;49: 717!22.
8. World Health Organization (2002). Innovative care for chronicconditions: building blocks for action. Geneva: World HealthOrganization.
9. Mendenhall E, Shivashankar R, Tandon N, Ali MK, NarayanKMV, Prabhakaran D. Stress and diabetes in socioeconomiccontext: a qualitative study of urban Indians. Soc Sci Med 2012;75: 2522!9.
10. Sridhar GR, Madhu K, Veena S, Madhavi R, Sangeetha BS,Rani A. Living with diabetes: Indian experience. DiabetesMetab Syndr 2007; 1: 181!7.
11. Sridhar GR, Madhu K. Psychosocial and cultural issues indiabetes mellitus. Curr Sci 2002; 83: 1556!64.
12. Sriram V, Sridhar GR, Madhu K. Gender differences in livingwith type 2 diabetes. Int J Diabetes Dev Ctries 2001; 21: 97!102.
13. World Health Organization (2008). Primary care: putting peoplefirst. The World Health Report 2008: primary health care ! nowmore than ever. Geneva: World Health Organization; 2008.
14. Waksler FC. Medicine and the phenomenological method. In:Toombs SK, ed. Handbook of phenomenology and medicine.Dordrecht: Kluwer Academic; 2001; 67!86.
15. Department of AYUSH. About the systems ! AYUSH.Available: http://www.indianmedicine.nic.in/index1.asp?lang#1&linkid#17&lid#40 [cited 20 August 2013].
16. Bhojani U, Beerenahalli TS, Devadasan R, Munegowda CM,Devedasan N, Criel B, et al. No longer diseases of the wealthy:prevalence and health-seeking for self-reported chronic condi-tions among urban poor in Southern India. BMC Health ServRes 2013; 13: 306.
17. Bhojani U, Thriveni BS, Devadasan R, Munegowda CM,Devadasan N, Kolsteren P, et al. Out-of-pocket healthcarepayments on chronic conditions impoverish urban poor inBangalore, India. BMC Public Health 2012; 12: 990.
18. Selvaraj S, Karan AK. Deepening health insecurity in India:evidence from National Sample Surveys since 1980s. Econ PolitWkly 2009; xliv: 55!60.
19. Ghosh S. Catastrophic payments and impoverishment dueto out-of-pocket health spending. Econ Polit Wkly 2011; xlvi:63!70.
20. Garg CC, Karan AK. Reducing out-of-pocket expenditures toreduce poverty: a disaggregated analysis at rural!urban andstate level in India. Health Policy Plan 2009; 24: 116!28.
21. Ministry of Health and Family Welfare. National urban healthmission: framework for implementation. New Delhi: Ministry ofHealth and Family Welfare, Government of India; 2010.
22. Conrad P. Meaning of medications: another look at compliance.Soc Sci Med 1985; 20: 29!37.
Upendra Bhojani et al.
8(page number not for citation purpose)
Citation: Glob Health Action 2013, 6: 22258 - http://dx.doi.org/10.3402/gha.v6i0.22258
23. Shoemaker SJ, Ramalho de Oliveira D. Understanding themeaning of medications for patients: the medication experience.Pharm World Sci 2008; 30: 86!91.
24. Patro BK, Kumar R, Goswami A, Nongkynrih B, Pandav CS.Community perception and client satisfaction about theprimary health care services in an urban resettlement colony ofNew Delhi. Indian J Community Med 2008; 33: 250!4.
25. Kumari R, Idris M, Bhushan V, Khanna A, Agarwal M,Singh SK. Study on patient satisfaction in the governmentallopathic health facilities of Lucknow district, India. Indian JCommunity Med 2009; 34: 35!42.
26. Chandwani HR, Jivarajani PJ, Jivarajani HP. Communityperception and client satisfaction about the primary healthcare services in a tribal setting of Gujarat ! India. InternetJ Health 2009; 9. Available: http://www.ispub.com/journal/the-internet-journal-of-health/volume-9-number-2/community-perception-and-client-satisfaction-about-the-primary-health-care-services-in-a-tribal-setting-of-gujarat-india.html#sthash.YeComJkz.dpbs [cited 1 July 2013].
27. Kumar S. Seen and not heard. BMJ 2003; 326: 1295.28. Prasad S. Deprivation and vulnerability among elderly in India.
WP-2011!013. Mumbai: Indira Gandhi Institute of Develop-
ment Research; 2011.29. Das S. The role of family in health and healthcare utilization
among elderly. Rourkrla: Department of Humanities and Social
Sciences, National Institute of Technology; 2012.30. UNFPA, HelpAge International. Ageing in the twenty-first
century: a celebration and a challenge. London: United Nations
Population Fund, HelpAge International; 2012.31. Vlassoff C. Gender differences in determinants and conse-
quences of health and illness. J Health Popul Nutr 2007; 25:
47!61.32. Shobhana R, Rama Rao P, Lavanya A, Padma C, Vijay V,
Ramachandran A. Quality of life and diabetes integration
among subjects with type 2 diabetes. J Assoc Physicians India
2003; 51: 363!5.
Patients’ perspectives from South India
Citation: Glob Health Action 2013, 6: 22258 - http://dx.doi.org/10.3402/gha.v6i0.22258 9(page number not for citation purpose)

Addendum
Table 2 in this paper mentions age of the respondent 1 (R1) as 21 years. Elsewhere in the text in this paper, R1’s age is mentioned as 25 years. We confirm from the interview transcript that R1 was of 25 years at the time of the interview.


Chapter 4. Gaps in organization of diabetes care
This chapter is based on the paper:
Bhojani U, Devadasan N, Mishra A, De Henauw S, Kolsteren P, Criel B. Health system challenges in organizing quality diabetes care for urban poor in South India. PLoS ONE 2014;9(9):e106522.
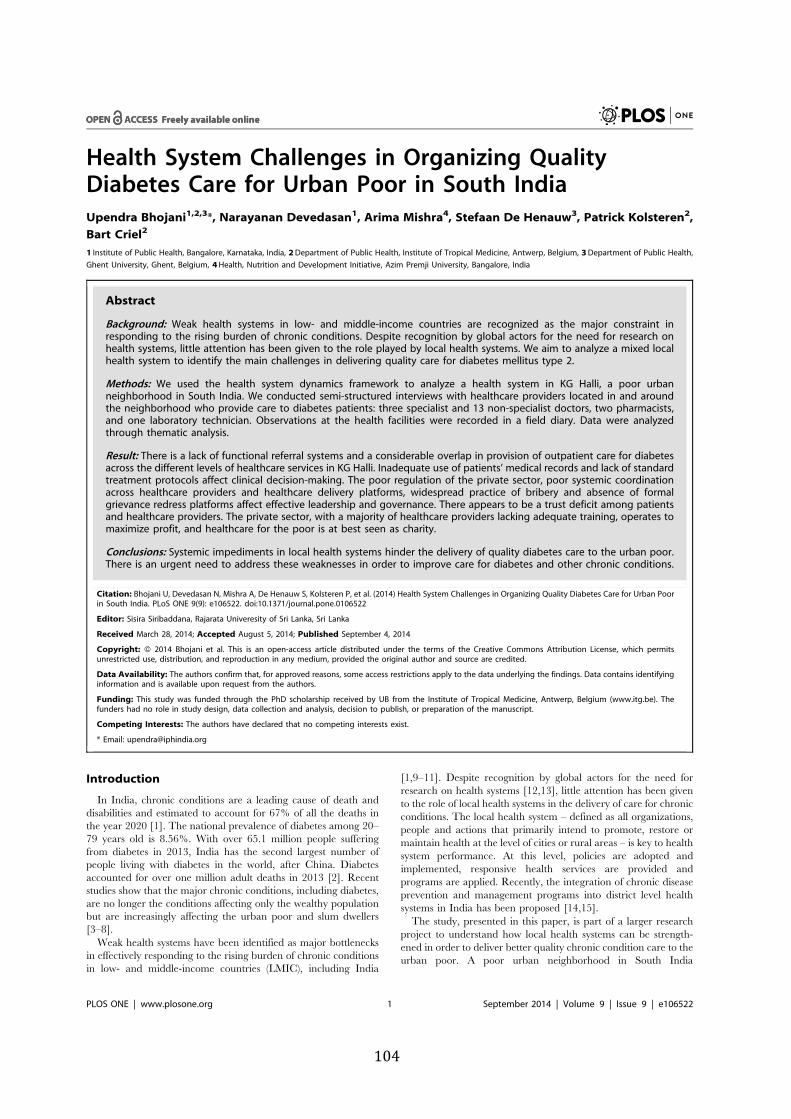
Health System Challenges in Organizing QualityDiabetes Care for Urban Poor in South IndiaUpendra Bhojani1,2,3*, Narayanan Devedasan1, Arima Mishra4, Stefaan De Henauw3, Patrick Kolsteren2,
Bart Criel2
1 Institute of Public Health, Bangalore, Karnataka, India, 2Department of Public Health, Institute of Tropical Medicine, Antwerp, Belgium, 3Department of Public Health,
Ghent University, Ghent, Belgium, 4Health, Nutrition and Development Initiative, Azim Premji University, Bangalore, India
Abstract
Background: Weak health systems in low- and middle-income countries are recognized as the major constraint inresponding to the rising burden of chronic conditions. Despite recognition by global actors for the need for research onhealth systems, little attention has been given to the role played by local health systems. We aim to analyze a mixed localhealth system to identify the main challenges in delivering quality care for diabetes mellitus type 2.
Methods: We used the health system dynamics framework to analyze a health system in KG Halli, a poor urbanneighborhood in South India. We conducted semi-structured interviews with healthcare providers located in and aroundthe neighborhood who provide care to diabetes patients: three specialist and 13 non-specialist doctors, two pharmacists,and one laboratory technician. Observations at the health facilities were recorded in a field diary. Data were analyzedthrough thematic analysis.
Result: There is a lack of functional referral systems and a considerable overlap in provision of outpatient care for diabetesacross the different levels of healthcare services in KG Halli. Inadequate use of patients’ medical records and lack of standardtreatment protocols affect clinical decision-making. The poor regulation of the private sector, poor systemic coordinationacross healthcare providers and healthcare delivery platforms, widespread practice of bribery and absence of formalgrievance redress platforms affect effective leadership and governance. There appears to be a trust deficit among patientsand healthcare providers. The private sector, with a majority of healthcare providers lacking adequate training, operates tomaximize profit, and healthcare for the poor is at best seen as charity.
Conclusions: Systemic impediments in local health systems hinder the delivery of quality diabetes care to the urban poor.There is an urgent need to address these weaknesses in order to improve care for diabetes and other chronic conditions.
Citation: Bhojani U, Devedasan N, Mishra A, De Henauw S, Kolsteren P, et al. (2014) Health System Challenges in Organizing Quality Diabetes Care for Urban Poorin South India. PLoS ONE 9(9): e106522. doi:10.1371/journal.pone.0106522
Editor: Sisira Siribaddana, Rajarata Univeresity of Sri Lanka, Sri Lanka
Received March 28, 2014; Accepted August 5, 2014; Published September 4, 2014
Copyright: ! 2014 Bhojani et al. This is an open-access article distributed under the terms of the Creative Commons Attribution License, which permitsunrestricted use, distribution, and reproduction in any medium, provided the original author and source are credited.
Data Availability: The authors confirm that, for approved reasons, some access restrictions apply to the data underlying the findings. Data contains identifyinginformation and is available upon request from the authors.
Funding: This study was funded through the PhD scholarship received by UB from the Institute of Tropical Medicine, Antwerp, Belgium (www.itg.be). Thefunders had no role in study design, data collection and analysis, decision to publish, or preparation of the manuscript.
Competing Interests: The authors have declared that no competing interests exist.
* Email: [email protected]
Introduction
In India, chronic conditions are a leading cause of death anddisabilities and estimated to account for 67% of all the deaths inthe year 2020 [1]. The national prevalence of diabetes among 20–79 years old is 8.56%. With over 65.1 million people sufferingfrom diabetes in 2013, India has the second largest number ofpeople living with diabetes in the world, after China. Diabetesaccounted for over one million adult deaths in 2013 [2]. Recentstudies show that the major chronic conditions, including diabetes,are no longer the conditions affecting only the wealthy populationbut are increasingly affecting the urban poor and slum dwellers[3–8].Weak health systems have been identified as major bottlenecks
in effectively responding to the rising burden of chronic conditionsin low- and middle-income countries (LMIC), including India
[1,9–11]. Despite recognition by global actors for the need forresearch on health systems [12,13], little attention has been givento the role of local health systems in the delivery of care for chronicconditions. The local health system – defined as all organizations,people and actions that primarily intend to promote, restore ormaintain health at the level of cities or rural areas – is key to healthsystem performance. At this level, policies are adopted andimplemented, responsive health services are provided andprograms are applied. Recently, the integration of chronic diseaseprevention and management programs into district level healthsystems in India has been proposed [14,15].The study, presented in this paper, is part of a larger research
project to understand how local health systems can be strength-ened in order to deliver better quality chronic condition care to theurban poor. A poor urban neighborhood in South India
PLOS ONE | www.plosone.org 1 September 2014 | Volume 9 | Issue 9 | e106522
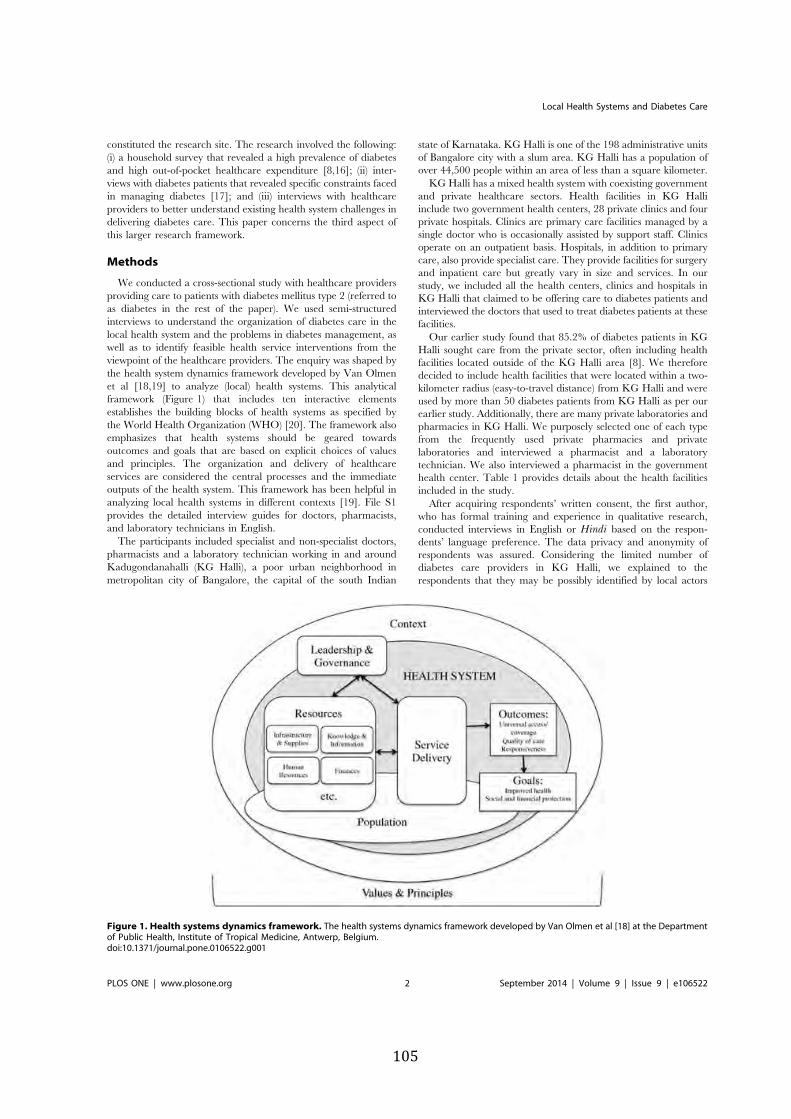
constituted the research site. The research involved the following:(i) a household survey that revealed a high prevalence of diabetesand high out-of-pocket healthcare expenditure [8,16]; (ii) inter-views with diabetes patients that revealed specific constraints facedin managing diabetes [17]; and (iii) interviews with healthcareproviders to better understand existing health system challenges indelivering diabetes care. This paper concerns the third aspect ofthis larger research framework.
Methods
We conducted a cross-sectional study with healthcare providersproviding care to patients with diabetes mellitus type 2 (referred toas diabetes in the rest of the paper). We used semi-structuredinterviews to understand the organization of diabetes care in thelocal health system and the problems in diabetes management, aswell as to identify feasible health service interventions from theviewpoint of the healthcare providers. The enquiry was shaped bythe health system dynamics framework developed by Van Olmenet al [18,19] to analyze (local) health systems. This analyticalframework (Figure 1) that includes ten interactive elementsestablishes the building blocks of health systems as specified bythe World Health Organization (WHO) [20]. The framework alsoemphasizes that health systems should be geared towardsoutcomes and goals that are based on explicit choices of valuesand principles. The organization and delivery of healthcareservices are considered the central processes and the immediateoutputs of the health system. This framework has been helpful inanalyzing local health systems in different contexts [19]. File S1provides the detailed interview guides for doctors, pharmacists,and laboratory technicians in English.The participants included specialist and non-specialist doctors,
pharmacists and a laboratory technician working in and aroundKadugondanahalli (KG Halli), a poor urban neighborhood inmetropolitan city of Bangalore, the capital of the south Indian
state of Karnataka. KG Halli is one of the 198 administrative unitsof Bangalore city with a slum area. KG Halli has a population ofover 44,500 people within an area of less than a square kilometer.KG Halli has a mixed health system with coexisting government
and private healthcare sectors. Health facilities in KG Halliinclude two government health centers, 28 private clinics and fourprivate hospitals. Clinics are primary care facilities managed by asingle doctor who is occasionally assisted by support staff. Clinicsoperate on an outpatient basis. Hospitals, in addition to primarycare, also provide specialist care. They provide facilities for surgeryand inpatient care but greatly vary in size and services. In ourstudy, we included all the health centers, clinics and hospitals inKG Halli that claimed to be offering care to diabetes patients andinterviewed the doctors that used to treat diabetes patients at thesefacilities.Our earlier study found that 85.2% of diabetes patients in KG
Halli sought care from the private sector, often including healthfacilities located outside of the KG Halli area [8]. We thereforedecided to include health facilities that were located within a two-kilometer radius (easy-to-travel distance) from KG Halli and wereused by more than 50 diabetes patients from KG Halli as per ourearlier study. Additionally, there are many private laboratories andpharmacies in KG Halli. We purposely selected one of each typefrom the frequently used private pharmacies and privatelaboratories and interviewed a pharmacist and a laboratorytechnician. We also interviewed a pharmacist in the governmenthealth center. Table 1 provides details about the health facilitiesincluded in the study.After acquiring respondents’ written consent, the first author,
who has formal training and experience in qualitative research,conducted interviews in English or Hindi based on the respon-dents’ language preference. The data privacy and anonymity ofrespondents was assured. Considering the limited number ofdiabetes care providers in KG Halli, we explained to therespondents that they may be possibly identified by local actors
Figure 1. Health systems dynamics framework. The health systems dynamics framework developed by Van Olmen et al [18] at the Departmentof Public Health, Institute of Tropical Medicine, Antwerp, Belgium.doi:10.1371/journal.pone.0106522.g001
Local Health Systems and Diabetes Care
PLOS ONE | www.plosone.org 2 September 2014 | Volume 9 | Issue 9 | e106522
and about the risk associated with it as part of the consent process.For respondents’ convenience, the interviews were conducted attheir workplaces, usually in their consultation rooms. Theinterviews lasted approximately 40 to 60 minutes, occasionallyinterrupted by patient consultations. The interviews were tape-recorded and were transcribed verbatim by a professionaltranscriptionist. In addition to the interviews, the first authormaintained a field diary recording the general observations madeat the health facility while conducting the interviews. Theseobservations included aspects such as physical environment of thehealth facility, writings and visuals displayed in the facility, andbehavior of patients and staff at the facility.We used thematic analysis. The first author coded transcripts in
Nvivo software by creating respondents’ profiles and usingelements of the health systems dynamics framework as tree nodes.
Free nodes were created to accommodate data that did not fit thetree nodes. Based on the initial coding, the research team discussedthe resulting overarching themes. They discussed the relationshipsacross and between the themes and respondents’ attributes. Theresearch team gathered expertise in relevant fields, includingmedicine, public health, health service research and medicalanthropology. The major recurring themes were grouped into fourcategories representing the four out of the ten interactive elementsof the health system dynamics framework (i.e., health servicedelivery, knowledge and information, leadership and governance,values and principles). We used these categories to present thestudy findings in the results section.This study received approval from the Institutional Review
Board at the Institute of Tropical Medicine, Antwerp (Belgium)and from the Technical Committee, as well as the Institutional
Table 1. Profile of respondents.
Respondentnumber
Sex of therespondent
Role of the respondentat his/her healthfacility
Formal trainingof the respondent
Type of therespondent’s facility(based on ownership)
Type of the respondent’s facility(based on deliveryplatform)
R1 Woman Non-specialist doctor Graduation in ayurveda &bridging course in allopathy
Private Clinic providing primarycare on outpatient basis
R2 Man Non-specialist doctor Graduation in unani Private Clinic providing primarycare on outpatient basis
R3 Woman Non-specialist doctor Graduation in unani Private Clinic providing primarycare on outpatient basis
R4 Woman Non-specialist doctor Graduation in unani Private Clinic providing primarycare on outpatient basis
R5 Man Non-specialist doctor Graduation in ayurveda Private Clinic providing primarycare on outpatient basis
R6 Man Non-specialist doctor Graduation in ayurveda Private Clinic providing primarycare on outpatient basis
R7 Man Non-specialist doctor Graduation in allopathy Private Clinic providing primarycare on outpatient basis
R8 Man Non-specialist doctor Graduation in allopathy Private Clinic providing primarycare on outpatient basis
R9 Man Non-specialist doctor Graduation in unani Private Clinic providing primarycare on outpatient basis
R10 Man Non-specialist doctor Graduation in allopathy Government Clinic providing primarycare on outpatient basis
R11 Woman Specialist doctor Post-graduation in allopathy Government Same facility as that of R10
R12 Woman Specialist doctor Post-graduation in allopathy Private Clinic providing specialistcare on outpatient basis
R13 Man Non-specialist doctor Graduation in allopathy Private Hospital (six beds)providing primary care and limitedreferral care
R14 Man Non-specialist doctor Graduation in unani Private Hospital (15 beds) providingprimary care and limited referral care
R15 Man Non-specialist doctor Graduation in ayurveda Private Hospital (30 beds) providingprimary care and limited referral care
R16 Man Specialist doctor Post-graduation in allopathy Private Super-specialty hospital(600 beds) attached to amedical school providingprimary and referral care
R17 Woman Pharmacist Graduation in pharmacy Government Same facility as that of R10
R18 Woman Pharmacist Completed schooleducation till 12th
class
Private Pharmacy
R19 Woman Laboratory technician Post-graduation in laboratorytechnology
Private Diagnostic center
doi:10.1371/journal.pone.0106522.t001
Local Health Systems and Diabetes Care
PLOS ONE | www.plosone.org 3 September 2014 | Volume 9 | Issue 9 | e106522
Ethics Committee at the Institute of Public Health, Bangalore(India).
Results
In total, we conducted 19 interviews with three specialistdoctors, 13 non-specialist doctors, two pharmacists and onelaboratory technician. These respondents were attached to agovernment health center, 11 private clinics, four private hospitals,a private pharmacy and a private diagnostic center. Table 1provides the profiles of the respondents and their respective healthfacilities. A non-specialist doctor working at a private clinic refusedto be interviewed whereas one non-specialist doctors and onespecialist doctor who had agreed to participate and worked at aprivate clinic and a private hospital, respectively, did not have timefor interviews despite repeated attempts by the researchers.
Table 2 provides summary of dominant themes defining localhealth system challenges in delivering quality diabetes care.
1. Health Care DeliveryPlurality in healthcare providers and care delivery
platforms. As enumerated in the methods section, KG Halli,with an area of less than a square kilometer, had several anddiverse healthcare delivery platforms that catered to diabetespatients, most of which belonged to the private sector. All theclinics, some of the hospitals and a health center offered servicesfor a specific duration in a day. Whereas doctors in thegovernment health center were formally trained in allopathy, thedoctors in the private sector were formally trained in differentsystems of medicine. In India, there are at least seven recognizedsystems of medicine apart from allopathy, grouped under theumbrella term AYUSH that refers to ayurveda, yoga, naturopa-thy, unani, siddha, homeopathy, and sowa-rigpa [21]. Of the 14
Table 2. Dominant themes pertaining to local health system challenges in KG Halli.
Health systemelements Dominant themes pertaining to challenges related to specific health system elements
Health care delivery Plurality in healthcare providers and care delivery platforms: KG Halli, with an areaof less than a square kilometer, had several and diverse healthcare delivery platformsthat catered to diabetes patients, most of which belonged to the private sector. Whereasdoctors in the government health center were formally trained in allopathy, the doctorsin the private sector were formally trained in different systems of medicine.
Hospitals providing primary care: All the hospitals explicitly market for and providebasic primary care for diabetes in addition to providing the referral specialist care,creating a significant functional overlap with services provided by private clinics andthe government health center.
Private clinics delaying referrals: ‘‘One thing is that no one [doctor] wants to leave theirpatients. If a patient goes [referred to other facility], he may not come back. They[non-specialist doctors at clinics] have this fear.’’ (R13, private hospital)
Knowledge andinformation
Inadequate use of the patient medical records: Only six of the 15 health facilities inthis study had a system that tracked medical records of diabetes patients.
Periodically updating the knowledge of doctors & influence of pharmaceutical industry:Nearly half of all the doctors indicated that they periodically updated their clinical knowledge.The pharmaceutical companies had easy access to doctors for influencing their practice throughpersonal periodic visits by company representatives, sponsoring of continuing medical educationactivities and provision of medical literature to doctors.
Lack of standard treatment protocols: ‘‘No, there is nothing like that [standard treatmentprotocol]. It depends on how we analyze it [diabetes condition] and accordingly treat it.’’(R2, private clinic)
Leadership andgovernance
Poor regulation of the private sector: ‘‘Many doctors in this area are not qualified topractice [allopathy]. But they have been doing it. … We have doctors who have a diplomain acupuncture and are practicing allopathy. Nothing is being done by the government.’’(R7, private clinic)
Poor systemic coordination: There was lack of coordination across different types of healthcareproviders (government, private for-profit and not-for-profit) and across multiple health care deliveryplatforms (clinics, health centers, hospitals).
Widespread bribery: ‘‘… It [kickbacks] happens in 90% of cases. It’s between pharmaceuticalcompany and the doctor. This is rampant in this area.’’ (R18, private pharmacy)
Lack of formal grievance redress platforms: Despite spending considerable amounts of money out oftheir pockets, the patients or community representatives had no formal functional platforms to engagewith the formal healthcare services for expressing grievances, conveying opinions on issues or demanding accountability.
Values andprinciples
Maximization of profit: ‘‘It [healthcare] has become a business nowadays.’’ (R6, private clinic)
Healthcare for poor as a charity: ‘‘We conduct the camps to test blood sugar for free to provide someservices for those who can’t afford even sugar test.’’ (R16, super-specialty private hospital)
Trust deficit among patients and providers: ‘‘Let the patient go to a physician. They will come backto you [non-specialist doctor] for small ailments. You should be happy because it is a circle. Thereshould be no fear that if I send a patient to you, then tomorrow the patient will never come back tome. … I don’t think doctors have this kind of trust today’’ (R1, private clinic)
doi:10.1371/journal.pone.0106522.t002
Local Health Systems and Diabetes Care
PLOS ONE | www.plosone.org 4 September 2014 | Volume 9 | Issue 9 | e106522
doctors interviewed in the private sector, four were trained inayurveda, five in unani and six in allopathy (one non-specialistdoctor had a dual training in ayurveda as well as allopathy).However, all of these doctors, irrespective of their trainingbackground, primarily practiced allopathy, which potentiallycompromised the competence of some of the doctors that werenot formally trained in allopathy.The doctors with training in ayurveda or unani learned to
practice allopathy typically through reading literature and workingearly in their career in one or more of the private hospitals, wherethey observed practice by senior allopathic practitioners. In fact,all the allopathic hospitals but one had a duty doctor whograduated in ayurveda or unani.
‘‘After my studies [in ayurveda], I worked in XXX [a privateallopathic hospital] as a duty doctor. I then worked in XXX[another private allopathic hospital] for six months in nightshifts. … I watch the [allopathic] physicians and my seniordoctors treat the patients. I will read the booklets. That is howI gained knowledge [about allopathy]’’ (R15, private
hospital).
When asked for their opinion, half of the doctors trained inallopathy believed that in the early and borderline cases ofdiabetes, ayurveda, yoga and naturopathy might play a supportiverole, provided this care is done alongside provision of allopathicmedicine and with strict blood glucose monitoring. Their support,at least in principle, for such ‘mix’ of medicines was due to theperceived harmful side effects of allopathic medication comparedwith the perceived safety of AYUSH practices and medications.
‘‘There are some very good medications in ayurveda that canbe used for diabetes treatment for long time without harm. …However, one should control and monitor blood sugar well.’’(R10, government clinic).
‘‘For people with borderline diabetes, alternate medicines like,naturopathy, Ayurveda, yoga or homeopathy will do [work]. Iwelcome it. … If by using it, these [allopathic] medicationscould be reduced, it is good because in allopathy, there is ill inevery pill but there is no pill for every ill.’’ (R1, private clinic).
The doctors with training in ayurveda or unani also suggestedthat these systems have a very limited supportive role in early casesof diabetes and favored mixing this care with allopathy.Despite the favorable attitude, none of the doctors exclusively
trained in allopathy actually practiced mixed medicine. Two of theayurveda and two of the unani-trained doctors occasionally, oftenbecause of patients’ demands, used ayurveda or unani medicationsalong with allopathic medications in the treatment of earlydiabetes. Another non-specialist doctor with dual training inayurveda and allopathy, who treated diabetes patients usingallopathic medications, occasionally referred patients to doctorspracticing AYUSH systems.
Hospitals providing primary care. In the private sector,unlike the government sector, there is no policy or plan torationalize organization of care across different levels of healthservices. All of the hospitals explicitly market for and provide basicprimary care for diabetes in addition to providing the referralspecialist care, creating a significant functional overlap withservices provided by private clinics and the government healthcenter. In fact, more than 90% of all the patients being treated atprivate hospitals were walk-in patients that were not referred from
other health facilities. This situation also occurred at the privatesuper-specialty hospital and led to crowding in the outpatientdepartment of the hospital. Based on different reasoning, aspecialist doctor working at this hospital justified provision ofprimary care; he felt that if poor patients were refused care fromhis hospital (that provides subsidized care) on the basis that theyneeded to consult primary care providers, these poor patientswould altogether fall out of the healthcare net. Furthermore, thisdoctor suggested that his fixed service-timings and fixed salariedremuneration meant that unlike specialists at other privatehospitals working on fee-for-service basis, he did not have to beselective in terms of number of patients or kind of patients he sees.
Private clinics delaying the referrals. Hospital doctorsbelieved that non-specialist doctors at private clinics do not referpatients in time and hold onto their patients until they can’tmanage the patient anymore.
‘‘One thing is that no one [doctor] wants to leave theirpatients. If a patient goes [referred to other facility], he maynot come back. They [non-specialist doctors at clinics] havethis fear.’’ (R13, private hospital).
Once patients were referred to hospitals, these patients were lesslikely to be referred back to clinics, as hospitals also providedprimary care. This explains the apprehension of doctors at clinicsabout ‘losing’ patients by referring them to hospitals.
‘‘No, we don’t get [patients referred back from specialists/hospitals]. It [referral] is good but it depends on the specialist.… Once they [patients] go there [to specialists/hospitals], theywill call them there only.’’ (R3, private clinic).
2. Knowledge and InformationInadequate use of the patient medical records. Only six
of the 15 health facilities in this study had a system that trackedmedical records of diabetes patients. Five of these six facilities (twoprivate clinics, two private hospitals and a government healthcenter) used patient-held, paper-based medical records for patientswith chronic conditions such as diabetes or hypertension. Thisrecord was mainly in the form of a small booklet that could beconveniently carried by patients. In this booklet, doctors recordedinformation about investigations and medications during eachencounter with patients. Patients were expected to bring thebooklet to follow-up visits. Two of the facilities provided bookletsto patients following the diagnosis, whereas patients were expectedto purchase such booklets for themselves in the other threefacilities. Only one of the five facilities had the correspondingfacility-held, paper-based medical records for patients. Addition-ally, one specialist clinic used facility-held, electronic records withno corresponding patient-held records for patients with chronicconditions.The patient-held medical records were advantageous, as they
allowed for the continuity of information across health facilities/providers when patients sought care from other (than regular)facilities, including out of network or emergency facilities.
‘‘If a patient is staying far from this hospital or if a patientdevelops acute myocardial infarction, I don’t want him towaste his crucial time and come to me. He can go across tonearby health facility and show them all the treatment done till
Local Health Systems and Diabetes Care
PLOS ONE | www.plosone.org 5 September 2014 | Volume 9 | Issue 9 | e106522
now [through his medical records].’’ (R16, private super-
specialty hospital).
The majority of the doctors, who did not use a medical recordsystem, expressed its usefulness in improving clinical decision-making. They saw the record as useful because very few of theirpatients carried the loose medical prescription papers issued tothem during earlier visits, making it difficult for doctors to makeinformed decisions. However, lack of time and the lack of humanresources were reported as the common constraints for setting upand using a medical record system for patients.
‘‘They [patients] might bring the last prescription but not all[earlier prescriptions] … It [medical records system] willsurely help but it is very difficult [for me] to get time to keeprecords.’’ (R8, private clinic).
All the five hospitals that were studied used facility-held, paper-based medical records for hospitalized patients. During dischargefrom hospitals, the patients were provided with a dischargesummary. None of the facilities, including those using medicalrecord systems, had an active follow-up or reminder system forpatients. Patients were lost to follow-up. Furthermore, there wasno population-level routine surveillance system for assessingprevalence of diabetes or its risk factors.
Periodically updating the knowledge of doctors &influence of pharmaceutical industry. Nearly half of all thedoctors indicated that they periodically updated their clinicalknowledge. The common educational tools included the continu-ing medical education activities (seminars, lectures) organized byprofessional associations and reading medical literature. Five of thedoctors were members of professional associations. They consid-ered continuing medical education as the major activity of theseassociations that, one or more times, included diabetes as a topic.The pharmaceutical companies had easy access to doctors for
influencing their practice through personal periodic visits bycompany representatives, sponsoring of continuing medicaleducation activities and provision of medical literature to doctors.Interestingly, two of the doctors reportedly used the internet as asource of learning the latest knowledge on diabetes management.
Lack of standard treatment protocols. Despite moderateparticipation in continuing medical education activities, none ofthe doctors except one specialist were aware of any standardtreatment protocol for diabetes management. The managementpractice for diabetes varied across the doctors, beyond theadjustments needed to accommodate for the individual needs ofpatients.
‘‘No, there is nothing like that [standard treatment protocol].It depends on how we analyze it [diabetes condition] andaccordingly treat it.’’ (R2, private clinic).
A few of the doctors, especially those not trained in allopathy,used a ‘trial and error’ approach for deciding on the use ofallopathic medications promoted by pharmaceutical companies.
‘‘Once they [pharmaceutical companies] give [medication]samples, I try with patients. I will see the response, if it isgood, okay, next time I will start with that. If patients don’trespond to it, then I send them to other [allopathic] doctors.’’(R4, private clinic).
Importantly, poverty in KG Halli has also shaped diabetesmanagement practices of the doctors. Some of the doctorsdeviated from the knowledge-based clinical practices to adapt tothe financial situation of patients even if the doctor knew thetreatment would worsen the patient’s health status.
‘‘Most of the patients will come and ask for the [oral] tabletsinstead of insulin injections and we would give them tablets.… Insulin is costly and they have to take all these medications.If we are not doing it, somebody else [doctor] will do it [onpatients’ request].’’ (R14, private hospital).
3. Leadership and GovernancePoor regulation of the private sector. We used a limited
interpretation of regulations by reducing them to the currenttoolbox of formal laws and policies. The laws formulated bygovernments to regulate healthcare, in the context of KG Halli,would require the following: (i) a healthcare provider to have arecognized qualification and a valid registration with the statecouncil of her/his respective system of medicine; (ii) registration ofprivate health facilities with the Karnataka Private MedicalEstablishment Act (2007) that prescribes the norms for healthcareinfrastructure; (iii) a valid trade license for health facilities issued bythe municipal government; and (iv) a No Objection Certificatefrom the Karnataka State Pollution Control Board that prescribesthe norms for bio-waste management.Of the 14 doctors working in the private sector, three knew
about the regulation of bio-waste management, whereas six knewabout the need for a trade license, as well as the registration oftheir facility, under some laws. The majority of them could notrecall the name of the law or its major provisions. The doctors ofonly three of the private facilities (one clinic and two hospitals)were aware of all four regulations, and their facilities were incompliance with these regulations.As mentioned earlier, the eight non-specialist private doctors,
who had a degree in ayurveda or unani, primarily practicedallopathy without a degree or registration to do so. A pharmacistwho ran a private pharmacy did not have the required degree.The majority of allopathy-trained doctors, who favored the mix ofAYUSH with allopathy in treatment of early diabetes, were notsupportive of doctors with AYUSH training that were primarilypracticing allopathy.
‘‘Many doctors in this area are not qualified to practice[allopathy]. But they have been doing it. … We have doctorswho have a diploma in acupuncture and are practicingallopathy. Nothing is being done by the government.’’ (R7,private clinic).
Interestingly, most of the doctors in the private sector, includingthose who were not complying with the prevailing regulations,found these regulations meaningful in improving healthcareservices. These doctors mentioned that the poor disseminationand enforcement of these regulations by government authoritieswas the major reason for non-compliance with regulations byprivate facilities. Another concern was the delay by regulatoryauthorities in processing applications and granting registrations/licenses.
‘‘They [regulations] are required and really good. But as faras the [enforcement] officers are concerned, I have not seen
Local Health Systems and Diabetes Care
PLOS ONE | www.plosone.org 6 September 2014 | Volume 9 | Issue 9 | e106522
them coming down and checking it [compliance]. … Weapplied for the registration around two years ago, still wehaven’t received any response.’’ (R2, private clinic).
Poor systemic coordination. Beyond formal regulations,coordination across different healthcare providers (government,private for-profit and not-for-profit) and across multiple healthcaredelivery platforms (clinics, health centers, hospitals) is an importantregulatory mechanism to steer care providers towards a coherentvision and goal in the local health system.However, basic information, such as the number of health
facilities/doctors in KG Halli and the range of services theyprovide, is not collected by the government or any private player.Although each private facility is expected to provide informationin a prescribed format to the appropriate government healthauthority in their area on a monthly basis, only one of the doctorsin the private sector was aware of the process and had starteddoing so a few months prior to this study.Government health workers or officers had never visited most of
the private health facilities in the area. Some of the private doctorswere not even aware of the location of a government health facilityin the area.
‘‘Nobody [from government] comes here. Till now, in the last20 years of my practice, I have not seen anybody from thegovernment health service coming here.’’ (R8, private clinic).
Within the private sector, only a few doctors who had beenpracticing for many years in the area knew the other doctors in thearea and had a professional interaction with them. There was nocoordination between two of the government facilities, which werelocated close to each other in KG Halli but managed by differentgovernment authorities. All of the super-specialty governmentreferral hospitals (outside KG Halli) were managed by the medicaleducation department of the state government with little or nocoordination with the municipal authority or the health depart-ment of the state government that are supposed to manageprimary care facilities in the city. There was no coordinationbetween the government facility in KG Halli and the privatefacilities for planning the organization of diabetes care.
Widespread bribery. Bribery was common at both theindividual healthcare provider and organizational level. Thekickbacks from the pharmaceutical companies to doctors forwriting particular brands of medication were commonplace.
‘‘… It [kickbacks] happens in 90% of cases. It’s betweenpharmaceutical company and the doctor. This is rampant inthis area.’’ (R18, private pharmacy).
In fact, one of the private health facilities in this study wasowned by a pharmacist, who allowed three doctors to use thatfacility to practice without paying any rent or facility costs if thesedoctors directed their patients to his pharmacy housed in the samebuilding. Interestingly, a private hospital had put a board in thepatients’ waiting area that stated doctors at that hospital do notinsist patients buy medications from any specific pharmacy. Thismessage was to reassure patients who knew that health facilitiesoften associate with specific pharmacies for kickbacks. Similarly,kickbacks from private diagnostic centers to the doctors in the areawere common. In fact, some of the doctors used prescriptionpapers that had the details of a specific private pharmacy orlaboratory printed at the bottom of the papers.
‘‘We have to pay some 25 to 30 percent [of cost of prescribedinvestigations as a kickback] to doctors. We are giving percentto more than 20 to 25 doctors in this area.’’ (R19, privatelaboratory).
Three of the private doctors, who were approached bygovernment regulatory authorities, reported that it was commonfor doctors to bribe the lower-level government officers to get thenecessary license/registration for their facilities or to avoidpunitive actions.
‘‘The inspector had come to me. Mine is an eight feet by eightfeet clinic [smaller than the minimum space needed to run aclinic by law]. I said, what to do sir? I am practicing here forthe past 20 years. Where will I go now? Take 5000 rupees [,USD 83] sir. That drug inspector will not come for anotheryear. Every year go on bribing them, go on practicing.’’ (R1,private clinic).
Lack of formal grievance redress platforms. Because thehighly utilized private health sector works on a fee-for-servicebasis, patients are the major funders of the health system. Despitespending considerable amounts of money out of their pockets, thepatients or community representatives had no functional platformsto engage with the formal healthcare services for expressinggrievances, conveying opinions on issues or demanding account-ability. Such engagement happened rather informally to a verylimited extent as part of the doctor-patient interaction during themedical consultation. In fact, one of the doctors in the privatesector felt that patients prefer to use his hospital because they couldpersonally hold the doctors or other staff accountable because theyhad paid for services.
4. Values and PrinciplesIn mixed health systems, often characterized by a relative lack of
stewardship, identifying common values that generally guide thehealth system is often difficult and not anticipated. We attemptedto highlight the values and principles that were often mentioned bythe healthcare providers during interviews that they believed to beimportant in shaping current medical practice, especially in theprivate sector.
Maximization of profit. Of the seven respondents who werewilling to talk about the guiding factors of current medical practicein the private sector, all but one mentioned that healthcare hasbecome a business in which the medical practice aims to maximizeprofits. Money, and not the patient, is at the center and guides thepractice. Other respondents either refused to express their opinionor had no specific comment on this aspect. The respondentsbelieved that in the past, doctors saw healthcare delivery more as aservice to mankind that should yield a decent income for doctors.However, healthcare is increasingly becoming like any otherbusiness in which profit drives practice. This transition was seen aspart of the larger societal transition in which money is becomingan important preoccupation in the lives of people in all sectors andnot limited to healthcare.
‘‘It [healthcare] has become a business nowadays.’’ (R6,
private clinic).
An allopathic doctor referred to the very expensive medical(allopathic) education system, especially in the private sector, inwhich admissions to the medical schools are literally being
Local Health Systems and Diabetes Care
PLOS ONE | www.plosone.org 7 September 2014 | Volume 9 | Issue 9 | e106522
purchased with huge sums of money, which then forces thesemedical graduates to ‘recover’ finances by charging more to thepatients.
Healthcare for poor as a charity. When patients haddifficulty affording healthcare, the common response from privateproviders was to refer them to a government facility. However,when the required treatment was available within their facilities,three of the private providers waived some of the treatment cost orgave free medications. Five of the doctors in the private sector,who expressed concern towards the poor economic conditions ofpatients, suggested the need to consider paying capacity of patientsas a guiding factor in deciding the fees. The doctors believed incharging more money to patients who could pay and help thosepatients who can’t afford care by charging them less. Apart fromwaivers in treatment cost, some doctors organized free diagnostichealth camps, occasionally with limited supplies of medication, astheir way ‘to help’ poor patients.
‘‘We conduct the camps to test blood sugar for free to providesome services for those who can’t afford even sugar tests.’’(R16, super-specialty private hospital).
Trust deficit among patients and providers. Privatedoctors had strong negative opinions about government healthservices. Coupled with poor coordination between these sectors,this division led to low levels of trust. Implicit with the notion ofreferring poor patients to government hospitals and wealthierpatients to private hospitals, the doctors believed strongly thatgovernment hospitals are poor facilities meant for poor patients.The overcrowding, long waiting times, scarcity of doctors,inadequate time and explanations provided to the patients,negative and even abusive attitudes of health workers, and lackof guidance to navigate chaotic set-ups in large hospitals shape theperceptions about government health facilities. Doctors in theprivate sector were referring poor patients to governmenthospitals, but they were not sure whether these patients wouldreceive the needed treatment in the government hospitals.
‘‘If the patient is very poor, we refer them to XXX[government hospital] or some other government hospital.Otherwise, if the patient can afford, we will send them to aprivate hospital. … \A private hospital will give good services,they will not shout at any patients.’’ (R14, private hospital).
However, a few autonomous super-specialty hospitals (for heartconditions, cancers) were perceived to provide similar care as thesuper-specialty private hospitals.There was a lack of trust between the non-specialist and
specialist doctors, which contributed to the poorly functioningreferral system. As one of the non-specialist doctors working at aprivate clinic who struggled to make referral links work stated:
‘‘Let the patient go to a physician. They will come back to you[non-specialist doctor] for small ailments. You should behappy because it is a circle. There should be no fear that if Isend a patient to you, then tomorrow the patient will nevercome back to me. … I don’t think doctors have this kind oftrust today.’’ (R1, private clinic).
The majority of doctors doubted and often blamed patients forfailing to follow the prescribed treatment and lifestyle changes, andthought the patients were ignorant, unconscious, or illiterate.
‘‘There are many illiterate people in this area. They are notaware of things. I also see many educated people also whodon’t follow (behavior change, medications). They are busywith other things and they are not conscious about it.’’ (R9,private clinic).
Discussion
The analytical frameworkOur study adds to the early experiences [22,23] of applying the
health system dynamics framework in LMIC. The framework wasuseful in shaping the research enquiry and the data analysis from ahealth system perspective. It helped to investigate the systemicimpediments that affected the effective delivery of quality diabetescare, as well as the interconnectedness of various elements of thelocal health system, e.g. a specific financing strategy (fee-for-service) affecting doctors’ behaviors (more patients with shortconsultation time, no time for record keeping) that thereforeaffected healthcare (less attention to prevention and patient-centeredness in care, lack of medical history affecting clinicaldecisions) in a context guided by changing deontological andprofessional values (maximization of profit from medical practice)in many of the private health facilities.However, designing research that enables use of the full scope of
this framework is difficult. The broader scope of the health system(and the framework) that involves many actors/elements and theirinterrelationships poses challenges in sampling the respondentsand designing the tools that help capture all the relevantinformation. In our study, respondents were limited to diabetescare providers, who mostly owned and managed their own healthfacilities. This reduced somewhat the complexity of our research,but was at the same time a limitation of our study, as it provides ananalysis of the local health system from the viewpoint of only oneset of actors. As explained in the introduction section, our earlierwork investigated the perspectives of diabetes patients [17]. Theuse of indirect questioning in the interviews and recording of theobservations at the health facilities helped us to better understandthe issues that respondents would either hesitate to discuss orprovide short answers that were difficult to be taken face value.This method particularly helped to investigate values andprinciples, kickbacks and patients’ participation in health services.
Systemic impediments in diabetes care deliveryThe major gaps in organizing diabetes care identified by our
study were related to the four elements of the local health system:health service delivery, information and knowledge, leadershipand governance, and values and principles guiding the system.Some of the problems identified in our study have been ailing
the urban health systems in India for many years. The governmentof India, in one of its national five year plans developed nearlythree decades ago that included a discussion of non-communicablediseases for the first time, mentioned that ‘‘the organized referralservices are almost non-existent’’ in urban areas [24]. Thegovernment health centers in urban India that were largelyestablished to deliver family planning services in the context of thepopulation control initiatives [25–31] lack provision of compre-hensive primary care, including care for chronic conditions. Thisfactor leads to (highly inefficient) overcrowding of tertiaryhospitals. The multitude of government agencies providinghealthcare at different levels of health services poses considerablecoordination challenges. There are at least seven governmentagencies providing healthcare in Bangalore city, and there is verylimited functional integration and no administrative integration
Local Health Systems and Diabetes Care
PLOS ONE | www.plosone.org 8 September 2014 | Volume 9 | Issue 9 | e106522
across the agencies. The coordination between the governmentand the private sector is currently still a largely utopian task.The regulation of the private health sector, which forms the
dominant part of the healthcare delivery system in urban areas, isyet another challenge. Despite the acknowledgement of the needto regulate the private sector since the early independence period[30], except for a few regulatory initiatives, the federal governmentenacted legislation to regulate the private medical establishmentsin 2010 [32]. However, like our findings from the KG Hallidemonstrate, the enforcement of and the compliance with thevarious private sector regulations remain dismal [33]. Althoughthe organized bodies representing the private healthcare providershave often resisted formal regulation of the private health sector[34,35], our study revealed that individual private healthcareproviders (most did not comply with current regulations) perceivedthe existing regulations as meaningful for ensuring betterhealthcare services. Instead, they blamed the apathy of theregulatory agency for the poor compliance by the private sector.However, there is more to the (local) health systems than formal
regulations and health programs, many of which are formulated athigher (state or national) levels in India. As Gilson [36] states,‘‘health systems are inherently relational and so many of the mostcritical challenges for health systems are relationship and behaviorproblems’’. The actors within the local health system possessdiscretionary powers that, through their daily practice and action,shape healthcare reforms, including leadership and healthcaredelivery in local health systems. Our study revealed that thelimited coordination between the government and the privatehealthcare sector in KG Halli happened in a context in whichgovernment reached out to private doctors (e.g., trying to convincethem to adhere to the tuberculosis treatment guidelines as specifiedby the national tuberculosis control program or providinginterested private providers with vaccines and contraceptivedevices to enhance delivery of preventive and family planningservices). In addition to the legislative measures to regulate theprivate sector, which seem to be poorly enforced and compliedwith, proactive interactions between government and privatehealthcare providers could possibly enhance coordination andrationalization of care within local health system. The presence ofgovernment-initiated disease/condition programs and insuranceschemes provide ‘entry points’ for engagements that could, withimproving relationships over time, broaden the scope beyond theprograms/schemes.The present study, as well as our earlier work [17], revealed the
poor relationships across healthcare providers, as well as betweenhealthcare providers and patients in KG Halli, which contributedto a general lack of trust. We join Gilson [36] in arguing that thegovernment needs to play a role beyond being the provider, funderor regulator of health services to manage the relationships andprocesses that influence the building of trust within local healthsystems. This goal could involve fostering interactions among andacross government and private healthcare providers working in thearea; developing a collective (health) vision for the community;and sharing of information and plans by health facilities thatencourages complementary, if not joint, planning. Studiesexploring the enhancement of leadership and management usingsimilar modalities in a mixed urban local system in South Africahave shown encouraging results [37].An important limitation of our study is that we analyzed the
local health system of a relatively small poor urban neighborhood.The findings related to the health system challenges can thereforenot be generalized to Bangalore city or to other areas in India.However, our findings imply the need for systems thinking in theplanning of health programs for diabetes or other chronic
conditions. Analytically, our study findings would help designingenquiries to understand systemic challenges in delivering care forchronic conditions in LMIC that are facing rising burden ofchronic conditions and share some common challenges in theirmixed health systems [9,38]. The national program for diabetes,which is being piloted in selected districts across India, introducessome ‘new’ (preventive and curative) services within district healthsystems for diabetes patients, but there is still an overlap in careacross different levels of health services [15]. The program aims tointegrate diabetes care delivery into routine government healthservices at various levels, but it does not attempt to address manyof the known systemic weaknesses in the existing governmenthealth system that are so critical to chronic condition care (e.g.,poor information systems, lack of medications in governmentfacilities or non-integration among and across government andprivate healthcare providers).The government of India has recently launched the National
Urban Health Mission, which is a population-based program toimprove the health status of the urban population in general [39].The programs focuses on the urban poor and disadvantaged andproposes a series of health system reforms addressing many of thegaps highlighted in our study, such as strengthening urbanprimary healthcare services including chronic condition care;enhancing referral links across different levels of healthcareservices; and creating institutional platforms for communityparticipation in health services.Despite acknowledging the high utilization of large private
health services by the urban poor, the mission largely focuses onthe government sector. It does not include the private sector (theso-called ‘elephant in the room’) in discussing reforms in thegovernment sector. The 89-page implementation frameworkdedicates a little over one page to mention the regulation of thehealth system [39]. The proposed regulations, including thedevelopment of quality standards for health services, the accred-itation of health facilities and setting up of mechanisms foraddressing user grievances, are all meant for the governmentfacilities and for the limited number of private facilities that themission might purchase. This indicates that the government doesnot have a strong will to regulate the private health sector. Westrongly advocate that the government should take a broader andmore inclusive view of the health system and augment thestewardship of the entire health system. We hope that theautonomy accorded to state and municipal governments incontextualizing the mission plan will consider the challenges aswell as the potential of local health systems to enhance healthcaredelivery, including diabetes care.
Conclusions
There is a lack of functional referral systems and a considerableoverlap in provision of primary diabetes care across the differentlevels of healthcare services. Inadequate use of patient medicalrecords and lack of standard treatment protocols affect clinicaldecision-making. The poor regulation of the private sector, thelack of coordination among and across the government andprivate healthcare providers, the widespread bribery practices andthe absence of any formal grievance redress platforms, reflect weakleadership and governance. There is a huge trust deficit betweenpatients and healthcare providers. The private sector, in which themajority of healthcare providers lack the required training, isguided by profit maximization in which healthcare for poor peopleis, at best, seen as charity. These systemic impediments in localhealth systems hinder the delivery of quality diabetes care to theurban poor. Our findings indicate the urgent need to address these
Local Health Systems and Diabetes Care
PLOS ONE | www.plosone.org 9 September 2014 | Volume 9 | Issue 9 | e106522
systemic weaknesses in local health systems in order to integrateand improve the care for diabetes and other chronic conditions.
Supporting Information
File S1 Interview guide for semi-structured interviewswith healthcare providers.(PDF)
Author Contributions
Conceived and designed the experiments: UB ND AM SDH PK BC.Performed the experiments: UB. Analyzed the data: UB. Contributedreagents/materials/analysis tools: UB. Contributed to the writing of themanuscript: UB. Reviewed and made comments for important revisions inthe draft manuscript: ND AM SDH PK BC.
References
1. Reddy KS, Shah B, Varghese C, Ramadoss A (2005) Responding to the threatof chronic diseases in India. Lancet 366: 1744–1749.
2. International Diabetes Federation (2013) IDF Diabetes Atlas, 6th edn. Brussels:International Diabetes Federation. Available: http://www.idf.org/diabetesatlas.Accessed 20 July 2014.
3. Anand K, Shah B, Yadav K, Singh R, Mathur P, et al. (2007) Are the urbanpoor vulnerable to non-communicable diseases? A survey of risk factors for non-communicable diseases in urban slums of Faridabad. Natl Med J India 20: 115–120.
4. Brashier B, Londhe J, Madas S, Vincent V, Salvi S (2012) Prevalence of self-reported respiratory symptoms, asthma and chronic bronchitis in slum area of arapidly developing Indian city. Open J Respir Dis 02: 73–81.
5. Misra A, Pandey RM, Devi JR, Sharma R, Vikram NK, et al. (2001) Highprevalence of diabetes, obesity and dyslipidaemia in urban slum population innorthern India. Int J Obes 25: 1722–1729.
6. Deepa M, Anjana RM, Manjula D, Narayan KV, Mohan V (2011)Convergence of prevalence rates of diabetes and cardiometabolic risk factorsin middle and low income groups in urban India: 10-year follow-up of theChennai Urban Population Study. J Diabetes Sci Technol 5: 918–927.
7. Kar SS, Thakur JS, Virdi NK, Jain S, Kumar R (2010) Risk factors forcardiovascular diseases: Is the social gradient reversing in nothern India? NatlMed J India 23: 206–209.
8. Bhojani U, Beerenahalli TS, Devadasan R, Munegowda CM, Devadasan N, etal. (2013) No longer diseases of the wealthy: prevalence and health-seeking forself-reported chronic conditions among urban poor in Southern India. BMCHealth Serv Res 13: 306.
9. Samb B, Desai N, Nishtar S, Mendis S, Bekedam H, et al. (2010) Prevention andmanagement of chronic disease: a litmus test for health-systems strengthening inlow-income and middle-income countries. Lancet 376: 1785–1797.
10. Venkataraman K, Kannan AT, Mohan V (2009) Challenges in diabetesmanagement with particular reference to India. Int J Diabetes Dev Ctries 29:103–109.
11. Dans A, Ng N, Varghese C, Tai ES, Firestone R, et al. (2011) The rise of chronicnon-communicable diseases in southeast Asia: time for action. Lancet 377: 680–689.
12. Task Force on Health Systems Research (2005) The Millennium DevelopmentGoals will not be attained without new research addressing health systemconstraints to delivering effective interventions: Report of the Task Force onHealth Systems Research. Available: http://www.who.int/rpc/summit/en/Task_Force_on_Health_Systems_Research.pdf. Accessed 27 March 2014.
13. Alliance for Health Policy and Systems Research (2004) Strengthening healthsystems: the role and promise of policy and systems research. Geneva: GlobalForum for Health Research. 120 p.
14. Kar SS, Thakur JS (2013) Integration of NCD programs in India: Concepts andhealth system perspective. Int J Med Public Heal 3: 215–218.
15. Directorate General of Health Services (2014) National programme forprevention and control of cancer, diabetes, cardiovascular diseases & stroke(NPCDCS): operational guidelines. New Delhi. 61 p. Available: http://health.bih.nic.in/Docs/Guidelines/Guidelines-NPCDCS.pdf. Accessed 27 March2014.
16. Bhojani U, Bs T, Devadasan R, Munegowda C, Devadasan N, et al. (2012) Out-of-pocket healthcare payments on chronic conditions impoverish urban poor inBangalore, India. BMC Public Health 12.
17. Bhojani U, Mishra A, Amruthavalli S, Devadasan N, Kolsteren P, et al. (2013)Constraints faced by urban poor in managing diabetes care: patients’perspectives from South India. Glob Health Action 6.
18. Van Olmen J, Criel B, Van Damme W, Marchal B, Van Belle S, et al. (2010)Analysing health systems to make them stronger. Antwerp: ITG Press.
19. Van Olmen J, Criel B, Bhojani U, Marchal B, Van Belle S, et al. (2012) TheHealth System Dynamics Framework: The introduction of an analytical modelfor health system analysis and its application to two case-studies. Heal Cult Soc2: 1–21.
20. World Health Organization (2007) Everybody’s business: Strengthening healthsystems to improve health outcomes. WHO’s framework for action. Geneva,Switwerland. 98 p.
21. Department of AYUSH (2010) About The Systems - AYUSH, Government ofInd i a . Ava i l ab l e : h t tp ://www. ind i anmed i c ine .n i c . i n/ index1 .asp?lang= 1&linkid = 17&lid = 40. Accessed 27 March 2014.
22. Chenge F, Van Der Vennet J, Van Olmen J, Criel B, Van Belle S (2010)Training of medical doctors in the DRC: consequences of uncontrolled creationof medical schools in the province of Katanga. Geneva: Geneva Health Forum.Available: http://ghf.globalhealthforum.net/download/16073/. Accessed 27March 2014.
23. Pongsupap Y (2010) Experiences of people-centred care in Thailand: Fromdemonstration diffusion to policy transformation. Geneva Health Forum 2010.Geneva: Geneva Health Forum.
24. Planning Commission of India (1985) Health and Family Welfare. 7th Five YearPlan (1985–1990) Vol-2. New Delhi: Planning Commission, Government ofIndia, Vol. 2. Available: http://planningcommission.nic.in/plans/planrel/fiveyr/default.html. Accessed 27 March 2014.
25. The World Bank (1988) Memorandum and recommendation of the president ofthe international development association to the executive directors on aproposed credit of SDR 41.0 (US$57.0 million) to India for the fifth (Bonbay andMadras) population project. 11 p. Available: http://www-wds.worldbank.org/external/default/WDSContentServer/WDSP/IB/1988/05/25/000009265_3960926221458/Rendered/PDF/multi0page.pdf. Accessed 27 March 2014.
26. The World Bank (1992) Memorandum and recommendation of the president ofthe international development association to the executive directors on aproposed credit of SDR 57.7 million to India for a family welfare (urban slums)project. 14 p. Available: http://www-wds.worldbank.org/external/default/WDSContentServer/WDSP/IB/1992/05/28/000009265_3961003011255/Rendered/PDF/multi0page.pdf. Accessed 27 March 2014.
27. Planning Commission of India (1969) Health and Family Planning. 4th Five YearPlan. New Delhi: Planning Commission, Government of India. Available:http://planningcommission.nic.in/plans/planrel/fiveyr/4th/4planch18.htmlAccessed 27 March 2014.
28. Planning Commission of India (1961) Health and Family Planning. 3rd Five YearPlan. New Delhi: Planning Commission, Government of India. Available:http://planningcommission.nic.in/plans/planrel/fiveyr/3rd/3planch32.html.Accessed 27 March 2014.
29. Planning Commission of India (1974) Health, Family Planning and Nutrition.6th Five Year Plan. New Delhi: Planning Commission, Government of India.Available: http://planningcommission.nic.in/plans/planrel/fiveyr/6th/6planch22.html. Accessed 27 March 2014.
30. Planning Commission of India (1951) Health. 1st Five Year Plan (1951–1956).New Delhi: Planning Commission, Government of India. Available: http://planningcommission.nic.in/plans/planrel/fiveyr/default.html. Accessed 27March 2014.
31. Planning Commission of India (1956) Health. 2nd Five Year Plan. New Delhi:Planning Commission, Government of India. Available: http://planningcommission.nic.in/plans/planrel/fiveyr/2nd/2planch25.html. Ac-cessed 27 March 2014.
32. Ministry of Law and Justice (2010) The Clinical Establishments (registration andregulation) Act, 2010: 16. New Delhi, India: Universal Law PublishingCompany.
33. Nandraj S (2012) Unregulated and unaccountable: private health providers.Econ Polit Wkly xlvii: 12–17.
34. Srinivasan S (2013) Regulation and the Medical Profession: Clinical Establish-ment Act, 2010. Econ Polit Wkly XLVIII: 14–16.
35. Sheikh K, Saligram PS, Hort K (2013) What explains regulatory failure?Analysing the architecture of health care regulation in two Indian states. HealthPolicy Plan: 1–17.
36. Gilson L (2003) Trust and the development of health care as a social institution.Soc Sci Med 56: 1453–1468.
37. Elloker S, Olckers P, Gilson L, Lehmann U (2012) Crises, Routines andInnovations: The complexities and possibilities of sub-district management: 161–173.
38. Nishtar S (2010) The mixed health systems syndrome. Bull World Health Organ88: 74–75.
39. Ministry of Health and Family Welfare (2013) National Urban Health Mission:Framework for implementation. New Delhi. 89 p. Available: http://www.pbnrhm.org/docs/nuhm_framework_implementation.pdf. Accessed 27 March2014.
Local Health Systems and Diabetes Care
PLOS ONE | www.plosone.org 10 September 2014 | Volume 9 | Issue 9 | e106522
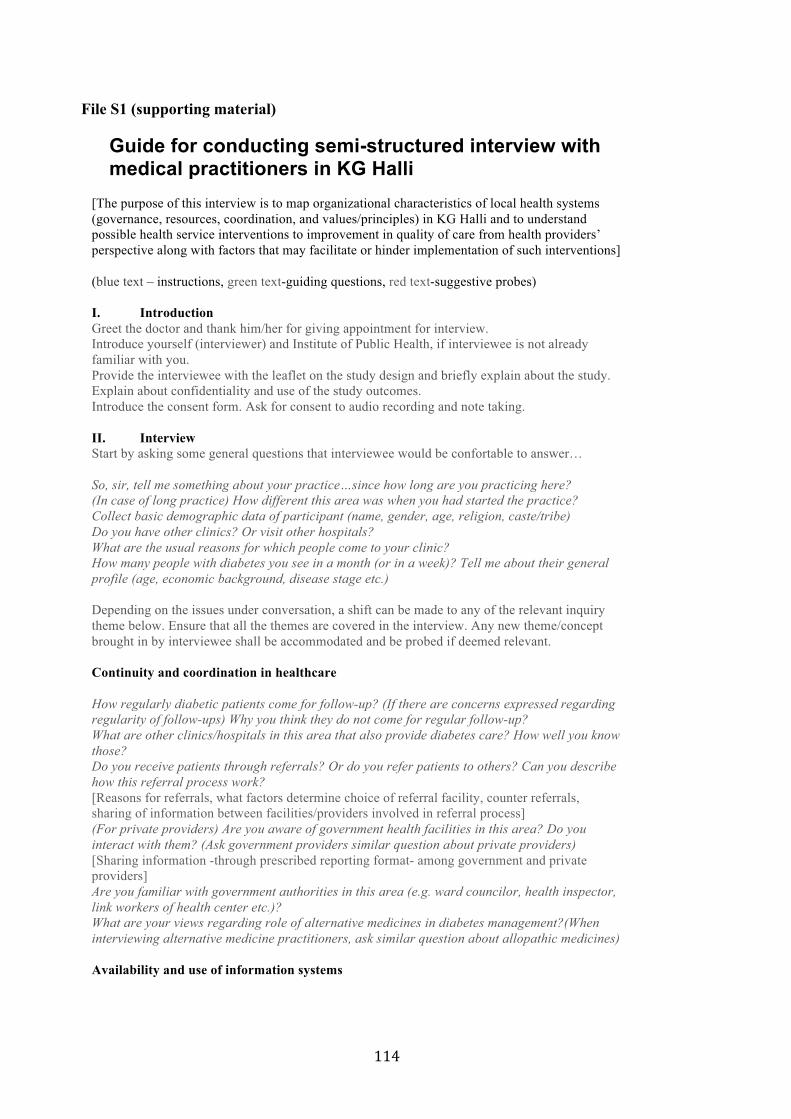
File S1 (supporting material)
Guide for conducting semi-structured interview with medical practitioners in KG Halli
[The purpose of this interview is to map organizational characteristics of local health systems (governance, resources, coordination, and values/principles) in KG Halli and to understand possible health service interventions to improvement in quality of care from health providers’ perspective along with factors that may facilitate or hinder implementation of such interventions] (blue text – instructions, green text-guiding questions, red text-suggestive probes) I. Introduction Greet the doctor and thank him/her for giving appointment for interview. Introduce yourself (interviewer) and Institute of Public Health, if interviewee is not already familiar with you. Provide the interviewee with the leaflet on the study design and briefly explain about the study. Explain about confidentiality and use of the study outcomes. Introduce the consent form. Ask for consent to audio recording and note taking. II. Interview Start by asking some general questions that interviewee would be confortable to answer… So, sir, tell me something about your practice…since how long are you practicing here? (In case of long practice) How different this area was when you had started the practice? Collect basic demographic data of participant (name, gender, age, religion, caste/tribe) Do you have other clinics? Or visit other hospitals? What are the usual reasons for which people come to your clinic? How many people with diabetes you see in a month (or in a week)? Tell me about their general profile (age, economic background, disease stage etc.) Depending on the issues under conversation, a shift can be made to any of the relevant inquiry theme below. Ensure that all the themes are covered in the interview. Any new theme/concept brought in by interviewee shall be accommodated and be probed if deemed relevant. Continuity and coordination in healthcare How regularly diabetic patients come for follow-up? (If there are concerns expressed regarding regularity of follow-ups) Why you think they do not come for regular follow-up? What are other clinics/hospitals in this area that also provide diabetes care? How well you know those? Do you receive patients through referrals? Or do you refer patients to others? Can you describe how this referral process work? [Reasons for referrals, what factors determine choice of referral facility, counter referrals, sharing of information between facilities/providers involved in referral process] (For private providers) Are you aware of government health facilities in this area? Do you interact with them? (Ask government providers similar question about private providers) [Sharing information -through prescribed reporting format- among government and private providers] Are you familiar with government authorities in this area (e.g. ward councilor, health inspector, link workers of health center etc.)? What are your views regarding role of alternative medicines in diabetes management?(When interviewing alternative medicine practitioners, ask similar question about allopathic medicines) Availability and use of information systems
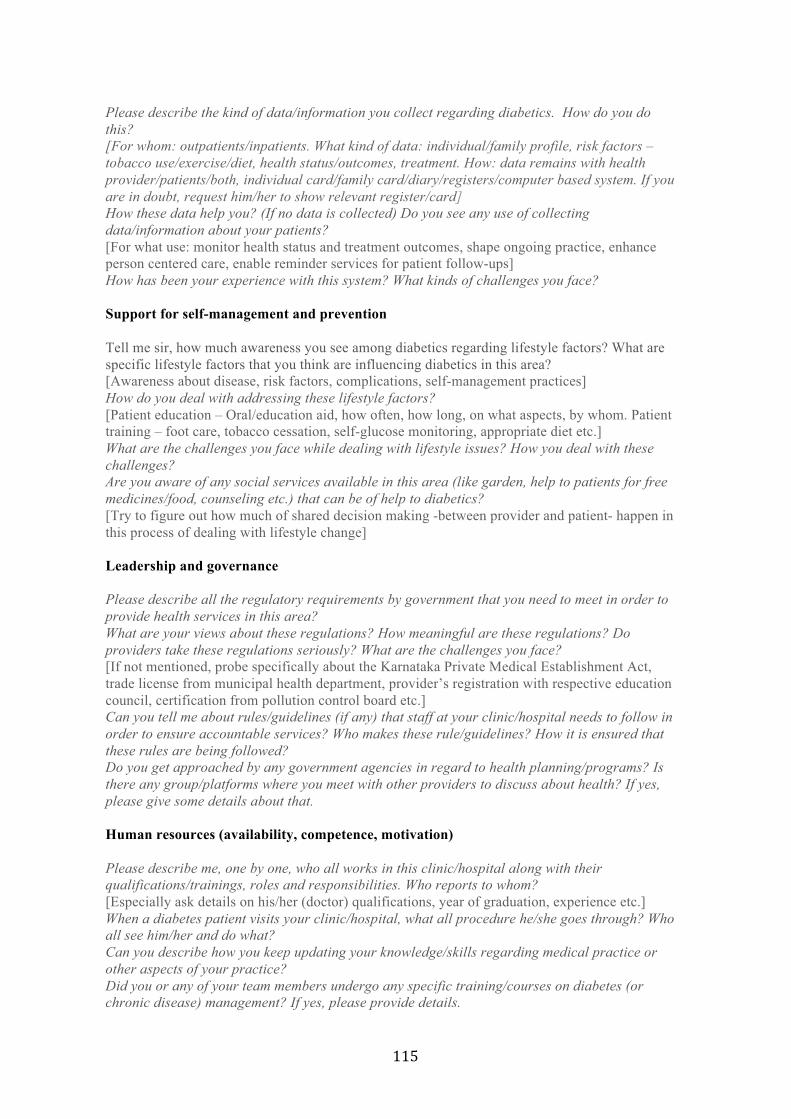
Please describe the kind of data/information you collect regarding diabetics. How do you do this? [For whom: outpatients/inpatients. What kind of data: individual/family profile, risk factors – tobacco use/exercise/diet, health status/outcomes, treatment. How: data remains with health provider/patients/both, individual card/family card/diary/registers/computer based system. If you are in doubt, request him/her to show relevant register/card] How these data help you? (If no data is collected) Do you see any use of collecting data/information about your patients? [For what use: monitor health status and treatment outcomes, shape ongoing practice, enhance person centered care, enable reminder services for patient follow-ups] How has been your experience with this system? What kinds of challenges you face? Support for self-management and prevention Tell me sir, how much awareness you see among diabetics regarding lifestyle factors? What are specific lifestyle factors that you think are influencing diabetics in this area? [Awareness about disease, risk factors, complications, self-management practices] How do you deal with addressing these lifestyle factors? [Patient education – Oral/education aid, how often, how long, on what aspects, by whom. Patient training – foot care, tobacco cessation, self-glucose monitoring, appropriate diet etc.] What are the challenges you face while dealing with lifestyle issues? How you deal with these challenges? Are you aware of any social services available in this area (like garden, help to patients for free medicines/food, counseling etc.) that can be of help to diabetics? [Try to figure out how much of shared decision making -between provider and patient- happen in this process of dealing with lifestyle change] Leadership and governance Please describe all the regulatory requirements by government that you need to meet in order to provide health services in this area? What are your views about these regulations? How meaningful are these regulations? Do providers take these regulations seriously? What are the challenges you face? [If not mentioned, probe specifically about the Karnataka Private Medical Establishment Act, trade license from municipal health department, provider’s registration with respective education council, certification from pollution control board etc.] Can you tell me about rules/guidelines (if any) that staff at your clinic/hospital needs to follow in order to ensure accountable services? Who makes these rule/guidelines? How it is ensured that these rules are being followed? Do you get approached by any government agencies in regard to health planning/programs? Is there any group/platforms where you meet with other providers to discuss about health? If yes, please give some details about that. Human resources (availability, competence, motivation) Please describe me, one by one, who all works in this clinic/hospital along with their qualifications/trainings, roles and responsibilities. Who reports to whom? [Especially ask details on his/her (doctor) qualifications, year of graduation, experience etc.] When a diabetes patient visits your clinic/hospital, what all procedure he/she goes through? Who all see him/her and do what? Can you describe how you keep updating your knowledge/skills regarding medical practice or other aspects of your practice? Did you or any of your team members undergo any specific training/courses on diabetes (or chronic disease) management? If yes, please provide details.
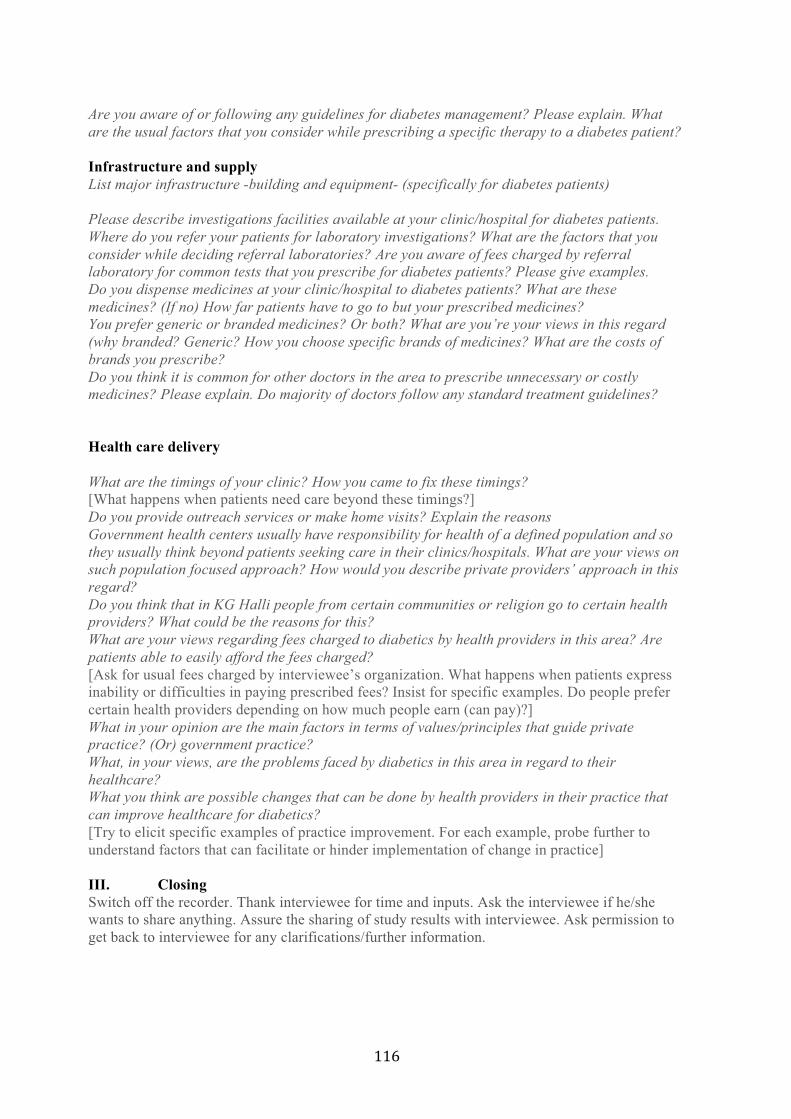
Are you aware of or following any guidelines for diabetes management? Please explain. What are the usual factors that you consider while prescribing a specific therapy to a diabetes patient?
Infrastructure and supply List major infrastructure -building and equipment- (specifically for diabetes patients)
Please describe investigations facilities available at your clinic/hospital for diabetes patients. Where do you refer your patients for laboratory investigations? What are the factors that you consider while deciding referral laboratories? Are you aware of fees charged by referral laboratory for common tests that you prescribe for diabetes patients? Please give examples. Do you dispense medicines at your clinic/hospital to diabetes patients? What are these medicines? (If no) How far patients have to go to but your prescribed medicines? You prefer generic or branded medicines? Or both? What are you’re your views in this regard (why branded? Generic? How you choose specific brands of medicines? What are the costs of brands you prescribe? Do you think it is common for other doctors in the area to prescribe unnecessary or costly medicines? Please explain. Do majority of doctors follow any standard treatment guidelines?
Health care delivery
What are the timings of your clinic? How you came to fix these timings? [What happens when patients need care beyond these timings?] Do you provide outreach services or make home visits? Explain the reasons Government health centers usually have responsibility for health of a defined population and so they usually think beyond patients seeking care in their clinics/hospitals. What are your views on such population focused approach? How would you describe private providers’ approach in this regard? Do you think that in KG Halli people from certain communities or religion go to certain health providers? What could be the reasons for this? What are your views regarding fees charged to diabetics by health providers in this area? Are patients able to easily afford the fees charged? [Ask for usual fees charged by interviewee’s organization. What happens when patients express inability or difficulties in paying prescribed fees? Insist for specific examples. Do people prefer certain health providers depending on how much people earn (can pay)?] What in your opinion are the main factors in terms of values/principles that guide private practice? (Or) government practice? What, in your views, are the problems faced by diabetics in this area in regard to their healthcare? What you think are possible changes that can be done by health providers in their practice that can improve healthcare for diabetics? [Try to elicit specific examples of practice improvement. For each example, probe further to understand factors that can facilitate or hinder implementation of change in practice]
III. ClosingSwitch off the recorder. Thank interviewee for time and inputs. Ask the interviewee if he/shewants to share anything. Assure the sharing of study results with interviewee. Ask permission toget back to interviewee for any clarifications/further information.
Guide for conducting semi-structured interview with pharmacist or laboratory technician (staff) in KG Halli
[The purpose of this interview is to map organizational characteristics of local health systems (governance, resources, coordination, values/principles) in KG Halli and to understand possible health service interventions to improvement in quality of care from health providers’ perspective along with factors that may facilitate or hinder implementation of such interventions] (blue text – instructions, green text-guiding questions, red text-suggestive probes) IV. Introduction Greet the pharmacist or laboratory technician and thank him/her for giving appointment for interview. Introduce yourself (interviewer) and Institute of Public Health, if interviewee is not already familiar with you. Provide the interviewee with the leaflet on the study design and briefly explain about the study. Explain about confidentiality and use of the study outcomes. Introduce the consent form. Ask for consent to audio recording and note taking. V. Interview Start by asking some general questions that interviewee would be confortable to answer… So, tell me something about your work…since how long are you working here? When was this pharmacy/laboratory established? (In case of long work history in the area) How different this area was when you had started working here? Collect basic demographic data of participant (name, gender, age, religion, caste/tribe) Do you own other pharmacies/laboratories? What are the usual investigations for which people come to your clinic? How many people come to you to buy diabetes medicines or (blood sugar/urine sugar) investigations in a day (or in a week)? Tell me about their general profile (age, economic background, disease stage etc.) Depending on the issues under conversation, a shift can be made to any of the relevant inquiry theme below. Ensure that all the themes are covered in the interview. Any new theme/concept brought in by interviewee shall be accommodated and be probed if deemed relevant. Infrastructure and supply List major infrastructure -building and equipment- (specifically in reference to diabetes care) Please describe various medicines or investigations (interviewer can use standard treatment guidelines for DM-2 to be able to enumerate or probe) available at your facility for diabetes patients. How you get medicines or laboratory materials? (In case of pharmacy) How you decide what all brands of medicines to keep? Do you keep generic medicines? Explain reasons. [Try to understand how pharmaceutical representatives (from pharmaceutical companies), doctors’ preferences, pharmacist’s interests, paying capacity of people in the area or other factors affect this?] Do you always have medicines demanded by patients available (or in stock)? Explain instances when patients demand medicines (or brand) that you do not keep? How you deal with this? [Provision of alternative brands, frequency of stock outs, linking patients to another pharmacy etc.]

Service delivery What are the timings of your pharmacy or laboratory? How you came to fix these timings? [Compatibility with timings of nearby clinics/hospitals, what happens when patients need these services beyond these timings?] Do you make home visits? Explain the reasons. (If yes,) describe how such visits are sought/coordinated? How people come to your pharmacy or laboratory? Do medical practitioners refer them? Do they come on their own? (In case of self-referrals) Please describe what kind of people come directly to you to purchase medicines or to undergo blood/urine sugar investigations? Why would you think they come directly to you without consulting their doctor? Is this common in this area? How you deal with such instances? (In case of referrals from doctors) Do they bring any correspondence (prescription, investigation form etc.) from medical practitioner? Do you get patients referred by all the doctors in the area? Who frequently refers patients to your pharmacy or laboratory? Do doctors in this area suggest specific pharmacies or laboratories to their patients or do they leave it up to their patients to choose? What in your opinion affects patients’ choice of specific pharmacy or laboratory? [Choice of pharmacy or laboratory: doctors’ referral, patients’ own choice, distance of laboratory from clinic/hospital, others. Following the flow of the discussion, try to bring in the issue of kickbacks/incentives from pharmacies or laboratories to medical practitioners] What are your views regarding fees charged by laboratories to do blood sugar (or urine sugar) investigations to diabetics in this area? OR what are your views regarding costs of medicines to be bought by diabetics? Are patients able to easily afford the fees charged? (In case of pharmacy) Do patients buy all the medicines (for all the days) prescribed by doctors? (If not) How they decide what to buy and what not to buy? What kind of questions they ask you? [Ask for usual fees charged by interviewee’s organization. What happens when patients express inability or difficulties in paying prescribed fees? Insist for specific examples. Do people prefer certain health providers depending on how much people earn (can pay)?] Do you get feedback/complains from patients using your services? Please explain what are the usual issues raised by patients? How you deal with that? Do you get feedback/complaints from doctors who refer patients to your pharmacy or laboratory? Please give examples of issues raised by doctors in past. [Mechanisms to receive feedback/grievance of patients, to address these grievances. Dynamics of relationship between doctors, pharmacist/laboratory technician/patients] What in your opinion are the main factors (or say values/principles) that underline how pharmacies or laboratories are functioning today? What your thoughts? Are you happy with how this works OR would you like to see any changes? What, in your views, are the problems faced by diabetics in this area in regard to their healthcare? What you think are possible changes that can be done by health providers, pharmacies, and laboratories in their practice that can improve healthcare for diabetics? [Try to elicit specific examples of practice improvement. For each example, probe further to understand factors that can facilitate or hinder implementation of change in practice] Availability and use of information systems Please describe the kind of data/information you collect regarding patients and/or services you render. How do you do this? [What kind of data: services rendered (laboratory investigations or medicines), personal information of patients, referring doctor. How: data remains with pharmacy/laboratory, shared with patient/doctor, registers/computer based system. If you are in doubt, request him/her to show relevant reports/registers] How do you use these data? (If no data is collected) Do you see any use of collecting data/information about your patients? [For what use: improving service management, retrieving old records, reminder to patients] How has been your experience with this system? What kinds of challenges you face?
Human resources (availability, competence, motivation) Please describe me, one by one, who all works in this pharmacy/laboratory along with their qualifications/trainings, roles and responsibilities. Who reports to whom? [Especially ask details on his/her (pharmacist/laboratory technician) qualifications, year of graduation, experience etc.] When a patient visits your pharmacy or laboratory, what all procedure he/she goes through? Who all see him/her and do what? How do you keep yourself updated with new medicines coming in market OR other aspect of your work? Do you or your tem member undergo any training? If yes, please provide details. Leadership and governance Please describe all the regulatory requirements by government that you need to meet in order to provide health services in this area? What are your views about these regulations? How meaningful are these regulations? Do providers take these regulations seriously? What are the challenges you face? [If not mentioned, probe specifically about the Pharmacy Act, Clinical Drugs and Cosmetics Act, trade license from municipal health department, provider’s registration with respective education council, certification from pollution control board etc.] Is there an association or network of pharmacies or laboratories in Bangalore (area/state/national)? Are you part of such network/associations? What is the role played by such network/association? Can you tell me about rules/guidelines (if any) that staff at your pharmacy/laboratory needs to follow in order to ensure accountable services? Who makes these rule/guidelines? How it is ensured that these rules are being followed? Do medical practitioners in the area approach you? Do you approach them? What typically happens when a new pharmacy/laboratory is opened in the area? Is there any group/platforms where you meet with other providers to discuss about health? If yes, please give some details about that. VI. Closing Switch off the recorder. Thank interviewee for time and inputs. Ask the interviewee if he/she wants to share anything. Assure the sharing of study results with interviewee. Ask permission to get back to interviewee for any clarifications/further information.

Chapter 5. Intervention to improve diabetes care
This chapter is based on the paper:
Bhojani U, Kolsteren P, Criel B, De Henauw S, Beerenahally TS, Verstraeten R, Devadasan N. Intervening in the local health system to improve diabetes care: lessons from a health service experiment in a poor urban neighborhood in India. Global Health Action 2015;8:28762.
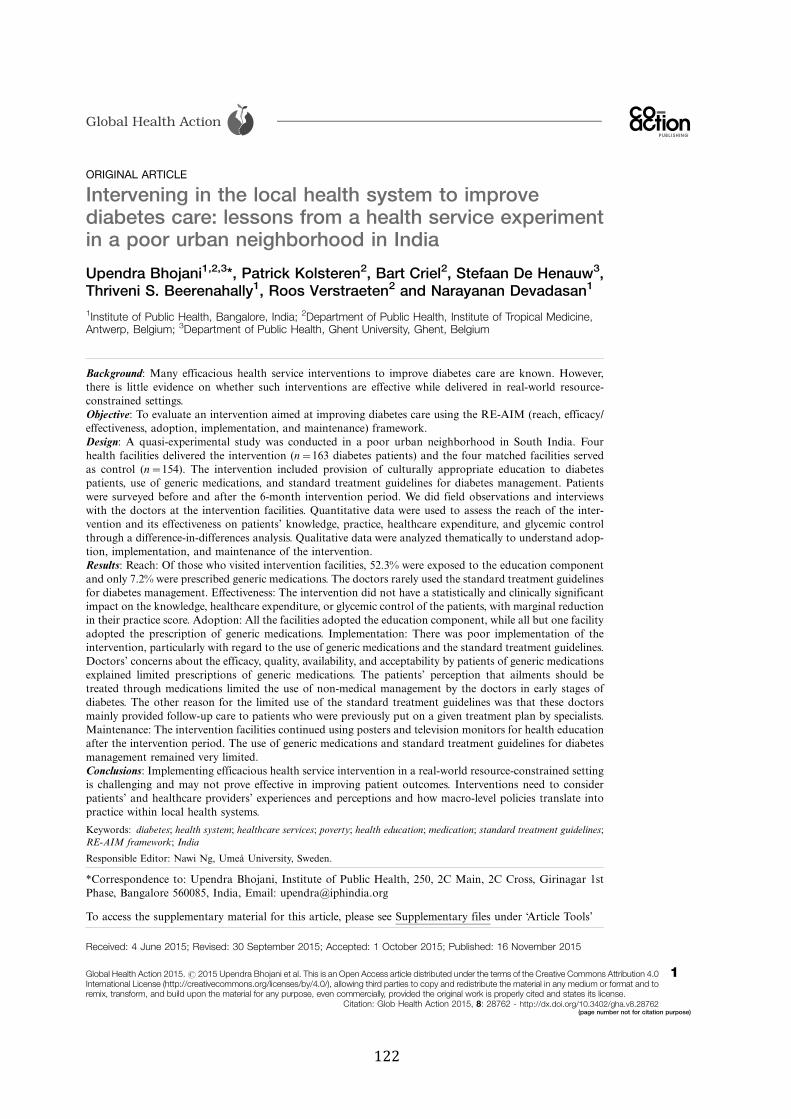
ORIGINAL ARTICLE
Intervening in the local health system to improvediabetes care: lessons from a health service experimentin a poor urban neighborhood in India
Upendra Bhojani1,2,3*, Patrick Kolsteren2, Bart Criel2, Stefaan De Henauw3,Thriveni S. Beerenahally1, Roos Verstraeten2 and Narayanan Devadasan1
1Institute of Public Health, Bangalore, India; 2Department of Public Health, Institute of Tropical Medicine,Antwerp, Belgium; 3Department of Public Health, Ghent University, Ghent, Belgium
Background: Many efficacious health service interventions to improve diabetes care are known. However,there is little evidence on whether such interventions are effective while delivered in real-world resource-constrained settings.Objective: To evaluate an intervention aimed at improving diabetes care using the RE-AIM (reach, efficacy/effectiveness, adoption, implementation, and maintenance) framework.Design: A quasi-experimental study was conducted in a poor urban neighborhood in South India. Fourhealth facilities delivered the intervention (n#163 diabetes patients) and the four matched facilities servedas control (n#154). The intervention included provision of culturally appropriate education to diabetespatients, use of generic medications, and standard treatment guidelines for diabetes management. Patientswere surveyed before and after the 6-month intervention period. We did field observations and interviewswith the doctors at the intervention facilities. Quantitative data were used to assess the reach of the inter-vention and its effectiveness on patients’ knowledge, practice, healthcare expenditure, and glycemic controlthrough a difference-in-differences analysis. Qualitative data were analyzed thematically to understand adop-tion, implementation, and maintenance of the intervention.Results: Reach: Of those who visited intervention facilities, 52.3% were exposed to the education componentand only 7.2% were prescribed generic medications. The doctors rarely used the standard treatment guidelinesfor diabetes management. Effectiveness: The intervention did not have a statistically and clinically significantimpact on the knowledge, healthcare expenditure, or glycemic control of the patients, with marginal reductionin their practice score. Adoption: All the facilities adopted the education component, while all but one facilityadopted the prescription of generic medications. Implementation: There was poor implementation of theintervention, particularly with regard to the use of generic medications and the standard treatment guidelines.Doctors’ concerns about the efficacy, quality, availability, and acceptability by patients of generic medicationsexplained limited prescriptions of generic medications. The patients’ perception that ailments should betreated through medications limited the use of non-medical management by the doctors in early stages ofdiabetes. The other reason for the limited use of the standard treatment guidelines was that these doctorsmainly provided follow-up care to patients who were previously put on a given treatment plan by specialists.Maintenance: The intervention facilities continued using posters and television monitors for health educationafter the intervention period. The use of generic medications and standard treatment guidelines for diabetesmanagement remained very limited.Conclusions: Implementing efficacious health service intervention in a real-world resource-constrained settingis challenging and may not prove effective in improving patient outcomes. Interventions need to considerpatients’ and healthcare providers’ experiences and perceptions and how macro-level policies translate intopractice within local health systems.
Keywords: diabetes; health system; healthcare services; poverty; health education; medication; standard treatment guidelines;RE-AIM framework; India
Responsible Editor: Nawi Ng, Umea University, Sweden.
*Correspondence to: Upendra Bhojani, Institute of Public Health, 250, 2C Main, 2C Cross, Girinagar 1stPhase, Bangalore 560085, India, Email: [email protected]
To access the supplementary material for this article, please see Supplementary files under ‘Article Tools’
Received: 4 June 2015; Revised: 30 September 2015; Accepted: 1 October 2015; Published: 16 November 2015
Global Health Action !
Global Health Action 2015.# 2015 Upendra Bhojani et al. This is an Open Access article distributed under the terms of the Creative Commons Attribution 4.0International License (http://creativecommons.org/licenses/by/4.0/), allowing third parties to copy and redistribute the material in any medium or format and toremix, transform, and build upon the material for any purpose, even commercially, provided the original work is properly cited and states its license.
1
Citation: Glob Health Action 2015, 8: 28762 - http://dx.doi.org/10.3402/gha.v8.28762(page number not for citation purpose)
India is a home to over 68.8 million people with
diabetes, a majority of whom struggle to get quality
healthcare (1). The need to reorient and strengthenthe existing health systems to provide effective response to
the care demands of people with chronic conditions, such
as diabetes, is globally recognized (2). In order to address
the rising burden of diabetes, India launched pilots ofa national program in 2008 that, among other things,
aimed at reorienting the healthcare delivery system (3).
Our earlier study in a poor urban neighborhood in South
India, however, revealed many gaps in the organization ofdiabetes care in the local health system (4). To tackle these
gaps, healthcare providers in the neighborhood were con-
sulted to identify their preferred interventions to improve
diabetes care (5!11). These included, for example, theprovision of culturally appropriate health information as
well as the use of standard treatment guidelines and low-
cost generic medications for diabetes management.Systematic reviews of randomized controlled trials showed
that these suggested interventions are likely to be efficacious.
Health education to diabetes patients has been shown to
improve patients’ knowledge and glycemic control (5!15).Interventions targeted at patients, prior to the consulta-tion, using coaching, checklists, or decision aids (video,
pamphlets) can enhance the patients’ knowledge about
treatment choices, their self-efficacy, their participation in
decision-making, and patient!provider communication(16, 17). Finally, interventions targeting primary care
providers, such as the use of printed educational materials
or personalized outreach educational visits, have been
shown to enhance professional practices of healthcareproviders, including drug prescribing patterns (18, 19).
There is, however, a dearth of studies on the application
of these interventions in real-world settings, especially
in the local health systems of low- and middle-incomecountries. Sanders and Haines (20) emphasize the useful-
ness of health system research, especially implementa-
tion research. There remains a gap between the available
knowledge and translating it into practice within healthsystems (20). More recently, prominent global actors
echoed this need (21). Glasgow et al. (22), in response
to the dominant ‘efficacy’ paradigm of the randomized
controlled trials, developed the RE-AIM framework toanalyze five important aspects of public health interven-
tions (reach, efficacy/effectiveness, adoption, implemen-
tation, and maintenance). Using the RE-AIM framework,
we aimed to evaluate a health service intervention toimprove diabetes care in the local health system of a poor
urban neighborhood.
Methods
Ethics statementThe Institutional Ethics Committee at the Institute ofPublic Health (India), the Institutional Review Board at
the Institute of Tropical Medicine (Belgium) and the EthicsCommittee at the University of Antwerp (Belgium) ap-proved this study. The study was explained to the diabetespatients before informed written consent was sought,separately for the surveys and blood sugar tests. Thestudy was explained to the doctors at the interventionhealth facilities before informed written consent wassought, separately for being part of the study (and agree-ing to implement the intervention) and for the interviewsat the end of the intervention.
Study settingWe conducted the study in Kadugondanahalli (KG Halli),one of the administrative units of Bangalore. Bangalore isa metropolitan city, capital of the southern Indian stateof Karnataka. KG Halli is a poor neighborhood housinga slum and a population of around 45,000 in an area ofless than one square kilometer. It has two governmenthealth centers, one providing limited primary care andthe other providing primary care and some specialist care.It has over 32 private health facilities: Four are hospitalsproviding primary, specialist, and inpatient care, whilethe rest are single-doctor clinics providing primary careon an outpatient basis. Private facilities provide care ona fee-for-service basis. Government centers provide freecare for the people living in below-the-poverty-line house-holds and charge nominal fees to other patients. Formore details on chronic conditions and health systemorganization in KG Halli, please refer to our earlier work(4, 23!25).
Intervention design and componentsWe conducted a quasi-experimental study with an inter-vention and a control group. The Institute of PublicHealth (Bangalore) has been implementing the UrbanHealth Action Research Project in KG Halli since 2009with an aim to improve the quality of healthcare for itsresidents by working with residents, the healthcare pro-viders, and the health authorities. As part of this project,six rounds of dialogue with local healthcare providerswere organized between August 2011 and March 2012 todiscuss residents’ health issues, including chronic condi-tions and the potential solutions (5!10). Subsequently, inJuly 2013, individual meetings were held with doctors !healthcare providers, irrespective of their training back-ground, who serve in clinic or hospitals and are generallythe first point of consultation for diabetes patients ! toshare the findings of an earlier study (4) on gaps inthe organization of diabetes care and to seek their sug-gestions on improving diabetes care (11). Based on theobtained suggestions and literature, we identified threeintervention components: 1) provision of culturally ap-propriate diabetes education; 2) prescription of genericmedications; and 3) use of standard treatment guidelines(STG) for diabetes management. Table 1 provides details onthe intervention that was delivered at the four intervention
Upendra Bhojani et al.
2(page number not for citation purpose)
Citation: Glob Health Action 2015, 8: 28762 - http://dx.doi.org/10.3402/gha.v8.28762
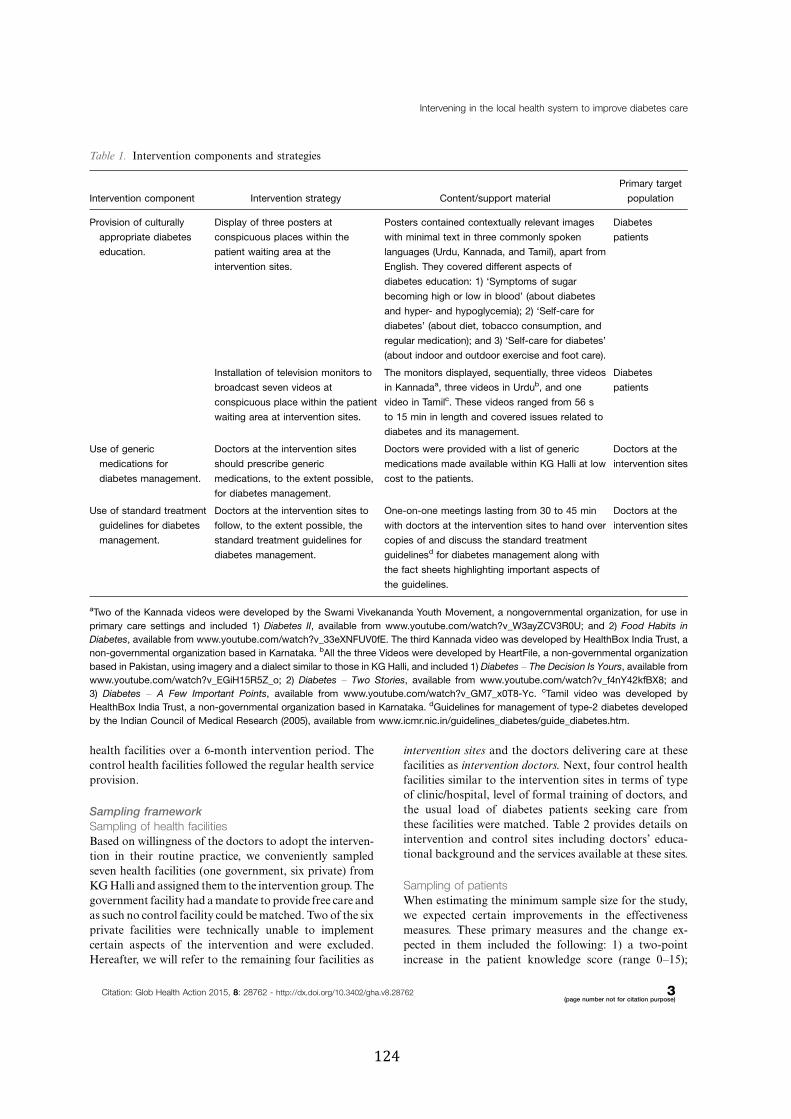
health facilities over a 6-month intervention period. Thecontrol health facilities followed the regular health serviceprovision.
Sampling frameworkSampling of health facilitiesBased on willingness of the doctors to adopt the interven-tion in their routine practice, we conveniently sampledseven health facilities (one government, six private) fromKGHalli and assigned them to the intervention group. Thegovernment facility had amandate to provide free care andas such no control facility could bematched. Two of the sixprivate facilities were technically unable to implementcertain aspects of the intervention and were excluded.Hereafter, we will refer to the remaining four facilities as
intervention sites and the doctors delivering care at thesefacilities as intervention doctors. Next, four control healthfacilities similar to the intervention sites in terms of typeof clinic/hospital, level of formal training of doctors, andthe usual load of diabetes patients seeking care fromthese facilities were matched. Table 2 provides details onintervention and control sites including doctors’ educa-tional background and the services available at these sites.
Sampling of patientsWhen estimating the minimum sample size for the study,we expected certain improvements in the effectivenessmeasures. These primary measures and the change ex-pected in them included the following: 1) a two-pointincrease in the patient knowledge score (range 0!15);
Table 1. Intervention components and strategies
Intervention component Intervention strategy Content/support material
Primary target
population
Provision of culturally
appropriate diabetes
education.
Display of three posters at
conspicuous places within the
patient waiting area at the
intervention sites.
Posters contained contextually relevant images
with minimal text in three commonly spoken
languages (Urdu, Kannada, and Tamil), apart from
English. They covered different aspects of
diabetes education: 1) ‘Symptoms of sugar
becoming high or low in blood’ (about diabetes
and hyper- and hypoglycemia); 2) ‘Self-care for
diabetes’ (about diet, tobacco consumption, and
regular medication); and 3) ‘Self-care for diabetes’
(about indoor and outdoor exercise and foot care).
Diabetes
patients
Installation of television monitors to
broadcast seven videos at
conspicuous place within the patient
waiting area at intervention sites.
The monitors displayed, sequentially, three videos
in Kannadaa, three videos in Urdub, and one
video in Tamilc. These videos ranged from 56 s
to 15 min in length and covered issues related to
diabetes and its management.
Diabetes
patients
Use of generic
medications for
diabetes management.
Doctors at the intervention sites
should prescribe generic
medications, to the extent possible,
for diabetes management.
Doctors were provided with a list of generic
medications made available within KG Halli at low
cost to the patients.
Doctors at the
intervention sites
Use of standard treatment
guidelines for diabetes
management.
Doctors at the intervention sites to
follow, to the extent possible, the
standard treatment guidelines for
diabetes management.
One-on-one meetings lasting from 30 to 45 min
with doctors at the intervention sites to hand over
copies of and discuss the standard treatment
guidelinesd for diabetes management along with
the fact sheets highlighting important aspects of
the guidelines.
Doctors at the
intervention sites
aTwo of the Kannada videos were developed by the Swami Vivekananda Youth Movement, a nongovernmental organization, for use in
primary care settings and included 1) Diabetes II, available from www.youtube.com/watch?v_W3ayZCV3R0U; and 2) Food Habits in
Diabetes, available from www.youtube.com/watch?v_33eXNFUV0fE. The third Kannada video was developed by HealthBox India Trust, a
non-governmental organization based in Karnataka. bAll the three Videos were developed by HeartFile, a non-governmental organization
based in Pakistan, using imagery and a dialect similar to those in KG Halli, and included 1) Diabetes ! The Decision Is Yours, available from
www.youtube.com/watch?v_EGiH15R5Z_o; 2) Diabetes ! Two Stories, available from www.youtube.com/watch?v_f4nY42kfBX8; and
3) Diabetes ! A Few Important Points, available from www.youtube.com/watch?v_GM7_x0T8-Yc. cTamil video was developed by
HealthBox India Trust, a non-governmental organization based in Karnataka. dGuidelines for management of type-2 diabetes developed
by the Indian Council of Medical Research (2005), available from www.icmr.nic.in/guidelines_diabetes/guide_diabetes.htm.
Intervening in the local health system to improve diabetes care
Citation: Glob Health Action 2015, 8: 28762 - http://dx.doi.org/10.3402/gha.v8.28762 3(page number not for citation purpose)
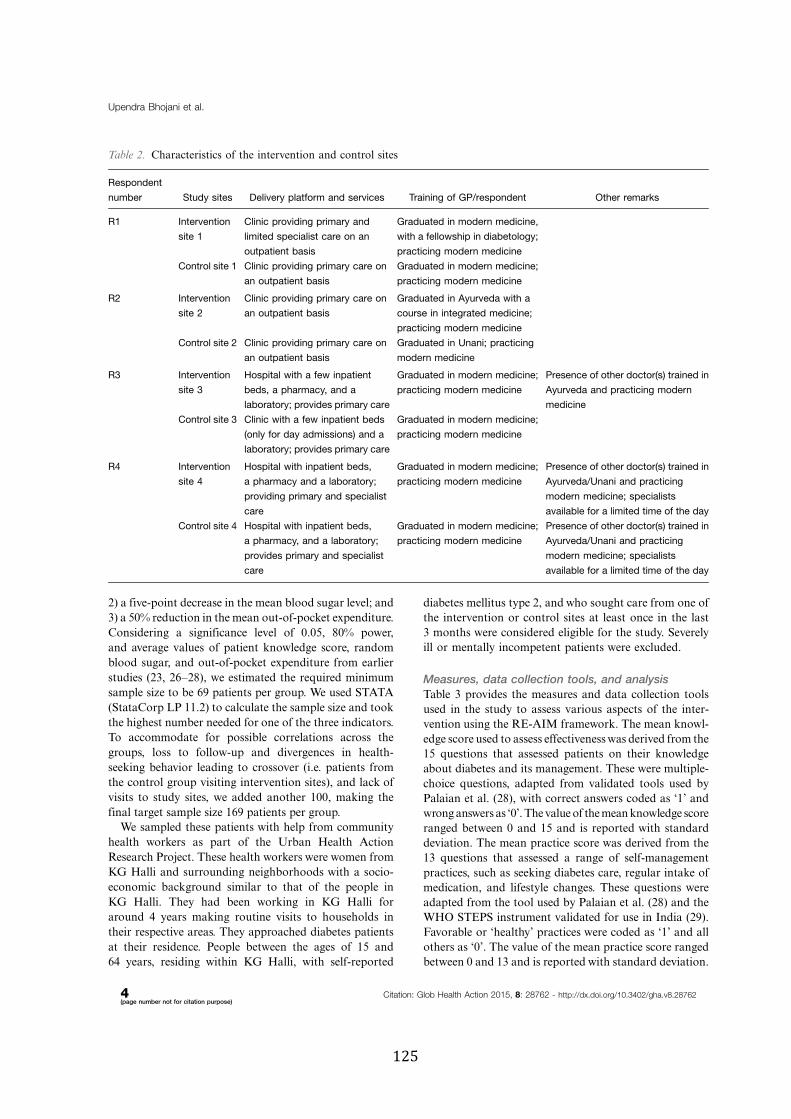
2) a five-point decrease in the mean blood sugar level; and3) a 50% reduction in the mean out-of-pocket expenditure.
Considering a significance level of 0.05, 80% power,and average values of patient knowledge score, random
blood sugar, and out-of-pocket expenditure from earlier
studies (23, 26!28), we estimated the required minimumsample size to be 69 patients per group. We used STATA
(StataCorp LP 11.2) to calculate the sample size and took
the highest number needed for one of the three indicators.To accommodate for possible correlations across the
groups, loss to follow-up and divergences in health-
seeking behavior leading to crossover (i.e. patients fromthe control group visiting intervention sites), and lack of
visits to study sites, we added another 100, making the
final target sample size 169 patients per group.We sampled these patients with help from community
health workers as part of the Urban Health Action
Research Project. These health workers were women fromKG Halli and surrounding neighborhoods with a socio-
economic background similar to that of the people in
KG Halli. They had been working in KG Halli foraround 4 years making routine visits to households in
their respective areas. They approached diabetes patients
at their residence. People between the ages of 15 and64 years, residing within KG Halli, with self-reported
diabetes mellitus type 2, and who sought care from one ofthe intervention or control sites at least once in the last3 months were considered eligible for the study. Severelyill or mentally incompetent patients were excluded.
Measures, data collection tools, and analysisTable 3 provides the measures and data collection toolsused in the study to assess various aspects of the inter-vention using the RE-AIM framework. The mean knowl-edge score used to assess effectivenesswas derived from the15 questions that assessed patients on their knowledgeabout diabetes and its management. These were multiple-choice questions, adapted from validated tools used byPalaian et al. (28), with correct answers coded as ‘1’ andwronganswers as ‘0’. Thevalueof themeanknowledge scoreranged between 0 and 15 and is reported with standarddeviation. The mean practice score was derived from the13 questions that assessed a range of self-managementpractices, such as seeking diabetes care, regular intake ofmedication, and lifestyle changes. These questions wereadapted from the tool used by Palaian et al. (28) and theWHO STEPS instrument validated for use in India (29).Favorable or ‘healthy’ practices were coded as ‘1’ and allothers as ‘0’. The value of the mean practice score rangedbetween 0 and 13 and is reported with standard deviation.
Table 2. Characteristics of the intervention and control sites
Respondent
number Study sites Delivery platform and services Training of GP/respondent Other remarks
R1 Intervention
site 1
Clinic providing primary and
limited specialist care on an
outpatient basis
Graduated in modern medicine,
with a fellowship in diabetology;
practicing modern medicine
Control site 1 Clinic providing primary care on
an outpatient basis
Graduated in modern medicine;
practicing modern medicine
R2 Intervention
site 2
Clinic providing primary care on
an outpatient basis
Graduated in Ayurveda with a
course in integrated medicine;
practicing modern medicine
Control site 2 Clinic providing primary care on
an outpatient basis
Graduated in Unani; practicing
modern medicine
R3 Intervention
site 3
Hospital with a few inpatient
beds, a pharmacy, and a
laboratory; provides primary care
Graduated in modern medicine;
practicing modern medicine
Presence of other doctor(s) trained in
Ayurveda and practicing modern
medicine
Control site 3 Clinic with a few inpatient beds
(only for day admissions) and a
laboratory; provides primary care
Graduated in modern medicine;
practicing modern medicine
R4 Intervention
site 4
Hospital with inpatient beds,
a pharmacy and a laboratory;
providing primary and specialist
care
Graduated in modern medicine;
practicing modern medicine
Presence of other doctor(s) trained in
Ayurveda/Unani and practicing
modern medicine; specialists
available for a limited time of the day
Control site 4 Hospital with inpatient beds,
a pharmacy, and a laboratory;
provides primary and specialist
care
Graduated in modern medicine;
practicing modern medicine
Presence of other doctor(s) trained in
Ayurveda/Unani and practicing
modern medicine; specialists
available for a limited time of the day
Upendra Bhojani et al.
4(page number not for citation purpose)
Citation: Glob Health Action 2015, 8: 28762 - http://dx.doi.org/10.3402/gha.v8.28762
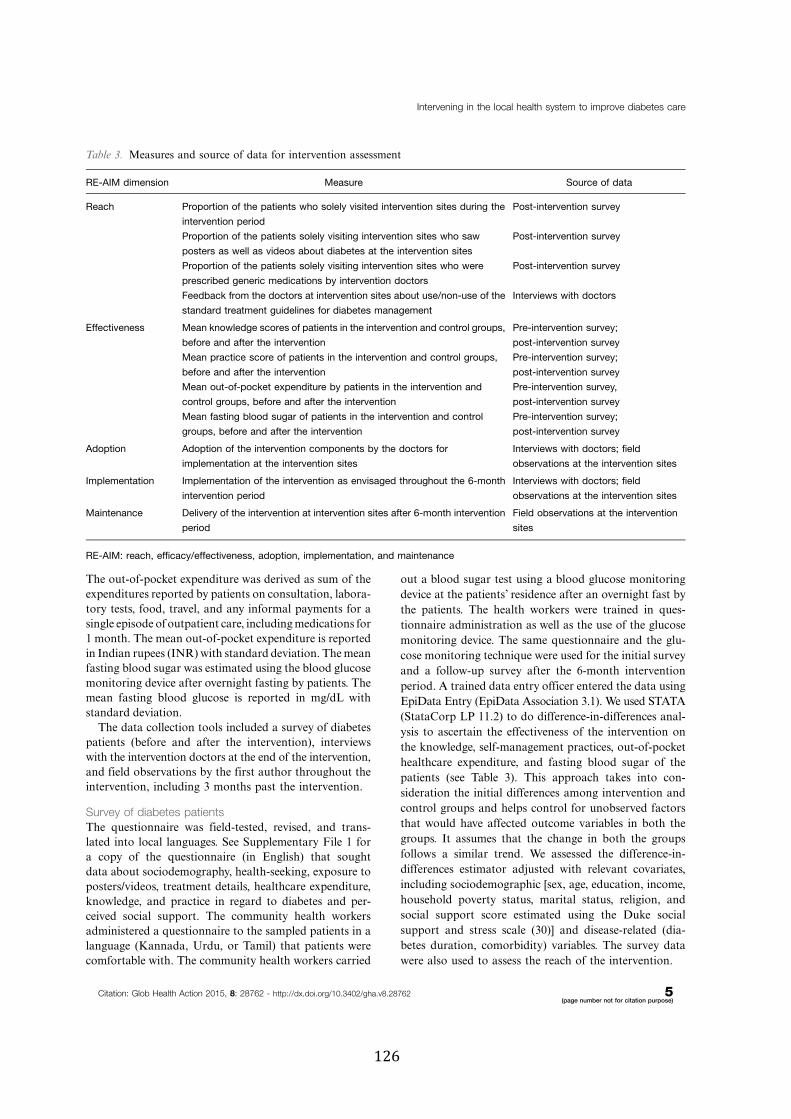
The out-of-pocket expenditure was derived as sum of theexpenditures reported by patients on consultation, labora-tory tests, food, travel, and any informal payments for asingle episode ofoutpatient care, includingmedications for1 month. The mean out-of-pocket expenditure is reportedin Indian rupees (INR) with standard deviation. Themeanfasting blood sugar was estimated using the blood glucosemonitoring device after overnight fasting by patients. Themean fasting blood glucose is reported in mg/dL withstandard deviation.
The data collection tools included a survey of diabetespatients (before and after the intervention), interviewswith the intervention doctors at the end of the intervention,and field observations by the first author throughout theintervention, including 3 months past the intervention.
Survey of diabetes patientsThe questionnaire was field-tested, revised, and trans-lated into local languages. See Supplementary File 1 fora copy of the questionnaire (in English) that soughtdata about sociodemography, health-seeking, exposure toposters/videos, treatment details, healthcare expenditure,knowledge, and practice in regard to diabetes and per-ceived social support. The community health workersadministered a questionnaire to the sampled patients in alanguage (Kannada, Urdu, or Tamil) that patients werecomfortable with. The community health workers carried
out a blood sugar test using a blood glucose monitoring
device at the patients’ residence after an overnight fast by
the patients. The health workers were trained in ques-
tionnaire administration as well as the use of the glucose
monitoring device. The same questionnaire and the glu-
cose monitoring technique were used for the initial survey
and a follow-up survey after the 6-month intervention
period. A trained data entry officer entered the data using
EpiData Entry (EpiData Association 3.1). We used STATA
(StataCorp LP 11.2) to do difference-in-differences anal-
ysis to ascertain the effectiveness of the intervention on
the knowledge, self-management practices, out-of-pocket
healthcare expenditure, and fasting blood sugar of the
patients (see Table 3). This approach takes into con-
sideration the initial differences among intervention and
control groups and helps control for unobserved factors
that would have affected outcome variables in both the
groups. It assumes that the change in both the groups
follows a similar trend. We assessed the difference-in-
differences estimator adjusted with relevant covariates,
including sociodemographic [sex, age, education, income,
household poverty status, marital status, religion, and
social support score estimated using the Duke social
support and stress scale (30)] and disease-related (dia-
betes duration, comorbidity) variables. The survey data
were also used to assess the reach of the intervention.
Table 3. Measures and source of data for intervention assessment
RE-AIM dimension Measure Source of data
Reach Proportion of the patients who solely visited intervention sites during the
intervention period
Post-intervention survey
Proportion of the patients solely visiting intervention sites who saw
posters as well as videos about diabetes at the intervention sites
Post-intervention survey
Proportion of the patients solely visiting intervention sites who were
prescribed generic medications by intervention doctors
Post-intervention survey
Feedback from the doctors at intervention sites about use/non-use of the
standard treatment guidelines for diabetes management
Interviews with doctors
Effectiveness Mean knowledge scores of patients in the intervention and control groups,
before and after the intervention
Pre-intervention survey;
post-intervention survey
Mean practice score of patients in the intervention and control groups,
before and after the intervention
Pre-intervention survey;
post-intervention survey
Mean out-of-pocket expenditure by patients in the intervention and
control groups, before and after the intervention
Pre-intervention survey,
post-intervention survey
Mean fasting blood sugar of patients in the intervention and control
groups, before and after the intervention
Pre-intervention survey;
post-intervention survey
Adoption Adoption of the intervention components by the doctors for
implementation at the intervention sites
Interviews with doctors; field
observations at the intervention sites
Implementation Implementation of the intervention as envisaged throughout the 6-month
intervention period
Interviews with doctors; field
observations at the intervention sites
Maintenance Delivery of the intervention at intervention sites after 6-month intervention
period
Field observations at the intervention
sites
RE-AIM: reach, efficacy/effectiveness, adoption, implementation, and maintenance
Intervening in the local health system to improve diabetes care
Citation: Glob Health Action 2015, 8: 28762 - http://dx.doi.org/10.3402/gha.v8.28762 5(page number not for citation purpose)

Interviews with doctorsAt the end of the intervention period, the first author,with formal training in qualitative research, conductedinterviews with the four intervention doctors to under-stand their experience and views with regard to imple-mentation of the intervention, adaptations that they madeto the initial intervention, impact of the interventionon patients, and sustainability of the intervention. Thedoctors were the respondents of choice, as they ownedand managed the intervention sites while also providinghealthcare to diabetes patients. A semi-structured ques-tioning guide was developed, pretested, and refined (seeSupplementary File 2). Audio-recorded interviews thatlasted 45 to 60 min were conducted in a mix of Englishand Hindi. Open-ended questions were followed withmore specific probes to clarify and extend the responses.Records were transcribed verbatim and translated intoEnglish by a professional transcriptionist. The first authorverified the transcripts based on audio records. Tran-scripts were analyzed by using thematic content analysisto identify emerging themes. Data were organized andcoded using NVivo software (QSR International 8.0) andlater the relationship between and across themes wasexplored using the mind-mapping tool MindNode Lite(IdeasOnCanvas GmbH 1.9.1). Data from the post-intervention survey (about reach of the intervention) andfield observations were used for triangulation.
Field observations and discussions with the doctorsThe first author made follow-up visits to the interventiondoctors once a month to discuss the status of the imple-mentation of the intervention and gather their feedback.He made observations about the implementation of theintervention (especially the television/poster component)as well as about the reactions of the patients and healthworkers. He used a structured observation grid andpointers for discussion with the doctors (see Supplemen-tary File 2). Immediately after the visit, observations andthe discussion were recorded in an online field diary,Evernote (Evernote Corporation 2.0.5). These data wereanalyzed in the same way as the interviews to understandimplementation, adoption, and sustainability aspects ofthe intervention.
Results
Participant characteristicsWe had four interventions and four control sites (seeTable 2). We were able to recruit 317 diabetes patients(163 in the intervention and 154 in the control group)from the community. Table 4 provides sociodemographicand diabetes-related indicators for the sample populationat the baseline. Women constituted over two-thirds of thesample population. The sample population had mean percapita income of INR 1,994.3 (approximately USD 32)
per month. More than one-fourth (28.7%) of the samplepopulation had no formal education. Of the 33.2% of thesample population who earned income, around 28.6%were daily wage earners. The majority of women werehomemakers. The patients in the intervention group hada lower education level and were poorer compared tothose in the control group. However, these differenceswere statistically insignificant.
RE-AIM frameworkReach of the interventionOf the patients recruited into the intervention and con-trol groups, 68.1 and 63% visited solely the interventionand control sites, respectively, at least once during theintervention period. Death, migration out of the studyarea, loss to follow-up, visits to non-selected sites, visitsto both the intervention and the control sites by thesame patients, and not seeking healthcare at all markedhealthcare-seeking for the remaining patients during the6-month intervention (see Fig. 1). Just over half (52.3%)of those who solely sought care from intervention sitesreported seeing posters as well as videos about diabetes.Fewer (7.2%) got generic medications prescribed by theintervention doctors. The doctors at the intervention sitesreported a very limited use of STG in their practice.At two of the intervention sites, doctors who practicedmodern medicine without the required formal trainingsaw diabetes patients. These doctors found the STGuseful and reported using it in their practice. Patients’exposure to the intervention was not related to theirsociodemographic characteristics (sex, age, work, educa-tion, income, household poverty status, marital status,religion, social support) or disease condition (diabetesduration, comorbidity), as these variables had no statis-tically significant association with the probability ofpatients receiving or not receiving the intervention.
Effectiveness of the interventionWe compared effectiveness measures between patientsin the intervention group who were exposed to the fulleducation component (n#58) and those from the controlgroup who had no exposure to the videos and/or postersabout diabetes (n#69). The size of these groups wassmaller than the minimum sample size estimated for thestudy, compromising the power to detect the expectedimpact. We did not assess the effectiveness of the genericmedication and STG components, as only eight patientshad received generic medications in the intervention groupand the intervention doctors rarely used STG for diabetesmanagement. The unadjusted difference-in-differences anal-ysis showed that after the intervention the mean knowl-edge score improved marginally ("0.23) while the meanout-of-pocket expenditure decreased ($29.21). The meanpractice score deteriorated marginally ($0.48) and themean fasting blood sugar level increased ("3.83). Thesechanges were statistically insignificant. After adjusting
Upendra Bhojani et al.
6(page number not for citation purpose)
Citation: Glob Health Action 2015, 8: 28762 - http://dx.doi.org/10.3402/gha.v8.28762
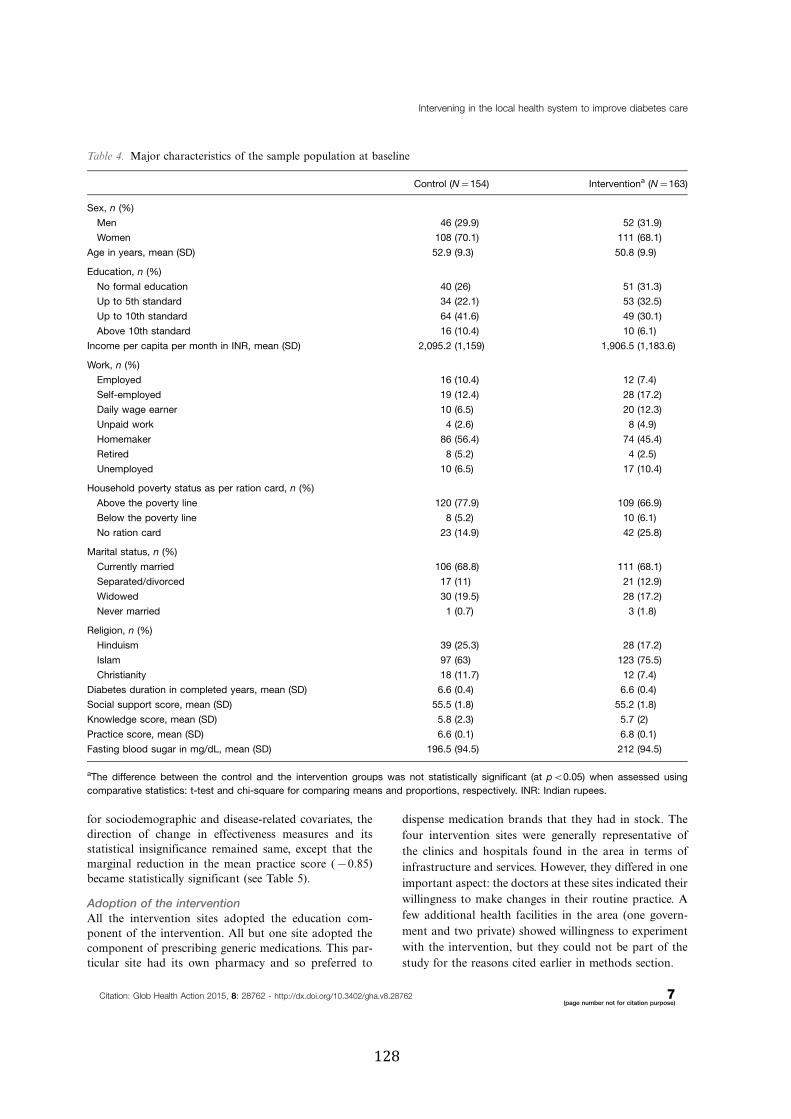
for sociodemographic and disease-related covariates, thedirection of change in effectiveness measures and itsstatistical insignificance remained same, except that themarginal reduction in the mean practice score ($0.85)became statistically significant (see Table 5).
Adoption of the interventionAll the intervention sites adopted the education com-ponent of the intervention. All but one site adopted thecomponent of prescribing generic medications. This par-ticular site had its own pharmacy and so preferred to
dispense medication brands that they had in stock. The
four intervention sites were generally representative of
the clinics and hospitals found in the area in terms of
infrastructure and services. However, they differed in one
important aspect: the doctors at these sites indicated their
willingness to make changes in their routine practice. A
few additional health facilities in the area (one govern-
ment and two private) showed willingness to experiment
with the intervention, but they could not be part of the
study for the reasons cited earlier in methods section.
Table 4. Major characteristics of the sample population at baseline
Control (N#154) Interventiona (N#163)
Sex, n (%)
Men 46 (29.9) 52 (31.9)
Women 108 (70.1) 111 (68.1)
Age in years, mean (SD) 52.9 (9.3) 50.8 (9.9)
Education, n (%)
No formal education 40 (26) 51 (31.3)
Up to 5th standard 34 (22.1) 53 (32.5)
Up to 10th standard 64 (41.6) 49 (30.1)
Above 10th standard 16 (10.4) 10 (6.1)
Income per capita per month in INR, mean (SD) 2,095.2 (1,159) 1,906.5 (1,183.6)
Work, n (%)
Employed 16 (10.4) 12 (7.4)
Self-employed 19 (12.4) 28 (17.2)
Daily wage earner 10 (6.5) 20 (12.3)
Unpaid work 4 (2.6) 8 (4.9)
Homemaker 86 (56.4) 74 (45.4)
Retired 8 (5.2) 4 (2.5)
Unemployed 10 (6.5) 17 (10.4)
Household poverty status as per ration card, n (%)
Above the poverty line 120 (77.9) 109 (66.9)
Below the poverty line 8 (5.2) 10 (6.1)
No ration card 23 (14.9) 42 (25.8)
Marital status, n (%)
Currently married 106 (68.8) 111 (68.1)
Separated/divorced 17 (11) 21 (12.9)
Widowed 30 (19.5) 28 (17.2)
Never married 1 (0.7) 3 (1.8)
Religion, n (%)
Hinduism 39 (25.3) 28 (17.2)
Islam 97 (63) 123 (75.5)
Christianity 18 (11.7) 12 (7.4)
Diabetes duration in completed years, mean (SD) 6.6 (0.4) 6.6 (0.4)
Social support score, mean (SD) 55.5 (1.8) 55.2 (1.8)
Knowledge score, mean (SD) 5.8 (2.3) 5.7 (2)
Practice score, mean (SD) 6.6 (0.1) 6.8 (0.1)
Fasting blood sugar in mg/dL, mean (SD) 196.5 (94.5) 212 (94.5)
aThe difference between the control and the intervention groups was not statistically significant (at pB0.05) when assessed using
comparative statistics: t-test and chi-square for comparing means and proportions, respectively. INR: Indian rupees.
Intervening in the local health system to improve diabetes care
Citation: Glob Health Action 2015, 8: 28762 - http://dx.doi.org/10.3402/gha.v8.28762 7(page number not for citation purpose)

Implementation of the interventionThe implementation of the intervention varied acrossintervention sites as well as across the different compo-nents of the intervention.
Education componentThis component was the most widely implemented; postersand videos were displayed at conspicuous places at allthe four sites. One of the sites preferred the installationof the television monitor inside the consultation room,unlike the other three sites, which installed it in thepatient waiting areas. This decision was mainly due to the
doctor’s concern about the safety/security of the monitor,
as the doctor worked alone at that facility with no sup-
port staff manning the patient waiting area. This change
also meant that at this site the intervention was delivered
individually and selectively to diabetes patients as part of
the consultation process. The researcher’s field observa-
tions indicated that three of the intervention sites routinely
displayed videos during peak consultation hours. How-
ever, one of the sites hardly switched the monitor on.
It was a busy site, and the responsibility for operating the
monitor was vaguely allocated between receptionist and
pharmacist with no supervision, leading to almost no use
Fig. 1. Health-seeking patterns and exposure to the intervention.
Table 5. Impact of the education component of the intervention
Intervention (I) Control (C) Difference (I!C)Unadjusted difference-
in-differences estimator (SD)
Adjusted difference-in-
differences estimatora (SD)
Mean knowledge score (SD)
Before (B) 5.36 (0.22) 5.86 (0.27) $0.49 (0.36) 0.23 (0.51) 0.32 (0.50)
After (A) 6.53 (0.22) 6.80 (0.27) $0.26 (0.36)
Difference (A!B) 1.17* (0.31) 0.94* (0.38)
Mean practice score (SD)
Before (B) 7.41 (0.23) 6.90 (0.21) 0.52 (0.31) $0.48 (0.22) $0.85* (0.37)
After (A) 6.43 (0.17) 6.39 (0.16) 0.04 (0.23)
Difference (A!B) $0.98* (0.29) $0.51 (0.26)
Mean out-of-pocket expenditure
Before (B) 455.57 (44.65) 471.26 (58.50) $15.69 (75.82) $29.21 (187.87) $65.12 (197.18)
After (A) 965.17 (72.28) 1,010.07 (145.34) $44.90 (171.89)
Difference (A!B) 509.60* (84.96) 538.81* (156.67)
Mean fasting blood sugar (mg/dL)
Before (B) 200.26 (10.68) 203.69 (10.09) $3.43 (14.71) 3.83 (0.84) 7.79 (19.39)
After (A) 206.21 (8.18) 205.82 (8.95) 0.40 (12.40)
Difference (A!B) 5.95 (13.48) 2.12 (13.45)
The difference-in-differences estimator was estimated using linear regression. aAdjusted with covariates (sex, age, work, education, per
capital income, household poverty status, marital status, religion, social support score, diabetes duration, comorbidity). *Two-sided
p-valueB0.05.
Upendra Bhojani et al.
8(page number not for citation purpose)
Citation: Glob Health Action 2015, 8: 28762 - http://dx.doi.org/10.3402/gha.v8.28762
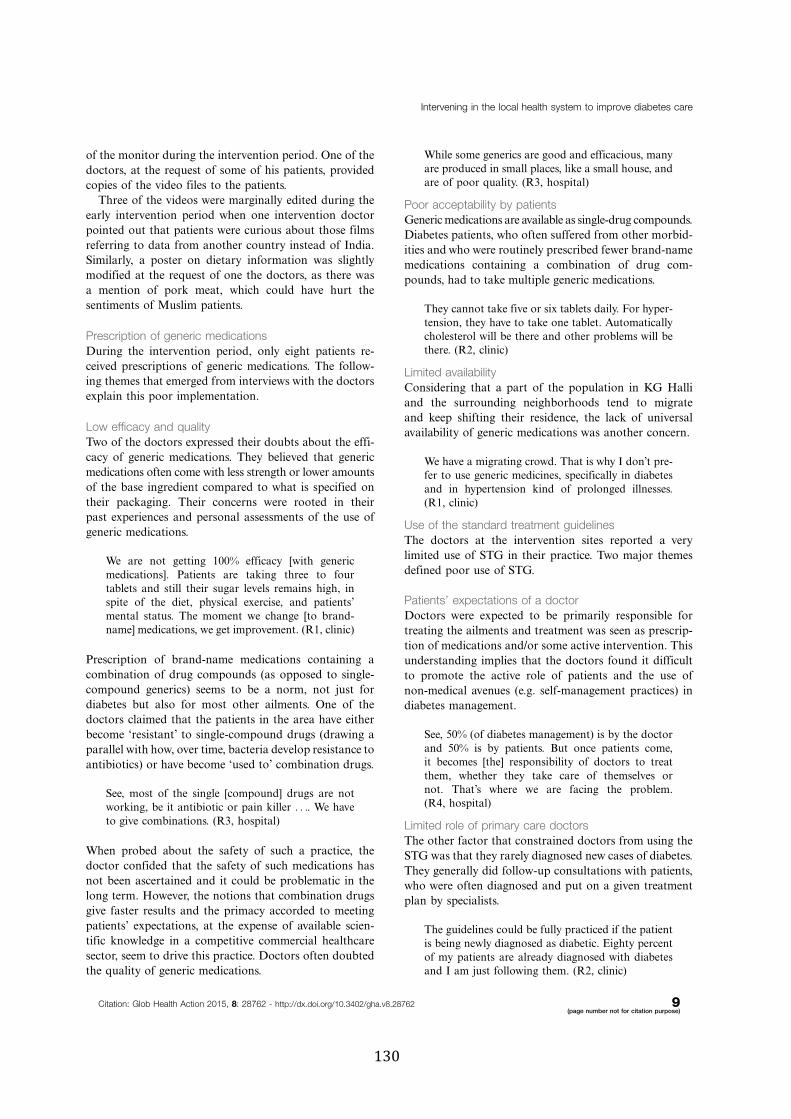
of the monitor during the intervention period. One of thedoctors, at the request of some of his patients, providedcopies of the video files to the patients.
Three of the videos were marginally edited during theearly intervention period when one intervention doctorpointed out that patients were curious about those filmsreferring to data from another country instead of India.Similarly, a poster on dietary information was slightlymodified at the request of one the doctors, as there wasa mention of pork meat, which could have hurt thesentiments of Muslim patients.
Prescription of generic medicationsDuring the intervention period, only eight patients re-ceived prescriptions of generic medications. The follow-ing themes that emerged from interviews with the doctorsexplain this poor implementation.
Low efficacy and qualityTwo of the doctors expressed their doubts about the effi-cacy of generic medications. They believed that genericmedications often come with less strength or lower amountsof the base ingredient compared to what is specified ontheir packaging. Their concerns were rooted in theirpast experiences and personal assessments of the use ofgeneric medications.
We are not getting 100% efficacy [with genericmedications]. Patients are taking three to fourtablets and still their sugar levels remains high, inspite of the diet, physical exercise, and patients’mental status. The moment we change [to brand-name] medications, we get improvement. (R1, clinic)
Prescription of brand-name medications containing acombination of drug compounds (as opposed to single-compound generics) seems to be a norm, not just fordiabetes but also for most other ailments. One of thedoctors claimed that the patients in the area have eitherbecome ‘resistant’ to single-compound drugs (drawing aparallel with how, over time, bacteria develop resistance toantibiotics) or have become ‘used to’ combination drugs.
See, most of the single [compound] drugs are notworking, be it antibiotic or pain killer . . .. We haveto give combinations. (R3, hospital)
When probed about the safety of such a practice, thedoctor confided that the safety of such medications hasnot been ascertained and it could be problematic in thelong term. However, the notions that combination drugsgive faster results and the primacy accorded to meetingpatients’ expectations, at the expense of available scien-tific knowledge in a competitive commercial healthcaresector, seem to drive this practice. Doctors often doubtedthe quality of generic medications.
While some generics are good and efficacious, manyare produced in small places, like a small house, andare of poor quality. (R3, hospital)
Poor acceptability by patientsGenericmedications are available as single-drug compounds.Diabetes patients, who often suffered from other morbid-ities and who were routinely prescribed fewer brand-namemedications containing a combination of drug com-pounds, had to take multiple generic medications.
They cannot take five or six tablets daily. For hyper-tension, they have to take one tablet. Automaticallycholesterol will be there and other problems will bethere. (R2, clinic)
Limited availabilityConsidering that a part of the population in KG Halliand the surrounding neighborhoods tend to migrateand keep shifting their residence, the lack of universalavailability of generic medications was another concern.
We have a migrating crowd. That is why I don’t pre-fer to use generic medicines, specifically in diabetesand in hypertension kind of prolonged illnesses.(R1, clinic)
Use of the standard treatment guidelinesThe doctors at the intervention sites reported a verylimited use of STG in their practice. Two major themesdefined poor use of STG.
Patients’ expectations of a doctorDoctors were expected to be primarily responsible fortreating the ailments and treatment was seen as prescrip-tion of medications and/or some active intervention. Thisunderstanding implies that the doctors found it difficultto promote the active role of patients and the use ofnon-medical avenues (e.g. self-management practices) indiabetes management.
See, 50% (of diabetes management) is by the doctorand 50% is by patients. But once patients come,it becomes [the] responsibility of doctors to treatthem, whether they take care of themselves ornot. That’s where we are facing the problem.(R4, hospital)
Limited role of primary care doctorsThe other factor that constrained doctors from using theSTG was that they rarely diagnosed new cases of diabetes.They generally did follow-up consultations with patients,who were often diagnosed and put on a given treatmentplan by specialists.
The guidelines could be fully practiced if the patientis being newly diagnosed as diabetic. Eighty percentof my patients are already diagnosed with diabetesand I am just following them. (R2, clinic)
Intervening in the local health system to improve diabetes care
Citation: Glob Health Action 2015, 8: 28762 - http://dx.doi.org/10.3402/gha.v8.28762 9(page number not for citation purpose)
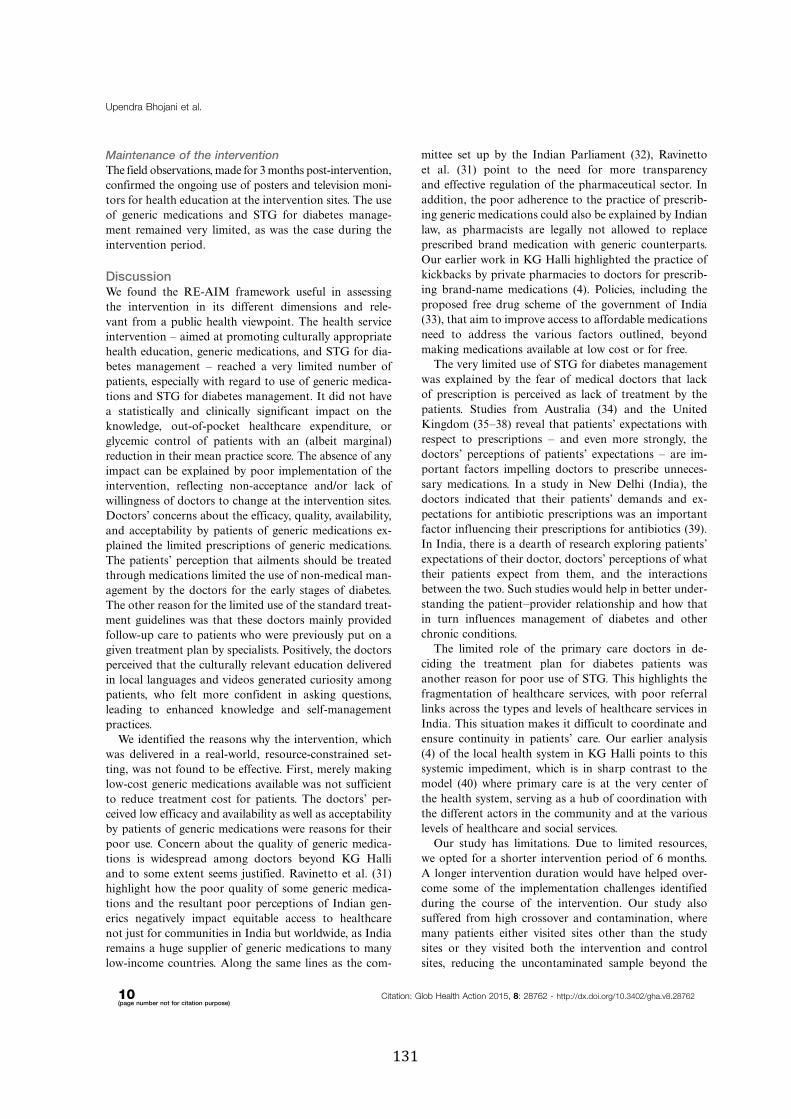
Maintenance of the interventionThe field observations, made for 3months post-intervention,confirmed the ongoing use of posters and television moni-tors for health education at the intervention sites. The useof generic medications and STG for diabetes manage-ment remained very limited, as was the case during theintervention period.
DiscussionWe found the RE-AIM framework useful in assessingthe intervention in its different dimensions and rele-vant from a public health viewpoint. The health serviceintervention ! aimed at promoting culturally appropriatehealth education, generic medications, and STG for dia-betes management ! reached a very limited number ofpatients, especially with regard to use of generic medica-tions and STG for diabetes management. It did not havea statistically and clinically significant impact on theknowledge, out-of-pocket healthcare expenditure, orglycemic control of patients with an (albeit marginal)reduction in their mean practice score. The absence of anyimpact can be explained by poor implementation of theintervention, reflecting non-acceptance and/or lack ofwillingness of doctors to change at the intervention sites.Doctors’ concerns about the efficacy, quality, availability,and acceptability by patients of generic medications ex-plained the limited prescriptions of generic medications.The patients’ perception that ailments should be treatedthrough medications limited the use of non-medical man-agement by the doctors for the early stages of diabetes.The other reason for the limited use of the standard treat-ment guidelines was that these doctors mainly providedfollow-up care to patients who were previously put on agiven treatment plan by specialists. Positively, the doctorsperceived that the culturally relevant education deliveredin local languages and videos generated curiosity amongpatients, who felt more confident in asking questions,leading to enhanced knowledge and self-managementpractices.
We identified the reasons why the intervention, whichwas delivered in a real-world, resource-constrained set-ting, was not found to be effective. First, merely makinglow-cost generic medications available was not sufficientto reduce treatment cost for patients. The doctors’ per-ceived low efficacy and availability as well as acceptabilityby patients of generic medications were reasons for theirpoor use. Concern about the quality of generic medica-tions is widespread among doctors beyond KG Halliand to some extent seems justified. Ravinetto et al. (31)highlight how the poor quality of some generic medica-tions and the resultant poor perceptions of Indian gen-erics negatively impact equitable access to healthcarenot just for communities in India but worldwide, as Indiaremains a huge supplier of generic medications to manylow-income countries. Along the same lines as the com-
mittee set up by the Indian Parliament (32), Ravinetto
et al. (31) point to the need for more transparencyand effective regulation of the pharmaceutical sector. In
addition, the poor adherence to the practice of prescrib-ing generic medications could also be explained by Indian
law, as pharmacists are legally not allowed to replaceprescribed brand medication with generic counterparts.
Our earlier work in KG Halli highlighted the practice ofkickbacks by private pharmacies to doctors for prescrib-ing brand-name medications (4). Policies, including the
proposed free drug scheme of the government of India(33), that aim to improve access to affordable medications
need to address the various factors outlined, beyondmaking medications available at low cost or for free.
The very limited use of STG for diabetes management
was explained by the fear of medical doctors that lackof prescription is perceived as lack of treatment by the
patients. Studies from Australia (34) and the UnitedKingdom (35!38) reveal that patients’ expectations withrespect to prescriptions ! and even more strongly, the
doctors’ perceptions of patients’ expectations ! are im-portant factors impelling doctors to prescribe unneces-
sary medications. In a study in New Delhi (India), thedoctors indicated that their patients’ demands and ex-
pectations for antibiotic prescriptions was an importantfactor influencing their prescriptions for antibiotics (39).
In India, there is a dearth of research exploring patients’expectations of their doctor, doctors’ perceptions of what
their patients expect from them, and the interactionsbetween the two. Such studies would help in better under-
standing the patient!provider relationship and how thatin turn influences management of diabetes and otherchronic conditions.
The limited role of the primary care doctors in de-
ciding the treatment plan for diabetes patients wasanother reason for poor use of STG. This highlights the
fragmentation of healthcare services, with poor referrallinks across the types and levels of healthcare services in
India. This situation makes it difficult to coordinate andensure continuity in patients’ care. Our earlier analysis
(4) of the local health system in KG Halli points to thissystemic impediment, which is in sharp contrast to themodel (40) where primary care is at the very center of
the health system, serving as a hub of coordination withthe different actors in the community and at the various
levels of healthcare and social services.Our study has limitations. Due to limited resources,
we opted for a shorter intervention period of 6 months.
A longer intervention duration would have helped over-come some of the implementation challenges identified
during the course of the intervention. Our study alsosuffered from high crossover and contamination, wheremany patients either visited sites other than the study
sites or they visited both the intervention and controlsites, reducing the uncontaminated sample beyond the
Upendra Bhojani et al.
10(page number not for citation purpose)
Citation: Glob Health Action 2015, 8: 28762 - http://dx.doi.org/10.3402/gha.v8.28762
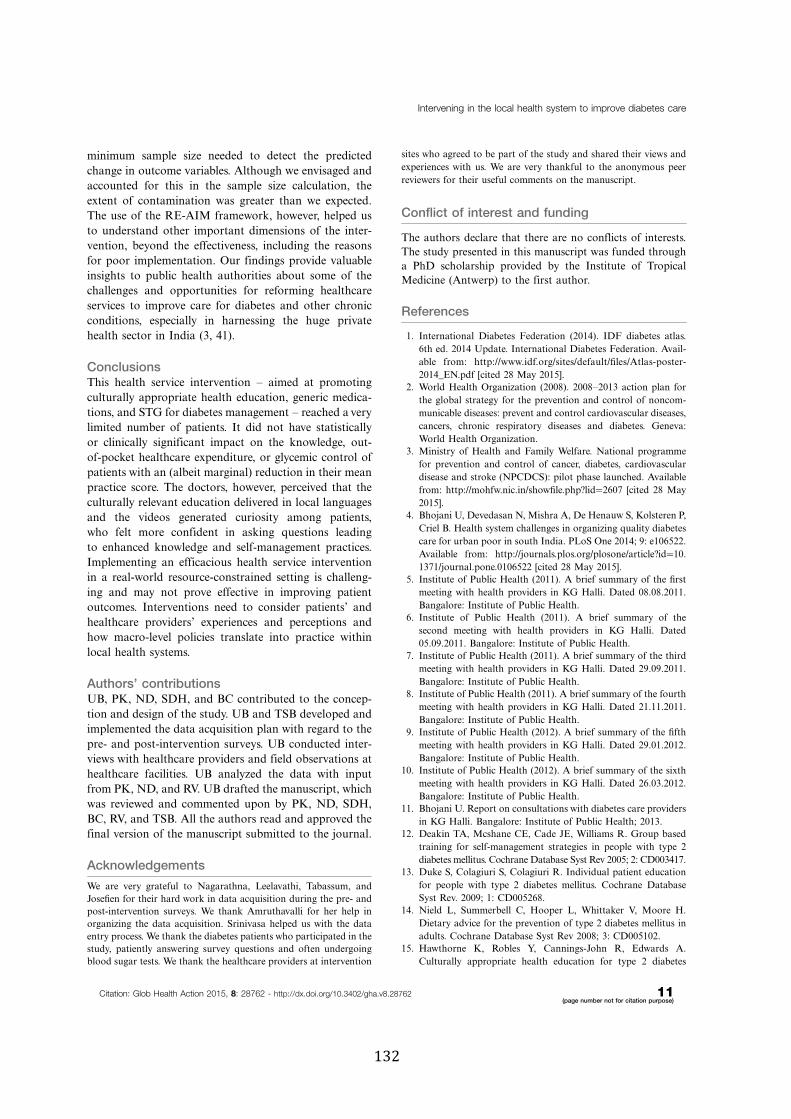
minimum sample size needed to detect the predicted
change in outcome variables. Although we envisaged and
accounted for this in the sample size calculation, the
extent of contamination was greater than we expected.
The use of the RE-AIM framework, however, helped us
to understand other important dimensions of the inter-
vention, beyond the effectiveness, including the reasons
for poor implementation. Our findings provide valuable
insights to public health authorities about some of the
challenges and opportunities for reforming healthcare
services to improve care for diabetes and other chronic
conditions, especially in harnessing the huge private
health sector in India (3, 41).
ConclusionsThis health service intervention ! aimed at promoting
culturally appropriate health education, generic medica-
tions, and STG for diabetes management ! reached a very
limited number of patients. It did not have statistically
or clinically significant impact on the knowledge, out-
of-pocket healthcare expenditure, or glycemic control of
patients with an (albeit marginal) reduction in their mean
practice score. The doctors, however, perceived that the
culturally relevant education delivered in local languages
and the videos generated curiosity among patients,
who felt more confident in asking questions leading
to enhanced knowledge and self-management practices.
Implementing an efficacious health service intervention
in a real-world resource-constrained setting is challeng-
ing and may not prove effective in improving patient
outcomes. Interventions need to consider patients’ and
healthcare providers’ experiences and perceptions and
how macro-level policies translate into practice within
local health systems.
Authors’ contributionsUB, PK, ND, SDH, and BC contributed to the concep-
tion and design of the study. UB and TSB developed and
implemented the data acquisition plan with regard to the
pre- and post-intervention surveys. UB conducted inter-
views with healthcare providers and field observations at
healthcare facilities. UB analyzed the data with input
from PK, ND, and RV. UB drafted the manuscript, which
was reviewed and commented upon by PK, ND, SDH,
BC, RV, and TSB. All the authors read and approved the
final version of the manuscript submitted to the journal.
Acknowledgements
We are very grateful to Nagarathna, Leelavathi, Tabassum, andJosefien for their hard work in data acquisition during the pre- andpost-intervention surveys. We thank Amruthavalli for her help inorganizing the data acquisition. Srinivasa helped us with the dataentry process. We thank the diabetes patients who participated in thestudy, patiently answering survey questions and often undergoingblood sugar tests. We thank the healthcare providers at intervention
sites who agreed to be part of the study and shared their views and
experiences with us. We are very thankful to the anonymous peer
reviewers for their useful comments on the manuscript.
Conflict of interest and funding
The authors declare that there are no conflicts of interests.
The study presented in this manuscript was funded througha PhD scholarship provided by the Institute of Tropical
Medicine (Antwerp) to the first author.
References
1. International Diabetes Federation (2014). IDF diabetes atlas.
6th ed. 2014 Update. International Diabetes Federation. Avail-
able from: http://www.idf.org/sites/default/files/Atlas-poster-
2014_EN.pdf [cited 28 May 2015].2. World Health Organization (2008). 2008!2013 action plan for
the global strategy for the prevention and control of noncom-
municable diseases: prevent and control cardiovascular diseases,
cancers, chronic respiratory diseases and diabetes. Geneva:
World Health Organization.3. Ministry of Health and Family Welfare. National programme
for prevention and control of cancer, diabetes, cardiovascular
disease and stroke (NPCDCS): pilot phase launched. Available
from: http://mohfw.nic.in/showfile.php?lid#2607 [cited 28 May
2015].4. Bhojani U, Devedasan N, Mishra A, De Henauw S, Kolsteren P,
Criel B. Health system challenges in organizing quality diabetes
care for urban poor in south India. PLoS One 2014; 9: e106522.
Available from: http://journals.plos.org/plosone/article?id#10.
1371/journal.pone.0106522 [cited 28 May 2015].5. Institute of Public Health (2011). A brief summary of the first
meeting with health providers in KG Halli. Dated 08.08.2011.
Bangalore: Institute of Public Health.6. Institute of Public Health (2011). A brief summary of the
second meeting with health providers in KG Halli. Dated
05.09.2011. Bangalore: Institute of Public Health.7. Institute of Public Health (2011). A brief summary of the third
meeting with health providers in KG Halli. Dated 29.09.2011.
Bangalore: Institute of Public Health.8. Institute of Public Health (2011). A brief summary of the fourth
meeting with health providers in KG Halli. Dated 21.11.2011.
Bangalore: Institute of Public Health.9. Institute of Public Health (2012). A brief summary of the fifth
meeting with health providers in KG Halli. Dated 29.01.2012.
Bangalore: Institute of Public Health.10. Institute of Public Health (2012). A brief summary of the sixth
meeting with health providers in KG Halli. Dated 26.03.2012.
Bangalore: Institute of Public Health.11. Bhojani U. Report on consultations with diabetes care providers
in KG Halli. Bangalore: Institute of Public Health; 2013.12. Deakin TA, Mcshane CE, Cade JE, Williams R. Group based
training for self-management strategies in people with type 2
diabetes mellitus. Cochrane Database Syst Rev 2005; 2: CD003417.13. Duke S, Colagiuri S, Colagiuri R. Individual patient education
for people with type 2 diabetes mellitus. Cochrane Database
Syst Rev. 2009; 1: CD005268.14. Nield L, Summerbell C, Hooper L, Whittaker V, Moore H.
Dietary advice for the prevention of type 2 diabetes mellitus in
adults. Cochrane Database Syst Rev 2008; 3: CD005102.15. Hawthorne K, Robles Y, Cannings-John R, Edwards A.
Culturally appropriate health education for type 2 diabetes
Intervening in the local health system to improve diabetes care
Citation: Glob Health Action 2015, 8: 28762 - http://dx.doi.org/10.3402/gha.v8.28762 11(page number not for citation purpose)
mellitus in ethnic minority groups. Cochrane Database Syst Rev
2008; 3: CD006424.16. Kinnersley P, Edwards A, Hood K, Cadbury N, Ryan R, Prout
H, et al. Interventions before consultations for helping patients
address their information needs. Cochrane Database Syst Rev
2007; 3: CD004565.17. Stacey D, Bennett CL, Barry MJ, Col NF, Eden KB, Holmes-
Rovner M, et al. Decision aids for people facing health treat-
ment or screening decisions. Cochrane Database Syst Rev 2011;
10: CD001431.18. Giguere A, Legare F, Grimshaw J, Turcotte S, Fiander M,
Grudniewicz A, et al. Printed educational materials: effects on
professional practice and healthcare outcomes. Cochrane Da-
tabase Syst Rev 2012; 10: CD004398.19. O’Brien MA, Rogers S, Jamtvedt G, Oxman AD, Odgaard-
jensen J, Kristoffersen DT, et al. Educational outreach visits:
effects on professional practice and health care outcomes.
Cochrane Database Syst Rev 2007; 4: CD000409.20. Sanders D, Haines A. Implementation research is needed to
achieve international health goals. PLoS Med 2006; 3: e186.21. Health Systems Global (2014). Statement on advancing imple-
mentation research and delivery science. Available from: http://
www.healthsystemsglobal.org/Portals/0/files/signstatement_IRDS/
statement_IRDS.pdf [cited 28 May 2015].22. Glasgow RE, Vogt TM, Boles SM. Evaluating the public
health impact of health promotion interventions: the RE-AIM
framework. Am J Public Health 1999; 89: 1322!7.23. Bhojani U, Thriveni BS, Devadasan R, Munegowda CM,
Devadasan N, Kolsteren P, et al. Out-of-pocket healthcare
payments on chronic conditions impoverish urban poor in
Bangalore, India. BMC Public Health 2012; 12: 990.24. Bhojani U, Mishra A, Amruthavalli S, Devadasan N, Kolsteren
P, De Henauw S, et al. Constraints faced by urban poor in
managing diabetes care: patients’ perspectives from South India.
Glob Health Action 2013; 6: 22258, doi: http://dx.doi.org/10.3402/gha.v6i0.22258
25. Bhojani U, Beerenahalli TS, Devadasan R, Munegowda CM,
Devadasan N, Criel B, et al. No longer diseases of the wealthy:
prevalence and health-seeking for self-reported chronic condi-
tions among urban poor in Southern India. BMC Health Serv
Res 2013; 13: 306.26. Kumar MBJ, Ramesh A, Nagavi BG. Impact of patient edu-
cation in a South Indian community pharmacy on health related
quality of life in patients with diabetes mellitus. Indian J Pharm
Educ Res 2006; 40: 34!9.27. Nekkanti RC. Plasma uric acid levels in patients with diabetes
mellitus and impaired glucose. 2010. Available from: http://www.
rguhs.ac.in/cdc/onlinecdc/uploads/01_M015_4895.doc [cited 28
May 2015].28. Palaian S, Acharya LD, Rao PGM, Shankar PR, Nair NM,
Nair NP. Knowledge, attitude, and practice outcomes: evaluat-
ing the impact of counseling in hospitalized diabetic patients inIndia. Pharm Ther Commun 2006; 31: 383!95.
29. World Health Organization. WHO STEPS instrument (core andexpanded). The WHO STEP wise approach to noncommunic-able disease risk factor surveillance (STEPS). Geneva: WorldHealth Organization. Available from: http://www.who.int/entity/chp/steps/instrument/STEPS_Instrument_V3.1.pdf [cited 28May 2015].
30. Department of Community and Family Medicine Duke Uni-versity Medical Center USA. Duke Social Support and StressScale (DUSOCS). 2014. Available from: http://healthmeasures.mc.duke.edu/images/DUSOCS.pdf [cited 28 May 2015].
31. Ravinetto RM, Dorlo TP, Caudron J-M, Prashanth N. Theglobal impact of Indian generics on access to health. Indian JMed Ethics 2013; 10(2): 118!20.
32. Department-related parliamentary standing committee onhealth and family welfare. Fifty-ninth report on the functioningof the central drugs standard control organization (CDSCO).New Delhi: Rajya Sabha Secretariat; 2012. Available from: http://164.100.47.5/newcommittee/reports/englishcommittees/committeeon health and family welfare/59.pdf [cited 28 May 2015].
33. Chopra R. Government mulls to provide 50 essential drugs freeby year-end, Health ministry seeks Rs 500 cr for scheme. The Eco-nomic Times. 2014. Available from: http://articles.economictimes.indiatimes.com/2014-07-29/news/52186865_1_health-ministry-free-medicines-public-health-facilities [cited 28 May 2015].
34. Cockburn J, Pit S. Prescribing behaviour in clinical practice:patients’ expectations and doctors’ perceptions of patients’ expec-tations a questionnaire study. BMJ 1997; 315: 520!3.
35. Britten N. Patients’ expectations of consultations. Science 2004;328: 416!17.
36. Barry CA, Bradley CP, Britten N, Stevenson FA, Barber N.Patients’ unvoiced agendas in general practice consultations:qualitative study. BMJ 2000; 320: 1246!50.
37. Britten N, Ukoumunne O. The influence of patients’ hopes ofreceiving a prescription on doctors’ perceptions and the decisionto prescribe: a questionnaire survey. BMJ 1997; 315: 1506!10.
38. Little P, Dorward M, Warner G, Stephens K, Senior J, MooreM. Importance of patient pressure and perceived pressure andperceived medical need for investigations, referral, and prescrib-ing in primary care: nested observational study. BMJ 2004;328: 444.
39. Kotwani A, Wattal C, Katewa S, Joshi PC, Holloway K. Factorsinfluencing primary care physicians to prescribe antibiotics inDelhi India. Fam Pract 2010; 27: 684!90.
40. World Health Organization (2008). Primary care: putting peoplefirst. The World Health Report 2008: Primary health care !Now more than ever. Geneva: World Health Organization.
41. Ministry of Health and Family Welfare (2013). National UrbanHealth Mission: framework for implementation. Available from:http://nrhm.gov.in/nhm/nuhm/nuhm-framework-for-implementation.
html [cited 28 May 2015].
Upendra Bhojani et al.
12(page number not for citation purpose)
Citation: Glob Health Action 2015, 8: 28762 - http://dx.doi.org/10.3402/gha.v8.28762
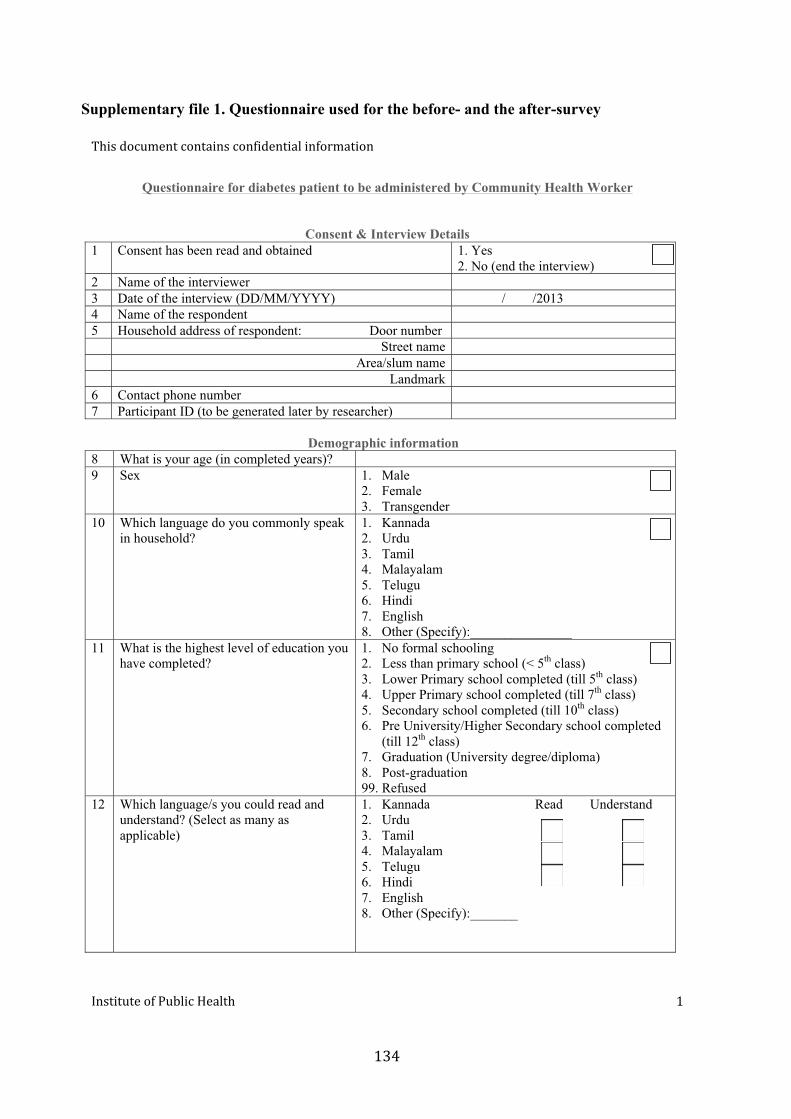
Supplementary file 1. Questionnaire used for the before- and the after-survey
Questionnaire for diabetes patient to be administered by Community Health Worker
Consent & Interview Details 1 Consent has been read and obtained 1. Yes
2. No (end the interview)2 Name of the interviewer 3 Date of the interview (DD/MM/YYYY) / /2013 4 Name of the respondent 5 Household address of respondent: Door number
Street nameArea/slum name
Landmark6 Contact phone number 7 Participant ID (to be generated later by researcher)
Demographic information 8 What is your age (in completed years)? 9 Sex 1. Male
2. Female3. Transgender
10 Which language do you commonly speak in household?
1. Kannada2. Urdu3. Tamil4. Malayalam5. Telugu6. Hindi7. English8. Other (Specify):_______________
11 What is the highest level of education you have completed?
1. No formal schooling2. Less than primary school (< 5th class)3. Lower Primary school completed (till 5th class)4. Upper Primary school completed (till 7th class)5. Secondary school completed (till 10th class)6. Pre University/Higher Secondary school completed
(till 12th class)7. Graduation (University degree/diploma)8. Post-graduation99. Refused
12 Which language/s you could read and understand? (Select as many as applicable)
1. Kannada Read Understand 2. Urdu3. Tamil4. Malayalam5. Telugu6. Hindi7. English8. Other (Specify):_______

13 Religion
1. Hinduism 2. Islam 3. Christianity 4. Others (specify):___________
14 Caste 1. General category 2. Schedule Caste (SC) 3. Schedule Tribe (ST) 4. Other Backward Caste (OBC) 98. Do not know 99. Refused
15 Marital status 1. Never married 2. Currently married 3. Separated 4. Divorced 5. Widowed 99. Refused
16 What describes best your main work status over the last six months?
1. Government employee 2. Private (formal sector) employee 3. Private (informal sector) employee 4. Daily wage earner 5. Self-employed 6. Unpaid work 7. Student 8. Homemaker 9. Retired 10. Unemployed 99. Refused
17 Number of people, including you, living in this household 18 Number of people, including you, who are above 18 years 19 Number of people, including you, who are currently earning members 20 What is your relation with the head of the
household?
1. Self 2. Father 3. Mother 4. Husband 5. Wife 6. Son 7. Daughter 8. Brother 9. Sister 10. Daughter in law 11. Other (Specify):__________________
21 Taking the past year, can you tell me what has been the average monthly earning of the household?
Average Monthly earnings (in INR) 98. Don’t know 99. Refused
22 Availability and type of ration card 1. No ration card 2. Above Poverty Line card 3. Below Poverty Line card 4. Antyodaya card 99. Refused
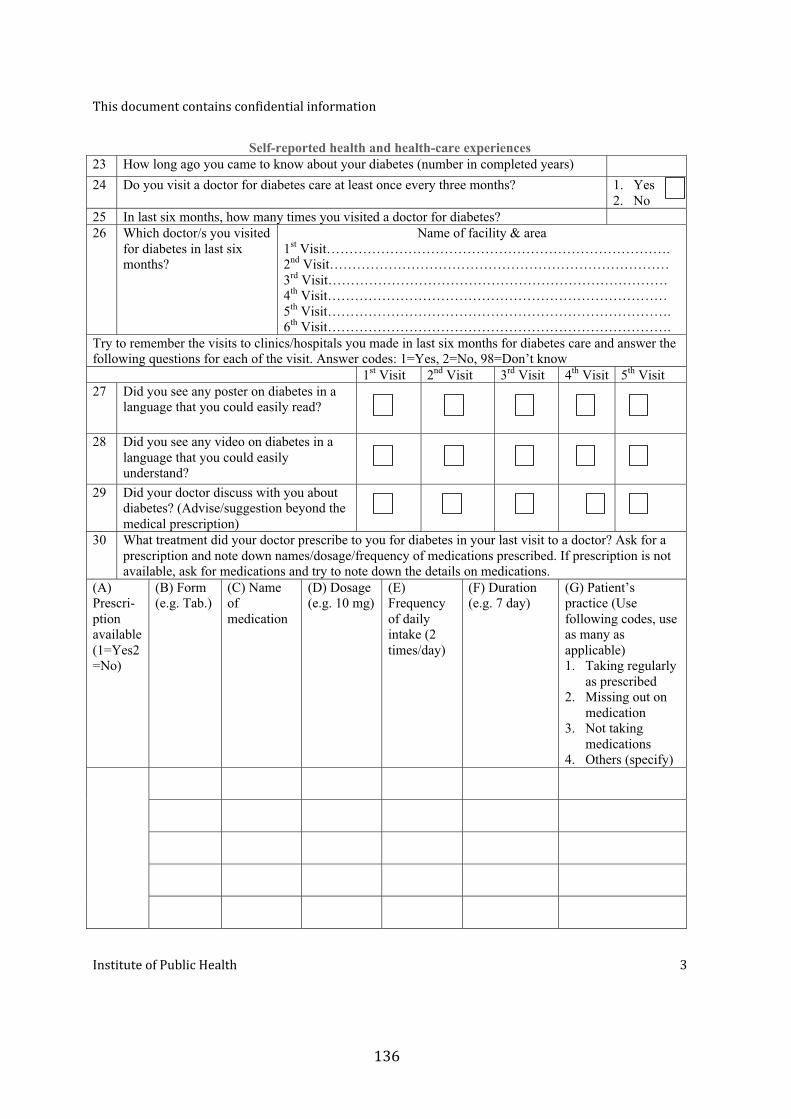
Self-reported health and health-care experiences 23 How long ago you came to know about your diabetes (number in completed years) 24 Do you visit a doctor for diabetes care at least once every three months? 1. Yes
2. No 25 In last six months, how many times you visited a doctor for diabetes? 26 Which doctor/s you visited
for diabetes in last six months?
Name of facility & area 1st Visit…………………………………………………………………. 2nd Visit………………………………………………………………… 3rd Visit………………………………………………………………… 4th Visit………………………………………………………………… 5th Visit…………………………………………………………………. 6th Visit………………………………………………………………….
Try to remember the visits to clinics/hospitals you made in last six months for diabetes care and answer the following questions for each of the visit. Answer codes: 1=Yes, 2=No, 98=Don’t know 1st Visit 2nd Visit 3rd Visit 4th Visit 5th Visit 27 Did you see any poster on diabetes in a
language that you could easily read?
28 Did you see any video on diabetes in a language that you could easily understand?
29 Did your doctor discuss with you about diabetes? (Advise/suggestion beyond the medical prescription)
30 What treatment did your doctor prescribe to you for diabetes in your last visit to a doctor? Ask for a prescription and note down names/dosage/frequency of medications prescribed. If prescription is not available, ask for medications and try to note down the details on medications.
(A) Prescri-ption available (1=Yes2=No)
(B) Form (e.g. Tab.)
(C) Name of medication
(D) Dosage (e.g. 10 mg)
(E) Frequency of daily intake (2 times/day)
(F) Duration (e.g. 7 day)
(G) Patient’s practice (Use following codes, use as many as applicable) 1. Taking regularly
as prescribed 2. Missing out on
medication 3. Not taking
medications 4. Others (specify)
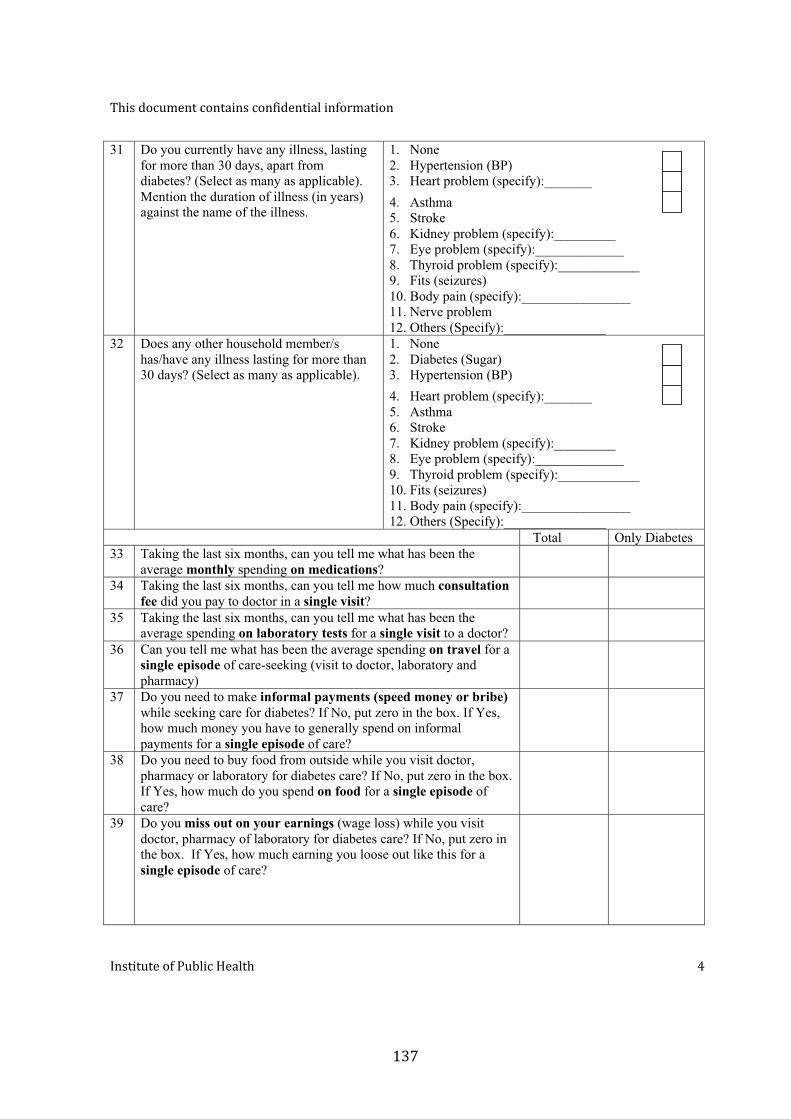
31 Do you currently have any illness, lasting for more than 30 days, apart from diabetes? (Select as many as applicable). Mention the duration of illness (in years) against the name of the illness.
1. None 2. Hypertension (BP) 3. Heart problem (specify):_______ 4. Asthma 5. Stroke 6. Kidney problem (specify):_________ 7. Eye problem (specify):_____________ 8. Thyroid problem (specify):____________ 9. Fits (seizures) 10. Body pain (specify):________________ 11. Nerve problem 12. Others (Specify):_______________
32 Does any other household member/s has/have any illness lasting for more than 30 days? (Select as many as applicable).
1. None 2. Diabetes (Sugar) 3. Hypertension (BP) 4. Heart problem (specify):_______ 5. Asthma 6. Stroke 7. Kidney problem (specify):_________ 8. Eye problem (specify):_____________ 9. Thyroid problem (specify):____________ 10. Fits (seizures) 11. Body pain (specify):________________ 12. Others (Specify):_______________
Total Only Diabetes 33 Taking the last six months, can you tell me what has been the
average monthly spending on medications?
34 Taking the last six months, can you tell me how much consultation fee did you pay to doctor in a single visit?
35 Taking the last six months, can you tell me what has been the average spending on laboratory tests for a single visit to a doctor?
36 Can you tell me what has been the average spending on travel for a single episode of care-seeking (visit to doctor, laboratory and pharmacy)
37 Do you need to make informal payments (speed money or bribe) while seeking care for diabetes? If No, put zero in the box. If Yes, how much money you have to generally spend on informal payments for a single episode of care?
38 Do you need to buy food from outside while you visit doctor, pharmacy or laboratory for diabetes care? If No, put zero in the box. If Yes, how much do you spend on food for a single episode of care?
39 Do you miss out on your earnings (wage loss) while you visit doctor, pharmacy of laboratory for diabetes care? If No, put zero in the box. If Yes, how much earning you loose out like this for a single episode of care?
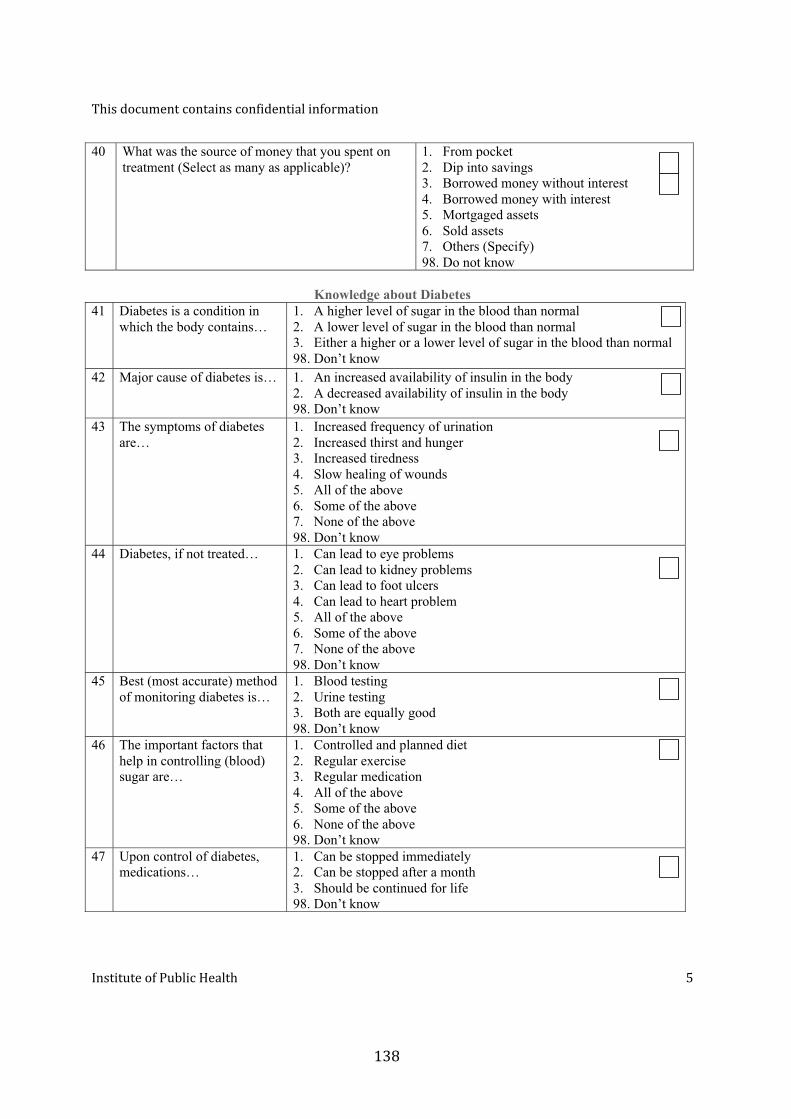
40 What was the source of money that you spent on treatment (Select as many as applicable)?
1. From pocket2. Dip into savings3. Borrowed money without interest4. Borrowed money with interest5. Mortgaged assets6. Sold assets7. Others (Specify)98. Do not know
Knowledge about Diabetes 41 Diabetes is a condition in
which the body contains… 1. A higher level of sugar in the blood than normal2. A lower level of sugar in the blood than normal3. Either a higher or a lower level of sugar in the blood than normal98. Don’t know
42 Major cause of diabetes is… 1. An increased availability of insulin in the body2. A decreased availability of insulin in the body98. Don’t know
43 The symptoms of diabetes are…
1. Increased frequency of urination2. Increased thirst and hunger3. Increased tiredness4. Slow healing of wounds5. All of the above6. Some of the above7. None of the above98. Don’t know
44 Diabetes, if not treated… 1. Can lead to eye problems2. Can lead to kidney problems3. Can lead to foot ulcers4. Can lead to heart problem5. All of the above6. Some of the above7. None of the above98. Don’t know
45 Best (most accurate) method of monitoring diabetes is…
1. Blood testing2. Urine testing3. Both are equally good98. Don’t know
46 The important factors that help in controlling (blood) sugar are…
1. Controlled and planned diet2. Regular exercise3. Regular medication4. All of the above5. Some of the above6. None of the above98. Don’t know
47 Upon control of diabetes, medications…
1. Can be stopped immediately2. Can be stopped after a month3. Should be continued for life98. Don’t know
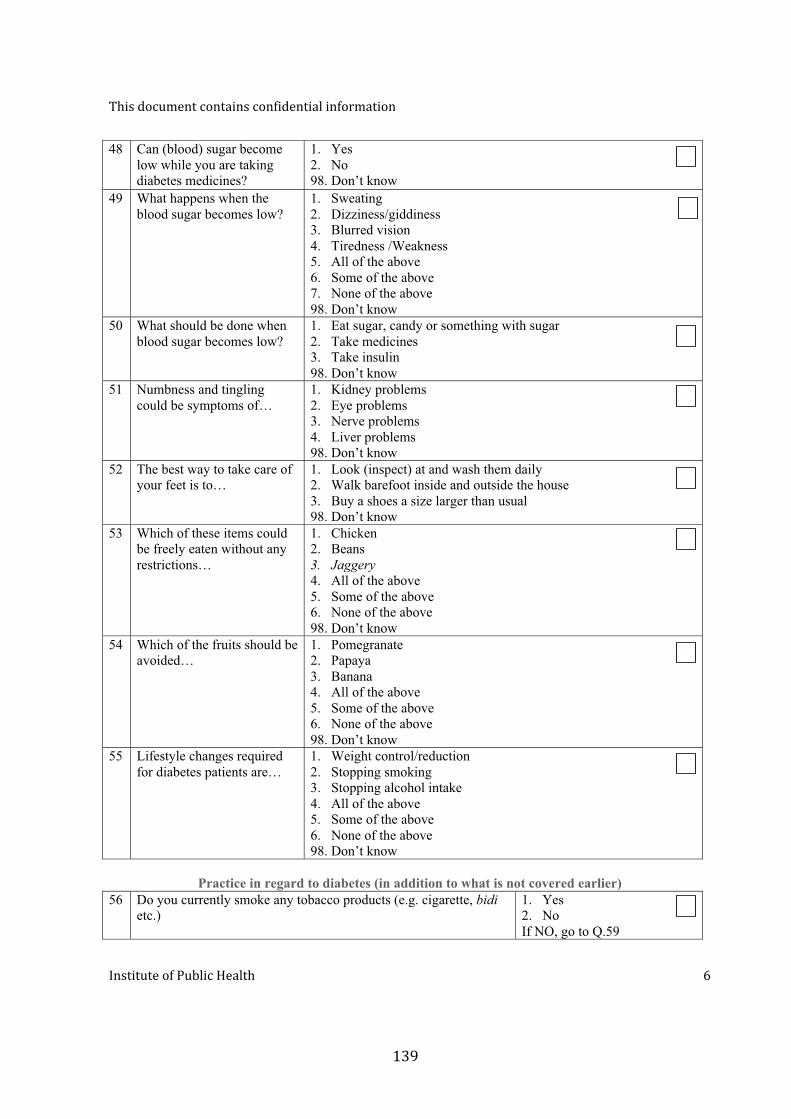
48 Can (blood) sugar become low while you are taking diabetes medicines?
1. Yes 2. No 98. Don’t know
49 What happens when the blood sugar becomes low?
1. Sweating 2. Dizziness/giddiness 3. Blurred vision 4. Tiredness /Weakness 5. All of the above 6. Some of the above 7. None of the above 98. Don’t know
50 What should be done when blood sugar becomes low?
1. Eat sugar, candy or something with sugar 2. Take medicines 3. Take insulin 98. Don’t know
51 Numbness and tingling could be symptoms of…
1. Kidney problems 2. Eye problems 3. Nerve problems 4. Liver problems 98. Don’t know
52 The best way to take care of your feet is to…
1. Look (inspect) at and wash them daily 2. Walk barefoot inside and outside the house 3. Buy a shoes a size larger than usual 98. Don’t know
53 Which of these items could be freely eaten without any restrictions…
1. Chicken 2. Beans 3. Jaggery 4. All of the above 5. Some of the above 6. None of the above 98. Don’t know
54 Which of the fruits should be avoided…
1. Pomegranate 2. Papaya 3. Banana 4. All of the above 5. Some of the above 6. None of the above 98. Don’t know
55 Lifestyle changes required for diabetes patients are…
1. Weight control/reduction 2. Stopping smoking 3. Stopping alcohol intake 4. All of the above 5. Some of the above 6. None of the above 98. Don’t know
Practice in regard to diabetes (in addition to what is not covered earlier)
56 Do you currently smoke any tobacco products (e.g. cigarette, bidi etc.)
1. Yes 2. No If NO, go to Q.59
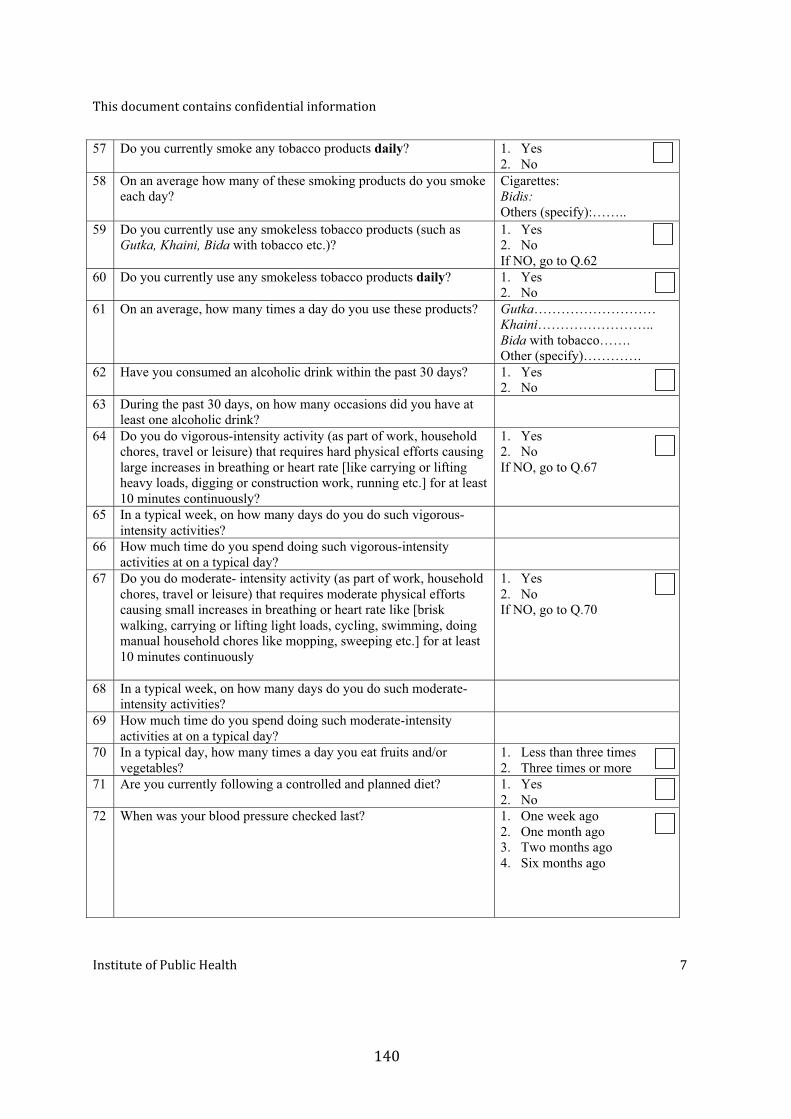
57 Do you currently smoke any tobacco products daily? 1. Yes 2. No
58 On an average how many of these smoking products do you smoke each day?
Cigarettes: Bidis: Others (specify):……..
59 Do you currently use any smokeless tobacco products (such as Gutka, Khaini, Bida with tobacco etc.)?
1. Yes 2. No If NO, go to Q.62
60 Do you currently use any smokeless tobacco products daily? 1. Yes 2. No
61 On an average, how many times a day do you use these products?
Gutka……………………… Khaini…………………….. Bida with tobacco……. Other (specify)………….
62 Have you consumed an alcoholic drink within the past 30 days? 1. Yes 2. No
63 During the past 30 days, on how many occasions did you have at least one alcoholic drink?
64 Do you do vigorous-intensity activity (as part of work, household chores, travel or leisure) that requires hard physical efforts causing large increases in breathing or heart rate [like carrying or lifting heavy loads, digging or construction work, running etc.] for at least 10 minutes continuously?
1. Yes 2. No If NO, go to Q.67
65 In a typical week, on how many days do you do such vigorous-intensity activities?
66 How much time do you spend doing such vigorous-intensity activities at on a typical day?
67 Do you do moderate- intensity activity (as part of work, household chores, travel or leisure) that requires moderate physical efforts causing small increases in breathing or heart rate like [brisk walking, carrying or lifting light loads, cycling, swimming, doing manual household chores like mopping, sweeping etc.] for at least 10 minutes continuously
1. Yes 2. No If NO, go to Q.70
68 In a typical week, on how many days do you do such moderate-intensity activities?
69 How much time do you spend doing such moderate-intensity activities at on a typical day?
70 In a typical day, how many times a day you eat fruits and/or vegetables?
1. Less than three times 2. Three times or more
71 Are you currently following a controlled and planned diet? 1. Yes 2. No
72 When was your blood pressure checked last? 1. One week ago 2. One month ago 3. Two months ago 4. Six months ago

73 When did you have your last eye examination? 1. One month ago 2. Six months ago 3. One year ago 4. Two years ago 5. Not done at all
74 When was your last urine examination? 1. One month ago 2. Six months ago 3. One year ago 4. Not done at all
75 Do you take care of your feet on a regular basis? (Washing and inspecting feet)
1. Yes 2. No
Patients’ perceived quality of care and satisfaction
Patients’ perceived social support
Blood sugar estimation
Considering the your last visit to the doctor for diabetes care, please rate the following questions on a scale of 1-5, where 1=strongly disagree, 2=Disagree, 3=Neutral, 4=Agree, 5=Strongly agree 76 The doctor/s gave you advise about ways to avoid illness (diabetes) and stay healthy 77 The doctor gave you complete information about your illness (diabetes) 78 The doctor gave you complete information about your treatment (diabetes) 79 Clinic/hospital staff talk politely 80 Clinic/hospital staff are helpful to you 81 You are given enough time to tell the doctor everything 82 Doctor listen carefully to what you have to say 83 The doctor checks patients properly 84 The doctor is always ready to answer your questions 85 The doctor gave you adequate time
A supportive person is one who is helpful, who will listen to you, or who will back you up when you are in trouble. Please let me know how supportive the following people are to you at this time in your life. For the answers, use codes: 0=None, 1=Some, 2=A lot, 0=There is no such person 86 Your wife, husband, or significant other person 87 Your children or grand children 88 Your parents or grand parents 89 Your brothers or sisters 90 Your other blood relatives 91 Your relatives by marriage (in-laws etc.) 92 Your neighbors 93 Your co-workers 94 Your church/temple/mosque (faith-based group) members 95 Your other friends 96 Do you have one particular person whom you trust and to whom you can go with
personal difficulties? Yes=2 No=0
97 Consent has been read and obtained 1. Yes 2. No (end the interview)
98 Reading of fasting blood sugar level (in mg/dL) by Glucometer
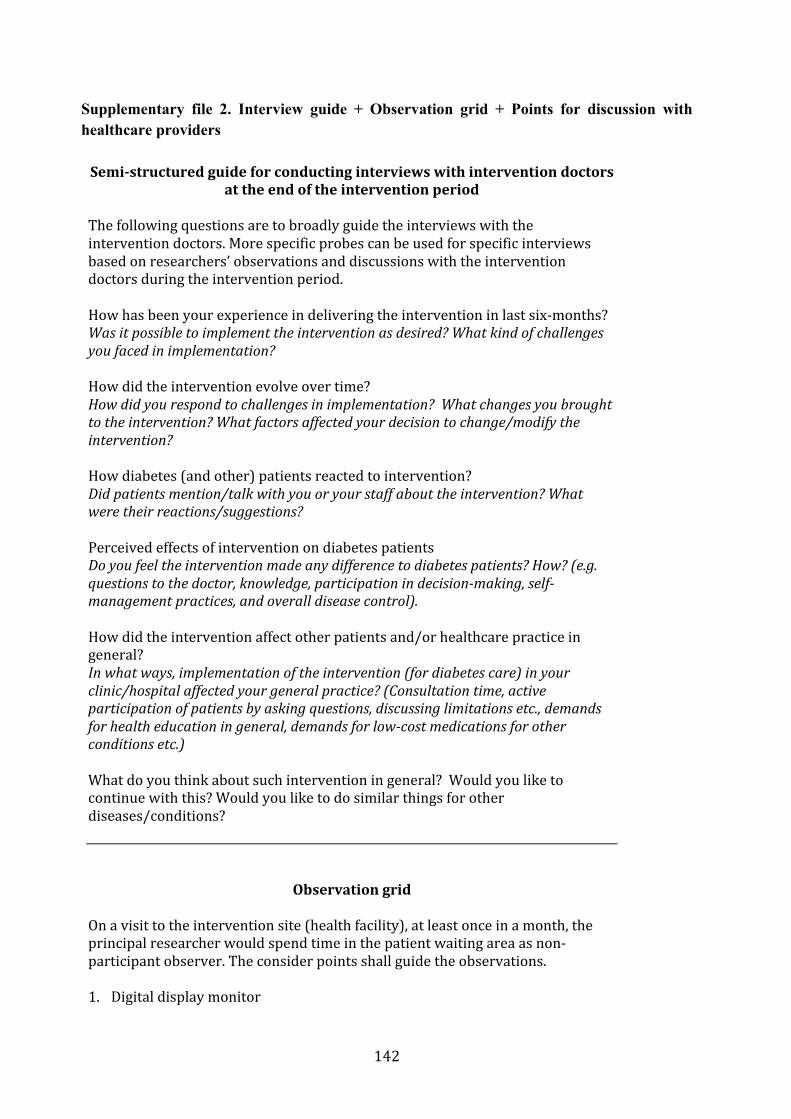
Supplementary file 2. Interview guide + Observation grid + Points for discussion with healthcare providers

Part III GENERAL DISCUSSION
1. Discussion of the results
This section summarizes and brings together results from the three sub-studies. It discusses the implications of the study findings in relation to what we know – existing literature.
1.1. High prevalence of chronic conditions among urban poor
Despite the fact that non-communicable diseases—a major contributor to chronic conditions—account for 60% of deaths in India, there is a dearth of studies assessing the overall prevalence and profile of non-communicable diseases and/or chronic conditions at community level in India. Most of the studies focus on assessing the prevalence of one or a few select chronic conditions that are generally known for their high epidemiologic burden in India and worldwide. Considering that the people with chronic conditions have several care demands in common, the data on overall prevalence and profile of chronic conditions in a given community is crucial for planning in the local health system.
In India, there are a very few studies assessing the burden of chronic conditions in slums and poor urban neighborhoods. We found a high prevalence of self-reported chronic conditions (8.6% in population and 13.6% among adults) in KG Halli. Our conservative estimate, which largely excludes people with chronic conditions who were not on regular medication, is nearly twice the estimate reported from an urban slum in Western India (Ahmedabad) seven years ago.1 Considering that many of the chronic conditions (such as diabetes and hypertension) remain under-diagnosed, the true prevalence of chronic conditions in KG Halli would be even higher.
Diabetes and hypertension were the two most commonly reported chronic conditions in KG Halli. Several studies in India show that the prevalence of diabetes and hypertension is increasing over time and is generally higher in urban compared to rural India.2–7 There remains a regional variation in prevalence of these conditions across India.2,3,6,8,9 The diabetes prevalence is higher in southern India compared to that in other parts of the country.2,3,9 The prevalence of self-reported diabetes among adults in KG Halli (6.4%) is higher than the corresponding estimates from large and often nationally representative surveys conducted in 2003 (2.5%)4, 2003–2005 (4.5%)2, 2005–2006 (1.3%)3, and 2008–2010 (4.2%)10. The prevalence of self-reported hypertension (10%) in KG Halli is similar to the corresponding estimate from a large nationally representative survey conducted in 2007 (9.5%).5
The prevalence of self-reported diabetes and hypertension in KG Halli is higher compared to the estimates of self-report of these conditions by studies in urban poor locations across India so far: Ballabgarh11 in 2003–04 (diabetes: 1.35%; hypertension 6.7%); Delhi (diabetes: 6%12; women only sample ~ diabetes: 5.4%13); Ahmedabad1 in 2002 (hypertension: 1%); Pune14 in 2008–09 (diabetes: 3.5%; hypertension: 5%); Trivandrum15 in 2005–06 (diabetes: 8.8%; hypertension: 11.1%); and Chennai16 in 1996–98 (diabetes: 2.9%; hypertension: 3.9%). The exception is a study from Chennai conducted in 2006–08 among low-income urban residents reporting a prevalence of self-reported diabetes of 9.4%. The prevalence of self-reported hypertension in the same study (5.9%) was much lower compared to that in KG Halli.16
These estimates of self-report of chronic conditions are not strictly comparable, as many factors including health awareness and access to healthcare would affect self-report of these conditions. Studies in India have shown that many people with diabetes and hypertension remain undiagnosed. Hence, the estimate of self-reported prevalence would be lower than the true prevalence of these conditions in a given population when assessed using clinical and/or laboratory tests. The community-based prevalence of undiagnosed diabetes and that of hypertension in urban settings have been shown to be at least as much as that of diagnosed conditions or even higher.5,11,15,17–19 If we use a conservative estimate of equal prevalence of diagnosed and undiagnosed conditions, the prevalence rates of hypertension and diabetes in KG Halli would stand at about 20% and 12.8%, respectively. Clearly, chronic conditions are no longer problems affecting only the wealthy sections of society.
1.2. Are poor disproportionately affected by chronic conditions?
The studies, cited earlier in this section, from urban poor locations in India over time indicate that the prevalence of chronic conditions, especially that of diabetes and hypertension, seem to be increasing. In India, there is a growing discourse about whether the socioeconomic gradient for chronic conditions is reversing. A survey across six states in India conducted in 2007 revealed that the prevalence of self-reported as well as clinically diagnosed hypertension increased consistently from the lowest wealth to the highest wealth quintile.5 Similarly, the analysis of data from the National Family Health Survey conducted in 2005–06 revealed that the prevalence of self-reported diabetes increased consistently from lowest to highest wealth quintile.3 A study comparing the prevalence of diabetes, hypertension and other risk factors among residents in a low-income and a middle-income neighborhoods in Chennai over 10 years (baseline study in 1996–98; follow-up study in 2006–08) provided detailed insight.16 While the prevalence of the studied chronic conditions was much lower in the low-income group compared to the middle-income group at baseline, the prevalence grew at a faster pace among the low-income group compared to the middle-income group and became similar in both groups at the follow-up. Some localized studies over the last five years report that the prevalence of some of the chronic conditions (especially diabetes, hypertension, and asthma) in urban poor areas is similar to or higher than that in the general urban population.11,15,20–22
Our study adds to this limited evidence and shows a clear inverse relationship between the per-capita income and the overall prevalence of self-reported chronic conditions. A similar inverse relationship was found between the per-capita income and the prevalence of self-reported diabetes and self-reported hypertension. However, the association was statistically significant only in the case of self-reported hypertension for the uppermost three quintiles. Likewise, people belonging to below-the-poverty-line households had three times greater odds of reporting chronic condition compared to people in the above-the-poverty-line households in KG Halli. Such inverse relationship between household poverty status and prevalence was also found for self-reported hypertension, but it was not statistically significant. In the case of diabetes, patients from below-the-poverty-line households were in fact less likely to report diabetes compared to those in above-the-poverty-line households.
It should be noted here that our study was not across the whole income range of the general population, but within KG Halli, a subset of urban population that tends to be on the lower

income scale. We relied on self-report of chronic conditions. Vellakkal et al.23 show that the association between the prevalence of certain chronic conditions and the socioeconomic status can vary a lot based on whether a self-report or some standardized measure of chronic condition is considered in the study. Their findings, based on data collected in 2007, show that while using self-report, certain chronic conditions (hypertension, asthma and lung diseases, vision problems, angina and depression) were concentrated among the higher socioeconomic group. However, while using standardized measures, many of these conditions were either concentrated among the lower socioeconomic group or there remained no strong gradient. This indicates that the self-report is less likely to accurately represent the prevalence of chronic conditions among poor and that the relation between the income and the prevalence of self-reported chronic conditions found in KG Halli might be even more pronounced.
Subramanian et al.24 in their provocative commentary, based on a review, challenged the dominant narrative that the positive association between the socioeconomic status and the cardiovascular risk factors has reversed or is reversing in India. They found that the majority of the studies reported positive correlation between socioeconomic status and cardiovascular risk factors (except for tobacco smoking and low intake of fruits and vegetables). Furthermore, there was a lack of clear gradient in association between the socioeconomic status and cardiovascular mortality in India. They, therefore, cautioned against the shift in policy attention to these diseases, as the allocation of limited health resources would benefit wealthier groups.24 Their commentary generated several responses, in turn questioning their interpretation and the methods used to arrive at the interpretation.25,25–30 While there may be inadequate evidence to determine whether the socioeconomic gradient for prevalence of cardiovascular risk factors and mortality has indeed reversed or is reversing in India, there is a general agreement that the poor, who constitute a major part of the population in India, suffer a high burden of chronic conditions that deserve an effective public health response.
1.3. Majority of urban poor depends on private healthcare sector
Overall, 80.6% of people with chronic conditions sought healthcare from private health facilities (as place of medical consultation), while the rest sought care from government health facilities. Similarly, a majority of people with diabetes (85.2%) and hypertension (81.9%) preferred private health facilities. This finding corroborates with other studies revealing high utilization of private health sector in general, and for chronic conditions in particular, among urban poor.1,31–34 A variety of factors such as short waiting times, proximity to private health facilities, favorable opening hours of private health facilities, often lower fees charged by informal private providers and a perceived greater effectiveness of treatment resulting in a shorter recovery period have been reported as reasons for seeking care from the private healthcare sector.31,33–35
This trend is not specific to the urban poor or to care for chronic conditions, but reflects a general health-seeking pattern in the Indian population for any ailment. For example, the recent National Sample Survey (2014) revealed that 78.8% of ailments reported in 15 days preceding the survey were treated in the private sector and only 21.2% of them were treated in the government sector.36 In fact, preference for private service provision has increased consistently over the last three rounds of the National Sample Surveys (1995-96; 2004; 2014).36
We found that in KG Halli, the increase in per-capita income was associated with increase in health seeking from private health facilities, except for diabetes, where no significant correlation existed between income and health-seeking preferences. While private healthcare providers manage the majority of chronic conditions among urban poor, government healthcare facilities remain the choice for those who are poorest among the poor. In KG Halli, people living in below-the-poverty-line households had greater odds of seeking care from government health facilities than from private health facilities. The association was statistically insignificant for diabetes. The odds of seeking care from government health facilities were greater for elderly (aged 60 years or above) and those seeking care at referral or super-specialty hospitals. A majority of the private healthcare providers works on a fee-for-service basis and hence reliance on it among urban poor has monetary implications.
1.4. Treatment gaps for people with chronic conditions
While many people with chronic conditions remain undiagnosed in India, those who get diagnosed find it difficult to seek healthcare. A large survey conducted in six Indian states in 2003 revealed that only 43.9% of adults who self-reported non-communicable diseases and injuries had ever received some treatment.4 The survey did not assess current or continuous treatment coverage, which is needed for most chronic conditions. Treatment coverage across chronic conditions varied from the highest of 80.4% for those who self-reported diabetes to the lowest of 12% for those who self-reported depression.4 A similar large survey in 2007 revealed that only 68.5% of all the adults who self-reported hypertension had received some treatment in the last 12 months.5 Even fewer (57.5% of those on treatment) had their blood pressure under control.5 Both the surveys revealed that the treatment rates were lowest for the poorer and with a few exceptions, generally increased across the wealth quintiles.4,5 While the treatment rates were marginally better for patients in urban areas compared to rural areas, there are not many studies assessing these parameters specifically for those living in urban poverty. A study in urban slums of northern India (Ballabgarh) in 2003-04 revealed that only 50% of adults who self-reported hypertension were on antihypertensive medications.11 Studies in Delhi slums have reported variable treatment gaps of 20%13 and 9.5%12 for self-reported diabetes patients.
Our study also identified households in KG Halli where family members with chronic conditions were advised to take medications on a regular basis but who were unable to do so for various reasons. Such cases accounted for 3.1% of self-reported chronic conditions. Analysis of the data from a national survey conducted in 2004 provided estimates of untreated chronic conditions similar to that found in KG Halli (cardiovascular diseases: 4%; diabetes: 3%).37 The very limited data available in India make it difficult to substantiate the crude observation that treatment rates for chronic conditions, while still very low, have improved over the time.
1.5. The treatment cost further impoverishes the poor
In India, households usually have to make out-of-pocket payments to access healthcare. Analysis of the national survey conducted in 2004 revealed that around 11.8 million households (or 63.2 million Indians) were pushed below the poverty line due to out-of-pocket healthcare spending.38 The study revealed that much of the impoverishment was due to outpatient care (79.3%) compared to inpatient care (20.7%).38
While that is about healthcare in general, our study—probably for the first time in India—provides an estimate and implications of out-of-pocket expenditure on treatment of chronic conditions. In KG Halli, 69.6% of the 3 202 households, where one or more members self reported chronic conditions, made out-of-pocket payments on outpatient care for chronic conditions. Overall, 16% of the households suffered financial catastrophe by spending more than 10% of their household income on outpatient care. These households spent a median of 3.2% of their total household income on outpatient care. Unlike the pattern observed for out-of-pocket payments on overall healthcare (outpatient and inpatient combined) in India39,40, we found that, in KG Halli, the incidence of financial catastrophe as well as the share of the household income spent on outpatient care for chronic conditions were regressive: the poorest households had 3.7 times greater odds of incurring financial catastrophe compared to that among the least poor households. In one-month duration, 0.9% of people with chronic condition in KG Halli were pushed below the poverty line, nearly doubling the absolute number of such people living below the poverty line.
1.6. Do the poor spend more on chronic conditions care compared to the wealthy in India?
There is a dearth of research assessing out-of-pocket healthcare payments and its impact on the poverty segregated by ‘outpatient and inpatient care’ and ‘acute and chronic ailments’ in India. Indrani Gupta41, in her methodological paper on poverty estimation in India, urged for such segregated analysis. Studies in urban Tamil Nadu42 (based on the data collected in 2004) and India43 in general (based on the data collected in 1986–87) showed that the share of healthcare spending as part of the overall household spending was regressive: the poor spent a greater share of their income on healthcare compared to the wealthy.
This raises a question of whether, as found in our study, healthcare spending on outpatient care is regressive, even if the spending on healthcare overall appear be progressive in India. People with chronic conditions are likely to seek outpatient care frequently and for a longer time and, hence, incur greater cumulative expenditure on outpatient care. Karan et al.44, through analysis of the national survey conducted in 2004, revealed that households with members suffering from cardiovascular diseases experience a significantly greater number of hospital stays (additional 10.3 stays in a year per 100 members) and outpatient visits (additional 11.2 visits in 15 days per 100 members) compared to households without cardiovascular diseases. The study showed that while total out-of-pocket healthcare spending was greater among households belonging to higher socioeconomic status (caste- and education-wise), the share of out-of-pocket healthcare spending as part of the total household spending as well as the incidence of distress financing (mortgaging or selling of assets) was greater among households with lower socioeconomic status. A study by Dror et al.45 in five resource-poor settings in rural India highlights that the median cost per illness episode was highest for chronic conditions, followed by accident and acute illness. A study in West Bengal in 2007 by Mondal et al.46 revealed that the odds of incurring financial catastrophe as a result of the out-of-pocket healthcare spending on outpatient care for chronic conditions was greater compared to that on hospitalizations or outpatient care for acute illnesses.
We reviewed the studies that assessed the cost of diabetes and/or its complications in India. While healthcare spending in absolute terms was higher among middle and higher income groups, healthcare spending as part of the household income was greater among the poor.47 The cost of treatment of diabetes for patients with complications was higher compared to those without complications. In summary, the existing studies, while inadequate to fully understand all the aspects of healthcare spending on chronic conditions, clearly point to high out-of-pocket spending on chronic conditions, leading to impoverishment. This impoverishing impact of out-of-pocket healthcare spending is greater for people with chronic conditions compared to people with non-chronic conditions, and among the people with chronic conditions, greater for poorer patients compared to the least poor or the wealthy.
1.7. Poor access to medications – a major cost driver for chronic conditions
In KG Halli, we found that a major part (66.3%) of out-of-pocket spending on outpatient care for chronic conditions is made on medications. This is followed by spending on diagnostics (at health centers/clinics and referral hospitals) or travel (at super-specialty hospitals). A study44 assessing healthcare spending on heart disease and other studies47,48 assessing the cost of diabetes care in different parts of India reveal that the expenditure on medications accounts for over half of the entire healthcare spending on these conditions. In fact, high out-of-pocket spending on medications has remained a consistent feature of out-of-pocket healthcare spending in India over the decades: constituting 81.6% and 71.2% in 1993–94 and 2004–05, respectively.39
Interestingly, expenditure on medications by people with chronic condition in KG Halli remained high (66%), even when the government sector was used as a place for consultation. This is mainly due to the very limited availability of medications for chronic conditions in the government sector: one of the two government facilities in KG Halli did not cater for chronic ailments, while the other one often had stock-outs of these medications. This implies that many people with chronic conditions, who seek care from the government sector, have no option but to buy medications from private pharmacies. A study by Kotwani et al.49 conducted in 2004–05 across five states in India revealed that the median availability of the select 30 medications (including ones used for common chronic conditions) in government health facilities was just 11.5%. It ranged from zero percent in West Bengal (indicating that none of the surveyed government facilities stocked any of the 30 medications) to 30% in Chennai (Tamil Nadu). The very commonly used chronic care medications, Glibenclamide (for diabetes) and Atenolol (for hypertension), had a median availability of 56.5% and 50.6%, respectively, in the government sector.49 The availability of the two essential medications for treatment of asthma (Beclomethasone and Salbutamol)—the third commonly reported chronic condition in KG Halli—was zero percent in four of the five Indian states surveyed.50 A recent study by Kotwani51 in 2011 in Delhi shows the poor availability of the medications used specifically for the treatment of chronic conditions: median availability of 43.4% in 40 facilities run by the state government of Delhi and 29.4% in other 40 facilities run by the municipal government in Delhi. It can be concluded from these studies that the availability of essential medications for many common chronic conditions is very low in government facilities.
While the availability of these medications was relatively better in private pharmacies, the prices vary a lot depending on the medication brands. Consequently, these medications remain generally unaffordable for the poor.49–51 The cost to the patient for standard regimen of single medication for some of the common chronic conditions (asthma, depression, hypertension) was approximately half of single day’s wage earned by the lowest paid government worker in India.50,51 The widespread comorbidities in people with chronic conditions add to this burden. This problem seems to affect several countries, especially low- and middle-income countries, where the availability of medications for chronic conditions in the government sector is low, while cost of these medications in the private sector is often high.52,53
1.8. Barriers to diabetes care: patients’ experiences
In India, not many studies have been undertaken to understand in detail the patients’ experiences of living with diabetes. The ones that are available are rather epidemiological enquiries assessing the distribution of the diabetes and its risk factors as well as the knowledge and self-management practices of the patients framed in a quantitative research paradigm, and the biomedical understanding of the condition. The narratives of diabetes patients from KG Halli highlight many factors related to their position in a broader family and social contexts that are generally beyond the influence of the formal healthcare services, as these services are traditionally understood and organized in the Indian context.
Diabetes situated in struggles of daily living
The struggle for daily survival, earning livelihood, ensuring food for the family, and repaying debts puts diabetes management on the back seat in the lives of the urban poor. Seeking diabetes care in that context would further aggravate the financial hardships, as the poor are not exempt from out-of-pocket healthcare payments. Consequently these people reduce or discontinue the use of medications. A study conducted in Chennai in 1999 revealed that the adherence to diabetes treatment was lower among patients in the lower socioeconomic group.54 A recent study highlighted that a majority of diabetes patients (55.8%) in Andhra Pradesh cited financial hardship as the reason for not adhering to the prescribed medications.55 Another study from Delhi reveals that diabetes patients from lower income groups often forgo healthcare due to cost concerns.56 While diabetes itself causes distress56,57, more so among the lower income strata, many other issues, such as finances, job, children’s future, conflicts in family, and personal and family health issues, cause equal or much greater stress among diabetes patients.56
Women and elderly: social norms and position at odds with diabetes care
The family role of women may be disadvantageous for them when it comes to managing diabetes. Lesley Weaver58 in her study of women with diabetes in Delhi argues that women gave priority to conform to their socially defined service-oriented role in the family at the expense of their own care leading to poor diabetes control. Studies in India indicate that men fare better compared to women in terms of engaging in physical activity and consuming fruits and vegetables, which are considered as healthy practices for diabetes patients.11,15,59 Men appear to be doing better at integrating (i.e. psychologically adjusting) diabetes in their life as compared to women.60,61 These studies also show that, as a result, men seem to enjoy better psychological health, with lesser depression and greater sense of wellbeing compared to women. In a nutshell,
the limited available research suggests that women are at disadvantage for self-care. Further research is needed to understand how social norms shape diabetes care and outcomes in both genders in India.
Being elderly in the prevailing social structure in India appears to bring difficulties in managing diabetes. In India, the proportion of the population aged 60 years and above increased from 6.8% in 1991 to 8.6% in 2011.62 This small increase in the percentage points actually reflects a huge number, nearly doubling of the elderly population from 56.7 million to 103.8 million.62 There is limited literature in India on how this growing segment of the Indian population, that is known to suffer greater morbidities, manages its health. Several social and physical constraints, such as reduced social participation, low income, financial dependency, and general neglect and abuse of elderly, impact the elders’ access to healthcare.63,64
In absence of a universal and functional social security system as well as health service outreach for the elderly in India, the family and social networks constitute a major source of support for the elderly in India and in many other low- and middle-income countries. In 2004, nearly 65% of the elderly in India were economically dependent on others for their day-to-day living.65 Nearly 80% of them were economically dependent on their children.65 Family and friends are an important source of support for diabetes patients. When it comes to source of support in managing their condition, about 97.3% of the diabetes patients in this segment reported their family members to be very supportive, followed by the healthcare team (90.2%), friends or the people close to patients (84.5%), and people at the workplace/school (42.3%).57 However, the increasing shift in family structure from traditional joint families to nuclear families is likely to reduce the support to elderly, in turn reducing their access to healthcare.66,67 This is what we also observed in KG Halli. Analysis of the national survey revealed that, in 2005–06, about 18.7% of the elderly population either lived alone or with their spouse.68 While the elderly were more aware of some of the welfare schemes than others, an abysmally low portion of the elderly population actually utilize or benefits from these welfare measures.68
Psychosocial support to diabetes patients
Patients expressed their concerns about the negative attitude and inadequate communication by the healthcare providers in KG Halli. They felt that many healthcare providers ignored the social and emotional contexts of patients while communicating with them. In fact, some of the patients immediately recounted their experiences with doctors who were empathetic and good listeners. They referred them as ‘good’ doctors.
Interestingly, the patient-provider communication did not emerge as a significant concern in the providers’ narratives when discussing issues related to delivery of diabetes care in KG Halli. In fact, most of the doctors we interviewed in our study doubted and often blamed their patients for not adhering to the prescribed treatment and lifestyle modifications. Their narratives tend to highlight illiteracy, ignorance and lack of health consciousness among patients as the barriers to effective diabetes treatment. They rarely referred to the social, economic and cultural contexts that defined their patients’ lives.
The Diabetes Attitudes, Wishes and Needs (DAWN2) study conducted in 17 countries, involving diabetes patients, family members, and diabetes care providers, investigated various
aspects of psychosocial burden of diabetes. While India scored highest among 17 countries on patients’ assessment of the healthcare climate, the overall mean score for this parameter for India was 57.9.57 The average score for this parameter across the countries ranged from 29.7 to 57.9 with an average of 25.7. The healthcare climate was assessed through questions about whether the healthcare team member encouraged patients to ask questions, listened to how patients would like to do things, and conveyed confidence in the patients’ ability to make changes. Furthermore, and interestingly, the score by the healthcare providers from India for the same parameter (of providing supportive healthcare climate to diabetes patients) was 82.9.69 Hence, there is a huge difference in the perceptions of these two groups—diabetes patients and care providers—on the support provided by the healthcare team to the patients. Similarly, while 73.3% of healthcare providers reported asking their diabetes patients about how diabetes affected their lives, only 45% of diabetes patients from India reported that their healthcare providers asked them about this aspect.57,69 While these data from patients and healthcare providers are not strictly comparable, it is apparent that many diabetes patients feel that they are yet to get adequate psychosocial support from their healthcare team, while the healthcare providers believe they are already providing substantial psychological support.
Studies from India show that the length of the consultation time remains very short (2.5–5 minutes) in context of the general healthcare delivery in primary care settings.70–72 The surveyed patients were dissatisfied with the fact that doctors did not explain and discuss the care with them.70–73 There is, therefore, a need for both, enhancement in provision of psychosocial support to diabetes patients as well as improvement in patient-provider interactions, on this aspect.
Medical consultation allowing patient-provider interaction was the only, and rather inadequate, platform for patients’ voices to be expressed in KG Halli. In rural India, the formal platforms to enhance community participation in health service planning do exist and, when actively facilitated, have improved healthcare provision, including making medications for chronic conditions available at primary care facilities.74
Fragmented services
Another concern of diabetes patients was related to the prevailing organization of diabetes care in the local health system. Patients had to visit many facilities for a single episode of outpatient care, leave apart additional facilities in case of acute episodes, due to fragmented provision of bare minimum services required routinely by diabetes patients. The providers’ narratives highlight this very disintegrated nature of the local healthcare delivery system with lack of coordination among and across different levels of health service organizations.
1.9. Systemic gaps in local health system in organizing quality diabetes care
We analyzed the local health system in KG Halli using a health system dynamics framework developed by Van Olmen and colleagues.75,76 We conducted interviews with local healthcare providers and recorded field observations made at local health facilities. There are other models specifically relevant to organization of chronic condition care such as chronic care model developed by MacColl Centre for Health Care Innovation and its several subsequent variants.77,78 Building on the chronic care model, WHO developed the innovative care for chronic condition framework.79 These models are specific to chronic condition care and are

generally focused on health care delivery system with less emphasis on other health system elements. There are no specialist facilities in KG Halli for chronic condition care. In general, primary care providers at single-doctor clinics and small hospitals provide chronic condition care along with care for other common health ailments. So we preferred to use of a broader and generic model that would capture local health system with its various dimensions. WHO’s conception of building blocks for health system is also relevant to this purpose.80 The health system dynamics framework incorporates WHO’s building blocks and additionally emphasizes importance of the context, people and choices of values and principles that guide health systems. It also makes linkages across various health system elements more explicit. Considering the limited experiences with these models in low- and middle-income countries (especially India), we consciously aimed to limit the use of the model to shape broader themes for enquiry while keeping the overall enquiry open enough to capture contextual insights and suggestions of healthcare providers. We found major gaps along four elements of local health system impacting delivery of quality diabetes care.
Gaps in healthcare delivery
We found that in KG Halli, within an area of less than a square kilometer, there were several (>20) health facilities providing diabetes care in some form. These facilities varied widely in terms of delivery platforms (clinics, health center, nursing home, hospitals of varied size, laboratories, pharmacies) and the healthcare services on offer. Most facilities were from the private sector where doctors had varied levels of training in different systems of medicine (mainly allopathy, ayurveda and unani). This plurality in provision of healthcare is reflective of how the health sector has evolved over time in India as a whole. There are at least seven government-recognized systems of medicine apart from allopathy grouped under the umbrella term AYUSH (ayurveda, yoga, naturopathy, unani, siddha, homeopathy and sowa-rigpa).81 Unlike the government health sector with an extended network of somewhat standardized delivery platforms across the country providing primary to referral care, there is a huge number of varied and diverse care delivery platforms in the private sector. There is also an overlap in provision of care across different levels of healthcare services: hospitals often provide and market primary care services along with provision of referral care. In the government sector, primary care facilities in urban areas historically evolved to provide family planning services in the context of ‘population control’ initiatives82–87 and often lacked provision of care for chronic conditions. This led to crowding of patients needing chronic condition care at referral hospitals. While plurality in care provision is not a problem in itself, lack of coordination and a functional referral system across providers make it difficult for patients to navigate the complex maze of several stand-alone healthcare delivery subsystems with no administrative and poor functional coordination across them.
Many of the doctors in private sector practicing allopathy had their basic training in other systems of medicine (more commonly ayurveda and unani). Some doctors lacked a minimum level of training required to practice any given system of medicine. The presence of such ‘informal’ healthcare providers (those lacking required level of training) seems to be specifically concentrated in poor urban neighborhoods compared to other urban areas.33,88
Gaps in information system and its use
There are gaps in the information collected with regard to chronic conditions by health services at individual and at population level in India. In KG Halli, for example, only six out of 15 health facilities studied had some system of tracking medical records of diabetes (or other chronic conditions) patients. Most commonly these were patient-held paper-based medical records. In the case of hospitals, detailed records were often maintained at facility level only for hospitalized patients, who received a summary by doctors on their discharge. Lack of organized individual medical records hinders continuity of information over time and across healthcare providers, affecting clinical management. A few facilities that tracked patients’ medical records had no provision for active follow-up or reminder services for patients. If for some reason, patients do not turn up for follow-up, they were lost to follow-up by health services.
At population level there is no ongoing regular surveillance for diabetes and a majority of other chronic conditions. Till date, very few multi-site studies or sample surveys provide indicative data for prevalence of chronic conditions and their risk factors at national level.2,89–91 At local health system level, government health facilities, through their outpatient register, collect data on diagnosis of ailments presented at health facilities. This would include chronic conditions. However, there is no further upward reporting and analysis of data specifically on chronic conditions, except for a few specific chronic conditions such as tuberculosis, blindness and cancers for which there have been long-standing national programs. No such data is available for many common chronic conditions such as diabetes and hypertension, and certainly not for risk factors for chronic conditions. Furthermore, these data are based on patients who presented themselves at government health facilities. A majority of patients with chronic conditions seek care from the private health sector. While there is a system where government health facilities seek data from private health facilities in their jurisdiction via a prescribed form, it is not functional on the ground. This form does not seek data on chronic conditions anyways.
In India, there have been initiatives for developing standard treatment guidelines for diabetes management, including psychosocial management.92,93 Similarly governments, as part of regulatory initiatives and national health programs, have developed standard treatment guidelines for many other chronic conditions.94 However, the use of these guidelines and protocols in clinical management remains far from expected. In KG Halli, only one specialist doctor out of 16 doctors who provided diabetes care was aware of standard treatment guidelines for diabetes.
Lack of effective leadership and governance
In KG Halli, we found poor governance at local health system level in the form of poor regulation of the dominant private sector, poor coordination across and among government and private sector, lack of formal grievance redressal platforms for patients and widespread bribery. In KG Halli only three of the private health facilities were in compliance with all the prevailing regulations. A majority of other doctors and health facilities could not even name the prescribed regulations that they were expected to comply with. The eight non-specialist doctors having a degree in ayurveda or unanni were primarily practicing allopathy without a degree and registration to do so. Only three of the fourteen doctors working in the private sector knew
prevailing norms around disposal of bio-medical waste. A few more knew about the need for a trade license from the municipal government to run their clinics. There was also apathy from the governments’ (regulator) side to enforce the regulations. This scenario is not unique to KG Halli. Despite recognition of the need to regulate the fast growing private sector in health since the early independence period, followed by many regulatory initiatives including a recent legislation to regulate clinical establishments in the country, the enforcement of and compliance with these regulations has remained dismal.95,96
Apart from the formal regulations, the coordination across different healthcare providers and care delivery platforms is important to steer the local health system towards shared goals with regard to health and healthcare delivery. However, except for occasional exchange required under the national tuberculosis control program, there was no communication between the government health facility in KG Halli and the several private health facilities. There was minimal or no coordination within several (at least seven) government agencies involved in delivering healthcare in Bangalore city. In fact, we found that a majority of private providers had strong negative perceptions about government health facilities and they saw government facilities as primarily the places for poor patients who cannot afford to go to private health facilities. There was also a lack of trust between non-specialist and specialist doctors. A majority of non-specialist doctors hesitated to refer diabetes patients to a specialist even when they thought it was needed. This was because they believed that the specialist would not send the patient back to them and so they will “lose” the patient. This, of course, contributes to the non-functional referral system that was identified as a key problem in context of the urban areas in a national five-year plan document prepared nearly three decades ago.97
Lastly, unlike as seen and encouraged in rural India, the organized community groups representing the community voice for health were absent in KG Halli, as in most urban areas in India. There were no formal platforms for community members or (health service) users for grievance redressal within the local health system. The National Rural Health Mission, a flagship program of the Indian government launched in the year 2005 to strengthen rural health systems had an explicit objective to enhance community participation in planning and monitoring of (government) health services. This encouraged the establishment of institutional mechanisms (committees, dialogues, joint plans) from village to district levels for community participation. While the experience of these mission strategies for community participation remains variable across the country, internal reports and published literature point to some positive gains, including improvement in availability of medications for chronic conditions.74,98
Values guiding healthcare practice: problematic?
All but one doctors in KG Halli who chose to speak about what drives today’s healthcare sector indicated that healthcare practice is largely aimed at maximization of profits. This might explain widespread bribery: pharmaceutical companies and laboratories paying kickbacks (commissions) to doctors for prescribing specific brand medications or laboratory tests respectively. Some of the private doctors mentioned how easy it was to bribe lower-cadre government officers in order to get licenses/registrations for their health facilities without meeting prescribed norms. Interactions with local healthcare providers basically gave an impression that healthcare has become just another ‘business’ where money and not the service
to patients is at the center. The narratives of diabetes patients also hint at this transformation. Patients referred to the frequently organized ‘free’ diabetes and health check-up camps by private clinics/hospitals in KG Halli as a tactic to ‘find’ new clients for them. However, when patients go back to these private facilities for follow-up, they do not get free or subsidized care.
In such scenario, when confronted with harsh economic realities of their patients, some private doctors responded through charitable acts. They occasionally waived or subsidized their consultation fees. Some doctors saw ‘free’ diagnostic camps that they conducted or participated in as their ‘service’ to the community. So, providing healthcare to the poor was at best seen as charity, different from the notion of access to healthcare as a right.
1.10. Implementing the intervention in local health system
Following our situation analysis with regard to chronic conditions and the local health system in KG Halli, we conducted a quasi-experimental study where four health facilities within KG Halli delivered a health service intervention for diabetes patients. The intervention included providing culturally appropriate diabetes education to the patients as well as using generic medications and standard treatment guidelines for diabetes management. Matched facilities in KG Halli served as controls carrying on with their usual care practices. We studied cohorts of diabetes patients seeking care from intervention and control sites over six-month duration.
The intervention, while responding to some of the gaps in the local health service delivery, did not address many other systemic impediments in local health system found in earlier studies including move towards goal-oriented and person centered care complementing ‘bio-medical’ care with provision of social and welfare services. We would have liked the intervention to address key concerns expressed by diabetes patients by making systemic changes in prevailing organization of diabetes care in KG Halli. However, in a given space and time, we had limitations in framing the intervention. The local health providers were preoccupied with bio-medical care provision in their practice, often aimed at maximization of profit. Their participation and willingness to make changes in their routine practice was essential to set-up a health service intervention. At the moment, researcher (and the broader KG Halli community health project staff) did not have working relationship with other government agencies/actors engaged in provision of social and/or welfare services.
This experiment illustrated that intervening in the local health system to improve care for diabetes or chronic conditions is complex and needs to carefully consider the many challenges and opportunities that local health systems offer. We now discuss some of the major lessons learnt in this experiment.
Health service interventions need to consider complex health seeking patterns
Our study revealed that a majority of diabetes patients in KG Halli do not seek care from the same healthcare provider over long time. Over 34% of patients changed their healthcare provider once or more than once during the six-month intervention duration. A few patients did not seek care during those six months while a few others migrated out of KG Halli and were lost to follow-up. The doctors in KG Halli also indicated this phenomenon as ‘doctor shopping’ by patients. This was a major factor that reduced reach of the intervention to diabetes patients.
Hence, the interventions that are to be delivered through healthcare facilities ideally need to cover majority/all the facilities in the area in order to ensure better access by patients.
Mere availability of generic medications is not enough
In India, generic medications, especially in the private sector, are sold at maximum retail prices, which are often not very different from the prices of commonly prescribed brand medications. So it does not make much difference to patients in terms of cost. In fact, the generic medications are more commonly available in the private sector compared to government health facilities, but at prices that are not affordable for many.51,99 It is often the dealers and pharmacists who get a bigger margin while selling generic medications and not the patients. Hence, making generic medications available at low prices is crucial if it is to benefit the patients.
In KG Halli, as part of the experimental study, we made generic medications available at low prices. However, doctors at intervention sites rarely prescribed generic medications to diabetes patients. Doctors’ perception was that generic medications are of poor quality and that lack of their universal market availability would affect its use by migratory patients. Only 7.2% of the diabetes patients who visited intervention sites were ever prescribed generic medications. The negative perceptions about the quality of generic medications are not just limited to doctors in KG Halli. Ravinetto et al.100 highlight how the poor quality of some of the Indian generic medications and the resultant poor perceptions of it will negatively affect access to affordable medications not only in India but worldwide as India is a huge supplier of low-cost generic medications for many low- and middle-income countries. Furthermore, the kickbacks received by doctors for prescribing brand medications and the fact that most doctors are using brand medications that come with combination of drug compounds explain limited prescriptions of generic medications.
Poor use of standard treatment guidelines for diabetes management
The doctors at intervention sites, who were supplied with standard treatment guidelines for diabetes management, hardly used them. The non-specialist doctors reported that the diabetes patients they treat are often diagnosed and put on a certain treatment plan by specialist doctors. Hence, they rather follow-up without significantly changing the treatment plan. Importantly, when doctors diagnosed new patients with diabetes, they had a theoretical chance to follow standard treatment guideline for instituting treatment plan for these patients. So for example, many of these patients who are pre-diabetic or at early stages of diabetes might just need lifestyle modification without medications. However, doctors believed that patients expect them to be primarily responsible for treating the ailments and if doctors only advise lifestyle changes without a prescription of medications, patients might see it as lack of treatment. This appeared to be a shared perception among doctors about what patients expect doctors to be doing – prescribing medications. Studies from Australia101 and United Kingdom102–105 show that patients’ expectations for prescriptions, and more than that doctors’ perceptions of patients’ expectations, make doctors prescribe unnecessary medications. While these perceptions ‘what patients expect’ and ‘what doctor should be doing’ are affecting prescription practices, there is no adequate research in India on these issues.
2. The way forward
Building on the earlier section, where we discussed our results in relation to what was known earlier and how our results add to new knowledge and/or interpretation, we now discuss the role of the local health system in prevention and management of chronic conditions, specifically among urban poor: its importance and how to strengthen the same. Towards the end, we outline areas that require further research in order to better understand and frame local health systems’ response to chronic conditions.
2.1. Need for information about chronic conditions within local health system
In a large and diverse country like India, with decentralized health systems planning and management, it becomes important to have primary information about chronic conditions within jurisdictions of local health systems. As the implications of somewhat similar set of care demands of people with common chronic conditions on the (re-) organization of health systems are similar and far reaching, it is useful to have information on overall prevalence and profile of chronic conditions in communities, in addition to diseases/condition specific data. Considering that the limited available information points to rising burden of chronic conditions among urban poor, community-based surveys among urban poor communities as well as facility-based ongoing surveillance of chronic conditions and their risk factors are needed. Such data is important in planning the local health system. Furthermore, effective management of these conditions over time in a local health system with plurality of healthcare delivery platforms and providers necessitates information system that allows for continuity of information over time and across healthcare providers, tracks patients and provides for proactive reminders. Provision and use of patient-held health records that sync with facility-based health records and reminder systems optimizing on appropriate technology is the need of an hour.
2.2. Importance of effective poverty alleviation and financial protection for health
There is a vicious cycle: spending on healthcare is making urban poor poorer and the poverty in turn constraints people from seeking healthcare. Indebtedness, struggle to earn living and to get two meals a day define narratives of patients with chronic conditions. In such circumstances, seeking healthcare often remains a marginal concern to meeting more basic needs of survival. For the people, who seek healthcare for chronic conditions in KG Halli, the poverty rate doubles every month due to high out-of-pocket spending on healthcare. Hence, in such contexts the poverty alleviation measures and financial protection for health have to be seen as the two sides of the same coin.
In 2004, 63.2 million Indians were pushed below the poverty line merely due to out-of-pocket healthcare spending.38 In response, the government of India, through the ministry of labor and employment, started a national health insurance scheme (Rashtriya Swasthya Bima Yojana) targeted to below-the-poverty-line households and workers in the unorganized sector. The scheme launched in 2008 now covers over 37.1 million households (estimated 188.5 million individuals), a little over half of all the below-the-poverty-line population in India.106 Several state governments have also started their own health insurance schemes targeting the below-the-poverty-line population and other marginalized communities. While these government-initiated schemes seem to have substantially expanded the health insurance for the poor, implementation
gaps still remain and people still have to make out-of-pocket expenditure.107 The recent national sample survey (2014) revealed that 85.9% of rural Indians and 82% of urban Indians are not covered by any mode of financial protection for healthcare expenditures.36 Of those in lowest quintile (monthly per-capita consumer expenditure) of the urban population, 91.4% individuals had no financial protection.36 The rest 8.5% individuals, who reported to have some coverage was mainly through the Rashtriya Swasthya Bima Yojana.36 More importantly, these schemes mainly cover hospitalization expenses and not the expenses on outpatient care, the latter being more impoverishing especially so in context of chronic conditions. There is, therefore, a need to augment the financial protection for health to these families that effectively cover outpatient care and bridges other prevailing gaps. Furthermore, as evident from our study in KG Halli, it is important to extend such protection to the ‘near poor’ who might not be living or having official status of living below-the-poverty-line – an income based marker which is known to be extremely low in India.
There is a national social security pension scheme in India that provides financial assistance to elderly living below the poverty line, and to widows and differently-abled people. A recent survey across ten states in India revealed that, despite some inadequacies, this national social assistance program remains an important support for about 26 million elderly persons, widowed women and differently-abled people in India.108 The meager amount they receive is often spent on food, healthcare and subsistence needs. It also helps them maintain and/or enhance social status within family and society. However, the pension amount remains very low and there are many barriers related to accessing the scheme including corruption.63,108 In KG Halli, for example, about 31% of households that reported having one or more members with chronic conditions did not possess a ration card – a document commonly used as a proof of household poverty status required to access benefits from a majority (if not all) of the welfare schemes in India. There is need for provision of ration cards (and therefore official household poverty status) to households in poor urban neighborhoods and facilitate their access to social security measures including benefits to differently-abled people and pension to elderly and widows. Newer, more sensitive and inclusive, forms of vulnerability assessments are needed instead of reliance on meager and simplistic income-based poverty line indicator.
These basically imply better public administration at local level engendering coordinated actions from different departments enhancing health and allied social and welfare service provision. We believe that health managers within local health system need to play proactive role in coordinating with various relevant departments in order to create enabling environment for people, especially urban poor, to manage diabetes and other such chronic conditions.
2.3. Improving provision of chronic condition care at local level
In government health services, there is very limited provision of primary healthcare, in particular chronic condition care, in urban poor neighborhoods. There were 862 slums in Bangalore city in 2012. The health facilities by the municipal government in this rapidly expanding city are very limited in number and the provision of services. Only four slums in the city have primary healthcare facilities of the municipal government.109 The primary healthcare provided at these facilities consists mainly of reproductive and childcare services with very limited community outreach. The vacancy rates for health workers crucial to chronic condition
care are very high: 63.7% for medical doctors, 59.3% for staff nurses, 77.5% for pharmacists and 83.7% for laboratory technicians.109 There is imminent need to ensure availability of free diagnostics and medications for common chronic conditions at primary and secondary level of government health facilities. In highly utilized private sector, medications and diagnostics remain expensive. Owing to several factors discussed in earlier section, healthcare providers in private sector are less likely to prescribe generic and/or low-cost medications. Hence, in addition to free medications in government sector, the interventions influencing prescription practice of healthcare providers, enhancing availability of quality generic and/or low-cost branded medications in private sector and raising patient awareness about and demand for generic medications will optimize the positive impact of affordable medications in chronic condition care. These could include, among others, the strict enforcement of the recent regulatory initiatives such as mandating doctors to use legible generic names of medications in their prescriptions110 and the uniform code of pharmaceutical marketing practices banning gifts and such offerings by pharmaceutical companies to doctors.111 There is need to promote use of standard treatment guidelines for management of chronic conditions.
2.4. Strengthening the role of patients, families and communities
The role of patients and family members, who are most commonly the caregivers in Indian context, is crucial in management of chronic conditions. Our study shows that at individual level, the patient-provider interactions are short where patients often hesitate to express themselves while providers tend to blame patients and fall short of adequate explanations. There is need to promote person centered care making healthcare providers sensitive to socioeconomic cultural and emotional contexts of their patients.
Furthermore, there are no functional platforms for engaging patient and broader community in formal healthcare services in KG Halli and in general in urban areas. In rural India, there are institutionalized platforms from village to district levels to promote community participation in planning and monitoring of government health services. While the experience of this strategy remains variable across the states, the relevant reports and published literature point to positive gains, including improved availability of medications for chronic conditions at government health facilities.74
2.5. Effective leadership and governance within local health system
There remains a functional divide between the government and the private health sector. Within government, there are multitudes of agencies providing healthcare to urban population that often work in silos. There are at least seven government agencies providing healthcare at varying scale in Bangalore city. The private sector is also heterogeneous including not-for-profit and for-profit entities with myriad of healthcare delivery platforms often practicing different systems of medicine. The healthcare delivery by these varied government and private providers is guided by different sets of values and goals. The implementation plan for the National (Urban) Health Mission in Bangalore, while making reference to private providers, fails to acknowledge the presence of all the government health providers (other than municipal government, state health and medical education departments) and how to coordinate among them. In such scenario, it is crucial that the state, beyond being funder and the provider of health services, play a stronger
role in governance of these mixed health systems: forging coordination mechanisms across healthcare providers (and other health system actors); effectively regulating private health sector and steering the health system towards common shared goals.
Lately, the governments are working out the regulations and policies concerning the private healthcare delivery system at national and state levels. The organized bodies representing private healthcare providers and establishments have generally resisted these regulatory initiatives. Our experience in KG Halli, however, indicates that the persistent work at the local health system level provides opportunities to engage with individual private healthcare providers and some of them are willing to embrace change and are open to test and learn from innovations in organization and delivery of health services at local level.
For example, many government health programs that need participation of private healthcare providers for efficient delivery of these health programs as well as for developing the area-specific health plan by the government health facilities for a given community provide ‘entry points’ for dialogues and coordination between these players who seemingly work in silos. As part of the Urban Health Action Research Project implemented by the Institute of Public Health (Bangalore), periodic dialogues between the government and the private healthcare providers were organized in KG Halli to discuss prevailing health issues and their potential solutions. Subsequently, based on the suggestions of the healthcare providers, a system of patient-held medicals records was introduced for common chronic conditions. Over time, a few of the private healthcare providers adopted this system while others discontinued for various reasons. A few more introduced their own version of medical records system. In general, this experiment helped to understand what form of medical records system might work better in prevailing health service organization in KG Halli. Similarly, the project staff collaborated with a private hospital and an elected leader from KG Halli to organize delivery of comprehensive primary care for patients with common chronic conditions. This included counseling services and provision of low-cost medications and diagnostic tests beyond routine medical consultations. Our intervention study with private healthcare providers in KG Halli helped understand factors affecting delivery of diabetes education and use of generic medications and standard treatment guidelines by private providers (see Chapter 5 of Part II). Such bottom-up experiments and learning foster innovations within local health system and could potentially feed into health policies.
In addition, there is need to effectively enforce the prevailing regulations concerning healthcare provision/establishments. There is documented corruption and malpractices in private sector in various forms negatively affecting the quality of treatment and the cost borne by patients. Many health workers in the private healthcare services are not adequately qualified or trained to do their work. As a result the quality of healthcare delivered in private sector remains variable. While the governments in India have acknowledged the need to regulate the private health sector since the early independence period, except for a few regulatory initiatives largely aimed at individual healthcare providers, it is only in 2010 that the federal government enacted a legislation to regulate private medical establishments: the Clinical Establishments (Registration and Regulation) Act. In 2007, Karnataka brought in a very similar legislation: the Karnataka Private Medical Establishments Act. It is aimed at mandating registration of private healthcare
facilities, ensuring that these facilities meet certain minimum standards of infrastructure and trained human resources, and that they maintain and provide to their patients the medical records. However, so far, there is poor enforcement of and compliance with these legislations.95
2.6. Macro-level policy reforms with potential impact on local health system
We briefly mention some of the major policy reforms at national level that are likely to impact local health systems, especially with regard to chronic condition care for the urban poor.
In 2013, the government of India finally approved the implementation framework for the National Urban Health Mission88, a much-talked-about program that was conceptualized to begin in the year 2008.112 The mission aimed to improve the health of the urban poor, especially of slum dwellers and other vulnerable urban groups, by enhancing their access to quality healthcare. The National Urban Health Mission was never implemented as such. Instead, the newly elected government of India designed an overarching National Health Mission113 that brought together the National Urban Health Mission and the erstwhile National Rural Health Mission114, a flagship program launched in 2006 to strengthen the rural health system. The National Health Mission, envisaged for a period from 2012 to 2017, provides an overarching framework to implement various national health programs and general health services so as to build synergies across them and provide guidance to achieve universal access to healthcare for all Indians. The National (Urban) Health Mission recognizes the growing burden of chronic conditions among the urban poor. It also recognizes that the primary care services offered by the government sector in urban areas, including outreach services to urban poor communities, are very limited, while the referral care facilities are generally overcrowded and not easy to navigate by the urban poor. The mission proposes to create new government health facilities as well as to augment the range of health services provided at the existing government health facilities so as to improve service provision to the urban poor. At present, the Mission covers limited sections of the urban poor population. The mission, over the time, aims to cover 779 cities/towns with over 50 000 population, including seven metropolitan cities.88 The National (Urban) Health Mission is to be implemented in five cities/towns of Karnataka, with Bangalore city being one of the implementation sites.115 The mission plans to create ten new primary healthcare facilities in slums where there are no existing government health facilities and to upgrade infrastructure and services offered by 70 of the existing government primary care facilities. These proposals are yet to be actualized on ground.
In India, there are a host of national government programs that aim to address specific chronic conditions, such as tuberculosis, HIV/AIDS, cancers, diabetes, cardiovascular diseases, blindness, deafness, fluorosis, mental health conditions, burn injuries, and oral health conditions. There are national programs to enhance the provision of palliative care and meet healthcare needs of the elderly population. The National Health Mission aims at building synergies across these programs and between the programs and the health system that is delivering the same. Many of these programs were formulated recently. They are very limited in its coverage. For example, the National Program for Prevention of Cancer, Diabetes, Cardiovascular Diseases and Stroke was launched in 2010 and is under implementation in 100 out of 676 districts in India.116 These programs are implemented in a context where there is already a high demand but a very limited provision of chronic condition care in the government healthcare services. For example,

in Karnataka, the National Program for Prevention of Cancer, Diabetes, Cardiovascular Diseases and Stroke is currently being implemented in five of the 30 districts. While the program aims at preventing and managing these ailments, at present, the implementation in limited districts is focused on doing screening of individuals for diabetes and hypertension. As a considerable portion of the people with these conditions remain undiagnosed in India, the screening phase identifies many new cases. However, the government health services are yet to gear up to respond to care demands of these individuals. The availability of medications at primary care services is very limited and there is a lack of functional referrals across different levels of government health services. The lack of information system does not allow for follow-up on patients and continuity of care over the time and across the healthcare providers.117
The present national government in India has proposed National Health Assurance Mission. This proposed initiative, yet to be launched, is likely to reform/merge existing health insurance schemes and provide health insurance to all the Indian citizens in a phased manner.118 It is proposed to make 50 essential medications (including those for diabetes and hypertension) available free at government health facilities. The availability of free medications for chronic conditions in government facilities has a great potential to reduce out-of-pocket health payments by patients visiting these facilities as the expenditure on medications form the greatest share of out-of-pocket healthcare spending. However, as indicated by our study, a majority of patients (including urban poor) are seeking care from private providers.
The national government has recently come out with the first draft of a National Health Policy 2015, which is put out for public comments.119 The draft policy in its very first paragraph clearly brings out the importance of strengthening health system: “The reality is straightforward. The power of existing interventions is not matched by the power of health systems to deliver them to those in greatest need…”. In its background the draft policy recognizes the need for focusing on urban poor and on chronic conditions and acknowledge s that the government attempts so far through the missions and programs are patchy and of very limited scale. The draft policy proposes to increase the government spending on health and strengthen the government system, including knowledge and information system, availability of trained human resources and free medications and diagnostics in government health facilities. It aims at enhancing coordination across various government agencies and programs. The draft provides a clear rationale and intention to regulate the private sector in health in order to align its goals with public policy goals. However, it does not provide clear mechanisms of how this might be achieved beyond what exists today. The draft also proposes to make access to healthcare as justiciable right, a fundamental and desirable shift from the prevailing scenario where healthcare for the poor is often limited to acts of charity. However, as recognized in this very draft, “a policy is only as good as its implementation” and past policies have faced severe implementation constraints.
2.7. Future research needs
We now briefly outline the areas that require further studies in order to better understand and frame the health system response to chronic conditions.
From a health systems viewpoint, ‘chronicity’ implies a set of common care demands from people that in turn require change in the way health services are currently financed, organized and delivered in India and many similar contexts. While there is growing number of epidemiological studies in India assessing the burden of specific chronic conditions (especially, diabetes, cardiovascular diseases, cancers and respiratory diseases), we are yet to have reliable information on the overall burden of chronic conditions in communities. This is very much likely to be varied across different parts of the country, as seen in the case of specific chronic conditions. Such data will be useful in informing and advocating for reorganization of health services at local and/or regional levels instead of more and more diseases-specific programs.
There is an increasing body of work on understanding out-of pocket payments for healthcare and its consequences on individuals and households in India. However, there is a dearth of studies examining this separately for acute and chronic conditions as well as for outpatient and inpatient care. Very few studies including ours show that while the income share spent as out-of-pocket healthcare expenditure appears to be progressive (wealthier spending higher share) in general, it is regressive (poor spending higher share) when it comes to outpatient care for chronic conditions. This can be explored further at scale and/or among mixed/poor neighborhoods in different parts of the country as such information has huge bearing on refining the prevailing financial protection measures for the poor across the country.
The field of health systems and policy research is evolving in India. We found many commentaries and editorials on health system challenges in, and reforms needed for, responding to rising burden of chronic conditions in India. However, there is dearth of studies empirically examining health systems at local levels. In our study, we found that many known and globally advocated strategies (e.g. enhancing people centeredness in healthcare, use of standard treatment protocols and generic medications) did not readily fit into realities of local health system in KG Halli. In other words, we encountered specific dynamics in KG Halli. In order to enhance health services, it was required to adapt the standard health service interventions to fit into those dynamics while also effecting change in the dynamics to allow for innovations/change in prevailing practices. The use of participatory research approaches, such as action research, where researchers in collaboration with health system actors test innovative organizational arrangements at the local level appears promising in finding local solutions while generating context-specific knowledge that can shape policies. Such approaches can help better understand many relevant issues in chronic condition care in India such as, introduction and use of medical records for patients with chronic conditions; alternative models of engagement among and coordination across plural healthcare providers; feasibility and implications of task shifting where non-physician health workers (nurses, pharmacists, community health workers) play bigger role in diabetes management; and building synergy between health services and other social and welfare services for patients with chronic conditions.
Finally, we observed that there remains a huge gap between the written policy documents and the practices related to healthcare delivery. For example, there are legislations related to healthcare facilities and healthcare providers mandating minimum availability and training/qualifications for health workers as well as prescribing preconditions and standards for establishing and running of health facilities. However, these regulations are poorly implemented.
Some of the policies are not rooted into the prevailing context/realities in which the healthcare sector operates. However, there is a dearth of explanatory research that critically examines this gap between the policies and the practice. There is need for policy analysis studies, especially with regard to policies regulating healthcare delivery.
3. References
1. Puwar TI, Kumpavat B, Trivedi KN. Pattern of morbidity and health seeking behavior in a slum area of ahmedabad city in India. Internet J Heal 2009;9(2). Available from: http://ispub.com/IJH/9/2/5679 [accessed on 19.07.2015]
2. Mohan V, Mathur P, Deepa R, Deepa M, Shukla DK, Menon GR, et al. Urban rural differences in prevalence of self-reported diabetes in India--the WHO-ICMR Indian NCD risk factor surveillance. Diabetes Res Clin Pract 2008;80(1):159–68.
3. Agrawal S, Ebrahim S. Prevalence and risk factors for self-reported diabetes among adult men and women in India: findings from a national cross-sectional survey. Public Health Nutr 2011;15(6):1065–77.
4. Raban MZ, Dandona R, Kumar GA, Dandona L. Inequitable coverage of non-communicable diseases and injury interventions in India. Natl Med J India 2010;23(5):267–73.
5. Moser KA, Agrawal S, Smith GD, Ebrahim S. Socio-demographic inequalities in the prevalence, diagnosis and management of hypertension in India: analysis of nationally-representative survey data. PLoS One. 2014;9(1):e86043. Available from: http://journals.plos.org/plosone/article?id=10.1371/journal.pone.0086043 [accessed on 19.07.2015]
6. Sidhu S, Kaur J, Randhawa R. Prevalence of hypertension in India: a review. Asian J Multidiscip Stud 2014;2(6):141–55.
7. Cheema A, Adeloye D, Sidhu S, Sridhar D, Chan KY. Urbanization and prevalence of type 2 diabetes in Southern Asia: a systematic analysis. J Glob Health 2014;4(1):010404.
8. Gupta R, Guptha S, Sharma KK, Gupta A, Deedwania P. Regional variations in cardiovascular risk factors in India: India heart watch. World J Cardiol 2012;4(4):112–20.
9. Baruah MP, Pathak A, Kalra S, Das AK, Zargar AH, Bajaj S, et al. A revisit to prevailing care and challenges of managing diabetes in India: focus on regional disparities. Indian J Endocrinol Metab 2014;18(3):254–63.
10. Joshi SR, Anjana RM, Deepa M, Pradeepa R, Bhansali A, Dhandania VK, et al. Prevalence of dyslipidemia in urban and rural India: the ICMR-INDIAB study. PLoS One. 2014;9(5):e96808. Available from: http://journals.plos.org/plosone/article?id=10.1371/journal.pone.0096808 [accessed on 19.07.2015]
11. Anand K, Shah B, Yadav K, Singh R, Mathur P, Paul E, et al. Are the urban poor vulnerable to non-communicable diseases? A survey of risk factors for non-communicable diseases in urban slums of Faridabad. Natl Med J India 2007;20(3):115–20.
12. Arora A, Sehgal A, Goyal A, Lakhani D, Uppal D, Sharma K, et al. Prevalence of type II diabetes mellitus and assessment of risk factors along with the health seeking behaviour of diabetics in slums of Delhi. J Asian Med Students’ Assoc 2013;2.
13. Singh R. Prevalence of self-reported reported diabetes and treatment in an urban slum of India. Int J Med Public Heal 2014;4(4):526.
14. Kroll M, Bharucha E, Kraas F. Does rapid urbanization aggravate health disparities? Reflections on the epidemiological transition in Pune, India. Glob Health Action 2014;7(23447). Available from:
http://www.globalhealthaction.net/index.php/gha/article/view/23447 [accessed on 19.07.2015]
15. Thankappan K, Shah B, Mathur P, Sarma P, Srinivas G, Mini G, et al. Risk factor profile for chronic non-communicable diseases: Results of a community-based study in Kerala, India. Indian J Med Res 2010;131:53–63.
16. Deepa M, Anjana RM, Manjula D, Narayan KV, Mohan V. Convergence of prevalence rates of diabetes and cardiometabolic risk factors in middle and low income groups in urban India: 10-year follow-up of the Chennai Urban Population Study. J Diabetes Sci Technol 2011;5(4):918–27.
17. Mohan V, Deepa M, Deepa R, Shanthirani C, Farooq S, Ganesan A, et al. Secular trends in the prevalence of diabetes and impaired glucose tolerance in urban South India — the Chennai Urban Rural Epidemiology Study (CURES-17). Diabetologia 2006;49:1175–8.
18. Sadikot S, Nigam A, Das S, Bajaj S, Zargar A, Prasannakumar K, et al. The burden of diabetes and impaired glucose tolerance in India using the WHO 1999 criteria: prevalence of diabetes in India study (PODIS). Diabetes Res Clin Pract 2004;66(3):301–7.
19. Menon V, Kumar K, Gilchrist A, Sugathan T, Sundaram K, Nair V, et al. Prevalence of known and undetected diabetes and associated risk factors in central Kerala - ADEPS. Diabetes Res Clin Pract 2006;74:289–94.
20. Brashier B, Londhe J, Madas S, Vincent V, Salvi S. Prevalence of self-reported respiratory symptoms, asthma and chronic bronchitis in slum area of a rapidly developing Indian city. Open J Respir Dis 2012;02:73–81.
21. Misra A, Pandey RM, Devi JR, Sharma R, Vikram NK, Khanna N. High prevalence of diabetes, obesity and dyslipidaemia in urban slum population in northern India. Int J Obes 2001;25:1722–9.
22. Kar SS, Thakur JS, Virdi NK, Jain S, Kumar R. Risk factors for cardiovascular diseases: is the social gradient reversing in nothern India? Natl Med J India 2010;23(4):206–9.
23. Vellakkal S, Subramanian SV, Millett C, Basu S, Stuckler D, Ebrahim S. Socioeconomic inequalities in non-communicable diseases prevalence in India: disparities between self-reported diagnoses and standardized measures. PLoS One 2013;8(7):e68219. Available from: http://journals.plos.org/plosone/article?id=10.1371/journal.pone.0068219 [accessed on 19.07.2015]
24. Subramanian SV, Corsi DJ, Subramanyam MA, Smith GD. Jumping the gun: the problematic discourse on socioeconomic status and cardiovascular health in India. Int J Epidemiol 2013 Oct;42(5):1410–26.
25. Gupta PC, Pednekar MS. Re: Jumping the gun: the problematic discourse on socioeconomic status and cardiovascular health in India. Int J Epidemiol 2014;43(1):276–8.
26. Jones-Smith JC. Commentary: Jumping the gun or asleep at the switch: is there a middle ground? Int J Epidemiol 2013;42(5):1435–7.
27. Gwatkin DR. Metrics matter: the case of assessing the importance of non-communicable diseases for the poor. Int J Epidemiol 2013;42(5):1211–4.
28. Stringhini S, Bovet P. Commentary: The social transition of cardiovascular disease in low- and middle-income countries: wait and see is not an option. Int J Epidemiol 2013;42(5):1429–31.
29. Narayan KMV, Ali MK. Commentary: Shielding against a future inferno: the not-so-problematic discourse on socioeconomic status and cardiovascular health in India. Int J Epidemiol 2013;42(5):1426–9.
30. Prabhakaran D, Jeemon P, Reddy KS. Commentary: Poverty and cardiovascular disease in India: do we need more evidence for action? Int J Epidemiol 2013;42(5):1431–5.
31. Barua N, Pandav CS. The allure of the private practitioner: is this the only alternative for the urban poor in India? Indian J Public Health 2011;55(2):107–14.
32. Mili D. Migration and healthcare: access to healthcare services by migrants settled in Shivaji Nagar slum of Mumbai, India. theHealth. 2011;2(3):82–5. Available from: http://www.thehealthj.com/september_2011/migration_and_healthcare_access_to_healthcare_services_by_migrants_settled_in_Shivaji_Nagar_slum_of_Mumbai_India.pdf [accessed on 19.07.2015]
33. Yadav K, Nikhil S, Pandav CS. Urbanization and health challenges: need to fast track launch of the National Urban Health Mission. Indian J community Med 2011;36(1):3–7.
34. Banerjee A, Jadhav S, Khedkar D, Bhawalkar J, Rathod H. Access to health services among slum dwellers in an industrial township and surrounding rural areas: a rapid epidemiological assessment. J Fam Med Prim Care 2012;1(1):20–6.
35. Ergler CR, Sakdapolrak P, Bohle H-G, Kearns RA. Entitlements to health care: why is there a preference for private facilities among poorer residents of Chennai, India? Soc Sci Med 2011;72(3):327–37.
36. National Sample Survey Office. Key indicators of social consumption in India - Health NSS 71st Round January-June 2014. Ministry of Statistics and Programme Implementation, Government of India; 2015.
37. Rao KD, Bhatnagar A, Murphy A. Socio-economic inequalities in the financing of cardiovascular & diabetes inpatient treatment in India. Indian J Med Res 2011;133(1):57–63.
38. Berman P, Ahuja R, Bhandari L. The impoverishing effect of healthcare payments in India: new methodology and findings. Econ Polit Wkly 2010;xlv(16):65–71.
39. Ghosh S. Catastrophic payments and impoverishment due to out-of-pocket health spending. Econ Polit Wkly 2011;XLVI:63–70.
40. Garg CC, Karan AK. Reducing out-of-pocket expenditures to reduce poverty: a disaggregated analysis at rural-urban and state level in India. Health Policy Plan 2009;24:116–28.
41. Gupta I. Out-of-pocket expenditures and poverty: estimates from NSS 61st round. Draft paper presented for consideration of the expert group on poverty, Planning Commission; 2009. Available from: planningcommission.nic.in/reports/genrep/indrani.pdf [accessed on 19.07.2015]
42. Vaishnavi SD, Dash U. Catastrophic payments for health care among households in urban Tamil Nadu, India. J Int Dev 2009;21:169–84.
43. Berman P. Rethinking health care systems: private health care provision in India. World Dev 1998;26(8):1463–79.
44. Karan A, Engelgau M, Mahal A. The household-level economic burden of heart disease in India. Trop Med Int Heal 2014;19(5):581–91.
45. Dror DM, Van Putten-rademaker O, Koren R. Cost of illness : Evidence from a study in five resource-poor locations in India. Indian J Med Res 2008;127:347–61.
46. Mondal S, Kanjilal B, Peters DH, Lucas H. Catastrophic out-of-pocket payment for health care and its impact on households: experience from West Bengal, India. Future Health Systems - innovations for equity; 2010. Available from: http://www.chronicpoverty.org/uploads/publication_files/mondal_et_al_health.pdf [accessed on 19.07.2015]
47. Yesudian C, Grepstad M, Visintin E, Ferrario A. The economic burden of diabetes in India: a review of the literature. Global Health 2014;10(80).
48. Kumar D, Mukherjee K. Economic impact of type-2 diabetes mellitus on households in Hisar district of Haryana state, India. Heal Agenda 2014;2(4):125–9.
49. Kotwani A, Ewen M, Dey D, Iyer S, Lakshmi PK, Patel A, et al. Prices & availability of common medicines at six sites in India using a standard methodology. Indian J Med Res 2007;125:645–54.

50. Kotwani A. Availability, price and affordability of asthma medicines in five Indian states.Int J Tuberc Lung Dis 2009;13(5):574–9.
51. Kotwani A. Where are we now: assessing the price, availability and affordability ofessential medicines in Delhi as India plans free medicine for all. BMC Health Serv ResBMC 2013;13(1):285.
52. Mendis S, Fukino K, Cameron A, Laing R, Jr F, Khatib O, et al. The availability andaffordability of selected essential medicines for chronic diseases in six low- and middle-income countries. Bull World Health Organ 2007;85:279–88.
53. Mourik MSM Van, Cameron A, Ewen M, Laing RO. Availability, price and affordabilityof cardiovascular medicines: a comparison across 36 countries using WHO/HAI data.BMC Cardiovasc Disord 2010;10(25).
54. Shobhana R, Begum R, Snehalatha C, Vijay V, Ramachandran A. Patients’ adherence todiabetes treatment. J Assoc Physicians India 1999;47(12):1173–5.
55. Medi RK, Mateti UV, Kanduri KR, Konda SS. Medication adherence and determinants ofnon-adherence among south Indian diabetes patients. J Soc Heal Diabetes 2015;3(1):48–51.
56. Mendenhall E, Shivashankar R, Tandon N, Ali MK, Narayan KMV, Prabhakaran D.Stress and diabetes in socioeconomic context: a qualitative study of urban Indians. SocSci Med 2012;75(2012):2522–9.
57. Nicolucci A, Kovacs Burns K, Holt RIG, Comaschi M, Hermanns N, Ishii H, et al.Diabetes Attitudes, Wishes and Needs second study (DAWN2TM): cross-nationalbenchmarking of diabetes-related psychosocial outcomes for people with diabetes. DiabetMed 2013;30:767–77.
58. Weaver LJ. When family comes first: diabetes, social roles, and coping among women inurban north India. Emory University; 2014.
59. Garg A, Anand T, Sharma U, Kishore J, Chakraborty M, Ray PC, et al. Prevalence of riskfactors for chronic non-communicable diseases using WHO steps approach in an adultpopulation in Delhi. J Fam Med Prim Care 2014;3(2):112–8.
60. Sridhar GR, Madhu K, Veena S, Madhavi R, Sangeetha BS, Rani A. Living withdiabetes: Indian experience. Diabetes Metab Syndr Clin Res Rev 2007;1(3):181–7.
61. Shobhana R, Rama Rao P, Lavanya A, Padma C, Vijay V, Ramachandran A. Quality oflife and diabetes integration among subjects with type 2 diabetes. J Assoc PhysiciansIndia 2003;51:363–5.
62. Registrar General and Census Commissioner. Census of India 2011 release of social andcultural tables - age: data highlights; 2013. Available from:http://www.censusindia.gov.in/2011-Documents/Census_2011_Age_data-final-12-09-2013.ppt [19.07.2015]
63. Dey S, Nambiar D, Lakshmi J, Sheik K, Reddy KS. Health of the elderly in India: challenges of access and affordability. In: Smith JP, Majmundar M, (editors) Aging in Asia: findings from new and emerging data initiatives. Washington: The National Academies Press; 2012.
64. UNFPA, HelpAge International. Ageing in the twenty-first century: a celebration and a challenge. 2012 Available from: http://www.unfpa.org/sites/default/files/pub-pdf/Ageing%20report.pdf [accessed on 19.07.2015]
65. Central Statistics Office. Situation analysis of the elderly in India. New Delhi: Ministry of Statistics and Programme Implementation, Government of India; 2011 Available from: http://mospi.nic.in/mospi_new/upload/elderly_in_india.pdf [accessed on 19.07.2015]
66. Prasad S. Deprivation and vulnerability among elderly in India. WP-2011-013. Mumbai: Indira Gandhi Institute of Development Research; 2011. Available from: http://www.igidr.ac.in/pdf/publication/WP-2011-013.pdf [accessed on 19.07.2015]
67. Das S. The role of family in health and healthcare utilization among elderly. Rourkela: National Institute of Technology; 2012. Available from: http://ethesis.nitrkl.ac.in/3646/1/project.pdf [accessed on 19.07.2015]
68. Sathyanarayana K, Kumar S, James K. Living arrangements of elderly in India: policy and programmatic implications. BKPAI Working Paper No.7. New Delhi; 2012 Available from: http://countryoffice.unfpa.org/india/drive/LivingarrangementinIndia.pdf [accessed on 19.07.2015]
69. Holt RIG, Nicolucci A, Kovacs Burns K, Escalante M, Forbes A, Hermanns N, et al. Diabetes Attitudes, Wishes and Needs second study (DAWN2TM): cross-national comparisons on barriers and resources for optimal care--healthcare professional perspective. Diabet Med 2013;30:789–98.
70. Patro BK, Kumar R, Goswami A, Nongkynrih B, Pandav CS. Community perception and client satisfaction about the primary health care services in an urban resettlement colony of New Delhi. Indian J community Med 2008;33(4):250–4.
71. Kumari R, Idris M, Bhushan V, Khanna A, Agarwal M, Singh S. Study on patient satisfaction in the government allopathic health facilities of lucknow district, India. Indian J community Med 2009;34(1):35–42.
72. Chandwani HR, Jivarajani PJ, Jivarajani HP. Community perception and client satisfaction about the primary health care services in a tribal setting of Gujarat - India. Internet J Heal 2009;9(2). Available from: http://ispub.com/IJH/9/2/8795 [accessed on 19.07.2015]
73. Kumar S. Seen and not heard. Br Med J 2003;326(7402):1295.
74. Shukla A, Khanna R, Jadhav N. Using community-based evidence for decentralized health planning: insights from Maharashtra, India. Health Policy Plan 2014;1–12.
75. Van Olmen J, Criel B, Bhojani U, Marchal B, Van Belle S, Chenge MF, et al. The health system dynamics framework: the introduction of an analytical model for health system analysis and its application to two case-studies. Heal Cult Soc 2012;2(1):1–21.
76. Van Olmen J, Criel B, Van Damme W, Marchal B, Van Belle S, Van Dormael M, et al. Analysing health systems to make them stronger. Antwerp: ITG Press; 2010.
77. The Chronic Care Model. Improving Chronic Illness Care. Available from: http://www.improvingchroniccare.org/index.php?p=The_Chronic_Care_Model&s=2 [accessed on 19.07.2015]
78. The Chronic Care Model - chronic care model gallery. Improving Chronic Illness Care. Available from: http://www.improvingchroniccare.org/index.php?p=CCM_Gallery&s=149 [accessed on 19.07.2015]
79. World Health Organization. Innovative care for chronic conditions: building blocks for action. Geneva: World Health Organization; 2002.
80. World Health Organization. Everybody’s business: Strengthening health systems to improve health outcomes. WHO's framework for action. Geneva: World Health Organization; 2007
81. Department of AYUSH. About the systems - AYUSH, government of India. Department of Ayush, Ministry of Health & Family Welfare, Government of India; 2010. Available from: http://www.indianmedicine.nic.in/index1.asp?lang=1&linkid=17&lid=40 [accessed on 19.07.2015]
82. The World Bank. Memorandum and recommendation of the president of the international development association to the executive directors on a proposed credit of SDR 57.7 million to India for a family welfare (urban slums) project; 1992 Available from: http://wwwwds.worldbank.org/external/default/WDSContentServer/WDSP/IB/1992/05/28/000009265_3961003011255/Rendered/PDF/multi0page.pdf [accessed on 19.07.2015]
83. Planning Commission of India. Health and Family Planning. 4th Five Year Plan. New Delhi: Planning Commission, Government of India; 1969. Available from: http://planningcommission.nic.in/plans/planrel/fiveyr/4th/4planch18.html [accessed on 19.07.2015]
84. Planning Commission of India. Health and Family Planning. 3rd Five Year Plan. New Delhi: Planning Commission, Government of India; 1961. Available from: http://planningcommission.nic.in/plans/planrel/fiveyr/3rd/3planch32.html [accessed on 19.07.2015]
85. Planning Commission of India. Health, Family Planning and Nutrition. 6th Five Year Plan. New Delhi: Planning Commission, Government of India; 1974. Available from: http://planningcommission.nic.in/plans/planrel/fiveyr/6th/6planch22.html [accessed on 19.07.2015]
86. Planning Commission of India. Health. 1st Five Year Plan (1951-1956). New Delhi: Planning Commission, Government of India; 1951. Available from: http://planningcommission.nic.in/plans/planrel/fiveyr/default.html [accessed on 19.07.2015]
87. Planning Commission of India. Health. 2nd Five Year Plan. New Delhi: Planning Commission, Government of India; 1956. Available from: http://planningcommission.nic.in/plans/planrel/fiveyr/2nd/2planch25.html [accessed on 19.07.2015]
88. Ministry of Health and Family Welfare. National Urban Health Mission: framework for implementation. New Delhi; 2013 Available from: www.pbnrhm.org/docs/nuhm_framework_implementation.pdf [accessed on 19.07.2015]
89. Deepa M, Pradeepa R, Anjana R, Mohan V. Noncommunicable diseases risk factor surveillance: experience and challenge from India. Indian J Community Med 2011;36(Suppl 1):S50–6.
90. National Institute of Medical Statistics & Indian Council of Medical Research. IDSP Non-Communicable Disease Risk Factor Survey, Phase-I States of India, 2007-2008. New Delhi; 2009 Available from: http://www.icmr.nic.in/final/IDSP-NCD%20Reports/Summary.pdf [accessed on 19.07.2015]
91. Anjana RM, Ali MK, Pradeepa R, Deepa M, Datta M, Unnikrishnan R, et al. The need for obtaining accurate nationwide estimates of diabetes prevalence in India - rationale for a national study on diabetes. Indian J Med Res 2011;133(4):369–80.
92. Kalra S, Sridhar GR, Balhara YPS, Sahay RK, Bantwal G, Baruah MP, et al. National recommendations: Psychosocial management of diabetes in India. Indian J Endocrinol Metab 2013;17(3):376–95.
93. Indian Council of Medical Research. Guidelines for Management of Type 2 Diabetes. New Delhi: Indian Council of Medical Research; 2005. Available from: http://icmr.nic.in/guidelines_diabetes/guide_diabetes.htm [accessed on 19.07.2015]
94. Ministry of Health and Family Welfare. Standard treatment guidelines. The Clinical Establishments (Registration and Regulation) Act, 2010. Available from: http://clinicalestablishments.nic.in/En/1068-standard-treatment-guidelines.aspx [accessed on 19.07.2015]
95. Nandraj S. Unregulated and unaccountable: private health providers. Econ Polit Wkly 2012;xlvii(4):12–7.
96. Nandraj S. Private health sector: Concerns, challenges and options. In: Nandraj S, Muraleedharan V, Baru R V, Qadeer I, Priya R, (editors) Private sector in India: review and annotated bibliography. Mumbai: Centre for Enquiry into Health and Allied Themes (CEHAT); 2001. Available from: www.cehat.org/go/uploads/Rphsi/phsi.pdf [accessed on 19.07.2015]
97. Planning Commission of India. Health and Family Welfare. 7th Five Year Plan ( 1985-1990) Vol-2. New Delhi: Planning Commission, Government of India; 1985. Availablefrom: http://planningcommission.nic.in/plans/planrel/fiveyr/default.html [accessed on19.07.2015]
98. Sudarshan H, Bhojani U, Madhav G, Prabha N. Community planning and monitoring ofhealth services: Karnataka experience. Bangalore: Karuna Trust; 2009.
99. Singal GL, Nanda A, Kotwani A. A comparative evaluation of price and quality of somebranded versus branded-generic medicines of the same manufacturer in India. Indian JPharmacol 2011;43(2):131–6.
100. Ravinetto RM, Dorlo TP, Caudron J-M, Prashanth N. The global impact of Indiangenerics on access to health. Indian J Med Ethics 2013;X(2):118–20.
101. Cockburn J, Pit S. Prescribing behaviour in clinical practice: patients’ expectations anddoctors' perceptions of patients' expectations a questionnaire study. BMJ1997;315(7107):520–3.
102. Britten N, Ukoumunne O. The influence of patients’ hopes of receiving a prescription ondoctors' perceptions and the decision to prescribe: a questionnaire survey. BMJ1997;315(7121):1506–10.
103. Britten N. Patients’ expectations of consultations. Science 2004;328:416–7.
104. Barry CA, Bradley CP, Britten N, Stevenson FA, Barber N. Patients’ unvoiced agendas ingeneral practice consultations: qualitative study. BMJ 2000;320(7244):1246–50.
105. Little P, Dorward M, Warner G, Stephens K, Senior J, Moore M. Importance of patientpressure and perceived pressure and perceived medical need for investigations, referral,and prescribing in primary care: nested observational study. BMJ 2004;328(7437):444.
106. Rashtriya Swasthya Bima Yojna. Overview: Enrollment of Beneficiaries. Available from:http://www.rsby.gov.in/Overview.aspx [accessed on 19.07.2015]
107. Forgia G La, Nagpal S. Government-sponsored health insurance in India: are youcovered? Washington: The World Bank; 2012.
108. Chopra S, Pudussery J. Social security pensions in India - an assessment. Econ PolitWkly 2014;XLIX(19):68–74.
109. Government of Karnataka. National Urban Health Mission Bengaluru City (BhruhatBengaluru Mahanagara Palike - BBMP) Programme Implementation Plan 2013-2014.Bengaluru; 2013 Available from: http://nrhm.gov.in/images/pdf/nuhm-instate/state-program/pip/Karnataka/NUHM_PIP_Karnataka_2013-14.zip [accessed on 19.07.2015]
110. Press Trust of India. Doctors will now write generic drugs name in capital letters.Business Standard. 2014. Available from: http://www.business-standard.com/article/pti-stories/doctors-will-now-write-generic-drugs-name-in-capital-letters-114120500547_1.html [accessed on 19.07.2015]
111. Department of Pharmaceuticals Government of India. Code of marketing practice forIndian pharmaceutical industry. 2014. Available from:http://pharmaceuticals.gov.in/uniformcode.pdf [accessed on 19.07.2015]
112. Ministry of Health and Family Welfare. National Urban Health Mission (2008-2012):meeting the health challenges of urban population specially the urban poor - draft forciculation. Urban Health Division, Ministry of Health and Family Welfare, Governmentof India; 2008. Available from: www.uhrc.in/downloads/Reports/NUHM-Draft.pdf[accessed on 19.07.2015]
113. Ministry of Health and Family Welfare. National Health Mission: Framework forimplementation 2012-2017. New Delhi: Ministry of Health and Family Welfare,Government of India. Available from:http://nrhm.gov.in/images/pdf/NHM/NRH_Framework_for_Implementation__08-01-2014_.pdf [accessed on 19.07.2015]
114. Ministry of Health and Family Welfare. National Rural Health Mission Meeting people’shealth needs in rural areas: Framework for Implementation 2005-2012. New Delhi:Ministry of Health and Family Welfare, Government of India; 2005. Available from:http://nrhm.gov.in/images/pdf/about-nrhm/nrhm-framework-implementation/nrhm-framework-latest.pdf [accessed on 19.07.2015]
115. Government of Karnataka. National Urban Health Mission Bengaluru City (BhruhatBengaluru Mahanagara Palike - BBMP) Programme Implementation Plan 2013-2014.Bengaluru; 2013 Available from: http://nrhm.gov.in/images/pdf/nuhm-instate/state-program/pip/Karnataka/NUHM_PIP_Karnataka_2013-14.zip [accessed on 19.07.2015]
116. Government of India. National action plan and monitoring framework for prevention andcontrol of noncommunicable diseases (NCDs) in India. Available from:http://www.searo.who.int/india/topics/cardiovascular_diseases/National_Action_Plan_and_Monitoring_Framework_Prevention_NCDs.pdf?ua=1 [accessed on 19.07.2015]
117. Manganavar B. Bheemaray Manganavar: reimagining the response to non-communicablediseases in India. thebmjblogs 2014. Available from:http://blogs.bmj.com/bmj/2014/12/30/bheemaray-manganavar-re-imagining-the-response-to-non-communicable-diseases-in-india/ [accessed on 19.07.2015]
118. Dey S. Health insurance for all likely in January. The Times of India 2014.Available from: http://timesofindia.indiatimes.com/india/Health-insurance-for-all-likely-in-January/articleshow/45245817.cms [accessed on 19.07.2015]
119. Ministry of Health and Family Welfare. National Health Policy 2015 Draft (placed inpublic domain for comments, suggestions, feedback). Ministry of Health and FamlyWelfare; 2014. Available from: http://www.mohfw.nic.in/showfile.php?lid=3014[accessed on 19.07.2015]

SAMENVATTING
Chronische degeneratieve aandoeningen nemen wereldwijd sterk toe en nog het meest in landen met meer lage- en middenklasinkomens. In India heeft 1 op 5 volwassenen tenminste één chronische aandoening en 60% van alle doodsoorzaken in India zijn toe te schrijven aan chronische aandoeningen. India staat op de tweede plaats voor wat betreft het aantal mensen met diabetes mellitus. In de meeste landen, India inbegrepen, is de gezondheidszorg traditioneel meest toegespitst op acute, episodische aandoeningen. Personen met een chronische aandoening en ook complexe noden en zorgen, hebben nood aan “lange termijn”, meestal ook levenslange opvolging via de gezondheidszorg. Een antwoord kunnen bieden op gezondheidszorgbehoeften voor deze grote groep personen, is een uitdaging voor het toch al zwakke gezondheidszorgsysteem in India.
Er is veel literatuur beschikbaar, hoofdzakelijk gebaseerd op informatie uit landen met hoge inkomens, over hoe gezondheidszorgsystemen kunnen gereorganiseerd worden om een betere zorg te bieden in het kader van chronische aandoeningen. Globale gezondheidsactoren zetten deze problematiek meer en meer in de kijker. Toch is er nog altijd een grote kloof tussen de beschikbare kennis en het implementeren ervan. Er is bovendien een gebrek aan onderzoek op het niveau van lokaal bestuur. In India leven ongeveer 100 miljoen personen in stedelijke sloppenwijken waar er geen toegang is tot basisvoorzieningen en tot basis gezondheidszorg. Daar de meerderheid van chronische aandoeningen meer prevalent is in stedelijke gebieden, hebben we besloten om onderzoek te verrichten naar de rol van een lokaal gezondheidsplatform, in welke mate een lokaal gezondheidsplatform een rol kan spelen in het verbeteren van de gezondheidszorg voor armen, met chronische aandoeningen, wonende in sloppenwijken.
We voerden een reeks opeenvolgende onderzoeken met een verschillende onderzoeksdesign uit in KG Halli, een arme sloppenwijk in de stad Bangalore in het zuiden van India.
In de eerste fase van het onderzoek kregen 9299 gezinnen een vragenlijst in te vullen. Informatie werd verzameld over zelf gerapporteerde ziekteprofielen en gedrag m.b.t. de zoektocht naar geschikte gezondheidszorg en naar gezondheidszorguitgaven in het kader van chronische aandoeningen.
In de tweede fase van de studie, besloten we om binnen de chronische aandoeningen, de focus te leggen op diabetes mellitus type-2. Om de perceptie van patiënten en de lokale gezondheidswerkers over het begrip lokale gezondheidszorg te begrijpen hebben we een kwalitatieve studie uitgevoerd. We verrichten (1) diepte-interviews bij diabetespatiënten, gebruik makende van een fenomenologische benadering van hun ervaring van het leven met diabetes en hun zoektocht naar zorg; en (2) semi gestructureerde interviews met gezondheidswerkers, gebaseerd op een dynamisch gezondheidszorgplatform, met informatie over de hiaten in de organisatie van diabeteszorg en hun suggesties voor haalbare interventies om de diabeteszorg te verbeteren.
In de derde fase hebben we een quasi experimentele studie uitgevoerd in de buurt. In vier gezondheidswijken werd een interventie uitgevoerd. Andere wijken dienden als controlegroep.
De interventie, ontwikkeld met behulp van suggesties van lokale gezondheidswerkers, bestond uit (1) verstrekking van informatie over diabetes via posters en videos; (2) het voorschrijven van generische medicatie; en (3) het gebruik van standaardrichtlijnen in verband met diabetesopvolging. Het onderzoek werd uitgevoerd op twee tijdsmomenten, bij de start van het onderzoek en opnieuw na 6 maanden, en dit in elke onderzoeksgroep. Veldwerkobservaties werden uitgevoerd gedurende de interventieperiode. De interviews werden afgenomen door artsen in het interventiecentrum. We gebruikten het RE-AIM netwerk om na de studie/interventieperiode het bereik, de effectiviteit, het adopteren van, de implementatie en de duurzaamheid van de interventie te begrijpen.
We vonden een hoge zorgbelasting van chronische aandoeningen in KG Halli. Over het algemeen is de prevalentie van zelf-gerapporteerde chronische aandoeningen bij volwassenen 13.8%. Hoge bloeddruk (10%) en diabetes (6.4%) werden het meest gerapporteerd. Ouderen en vrouwen rapporteerden meer chronische aandoeningen. We vonden een omgekeerd socio-economisch effect, personen wonende in gezinnen “onder de armoedegrens” hadden een drie maal grotere kans op het rapporteren van chronische aandoeningen vergeleken met personen wonende in gezinnen “boven de armoedegrens”. Private gezondheidszorginstellingen hebben meer dan 80% patiënten in hun bestand. Een stijging van het inkomen was positief geassocieerd met het gebruik van een private zorginstelling. Echter, ouderen, personen uit gezinnen”beneden de armoedegrens” en personen die hulp zochten in ziekenhuizen waren meer geneigd om gebruik te maken van overheidsdiensten.
Eén op de drie huishoudens moest zelf de medische kosten voor ambulante verzorging voorschieten.
Eén op de zes huishoudens kwam in financiële problemen door meer dan 10% van hun inkomen te besteden aan gezondheidszorg. Onze studie bracht aan het licht dat armen verhoudingsgewijs een hoger budget van hun inkomen spendeerden aan gezondheidszorg voor chronische aandoeningen. Het voorschieten van medische kosten voor chronische aandoeningen gaf aanleiding tot een verdubbeling van het aantal personen die leefden onder de armoedegrens, met een nog grotere armoede tot gevolg. De meerderheid van de gezinnen moesten hun spaargeld gebruiken en sommigen moesten ook geld gaan lenen, goederen verkopen of hypotheken nemen om de behandelingskost te kunnen betalen.
Ondanks een overvloed aan gezondheidszorginstellingen in de nabijheid, onthulden de patiëntverhalen talloze moeilijkheden in het bekomen van gezondheidszorg zoals financiële problemen, negatieve attitudes en inadequate communicatie met gezondheidswerkers en ook versnippering van de gezondheidszorg infrastructuur. Familiepatronen benadelen vaak vrouwen voor wat betreft de toegang tot gezondheidszorg, door hun mobiliteit en autonomie te beperken. De heersende gezinsstructuur en conflicten tussen generaties limiteerden ook de ondersteuning en de zorg van ouderen.
Er waren drie grote tekortkomingen in het leveren van kwalitatieve diabeteszorg. Inadequaat gebruik van medische dossiers en het ontbreken van een doorverwijzingssysteem belemmeren de zorgcontinuïteit. Gebrek aan een standaard behandelingsprotocol heeft een effect op de klinische besluitvorming. De slechte werking van de private sector, slechte coördinatie tussen
gezondheidswerkers en gezondheidszorgplatformen, wijdverbreide omkooppraktijken en het ontbreken van platforms voor patiënt engagement, hebben een invloed op een effectief leiderschap en bestuur. Er is een tekort aan vertrouwen tussen patiënten en gezondheidswerkers. De private zorgverlening, met de meeste gezondheidswerkers zelfs zonder een adequate training, beoogt louter maximum winst en beschouwt gezondheidszorg voor de armen als liefdadigheid.
De interventiestudie onthulde een complex patroon van “zoeken naar gezondheid”, met een effect op de bereikbaarheid van gezondheidsinterventie wanneer deze gezondheidszorg wordt aangeboden door een beperkt aantal gezondheidszorg faciliteiten. De interventie was ook slecht geïmplementeerd omwille van weerstand van private artsen. De interventie had geen significant effect op kennis, uitgaven van gezondheidszorg en diabetescontrole bij de patiënten. Echter, artsen in interventiewijken namen een verbetering in kennis en initiatief met betrekking tot de chronische aandoeningen waar bij de patiënten. Artsen schreven zelden generieke medicijnen voor omwille van bezorgdheid over de kwaliteit, de beschikbaarheid en de aanvaarding ervan door de patiënten. De perceptie van de patiënt dat aandoeningen moeten worden behandeld met medicijnen limiteert het gebruik van een niet-medicamenteuze behandeling in een vroeg stadium van diabetes. Een andere reden voor het gelimiteerd gebruik van een standaard behandelingsprotocol was te wijten aan het feit dat deze artsen de patiënt opvolgden. Zij hadden reeds een behandelingsplan voorgeschreven gekregen door specialisten.
Onze studie wijst op de dringende noodzaak om de lokale gezondheidszorg te versterken en betaalbare en kwalitatieve zorgverlening toe te kennen aan een groot aantal personen, in het bijzonder aan de armen in de steden, lijdende aan chronische aandoeningen. Het onthult een complexe dynamiek rond lokale gezondheidszorg en wijst op mogelijkheden op lokaal gebied om de zorg van chronische aandoeningen te verbeteren. Het benadrukt de noodzaak om verder te kijken dan enkel de gezondheidszorgsystemen, maar ook sociale determinanten van chronische aandoeningen zoals armoede, leeftijd- en gender gebaseerde normen, veranderende familiestructuren en inadequate sociale hulpverlening mee te betrekken.

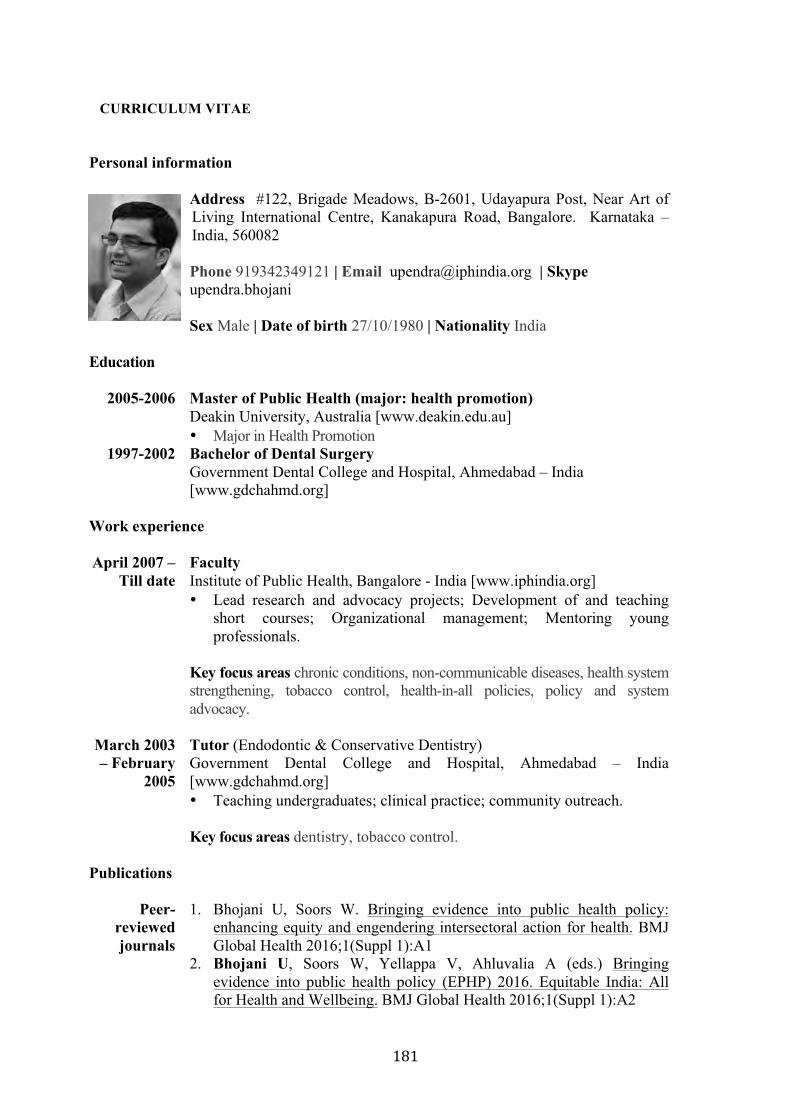
CURRICULUM VITAE
Personal information Address #122, Brigade Meadows, B-2601, Udayapura Post, Near Art of
Living International Centre, Kanakapura Road, Bangalore. Karnataka – India, 560082 Phone 919342349121 | Email [email protected] | Skype upendra.bhojani Sex Male | Date of birth 27/10/1980 | Nationality India
Education
2005-2006 Master of Public Health (major: health promotion) Deakin University, Australia [www.deakin.edu.au] • Major in Health Promotion
1997-2002 Bachelor of Dental Surgery Government Dental College and Hospital, Ahmedabad – India [www.gdchahmd.org]
Work experience April 2007 –
Till date Faculty Institute of Public Health, Bangalore - India [www.iphindia.org] • Lead research and advocacy projects; Development of and teaching
short courses; Organizational management; Mentoring young professionals.
Key focus areas chronic conditions, non-communicable diseases, health system strengthening, tobacco control, health-in-all policies, policy and system advocacy.
March 2003 – February
2005
Tutor (Endodontic & Conservative Dentistry) Government Dental College and Hospital, Ahmedabad – India [www.gdchahmd.org] • Teaching undergraduates; clinical practice; community outreach.
Key focus areas dentistry, tobacco control.
Publications
Peer-reviewed journals
1. Bhojani U, Soors W. Bringing evidence into public health policy: enhancing equity and engendering intersectoral action for health. BMJ Global Health 2016;1(Suppl 1):A1
2. Bhojani U, Soors W, Yellappa V, Ahluvalia A (eds.) Bringing evidence into public health policy (EPHP) 2016. Equitable India: All for Health and Wellbeing. BMJ Global Health 2016;1(Suppl 1):A2
3. Rao N, Bhojani U, Shekar P, Daddi S. Conflicts of interest in tobacco control in India: an exploratory study. Tobacco Control 2015;052503
4. Bhojani U, Kolsteren P, Criel B, De Henauw S, Beerenahally TS, Verstraeten R, Devadasan N. Intervening in the local health system to improve diabetes care: lessons from a health service experiment in a poor urban neighbourhood in India. Global Health Action 2015;8:28762
5. Bhojani U, Soors W. Tobacco control in India: a case for Health-in-All Policy approach. National Medical Journal of India 2015;28(2):e1-e4
6. Gowda MJ, Bhojani U, Devadasan N, Beerenahally TS. The rising burden of chronic conditions among urban poor: a three-year follow-up survey in Bengaluru, India. BMC Health Service Research 2015;15:330
7. Bhojani U, Devadasan N, Mishra A, De Henauw S, Kolsteren P, Criel B. Health system challenges in organizing quality diabetes care for urban poor in south India. PLoS ONE 2014;9(9):e106522
8. Bhojani U, Hebbar P, Rao V, Shah V. Litigation for claiming health rights: insights from tobacco control. Health and Human Rights 2014
9. Bhojani U, Mishra A, Amruthavalli S, Devadasan N, Kolsteren P, De Henauw S, Criel B. Constraints faced by urban poor in managing diabetes care: patients’ perspectives from South India. Global Health Action 2013;6:22258
10. Bhojani U, Venkataraman V, Manganawar B. Challenging ties between state and tobacco industry: advocacy lessons from India. Health Promotion Perspectives 2013;3(1):102-112
11. Bhojani U, Beerenahalli TS, Devadasan R, Munegowda CM, Devadasan N, Criel B, Kolsteren P. No longer diseases of the wealthy: prevalence and health-seeking for self-reported chronic conditions among urban poor in Southern India. BMC Health Service Research 2013;13:306
12. Van Olmen J, Criel B, Bhojani U, Marchal B, Van Belle S, Chenge MF, Hoeree T, Pirard M, Van Damme W, Kegels G. The health system dynamics framework: the introduction of an analytical model for health system analysis and its application to two case-studies. Health, Culture and Society 2012:2(1)
13. Bhojani U, Thriveni BS, Devadasan R, Munegowda CM, Devadasan N, Kolsteren P, Criel B. Out-of-pocket healthcare payments on chronic conditions impoverish urban poor in Bangalore, India. BMC Public Health 2012; 12(990)
14. Bhojani U, Mishra A, Prashanth NS, Soors W (eds.) Bringing evidence into public health policy (EPHP) 2012: strengthening health systems to achieve universal health coverage. BMC Proceedings 2012;6(5)
15. Bhojani U, Prashanth NS, Venkataraman V, Devadasan N (eds.) Bringing evidence into public health policy (EPHP) 2010: five years of national rural health mission. BMC Proceedings 2012;6(1)
16. Bhojani U, Thriveni BS, Devadasan R, Munegowda CM, Amruthavalli, Devadasan N, Criel B, Kolsteren P. Challenges in organizing quality diabetes care for the urban poor: a local health system perspective. BMC Proceedings 2012;6(5):O13
17. Thriveni BS, Bhojani U, Mishra A, Amruthavalli, Devadasan R, Munegowda CM. Health system challenges in delivering maternal
health care: evidence from a poor urban neighbourhood in south India. BMC Proceedings 2012;6(5):P13
18. Bhojani U, Elias MA, Devadasan N. Adolescents’ perceptions about smoker in Karnataka, India. BMC Public Health 2011;11:563
19. Bhojani U, Venkataraman V, Manganawar B. Public policies and the tobacco industry. Economic and Political Weekly 2011;XLVI(28):27-30
20. Bhojani U, Prashanth NS, Devadasan N. A critique of the draft national health research policy 2011. Economic and Political Weekly 2011;XLVI(15):19-22
21. Prashanth NS, Bhojani U, Soors W. Health systems research and the Gadchiroli debate: a plea for universal and equitable ethics. Indian Journal of Medical Ethics 2011;8(1):47-48
22. Bhojani U, Thriveni BS, Devadasan R, Munegowda MS, Anthonyamma C, Soors W, Devadasan N, Criel B, Kolsteren P. Health system obstacles in the delivery of quality care to people with chronic diseases (PWCD): a case study from urban India. Tropical Medicine and International Health 2011;16(1):346
23. Thriveni BS, Bhojani U, Amruthavalli, Devadasan R, Munegowda CM, Anthonyamma C, Devadasan N. Controlled lives: impact of social factors on reproductive rights of women in urban India. Tropical Medicine and International Health 2011;16(1):299
24. Bhojani U, Chander SJ, Devadasan N. Tobacco use and related factors among preuniversity students in a college in Bangalore, India. National Medical Journal of India 2009;22(6):294-297
25. Bhojani U, Devadasan N. What to do with the Epidemic of Diabetes – a Health Systems Response. Christian Medical Journal of India 2008;23(3-4):26-28
Books/
Monographs 1. Bhojani U. Youth and tobacco use: a monograph on perceptions, practices
& policies. Bangalore: Institute of Public Health; 2013
Blogs/Magazine/News
papers
1. Prashanth NS, Bhojani U. Modi-fying India’s health: health in the times of India’s new prime minister. International Health Policies; 2015
2. Jithendra A, Bhojani U. How the tobacco industry wins friends and influences policy. Newslaundry; 2015
3. Arora R, Bhojani U. The semantics of commitment. International Health Policies; 2015
4. Hebbar P, Bhojani U, Rao V. Television as a public awareness tool to reduce tobacco use in India. eSocialSciences; 2013
5. Bhojani U. Killing interference. The Week; 2012 6. Bhojani U. A night at the labor ward. From the Field – Institute of Public
Health; 2011 7. Venkataraman V, Bhojani U. India: code of conduct on dealings with
tobacco industry. News Analysis – Tobacco Control; 2011 8. Bhojani U. When a picture paints a 1,000 words. Deccan Chronicle; 2011
Conference presentations
1. Rao N, Bhojani U, Shekar P, Daddi S. Conflicts of interest in tobaccocontrol in India - an exploratory study - oral presentation at the WorldConference on Tobacco OR Health, 17-21 March 2015, Abu Dhabi.
2. Hebbar P, Bhojani U. Local partnerships for global challenges:Lessons from local intersectoral work for tobacco control. Oralpresentation at the 3rd Global Symposium on Health Systems Research,29th Sept - 3 Oct 2014, Cape Town.
3. Bhojani U. Learning from success stories in states of India. Oralpresentation at the 3rd National Conference on Tobacco OR Health,15-16 December 2014, Mumbai-India.
4. Hebbar P, Bhojani U, Kennedy J, Rao V. From Policy to Practice:Insights from Karnataka about Implementation of Tobacco ControlLaw. Oral presentation at the 3rd National Conference on Tobacco ORHealth,15-16 December 2014, Mumbai-India.
5. Bhojani U, Hebbar P, Rao V, Shah V. Role of Litigation in TobaccoControl: Lessons from Past. Poster presentation at the 3rd NationalConference on Tobacco OR Health,15-16 December 2014, Mumbai-India.
6. Bhojani U, Soors W. Tobacco control in India: a case for Health-in-Allpolicies. Poster presentation at the 3rd National Conference on TobaccoOR Health,15-16 December 2014, Mumbai-India.
7. Bhojani U. Public interest litigation for tobacco control in India. Oralpresentation at the international seminar on Legal strategies forimplementing tobacco control laws, 21-28 December, Washington DC.
8. Bhojani U. Using laws to stop government involvement in tobaccoindustry events. Oral presentation at the 15th World Conference onTobacco OR Health, 20-24 March 2012, Singapore.
9. Bhojani U, Ellias MA, Devadasan N. She is not an Indian culturedwoman": Youth perceptions about smokers in South India. Posterpresentation at the 15th World Conference on Tobacco OR Health, 20-24 March 2012, Singapore.
10. Bhojani U, Venkataraman V, Kothari J, Manganawar B, Basha R.Challenging the conflict of interest for tobacco control: Advocacylessons from India. Poster presentation at the 15th World Conference onTobacco OR Health, 20-24 March 2012, Singapore.
11. Thriveni BS, Bhojani U, Devadasan R, Nagarathna, Leelavathi,Josephine. Understanding factors at household level affecting access todiabetes care: Study from urban south India. Poster presentation at theGeneva Health Forum, 18-20 April 2012, Geneva, Switzerland.
12. Bhojani U. Role of civil society in tobacco control – Invitedpresentation at State level consultation on ban on tobaccoadvertisement, promotion and sponsorships. July 5, 2013, BangaloreIndia.
13. Bhojani U, Thriveni BS, Devadasan R, Munegowda CM,Anthoniyamma C, Soors W, Devadasan N, Criel B, Kolsteren P. Healthsystem obstacles in the delivery of quality care to People With ChronicDiseases (PWCD): a case study from urban India - Poster presented atthe 7th European Congress on Tropical Medicine and International
Health, 3-6 October, Barcelona, Spain. 14. Thriveni BS, Bhojani U, Amruthavalli S, Munegowda CM,
Anthoniyamma C, Devadasan R, Devadasan N. Controlled lives: Impact of social factors on reproductive rights of women in urban South India - Poster presented at the 7th European Congress on Tropical Medicine and International Health, 3-6 October, Barcelona, Spain.
15. Bhojani UM, Prashanth NS, Devadasan N. Under reported deaths and inflated deliveries: making sense of health management information systems in India, - paper presented at the International Conference on Health Systems Strengthening, 6-10 May 2010, Chennai, India.
16. Bhojani UM, Madhav G, State Mentoring Monitoring Group Karnataka (Narayan T, Sudarshan H, Premadas E, Basavaraju E, Prabha N, Saligram P, Oblesha KB, Karpagam S) Community-based planning & monitoring of public health services: Lessons from the South-Indian state of Karnataka, - Poster presented at International Conference on Health Systems Strengthening, 6-10 May 2010, Chennai, India
17. Kavya R, Bhojani U, Prashanth NS, Devadasan N. Capacity building programme for district health team, - Poster presented at International Conference on Health Systems Strengthening, 6-10 May 2010, Chennai, India
18. Bhojani U. Using Evidence to inform policy making and implementation: A case of tobacco control in Karnataka – Poster presented at 8th Winter Symposium on ‘Evidence Informed Healthcare’, 11-14 January 2010, Vellore, India
19. Bhojani U, Devadasan N. Community-based Monitoring in Health: Lessons from practice – Paper presented at the 21st Annual Conference of Karnataka Association of Community Health, 10-11 October 2009, Mysore, India
20. Seshadri T, Prashanth NS, Bhojani U, Devadasan N. Capacity building programme for district health team – Poster presented at the 21st Annual Conference of Karnataka Association of Community Health, 10-11 October 2009, Mysore, India
21. Bhojani U, Chander SJ, Devadasan N. Tobacco use and related factors among south Indian metropolis – Poster presented at 14th World Conference on Tobacco Or Health, 9-12 March 2009, Mumbai, India
Workshops/Courses 1. New Models of Post-graduate Public Health Education, 18-23 May
2015, Cape Town. 2. 2nd National Workshop on Implementation of FCTC Article 5.3 –
Stopping Tobacco Industry Interference in Tobacco Control, 22-24 April 2015, Kolkata.
3. International seminar on Legal strategies for implementing tobacco control laws organized by the International Legal Consortium, 21-28 December 2014, Washington DC.
4. National Workshop on Implementation of FCTC Article 5.3 – Stopping Tobacco Industry Interference in Tobacco Control, 12-14 August 2013, Jaipur.
5. International Tobacco Control Leadership Program at John HopkinsSchool of Public Health, Baltimore, July 2010.
6. Theory-driven inquiry for health systems research: Lessons fromexperience, Institute of Tropical Medicine at Antwerp, Belgium, 22-23November 2010
7. Workshop on pack warnings for tobacco products in India, at NewDelhi India, 26-27 August 2009
8. Workshop on Socio Economic Impact of Diabetes and itsComplications, at Chennai India, 12 September 2009
9. Global Youth Meet on Tobacco Control (GYM), at Mumbai India, 6-7March 2009
10. South Asia Course on Equity and Health Rights, at Jaipur India, 15-21March 2008
Awards/Scholarships
1. Scholarship from Directorate General of Development Cooperation(Belgium) – Institute of Tropical Medicine, Antwerp for doctoralstudies, 2010-2014.
2. Institute for Social and Economic Change – Sir Ratan Tata Trustvisiting fellowship for short research, 2008 –2009.
3. Best Resource Person Award by Voluntary Health Association Jammu& Kashmir.
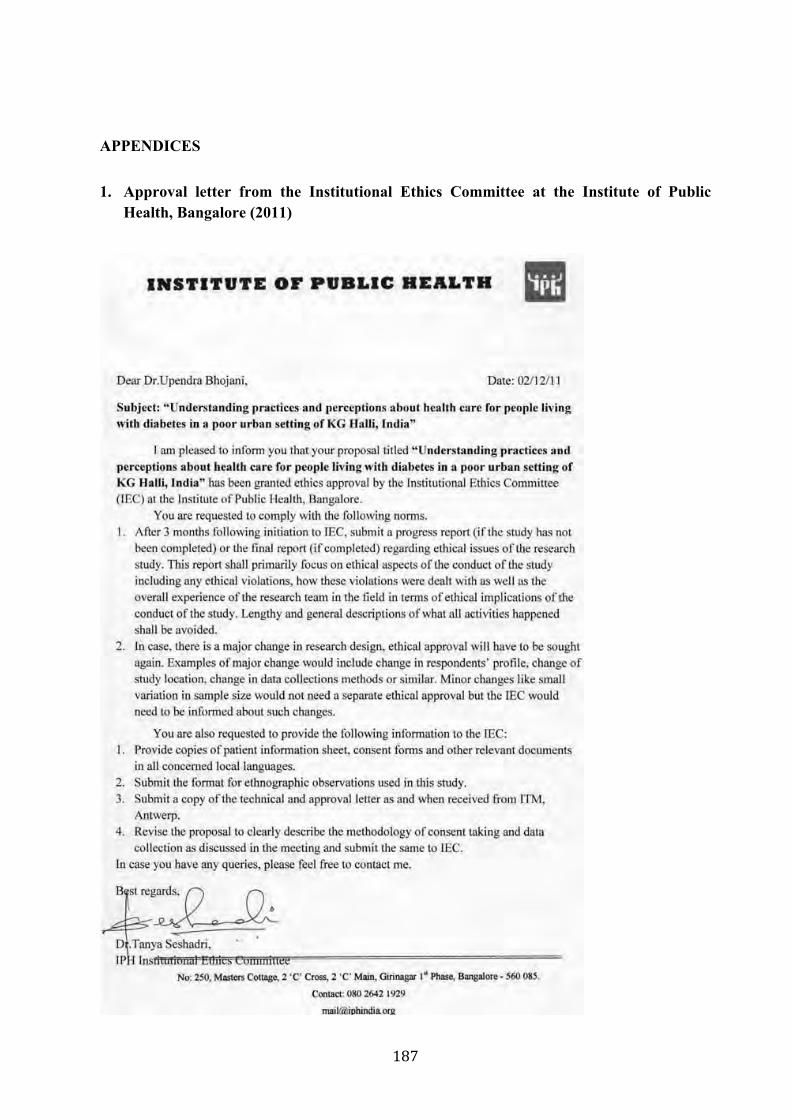
APPENDICES
1. Approval letter from the Institutional Ethics Committee at the Institute of Public Health, Bangalore (2011)
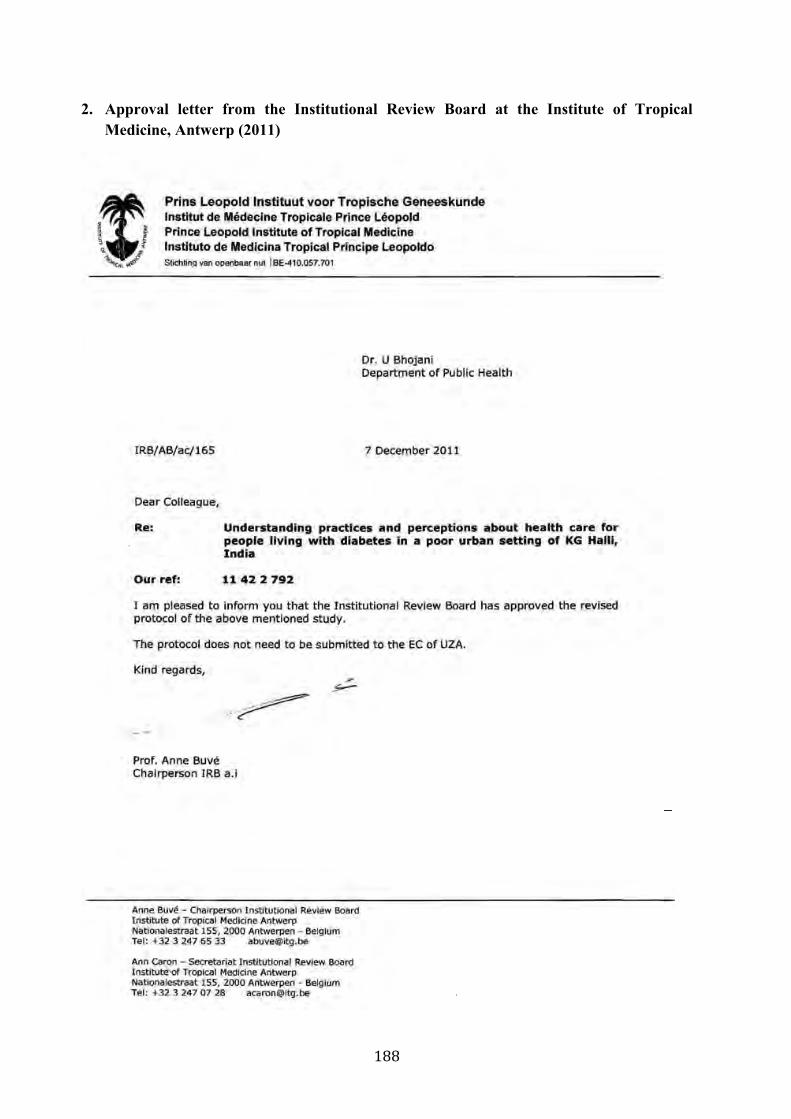
2. Approval letter from the Institutional Review Board at the Institute of TropicalMedicine, Antwerp (2011)
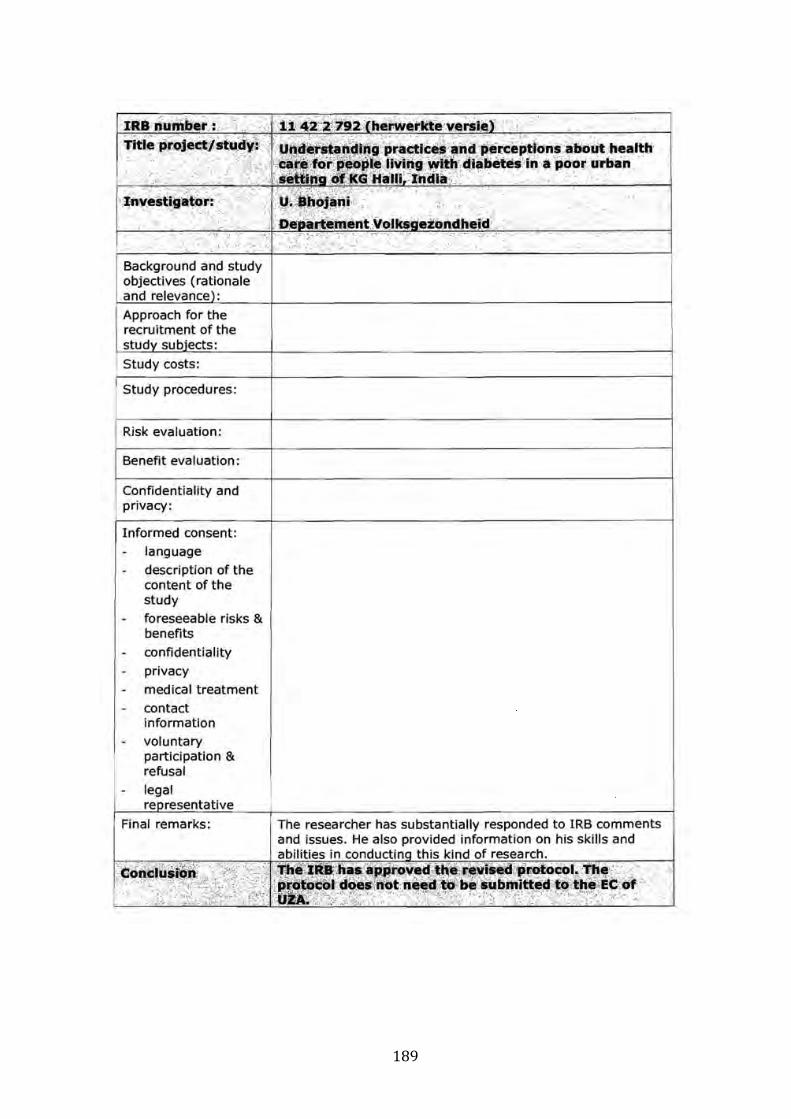
3. Approval letter from the Institutional Ethics Committee at the Institute of Public Health, Bangalore (2013)
============================================================== No: 250, Masters Cottage, 2 ‘C’ Cross, 2 ‘C’ Main, Girinagar 1st Phase, Bengaluru - 560 085.
Contact: 080 2642 1929
II N S T I T U T E O F P U B L I C H E A L T H
4. Approval letter from the Institutional Review Board at the Institute of Tropical Medicine, Antwerp (2013)

5. Approval letter from the Ethics Committee at the University of Antwerp (2013)
6. The rising burden of chronic conditions among urban poor: a three-year follow-upsurvey in Bengaluru, India – a paper published in the BMC Health Service Research
RESEARCH ARTICLE Open Access
The rising burden of chronic conditionsamong urban poor: a three-year follow-upsurvey in Bengaluru, IndiaMrunalini J Gowda1*, Upendra Bhojani1,2, Narayanan Devadasan1 and Thriveni S Beerenahally1
Abstract
Background: Chronic conditions are on rise globally and in India. Prevailing intra-urban inequities in access tohealthcare services compounds the problems faced by urban poor. This paper reports the trends in self-reportedprevalence of chronic conditions and health-seeking pattern among residents of a poor urban neighborhood insouth India.
Methods: A cross sectional survey of 1099 households (5340 individuals) was conducted using a structuredquestionnaire. The prevalence and health-seeking pattern for chronic conditions in general and for hypertensionand diabetes in particular were assessed and compared with a survey conducted in the same community threeyears ago. The predictors of prevalence and health-seeking pattern were analyzed through a multivariable logisticregression analysis.
Results: The overall self-reported prevalence of chronic conditions was 12 %, with hypertension (7 %) and diabetes(5.8 %) being the common conditions. The self-reported prevalence of chronic conditions increased by 3.8percentage point over a period of three years (OR: 1.5). Older people, women and people living below the povertyline had greater odds of having chronic conditions across the two studies compared. Majority of patients (89.3 %)sought care from private health facilities indicating a decrease by 8.7 percentage points in use of governmenthealth facility compared to the earlier study (OR: 0.5). Patients seeking care from super specialty hospitals and thoseliving below the poverty line were more likely to seek care from government health facilities.
Conclusion: There is need to strengthen health services with a preferential focus on government services to assureaffordable care for chronic conditions to urban poor.
BackgroundGlobally 36 million people died in 2008 due to non-communicable diseases, one of the major contributors tochronic conditions [1]. Nearly 80 % of these deaths oc-curred in low- and middle-income countries [1]. Theprevalence of chronic conditions is on the rise globallyas well as in India. In 2014, 60 % of all the deaths inIndia were due to non-communicable diseases and theburden is estimated to increase over the time [2–4].Urbanization is linked with greater risk for and burden ofmajor chronic conditions. While India is urbanizing at arapid pace, there is a huge intra-urban inequity with urban
poor having poorer access to basic amenities and poorerhealth indicators compared to the affluent urbanites [5].The recent studies reveal high prevalence of chronic
conditions among urban poor in India [6–9]. While itremains contentious whether, in a strict epidemiologicalsense, the poor in India suffer greater burden fromchronic conditions compared to rich, there seems to beconsensus that they form a highly vulnerable group thatneeds urgent attention in terms of care and control ofchronic conditions [10–20]. In this context, it is crucialto monitor trends in prevalence and health-seeking forchronic conditions among urban poor.As part of the community-based action research pro-
ject, we had conducted a census in a poor urban neigh-borhood in Bengaluru (India) in 2009–2010. That studyrevealed a high burden of chronic conditions among
* Correspondence: [email protected] of Public Health, 250, 2nd C Main, Girinagar 1st Phase, Bengaluru560085, IndiaFull list of author information is available at the end of the article
© 2015 Gowda et al. Open Access This article is distributed under the terms of the Creative Commons Attribution 4.0International License (http://creativecommons.org/licenses/by/4.0/), which permits unrestricted use, distribution, andreproduction in any medium, provided you give appropriate credit to the original author(s) and the source, provide alink to the Creative Commons license, and indicate if changes were made. The Creative Commons Public DomainDedication waiver (http://creativecommons.org/publicdomain/zero/1.0/) applies to the data made available in thisarticle, unless otherwise stated.
Gowda et al. BMC Health Services Research (2015) 15:330 DOI 10.1186/s12913-015-0999-5
residents [7]. Subsequently, The Urban Health ActionResearch Project trained three community health assis-tants from the same community to strengthen the exist-ing health systems and also create awareness about thechronic conditions and its management. We conducteda follow-up survey after three years in the same popula-tion. This paper reports findings from the follow-up sur-vey, and compares it with the earlier study to developtrends in prevalence and health-seeking behavior amongresidents over the time.
MethodsStudy settingKG Halli is the field site of the Urban Health Action Re-search Project (UHARP) being implemented by the In-stitute of Public Health in Kadugondanahalli (KG Halli)since 2009. KG Halli was purposefully selected for theUHARP to study how access to quality healthcare couldbe improved in a poor urban community with a pluralis-tic healthcare system. A cross sectional survey was con-ducted to understand self reported illness and healthseeking profile. The residents as well as healthcare pro-viders in KG Halli have identified unaffordable health-care expenses as one of the major issues in the area [21].The institutional ethics committee from Institute ofPublic Health, Bengaluru, India approved this study.KG Halli is one of the 198 administrative units of
Bangalore, a metropolitan capital of Karnataka. KG Hallihas a population of over 44,500 individuals in an area ofless than a square kilometer. KG Halli has two recog-nized slums and comprises of people from Karnataka aswell as migrants from other Indian states. Majority of thepopulation in the community are daily wageworkers. KGHalli has a mixed healthcare system with two governmentfacilities run by municipal and state government andaround 32 private healthcare facilities. Services offered bygovernment facilities are heavily subsidized and, inprinciple, free for people living below the poverty line. Pri-vate facilities that include many single-doctor clinics andfour hospitals work on fee-for-service basis.
Sample sizeConsidering the 8.6 % of overall prevalence of self-reported chronic condition as found in the earlier studyin KG Halli [7], 95 % confidence interval and 1 % of pre-cision, we estimated the minimum sample size neededfor our survey to be 3286 individuals. We added another50 % of this number in order to cover for non-response.A few factors made us to account for high non-responserate.The population of KG Halli comprises largely of mi-
grants who often keep shifting their residence. In thecourse of our project activities and the earlier survey, wewould find many households empty or closed for long
time. Also the community in the area is weary of partici-pating in surveys – as they often are approached by vari-ous agencies dealing with marketing of commercialproducts and/or as part of welfare projects/schemes.Majority of adults in the community are daily-wageworkers who are often not at home during the day.There are many nuclear families where all the adultsmight be at work and so it’s likely that such householdswill not have an adult respondent at home when datacollectors approached the houses. Considering the aver-age household size of 4.7, we aimed to survey a mini-mum of 1047 households in KG Halli.
Data collection and measurementsAs part of the UHARP project, a baseline census wasconducted in 2009–2010 to understand the socio-demographics and health related aspects of the commu-nity. We conducted a follow-up survey in 2012–2013 inKG Halli to monitor changes in socio-demography,prevalence of self-reported illness, health-seeking andhealthcare expenditure. The baseline survey revealed ahigh prevalence of self reported chronic conditions, es-pecially that of diabetes and hypertension. These pa-tients were incurring high out of pocket expenses fromthese conditions [7]. As part of the action research pro-ject varied strategies were employed, three communityhealth assistants were identified from the same commu-nity and were trained for over a period of one year. Thecommunity health assistants started conducting regularhouse-to-house visits creating awareness on chronicconditions in general and for diabetes and hypertensionin particular. They directed them to appropriate health-care services in the area. Periodic meetings with health-care providers in the area were conducted to discusshealth issues of the population identified form the baselinesurvey and also provide local solutions for the same. Inthis paper we selectively analyze these parameters in refer-ence to chronic conditions. Community health workerscollected data at household level using a structured ques-tionnaire. They administered a questionnaire to availableand willing family member aged 18 years or above. Theyselected every tenth family in a sequential order, startingfrom the Vinobhanagar area, a southern end of KG Halli.In case of refusal or unavailability of eligible respondent,the immediate next household replaced the household.The data collectors took informed verbal consent fromthe participants before administering the questionnaire.The completed questionnaires were verified and revisits tosurveyed households were made on the following day forany corrections or missing data. The research team veri-fied 10 % of the questionnaires from the survey. Themethods for the survey including the tool for data collec-tion were similar to those used for the baseline census.While we briefly outline methods used for this survey,
Gowda et al. BMC Health Services Research (2015) 15:330 Page 2 of 8
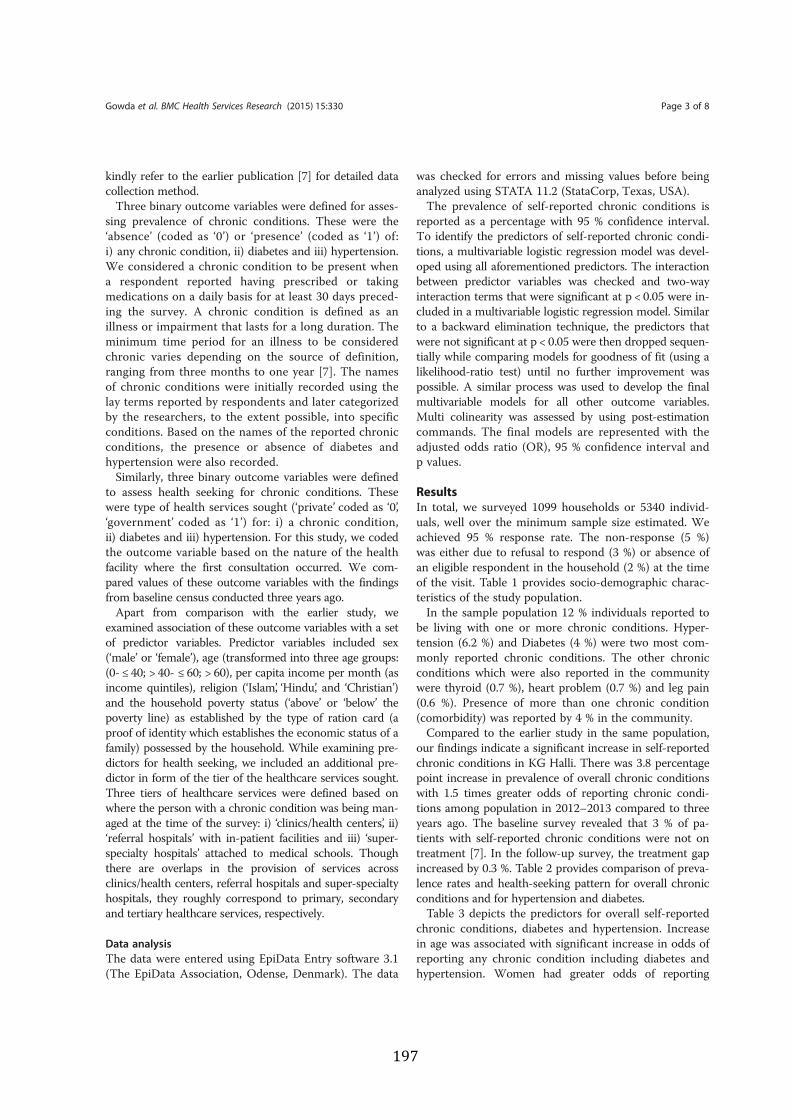
kindly refer to the earlier publication [7] for detailed datacollection method.Three binary outcome variables were defined for asses-
sing prevalence of chronic conditions. These were the‘absence’ (coded as ‘0’) or ‘presence’ (coded as ‘1’) of:i) any chronic condition, ii) diabetes and iii) hypertension.We considered a chronic condition to be present whena respondent reported having prescribed or takingmedications on a daily basis for at least 30 days preced-ing the survey. A chronic condition is defined as anillness or impairment that lasts for a long duration. Theminimum time period for an illness to be consideredchronic varies depending on the source of definition,ranging from three months to one year [7]. The namesof chronic conditions were initially recorded using thelay terms reported by respondents and later categorizedby the researchers, to the extent possible, into specificconditions. Based on the names of the reported chronicconditions, the presence or absence of diabetes andhypertension were also recorded.Similarly, three binary outcome variables were defined
to assess health seeking for chronic conditions. Thesewere type of health services sought (‘private’ coded as ‘0’,‘government’ coded as ‘1’) for: i) a chronic condition,ii) diabetes and iii) hypertension. For this study, we codedthe outcome variable based on the nature of the healthfacility where the first consultation occurred. We com-pared values of these outcome variables with the findingsfrom baseline census conducted three years ago.Apart from comparison with the earlier study, we
examined association of these outcome variables with a setof predictor variables. Predictor variables included sex(‘male’ or ‘female’), age (transformed into three age groups:(0- ≤ 40; > 40- ≤ 60; > 60), per capita income per month (asincome quintiles), religion (‘Islam’, ‘Hindu’, and ‘Christian’)and the household poverty status (‘above’ or ‘below’ thepoverty line) as established by the type of ration card (aproof of identity which establishes the economic status of afamily) possessed by the household. While examining pre-dictors for health seeking, we included an additional pre-dictor in form of the tier of the healthcare services sought.Three tiers of healthcare services were defined based onwhere the person with a chronic condition was being man-aged at the time of the survey: i) ‘clinics/health centers’, ii)‘referral hospitals’ with in-patient facilities and iii) ‘super-specialty hospitals’ attached to medical schools. Thoughthere are overlaps in the provision of services acrossclinics/health centers, referral hospitals and super-specialtyhospitals, they roughly correspond to primary, secondaryand tertiary healthcare services, respectively.
Data analysisThe data were entered using EpiData Entry software 3.1(The EpiData Association, Odense, Denmark). The data
was checked for errors and missing values before beinganalyzed using STATA 11.2 (StataCorp, Texas, USA).The prevalence of self-reported chronic conditions is
reported as a percentage with 95 % confidence interval.To identify the predictors of self-reported chronic condi-tions, a multivariable logistic regression model was devel-oped using all aforementioned predictors. The interactionbetween predictor variables was checked and two-wayinteraction terms that were significant at p < 0.05 were in-cluded in a multivariable logistic regression model. Similarto a backward elimination technique, the predictors thatwere not significant at p < 0.05 were then dropped sequen-tially while comparing models for goodness of fit (using alikelihood-ratio test) until no further improvement waspossible. A similar process was used to develop the finalmultivariable models for all other outcome variables.Multi colinearity was assessed by using post-estimationcommands. The final models are represented with theadjusted odds ratio (OR), 95 % confidence interval andp values.
ResultsIn total, we surveyed 1099 households or 5340 individ-uals, well over the minimum sample size estimated. Weachieved 95 % response rate. The non-response (5 %)was either due to refusal to respond (3 %) or absence ofan eligible respondent in the household (2 %) at the timeof the visit. Table 1 provides socio-demographic charac-teristics of the study population.In the sample population 12 % individuals reported to
be living with one or more chronic conditions. Hyper-tension (6.2 %) and Diabetes (4 %) were two most com-monly reported chronic conditions. The other chronicconditions which were also reported in the communitywere thyroid (0.7 %), heart problem (0.7 %) and leg pain(0.6 %). Presence of more than one chronic condition(comorbidity) was reported by 4 % in the community.Compared to the earlier study in the same population,
our findings indicate a significant increase in self-reportedchronic conditions in KG Halli. There was 3.8 percentagepoint increase in prevalence of overall chronic conditionswith 1.5 times greater odds of reporting chronic condi-tions among population in 2012–2013 compared to threeyears ago. The baseline survey revealed that 3 % of pa-tients with self-reported chronic conditions were not ontreatment [7]. In the follow-up survey, the treatment gapincreased by 0.3 %. Table 2 provides comparison of preva-lence rates and health-seeking pattern for overall chronicconditions and for hypertension and diabetes.Table 3 depicts the predictors for overall self-reported
chronic conditions, diabetes and hypertension. Increasein age was associated with significant increase in odds ofreporting any chronic condition including diabetes andhypertension. Women had greater odds of reporting
Gowda et al. BMC Health Services Research (2015) 15:330 Page 3 of 8
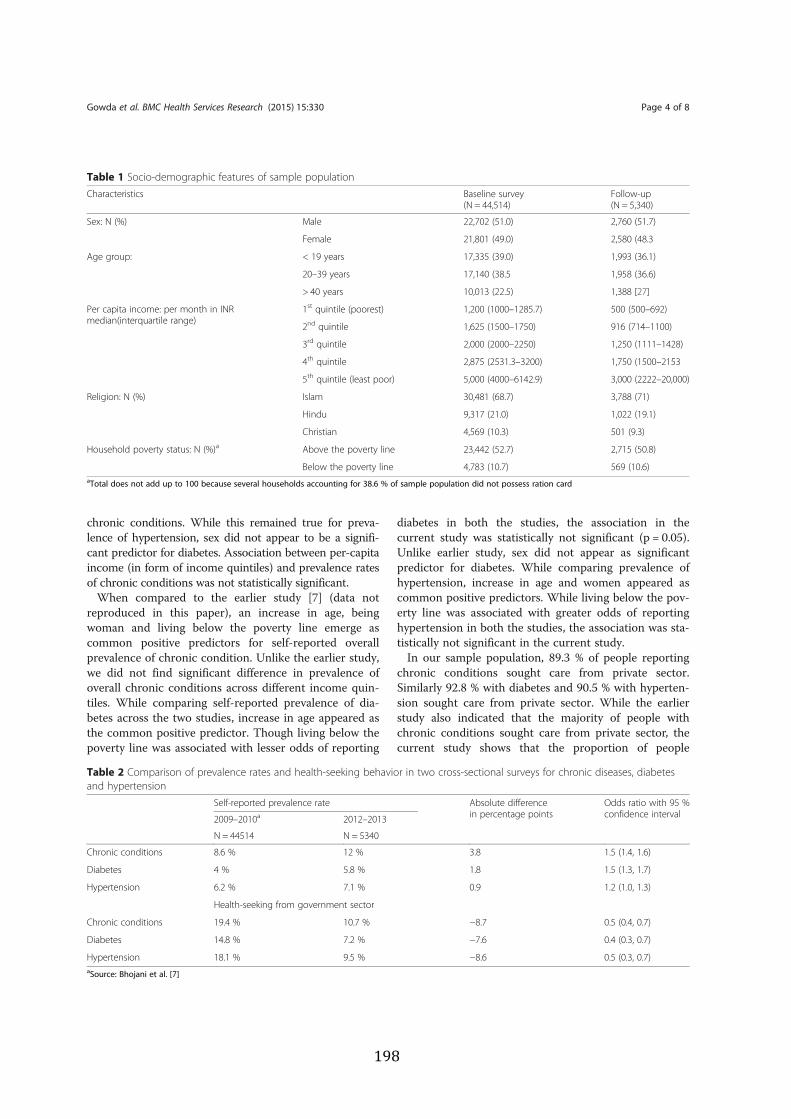
chronic conditions. While this remained true for preva-lence of hypertension, sex did not appear to be a signifi-cant predictor for diabetes. Association between per-capitaincome (in form of income quintiles) and prevalence ratesof chronic conditions was not statistically significant.When compared to the earlier study [7] (data not
reproduced in this paper), an increase in age, beingwoman and living below the poverty line emerge ascommon positive predictors for self-reported overallprevalence of chronic condition. Unlike the earlier study,we did not find significant difference in prevalence ofoverall chronic conditions across different income quin-tiles. While comparing self-reported prevalence of dia-betes across the two studies, increase in age appeared asthe common positive predictor. Though living below thepoverty line was associated with lesser odds of reporting
diabetes in both the studies, the association in thecurrent study was statistically not significant (p = 0.05).Unlike earlier study, sex did not appear as significantpredictor for diabetes. While comparing prevalence ofhypertension, increase in age and women appeared ascommon positive predictors. While living below the pov-erty line was associated with greater odds of reportinghypertension in both the studies, the association was sta-tistically not significant in the current study.In our sample population, 89.3 % of people reporting
chronic conditions sought care from private sector.Similarly 92.8 % with diabetes and 90.5 % with hyperten-sion sought care from private sector. While the earlierstudy also indicated that the majority of people withchronic conditions sought care from private sector, thecurrent study shows that the proportion of people
Table 1 Socio-demographic features of sample populationCharacteristics Baseline survey
(N = 44,514)Follow-up(N = 5,340)
Sex: N (%) Male 22,702 (51.0) 2,760 (51.7)
Female 21,801 (49.0) 2,580 (48.3
Age group: < 19 years 17,335 (39.0) 1,993 (36.1)
20–39 years 17,140 (38.5 1,958 (36.6)
> 40 years 10,013 (22.5) 1,388 [27]
Per capita income: per month in INRmedian(interquartile range)
1st quintile (poorest) 1,200 (1000–1285.7) 500 (500–692)
2nd quintile 1,625 (1500–1750) 916 (714–1100)
3rd quintile 2,000 (2000–2250) 1,250 (1111–1428)
4th quintile 2,875 (2531.3–3200) 1,750 (1500–2153
5th quintile (least poor) 5,000 (4000–6142.9) 3,000 (2222–20,000)
Religion: N (%) Islam 30,481 (68.7) 3,788 (71)
Hindu 9,317 (21.0) 1,022 (19.1)
Christian 4,569 (10.3) 501 (9.3)
Household poverty status: N (%)a Above the poverty line 23,442 (52.7) 2,715 (50.8)
Below the poverty line 4,783 (10.7) 569 (10.6)aTotal does not add up to 100 because several households accounting for 38.6 % of sample population did not possess ration card
Table 2 Comparison of prevalence rates and health-seeking behavior in two cross-sectional surveys for chronic diseases, diabetesand hypertension
Self-reported prevalence rate Absolute differencein percentage points
Odds ratio with 95 %confidence interval2009–2010a 2012–2013
N = 44514 N = 5340
Chronic conditions 8.6 % 12 % 3.8 1.5 (1.4, 1.6)
Diabetes 4 % 5.8 % 1.8 1.5 (1.3, 1.7)
Hypertension 6.2 % 7.1 % 0.9 1.2 (1.0, 1.3)
Health-seeking from government sector
Chronic conditions 19.4 % 10.7 % −8.7 0.5 (0.4, 0.7)
Diabetes 14.8 % 7.2 % −7.6 0.4 (0.3, 0.7)
Hypertension 18.1 % 9.5 % −8.6 0.5 (0.3, 0.7)aSource: Bhojani et al. [7]
Gowda et al. BMC Health Services Research (2015) 15:330 Page 4 of 8
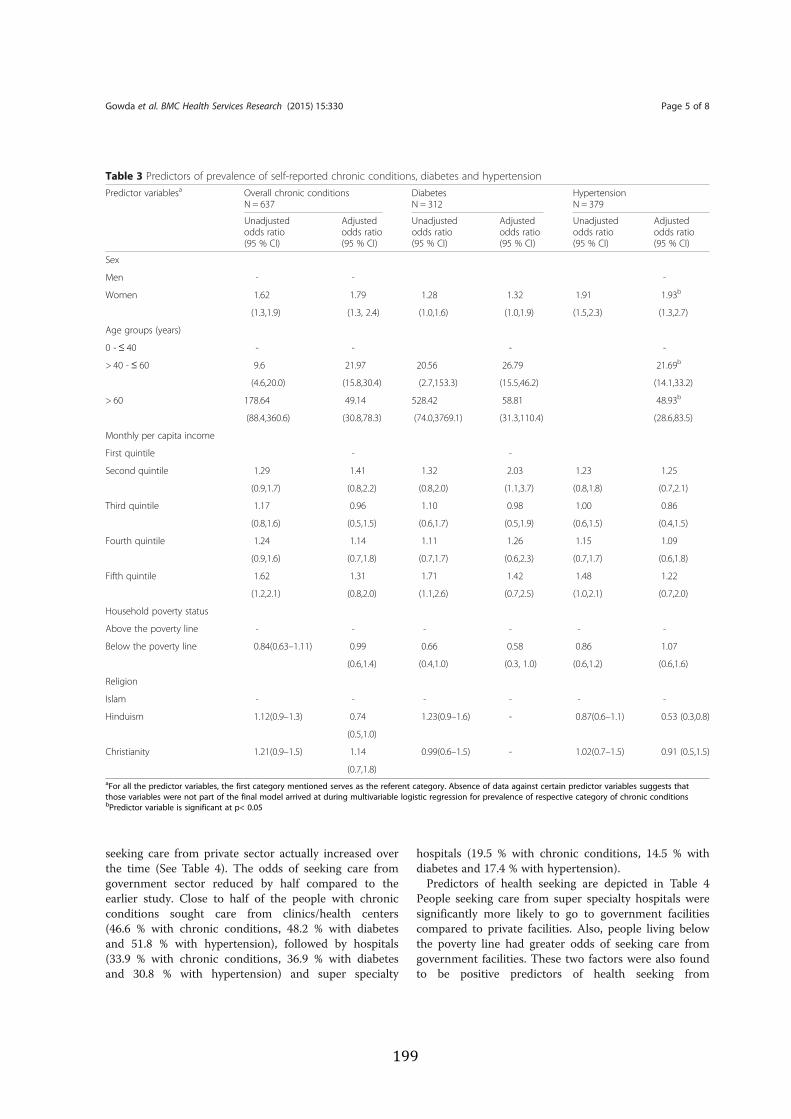
seeking care from private sector actually increased overthe time (See Table 4). The odds of seeking care fromgovernment sector reduced by half compared to theearlier study. Close to half of the people with chronicconditions sought care from clinics/health centers(46.6 % with chronic conditions, 48.2 % with diabetesand 51.8 % with hypertension), followed by hospitals(33.9 % with chronic conditions, 36.9 % with diabetesand 30.8 % with hypertension) and super specialty
hospitals (19.5 % with chronic conditions, 14.5 % withdiabetes and 17.4 % with hypertension).Predictors of health seeking are depicted in Table 4
People seeking care from super specialty hospitals weresignificantly more likely to go to government facilitiescompared to private facilities. Also, people living belowthe poverty line had greater odds of seeking care fromgovernment facilities. These two factors were also foundto be positive predictors of health seeking from
Table 3 Predictors of prevalence of self-reported chronic conditions, diabetes and hypertensionPredictor variablesa Overall chronic conditions
N = 637DiabetesN = 312
HypertensionN = 379
Unadjustedodds ratio(95 % CI)
Adjustedodds ratio(95 % CI)
Unadjustedodds ratio(95 % CI)
Adjustedodds ratio(95 % CI)
Unadjustedodds ratio(95 % CI)
Adjustedodds ratio(95 % CI)
Sex
Men - - -
Women 1.62 1.79 1.28 1.32 1.91 1.93b
(1.3,1.9) (1.3, 2.4) (1.0,1.6) (1.0,1.9) (1.5,2.3) (1.3,2.7)
Age groups (years)
0 - ≤ 40 - - - -
> 40 - ≤ 60 9.6 21.97 20.56 26.79 21.69b
(4.6,20.0) (15.8,30.4) (2.7,153.3) (15.5,46.2) (14.1,33.2)
> 60 178.64 49.14 528.42 58.81 48.93b
(88.4,360.6) (30.8,78.3) (74.0,3769.1) (31.3,110.4) (28.6,83.5)
Monthly per capita income
First quintile - -
Second quintile 1.29 1.41 1.32 2.03 1.23 1.25
(0.9,1.7) (0.8,2.2) (0.8,2.0) (1.1,3.7) (0.8,1.8) (0.7,2.1)
Third quintile 1.17 0.96 1.10 0.98 1.00 0.86
(0.8,1.6) (0.5,1.5) (0.6,1.7) (0.5,1.9) (0.6,1.5) (0.4,1.5)
Fourth quintile 1.24 1.14 1.11 1.26 1.15 1.09
(0.9,1.6) (0.7,1.8) (0.7,1.7) (0.6,2.3) (0.7,1.7) (0.6,1.8)
Fifth quintile 1.62 1.31 1.71 1.42 1.48 1.22
(1.2,2.1) (0.8,2.0) (1.1,2.6) (0.7,2.5) (1.0,2.1) (0.7,2.0)
Household poverty status
Above the poverty line - - - - - -
Below the poverty line 0.84(0.63–1.11) 0.99 0.66 0.58 0.86 1.07
(0.6,1.4) (0.4,1.0) (0.3, 1.0) (0.6,1.2) (0.6,1.6)
Religion
Islam - - - - - -
Hinduism 1.12(0.9–1.3) 0.74 1.23(0.9–1.6) - 0.87(0.6–1.1) 0.53 (0.3,0.8)
(0.5,1.0)
Christianity 1.21(0.9–1.5) 1.14 0.99(0.6–1.5) - 1.02(0.7–1.5) 0.91 (0.5,1.5)
(0.7,1.8)aFor all the predictor variables, the first category mentioned serves as the referent category. Absence of data against certain predictor variables suggests thatthose variables were not part of the final model arrived at during multivariable logistic regression for prevalence of respective category of chronic conditionsbPredictor variable is significant at p< 0.05
Gowda et al. BMC Health Services Research (2015) 15:330 Page 5 of 8
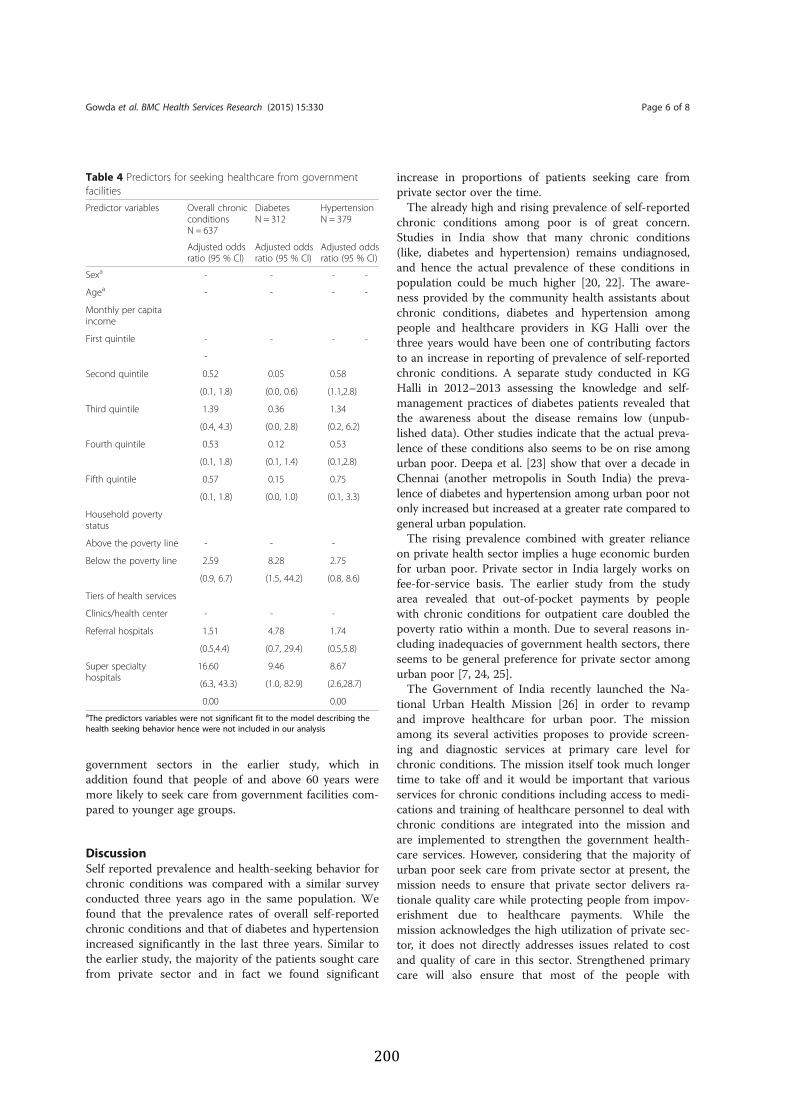
government sectors in the earlier study, which inaddition found that people of and above 60 years weremore likely to seek care from government facilities com-pared to younger age groups.
DiscussionSelf reported prevalence and health-seeking behavior forchronic conditions was compared with a similar surveyconducted three years ago in the same population. Wefound that the prevalence rates of overall self-reportedchronic conditions and that of diabetes and hypertensionincreased significantly in the last three years. Similar tothe earlier study, the majority of the patients sought carefrom private sector and in fact we found significant
increase in proportions of patients seeking care fromprivate sector over the time.The already high and rising prevalence of self-reported
chronic conditions among poor is of great concern.Studies in India show that many chronic conditions(like, diabetes and hypertension) remains undiagnosed,and hence the actual prevalence of these conditions inpopulation could be much higher [20, 22]. The aware-ness provided by the community health assistants aboutchronic conditions, diabetes and hypertension amongpeople and healthcare providers in KG Halli over thethree years would have been one of contributing factorsto an increase in reporting of prevalence of self-reportedchronic conditions. A separate study conducted in KGHalli in 2012–2013 assessing the knowledge and self-management practices of diabetes patients revealed thatthe awareness about the disease remains low (unpub-lished data). Other studies indicate that the actual preva-lence of these conditions also seems to be on rise amongurban poor. Deepa et al. [23] show that over a decade inChennai (another metropolis in South India) the preva-lence of diabetes and hypertension among urban poor notonly increased but increased at a greater rate compared togeneral urban population.The rising prevalence combined with greater reliance
on private health sector implies a huge economic burdenfor urban poor. Private sector in India largely works onfee-for-service basis. The earlier study from the studyarea revealed that out-of-pocket payments by peoplewith chronic conditions for outpatient care doubled thepoverty ratio within a month. Due to several reasons in-cluding inadequacies of government health sectors, thereseems to be general preference for private sector amongurban poor [7, 24, 25].The Government of India recently launched the Na-
tional Urban Health Mission [26] in order to revampand improve healthcare for urban poor. The missionamong its several activities proposes to provide screen-ing and diagnostic services at primary care level forchronic conditions. The mission itself took much longertime to take off and it would be important that variousservices for chronic conditions including access to medi-cations and training of healthcare personnel to deal withchronic conditions are integrated into the mission andare implemented to strengthen the government health-care services. However, considering that the majority ofurban poor seek care from private sector at present, themission needs to ensure that private sector delivers ra-tionale quality care while protecting people from impov-erishment due to healthcare payments. While themission acknowledges the high utilization of private sec-tor, it does not directly addresses issues related to costand quality of care in this sector. Strengthened primarycare will also ensure that most of the people with
Table 4 Predictors for seeking healthcare from governmentfacilitiesPredictor variables Overall chronic
conditionsN = 637
DiabetesN = 312
HypertensionN = 379
Adjusted oddsratio (95 % CI)
Adjusted oddsratio (95 % CI)
Adjusted oddsratio (95 % CI)
Sexa - - - -
Agea - - - -
Monthly per capitaincome
First quintile - - - -
-
Second quintile 0.52 0.05 0.58
(0.1, 1.8) (0.0, 0.6) (1.1,2.8)
Third quintile 1.39 0.36 1.34
(0.4, 4.3) (0.0, 2.8) (0.2, 6.2)
Fourth quintile 0.53 0.12 0.53
(0.1, 1.8) (0.1, 1.4) (0.1,2.8)
Fifth quintile 0.57 0.15 0.75
(0.1, 1.8) (0.0, 1.0) (0.1, 3.3)
Household povertystatus
Above the poverty line - - -
Below the poverty line 2.59 8.28 2.75
(0.9, 6.7) (1.5, 44.2) (0.8, 8.6)
Tiers of health services
Clinics/health center - - -
Referral hospitals 1.51 4.78 1.74
(0.5,4.4) (0.7, 29.4) (0.5,5.8)
Super specialtyhospitals
16.60 9.46 8.67
(6.3, 43.3) (1.0, 82.9) (2.6,28.7)
0.00 0.00aThe predictors variables were not significant fit to the model describing thehealth seeking behavior hence were not included in our analysis
Gowda et al. BMC Health Services Research (2015) 15:330 Page 6 of 8
chronic conditions are diagnosed and managed at thislevel avoiding burden on referral care facilities whilemaking care for chronic conditions closer, affordableand hopefully people-centered.Our study has some limitations. We assessed prevalence
of self-reported chronic conditions. While self-report ofmorbidity seems to be somewhat reliable and useful indi-cator, the prevalence rates would differ when assessedthrough self-report and bio-medical tests [16, 17]. As indi-cated earlier, the true prevalence of chronic conditions islikely to be greater than what we report in this study. Interms of health-seeking behavior, we asked people whichhealth facility they went to for seeking care. Based onownership we classified these facilities into governmentand private. Health seeking is a complex phenomenonand people often move from government to private sectorand vice versa. People often seek care from both thesectors for a single episode of care. For example, a personmight visit a government center and see a doctor there.He/she then might visit private laboratory or pharmacy toget diagnostic tests or medications respectively if that isnot available at that facility. What we capture in our studyis the facility where the primary consultation with doctorhappened. Finally, we compare the findings from a censusof the entire individual in KG Halli (n = 44154) with thatfrom a survey of a sample population (n = 5340). Whilewe surveyed adequate individuals in order to assess preva-lence of chronic conditions in the same population (SeeMethods), readers shall exercise caution while reading thecomparisons.
ConclusionsThere is a high prevalence of self-reported chronic con-ditions among residents of a poor urban neighborhoodin Bengaluru city. The majority of people with chronicconditions seek care from private sector. Both the preva-lence of self-reported chronic conditions and preferencefor private sector increased over the last three years.Many predictors of self-reported chronic conditions andthe health-seeking pattern remain same over the time.There is need to pay urgent attention on improvingchronic conditions care for urban poor with a preferen-tial focus on strengthening the government primary careservices.
Competing interestsThe author(s) declare that they have no competing interests.
Authors’ contributionsTBS designed the study and supervised the data collection. MG cleaned andprepared the dataset for analysis. MG and UB conceptualized the analyticalapproach used in the study. MG and UB did data analysis. MG wrote the firstdraft of the manuscript. UB, TBS and ND commented on the manuscript. Allthe authors read and approved the final manuscript.
AcknowledgementsWe are thankful to Nagarathna, Leelavathi, NargisTabassum, Amruthvalli andMunegowda for their help in data collection for this study.
Author details1Institute of Public Health, 250, 2nd C Main, Girinagar 1st Phase, Bengaluru560085, India. 2Department of Public Health, Ghent University, De Pintelaan185 4K3 9000, Ghent, Belgium.
Received: 7 January 2015 Accepted: 11 August 2015
References1. World Health Organization. Global status report on noncommunicable
diseases 2010. Geneva, Switwerland; 2011 p. 1622. Srinath Reddy K, Shah B, Varghese C, Ramadoss A. Responding to the threat
of chronic diseases in India. Lancet. 2005;366(9498):1744–9.3. Patel V, Chatterji S, Chisholm D, Ebrahim S, Gopalakrishna G, Mathers C, et
al. Chronic diseases and injuries in India. Lancet.2011;377(9763):413–28.
4. World Health Organization. India: World Health Organization -Noncommunicable Diseases (NCD) Country Profiles, 2014 [Internet]. 2014.Available from: http://www.who.int/nmh/publications/ncd_report_full_en.pdf
5. Agarwal S. The state of urban health in India; comparing the poorestquartile to the rest of the urban population in selected states and cities.Environ Urban. 2011;23(1):13–28.
6. Brashier B, Londhe J, Madas S, Vincent V, Salvi S. Prevalence ofself-reported respiratory symptoms, asthma and chronic bronchitisin slum area of a rapidly developing Indian city. Open J Respir Dis.2012;02:73–81.
7. Bhojani U, Beerenahalli TS, Devadasan R, Munegowda CM, Devadasan N,Criel B, et al. No longer diseases of the wealthy: prevalence and health-seeking for self-reported chronic conditions among urban poor in SouthernIndia. BMC Health Services Research. 2013;13:306.
8. Pawar A, Bansal R, Bharodiya P, Panchal S, Patel H, Padariya P, et al.Prevalence of hypertension among elderly women in slums of Surat city.Natl J Community Med. 2010;1(1):39–40.
9. Kar SS, Thakur JS, Virdi NK, Jain S, Kumar R. Risk factors for cardiovasculardiseases: Is the social gradient reversing in nothern India? Natl Med J India.2010;23(4):206–9.
10. Subramanian SV, Corsi DJ, Subramanyam M, Smith GD. Jumping the gun:the problematic discourse on socioeconomic status and cardiovascularhealth in India. Int J Epidemiol. 2013;42(5):1410–26.
11. Gupta PC, Pednekar MS. Re: Jumping the gun: the problematic discourse onsocioeconomic status and cardiovascular health in India. Int J Epidemiol.2014;43(1):276–8.
12. Jones-Smith JC. Commentary: Jumping the gun or asleep at the switch: isthere a middle ground? Int J Epidemiol. 2013;42(5):1435–7.
13. Stringhini S, Bovet P. Commentary: The social transition of cardiovasculardisease in low- and middle-income countries: wait and see is not an option.Int J Epidemiol. 2013;42(5):1429–31.
14. Narayan KMV, Ali MK. Commentary: Shielding against a future inferno: thenot-so-problematic discourse on socioeconomic status and cardiovascularhealth in India. Int J Epidemiol. 2013;42(5):1426–9.
15. Prabhakaran D, Jeemon P, Reddy KS. Commentary: Poverty andcardiovascular disease in India: do we need more evidence for action? Int JEpidemiol. 2013;42(5):1431–5.
16. Gwatkin DR. Metrics matter: the case of assessing the importance of non-communicable diseases for the poor. Int J Epidemiol.2013;42(5):1211–4.
17. Vellakkal S, Subramanian SV, Millett C, Basu S, Stuckler D, Ebrahim S.Socioeconomic inequalities in non-communicable diseases prevalence in India:disparities between self-reported diagnoses and standardized measures. PLoSOne. 2013;8(7), e68219.
18. Yadav K, SV N, Pandav CS. Urbanization and health challenges : need to fasttrack launch of the National Urban Health Mission. Indian J Community Med.2011;36(1):3–7.
19. Dasgupta R, Bisht R. The missing mission in health. Econ Polit Wkly.2010;14(6):16–8.
Gowda et al. BMC Health Services Research (2015) 15:330 Page 7 of 8
20. Ramachandran A, Snehalatha C, Kapur A, Vijay V, Mohan V, Das A, et al. Highprevalence of diabetes and impaired glucose tolerance in India: NationalUrban Diabetes Survey. Diabetologia. 2001;44(9):1094–101.
21. Bhojani U, Thriveni BS, Devadasan R, Munegowda CM, Devadasan N, KolsterenP, et al. Out-of-pocket healthcare payments on chronic conditions impoverishurban poor in Bangalore India. BMC Public Health. 2012;12:990.
22. Mohan V, Deepa M, Deepa R, Shanthirani C, Farooq S, Ganesan A, et al.Secular trends in the prevalence of diabetes and impaired glucosetolerance in urban South India — the Chennai Urban Rural EpidemiologyStudy (CURES-17). Diabetologia. 2006;49:1175–8.
23. Deepa M, Anjana RM, Manjula D, Narayan KV, Mohan V. Convergence ofprevalence rates of diabetes and cardiometabolic risk factors in middle andlow income groups in urban India: 10-year follow-up of the Chennai UrbanPopulation Study. J Diabetes Sci Technol. 2011;5(4):918–27.
24. Barua N, Pandav CS. The allure of the private practitioner: is this the onlyalternative for the urban poor in India? Indian J Public Health.2011;55(2):107–14.
25. Ergler CR, Sakdapolrak P, Bohle H-G, Kearns RA. Entitlements to health care:why is there a preference for private facilities among poorer residents ofChennai, India? Soc Sci Med. 2011;72(3):327–37.
26. Ministry of Health and Family Welfare. National Urban Health Mission:Framework for implementation. 2013 p. 1–89
27. Subramanian SV, Subramanyam MA, Selvaraj S, Kawachi I. Are self-reports ofhealth and morbidities in developing countries misleading ? Evidence fromIndia. Public Health. 2010;68:9.
Submit your next manuscript to BioMed Centraland take full advantage of:
• Convenient online submission
• Thorough peer review
• No space constraints or color figure charges
• Immediate publication on acceptance
• Inclusion in PubMed, CAS, Scopus and Google Scholar
• Research which is freely available for redistribution
Submit your manuscript at www.biomedcentral.com/submit
Gowda et al. BMC Health Services Research (2015) 15:330 Page 8 of 8
7. The health system dynamics framework: the introduction of an analytical model forhealth system analysis and its application to two case-studies – a paper published in theHealth, Culture and Society
J. van Olmen; B. Criel; U. Bhojani; B. Marchal; S. van Belle; M.F Chenge; T. Hoerée;M. Pirard; W. Van Damme; G. Kegels.
Volume 2, No. 1 (2012) | ISSN 2161-6590 (online) DOI 10.5195/hcs.2012.71 | http://hcs.pitt.edu
Health, Culture and Society Volume 2, No. 1 (2012) | ISSN 2161-6590 (online) | DOI 10.5195/hcs.2012.71 | http://hcs.pitt.edu
Frameworks can clarify concepts and improve understanding of underlying mechanisms in the domain of health systems research and strengthening. Many existing frameworks have a limited capacity to analyze interactions and equilibriums within a health system overlooking values as an underlying steering mechanism. This paper introduces the health system dynamics framework and demonstrates its application as a tool for analysis and modelling.
The added value of this framework is: 1) consideration of different levels of a health system and tracing how interventions or events at one level influence other elements and other levels; 2) emphasizes the importance of values; 3) a central axis linking governance, human resources, service delivery and population, and 4) taking into account the key elements of complexity in analysis and strategy development. We urge the analysis of individual health systems and meta-analysis, for a better understanding of their functioning and strengthening.
Keywords: Health systems; health systems research; health systems strengthening; conceptual frameworks; complexity
Health, Culture and Society Volume 2, No. 1 (2012) | ISSN 2161-6590 (online) | DOI 10.5195/hcs.2012.71 | http://hcs.pitt.edu
J. van Olmen1; B. Criel ; U. Bhojani3; B. Marchal ; S. van Belle ;M.F Chenge ; T. Hoerée ; M. Pirard ; W. Van Damme ; G. Kegels
Much more than clinical medicine, the domain of public health and health policy and systems as a part of
it - is shaped by dynamic alliances between actors from scientific, policy and operational backgrounds as well as the public in the form of patient groups, consumer associations and other interest groups and actors from the private sector. This strong influence of stakeholders from different backgrounds, each with their own logic and paradigms, contributes to the perceived lack of clarity.
The organization of health systems has long been considered more an operational problem and less a domain for research. This changed with the re-emerging attention for health systems strengthening and the demand of policy-makers for evidence to support their decisions. The scientific community has oriented itself towards health systems research, presently defining and developing the domain (Bennett et al. 2011;Gilson et al. 2011;Mills 2011;Sheikh et al. 2011). The scope of relevant research questions, approaches and methods in this domain is vast, but a recurrent element in the way of thinking is to start from a conceptual framework to both frame and interpret empirical research. Health system strengthening, universal coverage and primary health care pivotal topics in the current health systems research domain are abstract and multi-interpretable concepts. Frameworks can thus indeed help in clarifying the concept and can in turn point to linkages to other concepts, leading to a better understanding of underlying mechanisms, determinants of observed phenomena or a novel pathway to change.
The Health System Dynamics Framework Volume 2, No. 1 (2012) | ISSN 2161-6590 (online) | DOI 10.5195/hcs.2012.71 | http://hcs.pitt.edu
A number of health systems frameworks have been published over the last decade. These have served different purposes, from describing or analyzing existing situations to being predictive or prescriptive. Comprehensive frameworks at the national level include the widely used World Health Organization (WHO) models (World Health Organization 2000;World Health Organization 2007;World Health Organization 2009), some of which were adapted for evaluation (World Health Organization 2008b) or participatory planning (de Savigny and Adam, 2009). Other frameworks focus on specific interface between different components (Atun et al. 2009;World Health Organization 2005;World Health Organization 2008a;World Health Organization 2010).11 (Shakarishvili et al. 2010) give a comprehensive and analytical overview of the differences in existing health system frameworks.
Many of the existing frameworks have a limited capacity to analyze the interactions and equilibriums between different elements of a health system., Most, moreover, do not focus on values as important steering mechanisms for the behavior of people and thus for choices and processes in a health system. In response to these shortfalls, we developed a framework for description and analysis of health systems dynamics, which consists of ten elements focusing on system interactions (van Olmen et al. 2010b). This paper introduces the health system dynamics framework and illustrates how it has been applied in two cases of health systems research. The aim of our research is to explain this modelization and demonstrate how it can serve as a tool for analysis and modelling, in health systems research and practice.
Developing the health system dynamics framework comprised of five stages, which partly ran in parallel:
1) an historical analysis of the evolution of ideas about health systems; 2) a literature review of health systems andframeworks for health system strengthening; 3) a series of three expert meetings at the Institute of TropicalMedicine Antwerp assessing the impact value of literature through specialized perspectives and to elucidateunderlying operational values; 4) the drafting of a concept paper which was subject to internal and external peerreview; and 5) the application of the framework in assignments with M.sc. students and in field studies, some ofwhich were published or presented at scientific conferences (Boussery et al. 2011;Hôpitaux Universitaires deGenève 2010;Van Damme et al. 2011b).
While the health system dynamics framework incorporates elements of existing frameworks, such as WHO
building blocks (World Health Organization 2007), it goes further than most. First, it emphasizes that a health system should be geared towards outcomes and goals, but jointly adds that they are, and indeed should be, based on explicit choices of values and principles. Second, the framework considers some elements to be more important than others. We assert that the organization and delivery of health care services is the core of the central axis that includes leadership, governance as well as interaction with the population and other actors. This brings us to a framework consisting of ten elements and their dynamic interactions: 1) goals and outcomes; 2) values and principles; 3) service
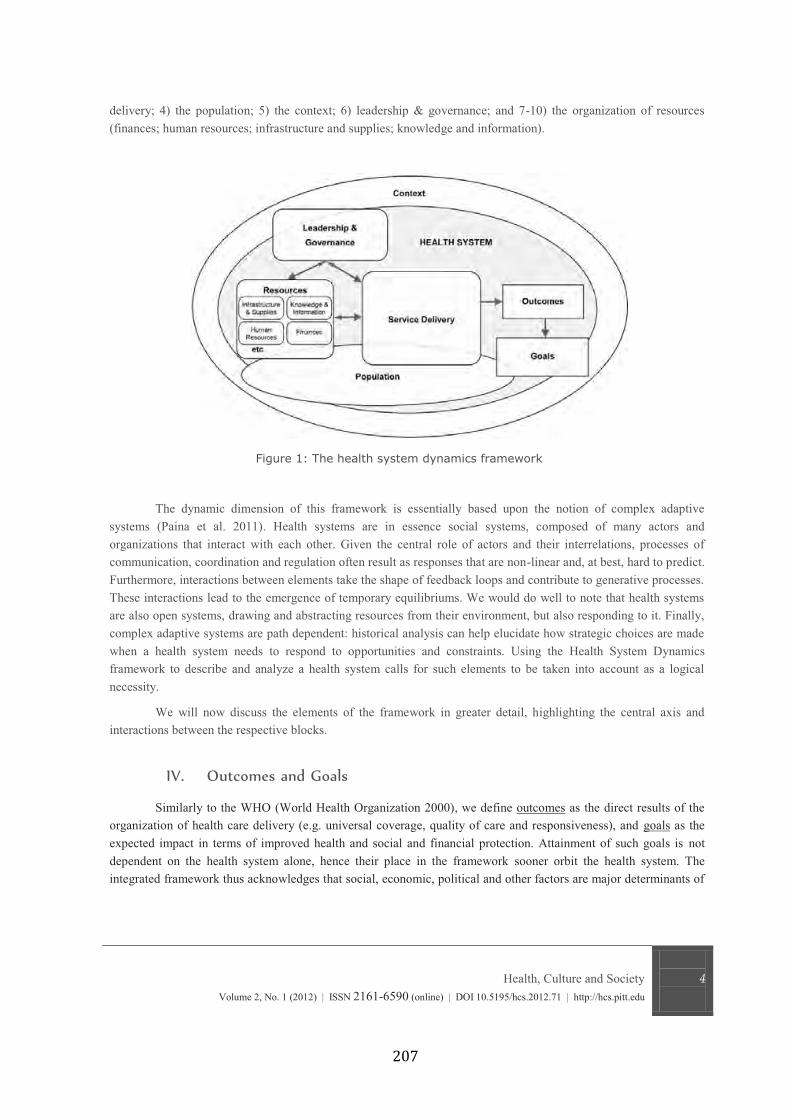
Health, Culture and Society Volume 2, No. 1 (2012) | ISSN 2161-6590 (online) | DOI 10.5195/hcs.2012.71 | http://hcs.pitt.edu
delivery; 4) the population; 5) the context; 6) leadership & governance; and 7-10) the organization of resources (finances; human resources; infrastructure and supplies; knowledge and information).
The dynamic dimension of this framework is essentially based upon the notion of complex adaptive systems (Paina et al. 2011). Health systems are in essence social systems, composed of many actors and organizations that interact with each other. Given the central role of actors and their interrelations, processes of communication, coordination and regulation often result as responses that are non-linear and, at best, hard to predict. Furthermore, interactions between elements take the shape of feedback loops and contribute to generative processes. These interactions lead to the emergence of temporary equilibriums. We would do well to note that health systems are also open systems, drawing and abstracting resources from their environment, but also responding to it. Finally, complex adaptive systems are path dependent: historical analysis can help elucidate how strategic choices are made when a health system needs to respond to opportunities and constraints. Using the Health System Dynamics framework to describe and analyze a health system calls for such elements to be taken into account as a logical necessity.
We will now discuss the elements of the framework in greater detail, highlighting the central axis and interactions between the respective blocks.
Similarly to the WHO (World Health Organization 2000), we define outcomes as the direct results of the
organization of health care delivery (e.g. universal coverage, quality of care and responsiveness), and goals as the expected impact in terms of improved health and social and financial protection. Attainment of such goals is not dependent on the health system alone, hence their place in the framework sooner orbit the health system. The integrated framework thus acknowledges that social, economic, political and other factors are major determinants of

The Health System Dynamics Framework Volume 2, No. 1 (2012) | ISSN 2161-6590 (online) | DOI 10.5195/hcs.2012.71 | http://hcs.pitt.edu
health and the well-being of people.
Improved health and wellbeing is the first goal of any health system. The holistic definition of health as - (Alma Ata 1978;World Health Organization 1946) has been widely
accepted although in reality the definition is often narrowed down to thand gauge. The increasing number of people with life-long conditions has led to advocacy for a broader definition,
integrity, equilibrium and sense of wellbeing (Huber et al. 2011).
Financial protection refers to the economic consequences of disease and in practice signals arrangements for access to care of decent quality and for ensuring income and financial support in case of illness. The ability of a
on to its population is an important factor in creating trust towards the health system. Social protection goes further and addresses the vulnerability of people who have fallen ill through services for relief from deprivation thus tackling more structural causes of inequity and power imbalances (Michielsen et al. 2010).
The definition of the goals and the choice for striking a particular balance between them reflect the interests and values of the actors at both central and local levels. This equilibrium is the result of power balances, reflecting domestic institutional arrangements as well as the influence of global, bilateral and other external actors. It is a key function of governance not only to make these different values and tensions explicit, but also to guarantee that accountability mechanisms are in place to ensure a fair decision-making process and to provide accounts of the choices made.
The outcomes of a health system include access and coverage, which are important determinants in the utilization and actualization of health services. Access relates to how many people have access to a health facility or
and geographical access. Coverage is used to determine the ratio of the population that benefits from a specific service or intervention, such as vaccination or health insurance. In its 2008 World Health Report on universal
specified package of health
having access) or height (relative part of cost that is covered by the package) (World Health Organization 2008a). The evaluation of access and utilization is, however, conceptually and methodologically difficult since there are no universally valid standards.
Quality of care is a multi-dimensional concept. It is defined differently by users, funders, providers and managers. Definitions of quality of care and other health related interventions usually emphasize a mix of the following components: effectiveness; efficiency; safety; patient-centeredness; integrated care (including curative care, prevention and health promotion); timeliness and continuity (within and beyond a single episode of disease and beyond the boundaries of a health care organization) (Institute of Medicine 2001;Unger et al. 2003b;World Health Organization 2008a). We add the dimension of enablement or empowerment
(Howie et al. 2000;van Olmen et al. 2010a).
Responsiveness entails reacting effectively to the needs and demands of the population and its different subpopulations and vulnerable groups. The content of the minimum package of activities should be informed both by the burden of disease and by the perceived needs of the population. It is a function of governance weighing the technical arguments; perceived needs; existing values and principles, and to decide which trade-offs to make, taking into account the infrastructure, level of development and capacity of implementation. This definition surpasses the definition of the WHO in its WHR 2000, which focuses on the individual expectations of people versus the health care provider (World Health Organization 2000).
Health, Culture and Society Volume 2, No. 1 (2012) | ISSN 2161-6590 (online) | DOI 10.5195/hcs.2012.71 | http://hcs.pitt.edu
Health systems are not mechanically engineered structures to deliver health care, but social institutions,
shaped by values, and likewise emanating values through their structure, institutions and respective inter-personal relationships (Freedman 2005;Gilson 2003). These values and principles vary between societies and among actors. Their effects on the health system are thus channelled through power structures and relations within society where certain values relate to processes such as effectiveness, efficiency and sustainability. Values such as solidarity, equity and autonomy reflect aspirations or ideological convictions. The latter include positioning on issues: a cosmopolitan versus a national paradigm of social justice for example, or a vision of health as an economic versus a social good (Evans et al. 1990;Roberts et al. 2004b). Since the pursuit of values may have opposing effects and since actors may indeed value outcomes and aims differently on the basis of their own set of values, tensions are likely to arise.
Many low- and middle-income countries (LMIC) face the tension of choosing between priorities for the short term and broader objectives on the longer term. Focused approaches can contribute to rapid results in particular fields, such as the decrease in the burden of malaria, but this often has the opportunity cost of neglecting mid- and long-term cross-cutting strategies in the health system (Richard et al. 2011). Priority-setting thus faces the challenge of choosing between options with different goals that emphasise different values. Whichever tensions and values at stake, their relative weight is unique to each context and paramount in the determination of priorities and processes within the health system. An essential function of health system governance is therefore to seek a balance, taking into account the values and principles of actors in the system through a process of negotiation on the basis of fair processes, whilst (1) being accountable to the ultimate beneficiary the population and, (2) minimizing harmful effects, especially for the most vulnerable groups. These choices ideally occur in-country, at the appropriate level central or more decentralized depending on the type of choice and the institutional arrangements therein articulated.
Because health systems are essentially open systems, they are shaped and influenced by wider societal
change. This means that every country has a health system that reflects its political decision-making and historical evolution (Riley 2008). It also implies a constant need for response to new developments and transitions, such as an ever-evolving disease burden composition; new technologies; changing expectations of patients and providers; increased availability of information and the changing roles of the state in the health and social sectors.
An analysis of the national context encompasses a governance analysis covering recent evolutions in the domestic political regime (including regulatory system); institutional arrangements (relations state, private sector and civil society organizations); the organization of the public sector (public sector reform including decentralization) and public financial management. The policy context of a health system at each level cannot be analysed in isolation local, national, regional and global as each of these levels dovetails others through power configurations and dynamics. Global financial and economic regimes and policies have an important influence on national policies in LIC. Many global and national actors interact directly with local health service and program managers, politicians and other stakeholders.
Above, we referred to the crucial influence of wider social determinants on health system outcomes and goals. There has, for instance, been a longstanding recognition of the influence of water and sanitation on the burden of infectious diseases and of good education as a determinant for maternal and child health. Furthermore, the

The Health System Dynamics Framework Volume 2, No. 1 (2012) | ISSN 2161-6590 (online) | DOI 10.5195/hcs.2012.71 | http://hcs.pitt.edu
framework of the Commission on Social Determinants and Health points to the broad impact of social and economic policies on health and social protection and its distribution in the population (World Health Organization 2008c). Analysis of health care organization for non-communicable diseases points to the large role of the private sector, especially the pharmaceutical, tobacco and food industry, in shaping the environment and the concordant behavior of people (Labonte et al. 2011).
Health service delivery is the process through which providers, health facilities, programmes and policies
are coordinated and implemented so as to reach the goals of the health system. It relates to services and activities with the primary purpose to improve health and includes primary prevention; secondary prevention; curative care and rehabilitation (Marchal et al. 2011). This means that a wide set of activities needs to be organised, from focused activities to general services. There are several ways to classify the delivery of this wide range of activities and services. Criteria include: the focus on individuals/families or on the total population (Boussery et al. 2011); the need for permanent availability or the possibility for intermittent scheduling (Van Damme et al. 2011a) or the extent to which services are transaction-intensive, discretionary and subject to information asymmetry (World Bank 2004a).
Scarcity of resources and the respective need for rationing requires prioritization of interventions. In
platform is informed by intervention-related characteristics (such as the possibility to standardize and delegate activities or the added value of bundling); the capacity of the health service supposed to implement the interventions; the capacity of the health system steward to coordinate actors and give managerial support, contextual factors (e.g. disease burden, regulation capacity) and the historical evolutions (path-dependency) (Unger et al. 2003a).
Service providers can be categorized as private or public; for-profit or not for-profit; formal or informal; professional or non-professional; allopathic or traditional; remunerated or voluntary. In practice, hybrid forms exist and boundaries are often blurred. In most health systems, providers indeed constitute a complex mix (often referred
personal initiative or spontaneous evolution or forces in the wider context (Meessen et al. 2011; Nishtar 2010). We believe that at the local level, health providers should operate within an integrated health system where there are no gaps in access, where composing tiers operate complementarily rather than competing and where there is an optimal flow of patients and information so that the patient is helped at the most appropriate level (Unger et al. 1995). The first-line health and social services are at the core of this system (World Health Organization 2008a), supported by an effective second level (including hospitals). Integrated systems require good coordination of all involved actors, which, given the pluralistic nature of most systems, is all the more essential (Bloom et al. 2001).
People seek to improve their health in many ways. Health seeking behaviour is diversified, based upon pragmatic and eclectic decisions, not only influenced by physical, financial and socio-cultural factors, but also by the accessibility, scope of services and the reputation of, and trust in, a provider or facility. This also involves self-referral and discontinuation of treatment. Mutual trust between health providers and the population and patients is a determinant as well as a consequence of the quality of care (Berlan et al. 2011). Trust of patients is influenced by the perceived fairness and behaviour and respect of individual providers, but likewise by the institutional set-up of care and by peoples experiences with public services in general (Gilson et al. 2005).
Health, Culture and Society Volume 2, No. 1 (2012) | ISSN 2161-6590 (online) | DOI 10.5195/hcs.2012.71 | http://hcs.pitt.edu
The population is involved in the health system as patients or customers, but also as citizens having rights
and obligations and as funders or even suppliers of care (Frenk 2010). There has been increasing attention for people as producers of health and health care, with attention for the (spontaneous) activities of individuals and the collective action of groups in the community such as self-help groups; patient organizations; peer-groups and informal caregivers.
The concept of participation includes a wide variety of approaches on a scale of increasing empowerment, from mobilizing people to contribute inputs, over common decision-making processes, to increased capacity and to autonomously recognizing and acting upon situations (Rifkin 2003). Empowerment at the individual and community level is widely recognized as an important goal, because it contributes to reducing inequities and bringing about desired social change (Gilson et al. 2007). At the community level, a strong community voice in relations with other actors in the health system, especially when priorities are set, is important. Empowerment implies the transformation of power relations that is likely to elicit resistance (van Olmen et al. 2010a). Empowerment of people, both at the individual and community level, calls for different approaches both at the supply and demand side that improve opportunities for voice (Perez et al. 2009), and also in the fair processes of decision-making to ensure that voices are heard and taken into account.
people seeking health care. Examples of mechanisms influencing the demand for health service and health seeking behavior are the development of financial incentives (or barriers); voucher schemes and awareness campaigns about health risks or information about provider characteristics (Berlan et al. 2011;Peters et al. 2008). Some of these may provide leverage for improving the accountability of health providers towards service users.
Governance entails policy guidance to the whole health system; coordination of actors and regulation of
different functions; levels and actors in the system; optimal allocation of resources and ensuring accountability towards the population and all stakeholders.
Government actors have a central role in the steering of the health system, since they have a public mandate. Ensuring the protection of citizens against ill health and its social and financial consequences is an important element of their legitimacy as public servants. Government should play a mediating role between all stakeholders to promote equity, efficiency and sustainability and to ensure the public finality of the health system. In
(Reich 2002). Agreements with -economic
policies and this may subsequently impose limits on its role in the delivery of health services. Decentralization processes within States devolve responsibilities for the delivery of health services from central to local government structures. As a result, a variety of players, including market and civil society actors, politicians, professional organizations and cooperative structures, have an influence on governance.
The increased role of stakeholders at all levels and in different functions demands strong capacity in the ministry of health, its decentralized structures and local governments to take leadership and to steer pluralistic and fragmented systems into a satisfactory balance. It entails strategic vision, technical knowledge and information, consensus-building and negotiation skills, as well as the capacity to consider values and principles, but also the
The Health System Dynamics Framework Volume 2, No. 1 (2012) | ISSN 2161-6590 (online) | DOI 10.5195/hcs.2012.71 | http://hcs.pitt.edu
ability to ensure effective participation and involvement of multiple stakeholders through transparent and fair processes. Furthermore, such involvement and linkage between different levels within the State and the health system is essential to facilitate the bottom-up influencing of policy-making and the implementation of policies.
Regulation is a major instrument to govern the health sector and includes rules, laws, guidelines and their enforcement, as well as professional and ethical rules and norms, and any kind of incentives acting upon actors (Mills et al. 2006). Lack of monitoring, insufficient knowledge and resources, diverging priorities and insufficient political commitment may cause gaps between the rules and their enforcement. The changing role of the State and the proliferation of actors have increased the importance of coordination as a governance tool. This implies the involvement of all stakeholders in discussion, decision-making and implementation. Again, it is up to State actors with a public mandate at central and peripheral levels to take the lead in creating and maintaining coordination mechanisms. At the decentralized level - - there is an important coordinating role for the teams heading that system. They are expected to organize the health services and health care on their territory in an efficient and effective manner, in line with national health policies but also to take into account the specific local needs and demands, coordinating with local authorities.
decisions or actions (Brinkerhoff 2003). In the health system, the obligation of accountability is situated at all levels, from provider-patient interaction, over the organizational meso-level to the relation of the ministry of health with government and the population. Accountability is a two-way relationship in which organizations are responsible but also held accountable by the users and the public at large (World Bank 2004b). This is greatly determined by general institutional arrangements of the State, such as the presence of the free press; transparency of decision-making and availability of information; the involvement of civil society and population representatives, and the level of corruption.
At operational facility level, various mechanisms for accountability have been used to varying degrees of success (Rifkin 2001). Recurrent problems in ensuring the accountability between health facilities and their users are caused by power differentials and information asymmetry, which hinder the capacity of populations to monitor providers, participate in decisions and, in general, claim their rights.
Financing
Financing involves the acquisition, pooling and allocation of financial resources in such a way that it effectively contributes to attaining the desired goals and outcomes. In essence, health financing needs to ensure access to services while protecting people against catastrophic health expenditure (World Health Organization 2008b). Health care financing modalities have a direct bearing on equity, efficiency and sustainability. The Commission on Macroeconomics and Health estimates the cost of a core package of activities at around US$40 per person per year, although analysis of health system performance shows that a number of countries are able to perform well with less (Riley 2008). Since health financing always involves rationing, the decisions on priority-setting and allocation of resources have great implications, especially when resources run scarce (Palmer et al. 2004;Roberts et al. 2004a). The prime responsibility for revenue collection is located at the national level, because this is linked with government accountability to the population. There is, however, a strong plea for global social responsibility and for longstanding commitment of the international community to contribute to the health financing of the basic package for those countries too poor to raise sufficient funds internally (Ooms et al. 2009).
The way in which different health services are financed and how providers are paid, directly influences the type of services being delivered and how they are delivered. In the present reality with increased fragmentation in the health care
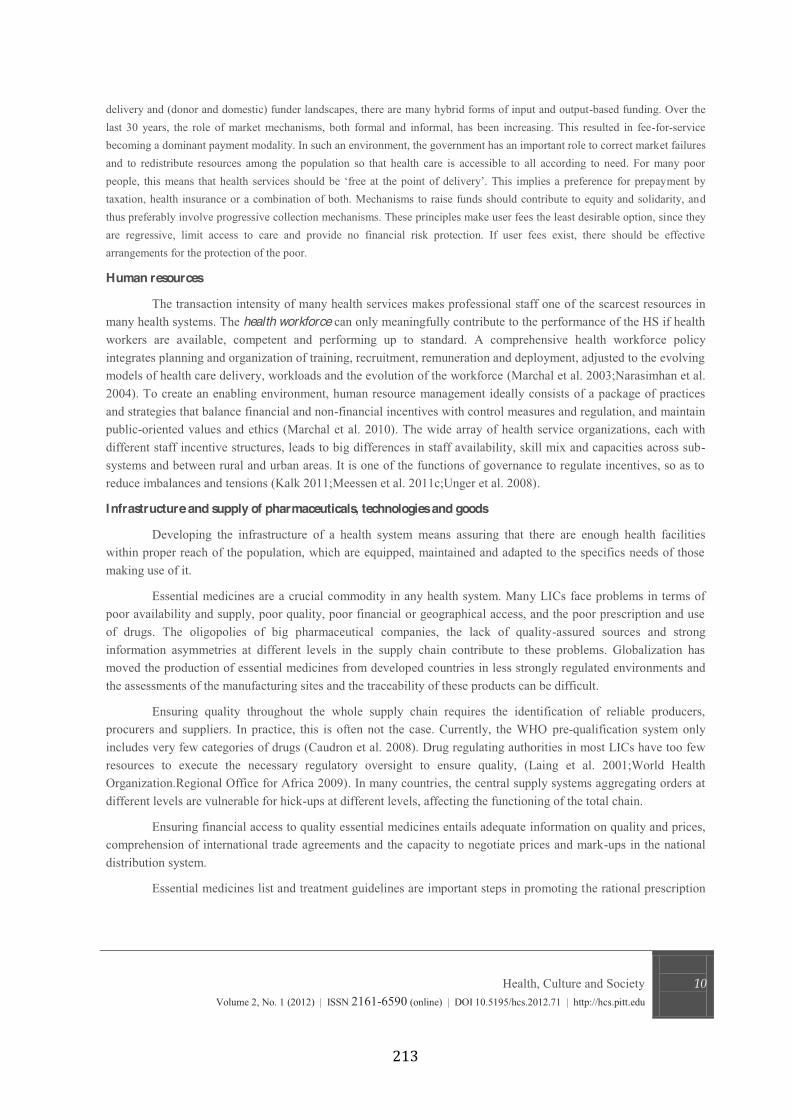
Health, Culture and Society Volume 2, No. 1 (2012) | ISSN 2161-6590 (online) | DOI 10.5195/hcs.2012.71 | http://hcs.pitt.edu
delivery and (donor and domestic) funder landscapes, there are many hybrid forms of input and output-based funding. Over the last 30 years, the role of market mechanisms, both formal and informal, has been increasing. This resulted in fee-for-service becoming a dominant payment modality. In such an environment, the government has an important role to correct market failures and to redistribute resources among the population so that health care is accessible to all according to need. For many poor
ment by taxation, health insurance or a combination of both. Mechanisms to raise funds should contribute to equity and solidarity, and thus preferably involve progressive collection mechanisms. These principles make user fees the least desirable option, since they are regressive, limit access to care and provide no financial risk protection. If user fees exist, there should be effective arrangements for the protection of the poor.
Human resources The transaction intensity of many health services makes professional staff one of the scarcest resources in
many health systems. The health workforce can only meaningfully contribute to the performance of the HS if health workers are available, competent and performing up to standard. A comprehensive health workforce policy integrates planning and organization of training, recruitment, remuneration and deployment, adjusted to the evolving models of health care delivery, workloads and the evolution of the workforce (Marchal et al. 2003;Narasimhan et al. 2004). To create an enabling environment, human resource management ideally consists of a package of practices and strategies that balance financial and non-financial incentives with control measures and regulation, and maintain public-oriented values and ethics (Marchal et al. 2010). The wide array of health service organizations, each with different staff incentive structures, leads to big differences in staff availability, skill mix and capacities across sub-systems and between rural and urban areas. It is one of the functions of governance to regulate incentives, so as to reduce imbalances and tensions (Kalk 2011;Meessen et al. 2011c;Unger et al. 2008).
Infrastructure and supply of pharmaceuticals, technologies and goods
Developing the infrastructure of a health system means assuring that there are enough health facilities within proper reach of the population, which are equipped, maintained and adapted to the specifics needs of those making use of it.
Essential medicines are a crucial commodity in any health system. Many LICs face problems in terms of poor availability and supply, poor quality, poor financial or geographical access, and the poor prescription and use of drugs. The oligopolies of big pharmaceutical companies, the lack of quality-assured sources and strong information asymmetries at different levels in the supply chain contribute to these problems. Globalization has moved the production of essential medicines from developed countries in less strongly regulated environments and the assessments of the manufacturing sites and the traceability of these products can be difficult.
Ensuring quality throughout the whole supply chain requires the identification of reliable producers, procurers and suppliers. In practice, this is often not the case. Currently, the WHO pre-qualification system only includes very few categories of drugs (Caudron et al. 2008). Drug regulating authorities in most LICs have too few resources to execute the necessary regulatory oversight to ensure quality, (Laing et al. 2001;World Health Organization.Regional Office for Africa 2009). In many countries, the central supply systems aggregating orders at different levels are vulnerable for hick-ups at different levels, affecting the functioning of the total chain.
Ensuring financial access to quality essential medicines entails adequate information on quality and prices, comprehension of international trade agreements and the capacity to negotiate prices and mark-ups in the national distribution system.
Essential medicines list and treatment guidelines are important steps in promoting the rational prescription
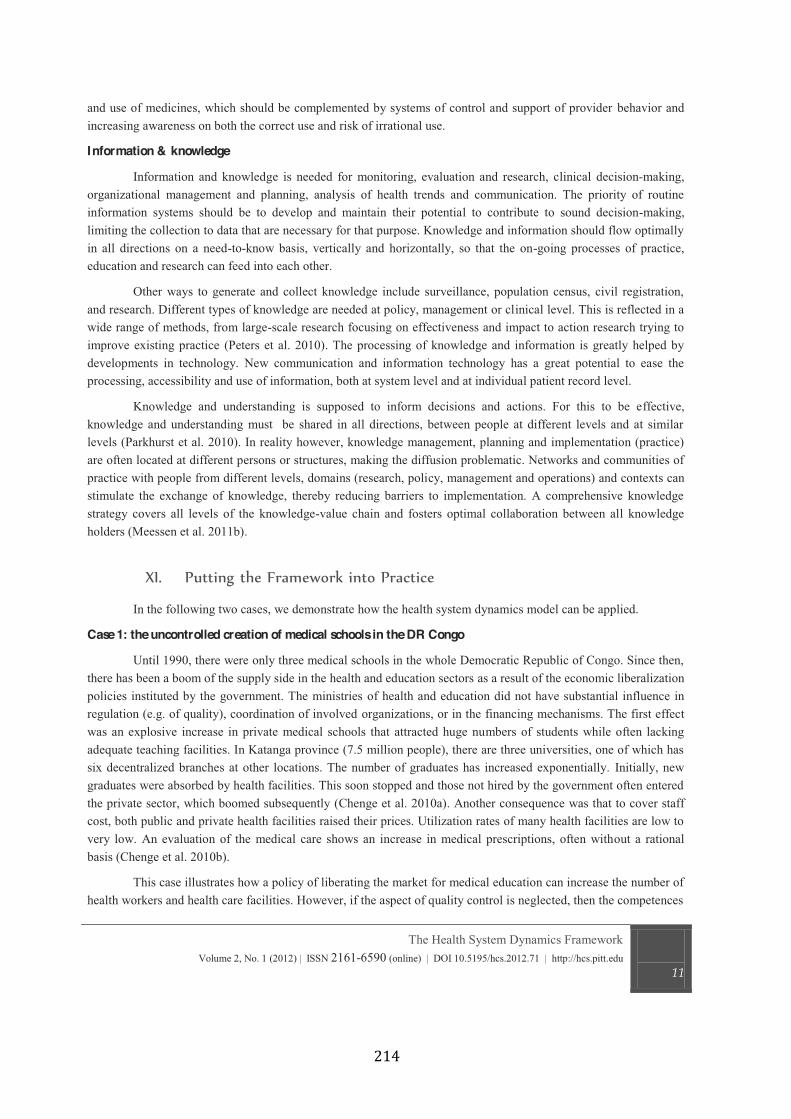
The Health System Dynamics Framework Volume 2, No. 1 (2012) | ISSN 2161-6590 (online) | DOI 10.5195/hcs.2012.71 | http://hcs.pitt.edu
and use of medicines, which should be complemented by systems of control and support of provider behavior and increasing awareness on both the correct use and risk of irrational use.
Information & knowledge Information and knowledge is needed for monitoring, evaluation and research, clinical decision-making,
organizational management and planning, analysis of health trends and communication. The priority of routine information systems should be to develop and maintain their potential to contribute to sound decision-making, limiting the collection to data that are necessary for that purpose. Knowledge and information should flow optimally in all directions on a need-to-know basis, vertically and horizontally, so that the on-going processes of practice, education and research can feed into each other.
Other ways to generate and collect knowledge include surveillance, population census, civil registration, and research. Different types of knowledge are needed at policy, management or clinical level. This is reflected in a wide range of methods, from large-scale research focusing on effectiveness and impact to action research trying to improve existing practice (Peters et al. 2010). The processing of knowledge and information is greatly helped by developments in technology. New communication and information technology has a great potential to ease the processing, accessibility and use of information, both at system level and at individual patient record level.
Knowledge and understanding is supposed to inform decisions and actions. For this to be effective, knowledge and understanding must be shared in all directions, between people at different levels and at similar levels (Parkhurst et al. 2010). In reality however, knowledge management, planning and implementation (practice) are often located at different persons or structures, making the diffusion problematic. Networks and communities of practice with people from different levels, domains (research, policy, management and operations) and contexts can stimulate the exchange of knowledge, thereby reducing barriers to implementation. A comprehensive knowledge strategy covers all levels of the knowledge-value chain and fosters optimal collaboration between all knowledge holders (Meessen et al. 2011b).
In the following two cases, we demonstrate how the health system dynamics model can be applied.
Case 1: the uncontrolled creation of medical schools in the DR Congo
Until 1990, there were only three medical schools in the whole Democratic Republic of Congo. Since then, there has been a boom of the supply side in the health and education sectors as a result of the economic liberalization policies instituted by the government. The ministries of health and education did not have substantial influence in regulation (e.g. of quality), coordination of involved organizations, or in the financing mechanisms. The first effect was an explosive increase in private medical schools that attracted huge numbers of students while often lacking adequate teaching facilities. In Katanga province (7.5 million people), there are three universities, one of which has six decentralized branches at other locations. The number of graduates has increased exponentially. Initially, new graduates were absorbed by health facilities. This soon stopped and those not hired by the government often entered the private sector, which boomed subsequently (Chenge et al. 2010a). Another consequence was that to cover staff cost, both public and private health facilities raised their prices. Utilization rates of many health facilities are low to very low. An evaluation of the medical care shows an increase in medical prescriptions, often without a rational basis (Chenge et al. 2010b).
This case illustrates how a policy of liberating the market for medical education can increase the number of health workers and health care facilities. However, if the aspect of quality control is neglected, then the competences
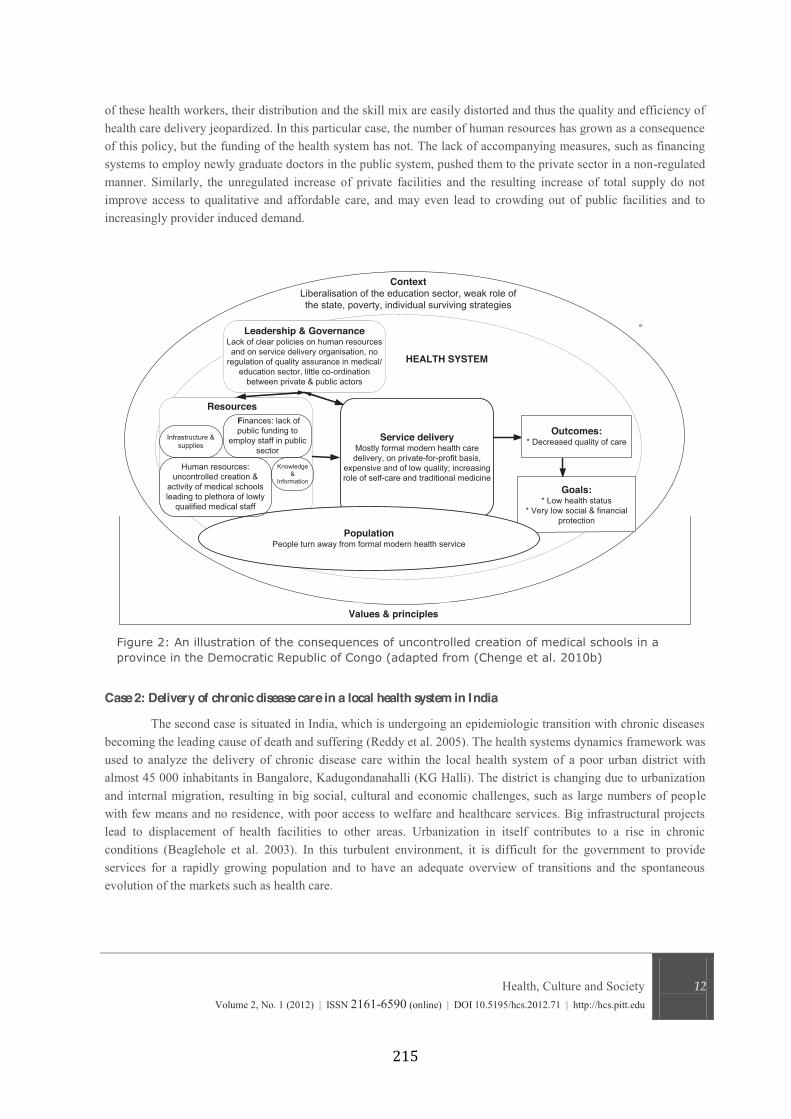
Health, Culture and Society Volume 2, No. 1 (2012) | ISSN 2161-6590 (online) | DOI 10.5195/hcs.2012.71 | http://hcs.pitt.edu
of these health workers, their distribution and the skill mix are easily distorted and thus the quality and efficiency of health care delivery jeopardized. In this particular case, the number of human resources has grown as a consequence of this policy, but the funding of the health system has not. The lack of accompanying measures, such as financing systems to employ newly graduate doctors in the public system, pushed them to the private sector in a non-regulated manner. Similarly, the unregulated increase of private facilities and the resulting increase of total supply do not improve access to qualitative and affordable care, and may even lead to crowding out of public facilities and to increasingly provider induced demand.
Case 2: Delivery of chronic disease care in a local health system in India The second case is situated in India, which is undergoing an epidemiologic transition with chronic diseases
becoming the leading cause of death and suffering (Reddy et al. 2005). The health systems dynamics framework was used to analyze the delivery of chronic disease care within the local health system of a poor urban district with almost 45 000 inhabitants in Bangalore, Kadugondanahalli (KG Halli). The district is changing due to urbanization and internal migration, resulting in big social, cultural and economic challenges, such as large numbers of people with few means and no residence, with poor access to welfare and healthcare services. Big infrastructural projects lead to displacement of health facilities to other areas. Urbanization in itself contributes to a rise in chronic conditions (Beaglehole et al. 2003). In this turbulent environment, it is difficult for the government to provide services for a rapidly growing population and to have an adequate overview of transitions and the spontaneous evolution of the markets such as health care.
Leadership & GovernanceLack of clear policies on human resources and on service delivery organisation, no
regulation of quality assurance in medical/education sector, little co-ordination
between private & public actors
Service deliveryMostly formal modern health care delivery, on private-for-profit basis,
expensive and of low quality; increasing role of self-care and traditional medicine
Values & principles
Outcomes:* Decreased quality of care
Goals:* Low health status
* Very low social & financial protection
PopulationPeople turn away from formal modern health service
Resources
ContextLiberalisation of the education sector, weak role of the state, poverty, individual surviving strategies
HEALTH SYSTEM
Knowledge &
Information
Human resources: uncontrolled creation &
activity of medical schools leading to plethora of lowly
qualified medical staff
Finances: lack of public funding to
employ staff in public sector
Infrastructure & supplies
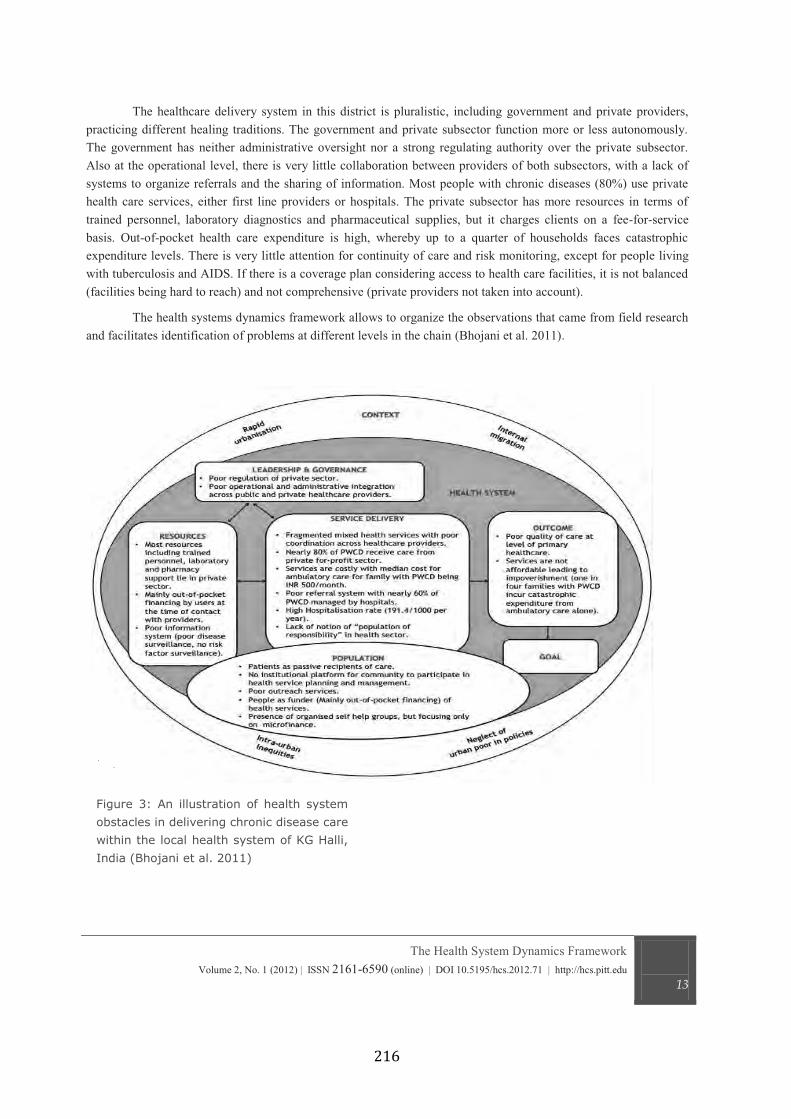
The Health System Dynamics Framework Volume 2, No. 1 (2012) | ISSN 2161-6590 (online) | DOI 10.5195/hcs.2012.71 | http://hcs.pitt.edu
The healthcare delivery system in this district is pluralistic, including government and private providers, practicing different healing traditions. The government and private subsector function more or less autonomously. The government has neither administrative oversight nor a strong regulating authority over the private subsector. Also at the operational level, there is very little collaboration between providers of both subsectors, with a lack of systems to organize referrals and the sharing of information. Most people with chronic diseases (80%) use private health care services, either first line providers or hospitals. The private subsector has more resources in terms of trained personnel, laboratory diagnostics and pharmaceutical supplies, but it charges clients on a fee-for-service basis. Out-of-pocket health care expenditure is high, whereby up to a quarter of households faces catastrophic expenditure levels. There is very little attention for continuity of care and risk monitoring, except for people living with tuberculosis and AIDS. If there is a coverage plan considering access to health care facilities, it is not balanced (facilities being hard to reach) and not comprehensive (private providers not taken into account).
The health systems dynamics framework allows to organize the observations that came from field research and facilitates identification of problems at different levels in the chain (Bhojani et al. 2011).
Health, Culture and Society Volume 2, No. 1 (2012) | ISSN 2161-6590 (online) | DOI 10.5195/hcs.2012.71 | http://hcs.pitt.edu
Our review of existing frameworks revealed limitations in terms of analysis of the interactions and mutual
relationships between the different elements of a health system and the absence of discussion of values as an important steering mechanism for the behavior of people and thus for choices and processes in a health system. With the framework presented in this paper, we attempt to address those limitations, thereby bridging gaps in knowledge and practice. Our framework, consisting of ten elements and their interactions, facilitates a comprehensive analytical view on a health system, its composing parts and its functioning at national, meso- or micro-level.
We believe that the added value of our framework lies, firstly, in the way it stimulates the researcher to take into account the different levels of a health system: the patient-provider interactions; the organization of individual health facilities; the local networks of health facilities and the interaction between these operational services and the central level. It also allows mapping the relevant global actors and their influence on the health system. In other words, the framework allows us to scale how interventions or events at one level influence other elements and levels. Secondly, the model emphasizes the role and importance of values. It can easily be used to describe the actual status of any given health system, but can also be loaded with normative values (as presented in this paper) and thus be utilized to assess whether a health system is in effect attaining the goals and aims it proclaims . Thirdly, a major difference with other frameworks is the role we assign to the central axis of our framework that links governance, human resources, service delivery and population. Health systems fail if this backbone is neither strong nor cohesively structured and health system strengthening fails if it does not ensure that this backbone is well developed. Fourthly, our framework builds upon the notion of the HS as a complex adaptive system and encourages the user to take into account the key elements of complexity in the analysis of the performance of health systems and the development of strategies for improvement.
This framework does not produce a classification of health systems. The existing attempts of typologies are based on characteristics such as the level of income of a country; its institutional financial arrangements; the availability of human resources; the service delivery patterns and the health status of the population. Most classifications are without clear relation to performance and thus rendering the construction of predictive and/or prescriptive frameworks difficult (McPake et al. 2009;Paris et al. 2010;Riley 2008). Nevertheless, the links between the different elements in our framework help to understand the relationships between certain health system characteristics and to compare the outcomes or ways of organizing elements in different health systems. In order to facilitate decision-making and induce change, the development of strategic and operational frameworks that help to decide what to do, how to do, and what results to expect has been advocated (Reich et al. 2009). A universal framework for such purpose risks to be too generic (Shakarishvili et al. 2010). We therefore plead for the analysis of health systems with frameworks like ours, followed by the meta-analysis of these applications.
Our framework does not aim to provide a uniform or definite model. Instead, it is flexible and can be adapted to the purpose of any particular analysis or planning exercise. Health systems research is a domain in which actors may struggle to find a balance between understanding and acting, or to combine knowing with doing. Although the core part of this paper deals with the understanding, we feel that it would be incomplete without spending a few words on what is meant by health systems strengthening and the processes to follow. The roots of our framework in notions of complexity point to the fact that strengthening a health system entails a change in equilibriums, and that reactions will occur as actors recalibrate their actions. It points to the need to understand the history of the system and its actors, and the linkages between these actors. Since intervening in health systems may change power interests, effective and lasting health system strengthening efforts are best done in a manner acceptable to most stakeholders. Inclusive decision-making is difficult but may increase the chances of aligning all
The Health System Dynamics Framework Volume 2, No. 1 (2012) | ISSN 2161-6590 (online) | DOI 10.5195/hcs.2012.71 | http://hcs.pitt.edu
actors, including the donor agencies and external actors, towards the overall goals and values. Interventions that mainly consist of increasing the inflow of resources are likely to work only if the health system has the capacity to transform these resources into (structural) positive changes (Potter et al. 2004). Health systems strengthening thus requires sound processes that are well maintained over a continuum in time and the creation of structures that ensure the institutionalization of these processes, while there are mechanisms to learn and adapt to transitions in the context (Keugoung et al. 2011;Marchal et al. 2011).
The authors of this paper would like to extend their acknowledgements to colleagues who contributed to the monograph that underlies this paper (van Olmen et al. 2010b).
Alma Ata. Declaration of Alma Ata: International conference on primary health care.
http://www.who.int/hpr/NPH/docs/declaration_almaata.pdf . 6-9-1978. Alma-Ata, USSR, Alma Ata. International
Conference on Primary Health Care. 6-9-2008.
Atun, R., de Jongh, T., Secci, F., Ohiri, K., & Adeyi, O. 2009. Integration of targeted health interventions
into health systems: a conceptual framework for analysis. Health Policy and Planning, 25, 104-111 available from:
PM:19917651
Beaglehole, R. & Yach, D. 2003. Globalisation and the prevention and control of non-communicable
disease: the neglected chronic diseases of adults. Lancet, 362, (9387) 903-908 available from: ISI:000185329400024
Bennett, S., Agyepong, I., Sheikh, K., Hanson, K., Ssengooba, F., & Gilson, L. 2011. Building the field of
health policy and systems research: an agenda for action. PLoS.Med, 8, (8) e1001081 available from: PM:21918641
Berlan, D. & Shiffman, J. 2011. Holding health providers in developing countries accountable to
consumers: a synthesis of relevant scholarship. Health Policy Plan. Available from: PM:21551121
Bhojani, U., Thriveni, B., Devadasan, R., Munegowda, M., Anthonyamma, C., Soors, W., Devadasan, N.,
Criel, B., & Kolsteren, P. 2011. Health system obstacles in the delivery of quality care to people with chronic
disease (PWCD): a case study from urban India. Tropical Medicine & International Health, 16, (Supplement I) 346-
347
Bloom, G. & Standing, H. Pluralism and marketisation in the health sector: meeting needs in contexts of
social change in low- and middle-income countries. [136]. 2001. Brighton, Institute of Development Studies.
Working Paper.
Health, Culture and Society Volume 2, No. 1 (2012) | ISSN 2161-6590 (online) | DOI 10.5195/hcs.2012.71 | http://hcs.pitt.edu
Boussery, G., Campos da Silveria, V., & Criel, B. 2011, Harmonisation for Health in Africa. Community of Practive on the Service Delivery Practice Study of High Impact Interventions., Institute of Tropical Medicine
Antwerp.
Brinkerhoff, D. Accountability and Health Systems: Overview, Framework, and Strategies. 2003.
Bethesda, MD: The Partners for Health Reformplus Project, Abt Associates Inc.
Caudron, J., Ford, N., Henkens, M., Mace, C., Kiddle-Monroe, R., & Pinel, J. 2008. Substandard medicines
in resource-poor settings: a problem that can no longer be ignored. Trop.Med Int Health, 13, (8) 1062-1072 available
from: PM:18631318
Chenge, F., Van der Vennet, J., Porignon, D., Luboya, N., Kabyla, I., & Criel, B. 2010a. La carte sanitaire
de la ville de Lubumbashi, République Démocratique du Congo. Partie I: problématique de la couverture sanitaire
en milieu urbain congolais. Global Health Promotion, 17, (3) 63-74
Chenge, F., Van der Vennet, J., van Olmen, J., & Criel, B. Training of Medical Doctors in the DRC.
Consequences of uncontrolled creation of medical schools in the province of Katanga. 2010b. Antwerp, Institute of
Tropical Medicine. 22-6-2010b.
Evans, R. & Stoddart, G. 1990. Producing health, consuming health care. Social Science & Medicine, 31,
(12) 1347-1363 available from: PM:2126895
Freedman, L. 2005. Achieving the MDGs: Health systems as core social institutions. Development, 48, (1)
19-24
Frenk, J. 2010. The global health system: strengthening national health systems as the next step for global
progress. Plos Medicine, 7, (1) e1000089 available from: PM:20069038
Gilson, L. 2003. Trust and the development of health care as a social institution. Social Science & Medicine, 56, (7) 1453-1468 available from: PM:12614697
Gilson, L., Hanson, K., Sheikh, K., Agyepong, I., Ssengooba, F., & Bennett, S. 2011. Building the field of
health policy and systems research: social science matters. PLoS.Med, 8, (8) e1001079 available from:
PM:21886488
Gilson, L., Loewenson, R., Doherty, J., & Francis, V. 2007, Challenging Inequity through Health Systems. Final Report Knowledge Network on Health Systems., WHO Commission on the Social Determinants of Health.
Gilson, L., Palmer, N., & Schneider, H. 2005. Trust and health worker performance: exploring a conceptual
framework using South African evidence. Social Science & Medicine, 61, (7) 1418-1429 available from:
PM:16005777
The Health System Dynamics Framework Volume 2, No. 1 (2012) | ISSN 2161-6590 (online) | DOI 10.5195/hcs.2012.71 | http://hcs.pitt.edu
Hôpitaux Universitaires de Genève 2010, Geneva Health Forum 2010. Globalisation, Crisis and Health
Systems. Confronting Regional perspectives, Geneva.
Howie, J., Heaney, D., Maxwell, M., Walker, J., & Freeman, G. 2000. Developing a 'consultation quality
index' (CQI) for use in general practice. Family Practice, 17, (6) 455-461 available from: PM:11120715
Huber, M., Knottnerus, J., Green, L., van der Horst, H., Jadad, A., Kromhout, D., Leonard, B., Lorig, K.,
Loureiro, M., van der Meer, J., Schnabel, P., Smith, R., van, W.C., & Smid, H. 2011. How should we define health?
BMJ, 343, d4163 available from: PM:21791490
Institute of Medicine 2001. Crossing the quality chasm. A new health system for the 21st century. Washington, National Academy Press.
Kalk, A. 2011. The costs of performance-based financing. Bull. World Health Organ, 89, (5) 319 available
from: PM:21556295
Keugoung, B., Macq, J., Buve, A., Meli, J., & Criel, B. 2011. The interface between health systems and
vertical programmes in Francophone Africa: the managers' perceptions. Trop.Med Int Health, 16, (4) 478-485
available from: PM:21219552
Labonte, R., Mohindra, K., & Lencucha, R. 2011. Framing international trade and chronic disease. Global Health, 7, (1) 21 available from: PM:21726434
Laing, R., Hogerzeil, H., & Ross-Degnan, D. 2001. Ten recommendations to improve use of medicines in
developing countries. Health Policy and Planning, 16, (1) 13-20 available from: PM:11238425;
Marchal, B., Dedzo, M., & Kegels, G. 2010. A realist evaluation of the management of a well-performing
regional hospital in Ghana. Bmc Health Services Research, 10, 24 available from: PM:20100330
Marchal, B. & Kegels, G. 2003. Health workforce imbalances in times of globalization: brain drain or
professional mobility? International Journal for Health Planning & Management, 18 Suppl 1, S89-101 available
from: PM:14661944
Marchal, B., Van Dormael, M., Pirard, M., Cavalli, A., Kegels, G., & Polman, K. 2011. Neglected Tropical
Disease (NTD) control in health systems: the interface between programmes and general health services. Acta Tropica, (in press),
McPake, B., Matthews, Z., Channon, A., Hadi, Y., & Chattoe-Brown, A. 2009, Health Systems Typology,
HLSP, Southampton.
Meessen, B., Bigdeli, M., Chheng, K., Decoster, K., Ir, P., Men, C., & Van Damme W. 2011a.
Composition of pluralistic health systems: how much can we learn from household surveys? An exploration in
Cambodia. Health Policy Plan., 26 Suppl 1, i30-i44 available from: PM:21729915
Health, Culture and Society Volume 2, No. 1 (2012) | ISSN 2161-6590 (online) | DOI 10.5195/hcs.2012.71 | http://hcs.pitt.edu
Meessen, B., Kouanda, S., Musango, L., Richard, F., Ridde, V., & Soucat, A. 2011b. Communities of
practice: the missing link for knowledge management on implementation issues in low-income countries? Trop.Med Int Health available from: PM:21564426
Meessen, B., Soucat, A., & Sekabaraga, C. 2011c. Performance-based financing: just a donor fad or a
catalyst towards comprehensive health-care reform? Bull.World Health Organ, 89, (2) 153-156 available from:
PM:21346927
Michielsen, J., Meulemans, H., Soors, W., Ndiaye, P., Devadasan, N., De, H.T., Verbist, G., & Criel, B.
2010. Social protection in health: the need for a transformative dimension. Tropical Medicine & International Health available from: PM:20374560
Mills, A. 2011. Health policy and systems research: defining the terrain; identifying the methods. Health Policy and Planning available from: PM:21324972
Mills, A. & Ranson, M. K. 2006, "The design of health systems," In International public health: diseases, programs, systems, and policies, 2nd ed. M. H. Merson, R. E. Black, & A. Mills, eds., Sudbury: Jones and Bartlett
Publishers, pp. 513-551.
Narasimhan, V., Brown, H., Pablos-Mendez, A., Adams, O., Dussault, G., Elzinga, G., Nordstrom, A.,
Habte, D., Jacobs, M., Solimano, G., Sewankambo, N., Wibulpolprasert, S., Evans, T., & Chen, L. 2004.
Responding to the global human resources crisis. Lancet, 363, (9419) 1469-1472 available from:
ISI:000221130300022
Nishtar, S. 2010. The mixed health systems syndrome. Bull.World Health Organ, 88, (1) 74-75 available
from: PM:20428356
Ooms, G. & Hammonds, R. 2009. Scaling up global social health protection: prerequisite reforms to the
International Monetary Fund. International Journal of Health Services, 39, (4) 795-801 available from:
PM:19927417
Paina, L. & Peters, D. 2011. Understanding pathways for scaling up health services through the lens of
complex adaptive systems. Health Policy Plan. Available from: PM:21821667
Palmer, N., Mueller, D.H., Gilson, L., Mills, A., & Haines, A. 2004. Health financing to promote access in
low income settings-how much do we know? Lancet, 364, (9442) 1365-1370
Paris, V., Devaux, M., & Wei, L. Health Systems Institutional Characteristics: A Survey of 29 OECD
Countries. [50]. 2010. Paris, Organization for Economic Co-operation and Development. OECD Health Working
Papers.
The Health System Dynamics Framework Volume 2, No. 1 (2012) | ISSN 2161-6590 (online) | DOI 10.5195/hcs.2012.71 | http://hcs.pitt.edu
Parkhurst, J., Weller, I., & Kemp, J. 2010. Getting research into policy, or out of practice, in HIV? Lancet, 375, (9724) 1414-1415 available from: PM:20417842
Perez, D., Lefevre, P., Romero, M.I., Sanchez, L., De Vos, P., & Van der Stuyft, P. 2009. Augmenting
frameworks for appraising the practices of community-based health interventions. Health Policy and Planning, 24,
(5) 335-341 available from: ISI:000269001700003
Peters, D., El-Saharty, S., Siadat, B., Janovsky, K., & Vujicic, M. Improving Health Service Delivery in
Developing Countries. Peters, D., El-Saharty, S., Siadat, B., Janovsky, K., and Vujicic, M. 2010. Washington,
World Bank.
Peters, D. & Muraleedharan, V. 2008. Regulating India's health services: To what end? What future? Social Science & Medicine, 66, (10) 2133-2144 available from: PM:18313189
Potter, C. & Brough, R. 2004. Systemic capacity building: a hierarchy of needs. Health Policy and Planning, 19, (5) 336-345 available from: PM:15310668
Reddy, K., Shah, B., Varghese, C., & Ramadoss, A. 2005. Chronic diseases 3 - Responding to the threat of
chronic diseases in India. Lancet, 366, (9498) 1744-1749 available from: ISI:000233206400031;file://C:\JOSEFIEN
Persoonlijke documenten WERKSTATION\BIBLIOTHEEK\Chronic Diseases\Reddy_responding to threat CD
India_Lancete 2005.pdf
Reich, M. 2002. Reshaping the state from above, from within, from below: implications for public health.
Social Science & Medicine, 54, (11) 1669-1675 available from: PM:12113448
Reich, M. & Takemi, K. 2009. G8 and strengthening of health systems: follow-up to the Tokayo summit.
Lancet, 373, (9662) 508-515
Richard, F., Hercot, D., Ouédraogo, C., Delvaux, T., Samaké, S., van Olmen, J., Conombo, G., Hammonds,
R., & Vandemoortele, J. 2011. Sub-Saharan Africa and the Health MDGs: the need to move beyond the 'quick win'
model. Reproductive Health Matters, 19, (38) 42-55
Rifkin, S. 2001. Ten best readings on community participation and health. African Health Sciences, 1, (1)
42-45 available from: PM:12789133
Rifkin, S. 2003. A framework linking community empowerment and health equity: it is a matter of
CHOICE. J.Health Popul.Nutr., 21, (3) 168-180 available from: PM:14717563
Riley, J. 2008. Low income, social growth, and good health. Berkeley: University of California Press.
Roberts, M., Hsiao, W., Berman, P., & Reich, M. 2004a, "Financing," In Getting Health Reform Right. A Guide to Improving Performance and Equity, New York: Oxford University Press, pp. 153-189.
Health, Culture and Society Volume 2, No. 1 (2012) | ISSN 2161-6590 (online) | DOI 10.5195/hcs.2012.71 | http://hcs.pitt.edu
Roberts, M., Hsiao, W., Berman, P., & Reich, M. 2004b. Getting Health Reform Right. A Guide to Improving Performance and Equity New York, Oxford University Press.
Shakarishvili, G., Atun, R., Berman, P., Hsiao, W., Burgess, C., & Lansang, M. 2010. Converging Health
Systems Frameworks: Towards A Concepts-to-Actions Roadmap for Health Systems Strengthening in Low and
Middle Income Countries. Global Health Governance, III, (2)
Sheikh, K., Gilson, L., Agyepong, I., Hanson, K., Ssengooba, F., & Bennett, S. 2011. Building the field of
health policy and systems research: framing the questions. PLoS.Med, 8, (8) e1001073 available from:
PM:21857809
Unger, J. & Criel, B. 1995. Principles of Health Infrastructure Planning in Less-Developed-Countries.
International Journal of Health Planning and Management, 10, (2) 113-128 available from: ISI:A1995RJ13700004
Unger, J., De Paepe, P., Buitron, R., & Soors, W. 2008. Costa Rica: Achievements of a heterodox health
policy. American Journal of Public Health, 98, (4) 636-643 available from: ISI:000254595500018
Unger, J., De Paepe, P., & Green, A. 2003a. A code of best practice for disease control programmes to
avoid damaging health care services in developing countries. International Journal of Health Planning and Management, 18, S27-S39 available from: ISI:000186662200003
Unger, J., Marchal, B., & Green, A. 2003b. Quality standards for health care delivery and management in
publicly oriented health services. International Journal of Health Planning and Management, 18, S79-S88 available
from: ISI:000186662200007
Van Damme, W., Pirard, M., Assefa, Y., & van Olmen, J. Which Health Systems for Disease Control?
How can Disease Control Programs contribute to Health Systems Strengthening in sub-Saharan Africa? [1]. 2011a.
Antwerp, Institute of Tropical Medicine. Studies in Health Services Organization and Policy. Working Papers.
Decoster, K., Marchal, B., Soors, W., van Olmen, J., and Van Damme W. 24-6-2011a.
Van Damme, W., Pirard, M., Assefa, Y., & van Olmen, J. Which Health Systems for Disease Control?
How can Disease Control Programs contribute to Health Systems Strengthening in sub-Saharan Africa? [1]. 2011b.
Antwerp, Institute of Tropical Medicine. Studies in Health Services Organization and Policy. Working Papers.
Decoster, K., Marchal, B., Soors, W., van Olmen, J., and Van Damme W. 24-6-2011b.
van Olmen, J., Criel, B., Devadasan, N., Pariyo, G., De Vos, P., Van Damme, W., Van Dormael, M.,
Marchal, B., & Kegels, G. 2010a. Primary Health Care in the 21st century: primary care providers and people's
empowerment. Tropical Medicine & International Health, 15, (4) 386-390
The Health System Dynamics Framework Volume 2, No. 1 (2012) | ISSN 2161-6590 (online) | DOI 10.5195/hcs.2012.71 | http://hcs.pitt.edu
van Olmen, J., Criel, B., Van Damme, W., Marchal, B., Van Belle, S., Van Dormael, M., Hoeree, T.,
Pirard, M., & Kegels, G. Analysing Health Systems to Make Them Stronger. [27]. 2010b. Antwerpen, ITG Press.
Studies in Health Services Organization & Policy. Van Lerberghe, W., Kegels, G., and De Brouwere, V.
World Bank 2004a, "Health and Nutrition Services," In World Development Report 2004, S. Devarajan,
ed., pp. 133-158.
World Bank. World Development Report 2004. Making services work for poor people. 2004b.
World Health Organization. Constitution of the World Health Organization. 1946.
World Health Organization 2000, The World Health Report 2000. Improving Performance, World Health
Organization, Geneva.
World Health Organization 2005, Preparing a Health Care Workforce for the 21st Century: The Challenge of Chronic Conditions, WHO, Geneva.
World Health Organization 2007, Everybody's Business. Strengthening Health Systems to Improve Health Outcomes. WHO's Framework for Action., WHO, Geneva.
World Health Organization The World Health Report 2008. Primary Health Care. Now more than Ever.,
Geneva: WHO.
World Health Organization. Toolkit on monitoring health systems strengthening. WHO . 2008b. WHO.
17-3-2009b.
World Health Organization 2009, Systems Thinking for Health Systems Strengthening Geneva.
World Health Organization 2010, World Health Report 2010. Health systems financing: the path to universal coverage, World Health Organization, Geneva.
World Health Organization, C. o. S. D. o. H. 2008c, Closing the gap in a generation: Health equity through action on the social determinants of health. Executive summary, World Health Organization, Geneva.
World Health Organization. Regional Office for Africa 2009, First African Medicines Regulatory Authorities Conference. Final Report, World Health Organization. Regional Office for Africa, Brazzaville.
8. Challenges in organizing quality diabetes care for the urban poor: a local health system perspective – an abstract published in the BMC Proceedings
ORAL PRESENTATION Open Access
Challenges in organizing quality diabetes care forthe urban poor: a local health system perspectiveUpendra Bhojani1,2*, BS Thriveni1, Roopa Devadasan1, CM Munegowda1, Amruthavalli1, Narayanan Devadasan1,Bart Criel2, Patrick Kolsteren2
From 2nd National Conference on bringing Evidence into Public Health Policy (EPHP 2012)Bangalore, India. 05-06 October 2012
IntroductionIndia is urbanizing at a rapid pace. Moreover, a quarter ofthe urban population lives in slum areas [1]. Unfavorablesocial determinants in health and huge inequities in accessto healthcare within urban India leave the urban poor withdismal health indicators [2]. The burden from chronic dis-eases is also on rise in India, disproportionately so forurban population, and is now the leading cause of deaths[3,4]. India is leading the diabetes epidemic in the world[5]. In urban south India, diabetes prevalence is on a rapidrise (from 5% in 1984 to 13.9% in 2000) [6].There has been a growing concern among public health
researchers/programmers regarding the neglect of urbanpoor in governments’ health policies/programs [7,8]. Thegovernment health services remain primarily orientedtowards management of acute episodes [9]. In this study,we analyze a local health system in Bangalore’s KG Hallineighborhood, identify the main challenges in organizingthe quality diabetes care, and discuss the way forward. KGHalli has a population of over 44,500 with one notifiedslum area. The median per-capita income is INR 2200/month.
MethodsKG Halli is the field site of the Urban Health ActionResearch Project (UHARP) designed and implemented bythe Institute of Public Health (IPH). Its purpose is toenhance access to quality healthcare for the KG Halliresidents.We used the data collected over a period of almost
four years (2009-2012) through following tools:(1) A census covering 9,299 households with a
response rate of 98.5% in KG Halli using a structured
questionnaire collecting data about socio-demographicfactors, self-reported illnesses, healthcare seeking beha-vior and expenditure;(2) Audio recordings of six of the periodic meetings of
healthcare providers in KG Halli, facilitated under theUHARP;(3) Field notes from UHARP researchers; and(4) In-depth interviews with eight diabetes patients
(sampled purposively to capture diverse experiences ofhealthcare seeking and living with diabetes), and semi-structured interviews with 14 healthcare providers, stafffrom two pharmacies and two laboratories in KG Halli(to understand organization of diabetes care, challengesand suggestions for improving diabetes care).For the survey, interviews, and meetings, an informed
consent was obtained prior to collecting data. We usedthe health system dynamics framework developed by VanOlmen et al [10] as analytical framework to structure ourfindings. Quantitative data were analyzed using STATAwhile thematic analysis was done for qualitative data.
ResultsMixed healthcare provisionOf the two government facilities in the area, the Com-munity Health Center (CHC), run by the state govern-ment, provides care for diabetes. In the private sector,there are at least 18 doctor clinics, four hospitals, threelaboratories, and many pharmacies. These clinics arestaffed by general practitioners (GPs) who reported theirtraining being in various medical systems; modern medi-cine (four), unani (eight), ayurveda (four), homeopathy(one) and others.
Stewardship/regulationThere is a lack of administrative and operational integra-tion across providers. Only two of the private providers
* Correspondence: [email protected] of Public Health, Bangalore, IndiaFull list of author information is available at the end of the article
Bhojani et al. BMC Proceedings 2012, 6(Suppl 5):O13http://www.biomedcentral.com/1753-6561/6/S5/O13
© 2012 Bhojani et al; licensee BioMed Central Ltd. This is an Open Access article distributed under the terms of the Creative CommonsAttribution License (http://creativecommons.org/licenses/by/2.0), which permits unrestricted use, distribution, and reproduction inany medium, provided the original work is properly cited.
were aware of and registered under the Karnataka PrivateMedical Establishment Act (KPMEA), a mandatorymechanism to ensure minimum quality in private health-care provision. All GPs, except for three who were nottrained in modern medicine, were practicing modernmedicine. None of the providers interviewed were awareof the standard treatment guidelines for diabetes devel-oped at national level. Both interviewees who were mana-ging private pharmacies were untrained pharmacists.Pharmacies and laboratories interviewed reported thepractice of kickbacks (10 to 25% of investigation or medi-cation costs) given by them (and other laboratories/phar-macies) to most GPs in the area.
Human-resource/technology/infrastructureMedical specialists were available with prior appointmentin hospitals. The CHC, which is supposed to provide spe-cialist care, neither had specialist services nor offeredlaboratory investigations for diabetes. Other factorsaffecting diabetes care at CHC included the frequentstock-outs of diabetes medicines and the limited avail-ability of medical doctors due to frequent deputationsand/or turnover. For primary care on an outpatient basis,only five GPs followed some form of medical record sys-tem aimed at organizing clinical information over thetime. Most GPs prescribed branded medicines andreported negative perceptions of generic medicines (‘notsafe’, ‘not as effective as branded medicines’). Thoughgeneric medicines were available at some of the privatepharmacies, the cost was comparable to that of brandedmedicines.
FinancesOver 85% of diabetes patients sought care form privateproviders that operate on fee-for-service basis. 72% of dia-betes patients incurred out-of-pocket (OOP) expenditurefor outpatient care and of those 22% spent over 10% oftheir family income on diabetes care. In 3.3% of the epi-sodes, families resorted to borrowing money and/or sellingassets.People’s participation in the health system was limited to
exercising choice in selecting providers, self-care/medica-tion, and funding the system. Public and private orienta-tion to healthcare delivery coexisted with dominance ofthe latter one.
DiscussionSome of the challenges highlighted in this paper (e.g.,availability of human resource/medicines/laboratorywithin government sector) are not unique to KG Halli,but affects the government system as a whole. TheNational Rural Health Mission launched in 2005, aims toaddress these challenges. Unfortunately, the NationalUrban Health Mission, an initiative similar to its rural
counterpart for urban areas, has remained in draft stagesince 2010.Considering the dominant presence and utilization by
diabetes patients of poorly regulated private providers,there is need to enhance the implementation of the exist-ing regulatory mechanisms e.g. KPMAE. In a pluralisticmedical system like the one in KG Halli, there is need forsome sort of steering mechanism that enhances coordi-nation across health providers and directs the systemtowards a common goal. The UHARP has been facilitat-ing actions in this direction with some positive outputsincluding enhanced coordination and collaborationacross the providers in addressing local health issues.High OOP spending and related impoverishment
implies the need for financial protection mechanisms.Expanding the coverage of existing schemes (like RastriyaSwasthya Bima Yojana) to include urban poor, as well asthe service package to include outpatient care for chronicconditions might significantly reduce OOP payments.Motivating providers to prescribe generic medicinesthrough various mechanisms (e.g. incentivizing, changingthe perceptions about generic medicines through effec-tive knowledge dissemination) and making generic medi-cines available at low prices are other ways of reducingOOP spending. Karnataka government has recentlyimplemented a pilot making generic medicines availableat low prices at selected tertiary government hospitals.Expansion of such schemes and making outlets withinthe community would be a positive step.
Funding statementThe UHARP is funded by the Sir Dorabaji Tata Trust,MISEREOR, and by the Directorate-General for Devel-opment Cooperation and Humanitarian Aid (DGD),Government of Belgium, through the institutional colla-boration between the Institute of Public Health, Banga-lore and the Institute of Tropical Medicine, Antwerp.The first author is supported by a PhD scholarship fromthe Institute of Tropical Medicine, Antwerp under theDGD grant mentioned above.
Author details1Institute of Public Health, Bangalore, India. 2Department of Public Health,Institute of Tropical Medicine, Antwerp, Belgium.
Competing interestsThe first five authors are part of the team implementing the Urban HealthAction Research Project in KG Halli, Bangalore.
Published: 28 September 2012
References1. National Building Organisation: Report of the committee on slum
statistics/census. New Delhi: Ministry of Housing and Urban Poverty,Government of India; 2010 [http://www.mhupa.gov.in/W_new/Slum_Report_NBO.pdf], (accessed 25 July 2012).
Bhojani et al. BMC Proceedings 2012, 6(Suppl 5):O13http://www.biomedcentral.com/1753-6561/6/S5/O13
Page 2 of 3
2. Agarwal S: The state of urban health in India: comparing the poorestquartile to the rest of the urban population in selected states and cities.Environment & Urbanization 2011, 23(1):13-28.
3. Reddy KS, Shah B, Varghese C, Ramadoss A: Responding to the threat ofchronic diseases in India. Lancet 2005, 366:1744-1749.
4. Gupta A, Ahuja R: Disease burden in Urban India. In India Health Beat.Public Health Foundation of India & Health, Nutrition and Population Unitof the World Bank;Forgia GL, Rao KD 2010:.
5. Shaw JE, Sicree RA, Zimmet PZ: Global estimates of the prevalence ofdiabetes for 2010 and 2030. Diabetes Res Clin Pract 2010, 87(1):4-14.
6. Ramachandran A: A breeding ground for diabetes. Diabetes Voice 2002,47(1):18-20.
7. Agarwal S, Sangar K: Need for dedicated focus on urban health withinNational Rural Health Mission. Indian J Public Health 2005, 49(3):141-51.
8. Yadav K, SV N, Pandav CS: Urbanization and health challenges: need tofast track launch of the National Urban Health Mission. Indian JCommunity Med 2011, 36(1):3-7.
9. Venkataraman K, Kannan AT, Mohan V: Challenges in diabetesmanagement with particular reference to India. Int J Diabetes Dev Ctries2009, 29(3):103-9.
10. Van Olmen J, Criel B, Bhojani U, Marchal B, Van Belle S, Chenge MF,Hoerée T, Pirard M, Van Damme W, Kegels G: The Health SystemDynamics Framework: The introduction of an analytical model for healthsystem analysis and its application to two case-studies. Health, Cultureand Society 2012, 2(1).
doi:10.1186/1753-6561-6-S5-O13Cite this article as: Bhojani et al.: Challenges in organizing qualitydiabetes care for the urban poor: a local health system perspective. BMCProceedings 2012 6(Suppl 5):O13.
Submit your next manuscript to BioMed Centraland take full advantage of:
• Convenient online submission
• Thorough peer review
• No space constraints or color figure charges
• Immediate publication on acceptance
• Inclusion in PubMed, CAS, Scopus and Google Scholar
• Research which is freely available for redistribution
Submit your manuscript at www.biomedcentral.com/submit
Bhojani et al. BMC Proceedings 2012, 6(Suppl 5):O13http://www.biomedcentral.com/1753-6561/6/S5/O13
Page 3 of 3

9. Health systems obstacles in the delivery of quality care to people with chronic diseases (PWCD): a case study from urban India – an abstract published in the Tropical Medicine and International Health
total of 21 districts in East Nusatenggara which see one outcomeof health system performance on accessibility. Mixed methodswere used to collect data including document review, observationsand review of routine health information.
RESULTS The complimentary approach which focus the HRdevelopment on quantity and quality has shown a positive resultwith 33% of first line facilities have an appropriate staff accordingto local standard. After a series of training and regular evaluation,a post training evaluation report shown an average percentage ofstaff who is competence on basic maternity skills is 43–67%.Preference of mother in using a midwife for basic maternity servicehas increase to 72.5% (from 36.5% in 2007). Province widefacility birth in 2010 is 24.2%, while facility birth on thesupported area has reach 87%.
CONCLUSIONS Place for maternal and newborn death are stilldominated by non facility based. Ensuring the availability of keyhealth human resources at the first line level, could increase theconfident and acceptability by community. But with the highdemand of midwives from East Timor, there is a need for properHR planning to ensure a longer retention.
4.3-028Lessons learned from an organisation-wide policy changewithin an international non-governmental organisation:process and issues linked to the removal of user fees withinmsf supported health servicesM. M. Philips, F. Ponsar and S. Gerard
Medecins Sans Frontieres, Brussels, Belgium
INTRODUCTION With its main focus on crisis, Medecins SansFrontieres (MSF) intervenes also in situations of post-conflict orextreme health gaps, with 60% in Sub Saharan Africa. In 2003MSF adopted a policy change, committing to provide care withoutrequiring patient payments. The experience of how to conduct afundamental and organisation-wide policy change on user fees canbe of use to other international organisations.
METHODS AND MATERIALS A description of the process of policychange is made, with identification of key elements and moments,organisational changes required, operational consequences andimpact on interventions and health status. During the eighties andnineties, co-payment was accepted in most public health servicessupported by MSF, if certain pre-conditions and implementationmodalities to assure equitable access were present. Followingincreasing problem reporting in terms of accessibility, affordabilityand perverse effects on quality of care, a policy change wasformalised in 2003. This policy paper stated the abolition of directpatient payments in all MSF supported health care.
RESULTS The following tools proved useful in the process: (i)Systematic review of accessibility situation in MSF supportedhealth services to obtain an objective measure of the degree ofproblems; (ii) Practical support during implementation in terms oforganisation and planning of additional resources; also monitoringtools were provided; (iii) Intensive briefings and discussions toobtain organisational buy in at all levels; (iv) At project andcountry level argumentation briefs and scientific literature wereprovided for use with health authorities and other organisations.Lessons learned from the process: (i) Population based measure-ment of access was key to obtaining a realistic perspective ofaccess, as only way to measure non-use of available health services.The usual classification based on crisis situation showed itslimitations. Post-conflict contexts showed prolonged high mortal-ity and financial access problems, but so called ‘stable’ areas,without any history of conflict – showed equally bad under fivemortality indicators; (ii) Many assessments focus on affordabilityof care in terms of willingness to pay or avoiding catastrophic
health expenses. MSF’s experience showed the importance ofexclusion/deterrence from utilisation and the important financialobstacles linked to relatively small fees for primary health care; (iii)Increased utilisation rates allowed better assessment of the realdisease burden in the community; (iv) Several population assess-ments post-abolition of user fees, show a significant reduction ingeneral and child mortality.
CONCLUSIONS For international organisations that support existingpublic health services, assurance of financial access is crucial, as itis key to reach those people most in need of care. Without this,additional resources mobilised by or through the organisation, aretrapped in inaccessible health facilities, channelled to the betteroff. For reasons of medical quality, effectiveness at populationlevel and accountability, abolition of user fees is an importantpolicy decision for international health organisations.
4.3-029Reorganization of provincial level of health system in NorthKivu and oriental Kasaı, democratic Republic of CongoJ.-B. Kahindo, M. Bonami, E. Godelet, G. Fonteyne, A. Wodon and C. Schirvel
CEMUBAC, Brussels, Belgium
INTRODUCTION In the framework of implementation of healthsystem straightening in DR Congo, and in a context ofdecentralization dictated by the National Constitution, reflexionwork has been initiated based on essentials functions of healthsystem’s provincial level in two different provinces in the country.
METHODS Two years multidisciplinary action research led in foursteps: (i) socio-anthropologic investigation on plans put in place inhealth provincial division (HPD); (ii) reflexion and analysisworkshop around specific plans; (iii) joint elaboration (experts andHPD) of a new organization chart based on four specificprofessions; and (iv) definition of this four professions (containsand organization).
RESULTS This action research gave rise to function plans put inplace by HPD in order to develop a more participative manage-ment and to compensate for the weakness of structural organiza-tion. Experts backed HPD for the implementation of a newstructure likely to institutionalize this new participative manage-ment. The latter is based on four professions: (i) health districtsupport; (ii) control and inspection; (iii) information, commu-nication and research and (iv) management. HPD and expertsdrew up profession definition, competences description. Resultswere presented at national level and have been integrated in thenew health development plan.
CONCLUSIONS Apart concrete result obtained, additionally, adoptedapproach – focused on apprenticeship and organizational devel-opment – has contributed to dynamize provincial level essentialsfunctions. Two major challenges have to be taken up: (i) supportHPD transformation from actual situation to the new model and(ii) spread this new model to the others provinces, according to thesame participative approach, successful condition to adjust theorganization chart at the context.
4.3-030Health systems obstacles in the delivery of quality care topeople with chronic diseases (PWCD): a case study fromurban IndiaU. Bhojani1, B. S. Thriveni1, R. Devadasan1, M. S. Munegowda1, C.AnthonyAmma1, W. Soors2, N. Devadasan1, B. Criel2 and P. Kolsteren21Institute of Public Health, Bengaluru, India; 2Institute of TropicalMedicine, Antwerp, Belgium
INTRODUCTION India is undergoing a rapid epidemiologic transitionwith chronic diseases now constituting a leading cause of deathand suffering. Delivering an appropriate response to this rising
Tropical Medicine and International Health volume 16 suppl 1 pp 97–384 october 2011
Abstracts of the 7th European Congress on Tropical Medicine and International Health
ª 2011 The Authors346 Tropical Medicine and International Health ª 2011 Blackwell Publishing Ltd, 16 (Suppl. 1), 97–384

burden implies health systems strengthening. We analysed thestructure and functioning of the Local Health System (LHS) in thepoor urban neighbourhood of KG Halli (Bangalore) in order toidentify its principal weaknesses in providing quality care toPWCD.
METHODS We applied the health-system analysis frameworkdeveloped by Van Olmen et al. to the situation of KG Halli usingdata generated over a period of 2 years through (i) a householdcensus (n = 9299, response rate = 98.5%) using a questionnaire onsocio-demographic characteristics, illness profile, health seekingbehaviour, and healthcare expenditure; (ii) mapping and inter-viewing healthcare providers (n = 24); and (iii) observational field-notes. Document analysis and STATA were used to analyse data.
RESULTS The KG Halli LHS faces poor operational and adminis-trative integration across public and private healthcare providers.Most resources including trained personnel, laboratory andpharmacy support lie in a poorly regulated private sector thatcares-on a fee-for-service basis – for more than 80% of PWCD.Lack of gate-keeping at the primary care level leads to hospitalsmanaging almost 60% of PWCD. These inefficiencies contribute tohave one out of four families experiencing catastrophic expendi-ture (>10% of household income) in ambulatory care alone. Allthe preceding factors, plus poor referral and information systems,negatively affect continuity and effectiveness of care, with a highhospitalisation rate of 191.4/1000 per year in PWCD, pointing todelays in receiving adequate care at the primary care level. Thegeographical delimitation of the population of responsibility of thepublic facilities in the KG Halli area is inappropriate; among theprivate providers, the notion of a ‘population of responsibilitya’ issimply not taken into consideration. Contextual factors like rapidurbanisation and internal migration pose additional challenges.
CONCLUSION The KG Halli LHS not only responds poorly to needsof PWCD but also causes them considerable impoverishment.Rising chronic disease burden provides an opportunity to re-examine organisation and performance of health systems. Astructured analysis allows identification of the main obstacles toovercome.
4.3-031Chinese immigrants in a southern area of Madrid:hospitalization pattern and comparison with other immigrantgroupsB. C. Jimenez, J. M. Ruiz-Giardin, A. M. Barrios, J. V. San Martin, N. Cabello,E. Canalejo and J. HinojosaUniversity Hospital Fuenlabrada, Madrid, Spain
BACKGROUND Chinese immigration to large cities in Spain hasincreased in the last decades. It is believed that they use nationalhealth care facilities less frequently and differently to otherimmigrants. The aim of this study was to describe the pattern ofhospitalization among Chinese as compared to other immigrantgroups in a general hospital attending a large proportion of foreignpopulation.
METHODS Review of hospitalization of Chinese immigrants at theUniversity Hospital Fuenlabrada, Madrid, period January 2006–June 2009. Description of patients¢ characteristics and hospitali-zation pattern using variables included in the Minimum Basic DataSet and the Diagnosis Related Groups (DRG) classification.Comparison with Latin-American (LAm), African (A), andEuropean (E) immigrants.
RESULTS Chinese (159), LAm (1705), A (1931) and E (1022)accounted for 4817 (8.7%) of all admissions. Average age: Chinese30 years (LAm 33; A 34.1; E 35 all P < 0.01), 88% women (LAm75%; A 78%; E 69% all P < 0.05). Departments: 79% obstetrics(LAm 48%; A 52.6%; E 45.3% all P < 0.01), 4.4% general
surgery (LAm 10.9% P = 0.09; A 5.3% P = 0.6; E 7.4% P = 0.16)4.4% internal medicine (LAm 14.54%; A 17.1%; E 18.8% allP < 0.01) 3.1% gastroenterology (LAm 2.8%; A 2.6%; E 4.1% allP > 0.5). Main DRG¢s: Vaginal delivery (VD) without complica-tions (C) (40.9%), (VD) with (C) (27%), cesarean section without(C) (6.1%), (VD) with sterilization (1.9%), disorders of pancreasexcept malignancy (1.9%), gastrointestinal hemorrhage (1.3%),kidney/urinary tract infection(1.3%). Mean length of stay3.17 days (LAm 4.2; A 5.1; E 4.85 all P < 0.01)
CONCLUSIONS The hospitalization pattern of Chinese patients in oursetting differs from that of other major immigrant groups. Theyare young women admitted to obstetric wards during labour,resulting in vaginal deliveries and short lengths of stay. Admissionto internal medicine and general surgery is significantly lessfrequent as compared to all groups and to LAm, respectively.
4.3-032Sustaining community midwives for quality maternalservices: an experience from a project in a rural area ofBangladeshS. Hoque, M. Iqbal, S. M. A. Hanifi, A. Moula and A. Bhuiya
ICDDR, B-Centre for Health and Population Research, Dhaka, Bangladesh
INTRODUCTION Bangladesh has been a serious shortage of qualifiedhealth workers at all levels. The shortage of nurses and midwiferystaff is particularly acute. In view of this shortage and hugedemand for services, informal providers emerged as the largestgroup. In 1994 ICDDR, B initiated a community based primaryhealth care project in Chakaria, a remote rural area of Bangladeshin an attempt to ensure quality services to the villagers.
MATERIAL AND METHODS The project involved in training of locallyrecruited 13 females as community health workers for disseminatehealth messages which they did till 1998. In 1998 to 2001 theywere trained as community midwives in five batches through aresidential course of 3 months. On the job training on midwiferyalso continued by the project physician twice a month. Thecommunity midwives provided services from seven village healthpost established by the villagers 6 days a week, performed ANC,home delivery and PNC, refer complicated cases to the physicianattending once a week at village health post and other public/private providers. In January 2006 the community midwives werereleased from ICDDR, B paid service with an arrangement thatICDDR, B will only reimburse for safe delivery services theyprovide to the women from lowest two asset quintiles. From 2009ICDDR, B has discontinued reimbursement for the serviceprovided by the community midwives. Data from the ChakariaHealth and Demographic Surveillance System of 2005 and 2010were used for comparing the performance of midwives.
RESULTS As of now, all midwives could sustain at their professionwithout further support from the project. HDSS data shows theperformance of midwives remains same in 2010 compared to2005.
CONCLUSION The most important factors that contributed insustaining midwives in their profession included communityinvolvement in the process, quality of training they had receivedand services they provide, raising their profile and providingprofessional and financial support by ICDDR, B, for an initialperiod of time, continuous linkage with ICDDR, B physician forconsultation mostly through mobile phone, and clear vision ofmaking them sustainable from the beginning. In settings with acuteshortage of health manpower locally recruited females should betrained to fill up the shortage of maternal service providers.
Tropical Medicine and International Health volume 16 suppl 1 pp 97–384 october 2011
Abstracts of the 7th European Congress on Tropical Medicine and International Health
ª 2011 The AuthorsTropical Medicine and International Health ª 2011 Blackwell Publishing Ltd, 16 (Suppl. 1), 97–384 347