Thesis Annemarie Nadort Tcm119 447105
179
The Hand Vein Pattern Used as a Biometric Feature Master Literature Thesis by Annemarie Nadort Amsterdam - May 2007
-
Upload
naveen-kumar -
Category
Documents
-
view
51 -
download
5
description
Hand vein pattern based verification
Transcript of Thesis Annemarie Nadort Tcm119 447105
The Hand Vein Pattern Used as a Biometric Feature
Master Literature Thesis by
Annemarie Nadort
Amsterdam - May 2007

I
The Hand Vein Pattern Used as a Biometric Feature – Annemarie Nadort
The Hand Vein Pattern Used as a Biometric Feature
Author: Annemarie Nadort
Context: Literature thesis for Master of Science programme Physics of Life, research master of study
Medical Natural Sciences at the Free University, Amsterdam
Supervisor: dr. ing. Zeno J.M.H. Geradts
Forensic scientist Image Analysis and Biometrics / R&D coordinator
Digital evidence and Biometrics
Nederlands Forensisch Instituut / Netherlands Forensic Institute
Ministerie van Justitie / Ministry of Justice
Den Haag / The Hague, The Netherlands
Second reviewer: Prof.dr. R.M. Heethaar
Head of dep. Physics and Medical Technology
VU Medisch Centrum / VU Medical Centre
Amsterdam, The Netherlands
Amsterdam, May 2007
Image on cover adapted from [1], figure 2

II
The Hand Vein Pattern Used as a Biometric Feature – Annemarie Nadort
III
The Hand Vein Pattern Used as a Biometric Feature – Annemarie Nadort
I. SUMMARY
The problem of truly identifying individuals in our society has become bigger in recent years,
due to our complex, mobile and vastly interconnected information society. The most secure way of
identifying people is said to be the verification of a concrete entity, inherently belonging to this
person: something that he is or that he does. This is what biometrics is: the automated use of
physiological or behavioural characteristics to determine or verify identity. The security of biometric
identification has however been questioned, especially for established techniques like fingerprint
verification. A relatively new biometric feature is the hand vein pattern. The Netherlands Forensic
Institute is interested in biometric identification/verification methods and evaluates new biometric
developments with regard to the technical and legal aspects of the method. Part of the evaluation
programme is this literature study, which addresses the properties of the hand vein pattern in the
context of biometric verification and identification.
The literature research is subdivided in three sections. The first section describes the physiological and
physical properties of the hand vascular system: its uniqueness, time-invariance, optical properties and
vein imaging methods. The pattern is highly variable amongst people, although not proven to be
unique. The permanence and stability of the vein pattern are assessed: several circumstances cause the
pattern to change. It depends on the matching process whether the changes are significant for
performance of the biometric devices. Two imaging techniques can be distinguished: capturing
naturally emanating thermal radiation from the hand and illuminating the hand with an infrared light
source and capturing reflected radiation. The second part describes how the biometric devices work,
that process the hand vein pattern for verification. Several patents, papers and websites of commercial
biometric companies and scientific studies on hand vein pattern verification have been assessed, to
give an overview of techniques that have been used in this field. Many different ways exist to extract
the features of a vein pattern from an original image of the veins, to obtain a representation of the hand
vein pattern only. The next step is to match this vein pattern to a previously stored template vein
pattern of this person. Due to several causes for variance in vein pattern images of the same hand, the
matching process should allow some misalignment. On the other hand it should be strict enough to
reject non-similar vein patterns. Because identification is typically used in security contexts the
devices are susceptible to attacks from impostors. The defence of the devices can rely on incorporating
a liveness detector in the method to verify whether the vein pattern belongs to a living hand. Although
many liveness detecting techniques are mentioned in the third subsection of this thesis, biometric
devices will never be spoof-proof. In addition, matching algorithms can make matching errors.
However, biometric vein pattern verification can be an appropriate tool to protect access to private
areas, as long as one knows the vulnerabilities and subsequently adapts the biometric system design.

IV
The Hand Vein Pattern Used as a Biometric Feature – Annemarie Nadort
V
The Hand Vein Pattern Used as a Biometric Feature – Annemarie Nadort
II. INDEX
I. SUMMARY ..................................................................................................................... III II. INDEX .............................................................................................................................. V III. DEFINITIONS ............................................................................................................. IX
Defining the subject ............................................................................................................. IX List of definitions .................................................................................................................XI
1 INTRODUCTION.............................................................................................................. 2 1.1 Biometrics .................................................................................................................. 4 1.2 Biometric properties hand vein pattern ...................................................................... 5 1.3 Goal ............................................................................................................................ 6
2 VEINS AS A BIOMETRIC FEATURE ............................................................................ 8 2.1 Uniqueness ................................................................................................................. 8
2.1.1 Vascular Development ....................................................................................... 8 2.1.2 Spatial arrangement.......................................................................................... 10
2.2 Time-invariance ....................................................................................................... 14 2.2.3 Natural vascular changes – healthy life............................................................ 14 2.2.4 Natural vascular changes – associated with disease......................................... 16 2.2.5 Drug based or surgical vascular changes ......................................................... 18
2.3 Optic properties tissue and blood ............................................................................. 20 2.3.1 Natural radiation............................................................................................... 20 2.3.2 Reflected radiation ........................................................................................... 22 2.3.3 Photon diffusion theory.................................................................................... 22
2.4 Vein Imaging............................................................................................................ 25 2.4.1 Near infrared imaging ...................................................................................... 25 2.4.2 Mid infrared imaging ....................................................................................... 26 2.4.3 Optical filters.................................................................................................... 28
2.5 Discussion ................................................................................................................ 30 2.5.1 Uniqueness ....................................................................................................... 30 2.5.2 Time invariance................................................................................................ 31 2.5.3 Optical properties and vein imaging ................................................................ 32
3 BIOMETRIC DEVICES .................................................................................................. 36 3.1 Commercial literature............................................................................................... 36
3.1.1 Veins in back of the hand................................................................................. 36 3.1.2 Veins in palm of hand ...................................................................................... 44 3.1.3 Veins in finger .................................................................................................. 46 3.1.4 Veins in wrist ................................................................................................... 56
3.2 Scientific Literature.................................................................................................. 58 3.2.1 Veins in back of hand....................................................................................... 58 3.2.2 Veins in palm of hand ...................................................................................... 72 3.2.3 Veins in finger .................................................................................................. 74
3.3 Discussion ................................................................................................................ 80 3.3.1 Image capturing................................................................................................ 84 3.3.2 ROI determination............................................................................................ 85 3.3.3 Image processing.............................................................................................. 86 3.3.4 Vein feature extraction ..................................................................................... 88 3.3.5 Vein feature matching ...................................................................................... 90 3.3.6 Performance ..................................................................................................... 92 3.3.7 Speed .............................................................................................................. 104

VI
The Hand Vein Pattern Used as a Biometric Feature – Annemarie Nadort
VII
The Hand Vein Pattern Used as a Biometric Feature – Annemarie Nadort
4 LIFENESS DETECTION .............................................................................................. 106 4.1 Principles of liveness detection .............................................................................. 108 4.2 Liveness detection in hand vein pattern recognition systems ................................ 112
4.2.1 Challenging the systems................................................................................. 112 4.2.2 Applied liveness detection?............................................................................ 114 4.2.3 Thermal imaging ............................................................................................ 114 4.2.4 Methods for liveness detection....................................................................... 115
4.3 Intrinsic Properties ................................................................................................. 116 4.3.1 Liveness inherent to biometric feature ........................................................... 116 4.3.2 Using extra hardware ..................................................................................... 118
4.4 Involuntary signals ................................................................................................. 124 4.4.1 Liveness inherent to biometric feature ........................................................... 124 4.4.2 Additional hardware ....................................................................................... 124
4.5 Bodily response ...................................................................................................... 132 4.5.1 Using additional algorithm............................................................................. 132 4.5.2 Additional hardware ....................................................................................... 132
4.6 Other methods to limit spoofing............................................................................. 134 4.6.1 Combination of multiple methods.................................................................. 134 4.6.2 Multiple entrees.............................................................................................. 134 4.6.3 Multiple templates.......................................................................................... 134 4.6.4 Combination with other authenticity cues...................................................... 134 4.6.5 Supervising..................................................................................................... 135
4.7 More spoofing risks................................................................................................ 136 4.7.1 Attack via USB port ....................................................................................... 136 4.7.2 Attack via data base........................................................................................ 136
4.8 Discussion .............................................................................................................. 138 4.8.1 Liveness detection related to biometric verification ...................................... 138 4.8.2 Other threats ................................................................................................... 139 4.8.3 Critical Issues ................................................................................................. 139
5 Final discussion and conclusion..................................................................................... 142 5.1 On the sub questions .............................................................................................. 142 5.2 On the main question.............................................................................................. 148
6 Acknowledgement.......................................................................................................... 150 7 References ...................................................................................................................... 152 8 APPENDIX A ................................................................................................................ 162
8.1 Hand vein pattern spoofing .................................................................................... 162

VIII
The Hand Vein Pattern Used as a Biometric Feature – Annemarie Nadort
Definitions IX
The Hand Vein Pattern Used as a Biometric Feature – Annemarie Nadort
III. DEFINITIONS
Defining the subject
This thesis is on hand vein pattern verification. The hand vein pattern is here regarded as a
biometric feature. Biometrics is the automated measurement of physiological or behavioural
characteristics to determine or verify identity [2]. Biological and behavioral characteristics are
physical properties of body parts, physiological and behavioral processes created by the body and
combinations of any of these. Distinguishing does not necessarily imply individualization [3]. The
hand vein pattern is used as a biometric feature, in this case a biological characteristic of an
individual which can be detected and from which distinguishing, repeatable biometric features can be
extracted for the purpose of automated recognition of individuals.
Verification is confirmation by examination and provision of objective evidence that specified
requirements have been fulfilled. Verification in a biometric application is the outcome true or false on
a claim about the similarity of a biometric reference and a recognition biometric sample by making a
comparison [3], a one-to-one match. Biometric authentication is often used as a synonym for
verification, but formally this is deprecated. Biometric identification is the outcome of a biometric
system function that performs a one-to-many search to obtain a candidate list [3].
The hand vein pattern is the network of blood vessels lying subcutaneously in the hand. In this thesis
it can regard vessels at the back or palm side of the hand, in a finger or the wrist. Although veins are
defined as the vessels carrying blood back to the heart, also arteries, the ones carrying blood away
from the heart, are part of this vessel network used for biometric verification. This is an erroneous
appellation of the biometric feature, but is common used in the biometric industry.
The actual pattern is the shape of the vascular network and its characteristics are the vein
features. It has to be derived from the hand by vein imaging, followed by image processing:
enhancing or changing an image to extract information or features. Vein feature matching is the
biometric verification process. It involves a lot of digital signal processing.
A biometric device can be a part of a biometric system and contains the sensor which
captures a biometric sample from an individual or it can be self-contained to perform the entire
biometric verification within itself. The performance of the device, including the verification process,
is an important property for usability of this biometric verification technique. It can be expressed in
terms as false acceptance rate or false rejection rate which will be defined below.
False acceptance is the goal of a biometric impostor, who presents a biometric feature and
attempts to be incorrectly recognized by generating a false match or by bypassing a positive claim in
the biometric system [3]. A genuine user, wrongly recognized as someone else, is not an impostor.
Sometimes liveness detection can prevent the success of a biometric impostor. It is regarded as the

Definitions X
The Hand Vein Pattern Used as a Biometric Feature – Annemarie Nadort
capability for the system to detect, during enrolment and verification/identification, whether or not the
biometric sample presented is alive or not [4].
This thesis encompasses the properties of the hand vein pattern, the processes towards
biometric verification and methods for liveness detection. More definitions of concepts used in this
thesis that require some explanation are listed next.
Definitions XI
The Hand Vein Pattern Used as a Biometric Feature – Annemarie Nadort
List of definitions
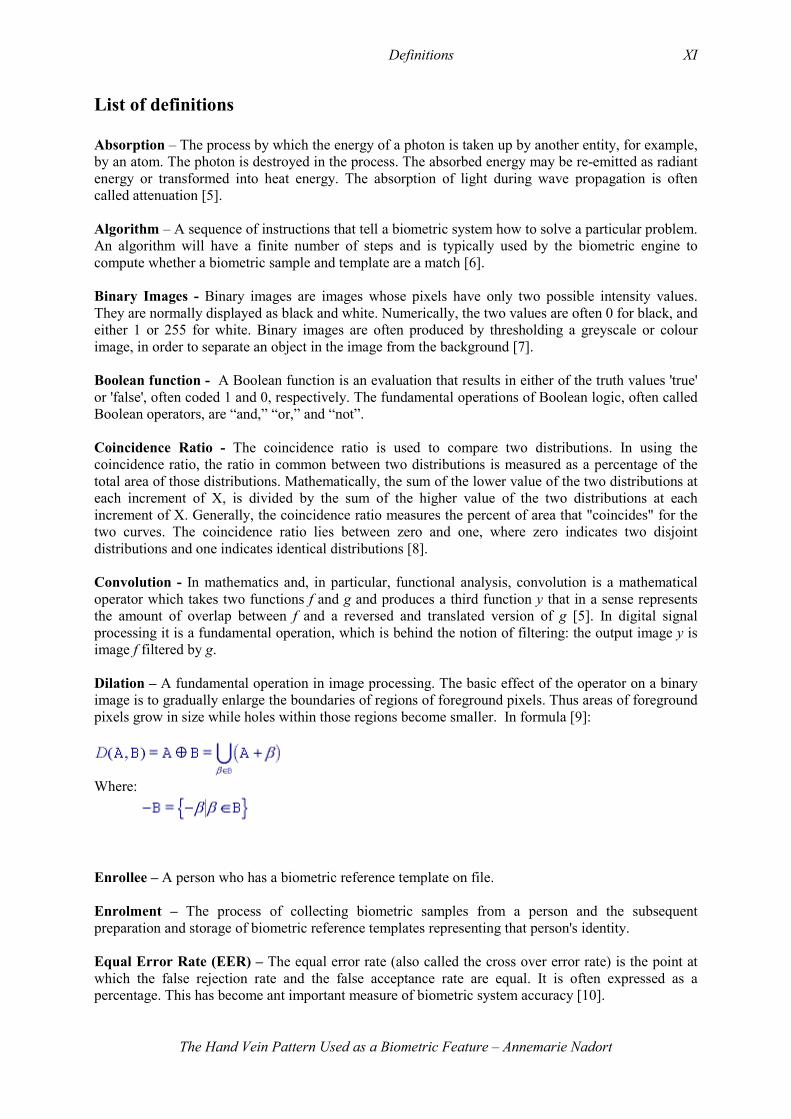
Absorption – The process by which the energy of a photon is taken up by another entity, for example, by an atom. The photon is destroyed in the process. The absorbed energy may be re-emitted as radiant energy or transformed into heat energy. The absorption of light during wave propagation is often called attenuation [5]. Algorithm – A sequence of instructions that tell a biometric system how to solve a particular problem. An algorithm will have a finite number of steps and is typically used by the biometric engine to compute whether a biometric sample and template are a match [6]. Binary Images - Binary images are images whose pixels have only two possible intensity values. They are normally displayed as black and white. Numerically, the two values are often 0 for black, and either 1 or 255 for white. Binary images are often produced by thresholding a greyscale or colour image, in order to separate an object in the image from the background [7]. Boolean function - A Boolean function is an evaluation that results in either of the truth values 'true' or 'false', often coded 1 and 0, respectively. The fundamental operations of Boolean logic, often called Boolean operators, are “and,” “or,” and “not”. Coincidence Ratio - The coincidence ratio is used to compare two distributions. In using the coincidence ratio, the ratio in common between two distributions is measured as a percentage of the total area of those distributions. Mathematically, the sum of the lower value of the two distributions at each increment of X, is divided by the sum of the higher value of the two distributions at each increment of X. Generally, the coincidence ratio measures the percent of area that "coincides" for the two curves. The coincidence ratio lies between zero and one, where zero indicates two disjoint distributions and one indicates identical distributions [8]. Convolution - In mathematics and, in particular, functional analysis, convolution is a mathematical operator which takes two functions f and g and produces a third function y that in a sense represents the amount of overlap between f and a reversed and translated version of g [5]. In digital signal processing it is a fundamental operation, which is behind the notion of filtering: the output image y is image f filtered by g. Dilation – A fundamental operation in image processing. The basic effect of the operator on a binary image is to gradually enlarge the boundaries of regions of foreground pixels. Thus areas of foreground pixels grow in size while holes within those regions become smaller. In formula [9]:
Where:
Enrollee – A person who has a biometric reference template on file. Enrolment – The process of collecting biometric samples from a person and the subsequent preparation and storage of biometric reference templates representing that person's identity. Equal Error Rate (EER) – The equal error rate (also called the cross over error rate) is the point at which the false rejection rate and the false acceptance rate are equal. It is often expressed as a percentage. This has become ant important measure of biometric system accuracy [10].
Definitions XII
The Hand Vein Pattern Used as a Biometric Feature – Annemarie Nadort
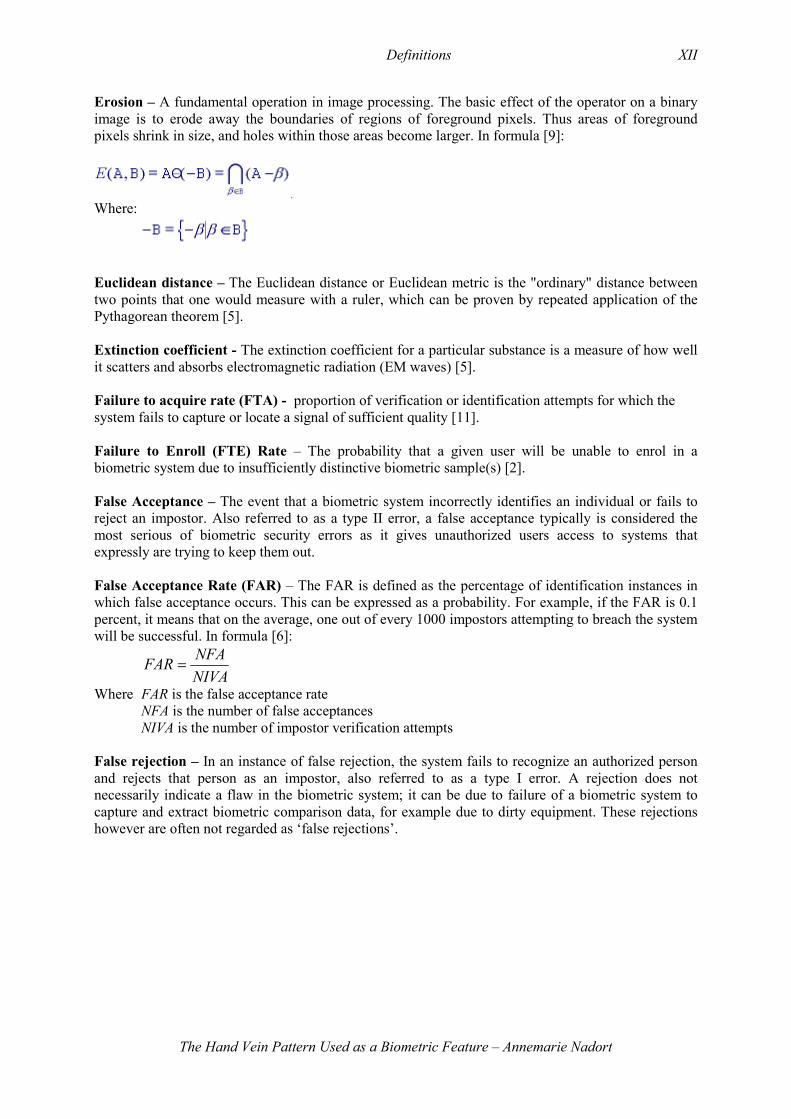
Erosion – A fundamental operation in image processing. The basic effect of the operator on a binary image is to erode away the boundaries of regions of foreground pixels. Thus areas of foreground pixels shrink in size, and holes within those areas become larger. In formula [9]:
. Where:
Euclidean distance – The Euclidean distance or Euclidean metric is the "ordinary" distance between two points that one would measure with a ruler, which can be proven by repeated application of the Pythagorean theorem [5]. Extinction coefficient - The extinction coefficient for a particular substance is a measure of how well it scatters and absorbs electromagnetic radiation (EM waves) [5]. Failure to acquire rate (FTA) - proportion of verification or identification attempts for which the system fails to capture or locate a signal of sufficient quality [11]. Failure to Enroll (FTE) Rate – The probability that a given user will be unable to enrol in a biometric system due to insufficiently distinctive biometric sample(s) [2]. False Acceptance – The event that a biometric system incorrectly identifies an individual or fails to reject an impostor. Also referred to as a type II error, a false acceptance typically is considered the most serious of biometric security errors as it gives unauthorized users access to systems that expressly are trying to keep them out. False Acceptance Rate (FAR) – The FAR is defined as the percentage of identification instances in which false acceptance occurs. This can be expressed as a probability. For example, if the FAR is 0.1 percent, it means that on the average, one out of every 1000 impostors attempting to breach the system will be successful. In formula [6]:
NIVA
NFAFAR =
Where FAR is the false acceptance rate NFA is the number of false acceptances NIVA is the number of impostor verification attempts False rejection – In an instance of false rejection, the system fails to recognize an authorized person and rejects that person as an impostor, also referred to as a type I error. A rejection does not necessarily indicate a flaw in the biometric system; it can be due to failure of a biometric system to capture and extract biometric comparison data, for example due to dirty equipment. These rejections however are often not regarded as ‘false rejections’.
Definitions XIII
The Hand Vein Pattern Used as a Biometric Feature – Annemarie Nadort
False rejection rate (FRR) - The FRR is defined as the percentage of identification instances in which false rejection occurs. This can be expressed as a probability. In formula [6]:
NEVA
NFFFRR =
Where FRR is the false rejection rate NFR is the number of false rejections NEVA is the number of enrolee verification attempts The FRR normally excludes failure to acquire errors (failure of a biometric system to capture and extract biometric comparison data). Fast Fourier Transform - In mathematics, the Fourier transform is a certain linear operator that maps functions to other functions. Loosely speaking, the Fourier transform decomposes a function into a continuous spectrum of its frequency components, and the inverse transform synthesizes a function from its spectrum of frequency components. The discrete Fourier transform (DFT), sometimes called the finite Fourier transform, is a Fourier transform widely employed in signal processing and related fields to analyze the frequencies contained in a sampled signal, to solve partial differential equations, and to perform other operations such as convolutions. The DFT can be computed efficiently in practice using a fast Fourier transform (FFT) algorithm [5]. High-pass filter - In digital image processing, frequency filtering is based on the Fourier Transform. The form of the filter function determines the effects of the operator. A high pass filter yields edge enhancement or edge detection in the spatial domain, because edges contain many high frequencies. Areas of rather constant graylevel consist of mainly low frequencies and are therefore suppressed Intra-variability – Variability within an individual Inter-variability – Variability between individuals Logical XOR operator – Literally means logical exclusive or, and generally symbolized by XOR or EOR. It is a logical operation on two operands that results in a logical value of true if and only if exactly one of the operands has a value of true. Low-pass filter - In digital image processing, frequency filtering is based on the Fourier Transform. The form of the filter function determines the effects of the operator. A low-pass filter attenuates high frequencies and retains low frequencies unchanged. The result in the spatial domain is equivalent to that of a smoothing filter; as the blocked high frequencies correspond to sharp intensity changes, i.e. to the fine-scale details and noise in the spatial domain image [7]. Mahalanobis distance – In statistics, the Mahalanobis distance is based on correlations between variables by which different patterns can be identified and analysed. It is a useful way of determining similarity of an unknown sample set to a known one. It differs from Euclidean distance in that it takes into account the correlations of the data set and is scale-invariant, i.e. not dependent on the scale of measurements [5]. Median Filter - The median filter is a non-linear digital filtering technique, normally used to reduce noise in an image. It is rather good at preserving useful detail in the image. Like the mean filter, the median filter considers each pixel in the image in turn and looks at its nearby neighbours to decide whether or not it is representative of its surroundings. Instead of simply replacing the pixel value with the mean of neighbouring pixel values (mean filtering), it replaces it with the median of those values [5].
Definitions XIV
The Hand Vein Pattern Used as a Biometric Feature – Annemarie Nadort
Multi resolution analysis (MRA) - MRA is the design method of most of the practically relevant discrete wavelet transforms (DWT) and the justification for the algorithm of the fast wavelet transform (FWT) [5]. Morphological thresholding algorithm - Morphological thresholding adds some complexity to normal thresholding because pixels are classified with regard to their morphology or structure. Usually, the structuring element is sized 3×3 and has its origin at the center pixel. It is shifted over the image and at each pixel of the image its elements are compared with the set of the underlying pixels. If the two sets of elements match the condition defined by the set operator (e.g. if set of pixels in the structuring element is a subset of the underlying image pixels), the pixel underneath the origin of the structuring element is set to a pre-defined value (0 or 1 for binary images). A morphological operator is therefore defined by its structuring element and the applied set operator [7].
Normalization - In image processing, normalization is a (linear) process that changes the range of pixel intensity values. Applications include photographs with poor contrast due to glare, for example. Normalization is sometimes called contrast stretching [5]. In general terms, normalization is any process that makes something more normal and in this thesis it is also used in the context of normalizing the size or position of the finger on the image. Photosensitive pin diode - A diode used in electronics that exhibits an increase in its electrical conductivity as a function of the intensity, wavelength, and modulation rate of the incident radiation [12]. Principle component analysis (PCA) –In statistics, principal components analysis is a technique for simplifying a dataset, by reducing multidimensional datasets to lower dimensions for analysis. PCA can be used for dimensionality reduction in a dataset while retaining those characteristics of the dataset that contribute most to its variance, by keeping lower-order principal components and ignoring higher-order ones. Such low-order components often contain the "most important" aspects of the data [5]. Receiver Operating Curves (ROC) – A graph showing how the false rejection rate and false acceptance rate vary according to the threshold [6]. Reflection – The change in direction of a wave front at an interface between two dissimilar media so that the wave front returns into the medium from which it originated. Reflection of light may be specular (that is, mirror-like) or diffuse (that is, not retaining the image, only the energy) depending on the nature of the interface. Diffuse reflection is also referred to as scattering [5]. Region of Interest – A term often used in image processing. In this thesis it means the required area of the hand image where the hand vein pattern for matching is obtained. Scattering - A general physical process whereby some forms of radiation, such as light or moving particles, for example, are forced to deviate from a straight trajectory by one or more localized non-uniformities in the medium through which it passes. This also includes deviation of reflected radiation from the angle predicted by the law of reflection. Reflections that undergo scattering are often called diffuse reflections and unscattered reflections are called specular (mirror-like) reflections [5]. Segmentation – Image segmentation is the process of isolating objects in the image from the background Skeletonization/Thinning – Skeletonization is a process for reducing foreground regions in a region while throwing binary image to a skeletal remnant that largely preserves the extent and connectivity of the original away most of the original foreground pixels [7]. Template/Reference Template - Data, which represents the biometric measurement of an enrolee, used by a biometric system for comparison against subsequently submitted biometric samples [6].

Definitions XV
The Hand Vein Pattern Used as a Biometric Feature – Annemarie Nadort
Thresholding algorithm - In image analysis thresholding is the simplest method of image segmentation. Individual pixels in a greyscale image are marked as 'object' pixels if their value is greater than some threshold value and as 'background' pixels otherwise. Watershed transformation - The watershed transform can be classified as a region-based segmentation approach. The intuitive idea underlying this method comes from geography: it is that of a landscape or topographic relief which is flooded by water, watersheds being the divide lines of the domains of attraction of rain falling over the region. The problem of this intuitive concept is that it leaves room for various formalizations, especially in digital images, since in the discrete case there is no unique definition of the path a drop of water would follow. Many sequential algorithms have been developed to compute watershed transforms [13]. Wavelet transformation - In mathematics the wavelet transform refers to the representation of a signal in terms of a finite length or fast decaying oscillating waveform (known as the mother wavelet). This waveform is scaled and translated to match the input signal [8].

Introduction 1
The Hand Vein Pattern Used as a Biometric Feature – Annemarie Nadort
Introduction 2
The Hand Vein Pattern Used as a Biometric Feature – Annemarie Nadort
1 INTRODUCTION Although over 6.5 billion (6.500.000.000) people inhabit this world on this moment, the
intuitively contradicting ‘small world problem’ was already recognized in 1969 [14]. In this
experiment the average path length for social networks of people in the United States was examined,
and the surprising conclusion was that people in the United States are separated by about six people on
average. Later this phenomenon became generally accepted, and was referred to with the term ‘six
degrees of separation’ [5].
This experiment and the many follow-up studies and discussions show how much the world
has changed into a networked society. When people still lived in small villages, or much older, in
tribes, it was enough to know perhaps one hundred people to get along in ‘society’. Identification was
important, but easily possible in such small networks by simply ‘knowing’ the features of your
neighbours. Nowadays, determining the identity of a person is becoming very important, but also
increasingly difficult in our complex, mobile and vastly interconnected information society [15].
Especially in an era in which terrorism and identity theft are mentioned in newspapers almost daily, a
fast, secure way of verifying that you are who you say you are is a hot topic. Public awareness of
security threats, whether it concerns your bank account, house, your data or the whole society, has put
the identification problem on a high scale.
There are two fundamentally distinct types of identification problems [16]; the first is
verification (Am I who I claim I am?) and the second is recognition, or popularly referred to as
identification (Who am I?). Both problems are very challenging and have different complexities. A
practical approach is to reduce the problem of verification of a person’s identity is to the problem of
verification of a concrete entity related tot the person. These entities can be categorized into [16]:
- Something that you have in your possession, such as an ID or member card. Or in a more
general way: everybody allowed in a building has a key that identifies this group.
- Something that you know, such as a password and login for a computer. Some systems
combine the first and second entities, e.g. the ATM card and PIN code combination.
- Something that you are or that you do, which is the measurement of the physical or
behavioural characteristics of a person. This is essentially what biometrics is. Examples of
biometric features are the fingerprint, iris, ear, gait, keystroke dynamics, voice, signature,
DNA, hand geometry, hand vein pattern, etc.
Introduction 3
The Hand Vein Pattern Used as a Biometric Feature – Annemarie Nadort
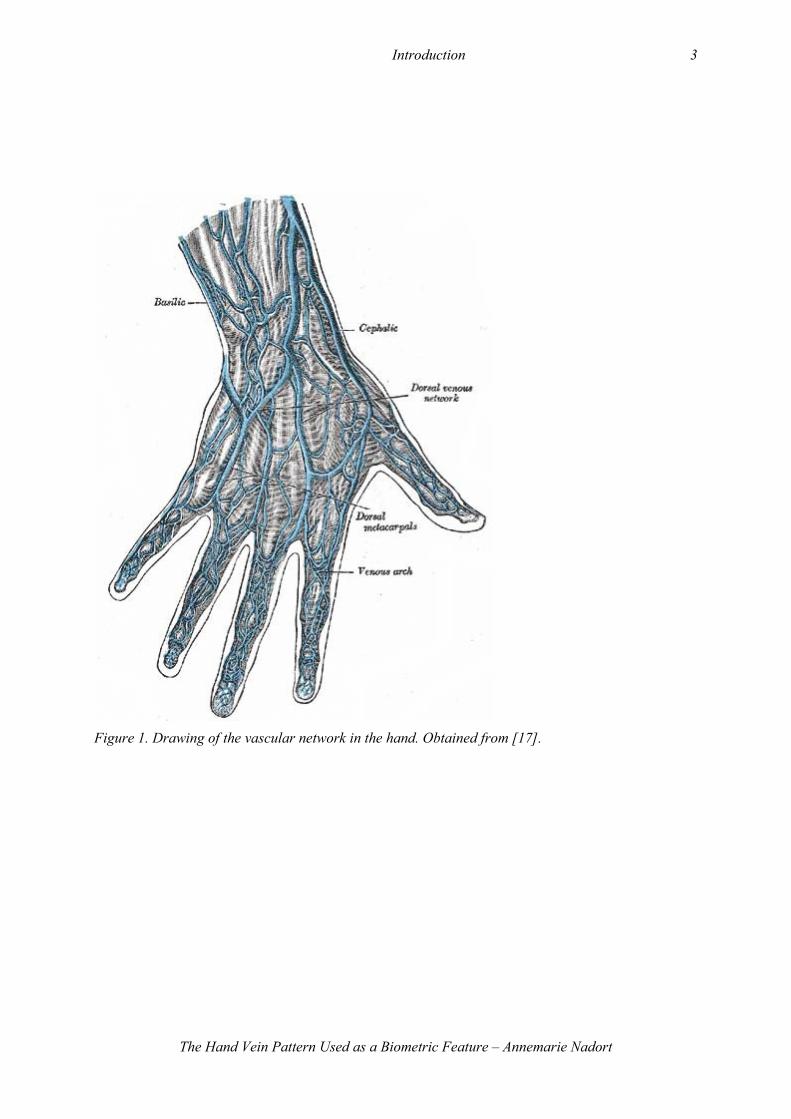
Figure 1. Drawing of the vascular network in the hand. Obtained from [17].
Introduction 4
The Hand Vein Pattern Used as a Biometric Feature – Annemarie Nadort
These three levels also incorporate an increasing level of security where the first category is
the least secure, and the last one is said to reach the highest level of security [18]. Therefore, it is
logical that the use of biometrics is seen as an exciting solution to many security and identification
problems. Manufacturers tell beautiful stories on their websites and make high security and
performance claims. However, a growing number of publications asses the risks of too much trust in
biometrics [4, 11, 19-23]. A lot of drawbacks are still attached to this promising technology, and a lot
of countermeasures have to be taken for the biometric identification systems to live up to their big
promises. The many different biometric features that are optional for identification all have their
individual pros and cons. Especially for the more established biometrics features, such as the
fingerprint, the disadvantages are well-known. Many disadvantages are related to the reliability of the
method, particularly in the light of impostor attacks at security systems. In fingerprint technology the
main threat is the ease with which you can obtain somebody’s fingerprint. People leave their
fingerprints everywhere; on everything they touch. And in addition, many techniques to make artificial
fingerprints with gelatine or silicon are available [4, 21], also on widely accessible internet sites,
including recipes [20]. Partially to overcome these problems of leaving your biometric feature behind
for anybody to copy, hand vein pattern recognition techniques are developed. The characteristics of
the vascular structure in the hand or finger (see figure 1) are captured and used for identification. This
relatively new biometric identification technique is thought to be a promise for the future [24-26].
However, due to its novelty not much is known about the critical issues of this biometric feature. The
Netherlands Forensics Institute is involved in the evaluation of biometric identification methods,
especially in legal contexts. Their interest in this new technique has resulted in this project: a literature
research on the hand vein pattern recognition technique. The goal in this thesis is to asses multiple
aspects of the hand vein pattern in the purpose of answering the main question: how suitable is the
hand vein pattern as a biometric feature?
1.1 Biometrics
Biometrics is the automated use of physiological or behavioural characteristics to determine or
verify identity. What qualifies a ‘suitable biometric’? The answer is that any human physiological or
behavioural characteristic could be a biometric feature, provided it has the following desirable
properties [16, 27]:
- universality: every relevant person should have the characteristic
- uniqueness: no two persons should have the same characteristic, and each relevant person
should only have one original characteristic
- permanence: the characteristic should be time-invariant
- collectability: the characteristic can be measured
- storability: the characteristic can be stored in manual or automated systems
Introduction 5
The Hand Vein Pattern Used as a Biometric Feature – Annemarie Nadort
- performance: the measurement and verification of the characteristic should be easy and
not error-prone; high accuracy and robustness should be achievable; and the measurement
should be precise enough to detect the smallest differences in the characteristic between
individuals.
Other properties are maybe not compelled, but very important in practice:
- convenience: measuring and storing the characteristic should be fast and user-friendly
- cost: measuring and storing the characteristic should be affordable and in relation to its
surplus value
- exclusivity: it should be used on its own without any further identity checks
- acceptability: relevant persons should be willing to accept the biometric system
- circumvention: the system should not be easy to fool by fraudulent users
1.2 Biometric properties hand vein pattern
The first property, universality, is quite straightforward for the hand vein pattern; every living
hand possesses a vascular structure for necessary blood supply. People who are born without hands or
have lost both their hands during life are excluded from this biometric identification method. The
occurrence of these people is rather low, but should be taken in to account. The other properties listed
above will be discussed in the three main chapters of this thesis. Each chapter assesses one of the three
following sub questions, which are related to the main research question stated above:
1) How unique and time-invariant is the hand vein pattern and how can we perceive it?
(Chapter 2, Veins as a biometric feature)
2) How does the vein pattern biometric identification technology work? (Chapter 3,
Biometric devices)
3) How can the hand vein recognition systems defend themselves against impostor attacks?
(Chapter 4, Liveness detection)
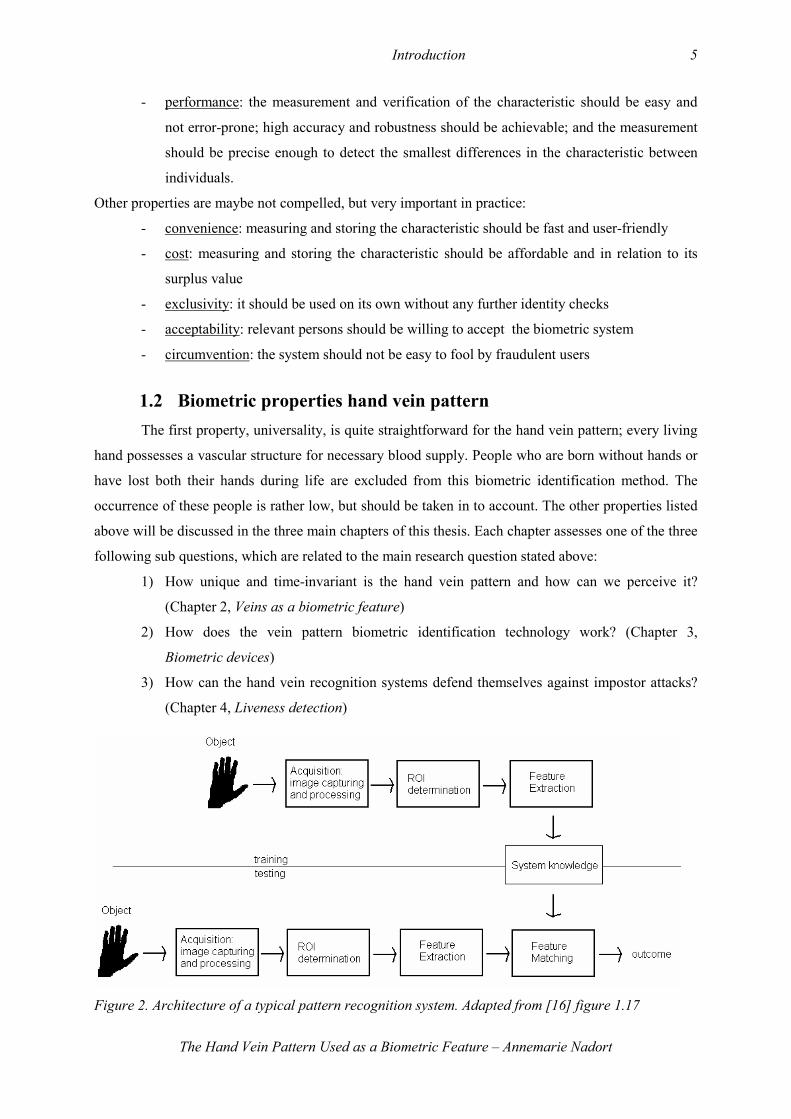
Figure 2. Architecture of a typical pattern recognition system. Adapted from [16] figure 1.17
Introduction 6
The Hand Vein Pattern Used as a Biometric Feature – Annemarie Nadort
In chapter 2 (Veins as a biometric feature) the properties universality, uniqueness, permanence
and collectability of the hand vein pattern as a biometric feature will be discussed, in order to find the
answer on the first sub question. Information on the physiological properties and development of the
vascular structure in the hand is provided, as well as some physical properties of veins and blood cells
that are utilized to visualize the vein pattern in a biometric application.
In chapter 3 (Biometric devices) the technical design of several biometric devices is described,
and the properties storability, performance, convenience and costs are included in this chapter. It
serves as an overview of different methods that have been used in this field. Biometric verification
systems work in two modes: enrolment mode and verification mode [16]. During enrolment one or
more measurements (often images) of the hand vein pattern are obtained to create a template that is
stored in a database. During verification the system measures the presented vein pattern, and
subsequently verifies whether the features of this vein pattern are present in the database of enrolled
templates (one-to-many match). Another way is to ask the user to inform the system who he is, either
with a PIN or other code. Subsequently the system will recall the claimant’s template from the
database and verify whether the biometric features match (one-to-one match). If no positive match
occurs, the system will reject the claimant. The actual verification process consists of several
processing steps: image capturing and processing, region of interest (ROI) determination, vein feature
extraction and matching. The typical architecture is shown in figure 2. More detail on all these steps is
given in chapter 3.
In chapter 4 (Liveness detection) the property circumvention is addressed. One way of fooling
a biometric device is by presenting an artificial copy of the actual biometric feature to the detector.
Liveness detection is the ability of the system to intercept such fake biometrics by verifying whether
the presented feature is ‘alive’ or not. This liveness detector should be implemented in figure 2, at
some stage before the outcome is given. More anti-spoofing measures are also mentioned in this
chapter.
All chapters conclude with a discussion on each individual research question. Chapter 5
comprises a final discussion and conclusion regarding the main question of this thesis.
1.3 Goal
The goal of this literature thesis is to give the reader objective information on the usability of
the hand vein pattern as a biometric identification feature. It is part of an evaluation programme of the
Netherlands Forensic Institute on biometrics. All information is derived from literature of both
scientific and commercial origin. Due to its use for security and identification purposes, biometrics
and related topics have a ‘secret nature’ which can sometimes blur your vision, and make you believe
all the beautiful promises of the biometric industry in our highly networked and demanding society. So
look after your veins…

Introduction 7
The Hand Vein Pattern Used as a Biometric Feature – Annemarie Nadort
Veins as a biometric feature 8
The Hand Vein Pattern Used as a Biometric Feature – Annemarie Nadort
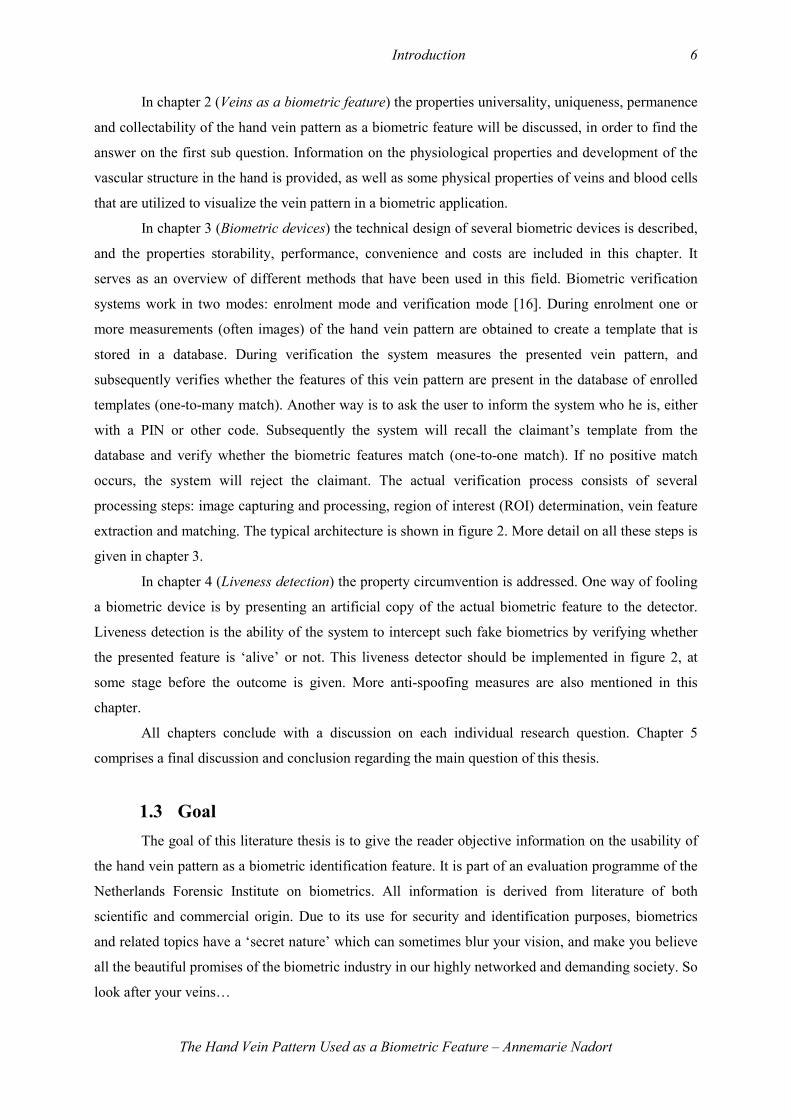
2 VEINS AS A BIOMETRIC FEATURE
One of the most important conditions of an identification system based on a biometric feature is that it
is a unique and time-invariant property for every individual, and that this property can somehow be
perceived by a device. Moreover, if it is unique, the differences between individuals should be big
enough to be picked up by the device that captures the biometric feature. In other words, both the
intra-variability of the feature compared to the inter-variability between individuals should satisfy the
demands of a proper biometric feature. Therefore, if the hand vein pattern is the property upon which
the identification process is based, it should comply with these conditions. In the section below, the
properties of the hand vein pattern concerning uniqueness and time-invariance are discussed, followed
by the optical principles on which capturing a hand vein pattern is based. Finally, several methods of
vein imaging are mentioned.
2.1 Uniqueness
Many resources state that the vein pattern is a unique property of each individual, both in the
retina [15, 28]or in the hand [24-26, 29, 30], but also the whole physical arrangement of blood
vessels, veins and capillaries within the human body is considered to be different for each individual
[31]. Scientific research on the uniqueness of veins in the hand is sparse. The mechanisms underlying
the development of the vascular system that are known so far, and studies on the spatial arrangement
of the final vascular network could provide more insight into the probability that no vein pattern will
be the same between two individuals.
2.1.1 Vascular Development
This section is based on a review article by A. Eichmann [32]
Histological, the structure of blood vessels is rather simple. The smallest vessels of the
vascular system, the capillaries, are composed solely of endothelial cells and are surrounded by a
basement membrane. Larger vessels have additional layers constituting the vessel wall, which are
composed of a muscular layer, an outer connective tissue layer and nerves. The endothelial cells
represent the major cellular compartment of the vascular system.
The cardiovascular system is the first organ system to develop during early embryonic
development. It starts with differentiation of the endothelial cells from cells of the blastula (a hollow
ball of cells that an early embryo consists of) during gastrulation, the phase early in the development
of animal embryos, during which the morphology of the embryo is dramatically restructured by cell
migration. These cells form one of the embryonic germ layers: the mesoderm. The mesoderm will

Veins as a biometric feature 9
The Hand Vein Pattern Used as a Biometric Feature – Annemarie Nadort
later differentiate into more substructures, continually developing towards a determined and
functioning organ system. The lateral and posterior mesoderms are found to give rise to blood cells
and endothelial cells. An important discovery was that these systems expressed the vascular
endothelial growth factor receptor (VEGFR2). Vascular endothelial growth factor (VEGF) and its
receptor (VEGFR2) are the most critical drivers for embryonic vessel formation.
Figure 3. Example of a fractal: a Koch Snowflake. Obtained from [5].
Veins as a biometric feature 10
The Hand Vein Pattern Used as a Biometric Feature – Annemarie Nadort
The in situ differentiation of endothelial cells from the mesoderm and there fusion into tubes of the
primary capillary system under influence of VEGF is called vasculogenesis. Vasculogenesis results in
the formation of the major embryonic vessels. Next, this primary system has to be remodelled into a
system with arteries and veins, to accommodate the heart and to establish the primary circulation.
For a long time it was believed that differentiation into veins and arteries was influenced by
hemodynamic forces. Recently, signalling molecules have been discovered that are present in early
development stages in endothelial cells, already labelling them arterial or venous. The same molecules
have also been found in the nervous system, where they regulate cell fate decisions and guidance of
migration of neuronal precursors as well as of developing axons. Thus speculations have been made
with regard to similarities in function of these molecules in the development of the nervous and the
vascular system.
Also, other recent research identified neural guidance receptors, which are expressed on
arteries and veins. In the nervous system, these molecules are implicated in establishment of cell
boundaries and in the guidance of developing axons. It is thus tempting to speculate that these
receptors may also play a role in vessel guidance during embryonic development. Indeed, recent
studies have shown that specialized cells (‘tip’ cells) are present at the ends of developing vessel
sprouts, with extending sensors that explore their environment in much the same way as the growth
cone of a developing axon. Moreover, the patterning of developing arteries in the limb skin of mouse
embryos has been shown to depend on interactions with nerves.
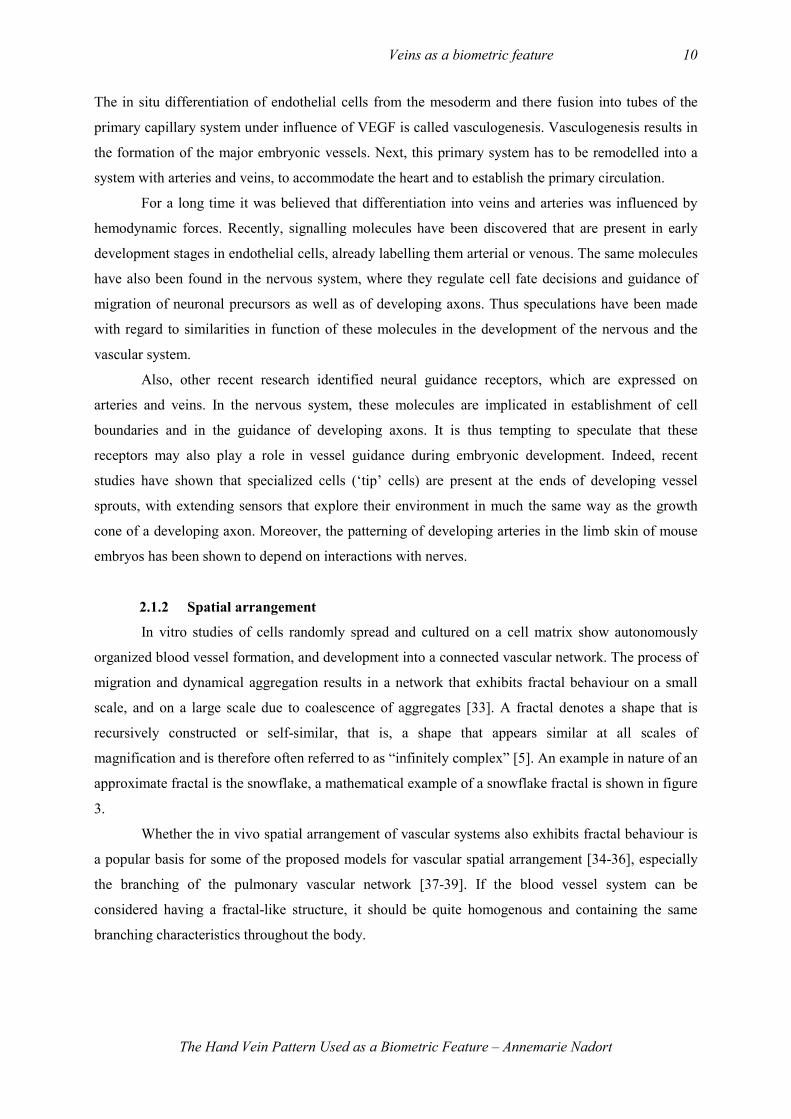
2.1.2 Spatial arrangement
In vitro studies of cells randomly spread and cultured on a cell matrix show autonomously
organized blood vessel formation, and development into a connected vascular network. The process of
migration and dynamical aggregation results in a network that exhibits fractal behaviour on a small
scale, and on a large scale due to coalescence of aggregates [33]. A fractal denotes a shape that is
recursively constructed or self-similar, that is, a shape that appears similar at all scales of
magnification and is therefore often referred to as “infinitely complex” [5]. An example in nature of an
approximate fractal is the snowflake, a mathematical example of a snowflake fractal is shown in figure
3.
Whether the in vivo spatial arrangement of vascular systems also exhibits fractal behaviour is
a popular basis for some of the proposed models for vascular spatial arrangement [34-36], especially
the branching of the pulmonary vascular network [37-39]. If the blood vessel system can be
considered having a fractal-like structure, it should be quite homogenous and containing the same
branching characteristics throughout the body.
Veins as a biometric feature 11
The Hand Vein Pattern Used as a Biometric Feature – Annemarie Nadort
.
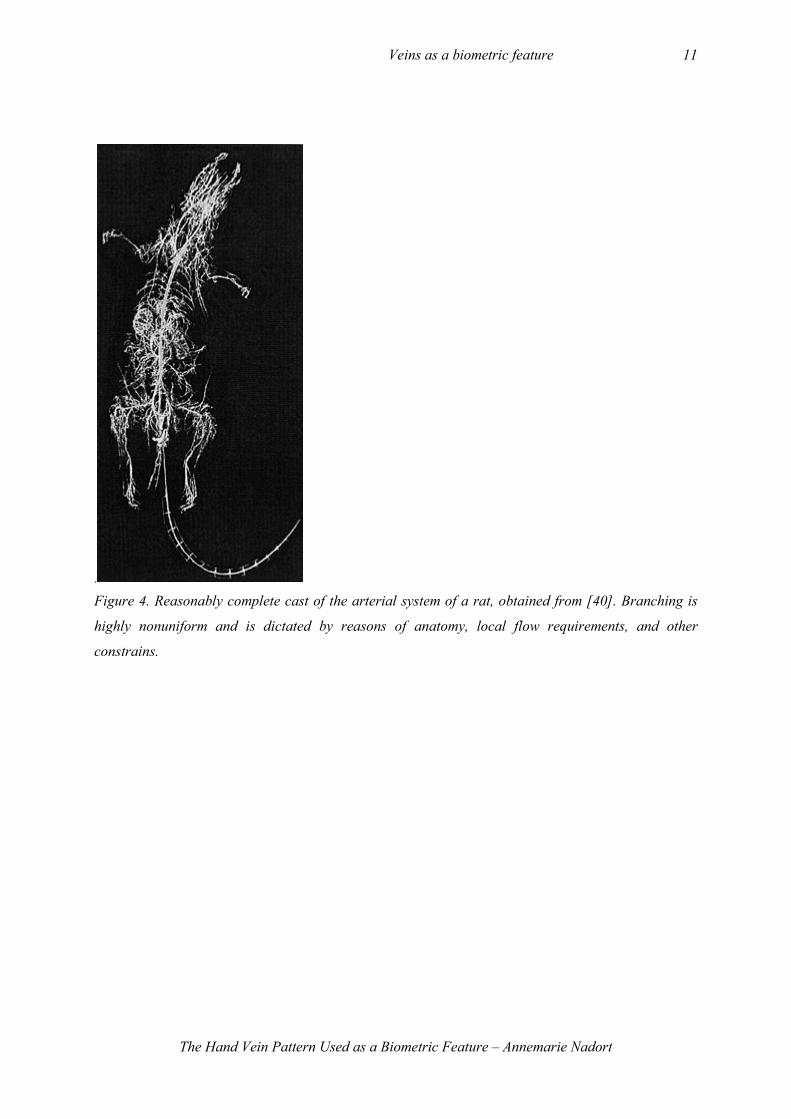
Figure 4. Reasonably complete cast of the arterial system of a rat, obtained from [40]. Branching is
highly nonuniform and is dictated by reasons of anatomy, local flow requirements, and other
constrains.
Veins as a biometric feature 12
The Hand Vein Pattern Used as a Biometric Feature – Annemarie Nadort
Several studies found quasi-fractal structures in coronary patterns, because the branching
parameters where not always identical but ranged between certain values [41]. These parameters
include relations between diameters of the three vessels involved at an arterial bifurcation and the
angles that the two branches make with the direction of the parent vessel. A distinction should be made
between the pulmonary (lung) or renal (kidney) vascular network and the remaining vascular system.
The pulmonary or renal vascular networks provide a processing function, which is supported by a
uniform distibuted vascular system. The remaining vascular network on the other hand, has a purely
metabolic function that is primarily based on providing blood to all parts of the body, and is less
uniformly distributed (see figure 4). Therefore the latter is unlikely to contain a higher degree of
fractal character, than the first and a model based on branching geometry may be more appropriate for
trees with a methabolic function such as the hand vein system.
A study on parametric Lindenmayer systems (L-systems) [42] that are formulated to generate
branching tree structures that have fractal structures and can incorporate the physiological laws of
arterial branching, did not result in a good model for the vascular tree; the model fractal tree structures
did not have the variability in branching parameters observed in arterial trees. The main reason is that
the source of variability in branching parameters of a real physiological vascular system is not known,
but it cannot be simulated with random values for branching parameters: these values may be
influenced by local anatomy, local flow requirements, and other constraints, and therefore the
variability may not be purely random.
A general biological model developed by West et al. [36] predicts the essential features of
transport systems and is based on three unifying principles: 1. a space-filling fractal-like branching
pattern to supply the entire volume, 2. final branch of the network is a size-invariant unit and 3. the
energy required to distribute resources is minimized (minimizing the total hydrodynamic resistance of
the system). The last restriction will reduce homogeneous diffusion, according to an optimized model
for arterial trees that incorporates homogeneous perfusion and uniform shear stress relations to
represent a general principle of vascular systems [43]. Perfusion heterogeneity is also described by
[44], in a model based on two parameters: branching asymmetry and the scaling properties (or fractal
dimensions) of vessel resistance. Branching asymmetry is based on the tissue volume that is fed by
each vessel, and the fractal relationships for the length and diameter exist as a function of scale. Data
on pig hearts [45, 46] show a large degree of fluctuation of length and diameter measurements.
Another study on the rat hepatic portal vein tree showed branching angles to oscillate between those
predicted by two optimally principles of minimum power loss and volume, and of minimum shear
stress and surface [47]. The liver shows a variation in branching morphology similar to that of other
organs.
Veins as a biometric feature 13
The Hand Vein Pattern Used as a Biometric Feature – Annemarie Nadort
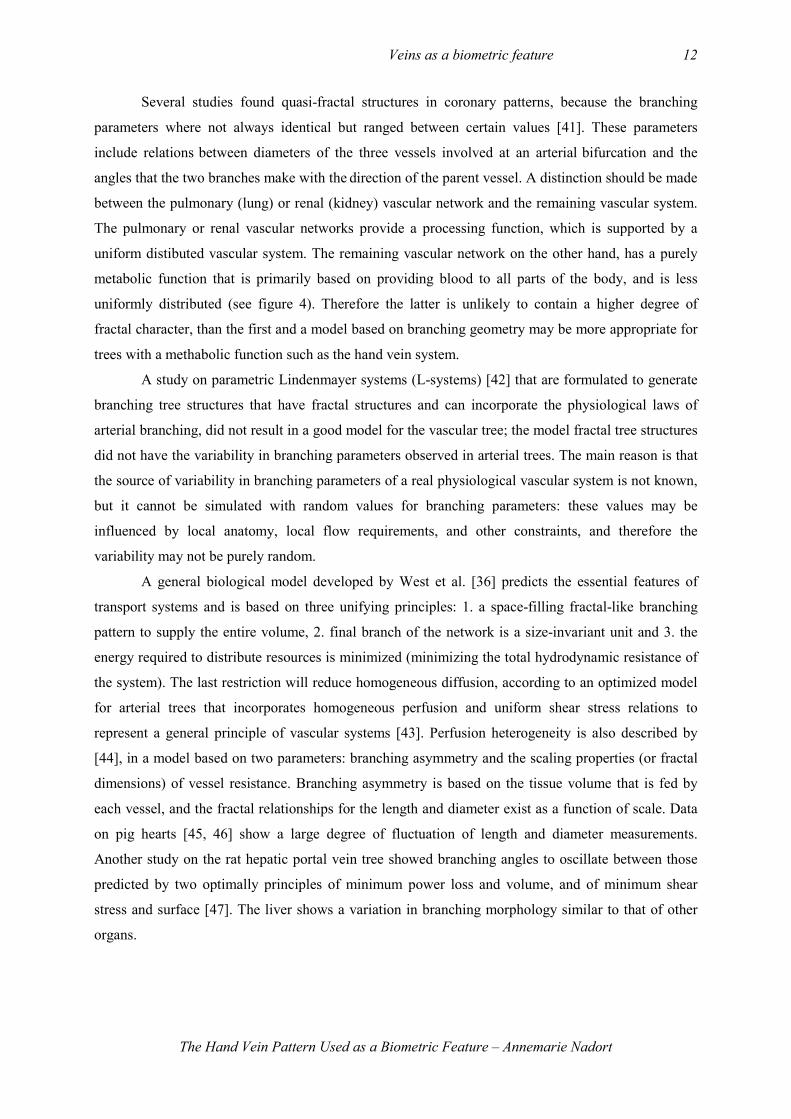
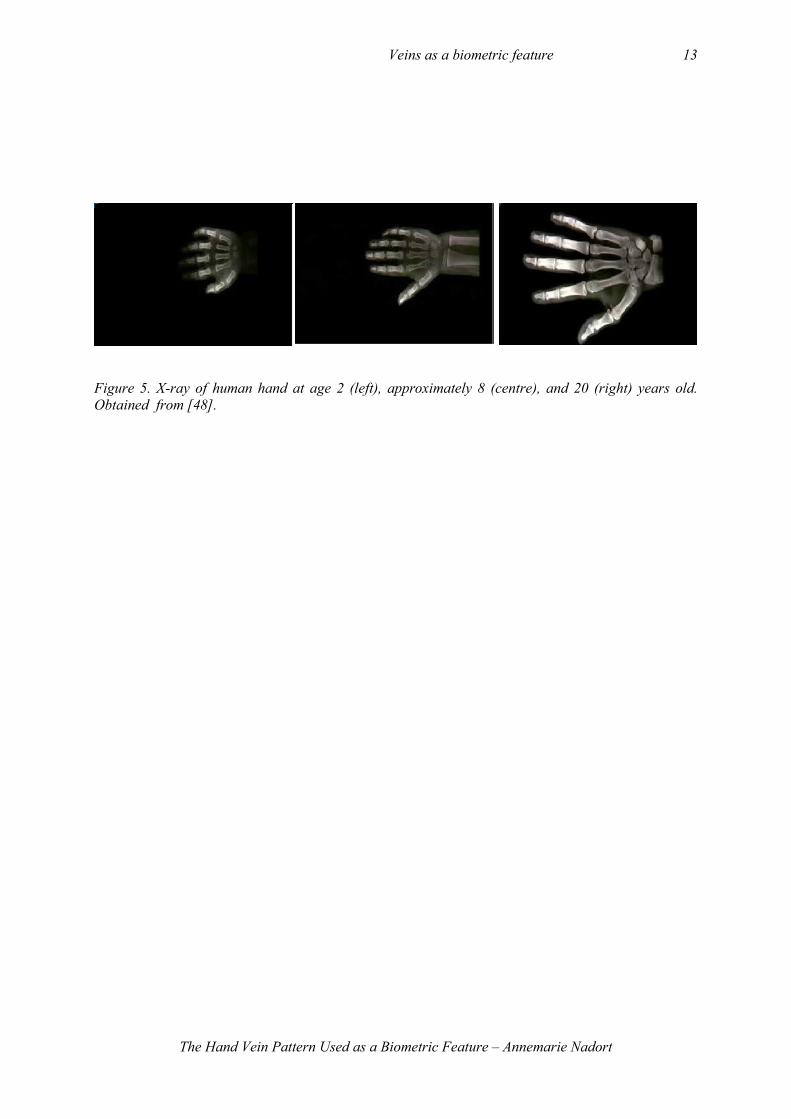
Figure 5. X-ray of human hand at age 2 (left), approximately 8 (centre), and 20 (right) years old.
Obtained from [48].
Veins as a biometric feature 14
The Hand Vein Pattern Used as a Biometric Feature – Annemarie Nadort
2.2 Time-invariance
A biometric property used to identify individuals is only useful when the property measured at
different instances in time has not changed. For example the electronic representation of a biometric
property stored in a database should match the biometric property captured and processed at a later
instance in time to authenticate the individual. In other words, the features of the biometric property
should be time-invariant. In case of the human hand vein pattern, there are three processes that might
change the pattern: natural changes in the vascular system throughout the life span of a healthy human
being, natural changes in the vascular system that are associated with some diseases and changes in
the vascular system induced by drugs or surgery. The section below will reflect upon these three
processes and the significance for the hand vein pattern authentication method will be discussed.
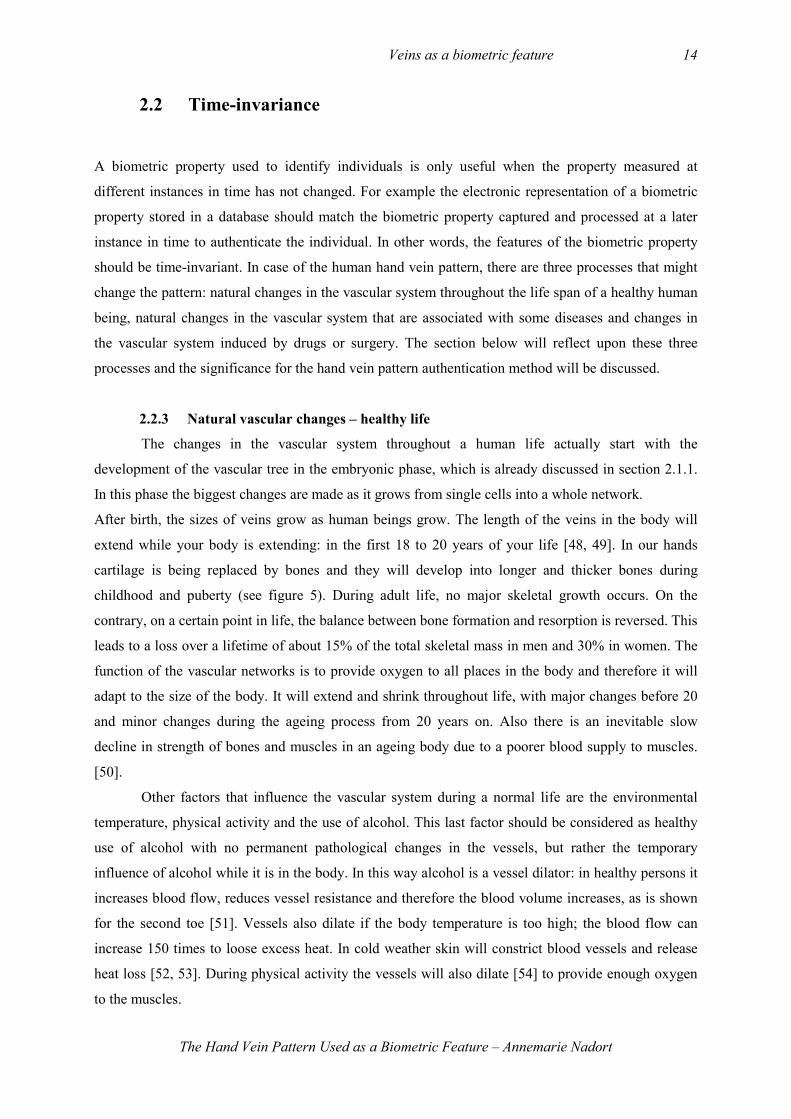
2.2.3 Natural vascular changes – healthy life
The changes in the vascular system throughout a human life actually start with the
development of the vascular tree in the embryonic phase, which is already discussed in section 2.1.1.
In this phase the biggest changes are made as it grows from single cells into a whole network.
After birth, the sizes of veins grow as human beings grow. The length of the veins in the body will
extend while your body is extending: in the first 18 to 20 years of your life [48, 49]. In our hands
cartilage is being replaced by bones and they will develop into longer and thicker bones during
childhood and puberty (see figure 5). During adult life, no major skeletal growth occurs. On the
contrary, on a certain point in life, the balance between bone formation and resorption is reversed. This
leads to a loss over a lifetime of about 15% of the total skeletal mass in men and 30% in women. The
function of the vascular networks is to provide oxygen to all places in the body and therefore it will
adapt to the size of the body. It will extend and shrink throughout life, with major changes before 20
and minor changes during the ageing process from 20 years on. Also there is an inevitable slow
decline in strength of bones and muscles in an ageing body due to a poorer blood supply to muscles.
[50].
Other factors that influence the vascular system during a normal life are the environmental
temperature, physical activity and the use of alcohol. This last factor should be considered as healthy
use of alcohol with no permanent pathological changes in the vessels, but rather the temporary
influence of alcohol while it is in the body. In this way alcohol is a vessel dilator: in healthy persons it
increases blood flow, reduces vessel resistance and therefore the blood volume increases, as is shown
for the second toe [51]. Vessels also dilate if the body temperature is too high; the blood flow can
increase 150 times to loose excess heat. In cold weather skin will constrict blood vessels and release
heat loss [52, 53]. During physical activity the vessels will also dilate [54] to provide enough oxygen
to the muscles.
Veins as a biometric feature 15
The Hand Vein Pattern Used as a Biometric Feature – Annemarie Nadort
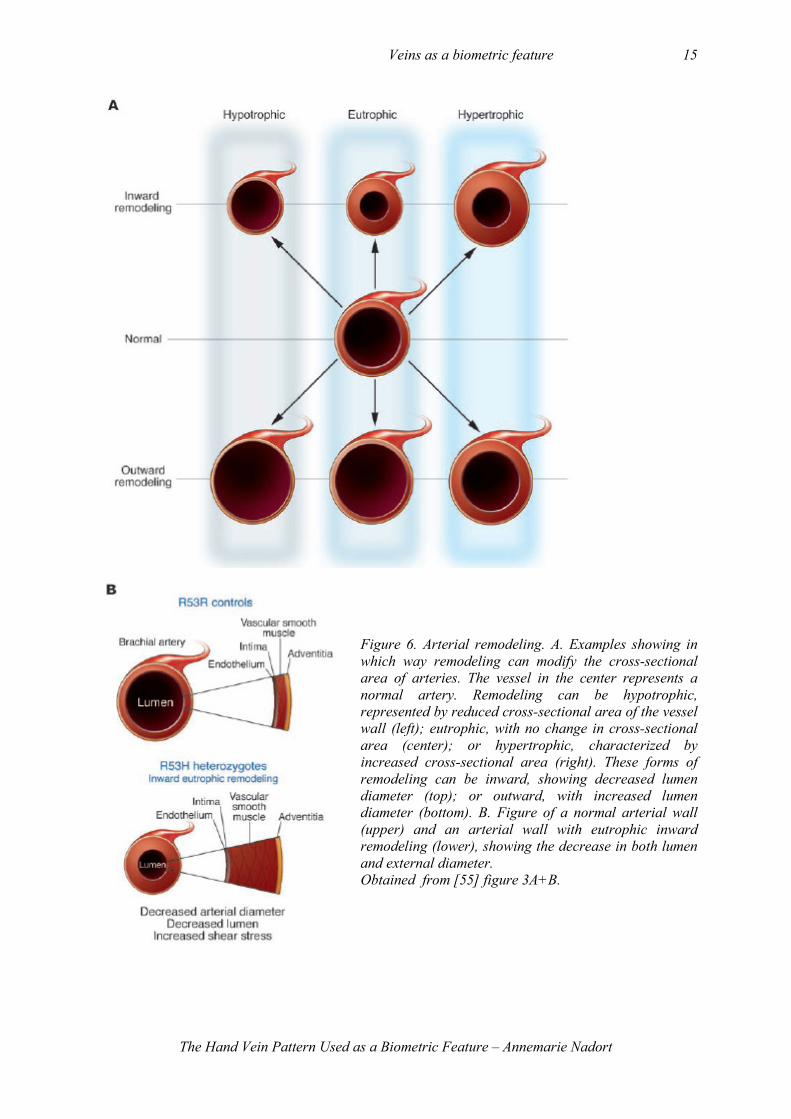
Figure 6. Arterial remodeling. A. Examples showing in
which way remodeling can modify the cross-sectional
area of arteries. The vessel in the center represents a
normal artery. Remodeling can be hypotrophic,
represented by reduced cross-sectional area of the vessel
wall (left); eutrophic, with no change in cross-sectional
area (center); or hypertrophic, characterized by
increased cross-sectional area (right). These forms of
remodeling can be inward, showing decreased lumen
diameter (top); or outward, with increased lumen
diameter (bottom). B. Figure of a normal arterial wall
(upper) and an arterial wall with eutrophic inward
remodeling (lower), showing the decrease in both lumen
and external diameter.
Obtained from [55] figure 3A+B.
Veins as a biometric feature 16
The Hand Vein Pattern Used as a Biometric Feature – Annemarie Nadort
2.2.4 Natural vascular changes – associated with disease
The vascular system is a large and essential system in the human body. Like almost all tissue,
throughout life cells of the vascular system are continually replaced by new cells, and form a dynamic
structure of several layers. Due to the dynamic character of the vascular system, it is sensitive to
conditions of the body that deviate from normal or healthy.
Diabetes, hypertension, atherosclerosis [56], metabolic diseases [55] or tumors [57] are
deviated conditions which can remodel the vascular system. The first four examples induce an effect
on the mechanical properties of the vessel wall which gives rise to hemodynamic changes. The
endothelium is thought to be the main shear sensor and the cytoskeleton (the structural component in
the endothelium of a vessel wall) plays in general a key role in biological responses to mechanical
factors [56]. But also mechanisms that are independent of the changes in pressure, e.g. new signaling
pathways and signaling molecules, can participate in the mechanisms of vascular remodeling, shown
by research on hypertension [58]. The remodeling process results in thickening or thinning of the
vessel wall, in both lumen and the external diameter, see figure 6.
Another process that influences the vascular system during disease is angiogenesis, a hallmark
of cancer and various ischaemic and inflammatory diseases [57, 59]. ‘Angiogenesis is a physiologic
process which refers to the remodeling of the vascular tissue characterized by the branching out of a
new blood vessel from a pre-existing vessel’ [60]. It is close related to the proliferation and migration
of endothelial cells (EC’s). In section 2.1.1 it is said that during embryonic development the
endothelial cells are particularly active, but during a normal adult life EC turnover is very low. This is
due to the ‘angiogenic switch’ that is ‘off’ when the effect of pro-angiogenic molecules is balanced by
that of anti-angiogenic molecules, and is ‘on’ when the net balance is tipped in favour of angiogenesis.
This switch is triggered by various signals associated with disease [57]. It is not fully understood how,
but when tumour cells begin to duplicate indiscriminately, they induce a shift in this equilibrium
towards pro-angiogenic factors to promote the formation of a vascular network surrounding them. This
is a clever mechanism in order to satisfy the growing need for oxygen and nutrients, which are
essential for the exponential growth that is seen in tumours. Various triggers have been proposed to
account for this pro-angiogenic state [57], the major ones influencing the VEGF and its receptors that
target and activate the ECs.
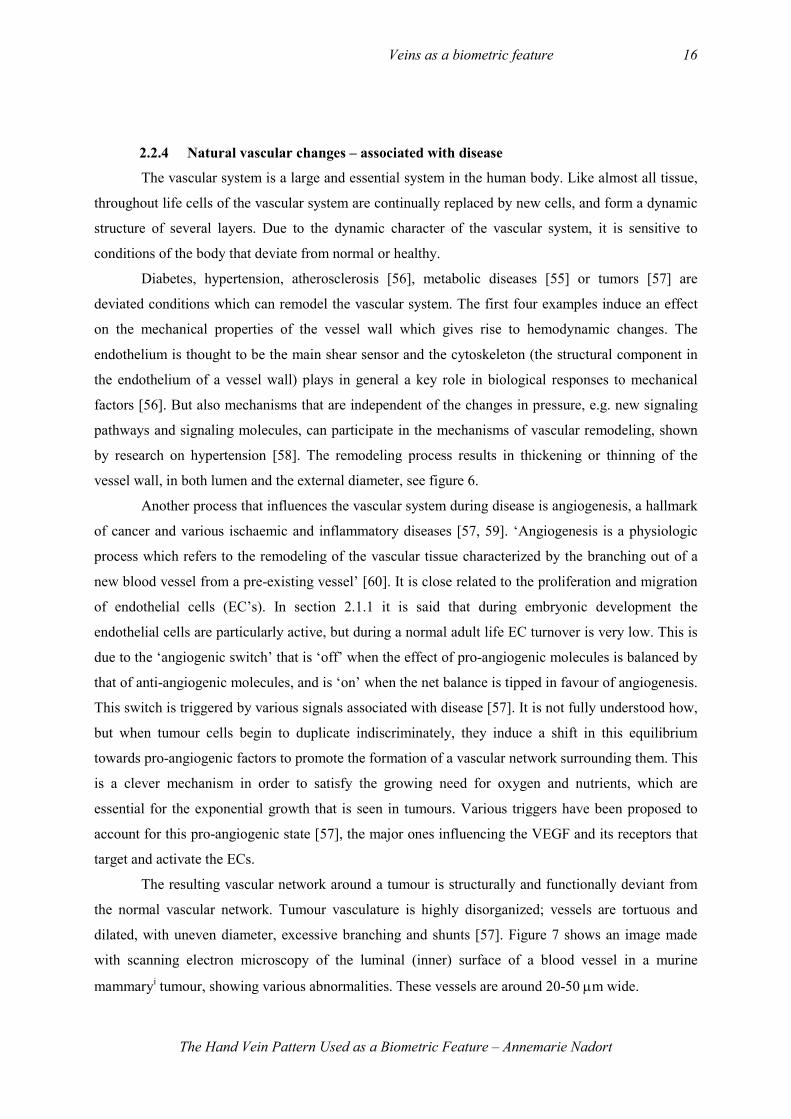
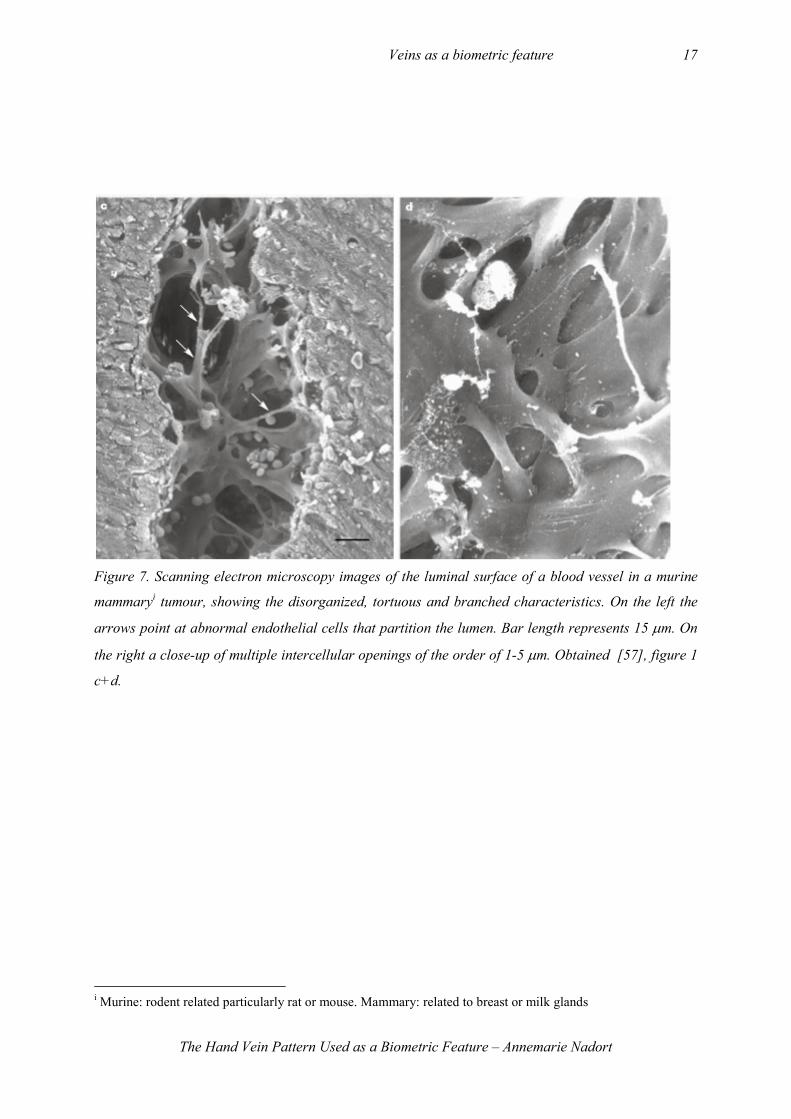
The resulting vascular network around a tumour is structurally and functionally deviant from
the normal vascular network. Tumour vasculature is highly disorganized; vessels are tortuous and
dilated, with uneven diameter, excessive branching and shunts [57]. Figure 7 shows an image made
with scanning electron microscopy of the luminal (inner) surface of a blood vessel in a murine
mammaryi tumour, showing various abnormalities. These vessels are around 20-50 µm wide.
Veins as a biometric feature 17
The Hand Vein Pattern Used as a Biometric Feature – Annemarie Nadort
Figure 7. Scanning electron microscopy images of the luminal surface of a blood vessel in a murine
mammaryi tumour, showing the disorganized, tortuous and branched characteristics. On the left the
arrows point at abnormal endothelial cells that partition the lumen. Bar length represents 15 µm. On
the right a close-up of multiple intercellular openings of the order of 1-5 µm. Obtained [57], figure 1
c+d.
i Murine: rodent related particularly rat or mouse. Mammary: related to breast or milk glands
Veins as a biometric feature 18
The Hand Vein Pattern Used as a Biometric Feature – Annemarie Nadort
2.2.5 Drug based or surgical vascular changes
The ability of tumours and other diseases to induce angiogenesis or vascular remodelling
inspired scientists to search for the triggers that are responsible for this growth or remodelling of
vessels. Being able to activate or inhibit these triggers can result in an effective therapy against e.g.
cancer. Over 60 compounds, stimulators and/or inhibitors, are currently in a clinical phase for a
number of different types of cancer pathologies and heart diseases [60].
In cancer treatment anti-angiogenic therapy is a promising approach [57]. One of the targets of
the angiogenic inhibitors are the active EC’s, who support tumour growth, but are less prone to
mutations than the tumour cells themselves. Most of the anti-angiogenic therapies inhibit the
EC/VEGF mechanism somewhere in its pathway to vessel growth.
Stimulating revascularization in ischemicii regions is an attractive novel therapeutic strategy
and several angiogenic agents have been clinically evaluated in recent years [60]. Because VEGF and
its receptors are over expressed in pathologic angiogenesis, admission of VEGF or modulators in the
EC/VEGF pathway is used as therapeutic pro-angiogenesis compounds. It has already shown to
promote capillary formation and organization in an in vitro assay [61], and another study on VEGF
overexpression showed promotion of growth of arteries and veins and induced capillary arterialisation
leading to supraphysiological blood flow in target muscles [62].
Another clinical interference in vessel formation can be in a surgical way. The most common
being the so-called bypass operation. The goal of coronary bypass surgery is to increase coronary
artery blood flow. Healthy arteries or veins are ‘harvested’ and used to channel the needed blood flow
around the blocked portions of the coronary arteries. The arteries or veins are connected from the aorta
to the surface of the heart, thereby ‘bypassing’ the narrowed or closed points in veins. The harvested
arteries or veins can come from the mammary artery in the chest, the radial artery in your forearm, or
the saphenous vein in your leg. [63]
Arterial bypass surgery is also performed on patients with severe ischaemia in the leg. There
are three different kinds of locations for peripheral arterial bypass surgery. Aortobifemoral bypass
surgery is used to bypass diseased large blood vessels in the abdomen and groin. Femoropopliteal
(fem-pop) bypass surgery is used to bypass diseased blood vessels above or below the knee.
Tibioperoneal bypass surgery is used to bypass diseased blood vessels in the lower leg or foot. The
grafted blood vessel may be a healthy blood vessel that has been transplanted, but can also be man-
made graft of synthetic material material (such as polytetrafluoroethyline [PTFE] or Dacron), which is
sewn to the existing artery [64].
ii In medicine, ischemia (Greek ισχαιµία, isch- is restriction, hema or haema is blood) is a restriction in blood supply, generally due to factors in the blood vessels, with resultant damage or dysfunction of tissue [5 www.wikipedia.com. .

Veins as a biometric feature 19
The Hand Vein Pattern Used as a Biometric Feature – Annemarie Nadort
Veins as a biometric feature 20
The Hand Vein Pattern Used as a Biometric Feature – Annemarie Nadort
A second example of surgical vascular treatment is used for patients with varicose veins. Varicose
veins are enlarged, twisted, painful superficial veins resulting from poorly functioning valves. In
varicose vein therapy, the unhealthy veins (most common in the legs) can be treated by surgical
removal (vein stripping) or occlusion of the vein [65].
A last example is a surgical procedure where the remodelling of veins is a secondary effect of
bone lengthening. This study on the effects of lengthening of the metacarpal bone on peripheral nerves
and blood vessels showed successful lengthening of the palmariii nerve and palmar blood vessels. This
was studied in 8 calves. During the first period the palmar nerve and blood vessels showed
morphologic alterations (e.g. thinning of the vessel wall), but they recovered their normal structure
almost completely 2 months after the end of the lengthening procedure [34].
2.3 Optic properties tissue and blood
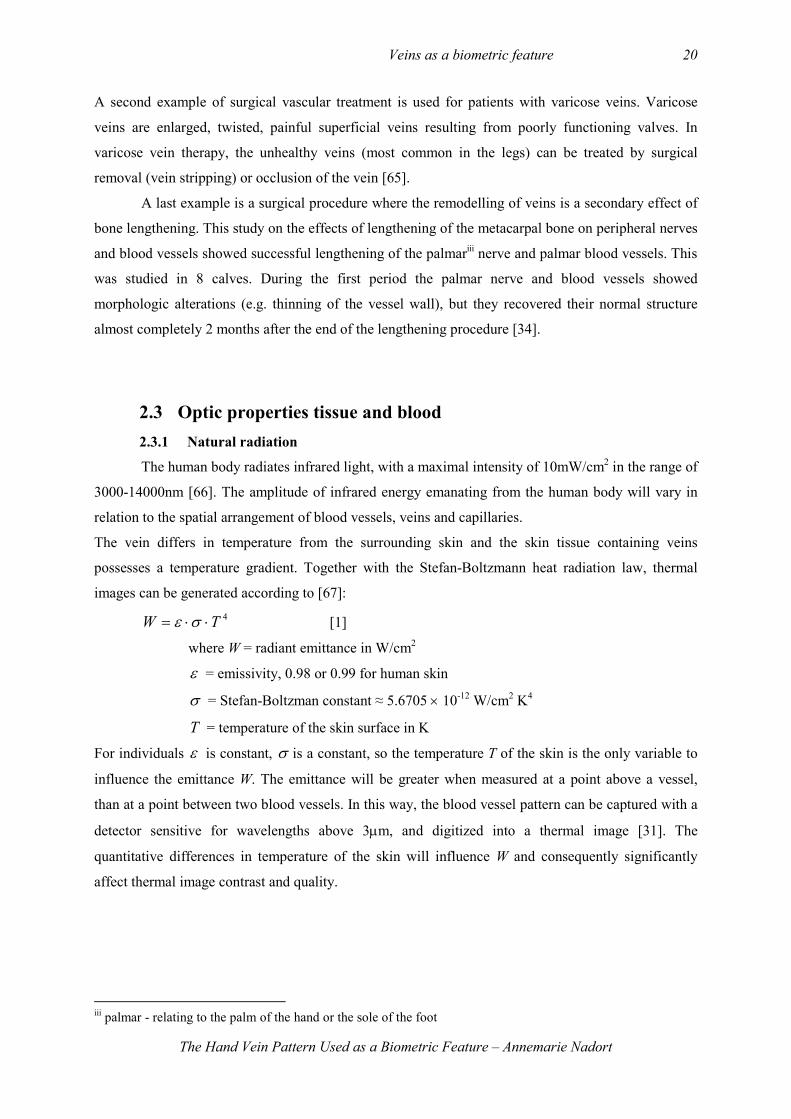
2.3.1 Natural radiation
The human body radiates infrared light, with a maximal intensity of 10mW/cm2 in the range of
3000-14000nm [66]. The amplitude of infrared energy emanating from the human body will vary in
relation to the spatial arrangement of blood vessels, veins and capillaries.
The vein differs in temperature from the surrounding skin and the skin tissue containing veins
possesses a temperature gradient. Together with the Stefan-Boltzmann heat radiation law, thermal
images can be generated according to [67]:
4TW ⋅⋅= σε [1]
where W = radiant emittance in W/cm2
ε = emissivity, 0.98 or 0.99 for human skin
σ = Stefan-Boltzman constant ≈ 5.6705 × 10⁻¹² W/cm2 K4
T = temperature of the skin surface in K
For individuals ε is constant, σ is a constant, so the temperature T of the skin is the only variable to
influence the emittance W. The emittance will be greater when measured at a point above a vessel,
than at a point between two blood vessels. In this way, the blood vessel pattern can be captured with a
detector sensitive for wavelengths above 3µm, and digitized into a thermal image [31]. The
quantitative differences in temperature of the skin will influence W and consequently significantly
affect thermal image contrast and quality.
iii palmar - relating to the palm of the hand or the sole of the foot
Veins as a biometric feature 21
The Hand Vein Pattern Used as a Biometric Feature – Annemarie Nadort
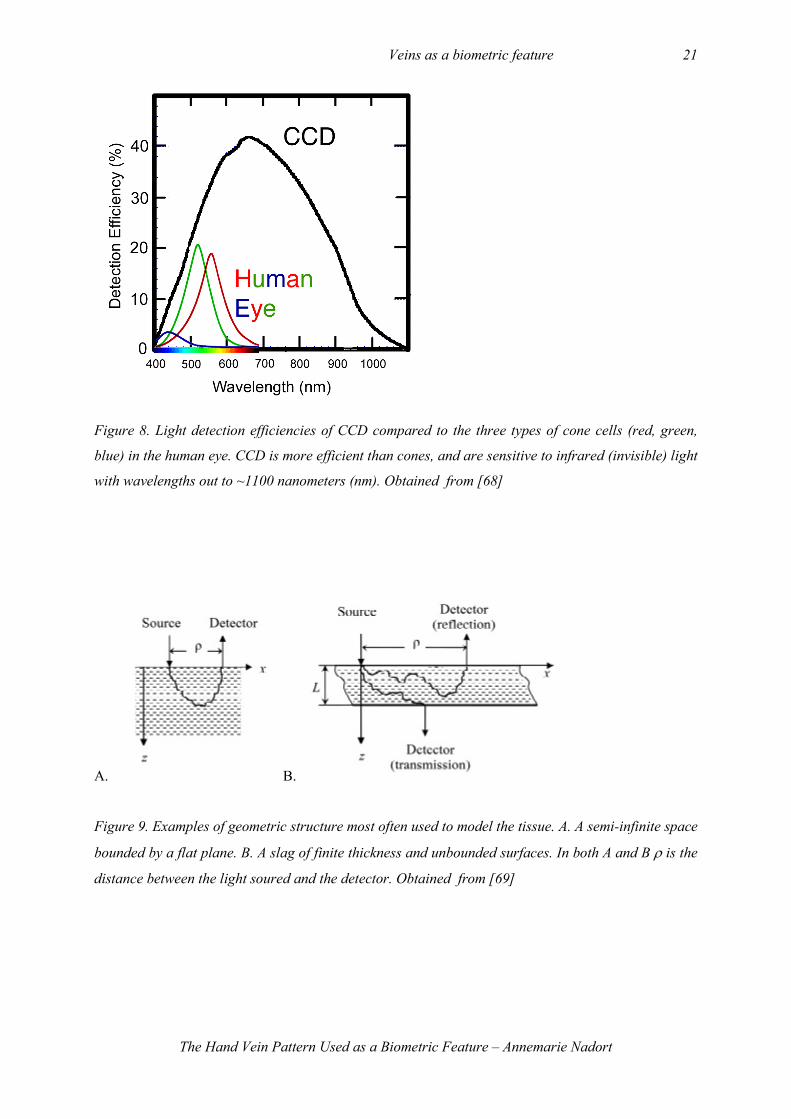
Figure 8. Light detection efficiencies of CCD compared to the three types of cone cells (red, green,
blue) in the human eye. CCD is more efficient than cones, and are sensitive to infrared (invisible) light
with wavelengths out to ~1100 nanometers (nm). Obtained from [68]
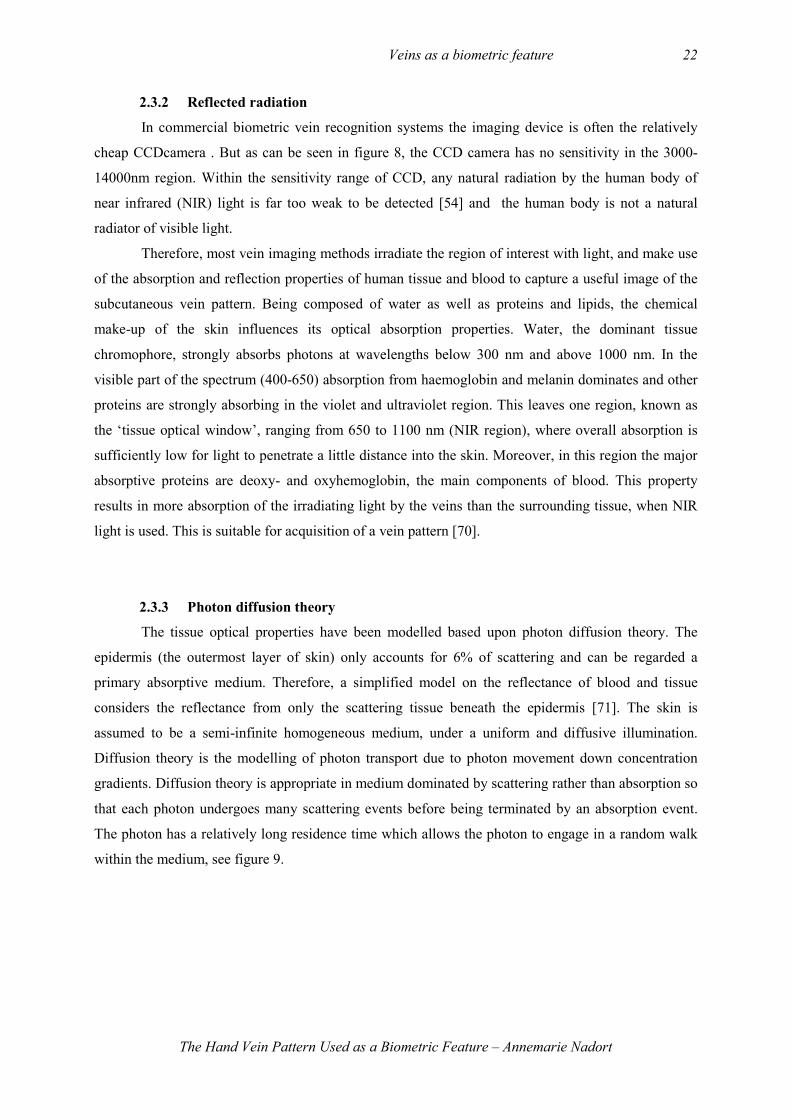
A. B.
Figure 9. Examples of geometric structure most often used to model the tissue. A. A semi-infinite space
bounded by a flat plane. B. A slag of finite thickness and unbounded surfaces. In both A and B ρ is the
distance between the light soured and the detector. Obtained from [69]
Veins as a biometric feature 22
The Hand Vein Pattern Used as a Biometric Feature – Annemarie Nadort
2.3.2 Reflected radiation
In commercial biometric vein recognition systems the imaging device is often the relatively
cheap CCDcamera . But as can be seen in figure 8, the CCD camera has no sensitivity in the 3000-
14000nm region. Within the sensitivity range of CCD, any natural radiation by the human body of
near infrared (NIR) light is far too weak to be detected [54] and the human body is not a natural
radiator of visible light.
Therefore, most vein imaging methods irradiate the region of interest with light, and make use
of the absorption and reflection properties of human tissue and blood to capture a useful image of the
subcutaneous vein pattern. Being composed of water as well as proteins and lipids, the chemical
make-up of the skin influences its optical absorption properties. Water, the dominant tissue
chromophore, strongly absorbs photons at wavelengths below 300 nm and above 1000 nm. In the
visible part of the spectrum (400-650) absorption from haemoglobin and melanin dominates and other
proteins are strongly absorbing in the violet and ultraviolet region. This leaves one region, known as
the ‘tissue optical window’, ranging from 650 to 1100 nm (NIR region), where overall absorption is
sufficiently low for light to penetrate a little distance into the skin. Moreover, in this region the major
absorptive proteins are deoxy- and oxyhemoglobin, the main components of blood. This property
results in more absorption of the irradiating light by the veins than the surrounding tissue, when NIR
light is used. This is suitable for acquisition of a vein pattern [70].
2.3.3 Photon diffusion theory
The tissue optical properties have been modelled based upon photon diffusion theory. The
epidermis (the outermost layer of skin) only accounts for 6% of scattering and can be regarded a
primary absorptive medium. Therefore, a simplified model on the reflectance of blood and tissue
considers the reflectance from only the scattering tissue beneath the epidermis [71]. The skin is
assumed to be a semi-infinite homogeneous medium, under a uniform and diffusive illumination.
Diffusion theory is the modelling of photon transport due to photon movement down concentration
gradients. Diffusion theory is appropriate in medium dominated by scattering rather than absorption so
that each photon undergoes many scattering events before being terminated by an absorption event.
The photon has a relatively long residence time which allows the photon to engage in a random walk
within the medium, see figure 9.
Veins as a biometric feature 23
The Hand Vein Pattern Used as a Biometric Feature – Annemarie Nadort
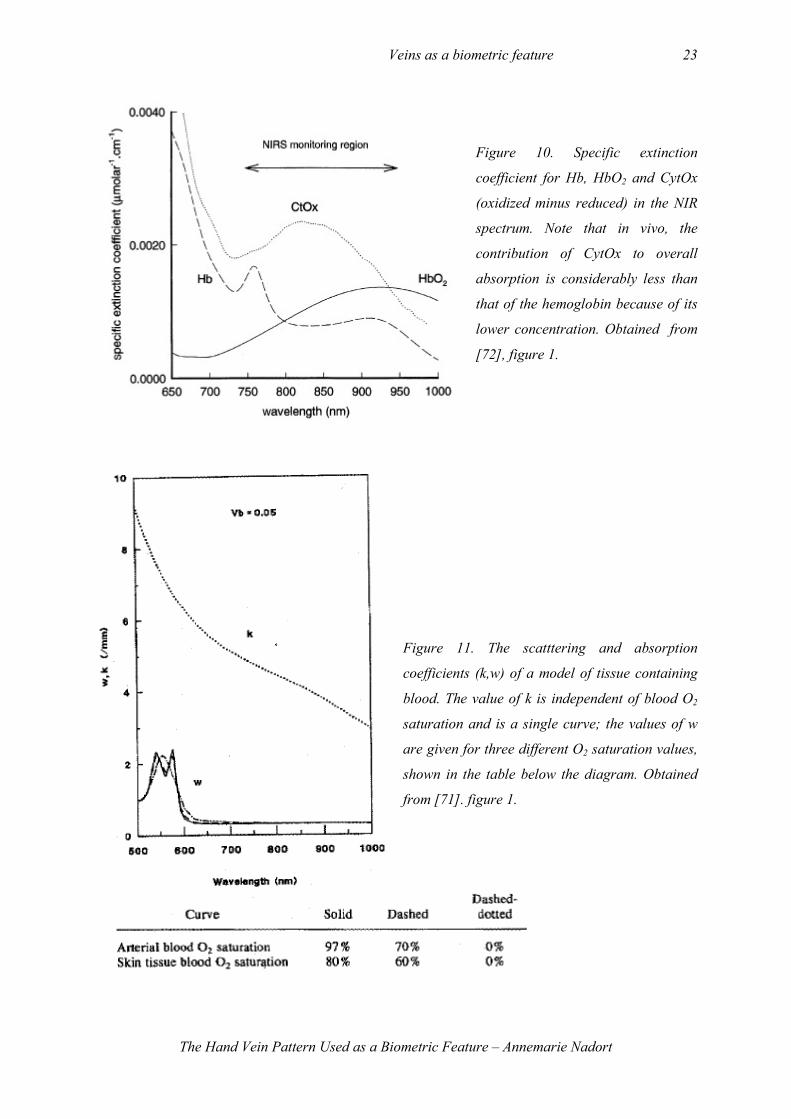
Figure 10. Specific extinction
coefficient for Hb, HbO2 and CytOx
(oxidized minus reduced) in the NIR
spectrum. Note that in vivo, the
contribution of CytOx to overall
absorption is considerably less than
that of the hemoglobin because of its
lower concentration. Obtained from
[72], figure 1.
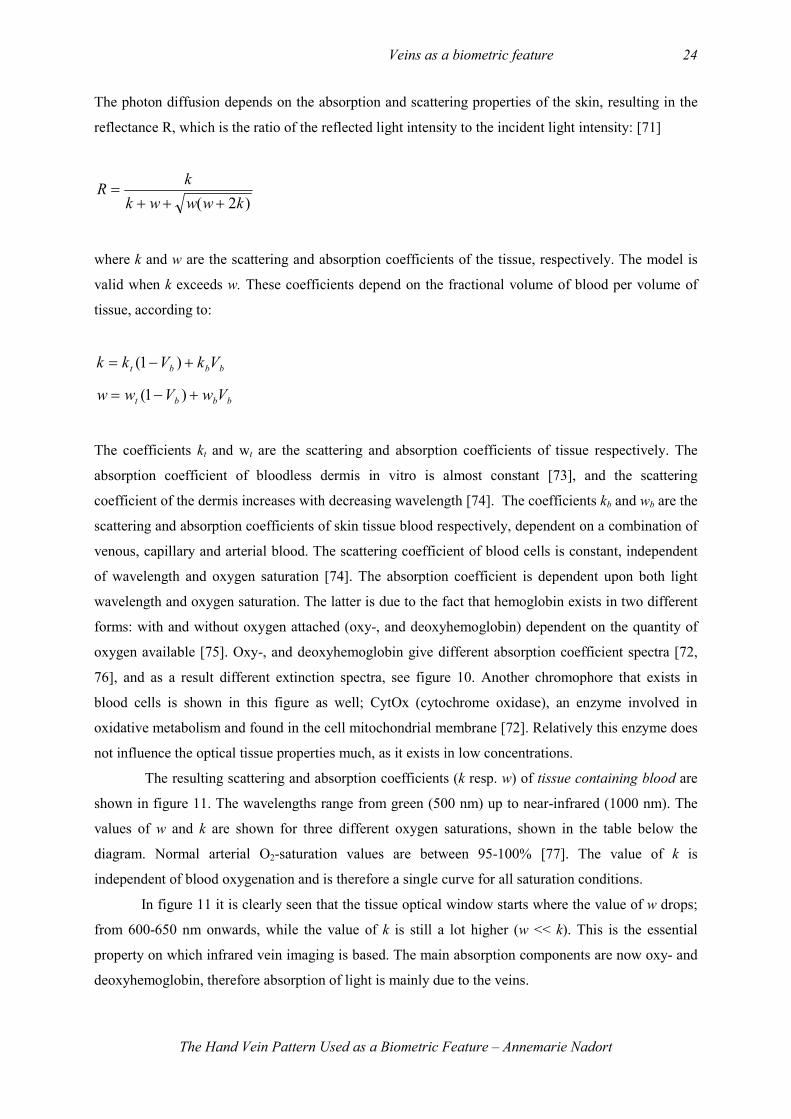
Figure 11. The scatttering and absorption
coefficients (k,w) of a model of tissue containing
blood. The value of k is independent of blood O2
saturation and is a single curve; the values of w
are given for three different O2 saturation values,
shown in the table below the diagram. Obtained
from [71]. figure 1.
Veins as a biometric feature 24
The Hand Vein Pattern Used as a Biometric Feature – Annemarie Nadort
The photon diffusion depends on the absorption and scattering properties of the skin, resulting in the
reflectance R, which is the ratio of the reflected light intensity to the incident light intensity: [71]
)2( kwwwk
kR
+++=
where k and w are the scattering and absorption coefficients of the tissue, respectively. The model is
valid when k exceeds w. These coefficients depend on the fractional volume of blood per volume of
tissue, according to:
bbbt VkVkk +−= )1(
bbbt VwVww +−= )1(
The coefficients kt and wt are the scattering and absorption coefficients of tissue respectively. The
absorption coefficient of bloodless dermis in vitro is almost constant [73], and the scattering
coefficient of the dermis increases with decreasing wavelength [74]. The coefficients kb and wb are the
scattering and absorption coefficients of skin tissue blood respectively, dependent on a combination of
venous, capillary and arterial blood. The scattering coefficient of blood cells is constant, independent
of wavelength and oxygen saturation [74]. The absorption coefficient is dependent upon both light
wavelength and oxygen saturation. The latter is due to the fact that hemoglobin exists in two different
forms: with and without oxygen attached (oxy-, and deoxyhemoglobin) dependent on the quantity of
oxygen available [75]. Oxy-, and deoxyhemoglobin give different absorption coefficient spectra [72,
76], and as a result different extinction spectra, see figure 10. Another chromophore that exists in
blood cells is shown in this figure as well; CytOx (cytochrome oxidase), an enzyme involved in
oxidative metabolism and found in the cell mitochondrial membrane [72]. Relatively this enzyme does
not influence the optical tissue properties much, as it exists in low concentrations.
The resulting scattering and absorption coefficients (k resp. w) of tissue containing blood are
shown in figure 11. The wavelengths range from green (500 nm) up to near-infrared (1000 nm). The
values of w and k are shown for three different oxygen saturations, shown in the table below the
diagram. Normal arterial O2-saturation values are between 95-100% [77]. The value of k is
independent of blood oxygenation and is therefore a single curve for all saturation conditions.
In figure 11 it is clearly seen that the tissue optical window starts where the value of w drops;
from 600-650 nm onwards, while the value of k is still a lot higher (w << k). This is the essential
property on which infrared vein imaging is based. The main absorption components are now oxy- and
deoxyhemoglobin, therefore absorption of light is mainly due to the veins.
Veins as a biometric feature 25
The Hand Vein Pattern Used as a Biometric Feature – Annemarie Nadort
2.4 Vein Imaging
In the former section the optical properties of tissue and blood have been discussed. Based on these
properties imaging of veins is possible using infrared light. Near infrared (reflection) imaging is the
common choice for the biometric vein pattern industry and thermal imaging in the mid-IR range a
good second. In the medical world, there are several other non-invasive vascular imaging techniques
available, like magnetic resonance angiography (MRA), ultrasound imaging or computer tomographic
angiography (CT-A) [78]. These last techniques are not (yet) suitable for biometric vein imaging due
to costs, addition of contrast fluid, resolution, hazardous radiation, time needed for capturing an image
or other practical implications. Infrared vascular imaging was first used in a medical environment and
it is reasonable to keep track of medical vascular imaging developments to improve biometric vein
imaging. So far, only (near) infrared imaging has been used in biometric devices.
2.4.1 Near infrared imaging
The tissue optical window is in the NIR region of light. In this region light can penetrate
relatively deep into the skin and illuminate underlying structures. Therefore infrared imaging is
important in vascular imaging, and especially for biometric use. The radiation is safe and offers no
significant hazard to the skin, unless it is concentrated to such high degree that it causes burning [79].
Infrared radiating light sources are relatively cheap and commercially available. Infrared sensors to
obtain images are also relatively cheap and commercially available in devices such as a CCD
cameras. They produce infrared images where regions with a higher intensity of emanating NIR light
are brighter, whereas low intensity regions are visualized as dark regions. By making use of the
reflectance and absorbance properties of tissue and blood infrared images captured after illuminating
tissue with NIR light will show darker pixels for vascular regions compared to nonvascular regions.
This is the basic principle for extracting a vein pattern from an infrared image.
CCD camera [5]
A relatively cheap commercially available device is the conventional charged coupled device (CCD)
camera. The CCD camera is often the image capturing device in vein pattern authentication products
[30, 54, 70, 80-83]. Originally, they are designed to capture visible light, but CCD cameras are also
sensitive to near IR wavelengths of the electromagnetic spectrum up to approximately 1100 nm.
(figure 8). A CCD is an image sensor, it consists of an integrated circuit containing an array of linked,
or coupled, capacitors sensitive to light. To transfer an image into a digital signal, the image is
projected by a lens on the capacitor array, causing each capacitor to accumulate an electric charge
proportional to the light intensity at that location. CCDs containing grids of capacitors (pixels) are
used in digital cameras, optical scanners and video cameras as light-sensing devices. A one-
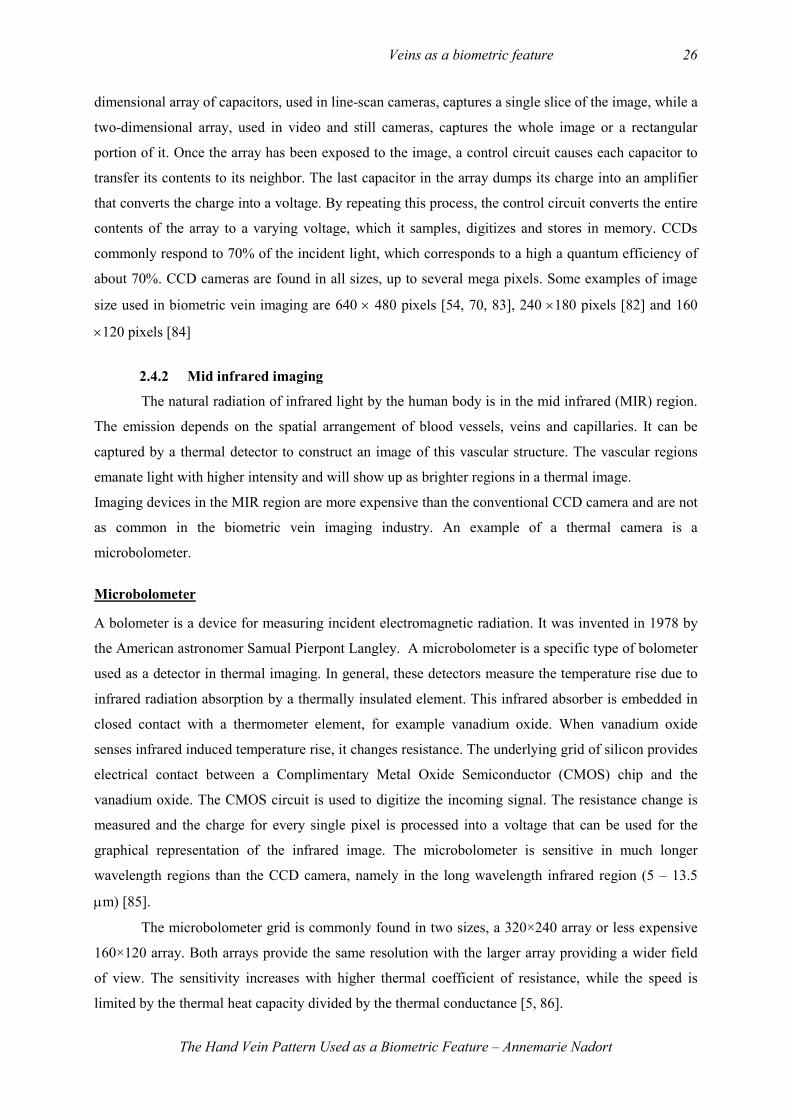
Veins as a biometric feature 26
The Hand Vein Pattern Used as a Biometric Feature – Annemarie Nadort
dimensional array of capacitors, used in line-scan cameras, captures a single slice of the image, while a
two-dimensional array, used in video and still cameras, captures the whole image or a rectangular
portion of it. Once the array has been exposed to the image, a control circuit causes each capacitor to
transfer its contents to its neighbor. The last capacitor in the array dumps its charge into an amplifier
that converts the charge into a voltage. By repeating this process, the control circuit converts the entire
contents of the array to a varying voltage, which it samples, digitizes and stores in memory. CCDs
commonly respond to 70% of the incident light, which corresponds to a high a quantum efficiency of
about 70%. CCD cameras are found in all sizes, up to several mega pixels. Some examples of image
size used in biometric vein imaging are 640 × 480 pixels [54, 70, 83], 240 ×180 pixels [82] and 160
×120 pixels [84]
2.4.2 Mid infrared imaging
The natural radiation of infrared light by the human body is in the mid infrared (MIR) region.
The emission depends on the spatial arrangement of blood vessels, veins and capillaries. It can be
captured by a thermal detector to construct an image of this vascular structure. The vascular regions
emanate light with higher intensity and will show up as brighter regions in a thermal image.
Imaging devices in the MIR region are more expensive than the conventional CCD camera and are not
as common in the biometric vein imaging industry. An example of a thermal camera is a
microbolometer.
Microbolometer
A bolometer is a device for measuring incident electromagnetic radiation. It was invented in 1978 by
the American astronomer Samual Pierpont Langley. A microbolometer is a specific type of bolometer
used as a detector in thermal imaging. In general, these detectors measure the temperature rise due to
infrared radiation absorption by a thermally insulated element. This infrared absorber is embedded in
closed contact with a thermometer element, for example vanadium oxide. When vanadium oxide
senses infrared induced temperature rise, it changes resistance. The underlying grid of silicon provides
electrical contact between a Complimentary Metal Oxide Semiconductor (CMOS) chip and the
vanadium oxide. The CMOS circuit is used to digitize the incoming signal. The resistance change is
measured and the charge for every single pixel is processed into a voltage that can be used for the
graphical representation of the infrared image. The microbolometer is sensitive in much longer
wavelength regions than the CCD camera, namely in the long wavelength infrared region (5 – 13.5
µm) [85].
The microbolometer grid is commonly found in two sizes, a 320×240 array or less expensive
160×120 array. Both arrays provide the same resolution with the larger array providing a wider field
of view. The sensitivity increases with higher thermal coefficient of resistance, while the speed is
limited by the thermal heat capacity divided by the thermal conductance [5, 86].

Veins as a biometric feature 27
The Hand Vein Pattern Used as a Biometric Feature – Annemarie Nadort
Figure 12. Emission curve of a typical 880±25 nm LED, superimposed on the response curve for a
typical silicon-based CCD sensor. Obtained from [54] figure 3a.
Figure 13. Transmission curve for a 900nm high-pass filter. Obtained from[54], figure 4.
Veins as a biometric feature 28
The Hand Vein Pattern Used as a Biometric Feature – Annemarie Nadort
2.4.3 Optical filters
In most devices that capture a vein image an optical filter is introduced, which only permits
the infrared light to enter the imaging device (often CCD). This can be either a band-pass filter or a
long-pass filter, which will attenuate wavelengths outside the band respectively shorter wavelengths
and transmit band wavelengths respectively longer wavelengths over the active range of the target
spectrum. Depending on the quality of the filter unwanted (visible) radiation is substantially reduced,
thereby enhancing the visibility of the veins and the quality of the vein image [87]. An example of the
use of filter to enhance a vein image is shown by figures 12 and 13. Figure 12 shows the emission
curve of a typical 880nm IR-LED, superimposed on the response curve for a typical CCD sensor. In a
normal vein imaging environment there will be a lot of contaminating light from wavelengths below
the LED emission curve on the CCD sensor. Therefore a high-pass filter is used to filter out the lower
wavelengths. The filter used is shown in figure 13, and is designed to transmit wavelengths greater
than 900nm. As can be seen, the filter will also reduce the wanted wavelengths from the LED and is
therefore not ideal, though it is used in a biometric vein imaging study. This shows the need for good
filters and light sources, which is probably restricted due to costs.

Veins as a biometric feature 29
The Hand Vein Pattern Used as a Biometric Feature – Annemarie Nadort
Veins as a biometric feature 30
The Hand Vein Pattern Used as a Biometric Feature – Annemarie Nadort
2.5 Discussion
This first section on veins addresses the question whether the vein pattern is a suitable biometric
feature or not. To come closer to the answer, the uniqueness, time-invariance, optical properties and
imaging methods are described. A discussion on these subjects will follow below.
2.5.1 Uniqueness
The development of the vascular structure in the human body starts very early in embryonic
stages of life. It is believed that hemodynamic forces as well as signalling molecules are responsible
for the differentiation into veins and arteries [32]. These signalling molecules share similarities with
molecules responsible for the development of the nervous system. Specialized cells are present at the
ends of growing vessels that sense the environment and ‘guide’ the vessel through the body.
The process of arranging the vascular system is therefore not totally random: the discovery of
‘guiding’ molecules suggests some sort of organized growing. The main goal of the vascular network
is to provide means for transporting oxygen and waste products from and to everywhere in the body.
Regarding the hand, its broad features are quite similar in almost every human being: five fingers on
specific spots around a square-like centre. So for each hand the vascular system has to provide blood
to all five fingers and the vessels are guided to these peripheries in the body. Therefore there might be
some sort of optimal vessel structure to provide blood to five fingers and this may reduce the
uniqueness of each hand vein pattern.
In addition, hemodynamic forces are thought to influence vascular arrangement due to the
body’s tendency to minimize pumping energy. Several processes have been identified in relation to
vascular growth. They provide a mechanism of efficiently generating complex blood transport systems
from limited genetic information. This suggests that hemodynamic factors can instruct embryonic
vascular remodelling toward optimality [88].
The human vascular network will be as optimal as possible, due to hemodynamic forces and
signalling molecules. Optimality is not an uncommon goal of natural processes. Nevertheless for
individuals an optimal vascular network will depend on individual features, and is probably not the
same for each human. Moreover, within an optimal structure, there might still be room for variance
and random growth. Studying the finished vascular spatial arrangements gives insight into this
variation amongst individuals.
Factal-like models as well as models based on branching geometry have been put forward.
Fractal-like structures are found in vascular networks in organs such as the lungs or the kidneys [35-
39]. For peripheral vasculature, models based on branching geometry are found more often in
literature [42, 44]. The final goal of the system is to supply blood to the whole human body in an
energy efficient way. Branching of vessels depends on the tissue volume that is fed by each vessel, the
length/diameter relation, local anatomy, and several other (unknown) constraints. Due to high variety
Veins as a biometric feature 31
The Hand Vein Pattern Used as a Biometric Feature – Annemarie Nadort
in branching parameters found in vivo, for which the origin is unknown, no model has fully simulated
the vascular system, although it is known that it cannot be simulated with random variables [42].
It can thus be said that the inter-variability of individual vascular structures is high, although
they will all be influenced by similar factors and satisfy on the aim of optimality. Reliable models of
the vascular system do not exist and specific data on the hand vascular spatial arrangement has not
been found in literature. So far, no resource has reported the existence of similar hand vein patterns,
not in the right and left hand of one person [29], not in fingers of the same hand [24], and not between
identical twins [28], although these studies are not in-depth.
2.5.2 Time invariance
The only variation in vascular structure that is reported by the biometric industry is the
variation due to growth [54, 67]. During life the human skeleton grows in the first phases and shrinks
in the last phases. The vascular networks function is to provide oxygen to all places in the body, and
therefore adapts to the size of the body. It will extend and evolve throughout life, with major changes
before 20 and minor changes during the ageing process from 20 years on. Other natural vascular
changes are due to weather conditions, physical activity and alcohol intake.
But in pathological conditions vascular changes can also occur. Vascular remodelling under
hypertension results in thickening or thinning of the vessel wall, in both lumen and external diameter.
Formation of new vessels occurs during angiogenic processes associated with tumour growth. This can
lead to a whole new network of vessels around a tumour. The influence of both processes on the hand
veins is hard to estimate. Remodelling under influence of changed hemodynamic forces (due to food
habits, smoking, and other vascular diseases) can happen in peripheral veins, such as the hand. This
will merely result in changed diameters of the veins and not in a changed structure. The subcutaneous
area is not a common site for human tumours [57], and bone tumors and soft tissue tumors of the hand
and upper limb are uncommon [89]. Nevertheless, several cases are known of tumours in the hand
area. The vessels formed due to tumour angiogenetic over-expression of VEGF are leaky and tortuous,
in combination with other compounds they might become less leaky, and the diameter of the resulting
vessels is not uniform [57].
There are several methods mentioned where man-made changes in vascular structures occur:
anti-angiogenic cancer treatment [57], angiogenic treatments to promote the growth of arteries in
ischemic regions [60, 62], by-pass surgery, varicose vein stripping and skeletal remodelling with
indirect consequences for vascular remodelling [34]. Because of the major role of angiogenesis in
several pathologies of significant medical as well as social impact, there is great interest in the
possibility of modulating this mechanism pharmacologically. According to the angiogenesis
foundation “at least 184 and 310 million patients in the western nations can benefit, respectively, from
anti-angiogenic and proangiogenic therapy. Currently, more than 200 biotech companies, as well as
large pharmaceutical companies have programs aimed at the development of new pharmaceuticals
Veins as a biometric feature 32
The Hand Vein Pattern Used as a Biometric Feature – Annemarie Nadort
which act on the angiogenic process and it has been estimated that so far the research and development
of angiogenesis-based molecules is one of the most well-financed field of medical research” [60]. In
the future these therapies are likely to improve significantly. Because it is not possible to ‘program’
angiogenesis to specific structures, (anti)angiogenic therapies cannot exactly copy someone’s vein
pattern, they can possibly change it. And although bypass operations don’t occur in the hand,
surgically it is possible to rearrange veins [90, 91], and maybe in the future in any required position.
2.5.3 Optical properties and vein imaging
The quality of vein images using natural emanating mid-IR-light depends highly on the quality
of the thermal cameras (which are also rather expensive) and of the contrast in temperature between
different tissues and veins of the hand. This is a problem, for example in the case of a thick layer of
subcutaneous fat on the hand [67] or in an outside setting in extreme environmental conditions [1].
The advantage is that thermal images can be made even in the total absence of light, so that the
method is not constrained by lighting conditions in contrast to NIR-vein imaging [67].
On the other hand, the distinct absorption and scattering coefficient of tissue and blood
modelled with photon diffusion theory make it possible to image veins using information from
reflected light. The coefficients k and w are dependent on wavelength. In near-infrared light, the
absorption coefficient is very small while the scattering coefficient is still large. The weak absorption
of NIR radiation means that NIR light can traverse a greater distance in tissue before it is completely
attenuated by tissue absorption.
The thickness of the epidermis (the outermost layer of the skin) including the stratum corneum
(‘the horny layer’) is 10-150 µm. The dermis lying beneath the epidermis consists of connective tissue
and contains blood vessels of different sizes, sweat glands, sebaceous glands and hair follicles. The
thickness of the dermal layer is 1-4 mm [71].
To visualize the veins, the light must illuminate the subcutaneous region. Statements on
penetrations depths differ between literatures. Depths of several centimetres can be sampled in tissue
using NIR light [92], while other reports state that ‘the light may go through dermis (1-4 mm) and
reach into subcutaneous tissue for the longer wavelengths (770 – 1000 nm)’[71]. In [72] is mentioned
that ‘NIR light to be detected across many centimetres of tissue’ while [74] states that the light within
the optical window ‘allows light to penetrate from a few hundreds of micrometers to a few millimeters
into the skin’, wherein ‘904 nm wavelength is particularly interesting, because the optical penetration
in the skin close to this wavelength is the deepest’. Others [79] report that ‘within the 650-1000 nm
window, it is possible with sensitive instrumentation to detect light which has traversed up to 8 cm. of
tissue’.
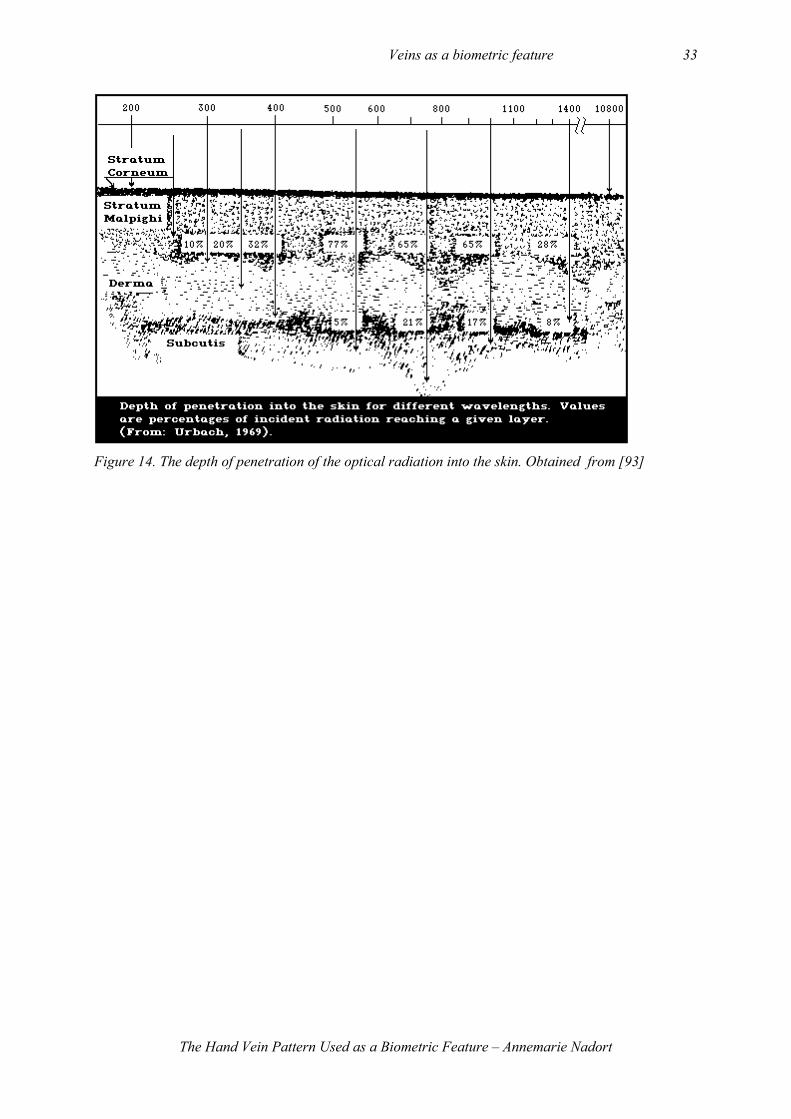
Veins as a biometric feature 33
The Hand Vein Pattern Used as a Biometric Feature – Annemarie Nadort
Figure 14. The depth of penetration of the optical radiation into the skin. Obtained from [93]
Veins as a biometric feature 34
The Hand Vein Pattern Used as a Biometric Feature – Annemarie Nadort
Figure 14 shows the results of another study on penetration into the skin for different wavelengths
ranging from 200nm (near UV) to 10800nm (far infrared). Other factors influencing the penetration
depth (which might be responsible for the non consensus in literature) are blood oxygenation and
blood volume.
Absorption and scattering properties of tissue containing blood are as said dependent on mean
blood fractional volume. A higher mean blood fractional volume will cause more absorption of the
incident light, and vice versa. Variation in mean blood fractional volume within body parts occurs with
arterial blood pulsation and with random fluctuations (i.e., physiological noise) [71]. Variation in
mean blood fractional volume between different body parts also exists. The blood fractional volumes
are expected to be in decreasing order starting from finger tip (highest), cheek, palm, forearm, and
anterior surface of the lower leg (lowest) [71].
The main components responsible for tissue absorption in the NIR region are deoxy- and
oxyhemoglobin. Therefore, veins will absorb more light than the surrounding tissue. The absorption
coefficient w is also dependent on blood oxygen saturation (see figure 10 and 11 above). This property
is the basis for measurements of non-invasive blood oxygen saturation in patients [5]. In case of vein
pattern extraction it is important to be aware of this property, because absorption and scattering of the
NIR light will depend on the exact wavelength used for imaging. At some wavelengths arteries
containing mainly oxyhemoglobin will absorb more radiation than veins containing mainly
deoxyhemoglobin. The same pattern captured at a lower wavelength were the oxyhemoglobin absorbs
less than deoxyhemoglobin will show the same veins and arteries but with different relative intensities.
At one wavelength, called the isobestic wavelength, the absorption and extinction coefficient for oxy-
and deoxyhemoglobin are exactly the same. This is at 805 nm (see figure 10).
The penetration into the skin due to a high scattering coefficient together with a lower
absorption coefficient not only introduces an unknown light loss, but also results in a non-linear
relationship between absorption changes and the resulting attenuation changes. The consequence of a
high scattering coefficient is that the light entering the tissues rapidly becomes a diffuse photon
density which then propagates through the tissue [72]. The deep penetration of NIR light into tissue
therefore has the advantage to illuminate subcutaneous veins and visualize them due to their distinct
absorption properties, but it has the disadvantage that the scattered photons change directions along a
long way back to the detector which makes the image slightly blurred.
The uniqueness, time-invariance and optical properties of the hand vein pattern that have just
been discussed will have implications on the validity of a hand vein pattern as a biometric feature, but
this also depends on the techniques available. The topics of the next section are the techniques that are
used in commercial and scientific exploration of biometric hand vein pattern verification methods.

Veins as a biometric feature 35
The Hand Vein Pattern Used as a Biometric Feature – Annemarie Nadort
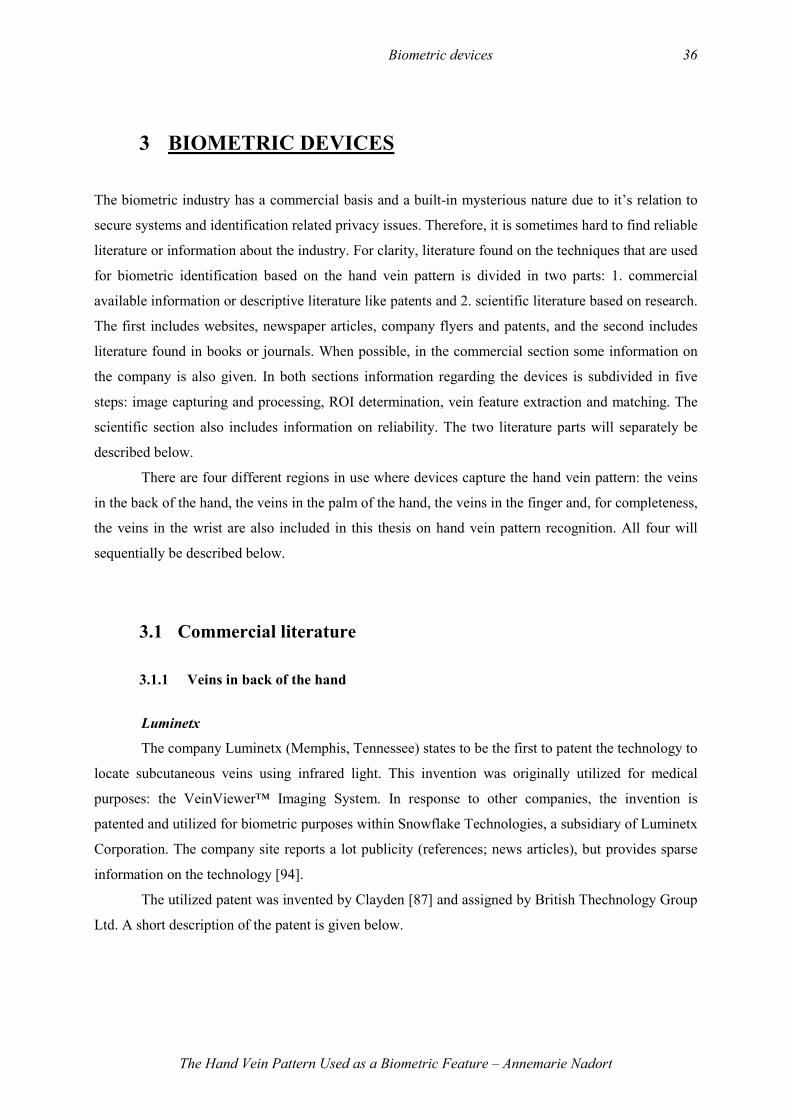
Biometric devices 36
The Hand Vein Pattern Used as a Biometric Feature – Annemarie Nadort
3 BIOMETRIC DEVICES The biometric industry has a commercial basis and a built-in mysterious nature due to it’s relation to
secure systems and identification related privacy issues. Therefore, it is sometimes hard to find reliable
literature or information about the industry. For clarity, literature found on the techniques that are used
for biometric identification based on the hand vein pattern is divided in two parts: 1. commercial
available information or descriptive literature like patents and 2. scientific literature based on research.
The first includes websites, newspaper articles, company flyers and patents, and the second includes
literature found in books or journals. When possible, in the commercial section some information on
the company is also given. In both sections information regarding the devices is subdivided in five
steps: image capturing and processing, ROI determination, vein feature extraction and matching. The
scientific section also includes information on reliability. The two literature parts will separately be
described below.
There are four different regions in use where devices capture the hand vein pattern: the veins
in the back of the hand, the veins in the palm of the hand, the veins in the finger and, for completeness,
the veins in the wrist are also included in this thesis on hand vein pattern recognition. All four will
sequentially be described below.
3.1 Commercial literature
3.1.1 Veins in back of the hand
Luminetx
The company Luminetx (Memphis, Tennessee) states to be the first to patent the technology to
locate subcutaneous veins using infrared light. This invention was originally utilized for medical
purposes: the VeinViewer™ Imaging System. In response to other companies, the invention is
patented and utilized for biometric purposes within Snowflake Technologies, a subsidiary of Luminetx
Corporation. The company site reports a lot publicity (references; news articles), but provides sparse
information on the technology [94].
The utilized patent was invented by Clayden [87] and assigned by British Thechnology Group
Ltd. A short description of the patent is given below.
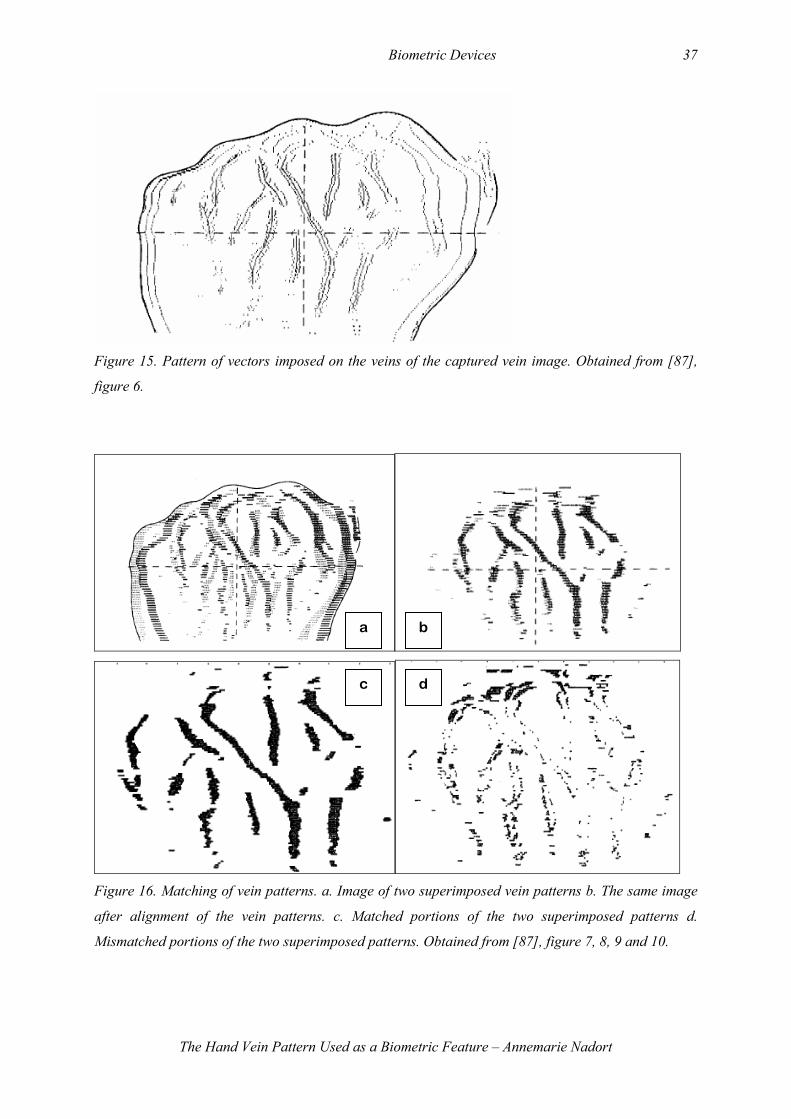
Biometric Devices 37
The Hand Vein Pattern Used as a Biometric Feature – Annemarie Nadort
Figure 15. Pattern of vectors imposed on the veins of the captured vein image. Obtained from [87],
figure 6.
Figure 16. Matching of vein patterns. a. Image of two superimposed vein patterns b. The same image
after alignment of the vein patterns. c. Matched portions of the two superimposed patterns d.
Mismatched portions of the two superimposed patterns. Obtained from [87], figure 7, 8, 9 and 10.
a
b
c
d
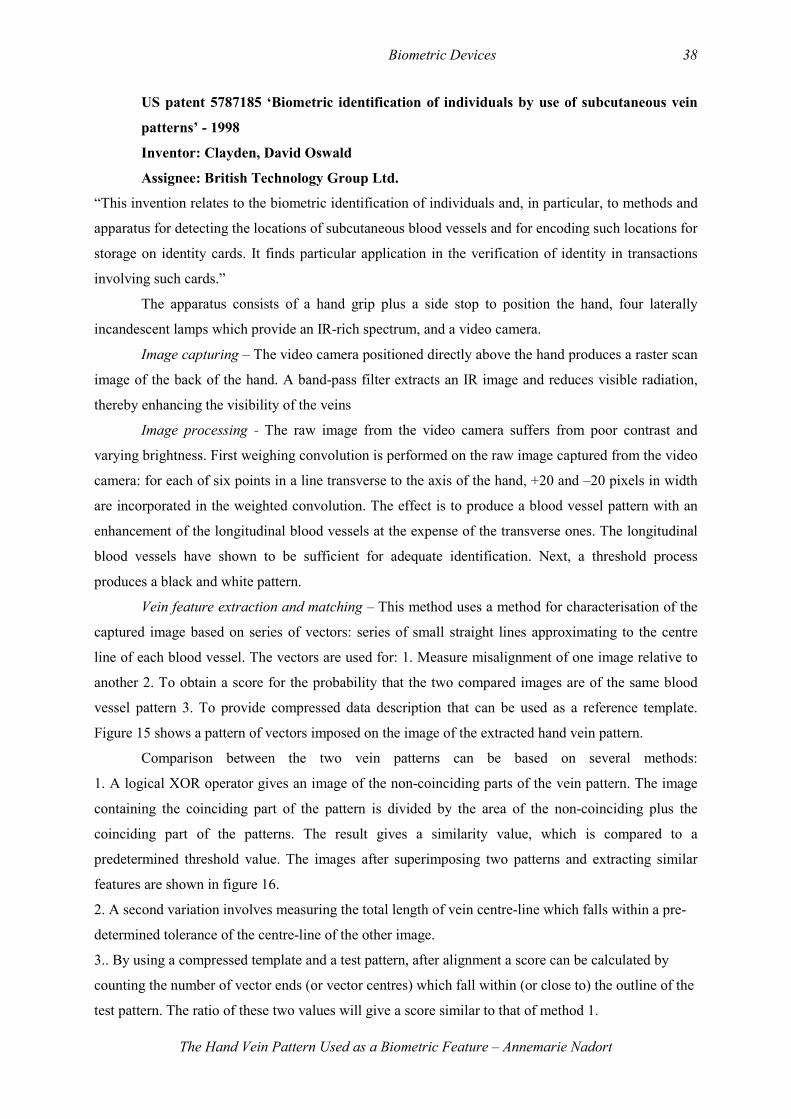
Biometric Devices 38
The Hand Vein Pattern Used as a Biometric Feature – Annemarie Nadort
US patent 5787185 ‘Biometric identification of individuals by use of subcutaneous vein
patterns’ - 1998
Inventor: Clayden, David Oswald
Assignee: British Technology Group Ltd.
“This invention relates to the biometric identification of individuals and, in particular, to methods and
apparatus for detecting the locations of subcutaneous blood vessels and for encoding such locations for
storage on identity cards. It finds particular application in the verification of identity in transactions
involving such cards.”
The apparatus consists of a hand grip plus a side stop to position the hand, four laterally
incandescent lamps which provide an IR-rich spectrum, and a video camera.
Image capturing – The video camera positioned directly above the hand produces a raster scan
image of the back of the hand. A band-pass filter extracts an IR image and reduces visible radiation,
thereby enhancing the visibility of the veins
Image processing - The raw image from the video camera suffers from poor contrast and
varying brightness. First weighing convolution is performed on the raw image captured from the video
camera: for each of six points in a line transverse to the axis of the hand, +20 and –20 pixels in width
are incorporated in the weighted convolution. The effect is to produce a blood vessel pattern with an
enhancement of the longitudinal blood vessels at the expense of the transverse ones. The longitudinal
blood vessels have shown to be sufficient for adequate identification. Next, a threshold process
produces a black and white pattern.
Vein feature extraction and matching – This method uses a method for characterisation of the
captured image based on series of vectors: series of small straight lines approximating to the centre
line of each blood vessel. The vectors are used for: 1. Measure misalignment of one image relative to
another 2. To obtain a score for the probability that the two compared images are of the same blood
vessel pattern 3. To provide compressed data description that can be used as a reference template.
Figure 15 shows a pattern of vectors imposed on the image of the extracted hand vein pattern.
Comparison between the two vein patterns can be based on several methods:
1. A logical XOR operator gives an image of the non-coinciding parts of the vein pattern. The image
containing the coinciding part of the pattern is divided by the area of the non-coinciding plus the
coinciding part of the patterns. The result gives a similarity value, which is compared to a
predetermined threshold value. The images after superimposing two patterns and extracting similar
features are shown in figure 16.
2. A second variation involves measuring the total length of vein centre-line which falls within a pre-
determined tolerance of the centre-line of the other image.
3.. By using a compressed template and a test pattern, after alignment a score can be calculated by
counting the number of vector ends (or vector centres) which fall within (or close to) the outline of the
test pattern. The ratio of these two values will give a score similar to that of method 1.

Biometric Devices 39
The Hand Vein Pattern Used as a Biometric Feature – Annemarie Nadort
4. Variation 4 involves using a compressed template and the centre-lines of a test pattern. The test is
set by the length of centre-line which falls within a predetermined tolerance of the vectors of the
template after alignment.
5. A fifth method uses two sets of vectors, a test pattern and a corresponding pattern derived from
measurements on an individual, and accesses the misalignment of the vector ends of one pattern and
the vectors of the other pattern.
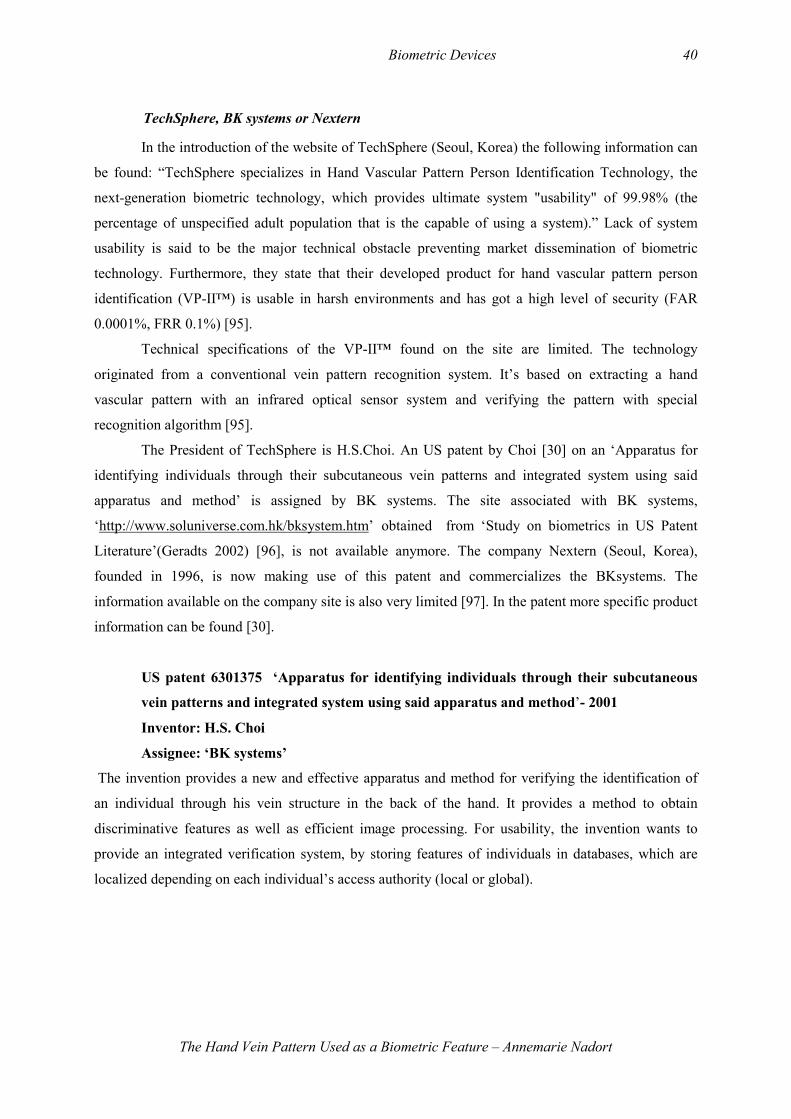
Biometric Devices 40
The Hand Vein Pattern Used as a Biometric Feature – Annemarie Nadort
TechSphere, BK systems or Nextern
In the introduction of the website of TechSphere (Seoul, Korea) the following information can
be found: “TechSphere specializes in Hand Vascular Pattern Person Identification Technology, the
next-generation biometric technology, which provides ultimate system "usability" of 99.98% (the
percentage of unspecified adult population that is the capable of using a system).” Lack of system
usability is said to be the major technical obstacle preventing market dissemination of biometric
technology. Furthermore, they state that their developed product for hand vascular pattern person
identification (VP-II™) is usable in harsh environments and has got a high level of security (FAR
0.0001%, FRR 0.1%) [95].
Technical specifications of the VP-II™ found on the site are limited. The technology
originated from a conventional vein pattern recognition system. It’s based on extracting a hand
vascular pattern with an infrared optical sensor system and verifying the pattern with special
recognition algorithm [95].
The President of TechSphere is H.S.Choi. An US patent by Choi [30] on an ‘Apparatus for
identifying individuals through their subcutaneous vein patterns and integrated system using said
apparatus and method’ is assigned by BK systems. The site associated with BK systems,
‘http://www.soluniverse.com.hk/bksystem.htm’ obtained from ‘Study on biometrics in US Patent
Literature’(Geradts 2002) [96], is not available anymore. The company Nextern (Seoul, Korea),
founded in 1996, is now making use of this patent and commercializes the BKsystems. The
information available on the company site is also very limited [97]. In the patent more specific product
information can be found [30].
US patent 6301375 ‘Apparatus for identifying individuals through their subcutaneous
vein patterns and integrated system using said apparatus and method’- 2001
Inventor: H.S. Choi
Assignee: ‘BK systems’
The invention provides a new and effective apparatus and method for verifying the identification of
an individual through his vein structure in the back of the hand. It provides a method to obtain
discriminative features as well as efficient image processing. For usability, the invention wants to
provide an integrated verification system, by storing features of individuals in databases, which are
localized depending on each individual’s access authority (local or global).
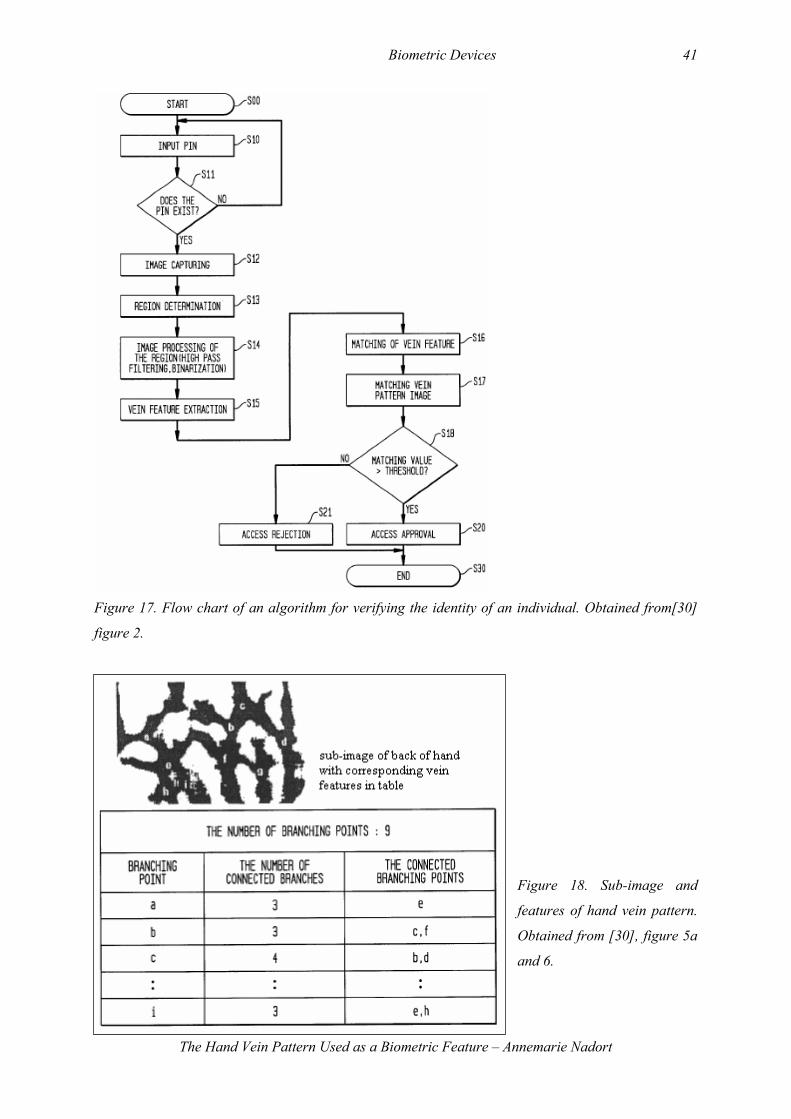
Biometric Devices 41
The Hand Vein Pattern Used as a Biometric Feature – Annemarie Nadort
Figure 17. Flow chart of an algorithm for verifying the identity of an individual. Obtained from[30]
figure 2.
Figure 18. Sub-image and
features of hand vein pattern.
Obtained from [30], figure 5a
and 6.
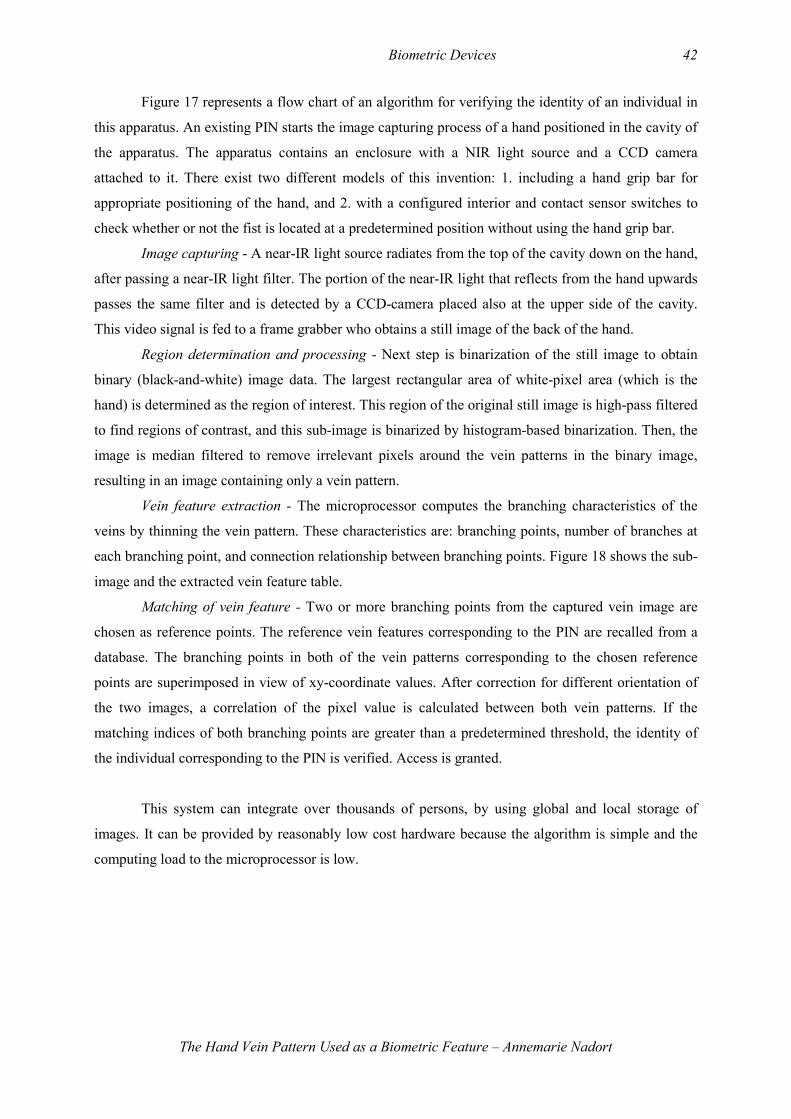
Biometric Devices 42
The Hand Vein Pattern Used as a Biometric Feature – Annemarie Nadort
Figure 17 represents a flow chart of an algorithm for verifying the identity of an individual in
this apparatus. An existing PIN starts the image capturing process of a hand positioned in the cavity of
the apparatus. The apparatus contains an enclosure with a NIR light source and a CCD camera
attached to it. There exist two different models of this invention: 1. including a hand grip bar for
appropriate positioning of the hand, and 2. with a configured interior and contact sensor switches to
check whether or not the fist is located at a predetermined position without using the hand grip bar.
Image capturing - A near-IR light source radiates from the top of the cavity down on the hand,
after passing a near-IR light filter. The portion of the near-IR light that reflects from the hand upwards
passes the same filter and is detected by a CCD-camera placed also at the upper side of the cavity.
This video signal is fed to a frame grabber who obtains a still image of the back of the hand.
Region determination and processing - Next step is binarization of the still image to obtain
binary (black-and-white) image data. The largest rectangular area of white-pixel area (which is the
hand) is determined as the region of interest. This region of the original still image is high-pass filtered
to find regions of contrast, and this sub-image is binarized by histogram-based binarization. Then, the
image is median filtered to remove irrelevant pixels around the vein patterns in the binary image,
resulting in an image containing only a vein pattern.
Vein feature extraction - The microprocessor computes the branching characteristics of the
veins by thinning the vein pattern. These characteristics are: branching points, number of branches at
each branching point, and connection relationship between branching points. Figure 18 shows the sub-
image and the extracted vein feature table.
Matching of vein feature - Two or more branching points from the captured vein image are
chosen as reference points. The reference vein features corresponding to the PIN are recalled from a
database. The branching points in both of the vein patterns corresponding to the chosen reference
points are superimposed in view of xy-coordinate values. After correction for different orientation of
the two images, a correlation of the pixel value is calculated between both vein patterns. If the
matching indices of both branching points are greater than a predetermined threshold, the identity of
the individual corresponding to the PIN is verified. Access is granted.
This system can integrate over thousands of persons, by using global and local storage of
images. It can be provided by reasonably low cost hardware because the algorithm is simple and the
computing load to the microprocessor is low.

Biometric Devices 43
The Hand Vein Pattern Used as a Biometric Feature – Annemarie Nadort
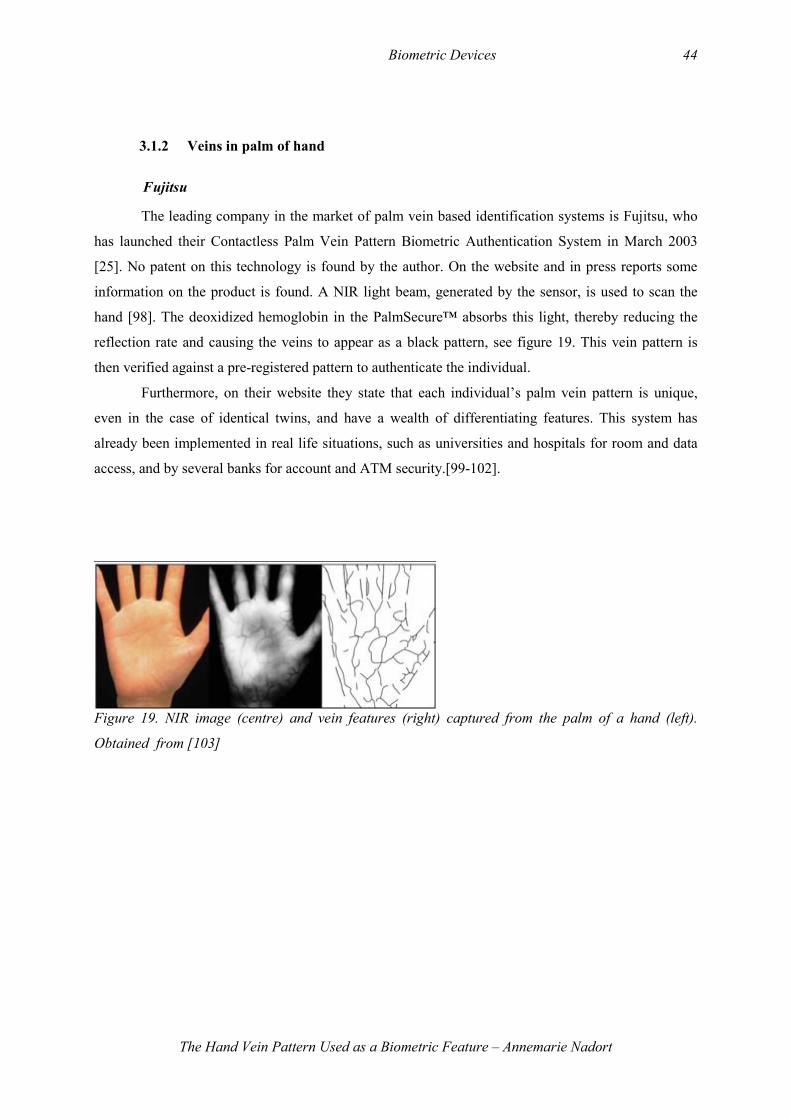
Biometric Devices 44
The Hand Vein Pattern Used as a Biometric Feature – Annemarie Nadort
3.1.2 Veins in palm of hand
Fujitsu
The leading company in the market of palm vein based identification systems is Fujitsu, who
has launched their Contactless Palm Vein Pattern Biometric Authentication System in March 2003
[25]. No patent on this technology is found by the author. On the website and in press reports some
information on the product is found. A NIR light beam, generated by the sensor, is used to scan the
hand [98]. The deoxidized hemoglobin in the PalmSecure™ absorbs this light, thereby reducing the
reflection rate and causing the veins to appear as a black pattern, see figure 19. This vein pattern is
then verified against a pre-registered pattern to authenticate the individual.
Furthermore, on their website they state that each individual’s palm vein pattern is unique,
even in the case of identical twins, and have a wealth of differentiating features. This system has
already been implemented in real life situations, such as universities and hospitals for room and data
access, and by several banks for account and ATM security.[99-102].
Figure 19. NIR image (centre) and vein features (right) captured from the palm of a hand (left).
Obtained from [103]
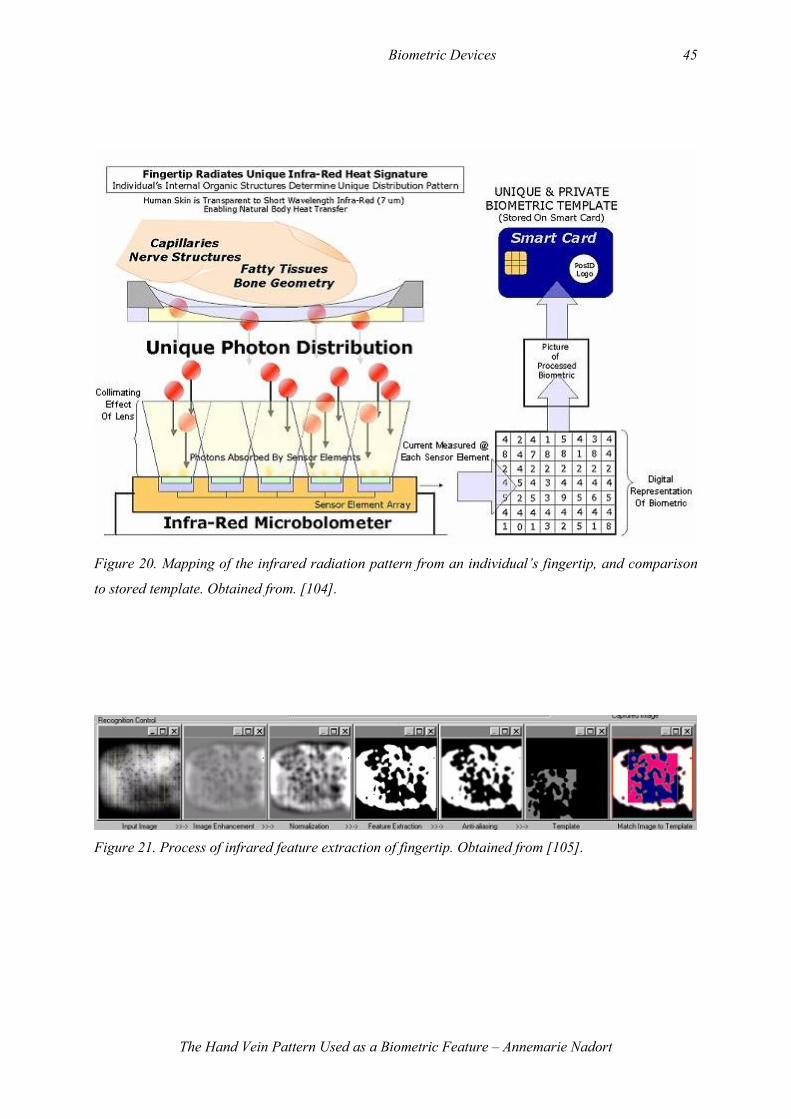
Biometric Devices 45
The Hand Vein Pattern Used as a Biometric Feature – Annemarie Nadort
Figure 20. Mapping of the infrared radiation pattern from an individual’s fingertip, and comparison
to stored template. Obtained from. [104].
Figure 21. Process of infrared feature extraction of fingertip. Obtained from [105].
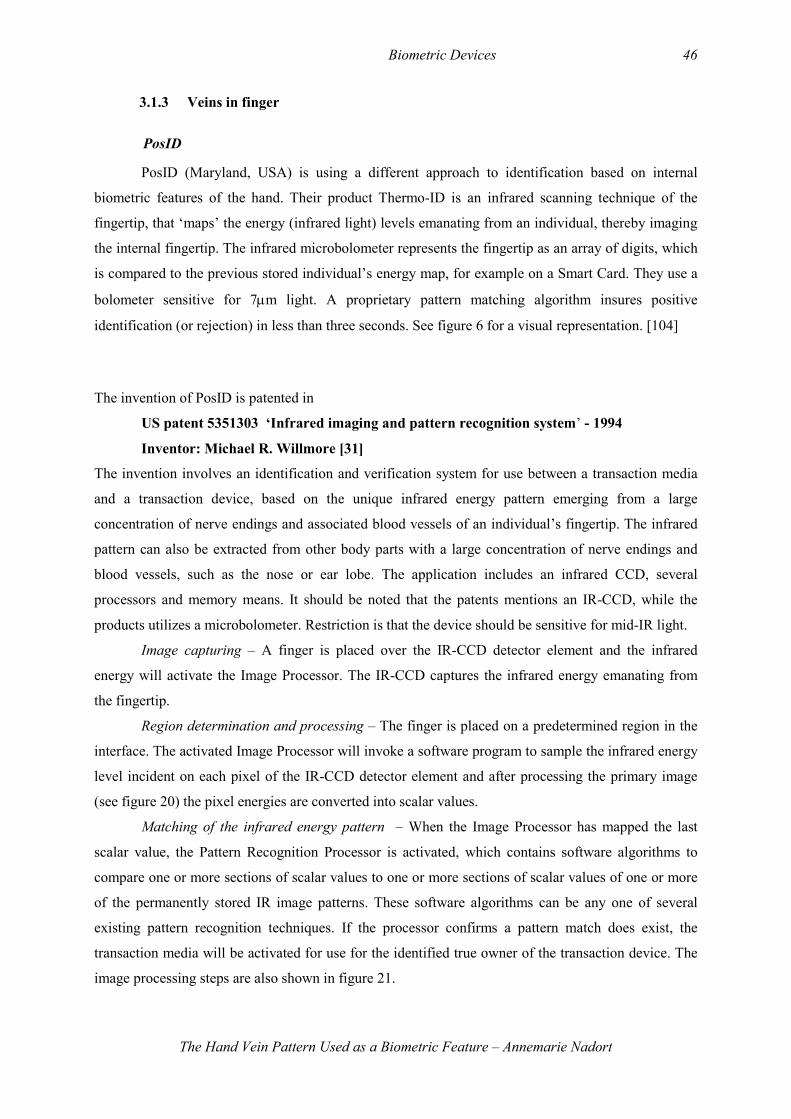
Biometric Devices 46
The Hand Vein Pattern Used as a Biometric Feature – Annemarie Nadort
3.1.3 Veins in finger
PosID
PosID (Maryland, USA) is using a different approach to identification based on internal
biometric features of the hand. Their product Thermo-ID is an infrared scanning technique of the
fingertip, that ‘maps’ the energy (infrared light) levels emanating from an individual, thereby imaging
the internal fingertip. The infrared microbolometer represents the fingertip as an array of digits, which
is compared to the previous stored individual’s energy map, for example on a Smart Card. They use a
bolometer sensitive for 7µm light. A proprietary pattern matching algorithm insures positive
identification (or rejection) in less than three seconds. See figure 6 for a visual representation. [104]
The invention of PosID is patented in
US patent 5351303 ‘Infrared imaging and pattern recognition system’ - 1994
Inventor: Michael R. Willmore [31]
The invention involves an identification and verification system for use between a transaction media
and a transaction device, based on the unique infrared energy pattern emerging from a large
concentration of nerve endings and associated blood vessels of an individual’s fingertip. The infrared
pattern can also be extracted from other body parts with a large concentration of nerve endings and
blood vessels, such as the nose or ear lobe. The application includes an infrared CCD, several
processors and memory means. It should be noted that the patents mentions an IR-CCD, while the
products utilizes a microbolometer. Restriction is that the device should be sensitive for mid-IR light.
Image capturing – A finger is placed over the IR-CCD detector element and the infrared
energy will activate the Image Processor. The IR-CCD captures the infrared energy emanating from
the fingertip.
Region determination and processing – The finger is placed on a predetermined region in the
interface. The activated Image Processor will invoke a software program to sample the infrared energy
level incident on each pixel of the IR-CCD detector element and after processing the primary image
(see figure 20) the pixel energies are converted into scalar values.
Matching of the infrared energy pattern – When the Image Processor has mapped the last
scalar value, the Pattern Recognition Processor is activated, which contains software algorithms to
compare one or more sections of scalar values to one or more sections of scalar values of one or more
of the permanently stored IR image patterns. These software algorithms can be any one of several
existing pattern recognition techniques. If the processor confirms a pattern match does exist, the
transaction media will be activated for use for the identified true owner of the transaction device. The
image processing steps are also shown in figure 21.
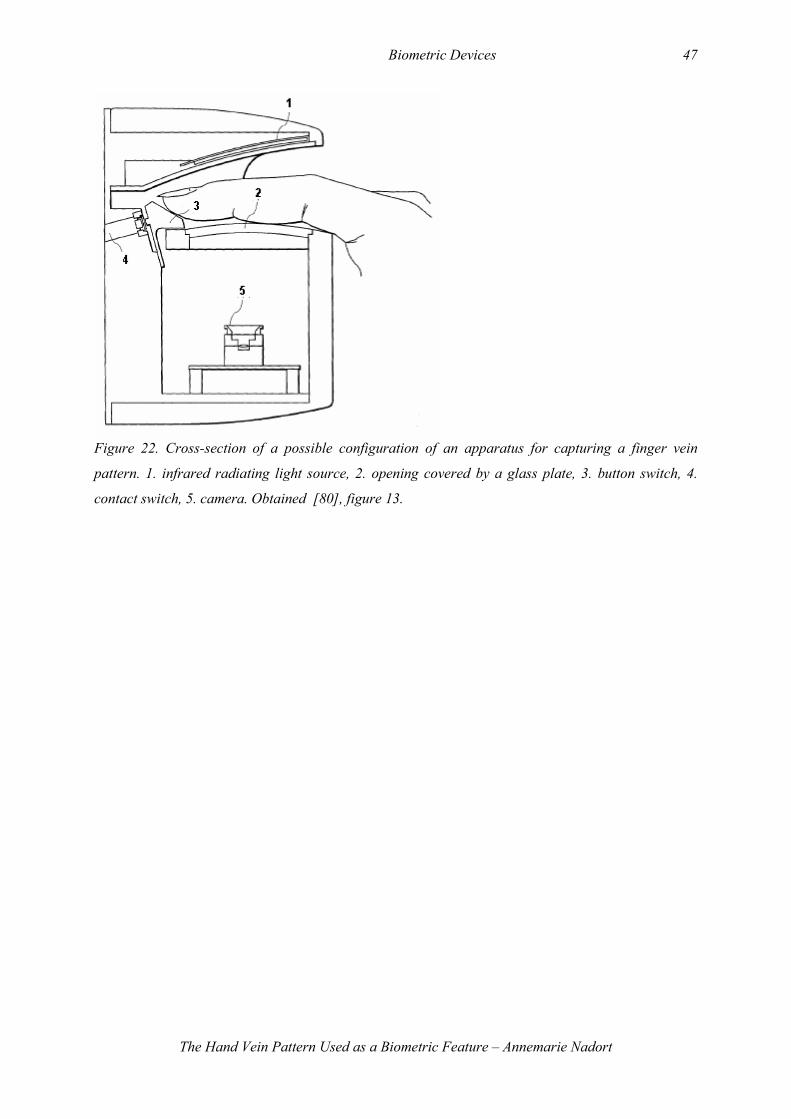
Biometric Devices 47
The Hand Vein Pattern Used as a Biometric Feature – Annemarie Nadort
Figure 22. Cross-section of a possible configuration of an apparatus for capturing a finger vein
pattern. 1. infrared radiating light source, 2. opening covered by a glass plate, 3. button switch, 4.
contact switch, 5. camera. Obtained [80], figure 13.
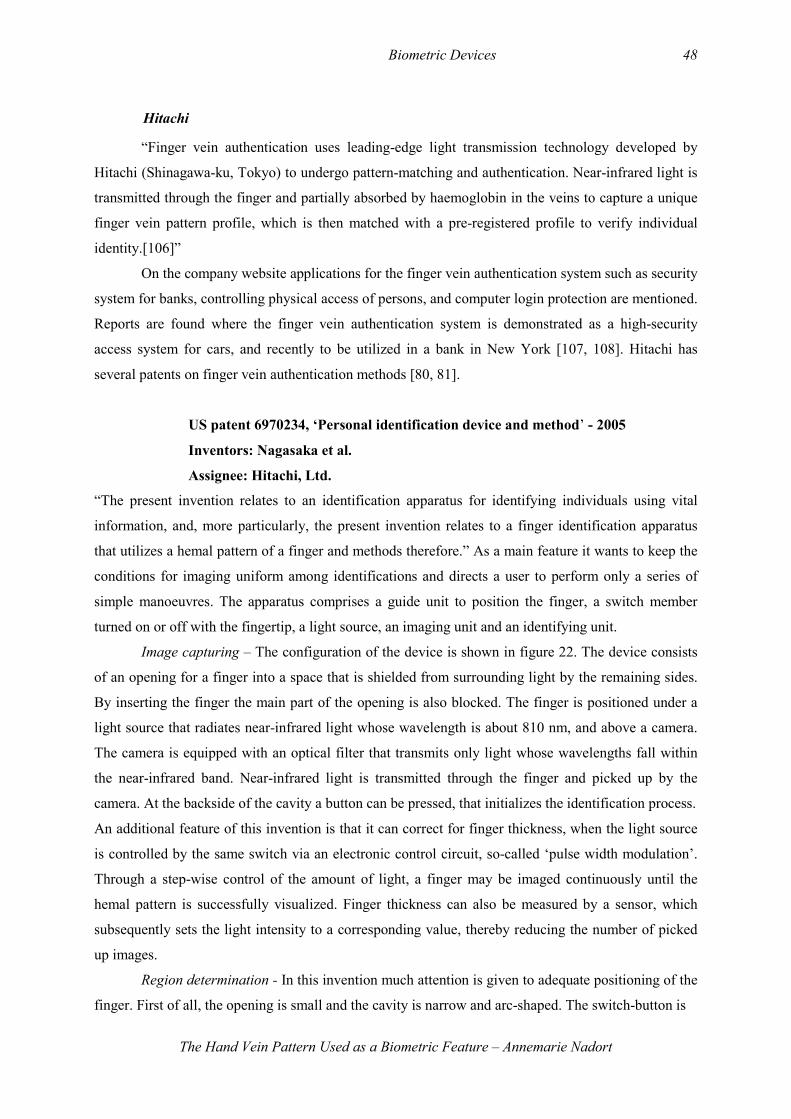
Biometric Devices 48
The Hand Vein Pattern Used as a Biometric Feature – Annemarie Nadort
Hitachi
“Finger vein authentication uses leading-edge light transmission technology developed by
Hitachi (Shinagawa-ku, Tokyo) to undergo pattern-matching and authentication. Near-infrared light is
transmitted through the finger and partially absorbed by haemoglobin in the veins to capture a unique
finger vein pattern profile, which is then matched with a pre-registered profile to verify individual
identity.[106]”
On the company website applications for the finger vein authentication system such as security
system for banks, controlling physical access of persons, and computer login protection are mentioned.
Reports are found where the finger vein authentication system is demonstrated as a high-security
access system for cars, and recently to be utilized in a bank in New York [107, 108]. Hitachi has
several patents on finger vein authentication methods [80, 81].
US patent 6970234, ‘Personal identification device and method’ - 2005
Inventors: Nagasaka et al.
Assignee: Hitachi, Ltd.
“The present invention relates to an identification apparatus for identifying individuals using vital
information, and, more particularly, the present invention relates to a finger identification apparatus
that utilizes a hemal pattern of a finger and methods therefore.” As a main feature it wants to keep the
conditions for imaging uniform among identifications and directs a user to perform only a series of
simple manoeuvres. The apparatus comprises a guide unit to position the finger, a switch member
turned on or off with the fingertip, a light source, an imaging unit and an identifying unit.
Image capturing – The configuration of the device is shown in figure 22. The device consists
of an opening for a finger into a space that is shielded from surrounding light by the remaining sides.
By inserting the finger the main part of the opening is also blocked. The finger is positioned under a
light source that radiates near-infrared light whose wavelength is about 810 nm, and above a camera.
The camera is equipped with an optical filter that transmits only light whose wavelengths fall within
the near-infrared band. Near-infrared light is transmitted through the finger and picked up by the
camera. At the backside of the cavity a button can be pressed, that initializes the identification process.
An additional feature of this invention is that it can correct for finger thickness, when the light source
is controlled by the same switch via an electronic control circuit, so-called ‘pulse width modulation’.
Through a step-wise control of the amount of light, a finger may be imaged continuously until the
hemal pattern is successfully visualized. Finger thickness can also be measured by a sensor, which
subsequently sets the light intensity to a corresponding value, thereby reducing the number of picked
up images.
Region determination - In this invention much attention is given to adequate positioning of the
finger. First of all, the opening is small and the cavity is narrow and arc-shaped. The switch-button is
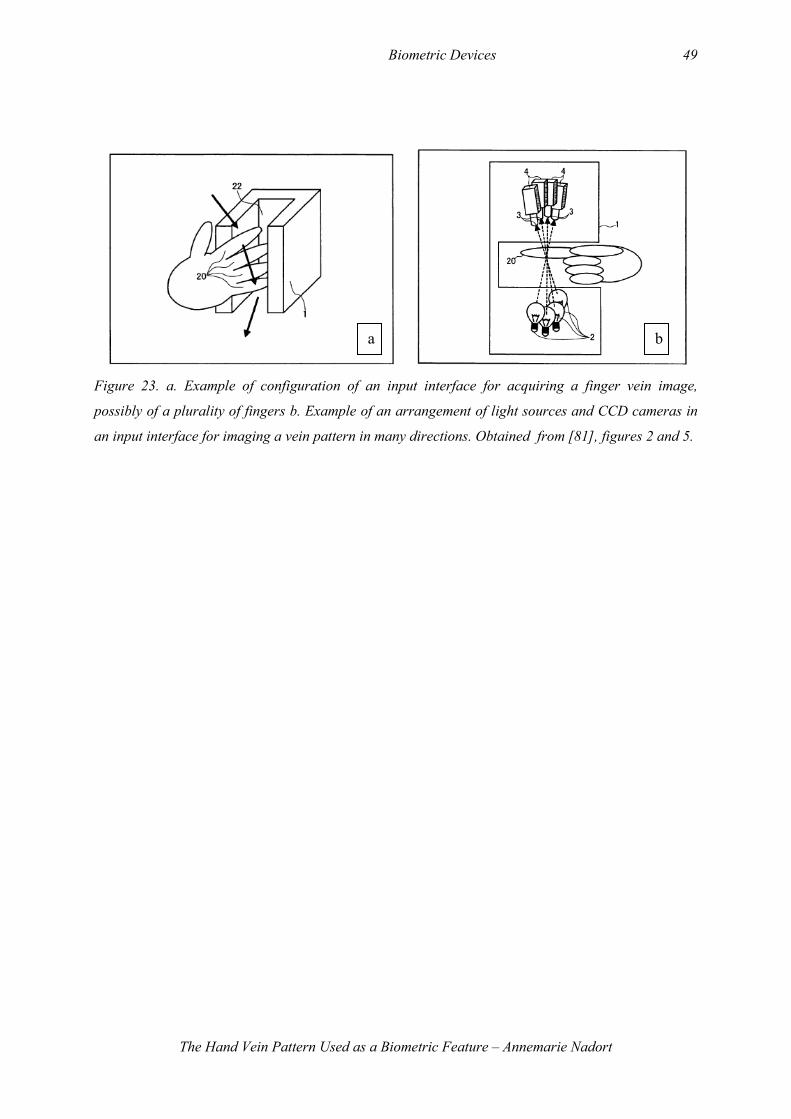
Biometric Devices 49
The Hand Vein Pattern Used as a Biometric Feature – Annemarie Nadort
Figure 23. a. Example of configuration of an input interface for acquiring a finger vein image,
possibly of a plurality of fingers b. Example of an arrangement of light sources and CCD cameras in
an input interface for imaging a vein pattern in many directions. Obtained from [81], figures 2 and 5.
a b
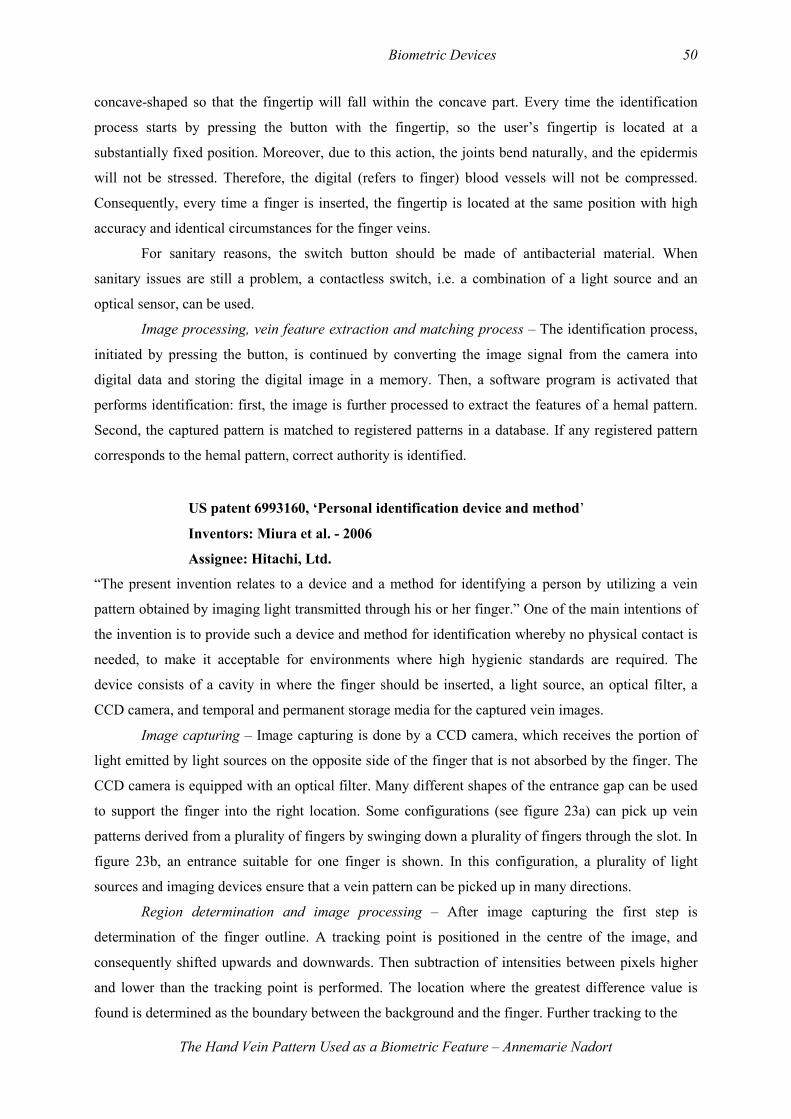
Biometric Devices 50
The Hand Vein Pattern Used as a Biometric Feature – Annemarie Nadort
concave-shaped so that the fingertip will fall within the concave part. Every time the identification
process starts by pressing the button with the fingertip, so the user’s fingertip is located at a
substantially fixed position. Moreover, due to this action, the joints bend naturally, and the epidermis
will not be stressed. Therefore, the digital (refers to finger) blood vessels will not be compressed.
Consequently, every time a finger is inserted, the fingertip is located at the same position with high
accuracy and identical circumstances for the finger veins.
For sanitary reasons, the switch button should be made of antibacterial material. When
sanitary issues are still a problem, a contactless switch, i.e. a combination of a light source and an
optical sensor, can be used.
Image processing, vein feature extraction and matching process – The identification process,
initiated by pressing the button, is continued by converting the image signal from the camera into
digital data and storing the digital image in a memory. Then, a software program is activated that
performs identification: first, the image is further processed to extract the features of a hemal pattern.
Second, the captured pattern is matched to registered patterns in a database. If any registered pattern
corresponds to the hemal pattern, correct authority is identified.
US patent 6993160, ‘Personal identification device and method’
Inventors: Miura et al. - 2006
Assignee: Hitachi, Ltd.
“The present invention relates to a device and a method for identifying a person by utilizing a vein
pattern obtained by imaging light transmitted through his or her finger.” One of the main intentions of
the invention is to provide such a device and method for identification whereby no physical contact is
needed, to make it acceptable for environments where high hygienic standards are required. The
device consists of a cavity in where the finger should be inserted, a light source, an optical filter, a
CCD camera, and temporal and permanent storage media for the captured vein images.
Image capturing – Image capturing is done by a CCD camera, which receives the portion of
light emitted by light sources on the opposite side of the finger that is not absorbed by the finger. The
CCD camera is equipped with an optical filter. Many different shapes of the entrance gap can be used
to support the finger into the right location. Some configurations (see figure 23a) can pick up vein
patterns derived from a plurality of fingers by swinging down a plurality of fingers through the slot. In
figure 23b, an entrance suitable for one finger is shown. In this configuration, a plurality of light
sources and imaging devices ensure that a vein pattern can be picked up in many directions.
Region determination and image processing – After image capturing the first step is
determination of the finger outline. A tracking point is positioned in the centre of the image, and
consequently shifted upwards and downwards. Then subtraction of intensities between pixels higher
and lower than the tracking point is performed. The location where the greatest difference value is
found is determined as the boundary between the background and the finger. Further tracking to the
Biometric Devices 51
The Hand Vein Pattern Used as a Biometric Feature – Annemarie Nadort
Figure 24. The outline of the top of a finger after rotational correction, and it’s normalized region for
further processing. Obtained from [81], figure 12.
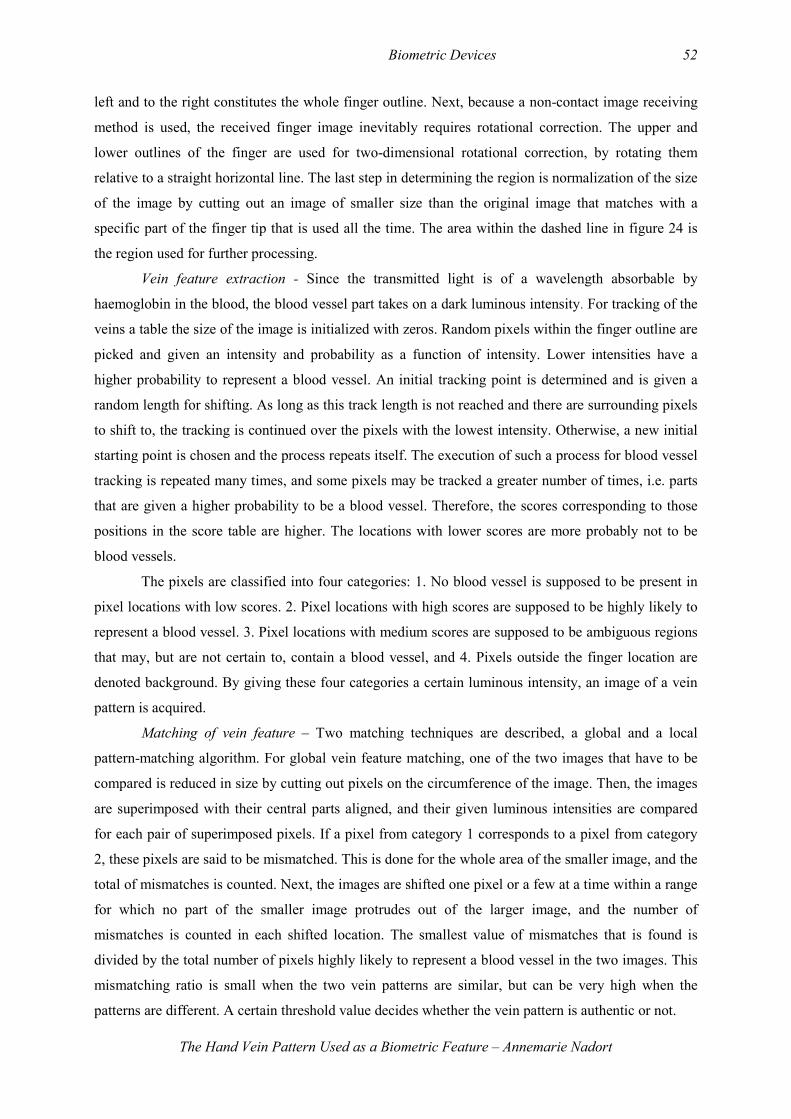
Biometric Devices 52
The Hand Vein Pattern Used as a Biometric Feature – Annemarie Nadort
left and to the right constitutes the whole finger outline. Next, because a non-contact image receiving
method is used, the received finger image inevitably requires rotational correction. The upper and
lower outlines of the finger are used for two-dimensional rotational correction, by rotating them
relative to a straight horizontal line. The last step in determining the region is normalization of the size
of the image by cutting out an image of smaller size than the original image that matches with a
specific part of the finger tip that is used all the time. The area within the dashed line in figure 24 is
the region used for further processing.
Vein feature extraction - Since the transmitted light is of a wavelength absorbable by
haemoglobin in the blood, the blood vessel part takes on a dark luminous intensity. For tracking of the
veins a table the size of the image is initialized with zeros. Random pixels within the finger outline are
picked and given an intensity and probability as a function of intensity. Lower intensities have a
higher probability to represent a blood vessel. An initial tracking point is determined and is given a
random length for shifting. As long as this track length is not reached and there are surrounding pixels
to shift to, the tracking is continued over the pixels with the lowest intensity. Otherwise, a new initial
starting point is chosen and the process repeats itself. The execution of such a process for blood vessel
tracking is repeated many times, and some pixels may be tracked a greater number of times, i.e. parts
that are given a higher probability to be a blood vessel. Therefore, the scores corresponding to those
positions in the score table are higher. The locations with lower scores are more probably not to be
blood vessels.
The pixels are classified into four categories: 1. No blood vessel is supposed to be present in
pixel locations with low scores. 2. Pixel locations with high scores are supposed to be highly likely to
represent a blood vessel. 3. Pixel locations with medium scores are supposed to be ambiguous regions
that may, but are not certain to, contain a blood vessel, and 4. Pixels outside the finger location are
denoted background. By giving these four categories a certain luminous intensity, an image of a vein
pattern is acquired.
Matching of vein feature – Two matching techniques are described, a global and a local
pattern-matching algorithm. For global vein feature matching, one of the two images that have to be
compared is reduced in size by cutting out pixels on the circumference of the image. Then, the images
are superimposed with their central parts aligned, and their given luminous intensities are compared
for each pair of superimposed pixels. If a pixel from category 1 corresponds to a pixel from category
2, these pixels are said to be mismatched. This is done for the whole area of the smaller image, and the
total of mismatches is counted. Next, the images are shifted one pixel or a few at a time within a range
for which no part of the smaller image protrudes out of the larger image, and the number of
mismatches is counted in each shifted location. The smallest value of mismatches that is found is
divided by the total number of pixels highly likely to represent a blood vessel in the two images. This
mismatching ratio is small when the two vein patterns are similar, but can be very high when the
patterns are different. A certain threshold value decides whether the vein pattern is authentic or not.
Biometric Devices 53
The Hand Vein Pattern Used as a Biometric Feature – Annemarie Nadort
FRR
FAR Conventional our Method
method Global matching
Global and local matching
1% 2.06% 0.148% 0.148%
0.1% 7.67% 0.738% 0.738%
0.01% 15.3% 1.17% 1.03%
0.001% 18.9% 1.92% 1.03%
0% 22.7% 2.51% 1.03%
a.
FRR
FAR Conventional our Method
method Global matching
Global and local matching
1% 0% 0 % 0%
0.1% 0.16% 0 % 0%
0.01% 0.57% 0 % 0%
0.001% 0.72% 0 % 0%
0% 1.0% 0 % 0%
b.
Table 1. Performance comparison between a method according to the invention derived from US
patent 6993160 and another method, in terms of the FAR and the FRR. a. results when registered
images for both template and verification purposes where captured only once b. results when
registered images for both template and verification purposes where captured three times, and the
best result was selected in the process. Obtained from [81], figure 16.
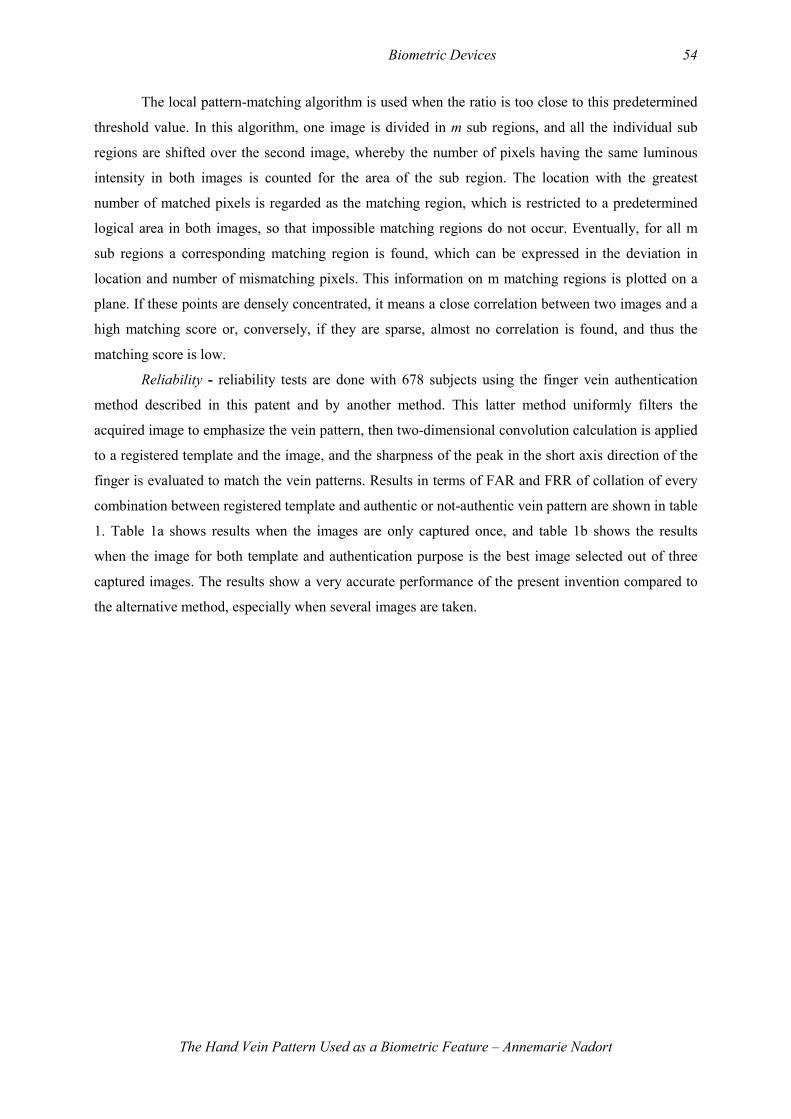
Biometric Devices 54
The Hand Vein Pattern Used as a Biometric Feature – Annemarie Nadort
The local pattern-matching algorithm is used when the ratio is too close to this predetermined
threshold value. In this algorithm, one image is divided in m sub regions, and all the individual sub
regions are shifted over the second image, whereby the number of pixels having the same luminous
intensity in both images is counted for the area of the sub region. The location with the greatest
number of matched pixels is regarded as the matching region, which is restricted to a predetermined
logical area in both images, so that impossible matching regions do not occur. Eventually, for all m
sub regions a corresponding matching region is found, which can be expressed in the deviation in
location and number of mismatching pixels. This information on m matching regions is plotted on a
plane. If these points are densely concentrated, it means a close correlation between two images and a
high matching score or, conversely, if they are sparse, almost no correlation is found, and thus the
matching score is low.
Reliability - reliability tests are done with 678 subjects using the finger vein authentication
method described in this patent and by another method. This latter method uniformly filters the
acquired image to emphasize the vein pattern, then two-dimensional convolution calculation is applied
to a registered template and the image, and the sharpness of the peak in the short axis direction of the
finger is evaluated to match the vein patterns. Results in terms of FAR and FRR of collation of every
combination between registered template and authentic or not-authentic vein pattern are shown in table
1. Table 1a shows results when the images are only captured once, and table 1b shows the results
when the image for both template and authentication purpose is the best image selected out of three
captured images. The results show a very accurate performance of the present invention compared to
the alternative method, especially when several images are taken.
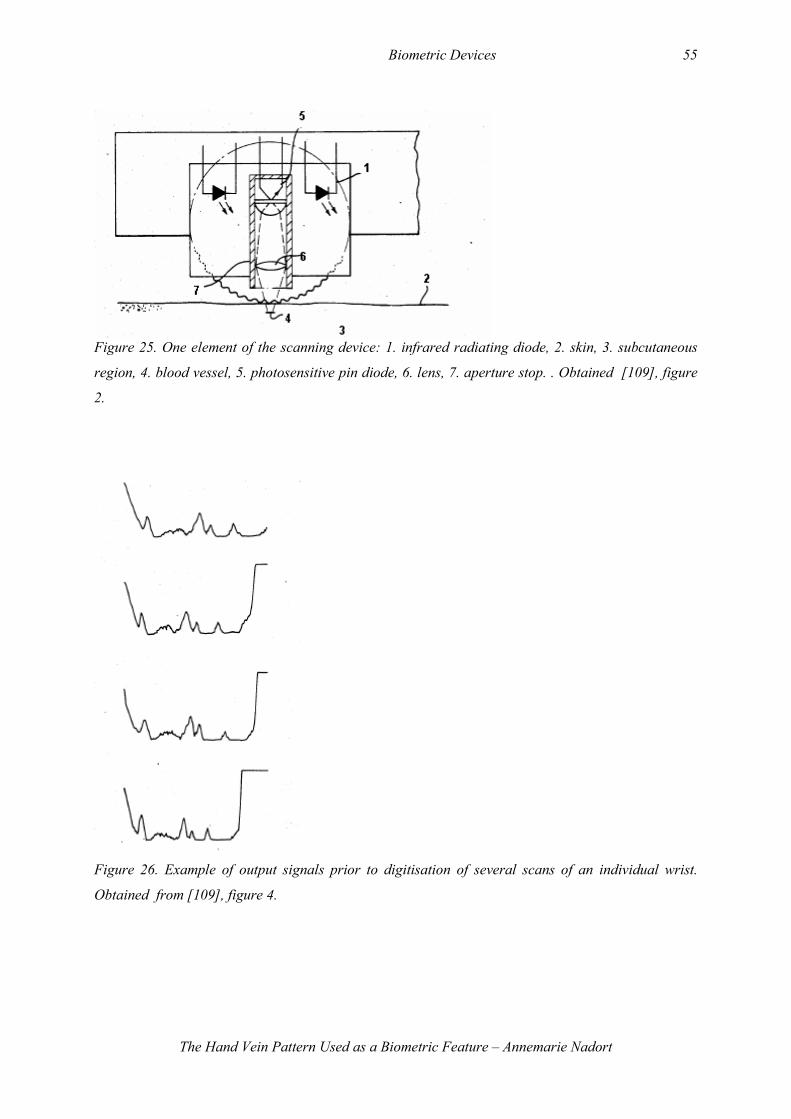
Biometric Devices 55
The Hand Vein Pattern Used as a Biometric Feature – Annemarie Nadort
Figure 25. One element of the scanning device: 1. infrared radiating diode, 2. skin, 3. subcutaneous
region, 4. blood vessel, 5. photosensitive pin diode, 6. lens, 7. aperture stop. . Obtained [109], figure
2.
Figure 26. Example of output signals prior to digitisation of several scans of an individual wrist.
Obtained from [109], figure 4.
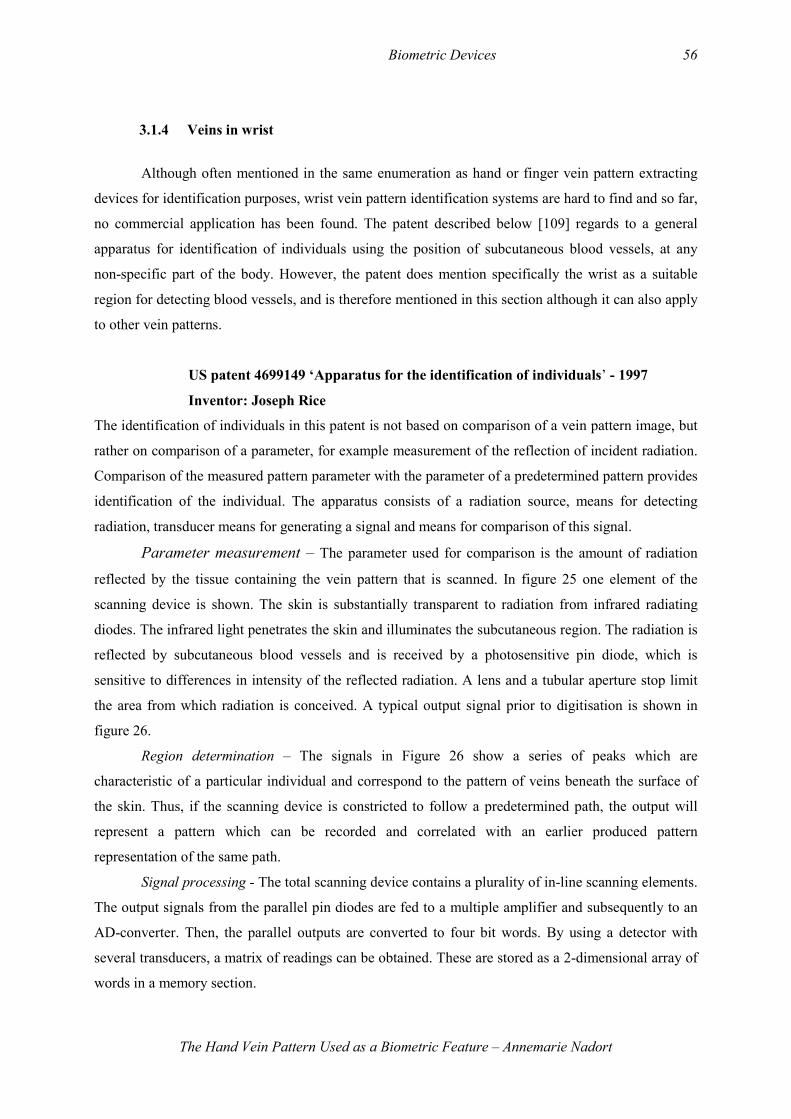
Biometric Devices 56
The Hand Vein Pattern Used as a Biometric Feature – Annemarie Nadort
3.1.4 Veins in wrist
Although often mentioned in the same enumeration as hand or finger vein pattern extracting
devices for identification purposes, wrist vein pattern identification systems are hard to find and so far,
no commercial application has been found. The patent described below [109] regards to a general
apparatus for identification of individuals using the position of subcutaneous blood vessels, at any
non-specific part of the body. However, the patent does mention specifically the wrist as a suitable
region for detecting blood vessels, and is therefore mentioned in this section although it can also apply
to other vein patterns.
US patent 4699149 ‘Apparatus for the identification of individuals’ - 1997
Inventor: Joseph Rice
The identification of individuals in this patent is not based on comparison of a vein pattern image, but
rather on comparison of a parameter, for example measurement of the reflection of incident radiation.
Comparison of the measured pattern parameter with the parameter of a predetermined pattern provides
identification of the individual. The apparatus consists of a radiation source, means for detecting
radiation, transducer means for generating a signal and means for comparison of this signal.
Parameter measurement – The parameter used for comparison is the amount of radiation
reflected by the tissue containing the vein pattern that is scanned. In figure 25 one element of the
scanning device is shown. The skin is substantially transparent to radiation from infrared radiating
diodes. The infrared light penetrates the skin and illuminates the subcutaneous region. The radiation is
reflected by subcutaneous blood vessels and is received by a photosensitive pin diode, which is
sensitive to differences in intensity of the reflected radiation. A lens and a tubular aperture stop limit
the area from which radiation is conceived. A typical output signal prior to digitisation is shown in
figure 26.
Region determination – The signals in Figure 26 show a series of peaks which are
characteristic of a particular individual and correspond to the pattern of veins beneath the surface of
the skin. Thus, if the scanning device is constricted to follow a predetermined path, the output will
represent a pattern which can be recorded and correlated with an earlier produced pattern
representation of the same path.
Signal processing - The total scanning device contains a plurality of in-line scanning elements.
The output signals from the parallel pin diodes are fed to a multiple amplifier and subsequently to an
AD-converter. Then, the parallel outputs are converted to four bit words. By using a detector with
several transducers, a matrix of readings can be obtained. These are stored as a 2-dimensional array of
words in a memory section.
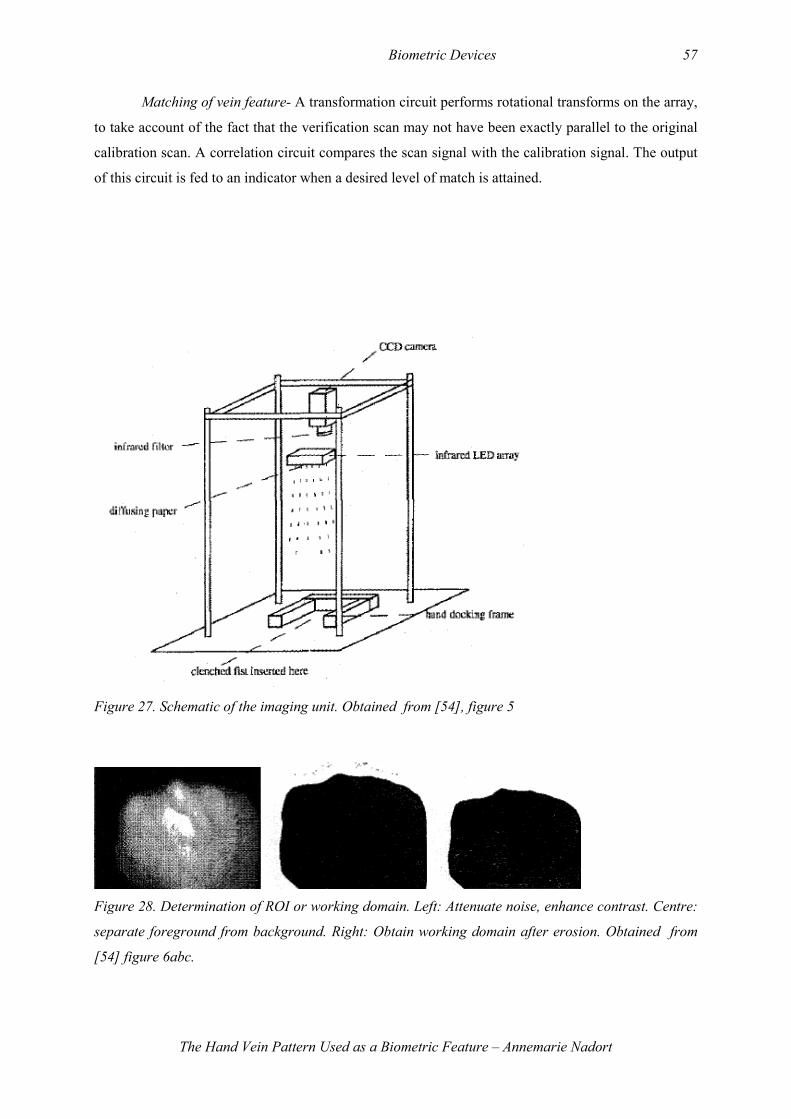
Biometric Devices 57
The Hand Vein Pattern Used as a Biometric Feature – Annemarie Nadort
Matching of vein feature- A transformation circuit performs rotational transforms on the array,
to take account of the fact that the verification scan may not have been exactly parallel to the original
calibration scan. A correlation circuit compares the scan signal with the calibration signal. The output
of this circuit is fed to an indicator when a desired level of match is attained.
Figure 27. Schematic of the imaging unit. Obtained from [54], figure 5
Figure 28. Determination of ROI or working domain. Left: Attenuate noise, enhance contrast. Centre:
separate foreground from background. Right: Obtain working domain after erosion. Obtained from
[54] figure 6abc.
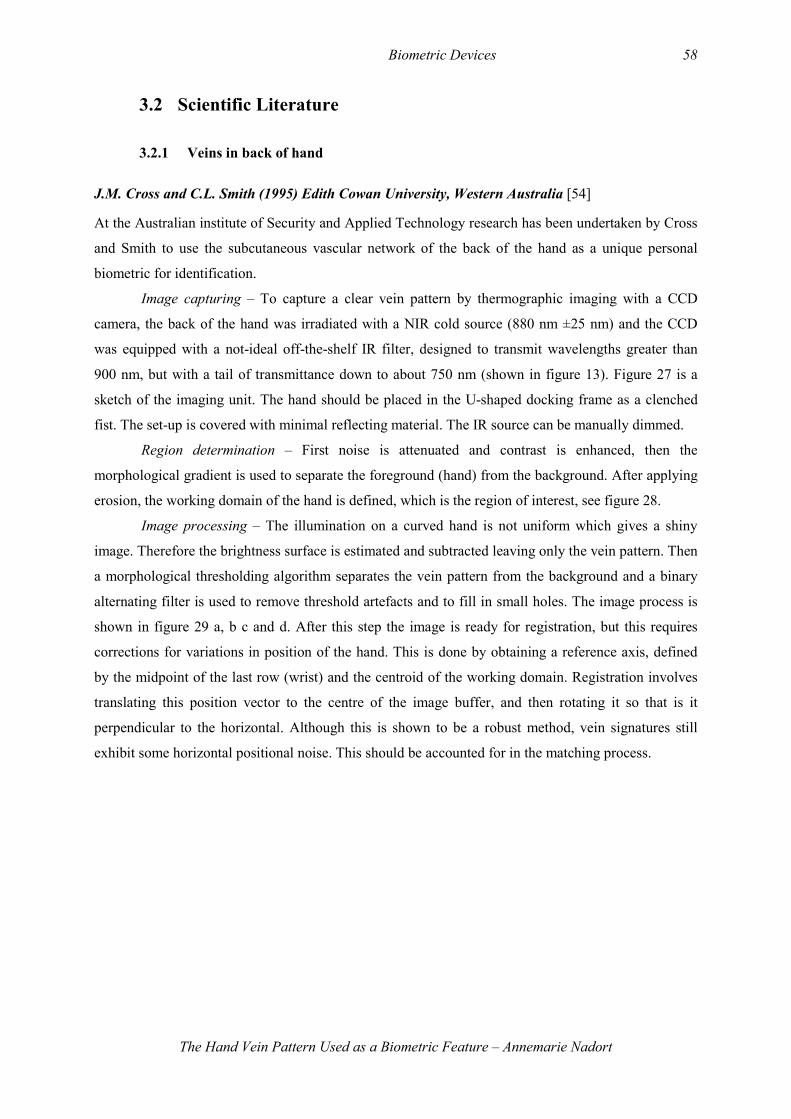
Biometric Devices 58
The Hand Vein Pattern Used as a Biometric Feature – Annemarie Nadort
3.2 Scientific Literature
3.2.1 Veins in back of hand
J.M. Cross and C.L. Smith (1995) Edith Cowan University, Western Australia [54]
At the Australian institute of Security and Applied Technology research has been undertaken by Cross
and Smith to use the subcutaneous vascular network of the back of the hand as a unique personal
biometric for identification.
Image capturing – To capture a clear vein pattern by thermographic imaging with a CCD
camera, the back of the hand was irradiated with a NIR cold source (880 nm ±25 nm) and the CCD
was equipped with a not-ideal off-the-shelf IR filter, designed to transmit wavelengths greater than
900 nm, but with a tail of transmittance down to about 750 nm (shown in figure 13). Figure 27 is a
sketch of the imaging unit. The hand should be placed in the U-shaped docking frame as a clenched
fist. The set-up is covered with minimal reflecting material. The IR source can be manually dimmed.
Region determination – First noise is attenuated and contrast is enhanced, then the
morphological gradient is used to separate the foreground (hand) from the background. After applying
erosion, the working domain of the hand is defined, which is the region of interest, see figure 28.
Image processing – The illumination on a curved hand is not uniform which gives a shiny
image. Therefore the brightness surface is estimated and subtracted leaving only the vein pattern. Then
a morphological thresholding algorithm separates the vein pattern from the background and a binary
alternating filter is used to remove threshold artefacts and to fill in small holes. The image process is
shown in figure 29 a, b c and d. After this step the image is ready for registration, but this requires
corrections for variations in position of the hand. This is done by obtaining a reference axis, defined
by the midpoint of the last row (wrist) and the centroid of the working domain. Registration involves
translating this position vector to the centre of the image buffer, and then rotating it so that is it
perpendicular to the horizontal. Although this is shown to be a robust method, vein signatures still
exhibit some horizontal positional noise. This should be accounted for in the matching process.
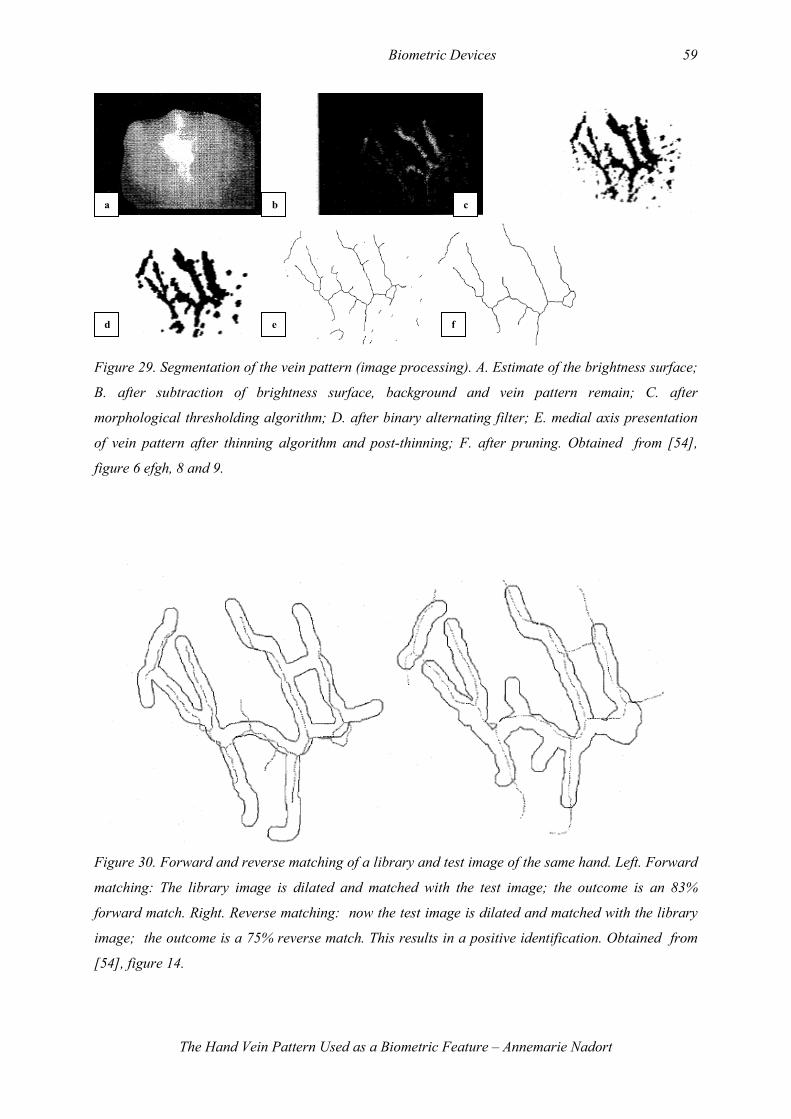
Biometric Devices 59
The Hand Vein Pattern Used as a Biometric Feature – Annemarie Nadort
Figure 29. Segmentation of the vein pattern (image processing). A. Estimate of the brightness surface;
B. after subtraction of brightness surface, background and vein pattern remain; C. after
morphological thresholding algorithm; D. after binary alternating filter; E. medial axis presentation
of vein pattern after thinning algorithm and post-thinning; F. after pruning. Obtained from [54],
figure 6 efgh, 8 and 9.
Figure 30. Forward and reverse matching of a library and test image of the same hand. Left. Forward
matching: The library image is dilated and matched with the test image; the outcome is an 83%
forward match. Right. Reverse matching: now the test image is dilated and matched with the library
image; the outcome is a 75% reverse match. This results in a positive identification. Obtained from
[54], figure 14.
a b c
d e f
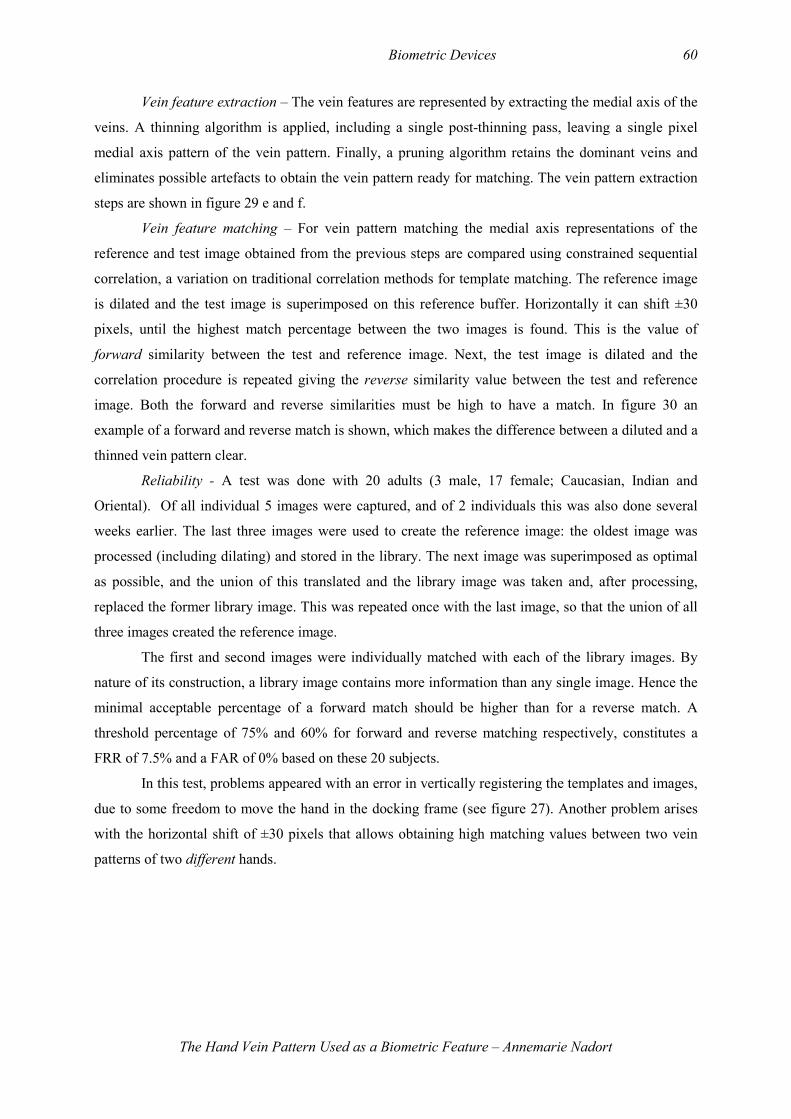
Biometric Devices 60
The Hand Vein Pattern Used as a Biometric Feature – Annemarie Nadort
Vein feature extraction – The vein features are represented by extracting the medial axis of the
veins. A thinning algorithm is applied, including a single post-thinning pass, leaving a single pixel
medial axis pattern of the vein pattern. Finally, a pruning algorithm retains the dominant veins and
eliminates possible artefacts to obtain the vein pattern ready for matching. The vein pattern extraction
steps are shown in figure 29 e and f.
Vein feature matching – For vein pattern matching the medial axis representations of the
reference and test image obtained from the previous steps are compared using constrained sequential
correlation, a variation on traditional correlation methods for template matching. The reference image
is dilated and the test image is superimposed on this reference buffer. Horizontally it can shift ±30
pixels, until the highest match percentage between the two images is found. This is the value of
forward similarity between the test and reference image. Next, the test image is dilated and the
correlation procedure is repeated giving the reverse similarity value between the test and reference
image. Both the forward and reverse similarities must be high to have a match. In figure 30 an
example of a forward and reverse match is shown, which makes the difference between a diluted and a
thinned vein pattern clear.
Reliability - A test was done with 20 adults (3 male, 17 female; Caucasian, Indian and
Oriental). Of all individual 5 images were captured, and of 2 individuals this was also done several
weeks earlier. The last three images were used to create the reference image: the oldest image was
processed (including dilating) and stored in the library. The next image was superimposed as optimal
as possible, and the union of this translated and the library image was taken and, after processing,
replaced the former library image. This was repeated once with the last image, so that the union of all
three images created the reference image.
The first and second images were individually matched with each of the library images. By
nature of its construction, a library image contains more information than any single image. Hence the
minimal acceptable percentage of a forward match should be higher than for a reverse match. A
threshold percentage of 75% and 60% for forward and reverse matching respectively, constitutes a
FRR of 7.5% and a FAR of 0% based on these 20 subjects.
In this test, problems appeared with an error in vertically registering the templates and images,
due to some freedom to move the hand in the docking frame (see figure 27). Another problem arises
with the horizontal shift of ±30 pixels that allows obtaining high matching values between two vein
patterns of two different hands.
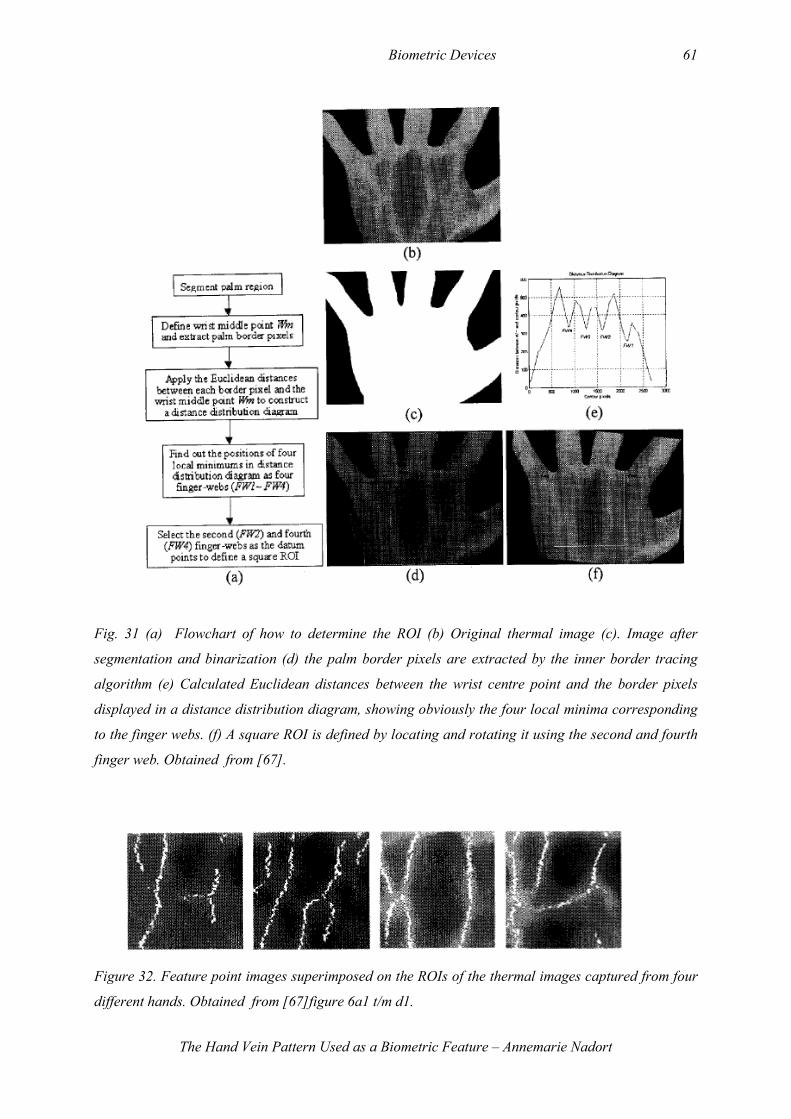
Biometric Devices 61
The Hand Vein Pattern Used as a Biometric Feature – Annemarie Nadort
Fig. 31 (a) Flowchart of how to determine the ROI (b) Original thermal image (c). Image after
segmentation and binarization (d) the palm border pixels are extracted by the inner border tracing
algorithm (e) Calculated Euclidean distances between the wrist centre point and the border pixels
displayed in a distance distribution diagram, showing obviously the four local minima corresponding
to the finger webs. (f) A square ROI is defined by locating and rotating it using the second and fourth
finger web. Obtained from [67].
Figure 32. Feature point images superimposed on the ROIs of the thermal images captured from four
different hands. Obtained from [67]figure 6a1 t/m d1.
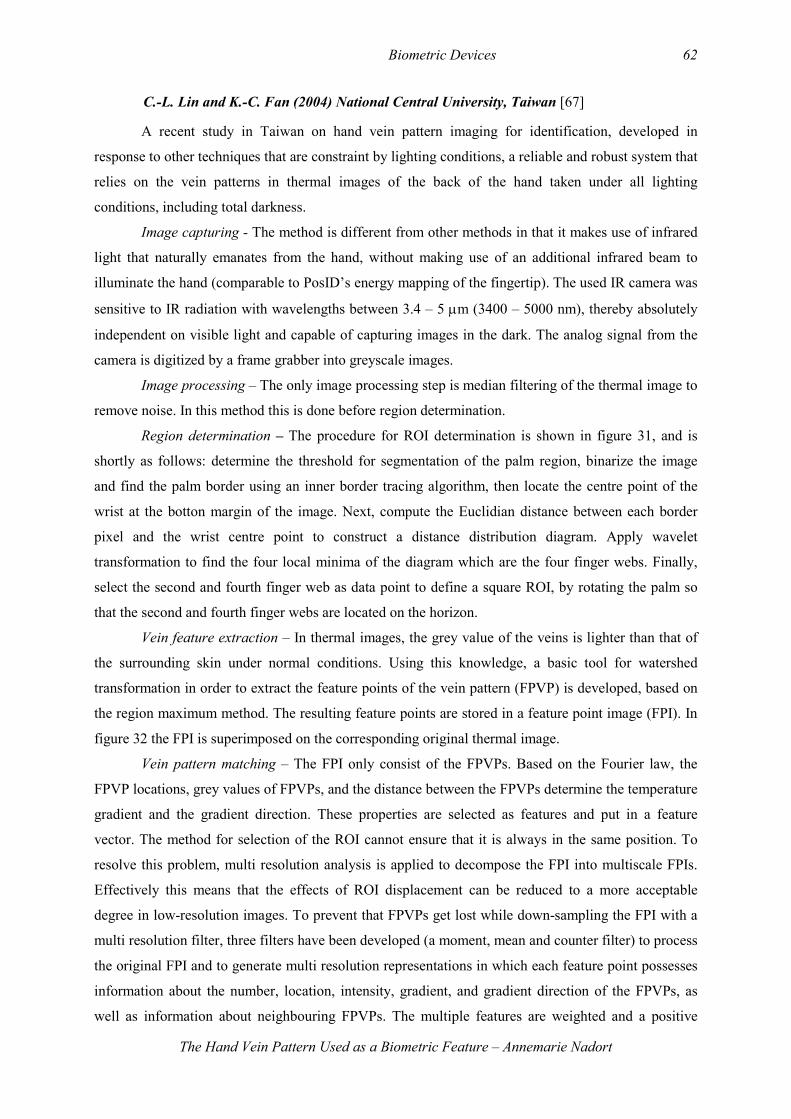
Biometric Devices 62
The Hand Vein Pattern Used as a Biometric Feature – Annemarie Nadort
C.-L. Lin and K.-C. Fan (2004) National Central University, Taiwan [67]
A recent study in Taiwan on hand vein pattern imaging for identification, developed in
response to other techniques that are constraint by lighting conditions, a reliable and robust system that
relies on the vein patterns in thermal images of the back of the hand taken under all lighting
conditions, including total darkness.
Image capturing - The method is different from other methods in that it makes use of infrared
light that naturally emanates from the hand, without making use of an additional infrared beam to
illuminate the hand (comparable to PosID’s energy mapping of the fingertip). The used IR camera was
sensitive to IR radiation with wavelengths between 3.4 – 5 µm (3400 – 5000 nm), thereby absolutely
independent on visible light and capable of capturing images in the dark. The analog signal from the
camera is digitized by a frame grabber into greyscale images.
Image processing – The only image processing step is median filtering of the thermal image to
remove noise. In this method this is done before region determination.
Region determination – The procedure for ROI determination is shown in figure 31, and is
shortly as follows: determine the threshold for segmentation of the palm region, binarize the image
and find the palm border using an inner border tracing algorithm, then locate the centre point of the
wrist at the botton margin of the image. Next, compute the Euclidian distance between each border
pixel and the wrist centre point to construct a distance distribution diagram. Apply wavelet
transformation to find the four local minima of the diagram which are the four finger webs. Finally,
select the second and fourth finger web as data point to define a square ROI, by rotating the palm so
that the second and fourth finger webs are located on the horizon.
Vein feature extraction – In thermal images, the grey value of the veins is lighter than that of
the surrounding skin under normal conditions. Using this knowledge, a basic tool for watershed
transformation in order to extract the feature points of the vein pattern (FPVP) is developed, based on
the region maximum method. The resulting feature points are stored in a feature point image (FPI). In
figure 32 the FPI is superimposed on the corresponding original thermal image.
Vein pattern matching – The FPI only consist of the FPVPs. Based on the Fourier law, the
FPVP locations, grey values of FPVPs, and the distance between the FPVPs determine the temperature
gradient and the gradient direction. These properties are selected as features and put in a feature
vector. The method for selection of the ROI cannot ensure that it is always in the same position. To
resolve this problem, multi resolution analysis is applied to decompose the FPI into multiscale FPIs.
Effectively this means that the effects of ROI displacement can be reduced to a more acceptable
degree in low-resolution images. To prevent that FPVPs get lost while down-sampling the FPI with a
multi resolution filter, three filters have been developed (a moment, mean and counter filter) to process
the original FPI and to generate multi resolution representations in which each feature point possesses
information about the number, location, intensity, gradient, and gradient direction of the FPVPs, as
well as information about neighbouring FPVPs. The multiple features are weighted and a positive
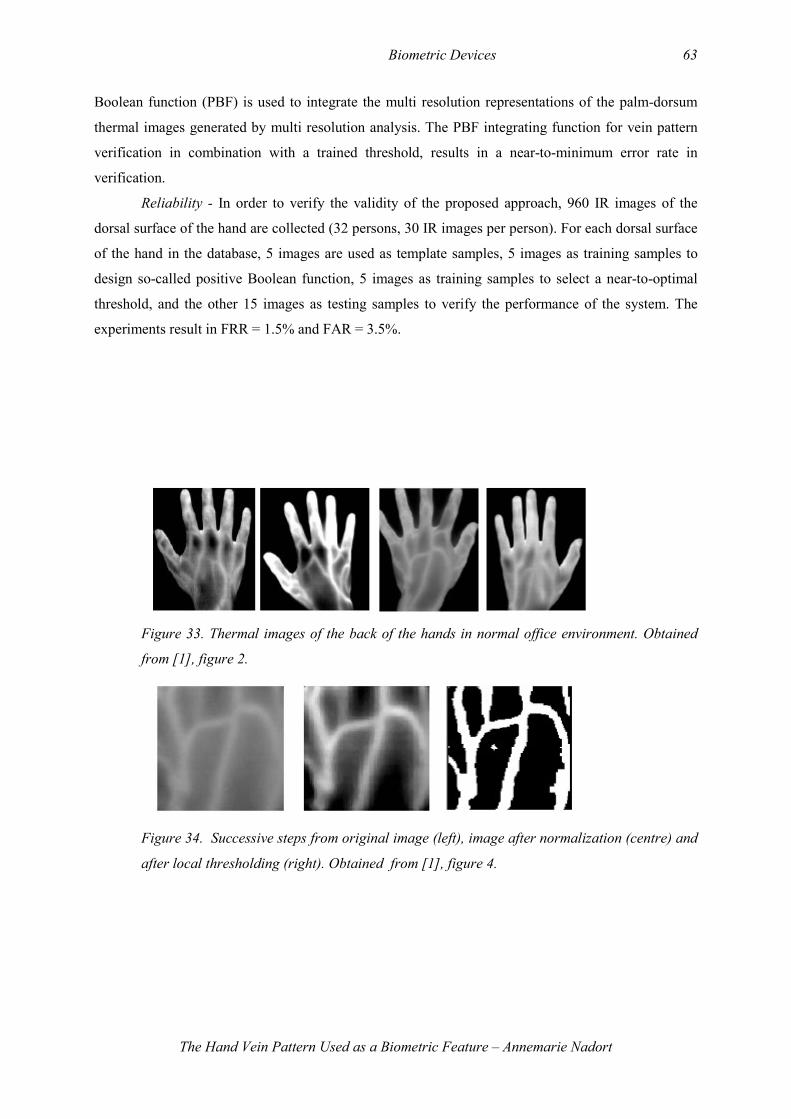
Biometric Devices 63
The Hand Vein Pattern Used as a Biometric Feature – Annemarie Nadort
Boolean function (PBF) is used to integrate the multi resolution representations of the palm-dorsum
thermal images generated by multi resolution analysis. The PBF integrating function for vein pattern
verification in combination with a trained threshold, results in a near-to-minimum error rate in
verification.
Reliability - In order to verify the validity of the proposed approach, 960 IR images of the
dorsal surface of the hand are collected (32 persons, 30 IR images per person). For each dorsal surface
of the hand in the database, 5 images are used as template samples, 5 images as training samples to
design so-called positive Boolean function, 5 images as training samples to select a near-to-optimal
threshold, and the other 15 images as testing samples to verify the performance of the system. The
experiments result in FRR = 1.5% and FAR = 3.5%.
Figure 33. Thermal images of the back of the hands in normal office environment. Obtained
from [1], figure 2.
Figure 34. Successive steps from original image (left), image after normalization (centre) and
after local thresholding (right). Obtained from [1], figure 4.
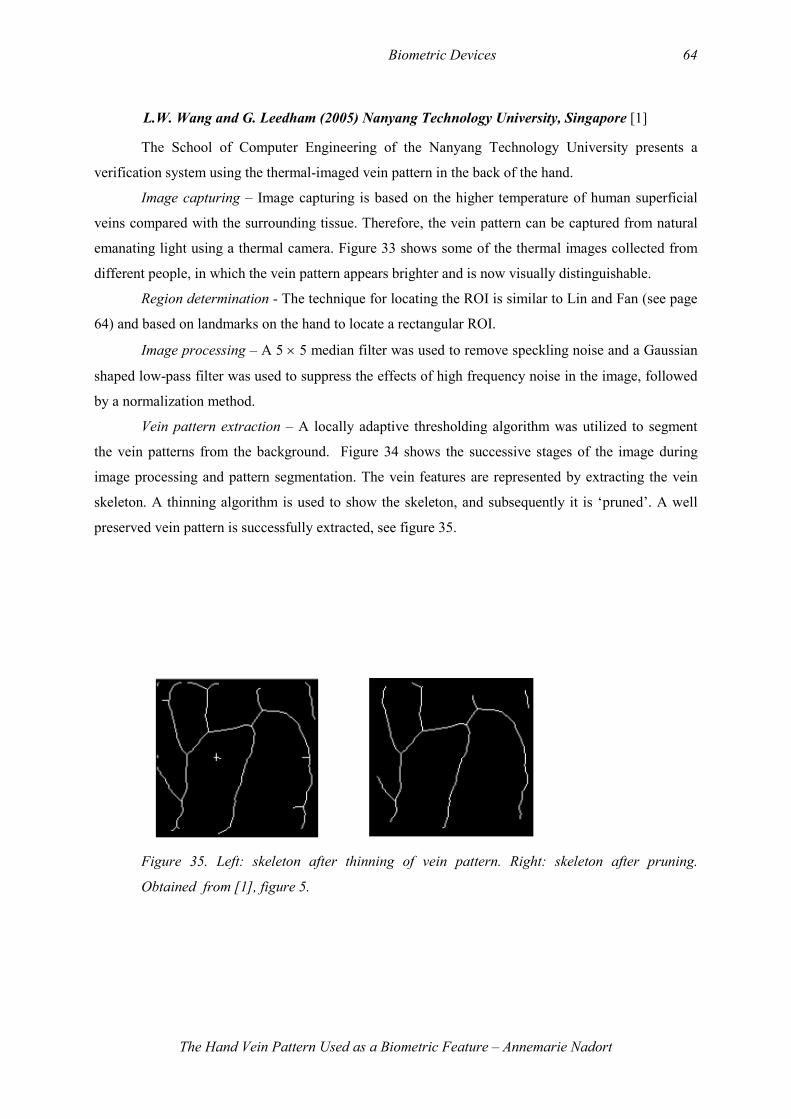
Biometric Devices 64
The Hand Vein Pattern Used as a Biometric Feature – Annemarie Nadort
L.W. Wang and G. Leedham (2005) Nanyang Technology University, Singapore [1]
The School of Computer Engineering of the Nanyang Technology University presents a
verification system using the thermal-imaged vein pattern in the back of the hand.
Image capturing – Image capturing is based on the higher temperature of human superficial
veins compared with the surrounding tissue. Therefore, the vein pattern can be captured from natural
emanating light using a thermal camera. Figure 33 shows some of the thermal images collected from
different people, in which the vein pattern appears brighter and is now visually distinguishable.
Region determination - The technique for locating the ROI is similar to Lin and Fan (see page
64) and based on landmarks on the hand to locate a rectangular ROI.
Image processing – A 5 × 5 median filter was used to remove speckling noise and a Gaussian
shaped low-pass filter was used to suppress the effects of high frequency noise in the image, followed
by a normalization method.
Vein pattern extraction – A locally adaptive thresholding algorithm was utilized to segment
the vein patterns from the background. Figure 34 shows the successive stages of the image during
image processing and pattern segmentation. The vein features are represented by extracting the vein
skeleton. A thinning algorithm is used to show the skeleton, and subsequently it is ‘pruned’. A well
preserved vein pattern is successfully extracted, see figure 35.
Figure 35. Left: skeleton after thinning of vein pattern. Right: skeleton after pruning.
Obtained from [1], figure 5.
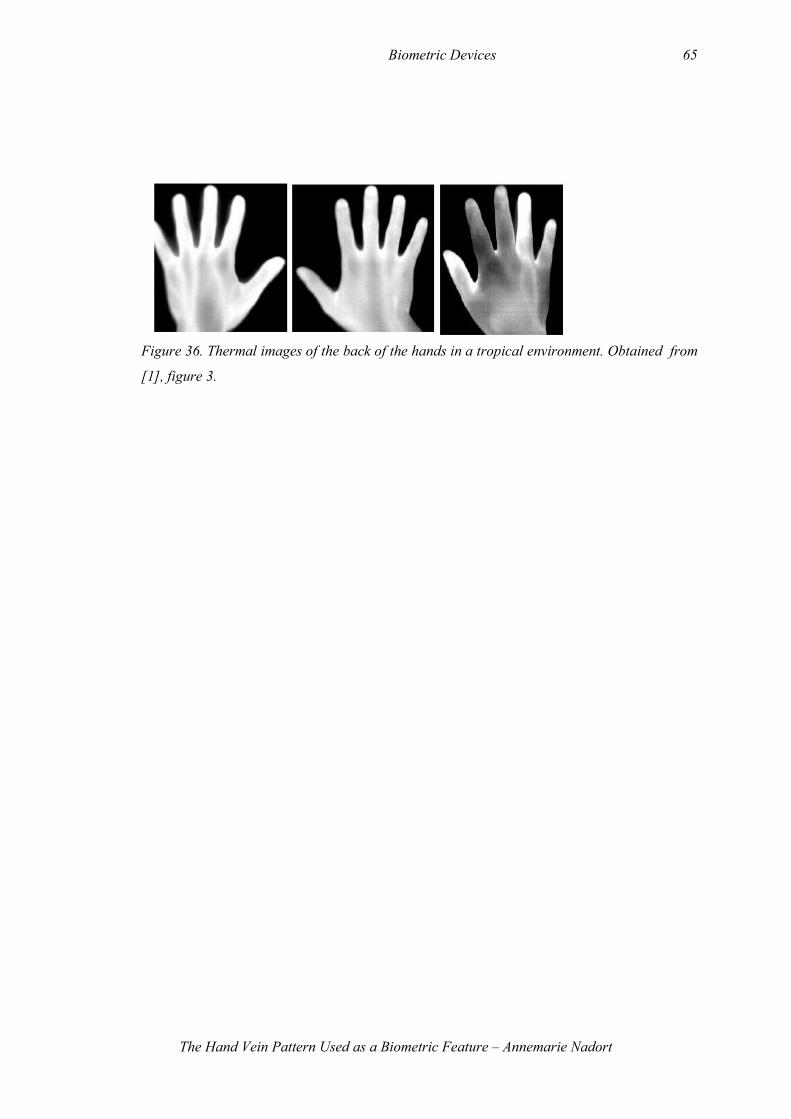
Biometric Devices 65
The Hand Vein Pattern Used as a Biometric Feature – Annemarie Nadort
Figure 36. Thermal images of the back of the hands in a tropical environment. Obtained from
[1], figure 3.
Biometric Devices 66
The Hand Vein Pattern Used as a Biometric Feature – Annemarie Nadort
Vein pattern matching – Vein pattern matching is done by measuring the line segment
Hausdorff distance between a pair of veins. Hausdorff distance is the maximum distance of a set to the
nearest point in the other set. It is defined as [110]:
For two sets of points A = a1,..., an and B = b1,…,bn
H ( A, B) = max( h( A, B), h(B, A)) [1]
where
h(A, B) = max min || a b || [2] a∈ A b∈ B
Modified Hausdorff distance (MHD):
∑∈
∈−=
AaBb
baA
BAh min1
),(mod [3]
In this way, spatial information of an image is obtained, but it lacks structural information
when it comes to comparing the shape of curves. The distance between two curved line segments can
be measured, using the line segment Hausdorff distance (LHD), a method proposed for face matching
[111]. This method calculates a vector indicating the angle distance, parallel distance and
perpendicular distance between two line segments. The vein pattern is divided in a number of curve
segments, sampled by a few points on the curve. Using these sample points as endpoints, a set of line
segments representing the shape of the pattern is obtained. The LHD can be calculated with equation
[1] in combination with equation [3], using the vector distance and the length of the line segment as
additional parameters. The LHD represents the similarity between two vein patterns.
Reliability - The hand vein pattern verification system is tested on a vein pattern database
consisting 108 images from 12 people (9 on each person). Three images where randomly selected for
each person as template images. For verification, three LHDs are computed for an incoming hand vein
pattern with the three template images. The average Hausdorff distance value is calculated, and is
regarded as the similarity measure between the incoming vein pattern and the template images. The
lower the distance value, the higher the probability the vein pattern belongs to the authentic person. In
this experiment, a threshold value of 9.0 resulted in a FAR and a FRR of 0% for all images.
It should be noted thought, that vein patterns where captured in a controlled manner, in a
normal office with ambient temperature around 20°C and low humidity. In real life applications, the
surrounding conditions are unknown. The thermal images of figure 36 for example are taken in a
tropical environment and the quality of the vein patterns is reduced. Consequently, a decrease in
accuracy can be expected.

Biometric Devices 67
The Hand Vein Pattern Used as a Biometric Feature – Annemarie Nadort
Biometric Devices 68
The Hand Vein Pattern Used as a Biometric Feature – Annemarie Nadort
Y. Ding, D. Zhuang and K. Wang (2005) Harbin Engineering University, China [112]
In this study, conventional and new methods are explored for the image processing stage and
vein pattern matching stage in hand vein recognition procedures. Image processing includes threshold
segmentation and thinning of the vein pattern.
Threshold segmentation - Poor segmentation was found using conventional single threshold or
multi-threshold segmentation methods; therefore a new segmentation method is proposed: the
threshold image method. Good segmentation is essential to obtain an effective binary image with
sufficient information. The principle of the algorithm is as follows: for every pixel in the original
image f(x,y) one grey scale value T is calculated using the N surrounding pixels (N = (2k -1)*(2k-1)-1,
and a value of k = 5 is used in this paper). T is the average gray scale value in an n×n template and this
value is given to the center pixel. A bitmap T(x,y) is initialized with zeros. Starting with the left
bottom of f(x,y), the first grey scale value is calculated and given to T0. The center pixel defines the
location of T0 in T(x,y). In this paper, a template of 31×31 is used, therefore T(16,16) = T0. (note: the
value k = 5 and template size 31×31 do not seem to agree in this paper). The template is shifted one
pixel to the right and T(16,17) = T1 is calculated. In this way the whole threshold image T(x,y) is
calculated, with an n-pixels wide outer frame consisting of zeros. Next, the original and the threshold
image are compared pixel by pixel and binarized according to:
=
=
255),(0),(
yxf
yxf
),(),(),(),(
yxTyxf
yxTyxf
<
≥
The image is further processed by median filtering to eliminate burrs and to make the borderline
smooth.
Thinning algorithm - Accurate thinning of the vein pattern is important when the feature
extracting is based on endpoints and crossing points of the veins. The conventional thinning algorithm
is as follows: mark the target points 1 (pixel value 255), the background points 0 (pixel value 0). The
target points in whose 8-neighborhood there is at least one background point are defined as boundary
points. Then, consider the 8-neighborhood points (p2, p3, … p9) centered by the boundary point (p1). If
p2 satisfies the following conditions, then delete p1:
1) 2≤N(p1)≤6;
2) S(p1)=1;
3) p2* p4* p6 =0;
4) p4* p6* p8 =0;
Where N(p1) is the number of nonzero neighbor points and S(p1) is the number of times the
point value changes from 0 to 1 in the order of p2, p3, … p9. After all boundary points have been
checked out, the process repeats until none of the pixel points can be deleted. With this thinning
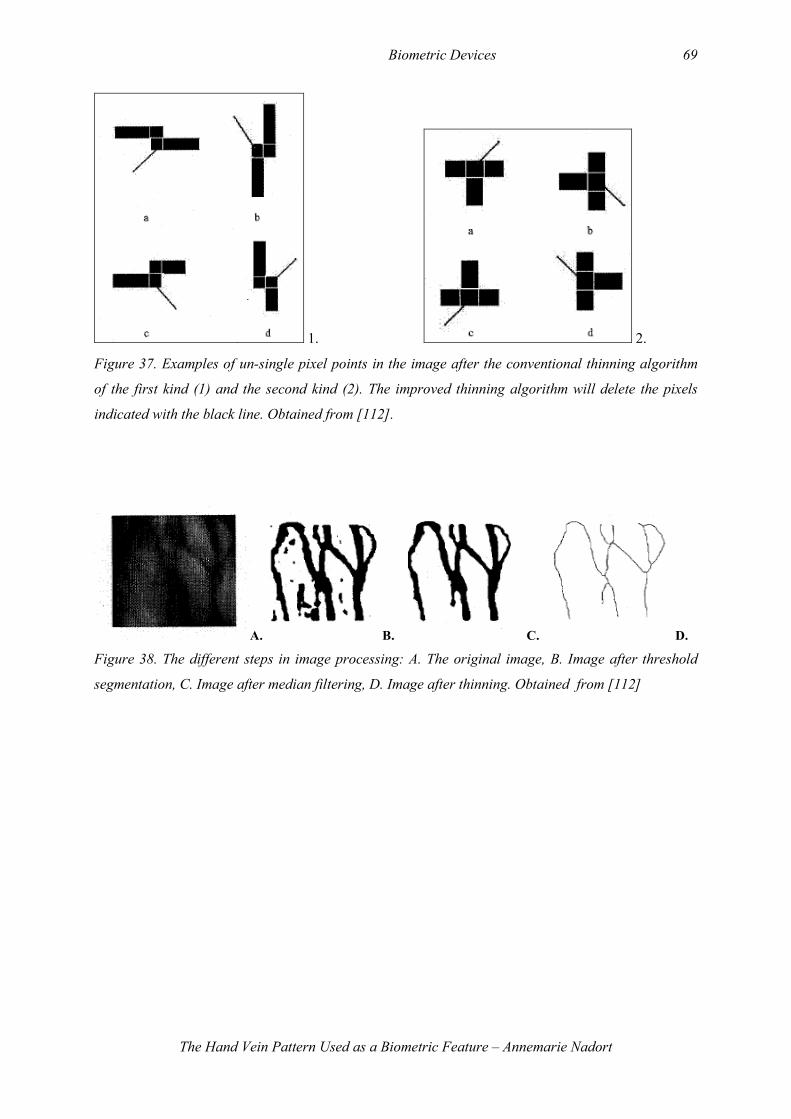
Biometric Devices 69
The Hand Vein Pattern Used as a Biometric Feature – Annemarie Nadort
1. 2.
Figure 37. Examples of un-single pixel points in the image after the conventional thinning algorithm
of the first kind (1) and the second kind (2). The improved thinning algorithm will delete the pixels
indicated with the black line. Obtained from [112].
A. B. C. D.
Figure 38. The different steps in image processing: A. The original image, B. Image after threshold
segmentation, C. Image after median filtering, D. Image after thinning. Obtained from [112]
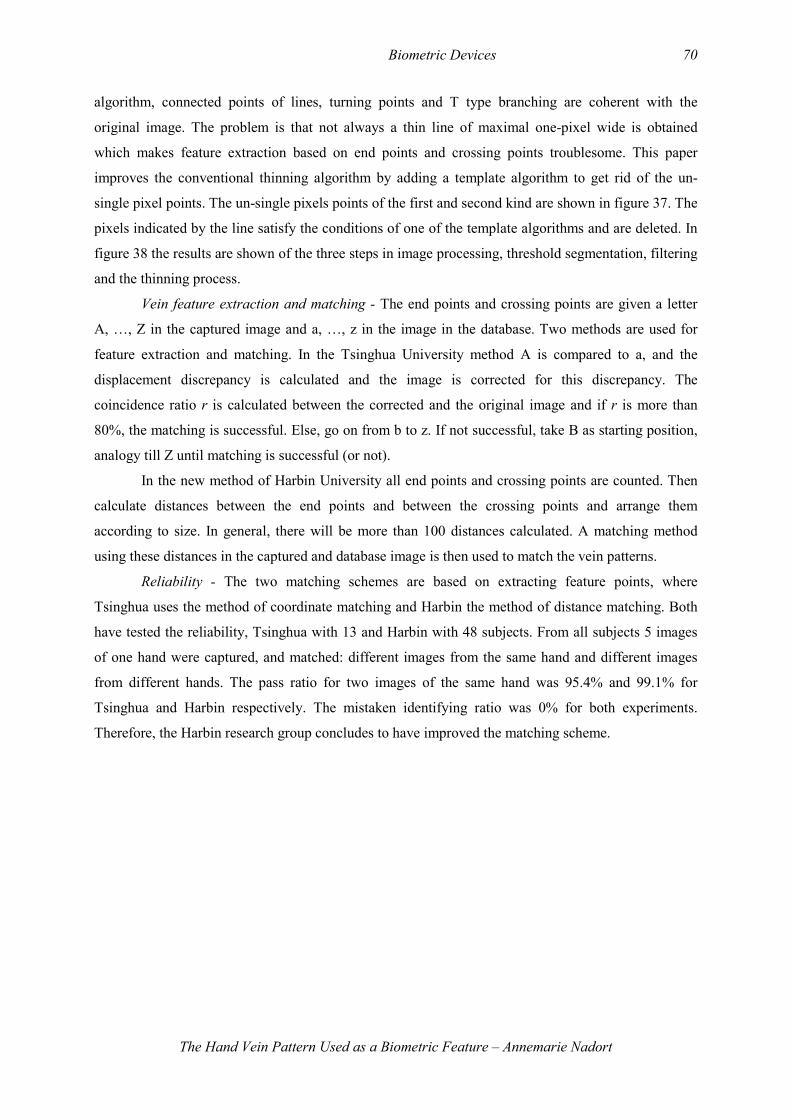
Biometric Devices 70
The Hand Vein Pattern Used as a Biometric Feature – Annemarie Nadort
algorithm, connected points of lines, turning points and T type branching are coherent with the
original image. The problem is that not always a thin line of maximal one-pixel wide is obtained
which makes feature extraction based on end points and crossing points troublesome. This paper
improves the conventional thinning algorithm by adding a template algorithm to get rid of the un-
single pixel points. The un-single pixels points of the first and second kind are shown in figure 37. The
pixels indicated by the line satisfy the conditions of one of the template algorithms and are deleted. In
figure 38 the results are shown of the three steps in image processing, threshold segmentation, filtering
and the thinning process.
Vein feature extraction and matching - The end points and crossing points are given a letter
A, …, Z in the captured image and a, …, z in the image in the database. Two methods are used for
feature extraction and matching. In the Tsinghua University method A is compared to a, and the
displacement discrepancy is calculated and the image is corrected for this discrepancy. The
coincidence ratio r is calculated between the corrected and the original image and if r is more than
80%, the matching is successful. Else, go on from b to z. If not successful, take B as starting position,
analogy till Z until matching is successful (or not).
In the new method of Harbin University all end points and crossing points are counted. Then
calculate distances between the end points and between the crossing points and arrange them
according to size. In general, there will be more than 100 distances calculated. A matching method
using these distances in the captured and database image is then used to match the vein patterns.
Reliability - The two matching schemes are based on extracting feature points, where
Tsinghua uses the method of coordinate matching and Harbin the method of distance matching. Both
have tested the reliability, Tsinghua with 13 and Harbin with 48 subjects. From all subjects 5 images
of one hand were captured, and matched: different images from the same hand and different images
from different hands. The pass ratio for two images of the same hand was 95.4% and 99.1% for
Tsinghua and Harbin respectively. The mistaken identifying ratio was 0% for both experiments.
Therefore, the Harbin research group concludes to have improved the matching scheme.
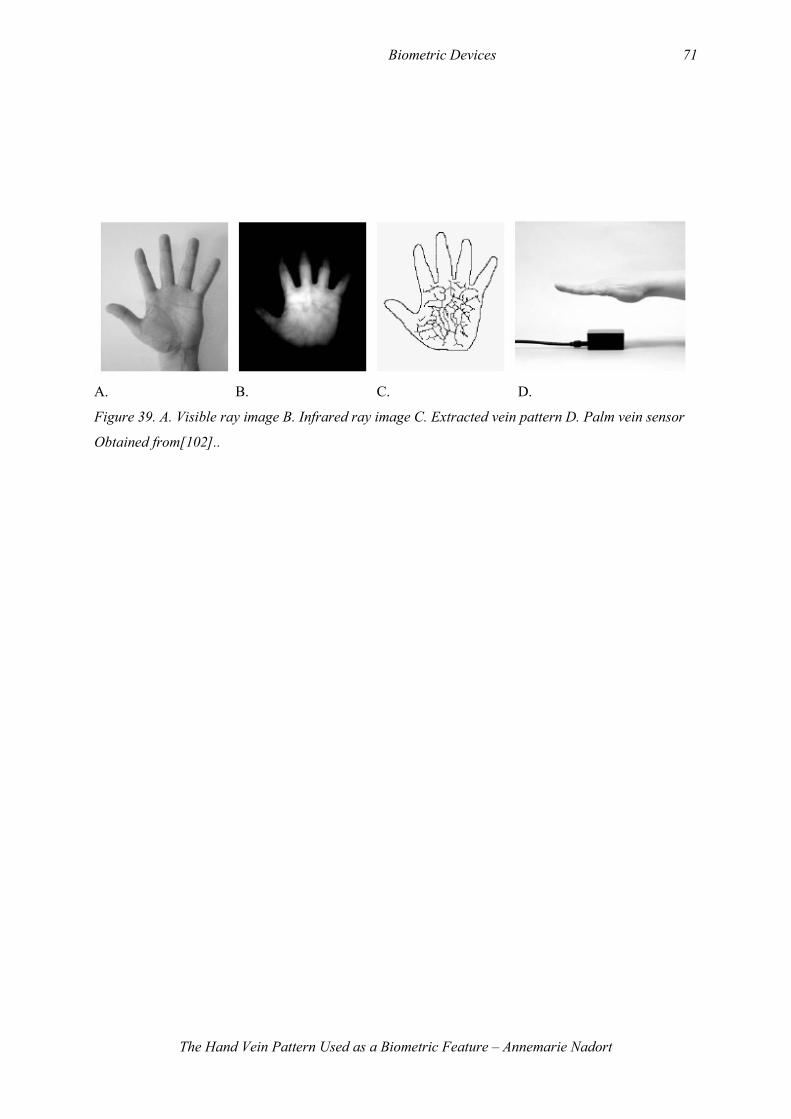
Biometric Devices 71
The Hand Vein Pattern Used as a Biometric Feature – Annemarie Nadort
A. B. C. D.
Figure 39. A. Visible ray image B. Infrared ray image C. Extracted vein pattern D. Palm vein sensor
Obtained from[102]..
Biometric Devices 72
The Hand Vein Pattern Used as a Biometric Feature – Annemarie Nadort
3.2.2 Veins in palm of hand
M. Watanabe et al. (2005) Fujitsu laboratories, Japan [102]
In Proceedings of the Biometric Consortium Conference a paper from the Fujitsu laboratories
provides little additional information about the technique. The palm vein sensor captures contactless
an infrared ray image of the palm of the hand. The NIR absorption properties of deoxidized
haemoglobin in the vein vessels make them show up as dark lines. The strength of illumination is
controlled by the sensor. The vein authentication software translates the black lines into a blood vessel
pattern of the palm, see figure 39. The software then matches the translated vein pattern with a pre-
registered template pattern, while correcting for position and orientation of the palm by a pattern
matching method.
Reliability - Also fujitsu laboratories have performed a reliability experiment on their palm
vein authentication technology. A total of 140.000 palms from 70.000 individuals were tested in the
following condition: three subsequent scans are taken of each palm of the individual for registration,
and then one final scan is permitted to confirm authentication. The individuals where very diverse in
both age, background, nationality and activity. The results confirmed a FAR of 0.00008% and a FRR
of 0.01%. (These numbers are extremely low; in the discussion an independent biometric testing round
is discussed with more credible numbers.)
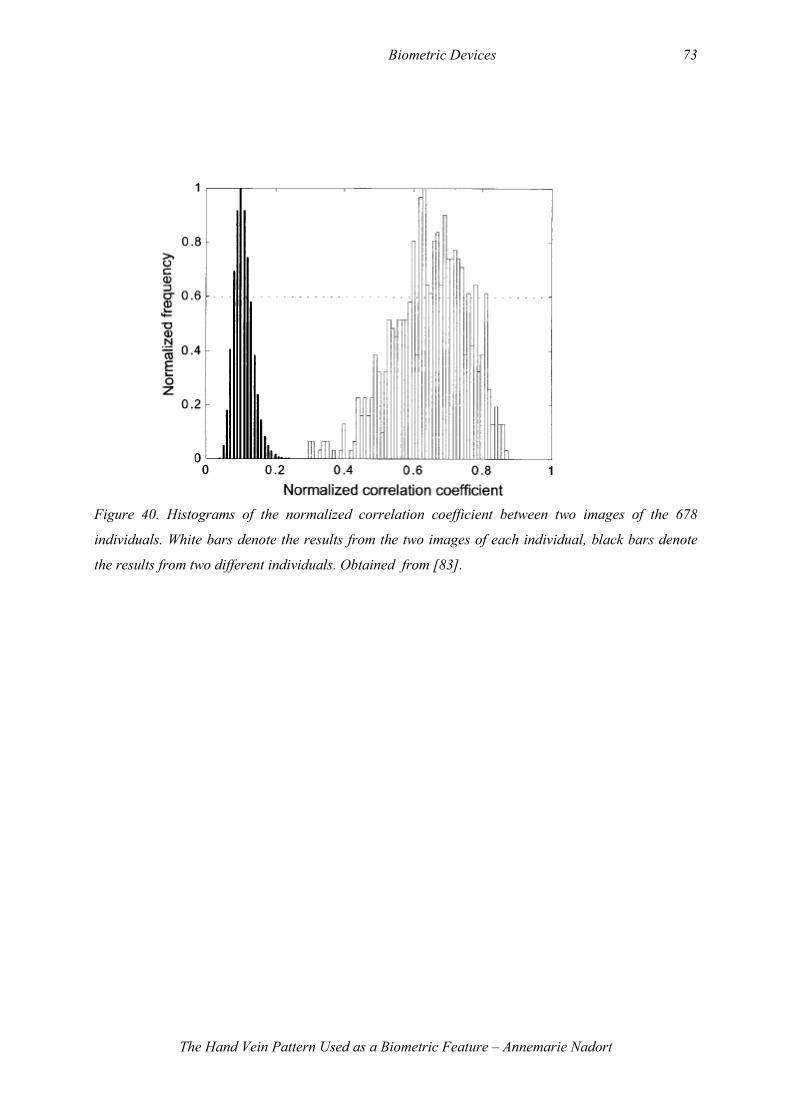
Biometric Devices 73
The Hand Vein Pattern Used as a Biometric Feature – Annemarie Nadort
Figure 40. Histograms of the normalized correlation coefficient between two images of the 678
individuals. White bars denote the results from the two images of each individual, black bars denote
the results from two different individuals. Obtained from [83].
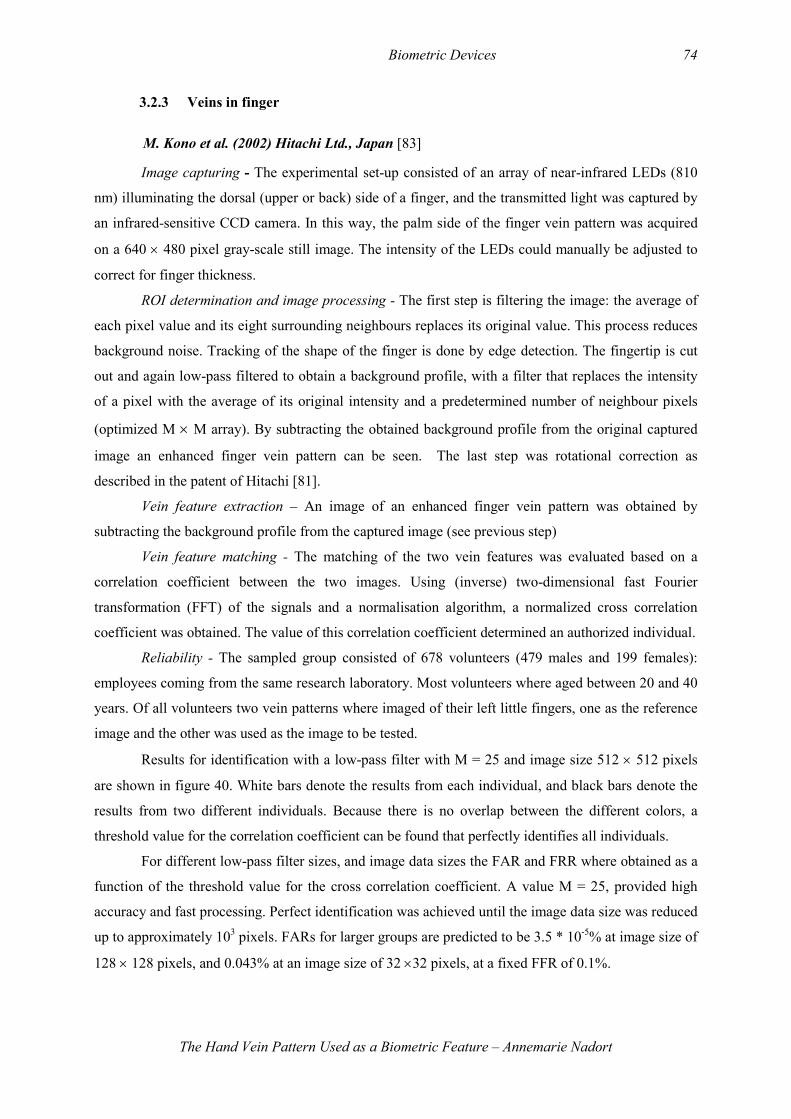
Biometric Devices 74
The Hand Vein Pattern Used as a Biometric Feature – Annemarie Nadort
3.2.3 Veins in finger
M. Kono et al. (2002) Hitachi Ltd., Japan [83]
Image capturing - The experimental set-up consisted of an array of near-infrared LEDs (810
nm) illuminating the dorsal (upper or back) side of a finger, and the transmitted light was captured by
an infrared-sensitive CCD camera. In this way, the palm side of the finger vein pattern was acquired
on a 640 × 480 pixel gray-scale still image. The intensity of the LEDs could manually be adjusted to
correct for finger thickness.
ROI determination and image processing - The first step is filtering the image: the average of
each pixel value and its eight surrounding neighbours replaces its original value. This process reduces
background noise. Tracking of the shape of the finger is done by edge detection. The fingertip is cut
out and again low-pass filtered to obtain a background profile, with a filter that replaces the intensity
of a pixel with the average of its original intensity and a predetermined number of neighbour pixels
(optimized M × M array). By subtracting the obtained background profile from the original captured
image an enhanced finger vein pattern can be seen. The last step was rotational correction as
described in the patent of Hitachi [81].
Vein feature extraction – An image of an enhanced finger vein pattern was obtained by
subtracting the background profile from the captured image (see previous step)
Vein feature matching - The matching of the two vein features was evaluated based on a
correlation coefficient between the two images. Using (inverse) two-dimensional fast Fourier
transformation (FFT) of the signals and a normalisation algorithm, a normalized cross correlation
coefficient was obtained. The value of this correlation coefficient determined an authorized individual.
Reliability - The sampled group consisted of 678 volunteers (479 males and 199 females):
employees coming from the same research laboratory. Most volunteers where aged between 20 and 40
years. Of all volunteers two vein patterns where imaged of their left little fingers, one as the reference
image and the other was used as the image to be tested.
Results for identification with a low-pass filter with M = 25 and image size 512 × 512 pixels
are shown in figure 40. White bars denote the results from each individual, and black bars denote the
results from two different individuals. Because there is no overlap between the different colors, a
threshold value for the correlation coefficient can be found that perfectly identifies all individuals.
For different low-pass filter sizes, and image data sizes the FAR and FRR where obtained as a
function of the threshold value for the cross correlation coefficient. A value M = 25, provided high
accuracy and fast processing. Perfect identification was achieved until the image data size was reduced
up to approximately 103 pixels. FARs for larger groups are predicted to be 3.5 * 10-5% at image size of
128 × 128 pixels, and 0.043% at an image size of 32 ×32 pixels, at a fixed FFR of 0.1%.
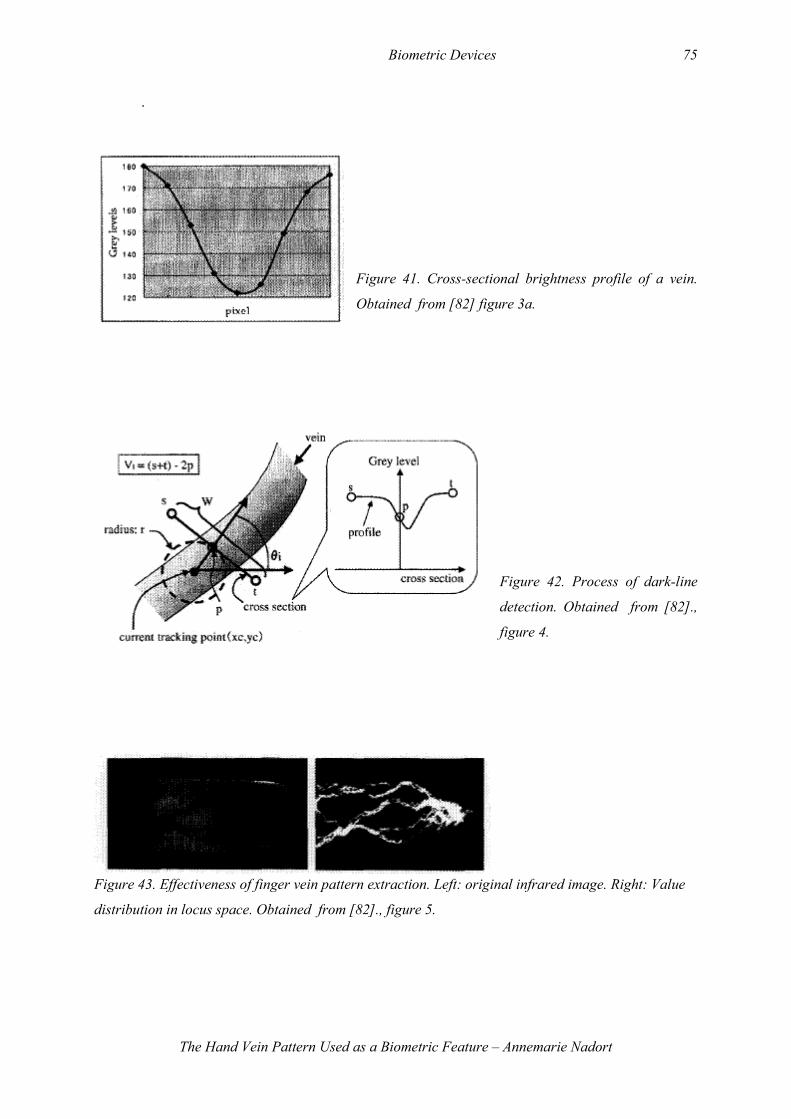
Biometric Devices 75
The Hand Vein Pattern Used as a Biometric Feature – Annemarie Nadort
.
Figure 41. Cross-sectional brightness profile of a vein.
Obtained from [82] figure 3a.
Figure 42. Process of dark-line
detection. Obtained from [82].,
figure 4.
Figure 43. Effectiveness of finger vein pattern extraction. Left: original infrared image. Right: Value
distribution in locus space. Obtained from [82]., figure 5.
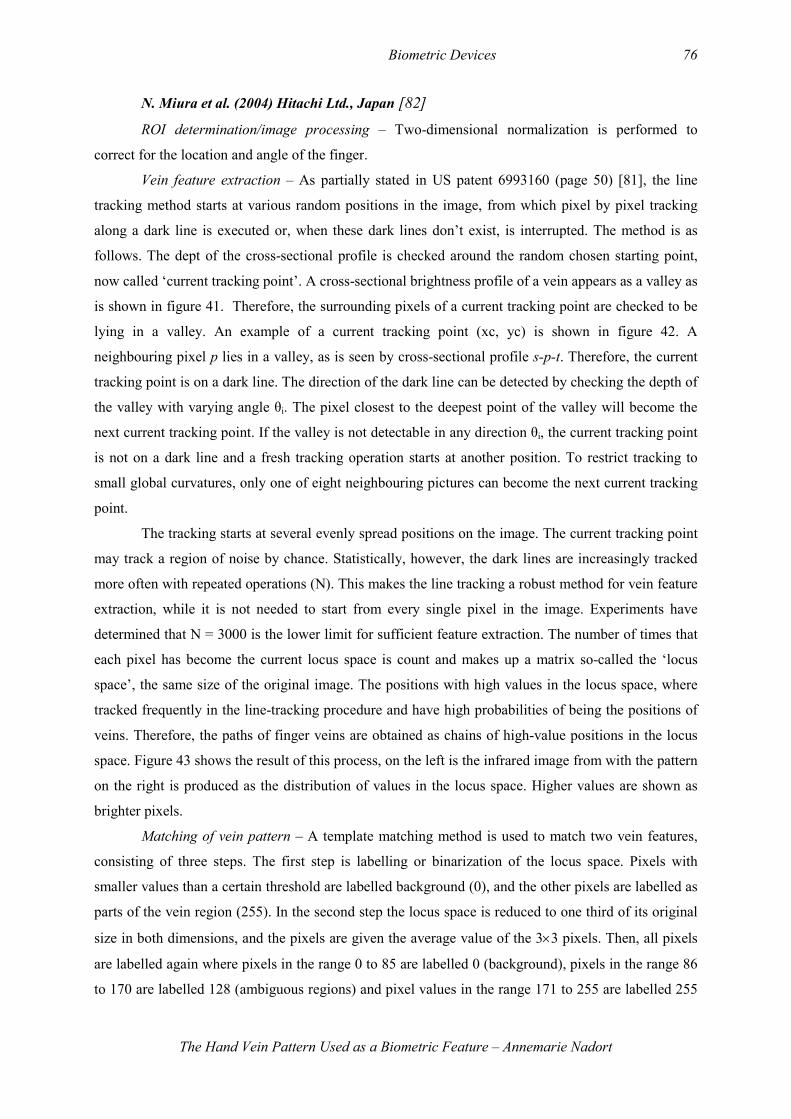
Biometric Devices 76
The Hand Vein Pattern Used as a Biometric Feature – Annemarie Nadort
N. Miura et al. (2004) Hitachi Ltd., Japan [82]
ROI determination/image processing – Two-dimensional normalization is performed to
correct for the location and angle of the finger.
Vein feature extraction – As partially stated in US patent 6993160 (page 50) [81], the line
tracking method starts at various random positions in the image, from which pixel by pixel tracking
along a dark line is executed or, when these dark lines don’t exist, is interrupted. The method is as
follows. The dept of the cross-sectional profile is checked around the random chosen starting point,
now called ‘current tracking point’. A cross-sectional brightness profile of a vein appears as a valley as
is shown in figure 41. Therefore, the surrounding pixels of a current tracking point are checked to be
lying in a valley. An example of a current tracking point (xc, yc) is shown in figure 42. A
neighbouring pixel p lies in a valley, as is seen by cross-sectional profile s-p-t. Therefore, the current
tracking point is on a dark line. The direction of the dark line can be detected by checking the depth of
the valley with varying angle θi. The pixel closest to the deepest point of the valley will become the
next current tracking point. If the valley is not detectable in any direction θi, the current tracking point
is not on a dark line and a fresh tracking operation starts at another position. To restrict tracking to
small global curvatures, only one of eight neighbouring pictures can become the next current tracking
point.
The tracking starts at several evenly spread positions on the image. The current tracking point
may track a region of noise by chance. Statistically, however, the dark lines are increasingly tracked
more often with repeated operations (N). This makes the line tracking a robust method for vein feature
extraction, while it is not needed to start from every single pixel in the image. Experiments have
determined that N = 3000 is the lower limit for sufficient feature extraction. The number of times that
each pixel has become the current locus space is count and makes up a matrix so-called the ‘locus
space’, the same size of the original image. The positions with high values in the locus space, where
tracked frequently in the line-tracking procedure and have high probabilities of being the positions of
veins. Therefore, the paths of finger veins are obtained as chains of high-value positions in the locus
space. Figure 43 shows the result of this process, on the left is the infrared image from with the pattern
on the right is produced as the distribution of values in the locus space. Higher values are shown as
brighter pixels.
Matching of vein pattern – A template matching method is used to match two vein features,
consisting of three steps. The first step is labelling or binarization of the locus space. Pixels with
smaller values than a certain threshold are labelled background (0), and the other pixels are labelled as
parts of the vein region (255). In the second step the locus space is reduced to one third of its original
size in both dimensions, and the pixels are given the average value of the 3×3 pixels. Then, all pixels
are labelled again where pixels in the range 0 to 85 are labelled 0 (background), pixels in the range 86
to 170 are labelled 128 (ambiguous regions) and pixel values in the range 171 to 255 are labelled 255
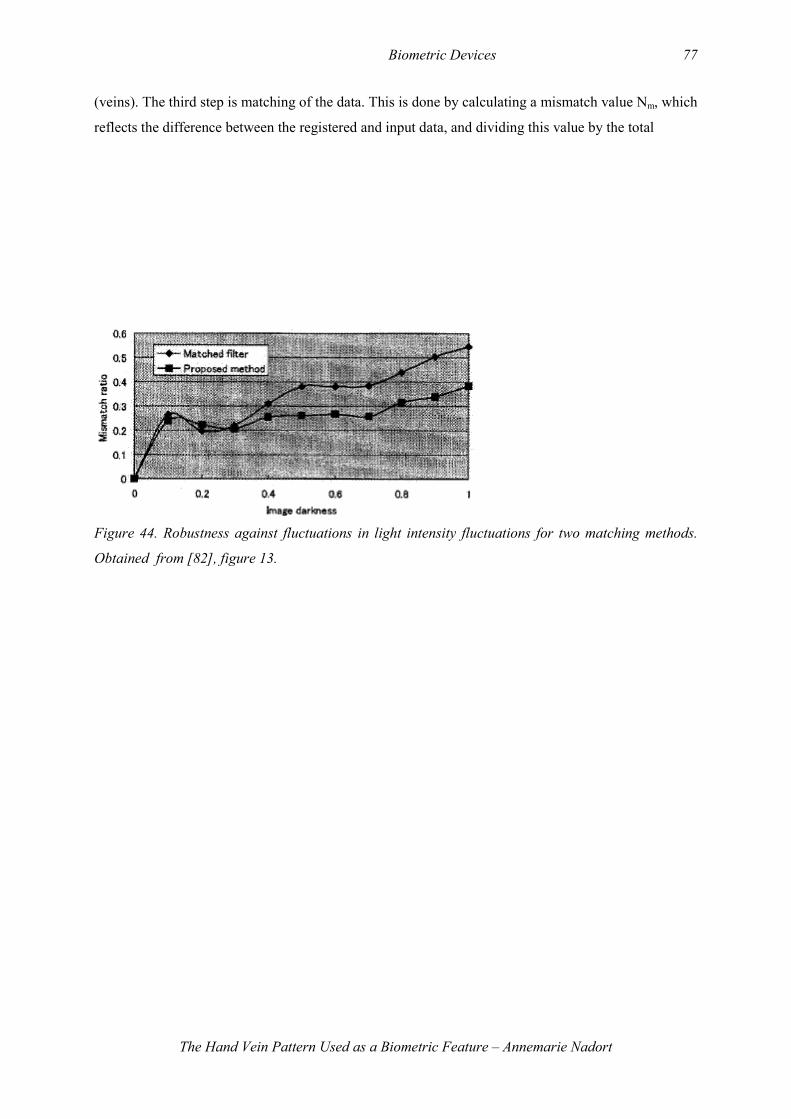
Biometric Devices 77
The Hand Vein Pattern Used as a Biometric Feature – Annemarie Nadort
(veins). The third step is matching of the data. This is done by calculating a mismatch value Nm, which
reflects the difference between the registered and input data, and dividing this value by the total
Figure 44. Robustness against fluctuations in light intensity fluctuations for two matching methods.
Obtained from [82], figure 13.
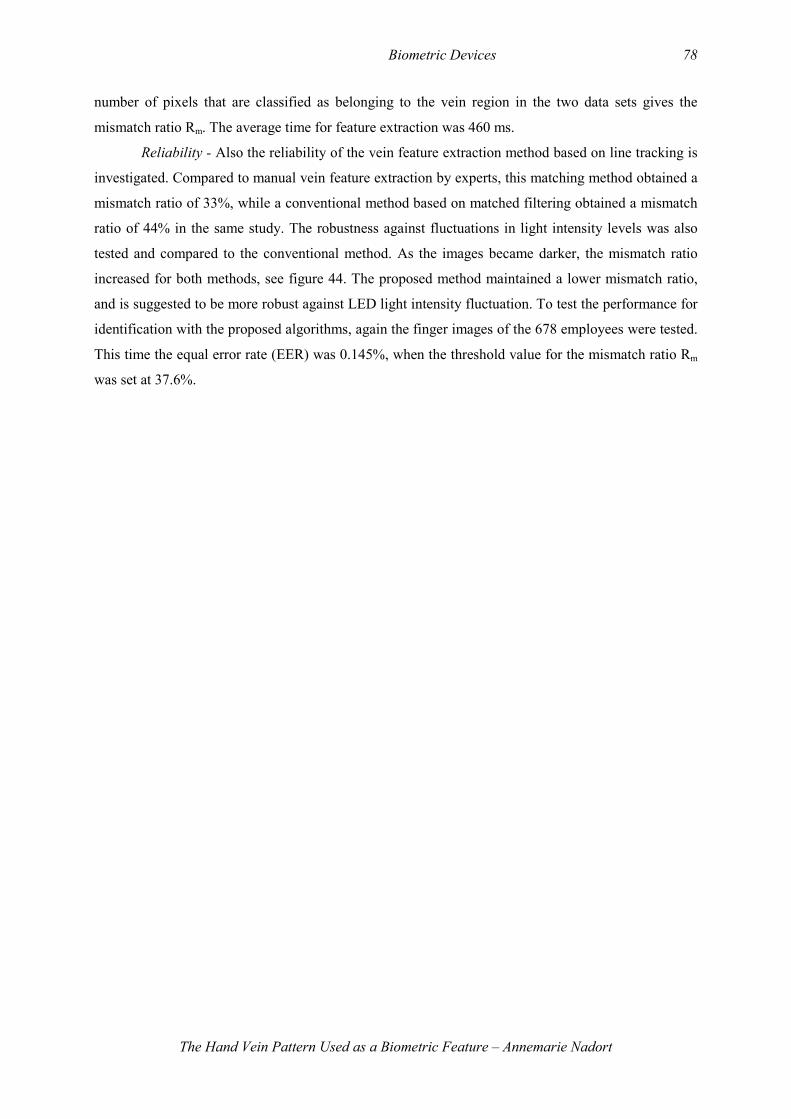
Biometric Devices 78
The Hand Vein Pattern Used as a Biometric Feature – Annemarie Nadort
number of pixels that are classified as belonging to the vein region in the two data sets gives the
mismatch ratio Rm. The average time for feature extraction was 460 ms.
Reliability - Also the reliability of the vein feature extraction method based on line tracking is
investigated. Compared to manual vein feature extraction by experts, this matching method obtained a
mismatch ratio of 33%, while a conventional method based on matched filtering obtained a mismatch
ratio of 44% in the same study. The robustness against fluctuations in light intensity levels was also
tested and compared to the conventional method. As the images became darker, the mismatch ratio
increased for both methods, see figure 44. The proposed method maintained a lower mismatch ratio,
and is suggested to be more robust against LED light intensity fluctuation. To test the performance for
identification with the proposed algorithms, again the finger images of the 678 employees were tested.
This time the equal error rate (EER) was 0.145%, when the threshold value for the mismatch ratio Rm
was set at 37.6%.

Biometric Devices 79
The Hand Vein Pattern Used as a Biometric Feature – Annemarie Nadort

Biometric Devices 80
The Hand Vein Pattern Used as a Biometric Feature – Annemarie Nadort
3.3 Discussion
The answer on the second research question ‘how do biometric devices that utilize the hand vein
pattern work’ is in detail given in sections 3.1 and 3.2. In general, there are 5 stages to distinguish in
the process of biometric verification using the hand vein system: image capturing, ROI determination,
vein feature extraction and vein feature matching. There are similarities and differences in these stages
for different companies or studies on hand vein pattern verification. In table 2 an overview is given of
all verification methods described, so that differences in the stages can be seen more clearly. This
discussion will continue with giving some remarks on the essential differences between the
verification methods for each stage and on the reliability of the methods.
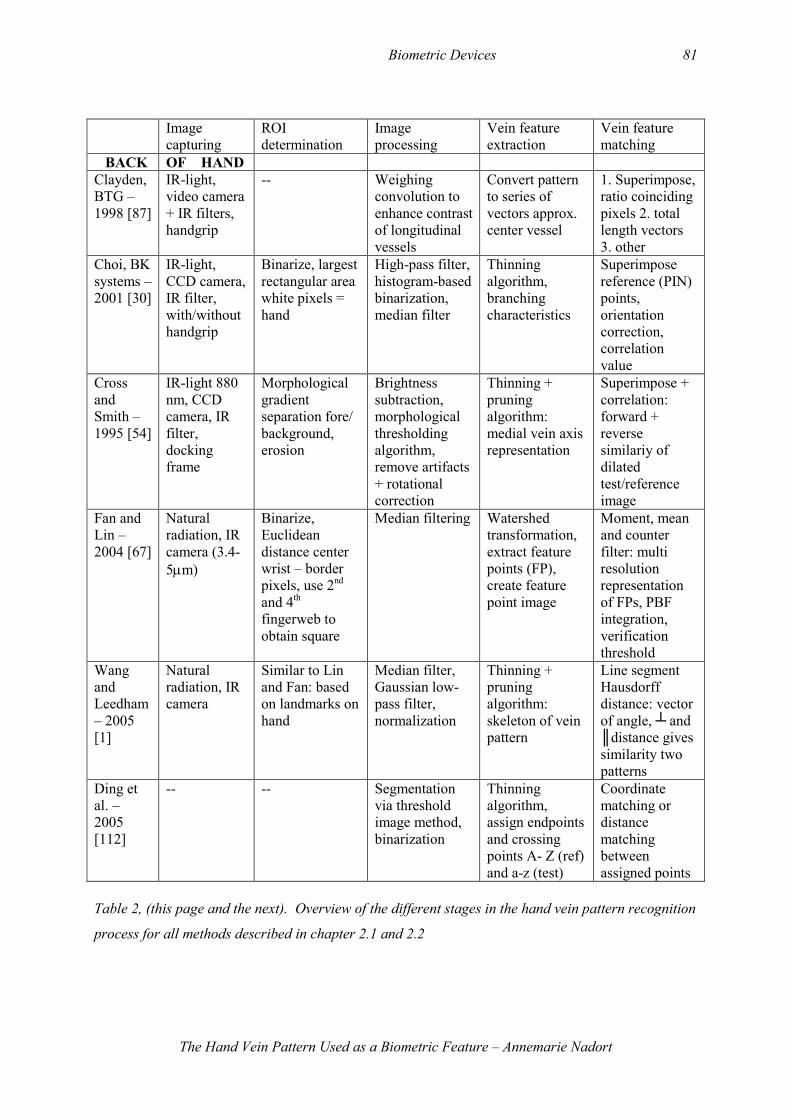
Biometric Devices 81
The Hand Vein Pattern Used as a Biometric Feature – Annemarie Nadort
Image capturing
ROI determination
Image processing
Vein feature extraction
Vein feature matching
BACK OF HAND
Clayden, BTG – 1998 [87]
IR-light, video camera + IR filters, handgrip
-- Weighing convolution to enhance contrast of longitudinal vessels
Convert pattern to series of vectors approx. center vessel
1. Superimpose, ratio coinciding pixels 2. total length vectors 3. other
Choi, BK systems – 2001 [30]
IR-light, CCD camera, IR filter, with/without handgrip
Binarize, largest rectangular area white pixels = hand
High-pass filter, histogram-based binarization, median filter
Thinning algorithm, branching characteristics
Superimpose reference (PIN) points, orientation correction, correlation value
Cross and Smith – 1995 [54]
IR-light 880 nm, CCD camera, IR filter, docking frame
Morphological gradient separation fore/ background, erosion
Brightness subtraction, morphological thresholding algorithm, remove artifacts + rotational correction
Thinning + pruning algorithm: medial vein axis representation
Superimpose + correlation: forward + reverse similariy of dilated test/reference image
Fan and Lin – 2004 [67]
Natural radiation, IR camera (3.4-5µm)
Binarize, Euclidean distance center wrist – border pixels, use 2nd and 4th fingerweb to obtain square
Median filtering Watershed transformation, extract feature points (FP), create feature point image
Moment, mean and counter filter: multi resolution representation of FPs, PBF integration, verification threshold
Wang and Leedham – 2005 [1]
Natural radiation, IR camera
Similar to Lin and Fan: based on landmarks on hand
Median filter, Gaussian low-pass filter, normalization
Thinning + pruning algorithm: skeleton of vein pattern
Line segment Hausdorff distance: vector of angle, ┴ and ║distance gives similarity two patterns
Ding et al. – 2005 [112]
-- -- Segmentation via threshold image method, binarization
Thinning algorithm, assign endpoints and crossing points A- Z (ref) and a-z (test)
Coordinate matching or distance matching between assigned points
Table 2, (this page and the next). Overview of the different stages in the hand vein pattern recognition
process for all methods described in chapter 2.1 and 2.2
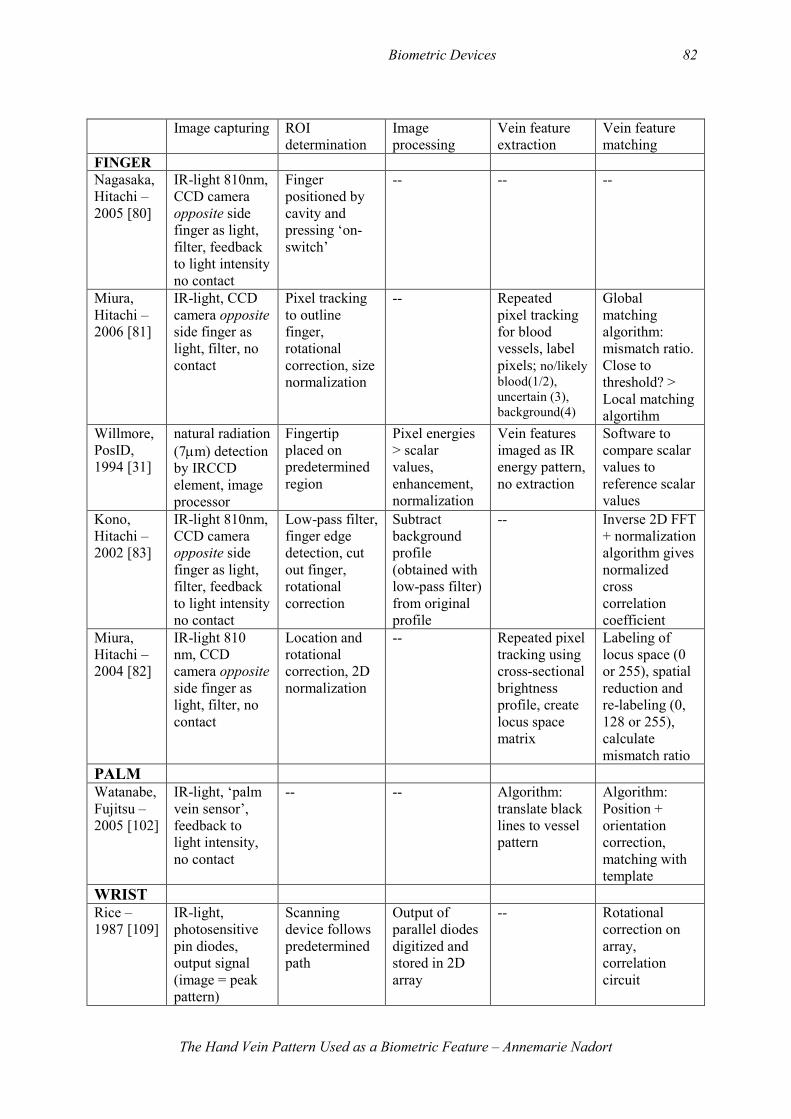
Biometric Devices 82
The Hand Vein Pattern Used as a Biometric Feature – Annemarie Nadort
Image capturing ROI determination
Image processing
Vein feature extraction
Vein feature matching
FINGER Nagasaka, Hitachi – 2005 [80]
IR-light 810nm, CCD camera opposite side finger as light, filter, feedback to light intensity no contact
Finger positioned by cavity and pressing ‘on-switch’
-- -- --
Miura, Hitachi – 2006 [81]
IR-light, CCD camera opposite side finger as light, filter, no contact
Pixel tracking to outline finger, rotational correction, size normalization
-- Repeated pixel tracking for blood vessels, label pixels; no/likely blood(1/2), uncertain (3), background(4)
Global matching algorithm: mismatch ratio. Close to threshold? > Local matching algortihm
Willmore, PosID, 1994 [31]
natural radiation (7µm) detection by IRCCD element, image processor
Fingertip placed on predetermined region
Pixel energies > scalar values, enhancement, normalization
Vein features imaged as IR energy pattern, no extraction
Software to compare scalar values to reference scalar values
Kono, Hitachi – 2002 [83]
IR-light 810nm, CCD camera opposite side finger as light, filter, feedback to light intensity no contact
Low-pass filter, finger edge detection, cut out finger, rotational correction
Subtract background profile (obtained with low-pass filter) from original profile
-- Inverse 2D FFT + normalization algorithm gives normalized cross correlation coefficient
Miura, Hitachi – 2004 [82]
IR-light 810 nm, CCD camera opposite side finger as light, filter, no contact
Location and rotational correction, 2D normalization
-- Repeated pixel tracking using cross-sectional brightness profile, create locus space matrix
Labeling of locus space (0 or 255), spatial reduction and re-labeling (0, 128 or 255), calculate mismatch ratio
PALM Watanabe, Fujitsu – 2005 [102]
IR-light, ‘palm vein sensor’, feedback to light intensity, no contact
-- -- Algorithm: translate black lines to vessel pattern
Algorithm: Position + orientation correction, matching with template
WRIST Rice – 1987 [109]
IR-light, photosensitive pin diodes, output signal (image = peak pattern)
Scanning device follows predetermined path
Output of parallel diodes digitized and stored in 2D array
-- Rotational correction on array, correlation circuit
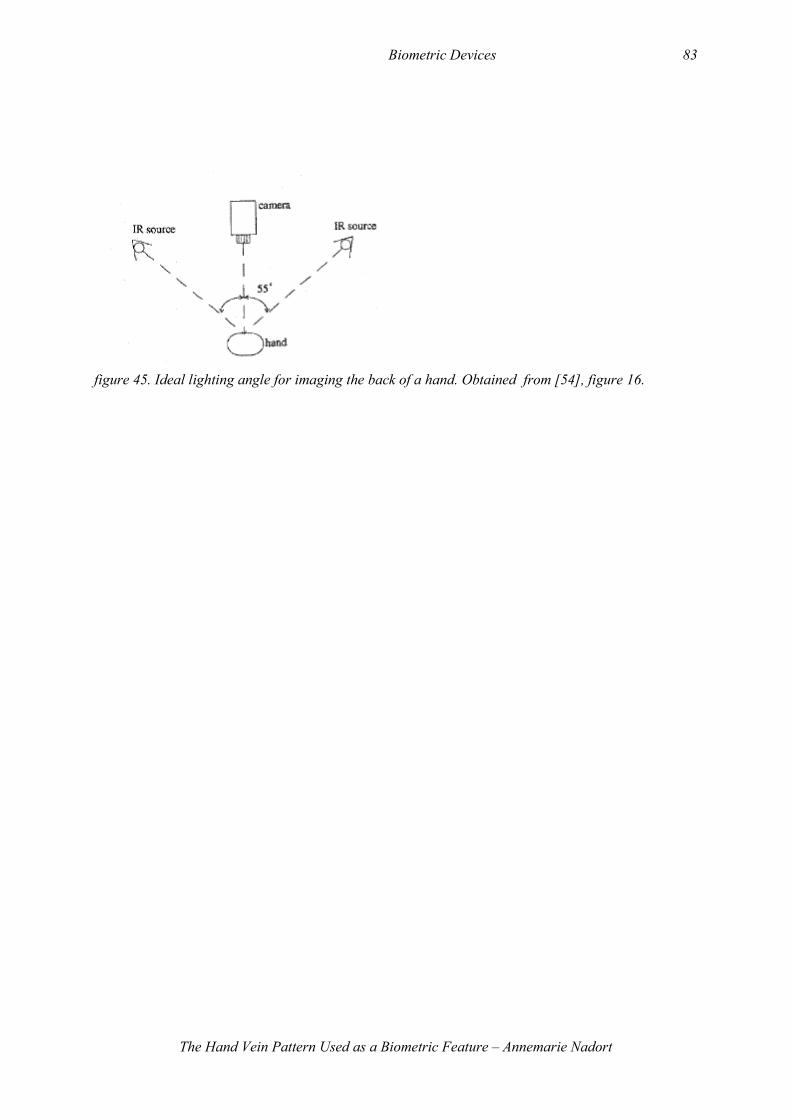
Biometric Devices 83
The Hand Vein Pattern Used as a Biometric Feature – Annemarie Nadort
figure 45. Ideal lighting angle for imaging the back of a hand. Obtained from [54], figure 16.
Biometric Devices 84
The Hand Vein Pattern Used as a Biometric Feature – Annemarie Nadort
3.3.1 Image capturing
A vein image is essentially made by capturing of mid- or near- infrared radiation by a
photosensitive device, which generates electronic signals that are converted into an image or a peak
diagram. The most essential difference in the image capturing stage is capturing the natural emanating
MIR radiation or capturing the reflected and scattered NIR radiation. I will refer to the first method as
‘thermal imaging’ and to the second method as ‘reflective imaging’.
Good quality of the image is essential, because high-quality images retain detailed information
of biometric features. Consequently, more information upon which verification is based is present in
the images, which improves reliability [67]. Factors that influence the quality of thermal images are
ambient temperatures, both cold and hot. As was seen in figure 36 (page 67) thermal images of the
back of a hand in a tropical outside environment (30-34 °C and >80% humidity) have a low quality
[1], which makes it hard to extract a vein pattern. This is due to a low contrast in temperature between
veins and surrounding tissue. In cold weather veins constrict and also become less clear. This also
holds for the quality of reflective imaging [82].
Another factor that influences the quality of reflection images is the lighting condition [67].
Sufficient lighting with near IR light sources and proper use of filters are essential. Some methods use
a feedback system to adjust the intensity of the IR lights for optimal illumination to prevent over- and
underexposure. This is an important improvement for the quality of the images [80, 83, 102]. Another
factor for image quality is the position of the light in relation to the hand. A single IR source induces
surface shadows and specular reflection. It is suggested that a convex surface, such as the back of a
hand, should be optimally lit using a lighting angle of 55° as shown in figure 45 [54]. An advantage of
thermal imaging is that it is independent of lighting conditions and can be used in total absence of light
[67].
Both imaging methods produce images with a reduced and obscured vein pattern when the
subject has a relatively thick layer of subcutaneous fat [54, 67]. This results in nearly homogeneous
grey values and lack of high contrast regions. Smith and Cross [54] suggest a study to determine the
optimal band of the NIR range for imaging these deeper subcutaneous veins. They had used a 880nm
source, which is, according to figure 14 (page 35), a region of deepest penetration into the skin.
Considering this, it is probably not possible to obtain a deeper penetration using different light
sources. Other factors that affect the distinctiveness of the vein pattern are the degree of venous
engorgement, the condition of the vein walls, and the nearness of the vein to the surface [67]. These
factors are in turn influenced by for example diseases that induce deterioration of veins and
environmental temperature, physical activity or alcohol intake, which reduce dilation or constriction of
the peripheral veins. A last issue is the amount of hair on the hand of the user: clumping of hair is also
responsible for low image quality [54].
Other essential differences in the imaging stage are the position of the imaging device in
relation to the light source and hand. In thermal imaging the sensor will capture mid IR light
Biometric Devices 85
The Hand Vein Pattern Used as a Biometric Feature – Annemarie Nadort
emanating from the same side of the hand or finger as the sensor and no additional light sources are
needed. Reflective imaging of the finger veins by Hitachi is done by positioning the NIR sources on
the opposite side of the finger as the camera. The image consists of light that has travelled through the
fingertip without being absorbed by the veins or tissue. Methods that image the palm, wrist or back of
the hand position their light sources and camera on the same side of the hand, thereby capturing light
that has penetrated the skin and is scattered or reflected back out of the same side.
In section 2.5.3 it is noted how different opinions on penetration depth of NIR light into tissue
are stated in literature. Distances range from a ‘few millimetres’ to up to 8 centimetres, (with very
sensitive equipment). Since it is possible to capture NIR radiation opposite to the fingertip, a sufficient
amount will at least travel this distance of around 0.5-2 cm’s. Light that enters the back or palm of the
hand will travel around the same distance in the skin before it is reflected back to the camera. The
amount of diffusion of the photons due to scattering resulting in an image with smooth gradients is
probably more or less similar for both methods. The wavelength of the NIR sources was sometimes
given; 880 nm [54] and 810 nm [102]. 880 nm will give a slightly deeper penetration [74, 93] and
810nm is closer to the isobestic wavelength (figure 10) where deoxy- and oxyhemoglobin have a
similar extinction coefficient.
One remark on signal capturing by Rice [109] should be made. The patent says that ‘the
radiation is reflected by subcutaneous blood vessels and received by photosensitive pin diode’. Some
radiation will indeed be reflected by the blood vessels, but most radiation will be reflected by the
surrounding tissue and rather be absorbed by haemoglobin inside the blood vessels.
3.3.2 ROI determination
Verification is based on comparison of features of vein patterns extracted in the same region
from two or more different images. The region to be extracted, the ROI, is therefore important to be
fixed in the same position in different images to ensure stability of the principal extracted vein
features, and thus accurate and reliable verification. There are several ways to stabilize the ROI. The
finger or hand can physically be guided to a selected position by a docking frame [54], cavity to insert
the finger [80, 81] or other form of restricted area to present the biometric feature [30, 31, 87, 109]. In
this way, the primary captured image is of the same region each time, although some positional
variation can be expected. This should be accounted for at the vein feature matching stage, where
some shifting of the feature image should be allowed. Another issue with physically guiding the
biometric feature is hygiene: a handgrip that is touched by all users is not very clean. A cavity can
restrict movement, and without any physical contact it is more hygienic than a grip. Some companies
provide devices with or without a handgrip [30] or make the contact surfaces of antibacterial material
[80].
Biometric Devices 86
The Hand Vein Pattern Used as a Biometric Feature – Annemarie Nadort
Another way to determine the ROI is to use information on the image after capturing. One can
select reference points such as finger webs and the wrist [1, 67], or define the outline of the hand or
finger using foreground-background properties [30, 54, 81, 83]. Then rotate the image until the
reference features are on standardized positions. Sometimes size normalization is part of this process
as well [81, 82]. The goal of pre- and/or post-imaging ROI determination is to reduce the displacement
of the ROI to acceptable range. In the vein feature matching process often more shifting and scaling is
applied. Several methods use both pre- and post-imaging ROI determination and additionally allow for
adaptations in the matching process.
All corrections for position that have just been mentioned are two dimensional corrections.
Three dimensional rotation of the finger degrades identification accuracy because two dimensional
images are used in the systems [82]. The third dimension in movement (angle of the hand/finger) can
not (yet) be corrected for, it can only be minimized by placement restrictions at the pre-imaging stage.
3.3.3 Image processing.
The image that is acquired contains much of information unnecessary for identification, such
as background noise, irregular shades due to muscle and bones in the finger and intensity fluctuations
[82]. The aim of image processing is to enhance the wanted vein pattern and reduce this unwanted
information. Useful digital image processing techniques are abundant. In sections 3.1 and 3.2 many
have been described. An in-depth review on these techniques is beyond the scope of this thesis, but
some remarks are made below.
In some methods, image processing is an accumulation of several filters and algorithms and
seems to be overkill. Choi [30] for example, uses a high-pass filter to enhance contrast, followed by
histogram based binarization followed by median filtering to remove noise. Wang and Leedham [1]
both median and low pass filter their image, for double noise reduction. Methods that manipulate the
original image relatively much continue with rather simple vein feature extraction methods or methods
that rely on a simple (black/white) vein image. These methods often derive step by step a
representation of the vein skeleton, starting from the original image [1, 30, 54, 83, 87, 112]. Other
methods don’t change the original image much [67, 80-82, 109]. They don’t segment or binarized the
images so that the images still contain smooth gradients. Consequently, their vein feature extraction
methods are more complex and robust against images with noise and gradients. Often they extract
features or label pixels to obtain a new image, containing only the extracted information.
While after vein imaging and ROI determination the images obtained according to the
different companies and studies showed many similarities, after the image processing stage the
different methods dissociate more from each other, although a few common trends exist. The next
steps, vein feature extraction and matching, continue with the processed images on the different routes
towards verification.
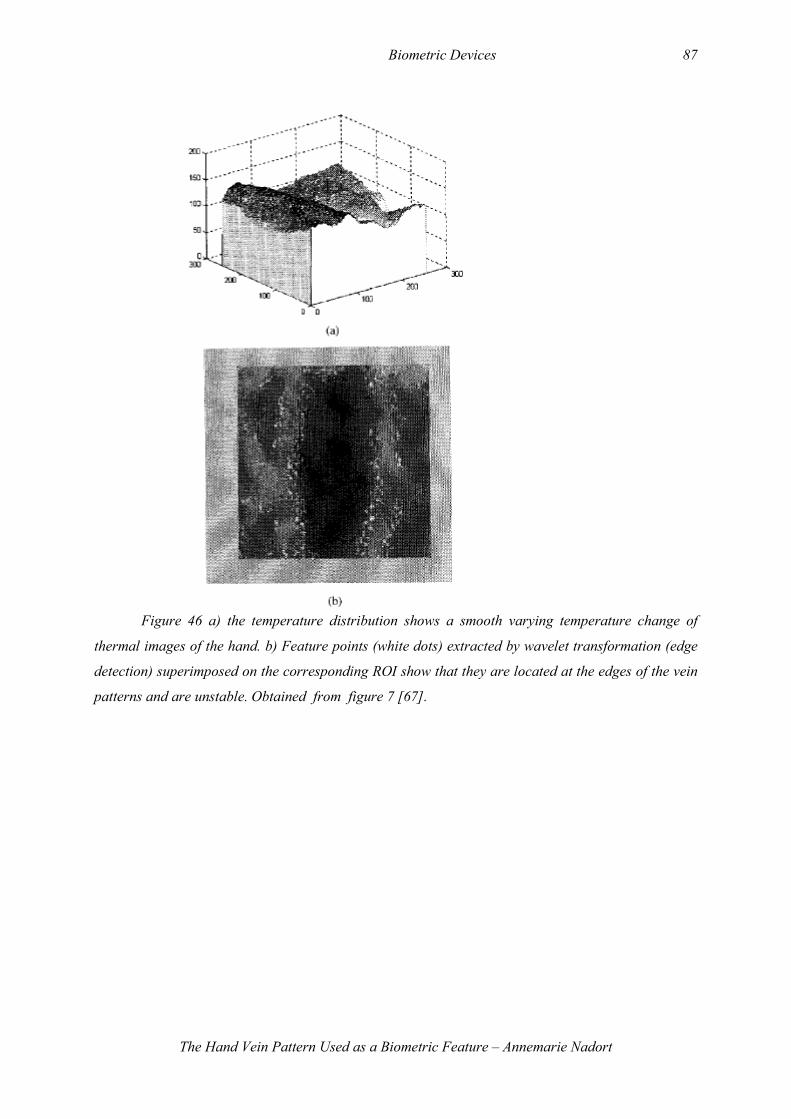
Biometric Devices 87
The Hand Vein Pattern Used as a Biometric Feature – Annemarie Nadort
Figure 46 a) the temperature distribution shows a smooth varying temperature change of
thermal images of the hand. b) Feature points (white dots) extracted by wavelet transformation (edge
detection) superimposed on the corresponding ROI show that they are located at the edges of the vein
patterns and are unstable. Obtained from figure 7 [67].
Biometric Devices 88
The Hand Vein Pattern Used as a Biometric Feature – Annemarie Nadort
3.3.4 Vein feature extraction
The goal of vein feature extraction is to obtain an image containing only the vein structure, or
a representation thereof. A representation of the characteristics of a vein pattern is seen in Choi [30],
who applied a thinning algorithm and then computed the branching characteristics to represent the
features of the vein pattern in a table. Also Ding et al.[112] use the threshold image method, binarize
and apply a thinning algorithm, followed by a representation of the vein pattern by coordinates of end
and crossing points.
Methods that retain the full vein structure, by representing its skeleton or medial axis are
Clayden [87], who approximated the vein centers with a series of (longitudinal) vectors, and Smith
and Cross [54] who applied a morphological thresholding algorithm to separate the veins from the
background and consequently applied a thinning and pruning algorithm, and used the remaining
skeleton for matching. One of the common trends thus seen is thinning of the vein pattern, also used
by Wang and Leedham [1] who also followed with pruning.
Another trend is line tracking. Miura et al. [81, 82], evaluated this for finger vein pattern
extraction. Conventional methods for extracting line-shaped features from images, such as the
connection of emphasized edge lines for line extraction or ridge line following, are not suitable
because they take much computational cost or respectively need an image with clear ridges, which is
not the case for finger vein images. Moreover, because transmittance of light varies with the thickness
of the finger, irregular shading and noise are present in the captured images. The aim of the vein
feature extraction method based on line tracking in this study is to be robust against these factors and
perform a fast identification. They used repeated pixel tracking, based on the cross-sectional
brightness profile. The frequency of tracking is put in a locus space matrix to categorize pixels. As the
parts of the veins are tracked over and over again in the repeated operations, they are increasingly
emphasized. Although noise may also be tracked, this will be to a lesser extent [82].
Lin and Fan [67] discuss the use of an edge detector. The grey level of thermal image changes
smoothly from a high to a low temperature. The temperature gradient of the hand also changes
smoothly, and consequently the greyscale image contains smooth gradients (see figure 46). As a result,
the familiar edge detectors based on gradient magnitudes, cannot effectively extract features from the
images. In figure 46b it is shown that the feature points extracted with edge detectors are located at the
edges of veins and not at their actual locations. To overcome these problems, Lin and Fan developed a
basic tool for watershed transformation to extract feature points. Now the feature points represent the
vein pattern uniform distributed over the veins (figure 32, page 63). The smooth gradient is not only
seen in thermal images, but also occurs in images obtained with reflection, due to the diffuse reflection
of tissue and the path length of the radiation in the tissue (section 2.5.3, page 36). Edge detectors, as
well as ridge detectors, are therefore not suitable for vein feature extraction.

Biometric Devices 89
The Hand Vein Pattern Used as a Biometric Feature – Annemarie Nadort
Segmentation of the vein pattern from the background encounters five general types of segmentation
errors [54]:
1. mismeasured attributes: noise can induce quantitative measurement errors in the
segmented image. For example, the length of a vein might appear longer in different
images of the same hand.
2. missing objects: if an object is not clearly visible due to glance, shadows or
occlusion it will not be represented in the segmented image
3. false objects: large marks or shadows appear as feature objects in the segmented
image
4. fragmented objects (ovesegmentation): noise can induce fake edges and fragment
one object into several regions in the segmented image
5. merged objects (undersegmentation): noise can induce blurred edges resulting in
two or more objects merged together as one region in the segmented image
Because vein images usually contain a lot of noise due to the complex structure of the tissue, bones
and skin surface, vein feature extraction methods should be robust enough to overcome errors. In
addition, the quality of the images after image processing should be as high as possible, but not
excessively manipulated.
Biometric Devices 90
The Hand Vein Pattern Used as a Biometric Feature – Annemarie Nadort
3.3.5 Vein feature matching
In this stage, the template image already stored in the database is recalled and compared to the
test image for verification. This can be a one-to-one match or a database search (one-to-many), which
are essentially many one-to-one matches until a match is found. It is important that the template image
is a high-quality image, captured under standardized conditions [54]. The temperature of the hand and
the amount of physical action prior to capturing the template image should be constant. This can, for
example, require that the individual squeezes a rubber ball several times prior to image capturing, so
that the vessels are dilated [54]. In addition, the template image can be an average of several images, 3
[1, 54] or 5 [67], captured for matching. Consequently it contains more detail than a single test image.
Other methods use only one image as a template [83].
Simple pixel by pixel comparison of two digital images of a vein pattern is not sufficient
because of two main reasons: 1. the subcutaneous blood vessels have some freedom to move within
the soft tissue they are embedded in; the shape of the hand (stretched fingers or clenched fist) will
influence the stretching of the skin and underlying veins, and 2. the diameters of the veins may vary as
a result of weather circumstances or physical activity [54]. Moreover, several IR images of a single
hand, both raw and processed, exhibit marked variability due to the complex structure of the tissue,
bones and skin surface and physiological circumstances of the veins. These factors collectively
diminish the accuracy of correlation and sequential matching which is the classical approach for
matching images [54].
On the other hand Miura et al. [82] reject structural matching, because structural matching
requires additional extraction of features points such as line endings and bifurcations and since a
finger-vein pattern has few of these points, template matching based on comparison of pixel values is
more appropriate for finger-vein pattern matching.
Examples of structural matching are found in Choi [30], who compares branching
characteristics of the test and template image (number of branches and connections between branching
points). All other methods use some kind of template matching and correlation method, although
different gradations of advanced algorithms are used.
In all methods the threshold value for matching similarity decides whether a positive match
occurred. This value should be high enough to prevent false positive matches, but low enough to allow
for the variability seen in several images of one single hand, due to the complex process of capturing a
vein image. A short discussion on the performance of the hand vein pattern verification methods is
therefore the topic of the next section.
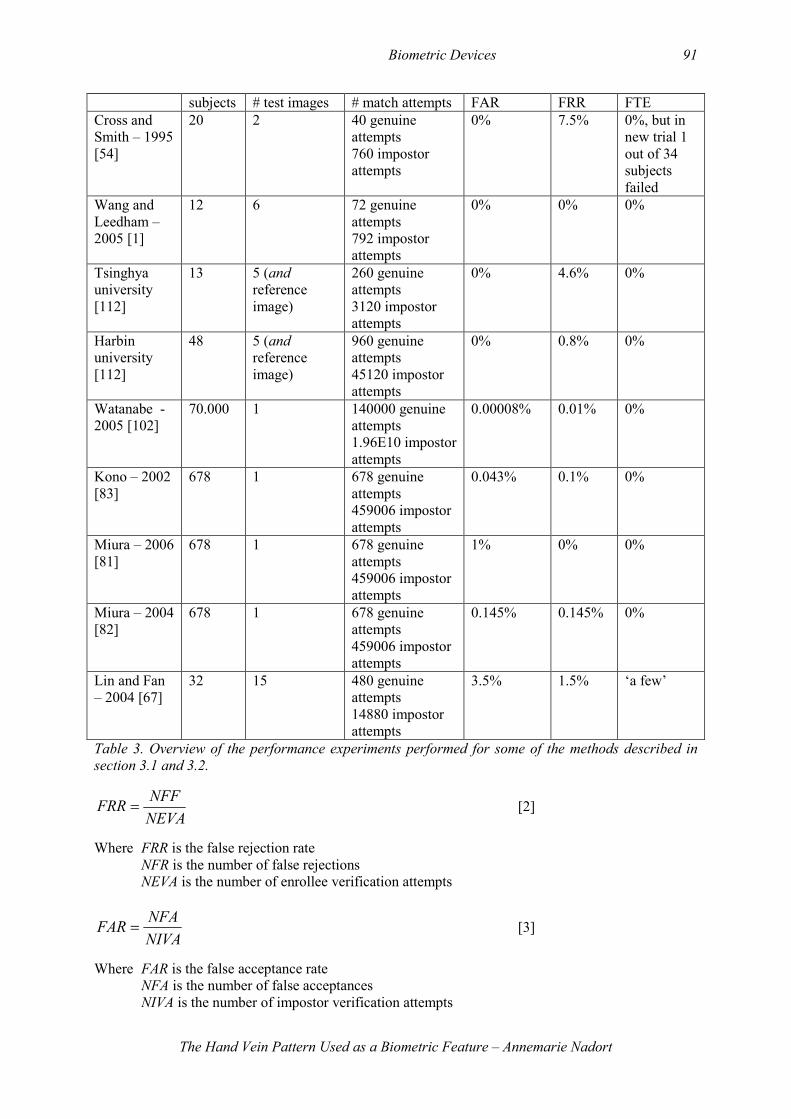
Biometric Devices 91
The Hand Vein Pattern Used as a Biometric Feature – Annemarie Nadort
subjects # test images # match attempts FAR FRR FTE Cross and Smith – 1995 [54]
20 2 40 genuine attempts 760 impostor attempts
0% 7.5% 0%, but in new trial 1 out of 34 subjects failed
Wang and Leedham – 2005 [1]
12 6 72 genuine attempts 792 impostor attempts
0% 0% 0%
Tsinghya university [112]
13 5 (and reference image)
260 genuine attempts 3120 impostor attempts
0% 4.6% 0%
Harbin university [112]
48 5 (and reference image)
960 genuine attempts 45120 impostor attempts
0% 0.8% 0%
Watanabe - 2005 [102]
70.000 1 140000 genuine attempts 1.96E10 impostor attempts
0.00008% 0.01% 0%
Kono – 2002 [83]
678 1 678 genuine attempts 459006 impostor attempts
0.043% 0.1% 0%
Miura – 2006 [81]
678 1 678 genuine attempts 459006 impostor attempts
1% 0% 0%
Miura – 2004 [82]
678 1 678 genuine attempts 459006 impostor attempts
0.145% 0.145% 0%
Lin and Fan – 2004 [67]
32 15 480 genuine attempts 14880 impostor attempts
3.5% 1.5% ‘a few’
Table 3. Overview of the performance experiments performed for some of the methods described in
section 3.1 and 3.2.
NEVA
NFFFRR = [2]
Where FRR is the false rejection rate NFR is the number of false rejections NEVA is the number of enrollee verification attempts
NIVA
NFAFAR = [3]
Where FAR is the false acceptance rate NFA is the number of false acceptances NIVA is the number of impostor verification attempts
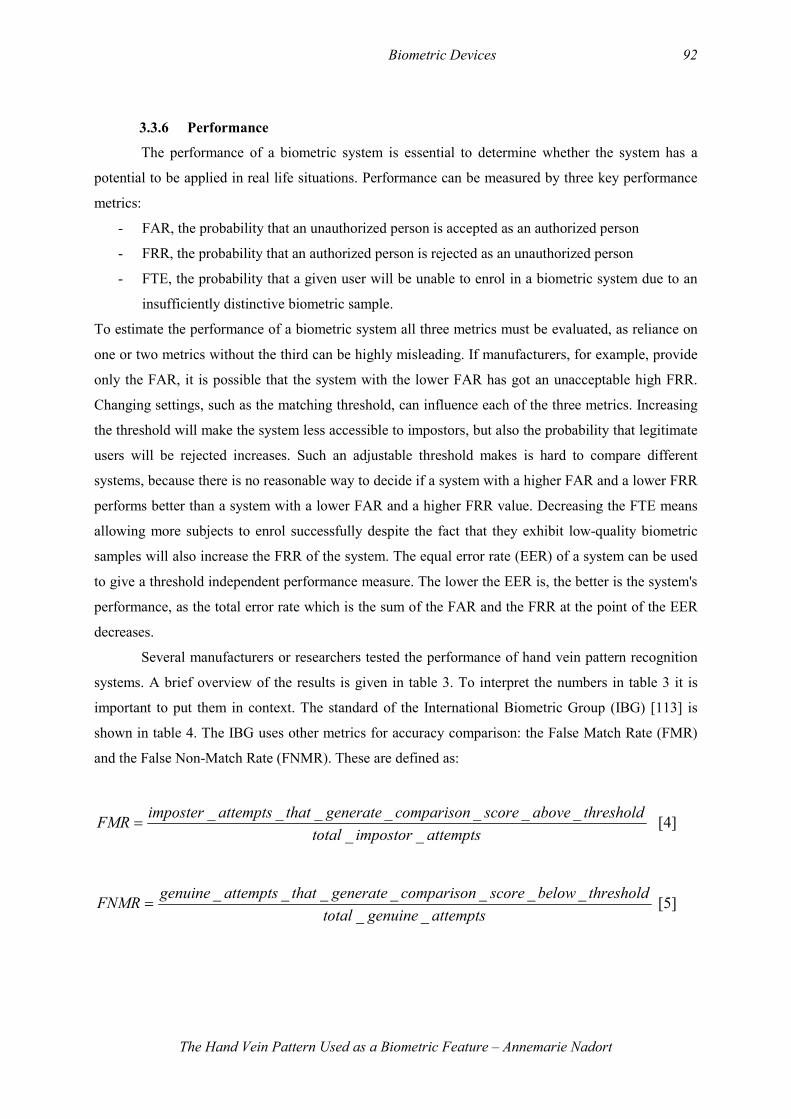
Biometric Devices 92
The Hand Vein Pattern Used as a Biometric Feature – Annemarie Nadort
3.3.6 Performance
The performance of a biometric system is essential to determine whether the system has a
potential to be applied in real life situations. Performance can be measured by three key performance
metrics:
- FAR, the probability that an unauthorized person is accepted as an authorized person
- FRR, the probability that an authorized person is rejected as an unauthorized person
- FTE, the probability that a given user will be unable to enrol in a biometric system due to an
insufficiently distinctive biometric sample.
To estimate the performance of a biometric system all three metrics must be evaluated, as reliance on
one or two metrics without the third can be highly misleading. If manufacturers, for example, provide
only the FAR, it is possible that the system with the lower FAR has got an unacceptable high FRR.
Changing settings, such as the matching threshold, can influence each of the three metrics. Increasing
the threshold will make the system less accessible to impostors, but also the probability that legitimate
users will be rejected increases. Such an adjustable threshold makes is hard to compare different
systems, because there is no reasonable way to decide if a system with a higher FAR and a lower FRR
performs better than a system with a lower FAR and a higher FRR value. Decreasing the FTE means
allowing more subjects to enrol successfully despite the fact that they exhibit low-quality biometric
samples will also increase the FRR of the system. The equal error rate (EER) of a system can be used
to give a threshold independent performance measure. The lower the EER is, the better is the system's
performance, as the total error rate which is the sum of the FAR and the FRR at the point of the EER
decreases.
Several manufacturers or researchers tested the performance of hand vein pattern recognition
systems. A brief overview of the results is given in table 3. To interpret the numbers in table 3 it is
important to put them in context. The standard of the International Biometric Group (IBG) [113] is
shown in table 4. The IBG uses other metrics for accuracy comparison: the False Match Rate (FMR)
and the False Non-Match Rate (FNMR). These are defined as:
attemptsimpostortotal
thresholdabovescorecomparisongeneratethatattemptsimposterFMR
_________
= [4]
attemptsgenuinetotal
thresholdbelowscorecomparisongeneratethatattemptsgenuineFNMR
_________
= [5]
Biometric Devices 93
The Hand Vein Pattern Used as a Biometric Feature – Annemarie Nadort
Level 4 Level 3 Level 2 Level 1
Usability Metrics
Failure to enrol rate (FTE) <1.00 % <2.50% <5.00% <8.00%
Average Enrollment Transaction Duration (Seconds) <30 <60 <90 <120
Transactional Failure to Acquire Rate (T-FTA) <1.00% <2.00% <4.00% <6.00%
Average Recognition Attempt Duration (Seconds) <3 <5 <10 <20
Accuracy Metrics
False Match Rate (FMR) <0.05 % <0.20% <0.75% <1.50%
False Non-Match Rate (FNMR) <1.00 % <2.50% <5.00% <10.00%
Transactional False Match Rate (T-FMR) <0.15% <0.50% <2.00% <4.00%
Transactional False Non-Match Rate (T-FNMR) <0.50% <1.50% <3.50% <7.50%
Table 4. Selection of standards of the International Biometric Group for classifying the performance
of biometric systems. Source: international biometric group [114].
Biometric Devices 94
The Hand Vein Pattern Used as a Biometric Feature – Annemarie Nadort
To compare the FAR and FRR to the FMR and FNMR the following formulas can be used [115]:
FAR = FMR * (1 - FTA) [6]
FRR = FTA + FNMR*(1-FTA) [7]
Here, the FTA means Failure to Acquire and is defined as the proportion of verification or
identification attempts for which the system fails to capture or locate a signal of sufficient quality. The
difference with FTE is thus that the FTA occurs when the person is already enrolled, but the system
fails to capture the biometric feature during verification. The FAR and FRR, including this FTA in the
calculation, are usually reported by the biometric manufacturers and studies (see table 3). However,
without knowing the FTA one cannot compare the different performance metrics and the FTA is never
reported in the studies. Assuming the FTA to be zero in the incorporated studies is reasonable, because
the FTA is not expected to deviate much from the FTE. Making this assumption, only the method of
Lin and Fan [67] fails to meet the level 1 criteria for FMR and is not qualified according to these
standards. All other methods meet level 1 to level 4 criteria for accuracy.
Some other remarks on table 3 should be made. First of all, in general these studies only
reported the FAR and the FRR, except Miura et al. [82] who reported the EER. This makes it hard to
compare the results more quantitatively than with the IBG standards, because no threshold
independent performance comparisons can be made.
The FTE of 0% might mean that failures to enrol have been excluded from the experiment,
although this was never reported. In addition the subjects might not be representative for the general
public. Most ‘failure to enrol cases’ where due to a thick layer of subcutaneous fat [54, 67], and these
people might not be present among the subjects. In support of the lack of representing the entire
population, in Kono et al. [83] it is said that ‘the genetic and age variations in this group of subjects
(678 subjects) are much smaller than the entire human population. Further study is needed to test its
accuracy in a large group with a large genetic and age variation.’
Most studies in table 3 did not include large numbers of subjects. Therefore, the estimated
error rates are less reliable. Cross and Smith [54] state they need a more detailed study, using images
from more than a 100 people, to more reliable estimate the FRR and the FAR and to optimize the
match parameters.
Another remark can be made on the study of Miura et al. [82]. They found a mismatch ratio of
33% with their new method, compared to a mismatch ratio of 44% using a conventional method. The
mismatch ratio is calculated by comparing a manual vein feature extraction done by experts, to the
results obtained with the automated methods. This ratio cannot be compared to other studies because
they did not report such mismatch ratios. However, the question rises whether 33% mismatch of an
automated system is such a good performance. Insight into the reasons why the automated system
performs a lot worse than a human eye can provide improvements for the automated system.
Biometric Devices 95
The Hand Vein Pattern Used as a Biometric Feature – Annemarie Nadort
A bias in table 3 occurs when more test images of the same hand are taken and used as test
images. In this way, the FAR is estimated based on several impostor attempts of the same hand (only
the images are taken at different times) and this tends to estimate the FAR lower than when in reality
many different people use the system. The number of subjects should thus always be taken into
account when looking at table 3.
The experiments where all performed with little time difference between capturing images for
enrolment and capturing images for verification. Most subjects performed enrolment and subsequently
submitted the biometric feature for verification. It has been shown that over time, many biometric
systems are prone to incorrectly rejecting a substantial percentage of users. Verifying a user
immediately after enrolment is not highly challenging to biometric systems. ‘However, after six
weeks, testing shows that some systems' error rates increase tenfold.’[113] Only Cross and Smith [54]
have tested two subjects again after several weeks. This implies that the performance metrics in table 3
will become higher when the methods are applied in real world situations, where it is likely that
enrolment and verification will occur with substantial time differences.
A last comment to make is that usability comparison of the incorporated methods is not
possible because most of the usability metrics of table 4 are not reported.
The most important remark that should be made on the comparison of all the methods of table
3 using the performance metrics reported in scientific studies, patents or company reports is that they
are all calculated using different test data and test protocols. This makes drawing hard conclusions on
their performance impossible. Table 3 should only be used as an indication for comparison. Ideally
system performance parameters are calculated using an infinite and representative test set, which of
course is not possible under real world conditions. To get comparable results it is therefore necessary
that the metrics that are compared are calculated on the same test data using the same test protocol.
The IBG performs ‘comparative biometric testing rounds’ in which these two test conditions are
fulfilled for the biometric devices attaining the test round. In September 2006 the Round 6 Public
Report became available [115], in which both Fujitsu and Hitachi subjected their vascular recognition
technologies to the comparison test. This reliable performance test is a very good tool for comparison
of these two methods.
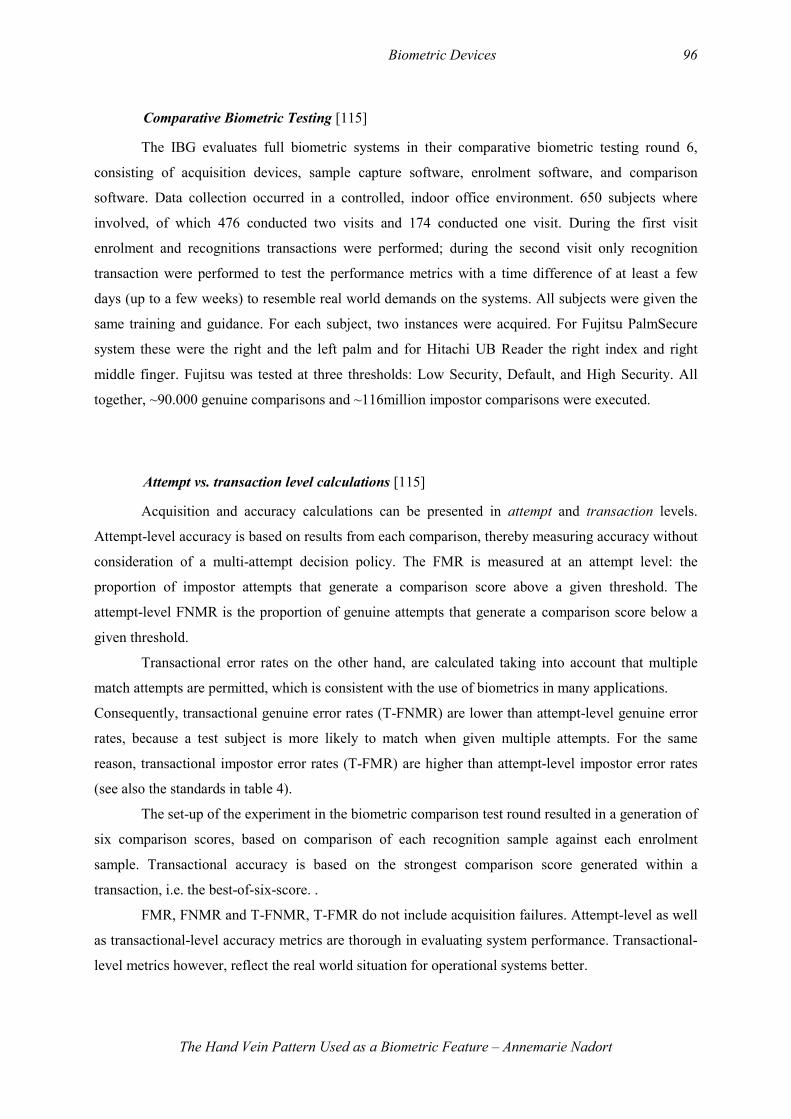
Biometric Devices 96
The Hand Vein Pattern Used as a Biometric Feature – Annemarie Nadort
Comparative Biometric Testing [115]
The IBG evaluates full biometric systems in their comparative biometric testing round 6,
consisting of acquisition devices, sample capture software, enrolment software, and comparison
software. Data collection occurred in a controlled, indoor office environment. 650 subjects where
involved, of which 476 conducted two visits and 174 conducted one visit. During the first visit
enrolment and recognitions transactions were performed; during the second visit only recognition
transaction were performed to test the performance metrics with a time difference of at least a few
days (up to a few weeks) to resemble real world demands on the systems. All subjects were given the
same training and guidance. For each subject, two instances were acquired. For Fujitsu PalmSecure
system these were the right and the left palm and for Hitachi UB Reader the right index and right
middle finger. Fujitsu was tested at three thresholds: Low Security, Default, and High Security. All
together, ~90.000 genuine comparisons and ~116million impostor comparisons were executed.
Attempt vs. transaction level calculations [115]
Acquisition and accuracy calculations can be presented in attempt and transaction levels.
Attempt-level accuracy is based on results from each comparison, thereby measuring accuracy without
consideration of a multi-attempt decision policy. The FMR is measured at an attempt level: the
proportion of impostor attempts that generate a comparison score above a given threshold. The
attempt-level FNMR is the proportion of genuine attempts that generate a comparison score below a
given threshold.
Transactional error rates on the other hand, are calculated taking into account that multiple
match attempts are permitted, which is consistent with the use of biometrics in many applications.
Consequently, transactional genuine error rates (T-FNMR) are lower than attempt-level genuine error
rates, because a test subject is more likely to match when given multiple attempts. For the same
reason, transactional impostor error rates (T-FMR) are higher than attempt-level impostor error rates
(see also the standards in table 4).
The set-up of the experiment in the biometric comparison test round resulted in a generation of
six comparison scores, based on comparison of each recognition sample against each enrolment
sample. Transactional accuracy is based on the strongest comparison score generated within a
transaction, i.e. the best-of-six-score. .
FMR, FNMR and T-FNMR, T-FMR do not include acquisition failures. Attempt-level as well
as transactional-level accuracy metrics are thorough in evaluating system performance. Transactional-
level metrics however, reflect the real world situation for operational systems better.
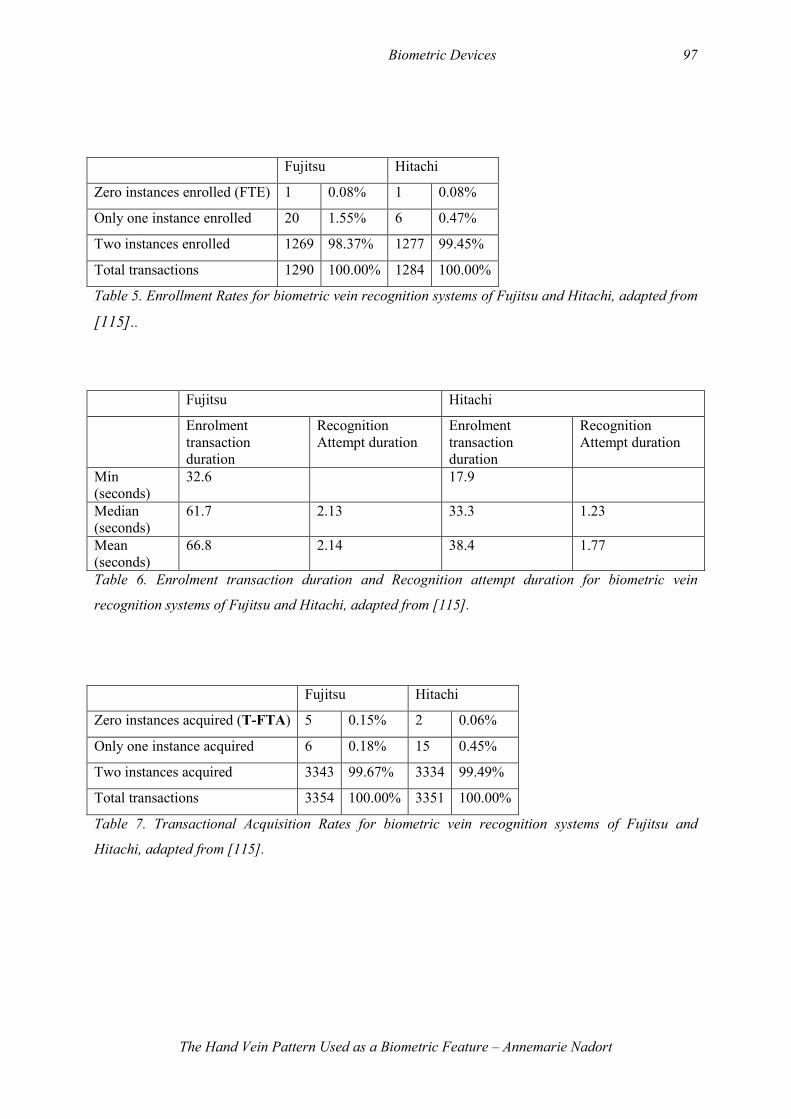
Biometric Devices 97
The Hand Vein Pattern Used as a Biometric Feature – Annemarie Nadort
Fujitsu Hitachi
Zero instances enrolled (FTE) 1 0.08% 1 0.08%
Only one instance enrolled 20 1.55% 6 0.47%
Two instances enrolled 1269 98.37% 1277 99.45%
Total transactions 1290 100.00% 1284 100.00%
Table 5. Enrollment Rates for biometric vein recognition systems of Fujitsu and Hitachi, adapted from
[115]..
Fujitsu Hitachi
Enrolment transaction duration
Recognition Attempt duration
Enrolment transaction duration
Recognition Attempt duration
Min (seconds)
32.6 17.9
Median (seconds)
61.7 2.13 33.3 1.23
Mean (seconds)
66.8 2.14 38.4 1.77
Table 6. Enrolment transaction duration and Recognition attempt duration for biometric vein
recognition systems of Fujitsu and Hitachi, adapted from [115].
Fujitsu Hitachi
Zero instances acquired (T-FTA) 5 0.15% 2 0.06%
Only one instance acquired 6 0.18% 15 0.45%
Two instances acquired 3343 99.67% 3334 99.49%
Total transactions 3354 100.00% 3351 100.00%
Table 7. Transactional Acquisition Rates for biometric vein recognition systems of Fujitsu and
Hitachi, adapted from [115].
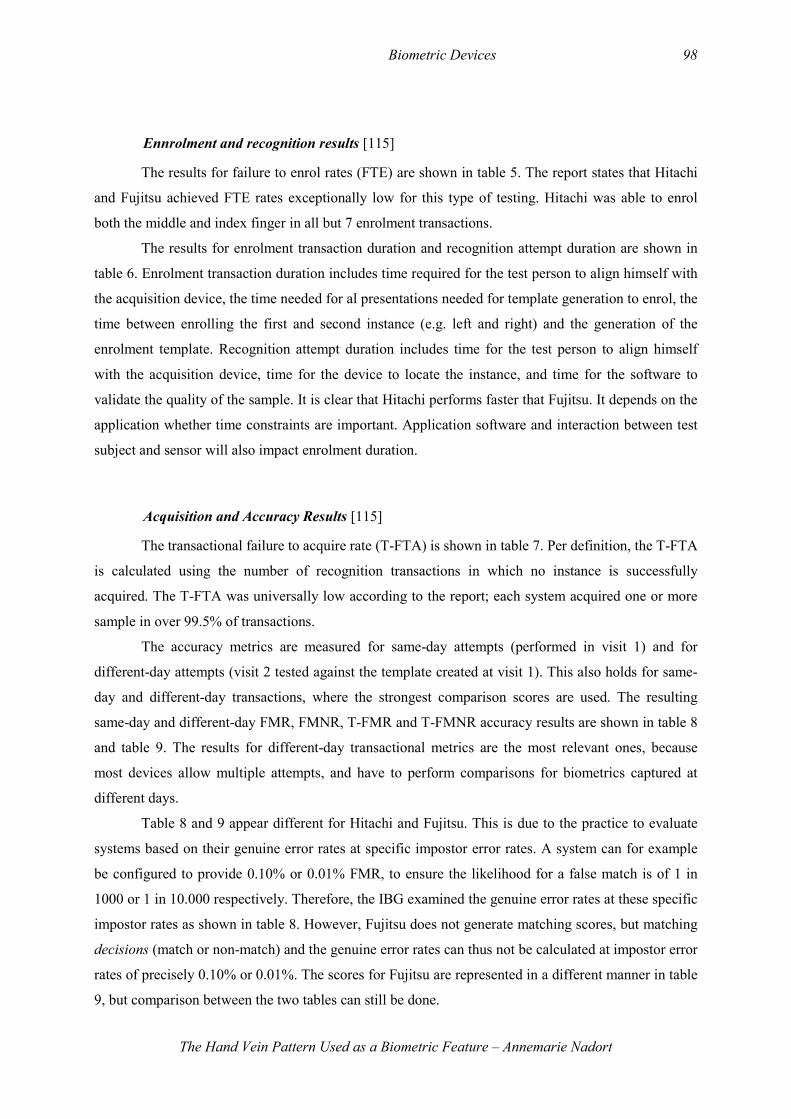
Biometric Devices 98
The Hand Vein Pattern Used as a Biometric Feature – Annemarie Nadort
Ennrolment and recognition results [115]
The results for failure to enrol rates (FTE) are shown in table 5. The report states that Hitachi
and Fujitsu achieved FTE rates exceptionally low for this type of testing. Hitachi was able to enrol
both the middle and index finger in all but 7 enrolment transactions.
The results for enrolment transaction duration and recognition attempt duration are shown in
table 6. Enrolment transaction duration includes time required for the test person to align himself with
the acquisition device, the time needed for al presentations needed for template generation to enrol, the
time between enrolling the first and second instance (e.g. left and right) and the generation of the
enrolment template. Recognition attempt duration includes time for the test person to align himself
with the acquisition device, time for the device to locate the instance, and time for the software to
validate the quality of the sample. It is clear that Hitachi performs faster that Fujitsu. It depends on the
application whether time constraints are important. Application software and interaction between test
subject and sensor will also impact enrolment duration.
Acquisition and Accuracy Results [115]
The transactional failure to acquire rate (T-FTA) is shown in table 7. Per definition, the T-FTA
is calculated using the number of recognition transactions in which no instance is successfully
acquired. The T-FTA was universally low according to the report; each system acquired one or more
sample in over 99.5% of transactions.
The accuracy metrics are measured for same-day attempts (performed in visit 1) and for
different-day attempts (visit 2 tested against the template created at visit 1). This also holds for same-
day and different-day transactions, where the strongest comparison scores are used. The resulting
same-day and different-day FMR, FMNR, T-FMR and T-FMNR accuracy results are shown in table 8
and table 9. The results for different-day transactional metrics are the most relevant ones, because
most devices allow multiple attempts, and have to perform comparisons for biometrics captured at
different days.
Table 8 and 9 appear different for Hitachi and Fujitsu. This is due to the practice to evaluate
systems based on their genuine error rates at specific impostor error rates. A system can for example
be configured to provide 0.10% or 0.01% FMR, to ensure the likelihood for a false match is of 1 in
1000 or 1 in 10.000 respectively. Therefore, the IBG examined the genuine error rates at these specific
impostor rates as shown in table 8. However, Fujitsu does not generate matching scores, but matching
decisions (match or non-match) and the genuine error rates can thus not be calculated at impostor error
rates of precisely 0.10% or 0.01%. The scores for Fujitsu are represented in a different manner in table
9, but comparison between the two tables can still be done.
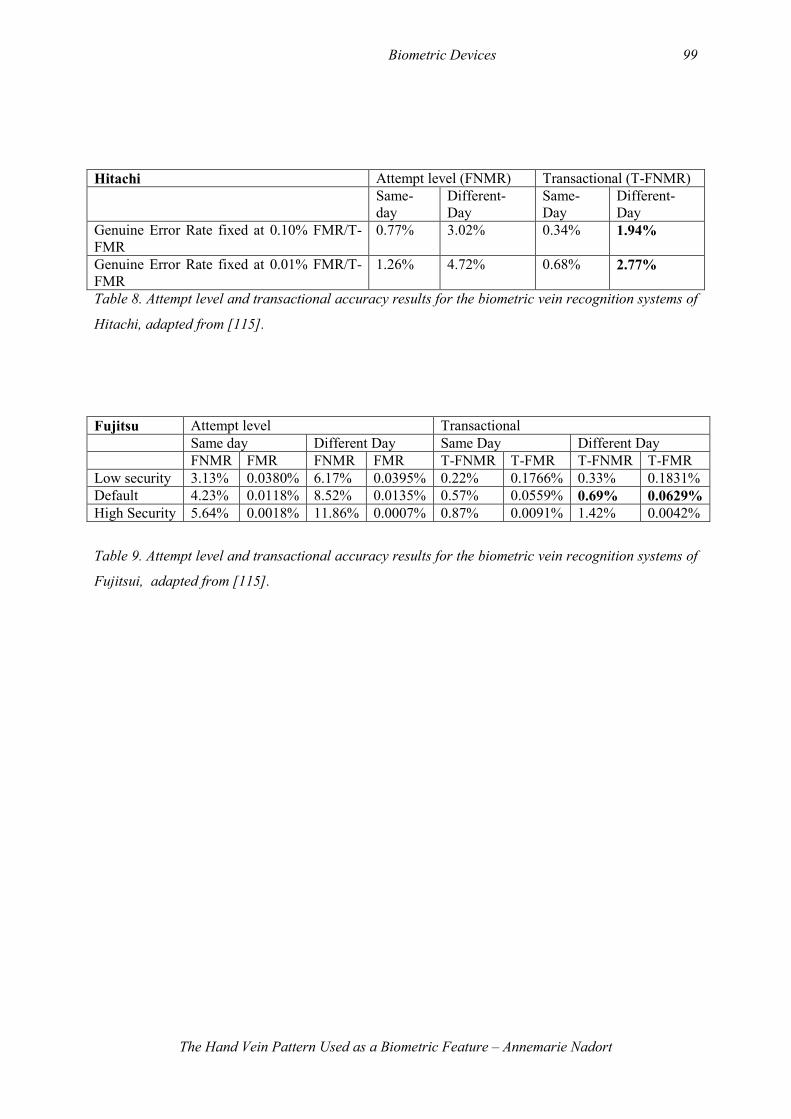
Biometric Devices 99
The Hand Vein Pattern Used as a Biometric Feature – Annemarie Nadort
Hitachi Attempt level (FNMR) Transactional (T-FNMR) Same-
day Different-Day
Same-Day
Different-Day
Genuine Error Rate fixed at 0.10% FMR/T-FMR
0.77% 3.02% 0.34% 1.94%
Genuine Error Rate fixed at 0.01% FMR/T-FMR
1.26% 4.72% 0.68% 2.77%
Table 8. Attempt level and transactional accuracy results for the biometric vein recognition systems of
Hitachi, adapted from [115].
Fujitsu Attempt level Transactional Same day Different Day Same Day Different Day FNMR FMR FNMR FMR T-FNMR T-FMR T-FNMR T-FMR Low security 3.13% 0.0380% 6.17% 0.0395% 0.22% 0.1766% 0.33% 0.1831% Default 4.23% 0.0118% 8.52% 0.0135% 0.57% 0.0559% 0.69% 0.0629%
High Security 5.64% 0.0018% 11.86% 0.0007% 0.87% 0.0091% 1.42% 0.0042%
Table 9. Attempt level and transactional accuracy results for the biometric vein recognition systems of
Fujitsui, adapted from [115].
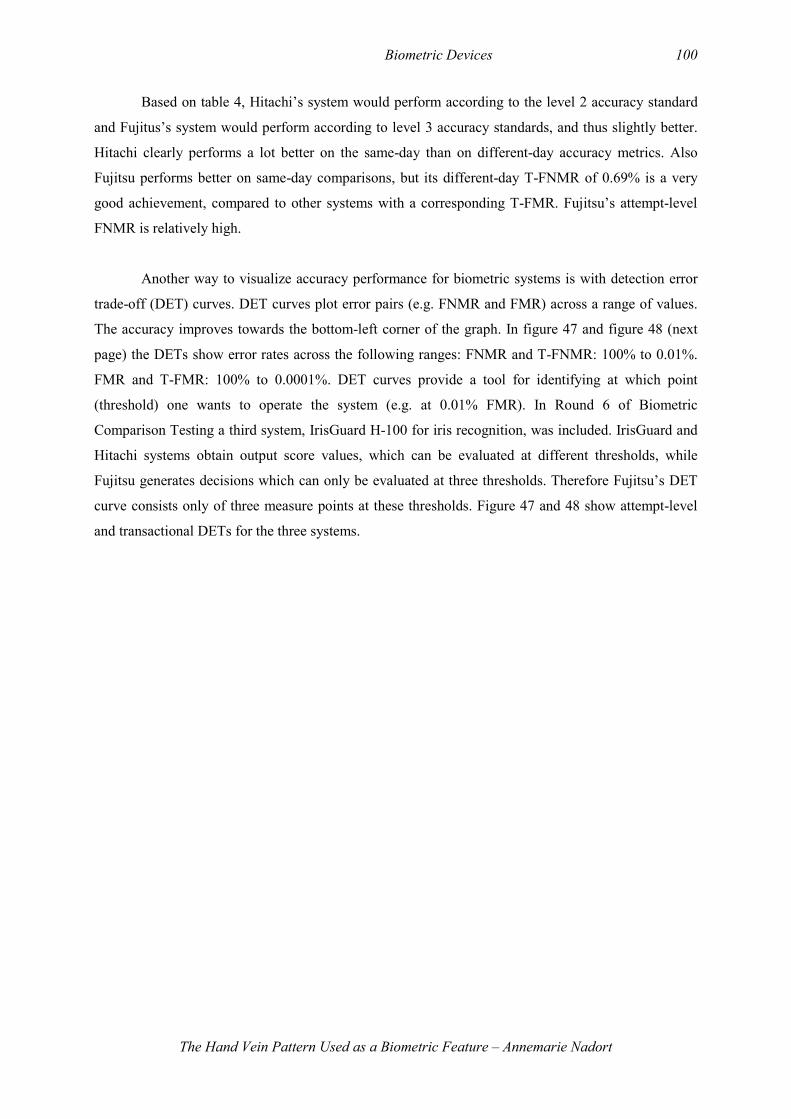
Biometric Devices 100
The Hand Vein Pattern Used as a Biometric Feature – Annemarie Nadort
Based on table 4, Hitachi’s system would perform according to the level 2 accuracy standard
and Fujitus’s system would perform according to level 3 accuracy standards, and thus slightly better.
Hitachi clearly performs a lot better on the same-day than on different-day accuracy metrics. Also
Fujitsu performs better on same-day comparisons, but its different-day T-FNMR of 0.69% is a very
good achievement, compared to other systems with a corresponding T-FMR. Fujitsu’s attempt-level
FNMR is relatively high.
Another way to visualize accuracy performance for biometric systems is with detection error
trade-off (DET) curves. DET curves plot error pairs (e.g. FNMR and FMR) across a range of values.
The accuracy improves towards the bottom-left corner of the graph. In figure 47 and figure 48 (next
page) the DETs show error rates across the following ranges: FNMR and T-FNMR: 100% to 0.01%.
FMR and T-FMR: 100% to 0.0001%. DET curves provide a tool for identifying at which point
(threshold) one wants to operate the system (e.g. at 0.01% FMR). In Round 6 of Biometric
Comparison Testing a third system, IrisGuard H-100 for iris recognition, was included. IrisGuard and
Hitachi systems obtain output score values, which can be evaluated at different thresholds, while
Fujitsu generates decisions which can only be evaluated at three thresholds. Therefore Fujitsu’s DET
curve consists only of three measure points at these thresholds. Figure 47 and 48 show attempt-level
and transactional DETs for the three systems.
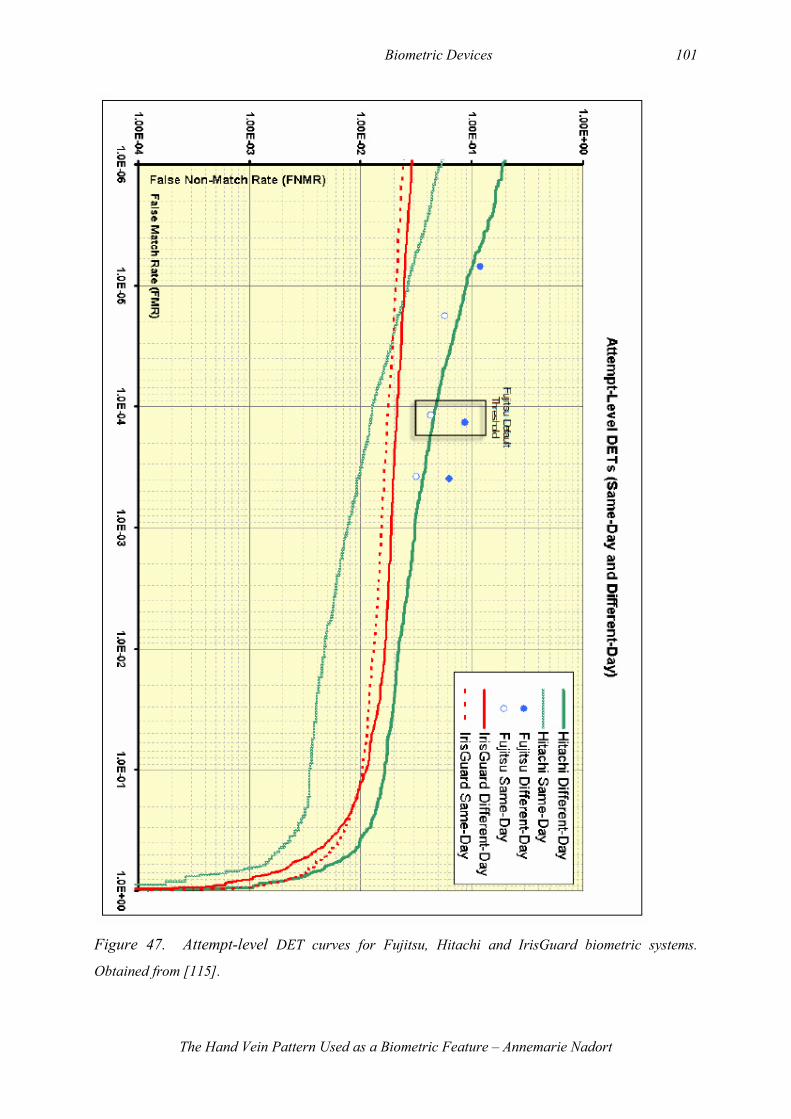
Biometric Devices 101
The Hand Vein Pattern Used as a Biometric Feature – Annemarie Nadort
Figure 47. Attempt-level DET curves for Fujitsu, Hitachi and IrisGuard biometric systems.
Obtained from [115].
Biometric Devices 102
The Hand Vein Pattern Used as a Biometric Feature – Annemarie Nadort
Figure 48. Transactional DET curves for Fujitsu, Hitachi and IrisGuard biometric systems.
Obtained from [115].
Biometric Devices 103
The Hand Vein Pattern Used as a Biometric Feature – Annemarie Nadort
The overall result of to IBG’s Public Report is that all three systems ‘can be considered very
high-performing systems for the types of applications that CBT (Comparative Biometric Tests)
models.’ They were surprised by the low failure to enrol and acquire rates generated by particularly
the vascular recognition systems, even at the attempt-level. Also the short durations of the systems
processes, especially of Hitachi, were marked as very positive for usability.
‘In sum, vascular recognition appears to be a very serious competitor to fingerprint, hand geometry,
and certain iris recognition systems used in large-scale 1:1 access control, logical access and customer
ID applications. The systems provided a strong combination of usability and accuracy.’
Performance challenging
The Comparative Biometric Testing, Round 6 [115] was the first independent comparison
study done for vascular recognition systems. The positive result is a nice accomplishment for these
two systems. However, some remarks should be made to put the results into perspective. As has been
shown by Wang and Leedham [1], vascular images captured in an office environment obtain high
quality compared to images captured in less constant environmental settings, such as an outdoor
(tropical) environment. All performance studies so far, have been conducted in office or laboratory
environments, including the IBG Test Report. In real life situations it is likely that people will use the
systems outside, or coming from outside environments indoors. Performance test in such variable
conditions should also be performed, to investigate the usability and accuracy of vascular recognitions
systems.
Another remark is that all match attempts have been made with real, biological, living hands
of people with goodwill who did not try to challenge the system. The question is how the systems are
equipped to distinct between real and fake hands, and protect themselves against attacks from real
impostors. In Chapter 4 on Liveness Detection more information regarding this threat is given and
vascular recognition systems are evaluated in this respect. For now it is important to keep in mind that
the performance studies described so far, have not dealt with real impostor threats.
Biometric Devices 104
The Hand Vein Pattern Used as a Biometric Feature – Annemarie Nadort
3.3.7 Speed
Two criteria for usability performance put forward by the IBG are duration of enrolment
transaction and duration of recognition attempt duration [115]. Fast algorithms, simple processes and
good processors can therefore also influence the performance of a system. The method of Ding et al.
[112] for example, encounters speed problems in the part of threshold segmentation. Indeed the
developed algorithm looks rather cumbrous. Several studies are focused on improving the speed of the
authentication process by improving algorithms [84, 116].
One example is the development of an application specific processor (ASP) and algorithm for
vein pattern extraction, by BK systems in cooperation with the Department of Electronics Engineering
of Korea University [84]. It can replace the conventional vein-pattern-extracting algorithm that
inevitable includes a high-priced digital signal processor (DSP) used in biometric identification
systems. In the conventional algorithm floating-point operators are needed for the Gaussian low-pass
and high-pass filtering processes in a real-time process. The proposed algorithm follows the same
steps as the conventional algorithm, except that both coefficients for the Gaussian low pass filter
and the low pass filter are designed to have 7-tap CSD (canonical signed digit) codes at the
maximum. It is said that, CSD code is an effective code for designing a FIR (finite impulse response)
filter without a multiplier. The general CSD code is equal to,
∑=
−=jM
i
i
ij SW1
2 [8]
where j = 1, 2, …, 121, Si∈ {-1, 0, 1} and M is an integer. Instead of using a 3 x 3 spatial Gaussian
low pass filter repeatedly, an 11 x 11 spatial Gaussian low-pass filter is applied. Also, for the
normalization, the fast decimation method is used. A fast data processing capability is reached using
the proposed algorithm of 150 ms/person.
The accuracy and usability aspects of the vein pattern verification systems influence their
performance, from qualitative image capturing till fast verification, as has been described so far. The
next step is assessing their performance when being challenged by an impostor, as can be expected for
security systems. The next chapter deals with this.

Liveness detecion 105
The Hand Vein Pattern Used as a Biometric Feature – Annemarie Nadort
Liveness detection 106
The Hand Vein Pattern Used as a Biometric Feature – Annemarie Nadort
4 LIFENESS DETECTION
To illustrate the concept of liveness detection I would like to start with an example from [117]: At
certain places in Africa it was custom to identify people entitled to social benefits by their fingerprints.
After verification they were directly given their money. One day two young people came in, heavily
supporting an old man in between them. When they arrived at the front desk, they had to help the man
by raising his arm and pressing his finger on the ink and paper, and explained ‘he is very lazy’.
Because of the rather unnatural and uncoordinated movements of the man, the employee behind the
desk became suspicious. End of the story: the man turned out to be dead. Before this attentive
employer caught this couple red-handed, they had successfully obtained money from several other
dead claimants.
Liveness detection is the capability of a biometric system to check whether the biometric
sample presented for verification or identification is alive or not. It should also be able to check
whether the biometric feature being captured belongs to the authorized person who is present at the
time of capture. When a system fails at this point, it is said to be ‘spoofed’ by the perpetrator: he/she
can, for example, gain access to a secured system by presenting fake biometric features (fake artefacts)
that belong to an authorized person. Or, as in the example, presenting original biometric features that
belong to a dead body and are therefore non-acceptable.
There are four scenarios possible as a consequence of the susceptibility of biometric systems
to spoofing [19, 118]:
- fake artefacts may be mounted against existing enrolments in order to gain access to a
protected facility or system
- fake artefacts being used to associate the authentic owner of the biometric feature with an
unauthorized event.
- fake artefacts may enrol in the system and subsequently be shared across multiple
individuals, thereby undermining the integrity of the entire system
- the inability of the system to defend against attacks with fake artefacts gives authorized
users the possibility to repudiate transactions associated with their enrolment, and claim
that they are done by perpetrators.
Given these unwanted scenarios – especially because biometric control systems are often used in
essential processes in society; like bank and network security, border control or access to private
properties – a proper incorporation of liveness detection in biometric systems is very important.
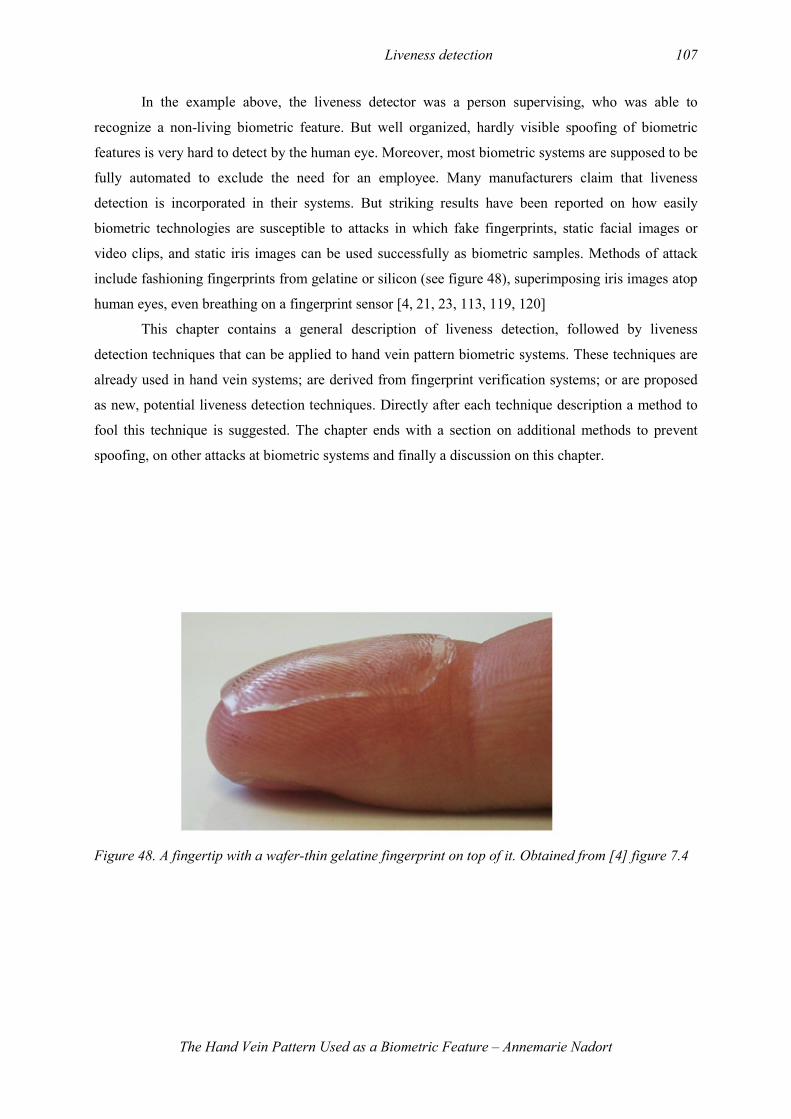
Liveness detection 107
The Hand Vein Pattern Used as a Biometric Feature – Annemarie Nadort
In the example above, the liveness detector was a person supervising, who was able to
recognize a non-living biometric feature. But well organized, hardly visible spoofing of biometric
features is very hard to detect by the human eye. Moreover, most biometric systems are supposed to be
fully automated to exclude the need for an employee. Many manufacturers claim that liveness
detection is incorporated in their systems. But striking results have been reported on how easily
biometric technologies are susceptible to attacks in which fake fingerprints, static facial images or
video clips, and static iris images can be used successfully as biometric samples. Methods of attack
include fashioning fingerprints from gelatine or silicon (see figure 48), superimposing iris images atop
human eyes, even breathing on a fingerprint sensor [4, 21, 23, 113, 119, 120]
This chapter contains a general description of liveness detection, followed by liveness
detection techniques that can be applied to hand vein pattern biometric systems. These techniques are
already used in hand vein systems; are derived from fingerprint verification systems; or are proposed
as new, potential liveness detection techniques. Directly after each technique description a method to
fool this technique is suggested. The chapter ends with a section on additional methods to prevent
spoofing, on other attacks at biometric systems and finally a discussion on this chapter.
Figure 48. A fingertip with a wafer-thin gelatine fingerprint on top of it. Obtained from [4] figure 7.4

Liveness detection 108
The Hand Vein Pattern Used as a Biometric Feature – Annemarie Nadort
4.1 Principles of liveness detection
When considering liveness detection, one should also consider the concept of non-liveness
detection. Looking at the mechanisms nowadays however, often the theory of liveness detection is
addressed: one or more qualities of a biometric sample are consistent with the qualities associated with
live biometric samples. Therefore a biometric system is designed to process data that falls within a
certain set of parameters (often with margins) and to not process data that falls beyond the margins of
these parameters. In ‘IT-language’ this decision process can be described as
if data = live, perform acquisition and extraction;
rather than
if data = not live, do not perform acquisition and extraction;
This means that the tendency towards liveness detection as opposed to non-liveness detection in
biometric systems gives individuals that want to spoof the system the simpler task of mimicking
characteristics of a live sample, than circumventing non-liveness detection methods. Although a fake
biometric sample can have a number of non-live characteristics, as long as it possesses the feature
characteristics that represent liveness, it can defeat the system. In fact, it is stated by [19] that ‘any
liveness detection method can and will be defeated’.
The check for liveness can be performed at the acquisition stage (capturing raw data) or at the
processing stage (obtaining features from raw data). All methods of liveness detection fall within three
broad categories [117]:
1. methods that look at the intrinsic properties of a living body
E.g. weight, density and elasticity, (physical properties), capacitance,
permittivity and resistance (electrical properties), colour and opacity (visual
properties), reflectance and absorbance (optical properties), and the analysis
of bodily fluids for contents such as blood constituents, oxygen or DNA.
2. methods that analyze involuntary signals generated by a living body
E.g. pulse, blood pressure, heat, thermal gradients, corpuscular blood flow
(plesythmographic) signals, skin exudation, transpiration of gases, body odor,
perspiration, electrical signals generated by the heart (ECG), brain wave
(EEG).

Liveness detection 109
The Hand Vein Pattern Used as a Biometric Feature – Annemarie Nadort
Liveness detection 110
The Hand Vein Pattern Used as a Biometric Feature – Annemarie Nadort
3. methods that measure a bodily response to a stimulus – a challenge-response method. It
can look for either voluntary (behaviorial) or involuntary (reflexive) responses.
E.g. voluntary; the user provides a logical response to a prompt generated
by the system. The stimulus can be tactile, visual or auditory in nature.
(“touch A if the plate is hot, touch B when the plate is cold”, or tasks like
smiling or blinking)
Involuntary; user’s body automatically provides the response with a
physiological change or reaction to a stimulus (electrical response for muscles,
pupil reflex, knee reflex)
Lifeness detection is generally implemented in the system in one of the following three ways: it can
capture signs of life from liveness information inherent to the biometric feature; from additional
processing of data already captured by the biometric reader; and third from the acquisition of life signs
by using additional hardware [22].
Additional hardware has got the disadvantage that it is bulky, expensive and it might be easy
to spoof when it is possible to present the fake artefact to the identification hardware, while another
living biometric sample is presented to the liveness detector. Successful liveness detection can already
happen when a fake biometric sample is mounted on a living person. Examples of life signs captured
by additional hardware are blood pressure, oxygen content or challenge-response actions.
The second approach - an algorithm for liveness detection to process data that is already
captured by the biometric device - does not have these disadvantages, but it can be difficult to
accomplish liveness detection without obtaining more data with additional hardware. One example in
the fingerprint field is measuring perspiration over time as both a life sign and a way to image the
unique ridges and valleys of a fingerprint [121]. The limitation is that the liveness detector should be
effective in both dry and sweaty environments, and this wide range of the parameter ‘perspiration’
makes it easy to be included using an artificial fingerprint.
Biometric features that inherently contain liveness information are for example keystroke
patterns [122], gait [123], ECG [124] body odor and facial thermograms [22]. These systems require a
living person in order to measure the biometric feature and are therefore least susceptible to spoofing.
These biometric technologies are not yet as developed as other biometric modalities (fingerprint, iris
recognition). Some regard hand vein biometrics as belonging to this category as well [22], but this is
not in agreement with practical results of the method. This is explained in the next section where more
information is provided on liveness detection with regard to vein pattern recognition systems.
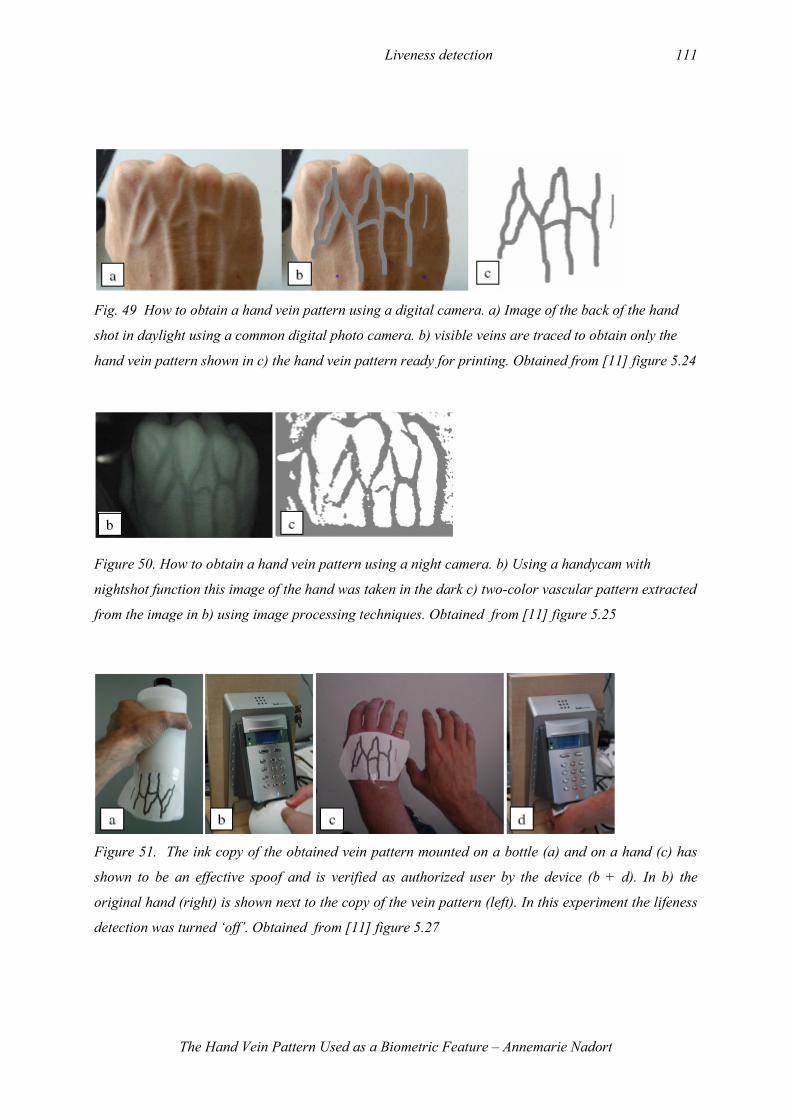
Liveness detection 111
The Hand Vein Pattern Used as a Biometric Feature – Annemarie Nadort
Fig. 49 How to obtain a hand vein pattern using a digital camera. a) Image of the back of the hand
shot in daylight using a common digital photo camera. b) visible veins are traced to obtain only the
hand vein pattern shown in c) the hand vein pattern ready for printing. Obtained from [11] figure 5.24
Figure 50. How to obtain a hand vein pattern using a night camera. b) Using a handycam with
nightshot function this image of the hand was taken in the dark c) two-color vascular pattern extracted
from the image in b) using image processing techniques. Obtained from [11] figure 5.25
Figure 51. The ink copy of the obtained vein pattern mounted on a bottle (a) and on a hand (c) has
shown to be an effective spoof and is verified as authorized user by the device (b + d). In b) the
original hand (right) is shown next to the copy of the vein pattern (left). In this experiment the lifeness
detection was turned ‘off’. Obtained from [11] figure 5.27
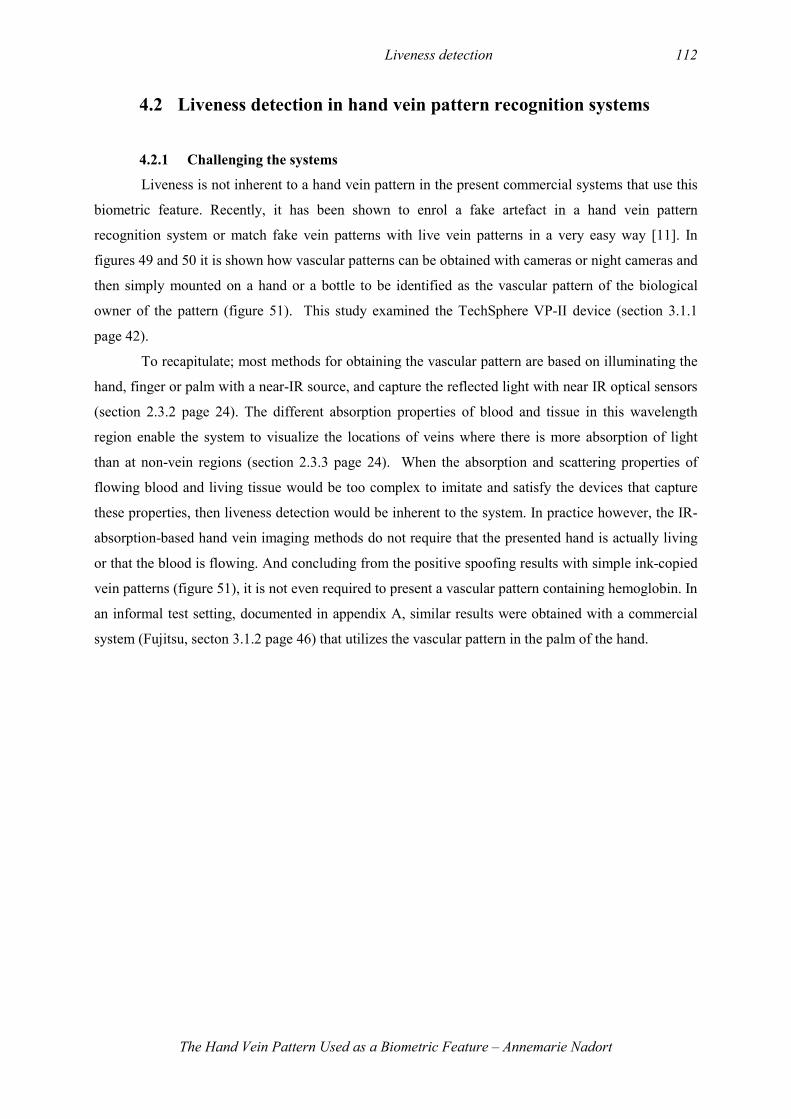
Liveness detection 112
The Hand Vein Pattern Used as a Biometric Feature – Annemarie Nadort
4.2 Liveness detection in hand vein pattern recognition systems
4.2.1 Challenging the systems
Liveness is not inherent to a hand vein pattern in the present commercial systems that use this
biometric feature. Recently, it has been shown to enrol a fake artefact in a hand vein pattern
recognition system or match fake vein patterns with live vein patterns in a very easy way [11]. In
figures 49 and 50 it is shown how vascular patterns can be obtained with cameras or night cameras and
then simply mounted on a hand or a bottle to be identified as the vascular pattern of the biological
owner of the pattern (figure 51). This study examined the TechSphere VP-II device (section 3.1.1
page 42).
To recapitulate; most methods for obtaining the vascular pattern are based on illuminating the
hand, finger or palm with a near-IR source, and capture the reflected light with near IR optical sensors
(section 2.3.2 page 24). The different absorption properties of blood and tissue in this wavelength
region enable the system to visualize the locations of veins where there is more absorption of light
than at non-vein regions (section 2.3.3 page 24). When the absorption and scattering properties of
flowing blood and living tissue would be too complex to imitate and satisfy the devices that capture
these properties, then liveness detection would be inherent to the system. In practice however, the IR-
absorption-based hand vein imaging methods do not require that the presented hand is actually living
or that the blood is flowing. And concluding from the positive spoofing results with simple ink-copied
vein patterns (figure 51), it is not even required to present a vascular pattern containing hemoglobin. In
an informal test setting, documented in appendix A, similar results were obtained with a commercial
system (Fujitsu, secton 3.1.2 page 46) that utilizes the vascular pattern in the palm of the hand.
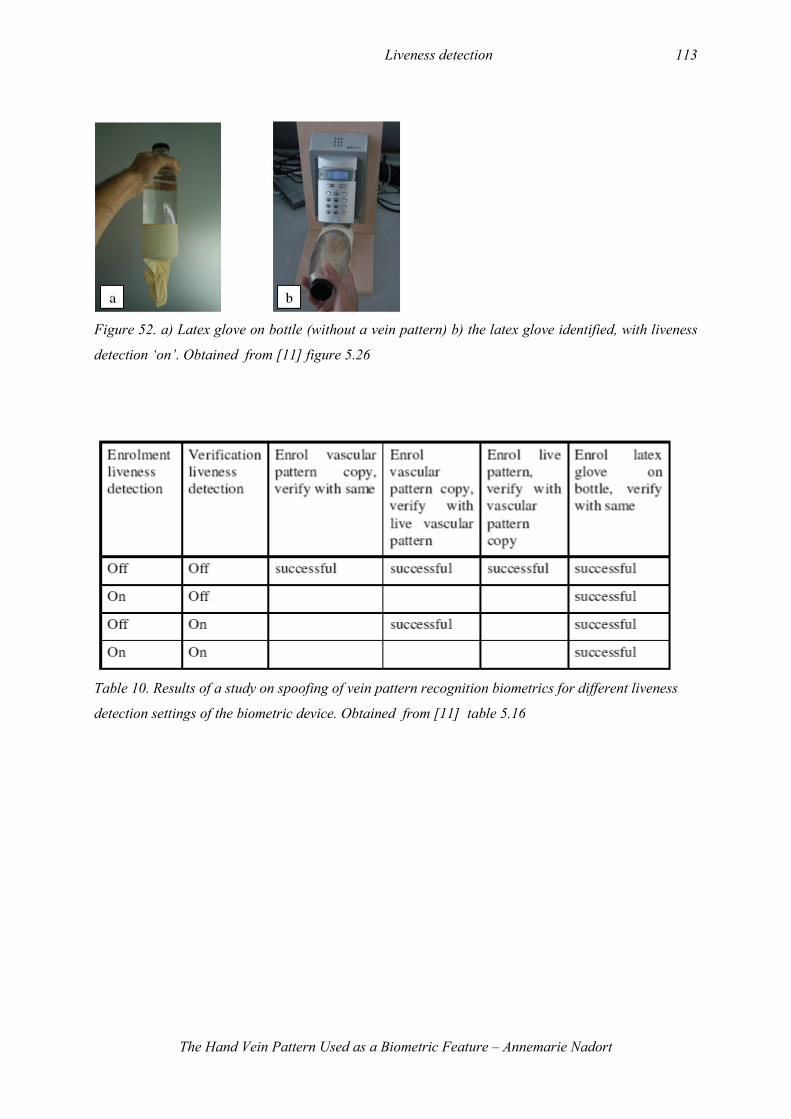
Liveness detection 113
The Hand Vein Pattern Used as a Biometric Feature – Annemarie Nadort
Figure 52. a) Latex glove on bottle (without a vein pattern) b) the latex glove identified, with liveness
detection ‘on’. Obtained from [11] figure 5.26
Table 10. Results of a study on spoofing of vein pattern recognition biometrics for different liveness
detection settings of the biometric device. Obtained from [11] table 5.16
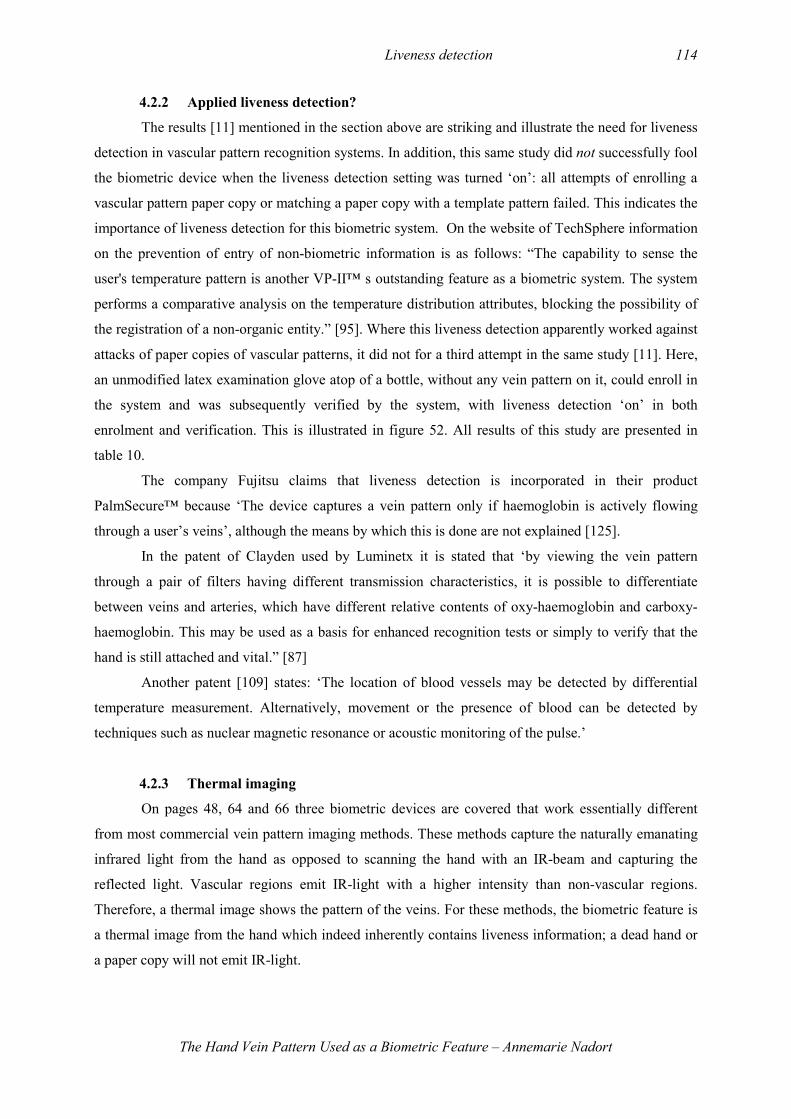
Liveness detection 114
The Hand Vein Pattern Used as a Biometric Feature – Annemarie Nadort
4.2.2 Applied liveness detection?
The results [11] mentioned in the section above are striking and illustrate the need for liveness
detection in vascular pattern recognition systems. In addition, this same study did not successfully fool
the biometric device when the liveness detection setting was turned ‘on’: all attempts of enrolling a
vascular pattern paper copy or matching a paper copy with a template pattern failed. This indicates the
importance of liveness detection for this biometric system. On the website of TechSphere information
on the prevention of entry of non-biometric information is as follows: “The capability to sense the
user's temperature pattern is another VP-II™ s outstanding feature as a biometric system. The system
performs a comparative analysis on the temperature distribution attributes, blocking the possibility of
the registration of a non-organic entity.” [95]. Where this liveness detection apparently worked against
attacks of paper copies of vascular patterns, it did not for a third attempt in the same study [11]. Here,
an unmodified latex examination glove atop of a bottle, without any vein pattern on it, could enroll in
the system and was subsequently verified by the system, with liveness detection ‘on’ in both
enrolment and verification. This is illustrated in figure 52. All results of this study are presented in
table 10.
The company Fujitsu claims that liveness detection is incorporated in their product
PalmSecure™ because ‘The device captures a vein pattern only if haemoglobin is actively flowing
through a user’s veins’, although the means by which this is done are not explained [125].
In the patent of Clayden used by Luminetx it is stated that ‘by viewing the vein pattern
through a pair of filters having different transmission characteristics, it is possible to differentiate
between veins and arteries, which have different relative contents of oxy-haemoglobin and carboxy-
haemoglobin. This may be used as a basis for enhanced recognition tests or simply to verify that the
hand is still attached and vital.” [87]
Another patent [109] states: ‘The location of blood vessels may be detected by differential
temperature measurement. Alternatively, movement or the presence of blood can be detected by
techniques such as nuclear magnetic resonance or acoustic monitoring of the pulse.’
4.2.3 Thermal imaging
On pages 48, 64 and 66 three biometric devices are covered that work essentially different
from most commercial vein pattern imaging methods. These methods capture the naturally emanating
infrared light from the hand as opposed to scanning the hand with an IR-beam and capturing the
reflected light. Vascular regions emit IR-light with a higher intensity than non-vascular regions.
Therefore, a thermal image shows the pattern of the veins. For these methods, the biometric feature is
a thermal image from the hand which indeed inherently contains liveness information; a dead hand or
a paper copy will not emit IR-light.
Liveness detection 115
The Hand Vein Pattern Used as a Biometric Feature – Annemarie Nadort
4.2.4 Methods for liveness detection
In the hand vein pattern biometric systems this passive thermal imaging is not common used.
Most companies make use of the active scanning technique, where additional liveness detection
should be an essential part of the system to improve reliability. Some companies (TechSphere, Fujitsu,
Luminetx) claim that they incorporate liveness detection. Information on their liveness detectors
however is minimal. And abnormal enrolments, as shown with the white glove experiment [11], are
yet to be explained if TechSphere actually uses a temperature liveness detector.
Therefore, in the next sections several methods for liveness detection will be presented. They
are subdivided into the three categories based on: intrinsic properties, involuntary signals and bodily
responses [22]. Applicable methods for vein pattern biometrics which have been studied for
fingerprint or other biometric technologies will be discussed in addition to the methods already used in
hand vein pattern recognition and several proposed methods from the medical field. These can be
applicable to hand vein pattern recognition systems as well.
Liveness detection 116
The Hand Vein Pattern Used as a Biometric Feature – Annemarie Nadort
4.3 Intrinsic Properties
Living human bodies exhibit intrinsic properties (parameters) that can be measured by liveness
detectors. A positive measurement result indicates that the parameter under investigation corresponds
to the range of this parameter found for a living body. The main problem is that for some parameters
other materials also exhibit these ‘liveness cues’. The intrinsic properties can be measured inherent to
the biometric feature, by adding software and by using additional hardware.
4.3.1 Liveness inherent to biometric feature
a) Spectrographic signature (near infrared region)
Living tissue under infrared illumination has a characteristic spectral signature, due to the
different absorption properties of the components of living tissue (section 2.3.3 page 24). As a means
for liveness detection in iris scans it is suggested to compare the fractions of light reflected in 650nm –
1100nm bands (tissue optical window) to reveal these characteristics and verify the liveness of the
presented eye [126, 127].
Of course, this suggestion for liveness detection in iris scans is the basis of the biometric
detection in the vein pattern imaging biometric technique. This means that the spectrographic
signature of the hand used for imaging of the veins is also a liveness detector and thus inherent to the
biometric sample. Then of course, the question remains, why is this not the case in practice? As shown
before, without additional liveness detection the hand vein biometric systems can easily be fooled.
This possible liveness detection method in iris scanning is only mentioned in [126, 127],
without providing information about the exact method, which makes it difficult to answer the question.
Most probably the vein imaging biometric methods are not selective enough to capture specific
wavelength dependent spectral properties of tissue, fat, blood and pigment. Commercial available
LEDs used for biometrics according to [128] are for vein imaging: 780 nm and 870 nm LEDs; for iris
imaging 810 nm and for finger imaging 660 nm. Their half width is approximately 35 nm. Hitachi [80]
makes use of 810 nm light and in [54] 880 nm is reported. Most filters to prevent visible light entering
the CCD imaging apparatus are commercially off-the-shelf longpass filters.
So what happens is that a spectrally broad scanning beam of NIR light illuminates the hand.
This light will be partially absorbed, scattered or reflected depending on the underlying material. The
(diffuse) reflected light is captured by the CCD, whereby the shorter wavelengths will be reduced by
the filter, but most filters allow wavelengths down to 650 nm to pass. In this wavelength region,
(deoxy) haemoglobin is one of the main absorbing proteins when imaging a hand. But when imaging
an ink pattern in this wavelength region, the ink will also be the main
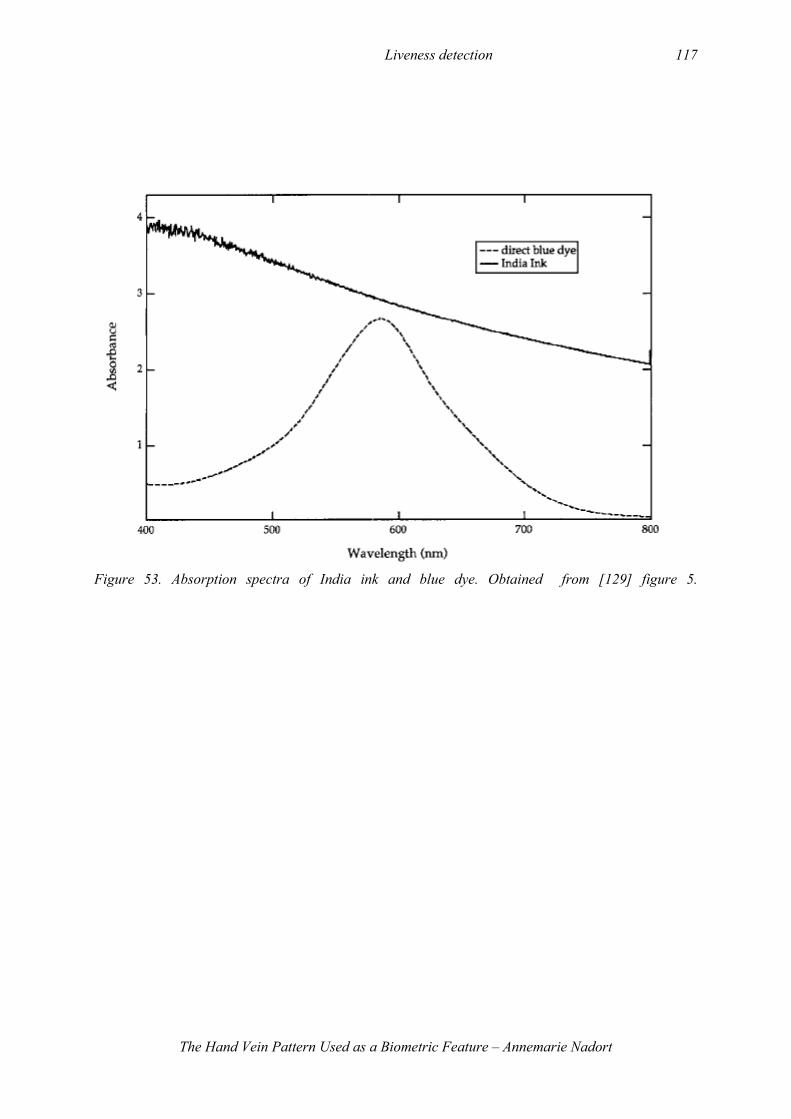
Liveness detection 117
The Hand Vein Pattern Used as a Biometric Feature – Annemarie Nadort
Figure 53. Absorption spectra of India ink and blue dye. Obtained from [129] figure 5.
Liveness detection 118
The Hand Vein Pattern Used as a Biometric Feature – Annemarie Nadort
absorbing component compared to e.g. white paper. This can be seen in figure 53: India ink absorbs
everywhere in this spectrum and a blue dye absorbs up to 800 nm. Herein lays the essence of the
problem: other materials than veins share similar absorption and scattering properties in this
wavelength area.
When looking at the absorption spectra of the main components of blood (fig. 10), they are of
course different and more complex than the spectrum shown in figure 53. But because of the non-
selective illumination and detection of NIR light by the devices, this doesn’t matter for obtaining an
image. Therefore, these devices can be spoofed by a vein pattern produced by ink on paper.
A solution to this problem might be to make use of several selective band pass filters and light
sources at different wavelength and to calculate the absorption ratio for these different wavelengths to
make better use of the specific absorption properties of (deoxy) haemoglobin along the NIR spectrum.
Arteries (HbO2) will for example absorb more at 900 nm compared to 700 nm, while veins (Hb) have
opposite absorption properties. A similar approach has been proposed in the patent of Clayden,
utilized by Lumintex [87]. Disadvantages are the costs of these expensive filters and the fact that the
hand should be kept very still while several images are made using each filter.
4.3.2 Using extra hardware
a) Comparative Analysis
Comparing several images taken at different wavelengths of the same hand vein pattern, as
described in the last paragraph of the former section, should be categorized as using extra hardware:
adding filters and/or light sources, including additional algorithms to obtain the liveness
characteristics. These characteristics are the specific absorption properties of (de)oxyhaemoglobin at
certain wavelengths, which are harder to imitate with fraudulent materials. Main disadvantages are the
costs and the practical implementation of this method.
a) Electric resistance
Electric resistance is a measure of the degree to which an object opposes the passage of an
electric current [5]. This can also be done for the skin; by passing a weak current through the skin and
measuring the electricity flow. In galvanometers, for example, this is measured over time as a function
of emotion: electric resistance depends on the humidity of the skin which increases during sweating.
Some people have a dry skin, while others produce a considerable amount of sweat. To get an
acceptable FRR, the acceptance range in electric resistance is wide. Therefore, it is easy to spoof this
method. The method is used so far in fingerprint biometrics, and spoofed by simply putting some
saliva on a silicon fingerprint [21]. In addition, this liveness detection method requires contact with

Liveness detection 119
The Hand Vein Pattern Used as a Biometric Feature – Annemarie Nadort
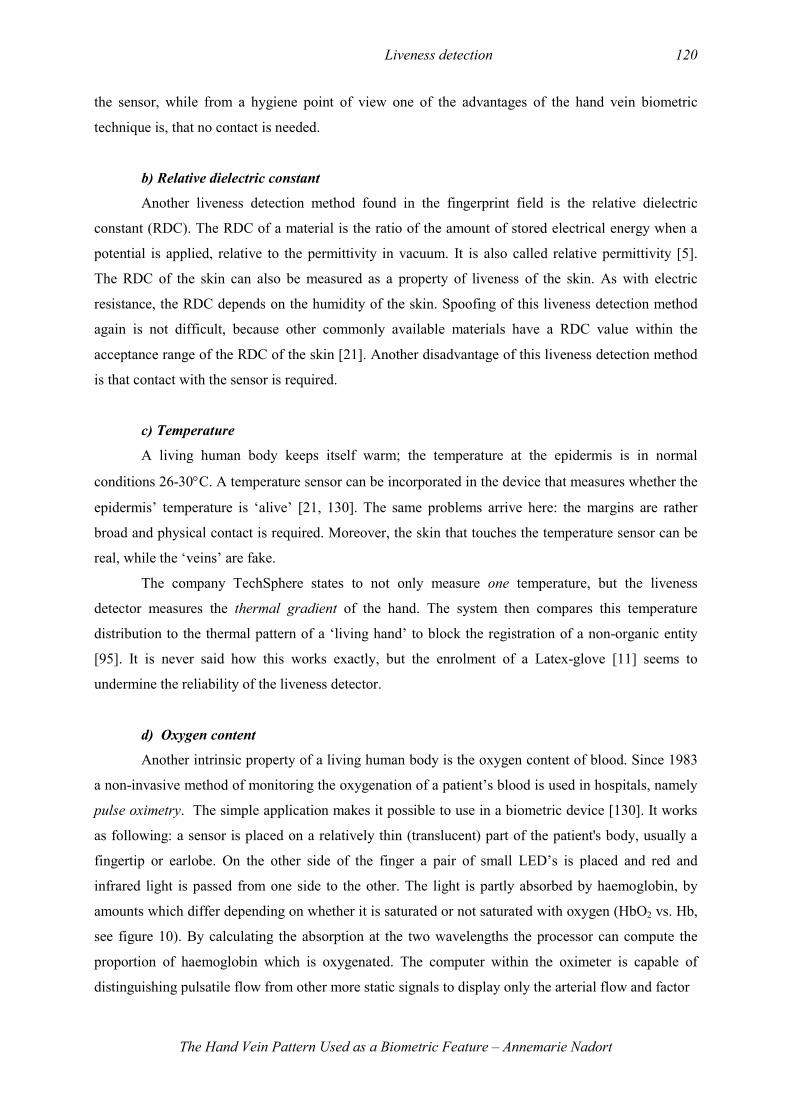
Liveness detection 120
The Hand Vein Pattern Used as a Biometric Feature – Annemarie Nadort
the sensor, while from a hygiene point of view one of the advantages of the hand vein biometric
technique is, that no contact is needed.
b) Relative dielectric constant
Another liveness detection method found in the fingerprint field is the relative dielectric
constant (RDC). The RDC of a material is the ratio of the amount of stored electrical energy when a
potential is applied, relative to the permittivity in vacuum. It is also called relative permittivity [5].
The RDC of the skin can also be measured as a property of liveness of the skin. As with electric
resistance, the RDC depends on the humidity of the skin. Spoofing of this liveness detection method
again is not difficult, because other commonly available materials have a RDC value within the
acceptance range of the RDC of the skin [21]. Another disadvantage of this liveness detection method
is that contact with the sensor is required.
c) Temperature
A living human body keeps itself warm; the temperature at the epidermis is in normal
conditions 26-30°C. A temperature sensor can be incorporated in the device that measures whether the
epidermis’ temperature is ‘alive’ [21, 130]. The same problems arrive here: the margins are rather
broad and physical contact is required. Moreover, the skin that touches the temperature sensor can be
real, while the ‘veins’ are fake.
The company TechSphere states to not only measure one temperature, but the liveness
detector measures the thermal gradient of the hand. The system then compares this temperature
distribution to the thermal pattern of a ‘living hand’ to block the registration of a non-organic entity
[95]. It is never said how this works exactly, but the enrolment of a Latex-glove [11] seems to
undermine the reliability of the liveness detector.
d) Oxygen content
Another intrinsic property of a living human body is the oxygen content of blood. Since 1983
a non-invasive method of monitoring the oxygenation of a patient’s blood is used in hospitals, namely
pulse oximetry. The simple application makes it possible to use in a biometric device [130]. It works
as following: a sensor is placed on a relatively thin (translucent) part of the patient's body, usually a
fingertip or earlobe. On the other side of the finger a pair of small LED’s is placed and red and
infrared light is passed from one side to the other. The light is partly absorbed by haemoglobin, by
amounts which differ depending on whether it is saturated or not saturated with oxygen (HbO2 vs. Hb,
see figure 10). By calculating the absorption at the two wavelengths the processor can compute the
proportion of haemoglobin which is oxygenated. The computer within the oximeter is capable of
distinguishing pulsatile flow from other more static signals to display only the arterial flow and factor
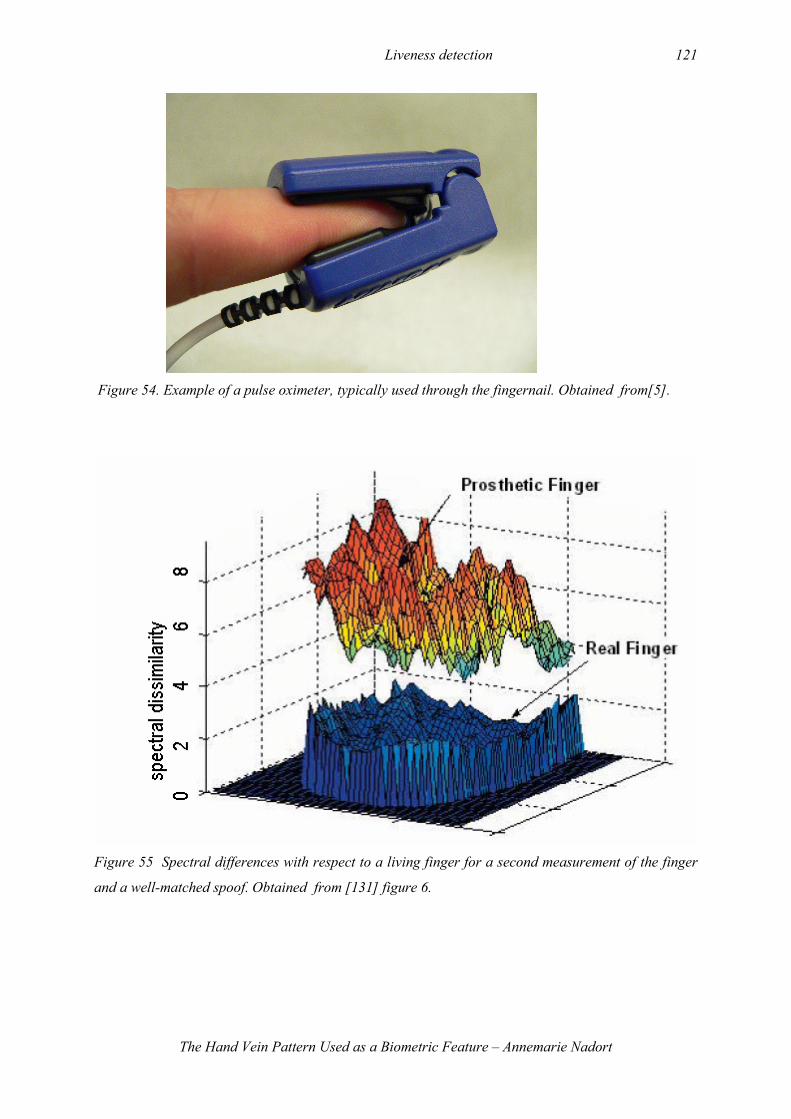
Liveness detection 121
The Hand Vein Pattern Used as a Biometric Feature – Annemarie Nadort
Figure 54. Example of a pulse oximeter, typically used through the fingernail. Obtained from[5].
Figure 55 Spectral differences with respect to a living finger for a second measurement of the finger
and a well-matched spoof. Obtained from [131] figure 6.
Liveness detection 122
The Hand Vein Pattern Used as a Biometric Feature – Annemarie Nadort
out venous blood, skin, bone, muscle, fat, and even fingernail polish. Therefore, the oximeter is
dependent on pulsatile flow and it will not function if there is none [5, 132, 133]. An example of a
medically used oximeter is shown in figure 54.
Acceptable normal ranges of percentage oxidized hemoglobin are from 95 to 100 percent.
Falsely low readings may be caused by hypo perfusion of the extremity being used for monitoring
(due to the part being cold or from vasoconstriction due to the use of vessel narrowing agents); or by
incorrect sensor application; highly calloused skin; and movement.
These last issues can be a problem in the use in biometric devices outside or with moving or
calloused hands. Advantage is that this method is dependent on both pulse and absorption, thus
actually measuring two features of liveness. A disadvantage again is that physical contact is required
and although these liveness cues are hard to simulate, it is easy to spoof the biometric detector while
the liveness detector measures the pulse and oxygen features of a living unauthorized person [22].
e) Spectrographic signature (near infrared and visual region)
The company Lumidigm, specialized in fingerprint biometric systems, makes use of a
multispectral imager to verify liveness characteristics in a fingerprint [131]. The system consists of
multiple illumination wavelengths for imaging, in addition to regular total internal reflection imaging
to obtain the fingerprint features. Two out of three anti-spoofing methods they developed which can be
applied to vein imaging will be discussed in this section, while the third falls in the category discussed
in section [response x.x].
1. Principal Component Analysis
Lumidigm has developed a small and rugged spectral sensor using solid-state optical
components operating in the visible and very NIR spectral region (400-940nm) that accurately
measures diffusely reflected skin spectra. This non-imaging spectroscopic method uses spectral
metrics determined from the enrolment sample and compares those to the same metrics calculated
from the test sample. The developed algorithm creates a model using Principal Component Analysis
(PCA) during the enrolment process. This model is compared to the test image using the Mahalanobis
distance. A threshold criterion is used to verify similarity. According to the authors the models created
from enrolment spectra, even when using the small number of wavelengths available in this system,
are effective for detecting sample materials that are not living skin, provided that the enrolment occurs
in a supervised, secure manner [131].
2. Chromatic Texture
This spoof detection method compares the power spectra from the enrolment and test images
to determine if the test image is a spoof. A power spectrum is a diagram of wavelength versus
reflected intensity. Power spectra of non-humane materials have different optical properties than
human skin, resulting in a deviation from ‘normal’ optical signal. The same holds for dismembered
tissue [118]. In figure 55 Lumidigm shows how much spectra differ between a prosthetic and a real
Liveness detection 123
The Hand Vein Pattern Used as a Biometric Feature – Annemarie Nadort
finger. The algorithm determines the frequency content (‘texture’) generated by the different colours
for each enrolled person and then compares the texture of a test image to the enrolled texture. A
reliable liveness check is the result, provided that the enrolment occurs in a supervised, secure manner
[131].
The two anti-spoofing methods both use optical properties of the skin in the infrared and
visible wavelength (red, blue and green) region as a liveness detector. Not much technical information
is provided. It is said before that infrared optical properties are not measured selective enough to be
able to detect liveness, and it is to be expected that several materials have optical properties in the
visible wavelengths which are very similar to the human skin. Though optical signature liveness
detection might be more reliable in this method because PCA and texture models are created of the
liveness characteristics of the individual and enrolment is supervised. Lumidigm proposes the use of
these two methods together as being very robust, but test results are yet statistically non-significant
[131].
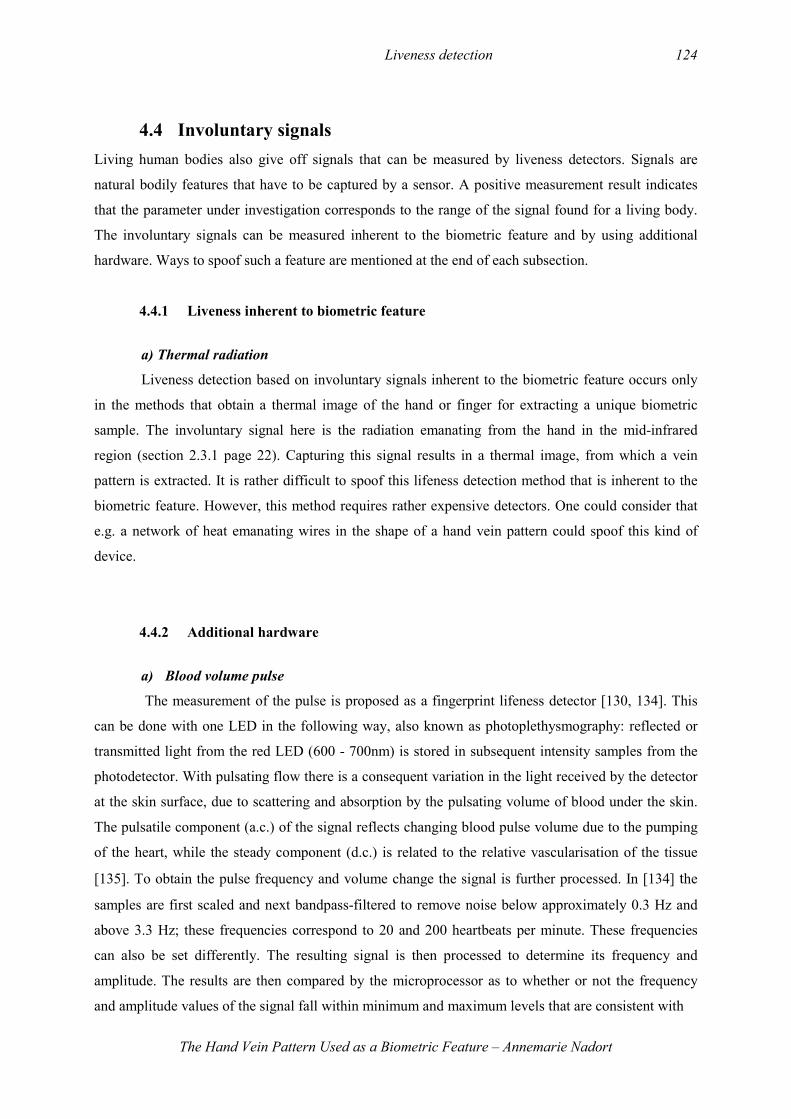
Liveness detection 124
The Hand Vein Pattern Used as a Biometric Feature – Annemarie Nadort
4.4 Involuntary signals
Living human bodies also give off signals that can be measured by liveness detectors. Signals are
natural bodily features that have to be captured by a sensor. A positive measurement result indicates
that the parameter under investigation corresponds to the range of the signal found for a living body.
The involuntary signals can be measured inherent to the biometric feature and by using additional
hardware. Ways to spoof such a feature are mentioned at the end of each subsection.
4.4.1 Liveness inherent to biometric feature
a) Thermal radiation
Liveness detection based on involuntary signals inherent to the biometric feature occurs only
in the methods that obtain a thermal image of the hand or finger for extracting a unique biometric
sample. The involuntary signal here is the radiation emanating from the hand in the mid-infrared
region (section 2.3.1 page 22). Capturing this signal results in a thermal image, from which a vein
pattern is extracted. It is rather difficult to spoof this lifeness detection method that is inherent to the
biometric feature. However, this method requires rather expensive detectors. One could consider that
e.g. a network of heat emanating wires in the shape of a hand vein pattern could spoof this kind of
device.
4.4.2 Additional hardware
a) Blood volume pulse
The measurement of the pulse is proposed as a fingerprint lifeness detector [130, 134]. This
can be done with one LED in the following way, also known as photoplethysmography: reflected or
transmitted light from the red LED (600 - 700nm) is stored in subsequent intensity samples from the
photodetector. With pulsating flow there is a consequent variation in the light received by the detector
at the skin surface, due to scattering and absorption by the pulsating volume of blood under the skin.
The pulsatile component (a.c.) of the signal reflects changing blood pulse volume due to the pumping
of the heart, while the steady component (d.c.) is related to the relative vascularisation of the tissue
[135]. To obtain the pulse frequency and volume change the signal is further processed. In [134] the
samples are first scaled and next bandpass-filtered to remove noise below approximately 0.3 Hz and
above 3.3 Hz; these frequencies correspond to 20 and 200 heartbeats per minute. These frequencies
can also be set differently. The resulting signal is then processed to determine its frequency and
amplitude. The results are then compared by the microprocessor as to whether or not the frequency
and amplitude values of the signal fall within minimum and maximum levels that are consistent with

Liveness detection 125
The Hand Vein Pattern Used as a Biometric Feature – Annemarie Nadort
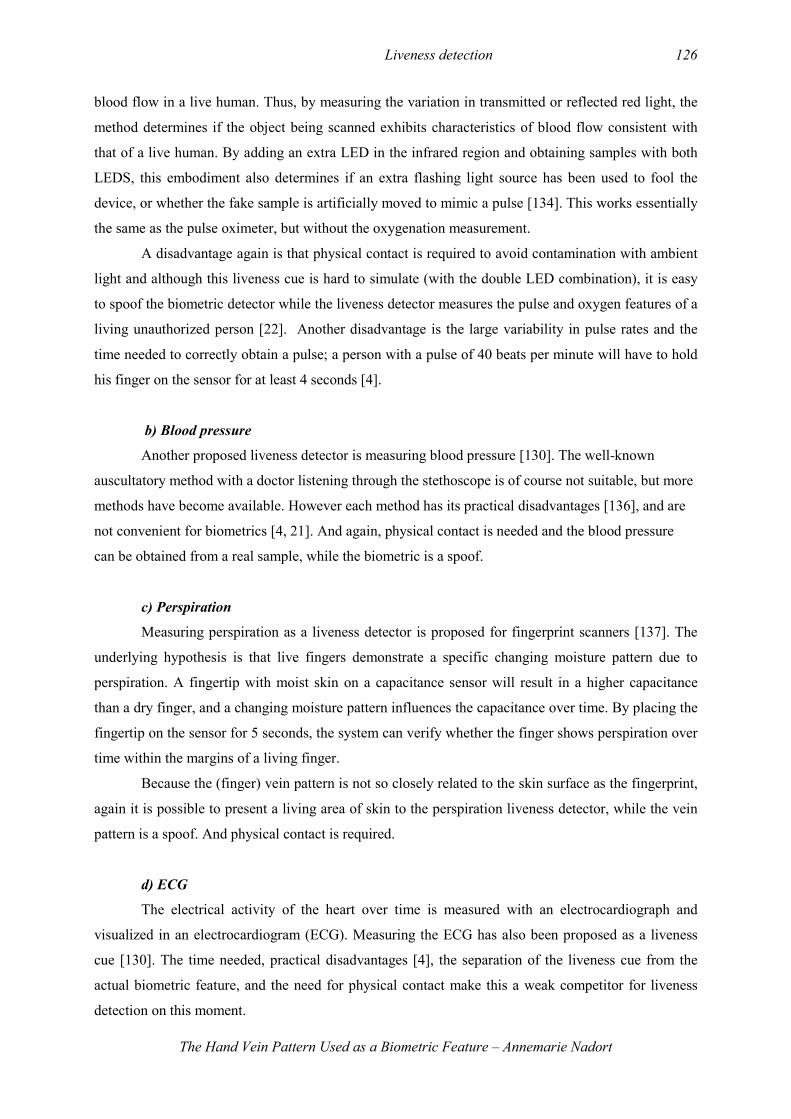
Liveness detection 126
The Hand Vein Pattern Used as a Biometric Feature – Annemarie Nadort
blood flow in a live human. Thus, by measuring the variation in transmitted or reflected red light, the
method determines if the object being scanned exhibits characteristics of blood flow consistent with
that of a live human. By adding an extra LED in the infrared region and obtaining samples with both
LEDS, this embodiment also determines if an extra flashing light source has been used to fool the
device, or whether the fake sample is artificially moved to mimic a pulse [134]. This works essentially
the same as the pulse oximeter, but without the oxygenation measurement.
A disadvantage again is that physical contact is required to avoid contamination with ambient
light and although this liveness cue is hard to simulate (with the double LED combination), it is easy
to spoof the biometric detector while the liveness detector measures the pulse and oxygen features of a
living unauthorized person [22]. Another disadvantage is the large variability in pulse rates and the
time needed to correctly obtain a pulse; a person with a pulse of 40 beats per minute will have to hold
his finger on the sensor for at least 4 seconds [4].
b) Blood pressure
Another proposed liveness detector is measuring blood pressure [130]. The well-known
auscultatory method with a doctor listening through the stethoscope is of course not suitable, but more
methods have become available. However each method has its practical disadvantages [136], and are
not convenient for biometrics [4, 21]. And again, physical contact is needed and the blood pressure
can be obtained from a real sample, while the biometric is a spoof.
c) Perspiration
Measuring perspiration as a liveness detector is proposed for fingerprint scanners [137]. The
underlying hypothesis is that live fingers demonstrate a specific changing moisture pattern due to
perspiration. A fingertip with moist skin on a capacitance sensor will result in a higher capacitance
than a dry finger, and a changing moisture pattern influences the capacitance over time. By placing the
fingertip on the sensor for 5 seconds, the system can verify whether the finger shows perspiration over
time within the margins of a living finger.
Because the (finger) vein pattern is not so closely related to the skin surface as the fingerprint,
again it is possible to present a living area of skin to the perspiration liveness detector, while the vein
pattern is a spoof. And physical contact is required.
d) ECG
The electrical activity of the heart over time is measured with an electrocardiograph and
visualized in an electrocardiogram (ECG). Measuring the ECG has also been proposed as a liveness
cue [130]. The time needed, practical disadvantages [4], the separation of the liveness cue from the
actual biometric feature, and the need for physical contact make this a weak competitor for liveness
detection on this moment.
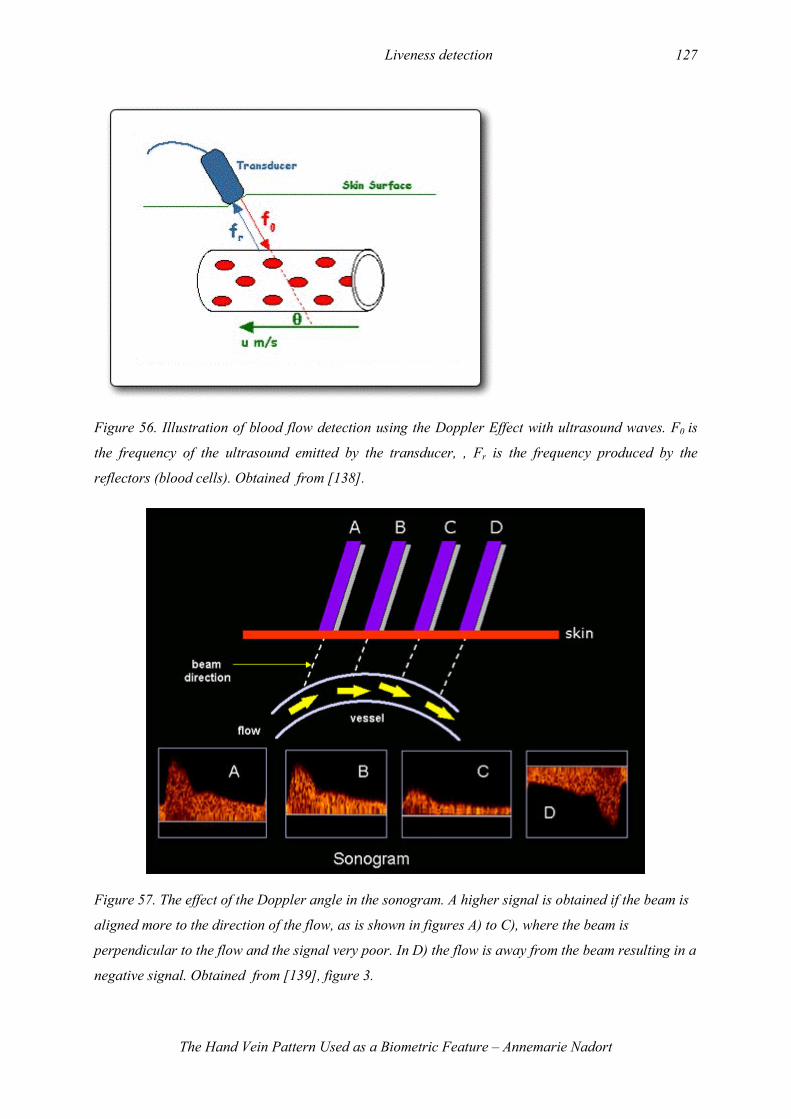
Liveness detection 127
The Hand Vein Pattern Used as a Biometric Feature – Annemarie Nadort
Figure 56. Illustration of blood flow detection using the Doppler Effect with ultrasound waves. F0 is
the frequency of the ultrasound emitted by the transducer, , Fr is the frequency produced by the
reflectors (blood cells). Obtained from [138].
Figure 57. The effect of the Doppler angle in the sonogram. A higher signal is obtained if the beam is
aligned more to the direction of the flow, as is shown in figures A) to C), where the beam is
perpendicular to the flow and the signal very poor. In D) the flow is away from the beam resulting in a
negative signal. Obtained from [139], figure 3.
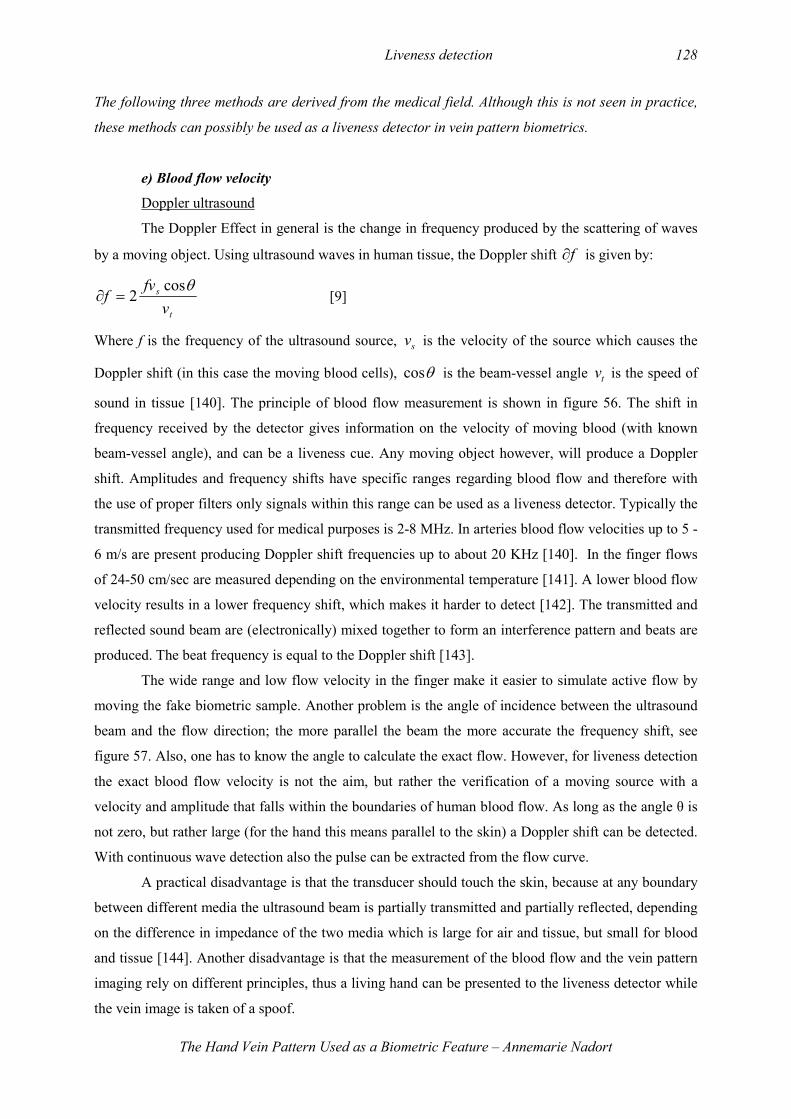
Liveness detection 128
The Hand Vein Pattern Used as a Biometric Feature – Annemarie Nadort
The following three methods are derived from the medical field. Although this is not seen in practice,
these methods can possibly be used as a liveness detector in vein pattern biometrics.
e) Blood flow velocity
Doppler ultrasound
The Doppler Effect in general is the change in frequency produced by the scattering of waves
by a moving object. Using ultrasound waves in human tissue, the Doppler shift f∂ is given by:
t
s
v
fvf
θcos2=∂ [9]
Where f is the frequency of the ultrasound source, sv is the velocity of the source which causes the
Doppler shift (in this case the moving blood cells), θcos is the beam-vessel angle tv is the speed of
sound in tissue [140]. The principle of blood flow measurement is shown in figure 56. The shift in
frequency received by the detector gives information on the velocity of moving blood (with known
beam-vessel angle), and can be a liveness cue. Any moving object however, will produce a Doppler
shift. Amplitudes and frequency shifts have specific ranges regarding blood flow and therefore with
the use of proper filters only signals within this range can be used as a liveness detector. Typically the
transmitted frequency used for medical purposes is 2-8 MHz. In arteries blood flow velocities up to 5 -
6 m/s are present producing Doppler shift frequencies up to about 20 KHz [140]. In the finger flows
of 24-50 cm/sec are measured depending on the environmental temperature [141]. A lower blood flow
velocity results in a lower frequency shift, which makes it harder to detect [142]. The transmitted and
reflected sound beam are (electronically) mixed together to form an interference pattern and beats are
produced. The beat frequency is equal to the Doppler shift [143].
The wide range and low flow velocity in the finger make it easier to simulate active flow by
moving the fake biometric sample. Another problem is the angle of incidence between the ultrasound
beam and the flow direction; the more parallel the beam the more accurate the frequency shift, see
figure 57. Also, one has to know the angle to calculate the exact flow. However, for liveness detection
the exact blood flow velocity is not the aim, but rather the verification of a moving source with a
velocity and amplitude that falls within the boundaries of human blood flow. As long as the angle θ is
not zero, but rather large (for the hand this means parallel to the skin) a Doppler shift can be detected.
With continuous wave detection also the pulse can be extracted from the flow curve.
A practical disadvantage is that the transducer should touch the skin, because at any boundary
between different media the ultrasound beam is partially transmitted and partially reflected, depending
on the difference in impedance of the two media which is large for air and tissue, but small for blood
and tissue [144]. Another disadvantage is that the measurement of the blood flow and the vein pattern
imaging rely on different principles, thus a living hand can be presented to the liveness detector while
the vein image is taken of a spoof.
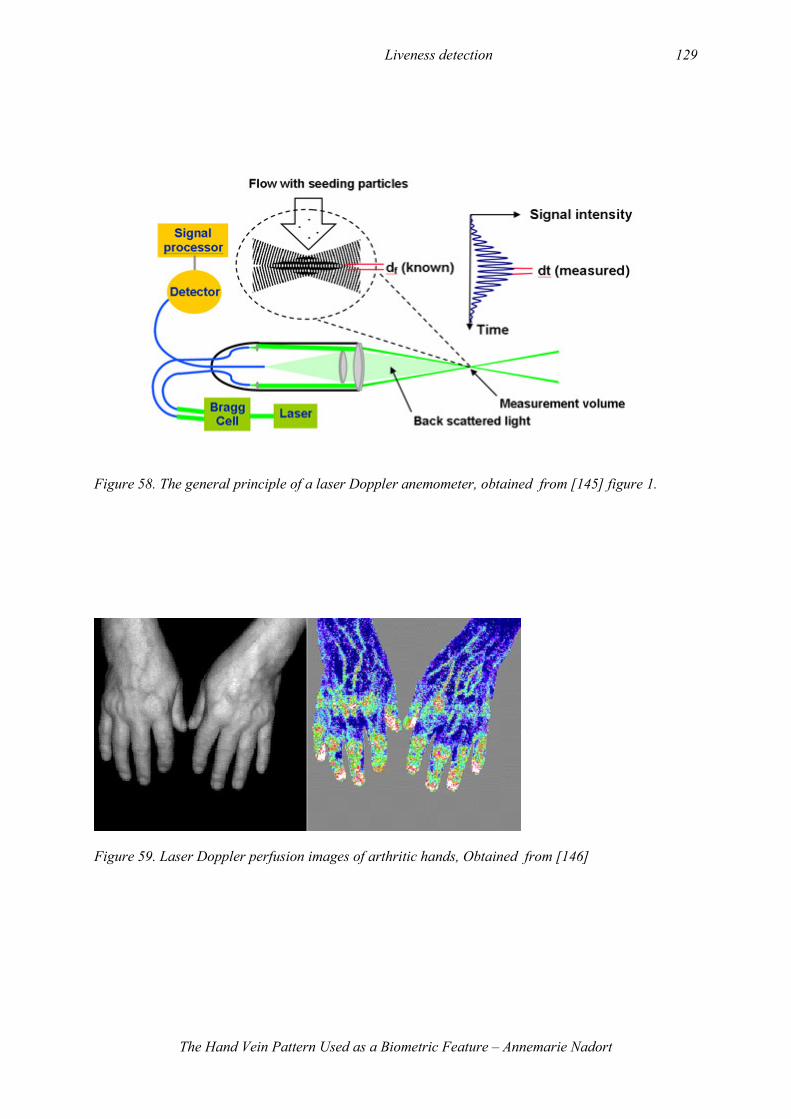
Liveness detection 129
The Hand Vein Pattern Used as a Biometric Feature – Annemarie Nadort
Figure 58. The general principle of a laser Doppler anemometer, obtained from [145] figure 1.
Figure 59. Laser Doppler perfusion images of arthritic hands, Obtained from [146]
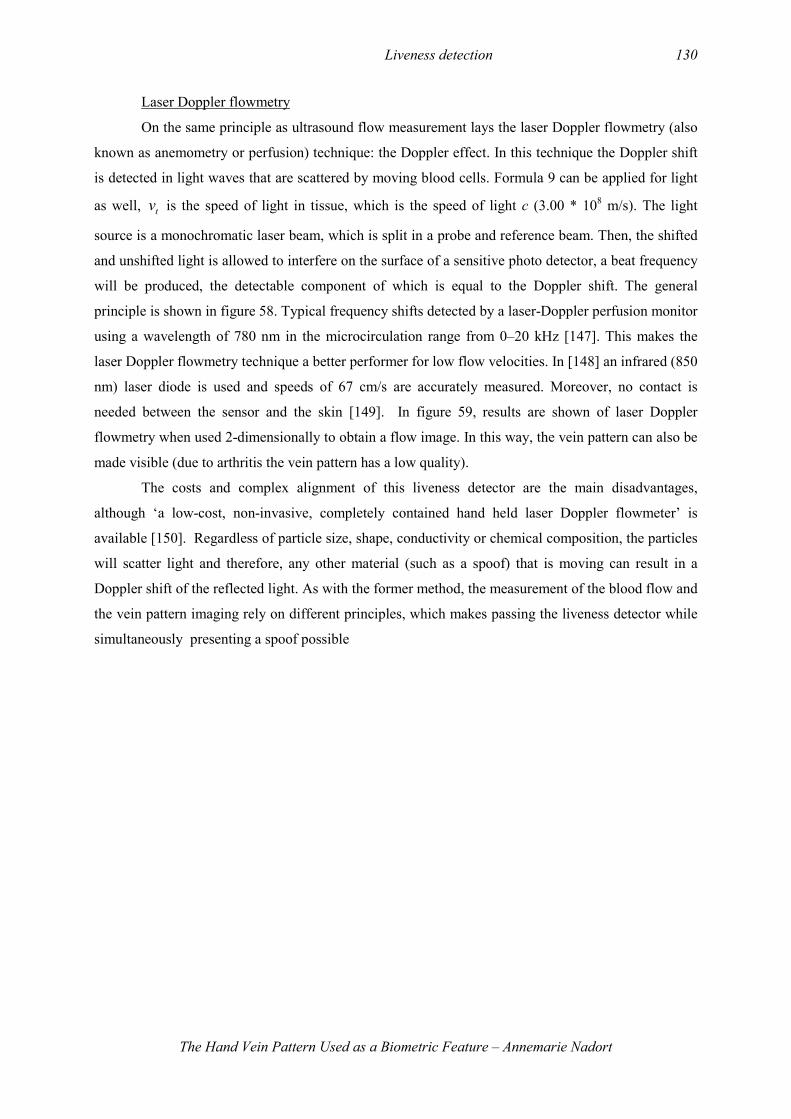
Liveness detection 130
The Hand Vein Pattern Used as a Biometric Feature – Annemarie Nadort
Laser Doppler flowmetry
On the same principle as ultrasound flow measurement lays the laser Doppler flowmetry (also
known as anemometry or perfusion) technique: the Doppler effect. In this technique the Doppler shift
is detected in light waves that are scattered by moving blood cells. Formula 9 can be applied for light
as well, tv is the speed of light in tissue, which is the speed of light c (3.00 * 108 m/s). The light
source is a monochromatic laser beam, which is split in a probe and reference beam. Then, the shifted
and unshifted light is allowed to interfere on the surface of a sensitive photo detector, a beat frequency
will be produced, the detectable component of which is equal to the Doppler shift. The general
principle is shown in figure 58. Typical frequency shifts detected by a laser-Doppler perfusion monitor
using a wavelength of 780 nm in the microcirculation range from 0–20 kHz [147]. This makes the
laser Doppler flowmetry technique a better performer for low flow velocities. In [148] an infrared (850
nm) laser diode is used and speeds of 67 cm/s are accurately measured. Moreover, no contact is
needed between the sensor and the skin [149]. In figure 59, results are shown of laser Doppler
flowmetry when used 2-dimensionally to obtain a flow image. In this way, the vein pattern can also be
made visible (due to arthritis the vein pattern has a low quality).
The costs and complex alignment of this liveness detector are the main disadvantages,
although ‘a low-cost, non-invasive, completely contained hand held laser Doppler flowmeter’ is
available [150]. Regardless of particle size, shape, conductivity or chemical composition, the particles
will scatter light and therefore, any other material (such as a spoof) that is moving can result in a
Doppler shift of the reflected light. As with the former method, the measurement of the blood flow and
the vein pattern imaging rely on different principles, which makes passing the liveness detector while
simultaneously presenting a spoof possible
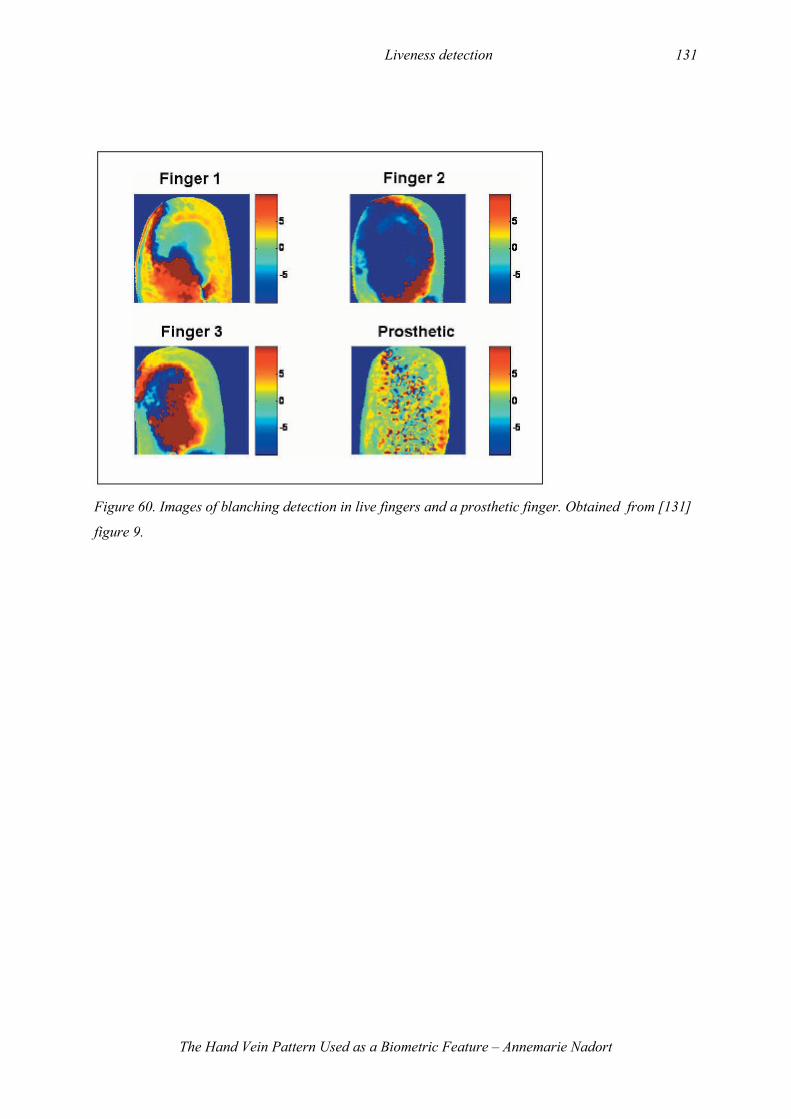
Liveness detection 131
The Hand Vein Pattern Used as a Biometric Feature – Annemarie Nadort
Figure 60. Images of blanching detection in live fingers and a prosthetic finger. Obtained from [131]
figure 9.
Liveness detection 132
The Hand Vein Pattern Used as a Biometric Feature – Annemarie Nadort
4.5 Bodily response
The last category of liveness detectors are the methods that measure a bodily response to a stimulus; a
challenge-response method. It can measure either voluntary (behavioural) or involuntary (reflexive)
responses. The bodily responses can be measured by using an additional algorithm and by using
additional hardware. Ways to spoof the system are mentioned at the end of each subsection
4.5.1 Using additional algorithm
a) Nonlinear deformation
Deformation of the skin of a fingertip when pressed hard against a surface compared to a less
rigid contact is proposed as a cue for liveness in fingerprint biometrics. A living skin should exhibit
nonlinear distortions, while thick artificial fake fingerprints are supposed to give rigid transformations
[4]. The same can hold for the hand vein pattern; because the veins are embedded in soft tissue small
movements of the veins are likely when the hand is put into different configurations (e.g. flexing or
stretching). These distortions are probably also nonlinear, while for example a paper hand or balloon
will deform in ways that are not characteristic for living tissue and veins. This liveness cue can be
measured with the same equipment; only adjustment of software is needed to compare two images
taken from different configurations of the hand. It is a form of a voluntary bodily response.
Not much is known about this method; therefore no valid statement can be made on the
properties of nonlinear deformations of the veins, or the ability of algorithms to verify authenticity and
liveness while the hand vein pattern is nonlinearly changed.
4.5.2 Additional hardware
a) Logical response
Examples of logical responses to prompts generated by the system are little tasks like ‘touch A
if the plate is hot, touch B when the plate is cold’ will be appropriate in verifying whether the person
standing in front of the device is alive or not, but can not at all verify whether the presented biometric
feature is belonging to this living person. Therefore this liveness detector is very easy to circumvent.
b) Blanching
The third liveness detection method of the company Ludigim [131] is a form of a bodily
response: the user is asked to press his finger against a hard surface. When a finger is in contact with a
hard surface, blanching occurs which is specific to a live finger. This blanching is primarily due to
changes in pooling of blood and therefore it can be measured in especially the red, and to a smaller
extent in the green wavelength region. To detect blanching, a series of images are taken using the red
and green wavelength LED’s of the mulitspectral system and the ratio of the differences of the green
Liveness detection 133
The Hand Vein Pattern Used as a Biometric Feature – Annemarie Nadort
and the red intensities is calculated. This ratio is a measure of blanching. As shown in figure 60, live
fingers show large blood pooling regions, while the prosthetic finger shows a distinct, mottled pattern.
When blanching can also be measured with an infrared LED already used to capture the vein pattern,
only adjustment of the software is needed for this liveness detection method.
This anti-spoofing method has got the primary disadvantage that contact with some hard
surface is needed. Second, it can only be used for finger vein biometric methods; for the convex and
concave shapes of the back and palm of the hand it will be complex to image blanching. Moreover, the
blanching verification and vein imaging should happen simultaneously otherwise it is easy to replace
the non-live biometric sample with a living finger in the liveness verification step. An essential
problem now is that the veins will be hard to visualize due to the blanching and the biometric vein
pattern itself will change as a function of pressure. Therefore, verification will be very complex and
this method is not useful for vein imaging methods.
c) Hot/cold stimulus
An involuntary bodily response that is closely related to the hand vein pattern itself is the
response of veins to hot or cold environments. For energy saving purposes veins dilate in warm
environments, while they contract in cold environments. Veins in two different images taken under
different temperatures should therefore differ in diameter. This can be measured with an additional
algorithm and some cooling or heating system.
The disadvantages are obvious: inconvenience for the users; a long liveness verification time
is needed because the reaction of the veins is not immediate; and the resolution of the images should
improve a lot before the differences are detectable and significant. Due to the distance that photons
travel in tissue which makes their path diffuse (section 2.5.3 page 36), it is probably impossible to
obtain images that are accurate enough for this liveness detection.
Liveness detection 134
The Hand Vein Pattern Used as a Biometric Feature – Annemarie Nadort
4.6 Other methods to limit spoofing
4.6.1 Combination of multiple methods
The combination of multiple biometrics [19, 151] as well as a combination of several liveness
detection methods [130] will make it harder for an intruder to trespass the system. The intruder has to
obtain several biometric features of the same authorized person or simulate several liveness cues on
the same time. In this way, a lot of possible spoofs fall outside the range of one of the different
methods, while they could have been included if only one such method was used [151]. Although this
might seem obvious, in practice combining multiple biometrics in one system is rather difficult, due to
environmental, cost or equipment limitations [19].
4.6.2 Multiple entrees
Another way to limit spoofing is to take several images of the same vein pattern and requiring
each of these to be identified and verified correctly [4]. For a paper copy of a hand vein pattern or
other spoof, this might be harder to achieve than a real authorized biometric sample. However, for an
authorized person this will increase the FRR and the verification time, and therefore increases the
inconvenience for ordinary users of the system.
4.6.3 Multiple templates
When users enrol multiple templates to the system, for example both left and right hand for the
hand vein pattern or all ten fingers for the finger vein pattern, the system can randomly ask for a
specific biometric feature and the intruder has to get hold of all of them to trespass the system. Such a
system may also require two different vein patterns before verifying authenticity [19].
4.6.4 Combination with other authenticity cues
Another proposed method against spoofing is the use of ‘multi-factor authentication’ [19]:
using biometrics in combination with smart cards, tokens or passwords. This reduces the convenience,
and perhaps also the idea of biometrics ‘being the key yourself’ but it will increase the security of the
system. An impostor would need both the biometric sample and the token or secret in order to defeat
the system.

Liveness detection 135
The Hand Vein Pattern Used as a Biometric Feature – Annemarie Nadort
4.6.5 Supervising
This chapter started with an example of an attentive employer as a liveness detector. In fact,
supervision during enrolment, verification and identification will increase the security of biometric
systems. Some spoofs however, are that small or lifelike that it is very difficult for a supervisor to
detect it. Especially because supervision is a human task, prone to human mistakes or lack of
concentration due to the monotonous job [4].
Liveness detection 136
The Hand Vein Pattern Used as a Biometric Feature – Annemarie Nadort
4.7 More spoofing risks
Besides tricking a biometric system with the aid of an artificially created fake biometric feature that is
presented to the regular sensor technology of the system, there are two additional approaches possible
to fool a biometric system: via the USB port and via the data base.
4.7.1 Attack via USB port
Regarding the approach attack the system via the Universal Serial Bus (USB), the system is
also fooled by artificial data, but this data is purely electronic [120, 152]. One can get hold of
reference data with, for instance, the aid of a sniffer program listening on the USB port. USB ports, as
is implicated in the name, are invented for convenient swapping of devices hooked up to a computer
while a computer is running. This allows potential assailants to exchange the biometric scanner for a
deceptive device of their own. By presenting the ‘stolen’ data to the USB port, the system’s regular
sensor system is bypassed, a procedure commonly known as a replay attack [120].
Two examples of eavesdropping tools are mentioned by [120]. The first is a filter drive like
‘USB Snoop’ for Windows; this tool is free to download on the internet [153]. It interposes itself
between the driver of the USB adapter and the actual device driver. All data that is being exchanged
between Windows and the device driver is written in a log file of USB Snoop itself. This log file is
available for the impostor to extract the data and re-submit it at any wanted time to the USB port to
fool the system. The second example is based on a hardware analyzer, which eavesdrops on the USB
cable directly and is virtually invisible. It records all transmitted data through the cable, and can be
made available to the impostor to filter out the relevant biometric data.
This study reports a successful attack at a fingerprint biometric device, ID Mouse by Siemens:
‘with the aid of data packets gathered by eavesdropping and some lines of Perl script we were able to
reconstruct complete fingerprints’ [120]. Their device was capable of impersonating towards the target
PC the previously removed biometric scanner: the device could respond with answers identical to
those of the actual fingerprint scanner and then at the right moment play back the stored biometric
data. [152] also recognizes the fact that USB devices (like PalmSecure) can be spoofed via these kinds
of attacks.
4.7.2 Attack via data base
This approach is based at the data base directly. An example is the following: ‘the hypothetical
case that a former bank employee who years after leaving his firm decides to bring down to life the at
one time surreptitiously created data set ‘Mr. Miller’s eleventh finger’ with the intention of generously
taking care of his retirement needs’ [120]. To do this, an impostor needs to have administrator rights,
and the data sets should have no separate protection by the system. In that case, the forger can
reactivate this created login at any later moment in time.

Liveness detection 137
The Hand Vein Pattern Used as a Biometric Feature – Annemarie Nadort
Liveness detection 138
The Hand Vein Pattern Used as a Biometric Feature – Annemarie Nadort
4.8 Discussion
True stories, like in the introduction of this chapter about the dead man in South Africa, but
also movie images of people being killed to obtain their eyes or fingers, have resulted in a certain gore
factor on the biometric industry [152]. A security system that decreases a user’s personal security is
not so popular. Although killing to obtain a person’s biometric feature is a rather farfetched thought,
copying someone’s biometric feature is a more significant threat to biometric systems.
However it must be said that the easiness with which you leave your fingerprints behind on
cups, door handles or other surfaces does not apply to your hand vein pattern. It is relatively hidden
beneath your skin, and does not leave surface traces. To copy somebody’s vein pattern one must have
access to the hands to draw (when the veins are quite superficial) or photograph the veins with for
example a (night) camera (see figures 49 and 50). Although possible, it would be rather hard to obtain
a detailed vein pattern without permission. This fact in itself makes the hand vein pattern biometry less
susceptible to be misused by impostors.
When impostors can have access to the database the threats are different. In this case hand
vein pattern templates can get stolen, or the impostor can create a fake account (section 4.7.2).
Another threat is attacking the USB port directly (section 4.7.1). All these scenarios require certain
concerns for the biometric industry to secure their systems.
Liveness detection is an option to secure a system against spoof biometrics. In the last chapter
many different ways to incorporate lifeness detection have been described. However, also ways to
circumvent the liveness detection are described for almost every method. Some main remarks on the
described methods can be made.
4.8.1 Liveness detection related to biometric verification
First of all, the biometric verification and the liveness detection are often not closely related
which makes it easy to present a fake biometric sample to the biometric sensor, while presenting the
liveness cues to the liveness detector. Ideally, the two systems work on the same time on the same
object, with the same detection technique. This is the case in for example thermal imaging (4.4.1a) and
some spectrographic methods (4.3.2a). In the first method, thermal radiation (MIR) is captured to
image the vein pattern and to obtain the liveness cue. In the second method NIR (and red) light and
proper filters are used to capture the vein pattern and to obtain the liveness cue: specific absorption
properties of (de)oxygenated haemoglobin. In theory, another method that falls into this category is the
laser Doppler flowmetry when this technique is used to image the vein pattern based on flow velocities
(see figure 59), besides detecting liveness. Also the blood volume pulse liveness detection method
(Section 4.4.2a) could be adapted into a configuration where reflection of near IR light is measured
Liveness detection 139
The Hand Vein Pattern Used as a Biometric Feature – Annemarie Nadort
over time to capture both the vein pattern and simultaneously the pulsatile change in blood volume.
These methods have their disadvantages as well; mostly cost, complex implementation, and
contamination with ambient light.
In a large number of the described methods the liveness detector makes use of radiation:
spectrographic signatures, oxygen content, blood pulse, blood flow, blanching and nonlinear
deformation, are all based on some interaction of light with the living body. Because vein imaging is
also based on capturing radiation, these methods are closely related to the biometric feature itself,
although not in an inherent way. Proper filters, light sources and sensors have to be used to make
spoofing more complex (costs), and in most cases physical contact is needed to prevent ambient light
to interfere.
4.8.2 Other threats
The two threats based on attacks via USB ports and databases belong to a different category.
Attacks via the USB port are not as science-fiction as they seem, in fact programmes and drivers have
already been developed. However, filter drivers are also quite easy to detect and require administration
rights to be installed [120]. But then again, programmers will probably always find ways around this.
A way to prevent attacks like this is to incorporate a so called challenge-response procedure, in which
the biometric device and the application mutually authenticate one another and thereafter exclusively
communicate with each other in an encrypted fashion [120]. Again, this adaptation of the biometric
devices will trigger new impostor attempts to circumvent the new security measures, and so on.
To prevent false enrolments in the database the simple solution is to handle your database with
care: check regularly for data sets that have not been used long, or are not registered and update your
database frequently. Though this will probably not prevent some ingenious ways which impostors will
create to contaminate a database of enrolled biometric features.
4.8.3 Critical Issues
Several methods that have been proposed for liveness detection sound rather solid. However,
most of the research into liveness detection is still in its infancy, especially for the relatively new hand
vein pattern biometric. The methods are simply not good enough to rely on for full protection against
impostors. The results shown before [11] demonstrate this clearly. This is in contrast with the aims of
the producers of the biometric devices. The biggest problem arising here is the feeling of safety, while
the threats are not recognized. Especially because biometrics are used in network security this can
cause serious damage, for both the user and the build-up status of biometrics in general [19]. In the
introduction of this chapter four unwanted scenarios have been discussed that are possible when
biometric systems are defeated.
Liveness detection 140
The Hand Vein Pattern Used as a Biometric Feature – Annemarie Nadort
A reason for the weakness of liveness detection is the ‘black-box’ treatment of the biometric
industry: ‘most vendors fall back on the need to retain a competitive advantage in holding secret their
liveness detection methods’ [19]. The controversy is however, that when complex systems are
available for review, this triggers revocation and reissuance processes that reinforce system integrity.
Critical functions of the system will improve by the willingness to accept and use criticism, an
approach which most powerful cryptographic systems are already familiar with. The biometrics closed
design is unlikely to be a long-term solution for building secure, reliable and effective systems. In
contrary to what vendors might feel (secrecy as their greatest protection against impostors), the
systems will benefit from an open approach to third party inspection, analysis, criticism and
improvement [19]. Accepting this will give potential users the possibility to assess whether the system
is suitable for their particular purposes [11].
Another important issue in evaluating liveness detection is the development of vendor-
independent testing of robustness of these methods against spoof attacks [4, 22, 118]. [11] is one
example, but more effort is needed. Lifeness detection will be at the cost of user convenience,
hardware prices or matching accuracy [118]. The relation of performance tests to lifeness detection
will be further discussed in the final chapter (Chapter 5).
It is important to keep in mind that spoofing techniques will always be evolving, and countermeasures
are only temporary. Therefore research and development will always be necessary, as well as proper
evaluation of the systems. And even with flawless liveness detection, people can still be forced or
drugged to present their biometric feature. Liveness detection is only a means to minimize the
effectiveness of artificial or simulated biometric samples. It is never a guarantee that the biometric
sample belongs to the authentic live human being. ‘If man can make it, man can break it.’[117].

Liveness detection 141
The Hand Vein Pattern Used as a Biometric Feature – Annemarie Nadort
Final discussion and conclusion 142
The Hand Vein Pattern Used as a Biometric Feature – Annemarie Nadort
5 Final discussion and conclusion
The core question of this thesis ‘How suitable is the hand vein pattern as a biometric feature?’
resulted in literature research of many articles, websites and patents. The three sub questions that
shaped the former three chapters will for clarity be repeated:
1) How unique and time-invariant is the hand vein pattern and how can we perceive it?
2) How does the vein pattern biometric identification technology work?
3) How can the systems defend themselves against impostor attacks?
5.1 On the sub questions
How unique and time-invariant is the hand vein pattern and how can we perceive it?
No statistical certainty can be given on the uniqueness of each hand vein pattern, unlike, for
example DNA profile frequencies. For DNA-profiles a scientific based model calculates the frequency
of a profile in the population based on the frequencies of each single independent allele (varying
element in DNA) in that profile [154]. For hand vein patterns no such scientific model exists to
quantitatively support the uniqueness of the pattern. However, it has been shown that, despite the
universal aim for optimal blood supply to the body, a very high variety in branching parameters is
found for the vascular tree of different organisms. According to [91] the arteries, that are located on
the palm side of the hand relatively deep under the surface, show less variation among persons than
the vein structure, located more superficial at the back side of the hand. But due to the low number of
hand vein patterns that have been investigated no harsh conclusion can be made on the uniqueness of
each hand vein pattern.
Another property of the hand vein pattern, compared to e.g. a fingerprint pattern, is the relative
simplicity of the pattern itself. In figure 1 it is seen that only a few bigger veins are present in the
hand, this fact can reduce the uniqueness of a pattern. In addition, the ‘uniqueness in practice’ depends
on the sensitivity of the devices to pick up small differences. Consequently it depends on the image
capturing technique (how many veins can the device capture) and on the matching method (how much
information of the vein pattern does the device retain for matching).
The non-time-invariance of the hand vein pattern is clear when looking at the growth and
reduction of the human body as a whole, resulting in growth and reduction of the vascular structure [1,
67]. In adult life these are minor changes and probably insignificant for the hand vein pattern. For
children this is different. Again the consequences for vein pattern verification are dependent on the
method of matching: bifurcations and intersections of veins (the structure) are determined in the early
stages of life, and matching based on structure will therefore not suffer from human growth [1].
Matching methods based on template matching on the other hand will not be robust against growth of
Final discussion and conclusion 143
The Hand Vein Pattern Used as a Biometric Feature – Annemarie Nadort
the vein pattern. This can be solved by a regular update of the template when identification of infants
is concerned.
Changes in the vessel diameter are quite common: naturally due to cold (smaller diameter) or
warm (larger diameter) temperatures, alcohol intake, or physical activity. In some diseases thickening
or thinning of the vessel wall or silting up of the vessels can result in an extended reduction in blood
flow which makes the vessels less or not visible on images. In cold weather and for poor vessel
conditions the variance in the visibility of the veins can induce errors in verification [1, 54]. Artificial
changes of the vein pattern can be made surgically. According to two Dutch surgeons the veins can
easily be moved a few millimetres, removed, tied up or seared (in which case new veins will evolve or
existing small veins will expand), or be removed and reconnected to other veins [90, 91]. Surgically it
is thus possible nowadays to interfere with the vein pattern identification system. In the future when
angiogenetic therapy is more developed, this treatment might also influence the hand vein pattern.
Artificial changes in the vein pattern can be made on purpose (fraudulent) or can be a side effect of
surgery or therapy.
Two ways of vein imaging are used by the biometric industry and biometric research: thermal
imaging and reflective imaging with NIR light. Thermal imaging relies on the fact that veins emit
more mid-infrared radiation than the surrounding tissue. Reflective imaging relies on the fact that in
the tissue optical window, (de)oxyhaemoglobin the main absorber of radiation is, while the other
tissue components reflect the NIR radiation. The absorption coefficient of both forms of haemoglobin
is wavelength dependent, except for the isobestic wavelength (805nm) where the absorption
coefficient is equal. Most imaging techniques use NIR light with wavelengths around the isobestic
wavelength. In figure 10 the absorption coefficient curves of deoxy- and oxyhaemoglobin show that
oxyhaemoglobin absorbs more at wavelengths beyond 805nm, while deoxyhaemoglobin absorbs more
at shorter wavelengths. When taking this into account it could be interesting to use wavelengths
shorter than 805nm for images of the back of the hand where the veins are situated which carry more
deoxyhaemoglobin than oxyhaemoglobin, and using wavelengths longer than 805nm for the palm
region of the hand, where the arteries are located.
The penetration depth of NIR radiation depends on wavelength, mean blood fractional
volume, blood oxygen saturation, and other specific tissue properties. When using the same device
with the same light source, there will always be a slight difference in reflected radiation between
different times of imaging. The devices have to be robust against this kind of variations, while on the
same time sensitive enough to pick up the differences belonging to different vein patterns. In addition,
due to the principle of scattering, the reflected light will be diffuse and thus reducing the sharpness of
the images. The influence of variation due to penetration depth and scattering should quantitatively be
assessed in large-scale studies. So far, despite this kind of inaccuracy the selectivity of the devices is
said to be quite good, of course according to the biometric industry itself [24, 25, 94] and IBG’s
Comparative Biometric Test [115].
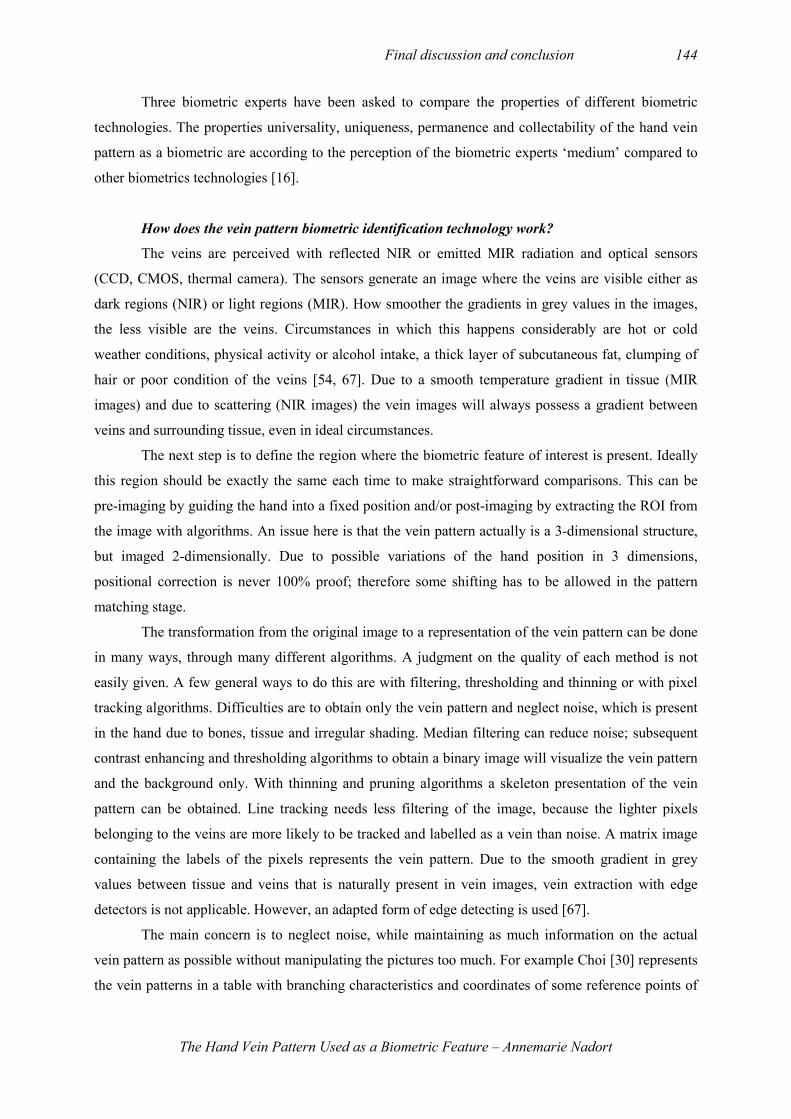
Final discussion and conclusion 144
The Hand Vein Pattern Used as a Biometric Feature – Annemarie Nadort
Three biometric experts have been asked to compare the properties of different biometric
technologies. The properties universality, uniqueness, permanence and collectability of the hand vein
pattern as a biometric are according to the perception of the biometric experts ‘medium’ compared to
other biometrics technologies [16].
How does the vein pattern biometric identification technology work?
The veins are perceived with reflected NIR or emitted MIR radiation and optical sensors
(CCD, CMOS, thermal camera). The sensors generate an image where the veins are visible either as
dark regions (NIR) or light regions (MIR). How smoother the gradients in grey values in the images,
the less visible are the veins. Circumstances in which this happens considerably are hot or cold
weather conditions, physical activity or alcohol intake, a thick layer of subcutaneous fat, clumping of
hair or poor condition of the veins [54, 67]. Due to a smooth temperature gradient in tissue (MIR
images) and due to scattering (NIR images) the vein images will always possess a gradient between
veins and surrounding tissue, even in ideal circumstances.
The next step is to define the region where the biometric feature of interest is present. Ideally
this region should be exactly the same each time to make straightforward comparisons. This can be
pre-imaging by guiding the hand into a fixed position and/or post-imaging by extracting the ROI from
the image with algorithms. An issue here is that the vein pattern actually is a 3-dimensional structure,
but imaged 2-dimensionally. Due to possible variations of the hand position in 3 dimensions,
positional correction is never 100% proof; therefore some shifting has to be allowed in the pattern
matching stage.
The transformation from the original image to a representation of the vein pattern can be done
in many ways, through many different algorithms. A judgment on the quality of each method is not
easily given. A few general ways to do this are with filtering, thresholding and thinning or with pixel
tracking algorithms. Difficulties are to obtain only the vein pattern and neglect noise, which is present
in the hand due to bones, tissue and irregular shading. Median filtering can reduce noise; subsequent
contrast enhancing and thresholding algorithms to obtain a binary image will visualize the vein pattern
and the background only. With thinning and pruning algorithms a skeleton presentation of the vein
pattern can be obtained. Line tracking needs less filtering of the image, because the lighter pixels
belonging to the veins are more likely to be tracked and labelled as a vein than noise. A matrix image
containing the labels of the pixels represents the vein pattern. Due to the smooth gradient in grey
values between tissue and veins that is naturally present in vein images, vein extraction with edge
detectors is not applicable. However, an adapted form of edge detecting is used [67].
The main concern is to neglect noise, while maintaining as much information on the actual
vein pattern as possible without manipulating the pictures too much. For example Choi [30] represents
the vein patterns in a table with branching characteristics and coordinates of some reference points of
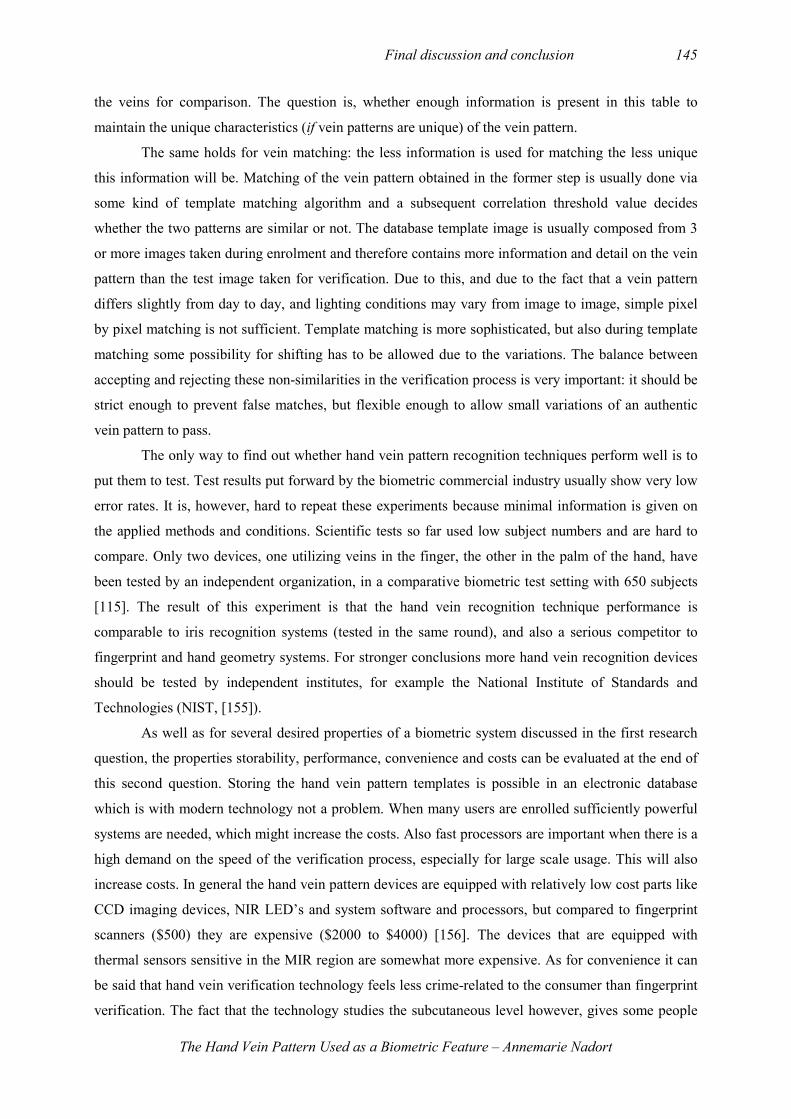
Final discussion and conclusion 145
The Hand Vein Pattern Used as a Biometric Feature – Annemarie Nadort
the veins for comparison. The question is, whether enough information is present in this table to
maintain the unique characteristics (if vein patterns are unique) of the vein pattern.
The same holds for vein matching: the less information is used for matching the less unique
this information will be. Matching of the vein pattern obtained in the former step is usually done via
some kind of template matching algorithm and a subsequent correlation threshold value decides
whether the two patterns are similar or not. The database template image is usually composed from 3
or more images taken during enrolment and therefore contains more information and detail on the vein
pattern than the test image taken for verification. Due to this, and due to the fact that a vein pattern
differs slightly from day to day, and lighting conditions may vary from image to image, simple pixel
by pixel matching is not sufficient. Template matching is more sophisticated, but also during template
matching some possibility for shifting has to be allowed due to the variations. The balance between
accepting and rejecting these non-similarities in the verification process is very important: it should be
strict enough to prevent false matches, but flexible enough to allow small variations of an authentic
vein pattern to pass.
The only way to find out whether hand vein pattern recognition techniques perform well is to
put them to test. Test results put forward by the biometric commercial industry usually show very low
error rates. It is, however, hard to repeat these experiments because minimal information is given on
the applied methods and conditions. Scientific tests so far used low subject numbers and are hard to
compare. Only two devices, one utilizing veins in the finger, the other in the palm of the hand, have
been tested by an independent organization, in a comparative biometric test setting with 650 subjects
[115]. The result of this experiment is that the hand vein recognition technique performance is
comparable to iris recognition systems (tested in the same round), and also a serious competitor to
fingerprint and hand geometry systems. For stronger conclusions more hand vein recognition devices
should be tested by independent institutes, for example the National Institute of Standards and
Technologies (NIST, [155]).
As well as for several desired properties of a biometric system discussed in the first research
question, the properties storability, performance, convenience and costs can be evaluated at the end of
this second question. Storing the hand vein pattern templates is possible in an electronic database
which is with modern technology not a problem. When many users are enrolled sufficiently powerful
systems are needed, which might increase the costs. Also fast processors are important when there is a
high demand on the speed of the verification process, especially for large scale usage. This will also
increase costs. In general the hand vein pattern devices are equipped with relatively low cost parts like
CCD imaging devices, NIR LED’s and system software and processors, but compared to fingerprint
scanners ($500) they are expensive ($2000 to $4000) [156]. The devices that are equipped with
thermal sensors sensitive in the MIR region are somewhat more expensive. As for convenience it can
be said that hand vein verification technology feels less crime-related to the consumer than fingerprint
verification. The fact that the technology studies the subcutaneous level however, gives some people
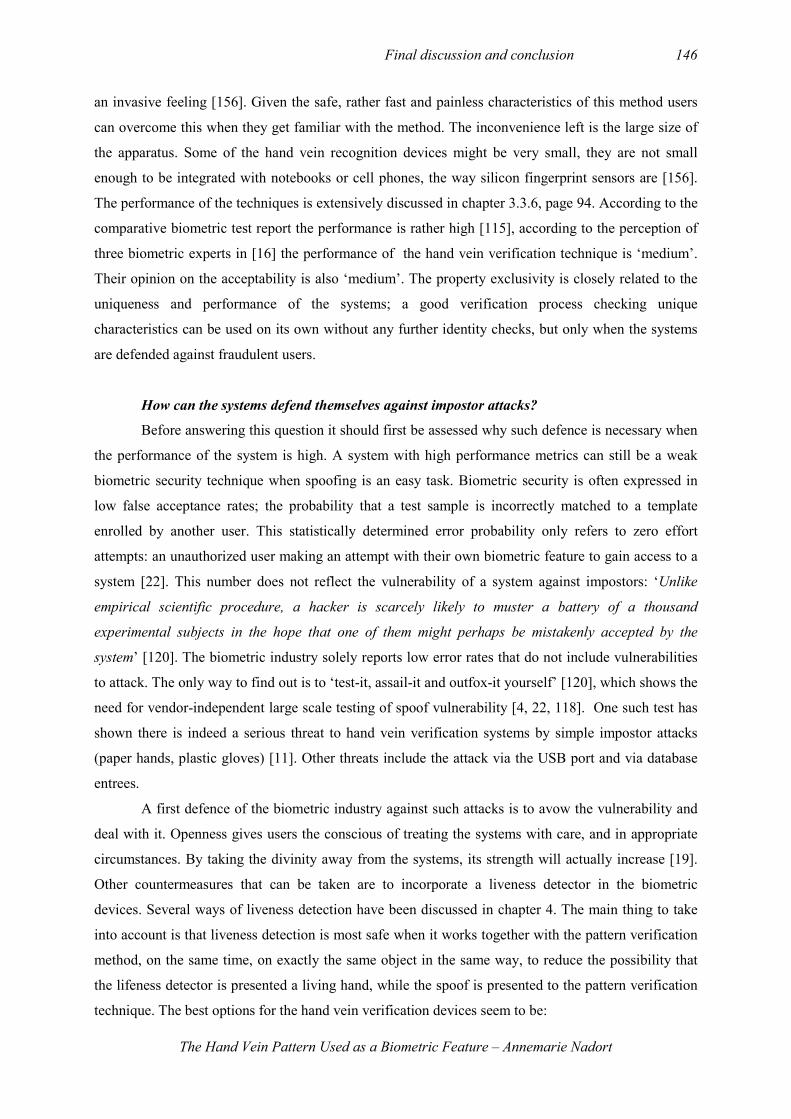
Final discussion and conclusion 146
The Hand Vein Pattern Used as a Biometric Feature – Annemarie Nadort
an invasive feeling [156]. Given the safe, rather fast and painless characteristics of this method users
can overcome this when they get familiar with the method. The inconvenience left is the large size of
the apparatus. Some of the hand vein recognition devices might be very small, they are not small
enough to be integrated with notebooks or cell phones, the way silicon fingerprint sensors are [156].
The performance of the techniques is extensively discussed in chapter 3.3.6, page 94. According to the
comparative biometric test report the performance is rather high [115], according to the perception of
three biometric experts in [16] the performance of the hand vein verification technique is ‘medium’.
Their opinion on the acceptability is also ‘medium’. The property exclusivity is closely related to the
uniqueness and performance of the systems; a good verification process checking unique
characteristics can be used on its own without any further identity checks, but only when the systems
are defended against fraudulent users.
How can the systems defend themselves against impostor attacks?
Before answering this question it should first be assessed why such defence is necessary when
the performance of the system is high. A system with high performance metrics can still be a weak
biometric security technique when spoofing is an easy task. Biometric security is often expressed in
low false acceptance rates; the probability that a test sample is incorrectly matched to a template
enrolled by another user. This statistically determined error probability only refers to zero effort
attempts: an unauthorized user making an attempt with their own biometric feature to gain access to a
system [22]. This number does not reflect the vulnerability of a system against impostors: ‘Unlike
empirical scientific procedure, a hacker is scarcely likely to muster a battery of a thousand
experimental subjects in the hope that one of them might perhaps be mistakenly accepted by the
system’ [120]. The biometric industry solely reports low error rates that do not include vulnerabilities
to attack. The only way to find out is to ‘test-it, assail-it and outfox-it yourself’ [120], which shows the
need for vendor-independent large scale testing of spoof vulnerability [4, 22, 118]. One such test has
shown there is indeed a serious threat to hand vein verification systems by simple impostor attacks
(paper hands, plastic gloves) [11]. Other threats include the attack via the USB port and via database
entrees.
A first defence of the biometric industry against such attacks is to avow the vulnerability and
deal with it. Openness gives users the conscious of treating the systems with care, and in appropriate
circumstances. By taking the divinity away from the systems, its strength will actually increase [19].
Other countermeasures that can be taken are to incorporate a liveness detector in the biometric
devices. Several ways of liveness detection have been discussed in chapter 4. The main thing to take
into account is that liveness detection is most safe when it works together with the pattern verification
method, on the same time, on exactly the same object in the same way, to reduce the possibility that
the lifeness detector is presented a living hand, while the spoof is presented to the pattern verification
technique. The best options for the hand vein verification devices seem to be:
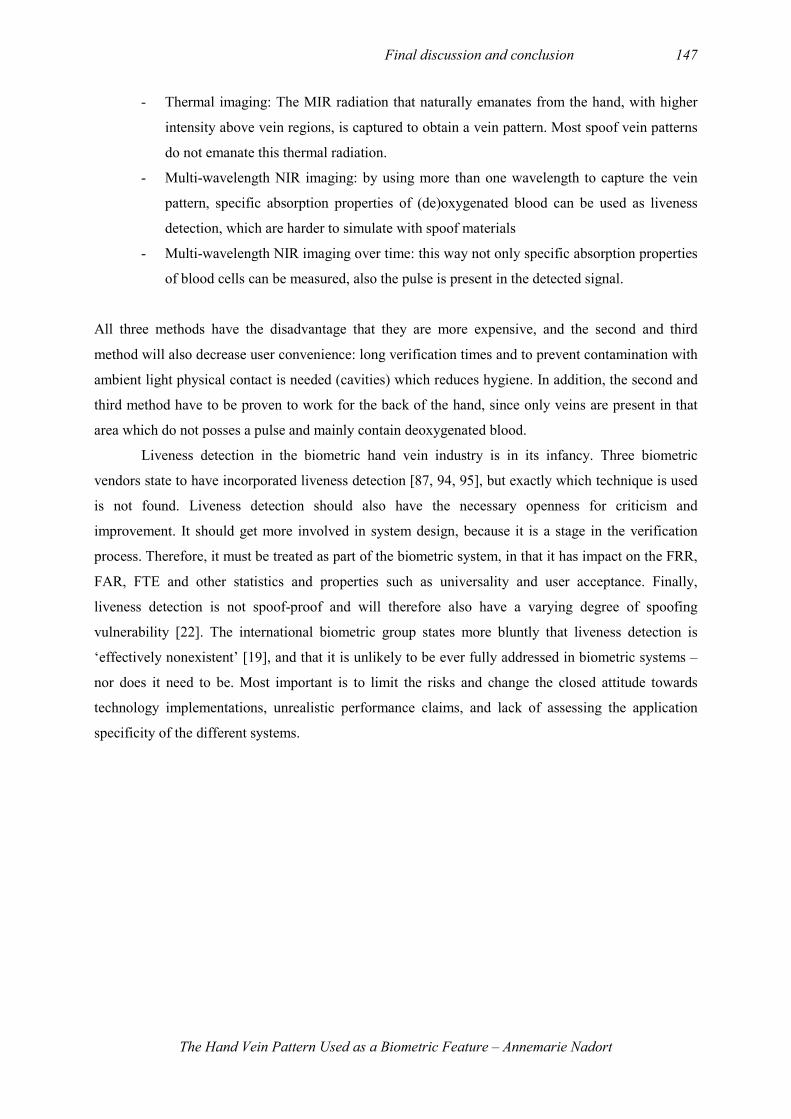
Final discussion and conclusion 147
The Hand Vein Pattern Used as a Biometric Feature – Annemarie Nadort
- Thermal imaging: The MIR radiation that naturally emanates from the hand, with higher
intensity above vein regions, is captured to obtain a vein pattern. Most spoof vein patterns
do not emanate this thermal radiation.
- Multi-wavelength NIR imaging: by using more than one wavelength to capture the vein
pattern, specific absorption properties of (de)oxygenated blood can be used as liveness
detection, which are harder to simulate with spoof materials
- Multi-wavelength NIR imaging over time: this way not only specific absorption properties
of blood cells can be measured, also the pulse is present in the detected signal.
All three methods have the disadvantage that they are more expensive, and the second and third
method will also decrease user convenience: long verification times and to prevent contamination with
ambient light physical contact is needed (cavities) which reduces hygiene. In addition, the second and
third method have to be proven to work for the back of the hand, since only veins are present in that
area which do not posses a pulse and mainly contain deoxygenated blood.
Liveness detection in the biometric hand vein industry is in its infancy. Three biometric
vendors state to have incorporated liveness detection [87, 94, 95], but exactly which technique is used
is not found. Liveness detection should also have the necessary openness for criticism and
improvement. It should get more involved in system design, because it is a stage in the verification
process. Therefore, it must be treated as part of the biometric system, in that it has impact on the FRR,
FAR, FTE and other statistics and properties such as universality and user acceptance. Finally,
liveness detection is not spoof-proof and will therefore also have a varying degree of spoofing
vulnerability [22]. The international biometric group states more bluntly that liveness detection is
‘effectively nonexistent’ [19], and that it is unlikely to be ever fully addressed in biometric systems –
nor does it need to be. Most important is to limit the risks and change the closed attitude towards
technology implementations, unrealistic performance claims, and lack of assessing the application
specificity of the different systems.
Final discussion and conclusion 148
The Hand Vein Pattern Used as a Biometric Feature – Annemarie Nadort
5.2 On the main question
How suitable is the hand vein pattern as a biometric feature
The main question of this thesis is actually an oversimplified question and the answer is not
straightforward. Hopefully the full body of this thesis makes this clear. Some main statements address
the answer to this question:
- The vascular structure is highly variable, but not (yet) proven to be unique
- The veins are rather stable through live, but their visibility is significantly influenced by
subcutaneous fat, environmental temperatures and bodily conditions. Solutions to these
imaging problems should be assessed. In addition, a serious threat might arise from
surgical procedures: since plastic surgery is getting into a crazy hype and money can buy
anything, any wanted vein pattern might be possible in the future. However, on this
moment only minor changes can be made and real vein pattern changes are unpredictable
[90, 91], and scars will be visible on the hand.
- The vein pattern is rather simple; it is important that algorithms retain as much
information as possible, while allowing variations in vein patterns due to changing
circumstances.
- The first independent large scale performance test on two hand vein biometric devices
resulted in a positive evaluation of the performance of these devices [115]. However, this
rather new technology should be evaluated more often, including spoof vulnerabilities; a
property that should be included in performance statistics [22].
- Liveness detection is essential, because hand vein pattern recognition is shown to be
spoofed by artificial hands [11].
- Fingerprints and DNA are easier to obtain from somebody than the hand vein pattern.
- The secrecy of the industry makes it hard to asses the vulnerabilities. The unwillingness of
the industry to have their liveness detection methods held up for third party inspection,
analysis and improvement makes it the weakest part of the device [19]. ‘Instead of finally
laying its cards on the table, the biometrics line of business prefers to hide behind error
rates it has measured itself’ [120].
All together, the hand vein pattern recognition technique is a potential biometric application, but like
all biometric identification methods, in spite of what the industry claims, it is a vulnerable system.
Whether due to spoof attacks or false matches and non-matches, a biometric decision based on hand
vein pattern recognition cannot be taken in and of itself as unassailable, legal proof that an individual
really executed a transaction or entered a facility. However, it might be an appropriate tool to protect
access to private areas, as long as you know your vulnerabilities and subsequently adapt your system
design.

Final discussion and conclusion 149
The Hand Vein Pattern Used as a Biometric Feature – Annemarie Nadort

Acknowledgement 150
The Hand Vein Pattern Used as a Biometric Feature – Annemarie Nadort
6 Acknowledgement
At the end of this literature study I would like to dedicate a few words to three people who
have put a good effort in the accomplishment of this project. In the first place my supervisor Dr. Zeno
Geradts, who has helped me with his knowledge and resources to find as much information as I could,
which resulted in a long-term but as complete as possible study on the biometrics of our hand veins.
And of course thanks go to his colleagues of the Digital Technology department of the Netherlands
Forensics Institute who have reviewed (parts of) this thesis. In the second place I wish to acknowledge
the contribution of my second reviewer Prof. dr. R.M. Heethaar, in the form of his time to evaluate,
and help to organize, this significant part of my master programme. In the third place I would like to
especially thank Mr. Benjamin Howe, who spent hours behind the computer to help me perfect my
English writing.

References 151
The Hand Vein Pattern Used as a Biometric Feature – Annemarie Nadort

References 152
The Hand Vein Pattern Used as a Biometric Feature – Annemarie Nadort
7 References
1 Wang, L. and Leedham, G. (2005) A thermal hand vein pattern verification system. In: Lecture notes in Computer Science, Springer Berlin / Heidelberg
2 See: www.biometricgroup.com International Biometric Group. 3 See: http://isotc.iso.org/ JTC 1/SC 37 Agreed Harmonized Core Biometric Terms and
Definitions. 4 Sandström, M. (2004) Liveness Detection in Fingerprint Recognition Systems,
Department of Electrical Engineering, Linköping Institute of Technology, Institutionen för systemteknik, Linköping
5 See: www.wikipedia.com . 6 See: http://www.authentec.com/getpage.cfm?sectionID=61 Glossary of Biometric
Terms
7 See: http://www.cee.hw.ac.uk/hipr/html/hipr_top.html Hypermedia Image Processing
Reference. University of Edinburgh 8 See: http://tmip.fhwa.dot.gov/clearinghouse/docs/mvrcm/ch4.stm#f4-2#f4-2. Model
Validation and Reasonableness Checking Manual 9 See: http://www.ph.tn.tudelft.nl/Courses/FIP/noframes/fip-Morpholo.html#Heading96
Image processing fundamentals, Morphology-based Operations 10 Geradts, Z. J. and Ruifrok, A. C. (2003) Extracting forensic evidence from biometric
devices. (Zia-ur, R., Robert, A. S. and Stephen, E. R., eds.), pp. 181-188, SPIE 11 Zoun, R., Geradts, Z., Arnout, C. R. and Sommer, P. (2006) D6.1: Forensic
Implications of Identity Management Systems. In FIDIS Future of Identity in the Information Society (No. 507512), pp. 65-69
12 See: www.answers.com 13 Roerdink, J. B. T. M. and Meijster, A. (2000) The Watershed Transform: Definitions,
Algorithms and Parallelization Strategies. FUNDAMENTA INFORMATICAE 41, 187-228
14 Travers, J. and Milgram, S. (1969) An Experimental Study of the Small World
Problem. Sociometry 32, 425-443 15 Jain, A., Bolle, R. M. and Pankati, S. (1999) Biometrics: Personal Identification in
Networked Society. Dordrecht: Kluwer Academic Publishers 16 Jain, A., Bolle, R. M. and Pankati, S. (1999) Ch. 1 Introduction to Biometrics. In
Biometrics - Personal Identification in Networked Society (Jain, A., Bolle, R. M. and Pankati, S., eds.), pp. 1-41, Kluwer Academic Publishers Boston/Dordrecht/london
17 See: http://anatomy.med.umich.edu/musculoskeletal_system/superficial_limbs_ans.html (2000) Dissector Answers - Superficial Limbs & Posterior Shoulder, University of Michigan
18 Huopio, S. (1998) Biometric Identification. In Seminar on Network Security: "Authorization and Access Control in Open Network Environment", Department of Computer Science Helsinki University of Technology
19 International_Biometrics_Group (2003) Liveness Detection in Biometric Systems (white paper).
20 Matsumoto, T., Matsumoto, H., Yamada, K. and Hoshino, S. (2002) Impact of
Artificial “Gummy” Fingers on Fingerprint Systems. SPIEE 4677 21 Putte, T. v. d. and Keuning, J. (2000) Biometrical Fingerprint Recognition: Don't Get
Your Fingers Burned. Kluwer Academic Publishers 22 Schuckers, S. A. C. (2002) Spoofing and Anti-Spoofing Measures. Information
Security Technical Report on Biometrics 7, 56 - 62
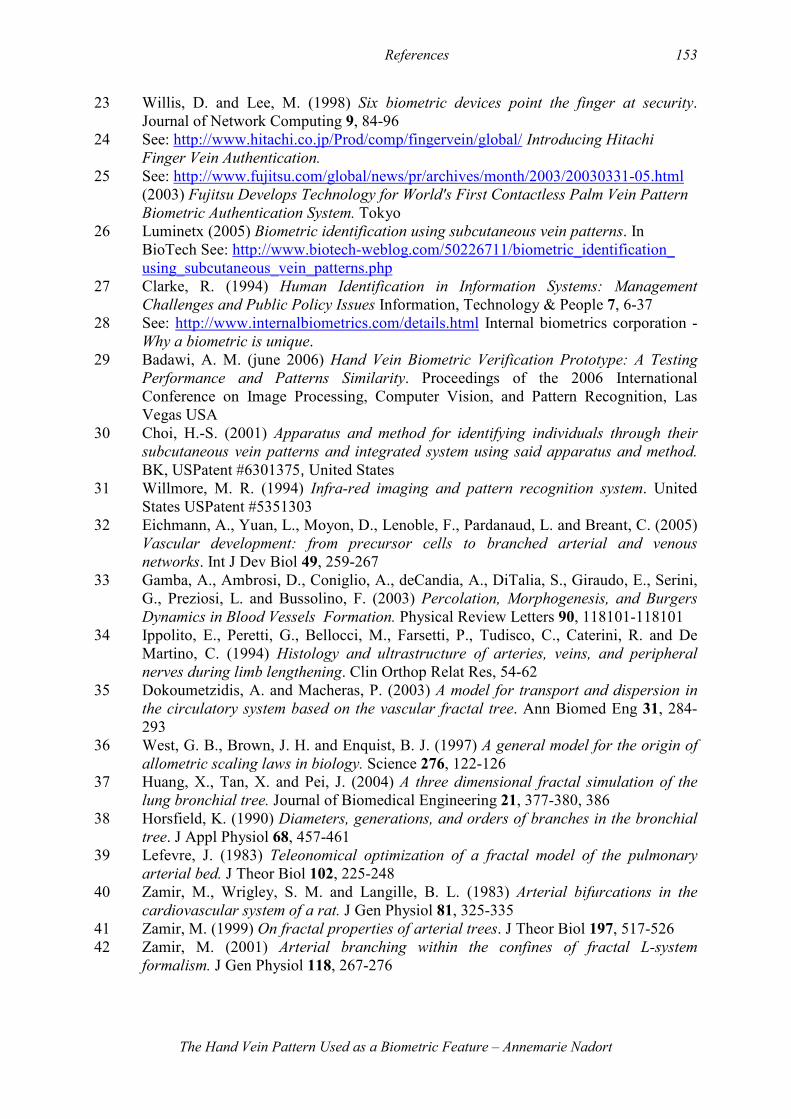
References 153
The Hand Vein Pattern Used as a Biometric Feature – Annemarie Nadort
23 Willis, D. and Lee, M. (1998) Six biometric devices point the finger at security. Journal of Network Computing 9, 84-96
24 See: http://www.hitachi.co.jp/Prod/comp/fingervein/global/ Introducing Hitachi
Finger Vein Authentication.
25 See: http://www.fujitsu.com/global/news/pr/archives/month/2003/20030331-05.html (2003) Fujitsu Develops Technology for World's First Contactless Palm Vein Pattern
Biometric Authentication System. Tokyo 26 Luminetx (2005) Biometric identification using subcutaneous vein patterns. In
BioTech See: http://www.biotech-weblog.com/50226711/biometric_identification_ using_subcutaneous_vein_patterns.php
27 Clarke, R. (1994) Human Identification in Information Systems: Management
Challenges and Public Policy Issues Information, Technology & People 7, 6-37 28 See: http://www.internalbiometrics.com/details.html Internal biometrics corporation -
Why a biometric is unique. 29 Badawi, A. M. (june 2006) Hand Vein Biometric Verification Prototype: A Testing
Performance and Patterns Similarity. Proceedings of the 2006 International Conference on Image Processing, Computer Vision, and Pattern Recognition, Las Vegas USA
30 Choi, H.-S. (2001) Apparatus and method for identifying individuals through their
subcutaneous vein patterns and integrated system using said apparatus and method. BK, USPatent #6301375, United States
31 Willmore, M. R. (1994) Infra-red imaging and pattern recognition system. United States USPatent #5351303
32 Eichmann, A., Yuan, L., Moyon, D., Lenoble, F., Pardanaud, L. and Breant, C. (2005) Vascular development: from precursor cells to branched arterial and venous
networks. Int J Dev Biol 49, 259-267 33 Gamba, A., Ambrosi, D., Coniglio, A., deCandia, A., DiTalia, S., Giraudo, E., Serini,
G., Preziosi, L. and Bussolino, F. (2003) Percolation, Morphogenesis, and Burgers
Dynamics in Blood Vessels Formation. Physical Review Letters 90, 118101-118101 34 Ippolito, E., Peretti, G., Bellocci, M., Farsetti, P., Tudisco, C., Caterini, R. and De
Martino, C. (1994) Histology and ultrastructure of arteries, veins, and peripheral
nerves during limb lengthening. Clin Orthop Relat Res, 54-62 35 Dokoumetzidis, A. and Macheras, P. (2003) A model for transport and dispersion in
the circulatory system based on the vascular fractal tree. Ann Biomed Eng 31, 284-293
36 West, G. B., Brown, J. H. and Enquist, B. J. (1997) A general model for the origin of
allometric scaling laws in biology. Science 276, 122-126 37 Huang, X., Tan, X. and Pei, J. (2004) A three dimensional fractal simulation of the
lung bronchial tree. Journal of Biomedical Engineering 21, 377-380, 386 38 Horsfield, K. (1990) Diameters, generations, and orders of branches in the bronchial
tree. J Appl Physiol 68, 457-461 39 Lefevre, J. (1983) Teleonomical optimization of a fractal model of the pulmonary
arterial bed. J Theor Biol 102, 225-248 40 Zamir, M., Wrigley, S. M. and Langille, B. L. (1983) Arterial bifurcations in the
cardiovascular system of a rat. J Gen Physiol 81, 325-335 41 Zamir, M. (1999) On fractal properties of arterial trees. J Theor Biol 197, 517-526 42 Zamir, M. (2001) Arterial branching within the confines of fractal L-system
formalism. J Gen Physiol 118, 267-276
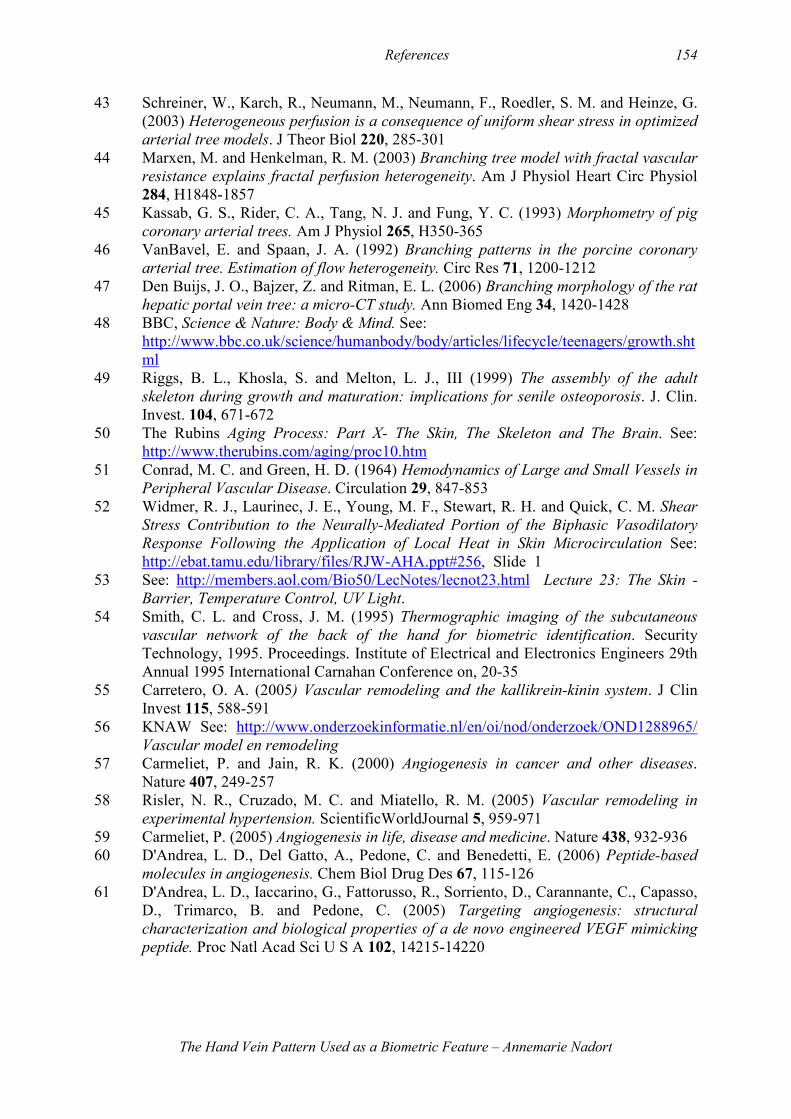
References 154
The Hand Vein Pattern Used as a Biometric Feature – Annemarie Nadort
43 Schreiner, W., Karch, R., Neumann, M., Neumann, F., Roedler, S. M. and Heinze, G. (2003) Heterogeneous perfusion is a consequence of uniform shear stress in optimized
arterial tree models. J Theor Biol 220, 285-301 44 Marxen, M. and Henkelman, R. M. (2003) Branching tree model with fractal vascular
resistance explains fractal perfusion heterogeneity. Am J Physiol Heart Circ Physiol 284, H1848-1857
45 Kassab, G. S., Rider, C. A., Tang, N. J. and Fung, Y. C. (1993) Morphometry of pig
coronary arterial trees. Am J Physiol 265, H350-365 46 VanBavel, E. and Spaan, J. A. (1992) Branching patterns in the porcine coronary
arterial tree. Estimation of flow heterogeneity. Circ Res 71, 1200-1212 47 Den Buijs, J. O., Bajzer, Z. and Ritman, E. L. (2006) Branching morphology of the rat
hepatic portal vein tree: a micro-CT study. Ann Biomed Eng 34, 1420-1428 48 BBC, Science & Nature: Body & Mind. See:
http://www.bbc.co.uk/science/humanbody/body/articles/lifecycle/teenagers/growth.shtml
49 Riggs, B. L., Khosla, S. and Melton, L. J., III (1999) The assembly of the adult
skeleton during growth and maturation: implications for senile osteoporosis. J. Clin. Invest. 104, 671-672
50 The Rubins Aging Process: Part X- The Skin, The Skeleton and The Brain. See: http://www.therubins.com/aging/proc10.htm
51 Conrad, M. C. and Green, H. D. (1964) Hemodynamics of Large and Small Vessels in
Peripheral Vascular Disease. Circulation 29, 847-853 52 Widmer, R. J., Laurinec, J. E., Young, M. F., Stewart, R. H. and Quick, C. M. Shear
Stress Contribution to the Neurally-Mediated Portion of the Biphasic Vasodilatory
Response Following the Application of Local Heat in Skin Microcirculation See: http://ebat.tamu.edu/library/files/RJW-AHA.ppt#256, Slide 1
53 See: http://members.aol.com/Bio50/LecNotes/lecnot23.html Lecture 23: The Skin - Barrier, Temperature Control, UV Light.
54 Smith, C. L. and Cross, J. M. (1995) Thermographic imaging of the subcutaneous
vascular network of the back of the hand for biometric identification. Security Technology, 1995. Proceedings. Institute of Electrical and Electronics Engineers 29th Annual 1995 International Carnahan Conference on, 20-35
55 Carretero, O. A. (2005) Vascular remodeling and the kallikrein-kinin system. J Clin Invest 115, 588-591
56 KNAW See: http://www.onderzoekinformatie.nl/en/oi/nod/onderzoek/OND1288965/ Vascular model en remodeling
57 Carmeliet, P. and Jain, R. K. (2000) Angiogenesis in cancer and other diseases. Nature 407, 249-257
58 Risler, N. R., Cruzado, M. C. and Miatello, R. M. (2005) Vascular remodeling in
experimental hypertension. ScientificWorldJournal 5, 959-971 59 Carmeliet, P. (2005) Angiogenesis in life, disease and medicine. Nature 438, 932-936 60 D'Andrea, L. D., Del Gatto, A., Pedone, C. and Benedetti, E. (2006) Peptide-based
molecules in angiogenesis. Chem Biol Drug Des 67, 115-126 61 D'Andrea, L. D., Iaccarino, G., Fattorusso, R., Sorriento, D., Carannante, C., Capasso,
D., Trimarco, B. and Pedone, C. (2005) Targeting angiogenesis: structural
characterization and biological properties of a de novo engineered VEGF mimicking
peptide. Proc Natl Acad Sci U S A 102, 14215-14220
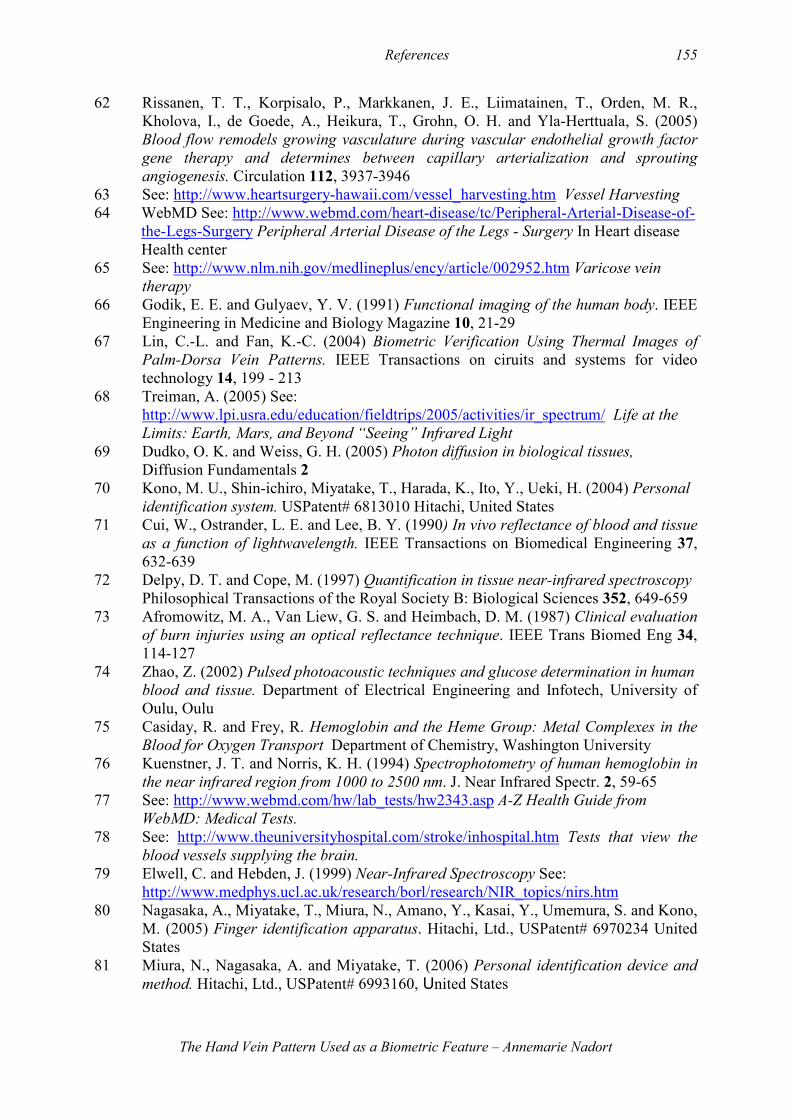
References 155
The Hand Vein Pattern Used as a Biometric Feature – Annemarie Nadort
62 Rissanen, T. T., Korpisalo, P., Markkanen, J. E., Liimatainen, T., Orden, M. R., Kholova, I., de Goede, A., Heikura, T., Grohn, O. H. and Yla-Herttuala, S. (2005) Blood flow remodels growing vasculature during vascular endothelial growth factor
gene therapy and determines between capillary arterialization and sprouting
angiogenesis. Circulation 112, 3937-3946 63 See: http://www.heartsurgery-hawaii.com/vessel_harvesting.htm Vessel Harvesting 64 WebMD See: http://www.webmd.com/heart-disease/tc/Peripheral-Arterial-Disease-of- the-Legs-Surgery Peripheral Arterial Disease of the Legs - Surgery In Heart disease Health center 65 See: http://www.nlm.nih.gov/medlineplus/ency/article/002952.htm Varicose vein
therapy
66 Godik, E. E. and Gulyaev, Y. V. (1991) Functional imaging of the human body. IEEE Engineering in Medicine and Biology Magazine 10, 21-29
67 Lin, C.-L. and Fan, K.-C. (2004) Biometric Verification Using Thermal Images of
Palm-Dorsa Vein Patterns. IEEE Transactions on ciruits and systems for video technology 14, 199 - 213
68 Treiman, A. (2005) See: http://www.lpi.usra.edu/education/fieldtrips/2005/activities/ir_spectrum/ Life at the Limits: Earth, Mars, and Beyond “Seeing” Infrared Light
69 Dudko, O. K. and Weiss, G. H. (2005) Photon diffusion in biological tissues, Diffusion Fundamentals 2
70 Kono, M. U., Shin-ichiro, Miyatake, T., Harada, K., Ito, Y., Ueki, H. (2004) Personal
identification system. USPatent# 6813010 Hitachi, United States 71 Cui, W., Ostrander, L. E. and Lee, B. Y. (1990) In vivo reflectance of blood and tissue
as a function of lightwavelength. IEEE Transactions on Biomedical Engineering 37, 632-639
72 Delpy, D. T. and Cope, M. (1997) Quantification in tissue near-infrared spectroscopy
Philosophical Transactions of the Royal Society B: Biological Sciences 352, 649-659 73 Afromowitz, M. A., Van Liew, G. S. and Heimbach, D. M. (1987) Clinical evaluation
of burn injuries using an optical reflectance technique. IEEE Trans Biomed Eng 34, 114-127
74 Zhao, Z. (2002) Pulsed photoacoustic techniques and glucose determination in human
blood and tissue. Department of Electrical Engineering and Infotech, University of Oulu, Oulu
75 Casiday, R. and Frey, R. Hemoglobin and the Heme Group: Metal Complexes in the
Blood for Oxygen Transport Department of Chemistry, Washington University 76 Kuenstner, J. T. and Norris, K. H. (1994) Spectrophotometry of human hemoglobin in
the near infrared region from 1000 to 2500 nm. J. Near Infrared Spectr. 2, 59-65 77 See: http://www.webmd.com/hw/lab_tests/hw2343.asp A-Z Health Guide from
WebMD: Medical Tests.
78 See: http://www.theuniversityhospital.com/stroke/inhospital.htm Tests that view the
blood vessels supplying the brain.
79 Elwell, C. and Hebden, J. (1999) Near-Infrared Spectroscopy See: http://www.medphys.ucl.ac.uk/research/borl/research/NIR_topics/nirs.htm
80 Nagasaka, A., Miyatake, T., Miura, N., Amano, Y., Kasai, Y., Umemura, S. and Kono, M. (2005) Finger identification apparatus. Hitachi, Ltd., USPatent# 6970234 United States
81 Miura, N., Nagasaka, A. and Miyatake, T. (2006) Personal identification device and
method. Hitachi, Ltd., USPatent# 6993160, United States
References 156
The Hand Vein Pattern Used as a Biometric Feature – Annemarie Nadort
82 Miura, N., Nagasaka, A. and Miyatake, T. (2004) Feature extraction of finger-vein
patterns based on repeated line tracking and its application to personal identification. Machine Vision and Applications, 15, 194-203
83 Kono, M., Ueki, H. and Umemura, S.-i. (2002) Near-infrared finger vein patterns for
personal identification. Applied Optics 41, 7429 - 7436 84 SangKyun, I., HyungMan, P., SooWon, K., Hwansoo, C. and Changkyung, C. (2000)
Improved vein pattern extracting algorithm and its implementation. International Conference on Consumer Electronics, 2000. ICCE. 2000 Digest of Technical Papers, 2-3
85 Hollows, G. (2004) Infrared cameras enhance machine-vision systems In Vision
Systems Design, in Vision Systems Design. See: http://vsd.pennnet.com/Articles/Article_Display.cfm?Section=ARCHI&ARTICLE_ID=212088&VERSION_NUM=2&p=19
86 Yon, J., Biancardini, L., Mottin, E., Tissot, J. and Letellier, L. (2003) Infrared microbolometer sensors and their application in automotive safety. AMAA 11
87 Clayden, D. O. (1998) Biometric identification of individuals by use of subcutaneous
vein patterns. British Technology Group, Ltd. , USPatent# 5787185, United States 88 Djonov G. Valentin, H. K., Peter H. Burri (2002) Optimality in the developing
vascular system: Branching remodeling by means of intussusception as an efficient
adaptation mechanism. Developmental dynamics 224, 391-402 89 Groot, H. de Initial evaluation of tumours of the hand. See:
http://bonetumor.org/learning/pages/introHand.htm 90 Linden, H. ter (2007) Surgeon at Isala klinieken, centrum voor plastische chirurgie.
Zwolle, Personal communication. 91 Niessen, F. B. (2007) Plastic Surgeon Department of Plastic Surgery, Free University
Medical Center Amsterdam Amsterdam, Personal communication 92 See: http://ibd.nrc-cnrc.gc.ca/research/spectroscopy/1_invivo_absorption_e.html In
vivo spectroscopy: Absorption,.National Research Council Canada, 93 Urbach, R. (1969) The biologic effects of ultraviolet radiation. Pergamon Press New York, see: http://www.inchem.org/documents/ehc/ehc/ehc23.htm#SubSectionNumber:2.2.1 94 Luminetx, see: http://www.luminetx.com . 95 Tech-Sphere, see: http://www.tech-sphere.com/english/company.htm . 96 Geradts, Z. J. (2002) Study on biometrics in US Patent Literature (DRAFT). 97 Nextern, see: http://www.nextern.com/eng/ . 98 See: http://www.fel.fujitsu.com/home/v3__press.asp?prid=433 (2005) Palm Vein:
Your Hand Is The Key - Fujitsu demonstrates leading biometrics authentication technology at major European
security conferences. London. 99 See: http://www.fujitsu.com/global/news/pr/archives/month/2005/20050622-01.html
(2005) Chiba Institute of Technology To Implement World's First Student I.D. System
Using Fujitsu Palm Vein Authentication Technology with Smart Cards to Securely
Access Student Records Tokyo 100 See: http://www.fujitsu.com/global/news/pr/archives/month/2005/20050511-01.html
(2005) The University of Tokyo Hospital Deploys Fujitsu's Contactless Palm Vein
Authentication Technology for Room Access Security. Tokyo 101 (2006) Fujitsu Introduces New Biometric Security Solution for ATMs in Brazil, Sao
Paolo.
References 157
The Hand Vein Pattern Used as a Biometric Feature – Annemarie Nadort
102 Watanabe, M., Endoh, T., Shiohara, M. and Sasaki, S. (2005) Palm vein
authentication technology and its applications. In The Biometric Consortium Conference, Hyatt Regency Crystal City, Arlington, VA, USA
103 Fujitsu, see: http://www.fujitsu.com/downloads/COMP/fcpa/biometrics/palmsecure_datasheet.pdf
104 PosID,see: http://www.posidinc.com/index.cfm 105 Mainguet, J.-F. Vein, Vascular Patterern, See:
http://perso.orange.fr/fingerchip/biometrics/types/vein.htm#VeinID 106 See: http://www.hitachi.co.jp/Prod/comp/fingervein/global/ Hitachi Finger Vein
Authentication Technology. 107 See: http://www.hitachi.com/New/cnews/070306.html Hitachi (2007) Hitachi's
Finger Vein Authentication Technology Selected by Shinkin Central Bank (SCB) New
York Branch -- First Access Control System Employing Hitachi Vascular
Authentication Technology in the United States -- 108 Hitachi See: www.hitachi.com 109 Rice, J. (1987) Apparatus for the identification of individuals. USPatent# 4699149
United States 110 Jesorsky, O., Kirchberg, K. J. and Frischholz, R. W. (2001) Robust Face Detection
Using the Hausdorff Distance. In Proc. Third International Conference on Audio- and
Video-based Biometric Person Authentication, Halmstad, Sweden (Springer, ed.), pp. 90-95, Lecture Notes in Computer Science
111 GaoYongsheng (2002) Line segment Hausdorff distance on face matching. Pattern recognition 35, 361-372
112 Ding, Y., Zhuang, D. and Wang, K. (2005) A Study of Hand Vein Recognition Method. In IEEE International Conference Mechatronics and Automation, pp. 2106-2110, IEEE, Niagara Falls, Canada
113 International_Biometrics_Group See http://www.biometricgroup.com/ 114 International_Biometrics_Group Certification FAQ. See:
http://www.biometricgroup.com/reports/public/reports/certification_faq.htm 115 International_Biometrics_Group (2006) Comparative Biometric Testing - Round 6
Public Report. See: http://www.biometricgroup.com/reports/public/comparative_biometric_testing.html
116 SangKyun, I., HyungMan, P., SooWon, K., Changkyung, C. and Hwansoo, C. (2000) Improved Vein Pattern Extracting Algorithm and its Implementation. IEEE International Conference on Digest of Technical Papers., 2-3
117 Woodward, J. D., Orlans, N. M. and Higgins, P. T. (2002) Biometrics - Identity
Assurance in the Information Age. McGraw-Hill Osborne Media 118 Toth, B. (2005) Biometric Liveness Detection. Information Security Bulletin 10, 291-
297 119 Kang, H., Lee, B., Kim, H., Shin, D. and Kim, J. (2003) A Study on Performance
Evaluation of the Liveness Detection for Various Fingerprint Sensor Modules In
Knowledge-Based Intelligent Information and Engineering Systems, Springer-Verlag Berlin Heidelberg
120 Thalheim, L., Krissler, J. and Ziegler, P.-M. (2002) Body Check - Biometric Access
Protection Devices and their Programs Put to the Test. In c't Magazin für Computertechnik, pp. 114, See: http://www.heise.de/ct/english/02/11/114/
121 Derakshani, R., Schuckers, S. A. C., Hornak, L. A. and O'Gorman, L. (2003) Determination of vitality from a non-invasive biomedical measurement for use in
fingerprint scanners. Pattern recognition 36, 383-396
References 158
The Hand Vein Pattern Used as a Biometric Feature – Annemarie Nadort
122 Monrose, F. and Rubin, A. D. (2000) Keystroke dynamics as a biometric for
authentication. Future Generation Computer Systems 16, 351-359 123 Cattin, P., Zlatnik, D. and Borer, R. (2001) Sensor fusion for a biometric system using
gait. In IEEE International Conference on Multisensor Fusion and Integration for Intelligent Systems, pp. 233-238, Baden-Baden
124 Biel, L., Pettersson, O., L.Philipson and Wide, P. (2001) ECG analysis: a new
approach in human identification. IEEE Transactions on Instrumentation and Measurement 50, 808-812
125 Fujitsu_Vietnam_Ltd. (2005) Fujitsu Asia Launches PalmSecure™ Contactless Palm
Vein Biometric Authentication Device for ASEAN and India. See: http://www.fujitsu.com/vn/en/news/2005/palmsecure.html
126 Daugman, J. Anti-Spoofing "Liveness Detection". University of Cambridge, computer laboratory, Cambridge. See: http://www.cl.cam.ac.uk/~jgd1000/countermeasures.pdf
127 Daugman, J. (1999) Ch. 5 Recognizing Persons by Their Iris Patterns. In Biometrics: Personal Identification in Networked Society (A. Jain, R. M. Bolle and S. Pankanti, ed.), pp. 118-119, Dordrecht: Kluwer Academic Publishers
128 Marubeni_Leds&Lenses General Information and Application Notes for our LED
Products. See: http://tech-led.com/applications.shtml#Biometrics 129 Mourant, J. R., Bigio, I. J., Jack, D. A., Johnson, T. M. and Miller, H. D. (1997)
Measuring absorption coefficients in small volumes of highly scattering media:
source-detector separations for which path lengths do not depend on scattering
properties. Applied Optics 36, 5655-5661 130 Osten, D. W., Carim, H. M., Arneson, M. R. and Blan, B. L. (1998) Biometric,
personal authentication system. Minnesota Mining and Manufacturing Company (St. Paul, MN) USPatent# 5719950, United States
131 Ennis, M. S., Rowe, R. K., Corcoran, S. P. and Nixon, K. A. (2005) Multispectral
Sensing for High-Performance Fingerprint Biometric Imaging. Lumidigm, Inc. See: http://www.lumidigm.com/PDFs/Multispectral_Fingerprint_Imaging.pdf
132 Stone, R. T. and Briggs, D. A. (1992) Method and apparatus for calculating arterial
oxygen saturation based plethysmographs including transients, Nellcor Incorporated (Hayward, CA), USPatent# 5078136, United States
133 Fearnley, S. J. (1995) Pulse Oximetry. In Update in Anaestesia - practical procedures Department of Anaesthetics Torbay Hospital, See: http://www.nda.ox.ac.uk/wfsa/html/u05/u05_003.htm Torquay, UK 134 Lapsley, P. D., Lee, J. A., Pare Jr., D. F. and Hoffman, N. (1998) Anti-fraud biometric
scanner that accurately detects blood flow. SmartTouch, LLC. (Berkeley, CA) USPatent#5737439 United States 135 Gigante, G., Mugnaini, S. and Staderini, E. M. (2002) The photoplethysmography
page. Tor Vergata University of Rome, Rome. See: http://www.uniroma2.it/fismed/faculty/Stadero/dewhurst/photoplet.html
136 Pickering, T. G., Hall, J. E., Appel, L. J., Falkner, B. E., Graves, J., Hill, M. N., Jones, D. W., Kurtz, T., Sheps, S. G. and Roccella, E. J. (2005) Recommendations for Blood
Pressure Measurement in Humans and Experimental Animals: Part 1: Blood Pressure
Measurement in Humans: A Statement for Professionals From the Subcommittee of
Professional and Public Education of the American Heart Association Council on
High Blood Pressure Research. Hypertension 45, 142-161 137 Schuckers, S., Hornak, L., Parthasaradhi, S. and Derakhshani, R. (2004) Time-Series
Detection of Perspiration as a Liveness Test in Fingerprint Devices. In The Biometric Consortium Conference BC2004 Arlington VA, USA
138 See http://en.wikibooks.org/

References 159
The Hand Vein Pattern Used as a Biometric Feature – Annemarie Nadort
139 Deane, C. Doppler Ultrasound: Principles and Practice See http://www.centrus.com.br/DiplomaFMF/SeriesFMF/doppler/capitulos- html/chapter_01.htm 140 Hoskins, A. P. R. (1990) Measurement of arterial blood flow by Doppler ultrasound.
Clinical Physics and Physiological Measurement 11, 1-26 141 Rojanapongpun, P. and Drance, S. M. (1993) The response of blood flow velocity in
the ophthalmic artery and blood flow of the finger to warm and cold stimuli in
glaucomatous patients Journal Graefe's Archive for Clinical and Experimental Ophthalmology 231, 375-377
142 Olofsson, P. Å. Ultrasound Doppler Physical and technical background. Dpt of Biomedical Engineering, Malmö University Hospital. See http://www.fygo.dk/files/ukursus/Ultrasound%20Doppler.pdf
143 Giancoli, D. C. (2000) Physics for Scientists and Engineers Prentice Hall, Upper Saddle River, NJ
144 Støylen, A. Basic ultrasound for clinicians. Norwegian University of Science and Technology. See http://folk.ntnu.no/stoylen/strainrate/Ultrasound/
145 See http://www.tut.fi/units/me/ener/laitteistot/EFD/LDA.html Laser Doppler
Anemometry.
146 See: http://www-biol.paisley.ac.uk/neuro/doppler.htm Laser Doppler Imaging. 147 Leahy, M. J., Mul, F. F. M. d., Nilsson, G. E. and Maniewski, R. (1999) Principles
and practice of the laser-Doppler perfusion technique. See: http://purl.org/utwente/23627
148 Chen, C.-M. and Chen, G.-L. (2005) Measurement of chicken blood velocity using
dual beam mode of laser Doppler anemometry by optical fiber module. In The 18th Annual Meeting of the IEEE Lasers and Electro-Optics Society (LEOS), pp. 903-904
149 Snellenburg, J. and J.M.Mulder (2006) Laser Doppler Anemometry. Vrije Universiteit i.s.m. De Digitale Universiteit, Amsterdam. See: http://www.science.uva.nl/remotelabs/website/experiments/VU/LDA.php
150 Olsen, D. L. and DiMarzio, C. A. (1992) A micro laser Doppler flowmeter. In Proceedings of the 1992 Eighteenth IEEE Annual Northeast Bioengineering Conference, pp. 101-102, Kingston, RI, USA
151 Schuckers, S., Hornak, L., Norman, T., Derakhshani, R. and Parthasaradhi, S. (2002) Issues for Liveness Detection in Biometrics. In Biometric Consortium 15 Arlington, VA USA
152 MacVittie, D. (2006) Flesh-and-Blood Biometrics - PalmSecure Foretells Biometric
Future. In Network Computing. See: http://www.networkcomputing.com/showArticle.jhtml?articleID=193500195&queryText=biometric
153 USB_Snoop_Tool http://sourceforge.net/projects/usbsnoop/ 154 Meulenbroek, A. J. (2006) De essenties van forensisch DNA-onderzoek. Nederlands
Forensisch Instituut, information map. 155 See http://www.nist.gov/ 156 Khan, I. (2006) Vein Pattern Recognition - Biometrics Underneath the Skin. In
AutoID & Security (findBiometrics.com) See http://www.findbiometrics.com/article/320

References 160
The Hand Vein Pattern Used as a Biometric Feature – Annemarie Nadort
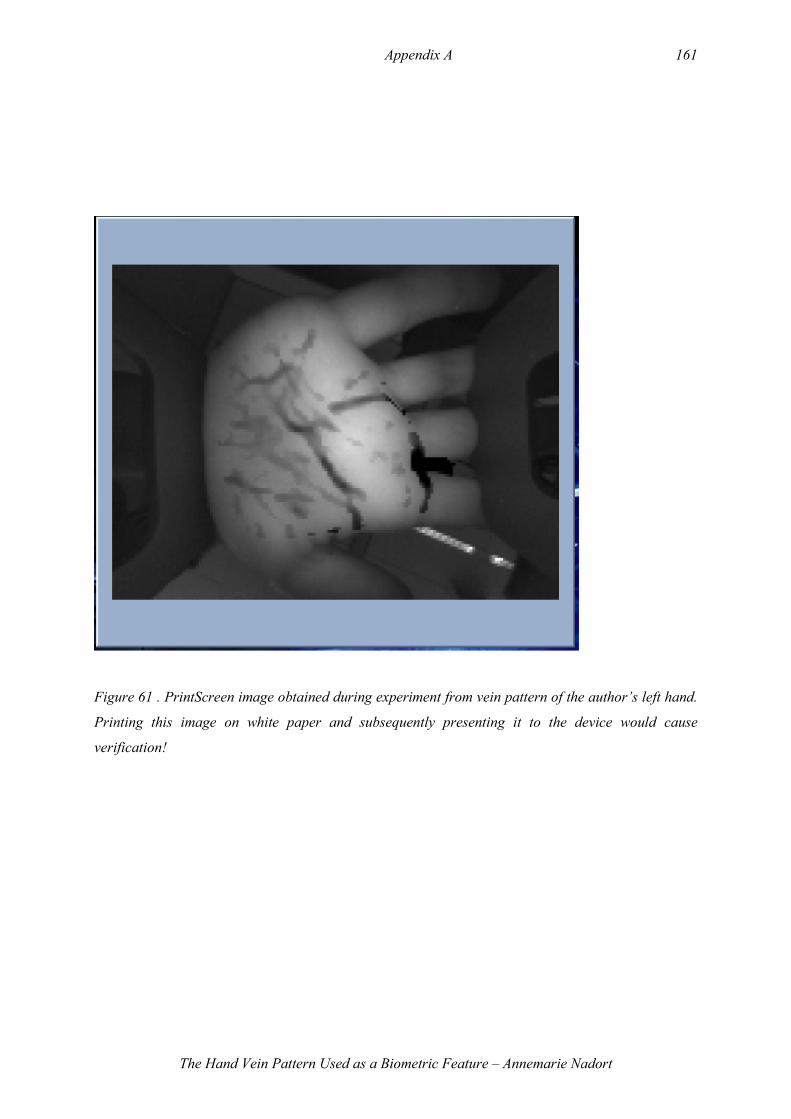
Appendix A 161
The Hand Vein Pattern Used as a Biometric Feature – Annemarie Nadort
Figure 61 . PrintScreen image obtained during experiment from vein pattern of the author’s left hand.
Printing this image on white paper and subsequently presenting it to the device would cause
verification!
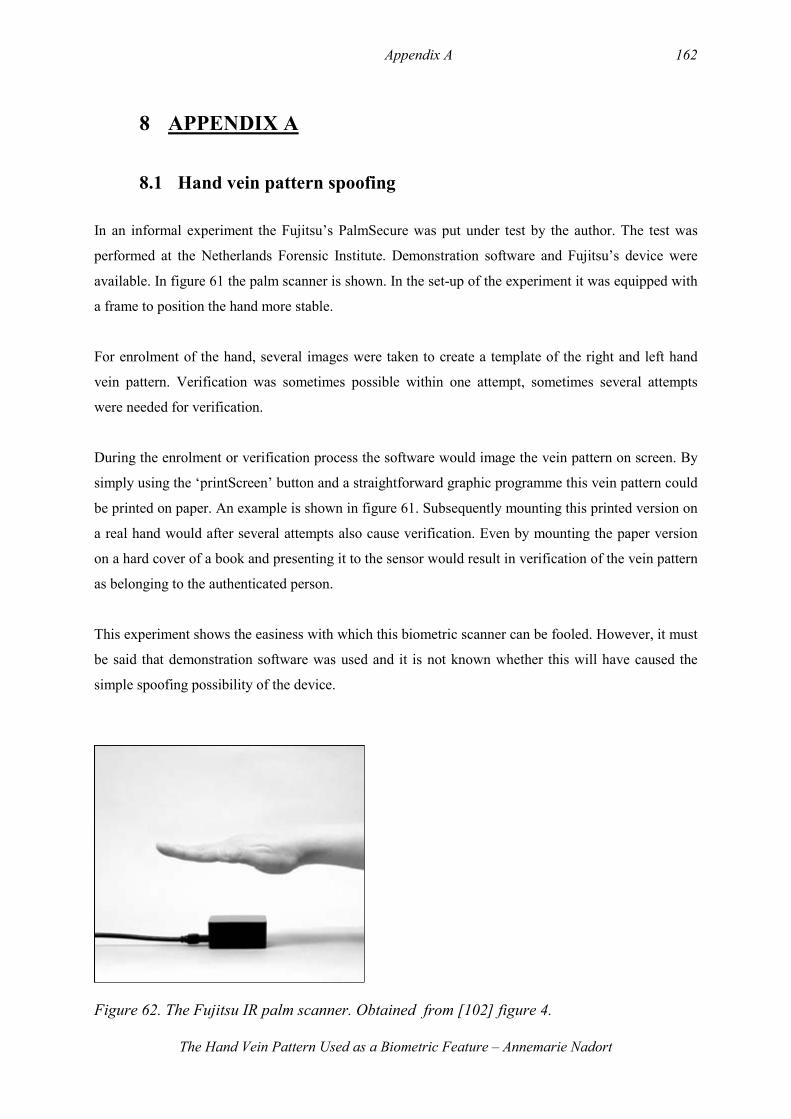
Appendix A 162
The Hand Vein Pattern Used as a Biometric Feature – Annemarie Nadort
8 APPENDIX A
8.1 Hand vein pattern spoofing
In an informal experiment the Fujitsu’s PalmSecure was put under test by the author. The test was
performed at the Netherlands Forensic Institute. Demonstration software and Fujitsu’s device were
available. In figure 61 the palm scanner is shown. In the set-up of the experiment it was equipped with
a frame to position the hand more stable.
For enrolment of the hand, several images were taken to create a template of the right and left hand
vein pattern. Verification was sometimes possible within one attempt, sometimes several attempts
were needed for verification.
During the enrolment or verification process the software would image the vein pattern on screen. By
simply using the ‘printScreen’ button and a straightforward graphic programme this vein pattern could
be printed on paper. An example is shown in figure 61. Subsequently mounting this printed version on
a real hand would after several attempts also cause verification. Even by mounting the paper version
on a hard cover of a book and presenting it to the sensor would result in verification of the vein pattern
as belonging to the authenticated person.
This experiment shows the easiness with which this biometric scanner can be fooled. However, it must
be said that demonstration software was used and it is not known whether this will have caused the
simple spoofing possibility of the device.
Figure 62. The Fujitsu IR palm scanner. Obtained from [102] figure 4.