Theses and Dissertations Thesis Collection - core.ac.uk · PDF fileLieutenant,UnitedStatesNavy...
127
Calhoun: The NPS Institutional Archive Theses and Dissertations Thesis Collection 1987 A statistical analysis determining effective and efficient methods of shipboard training. Michealson, Kirk A. http://hdl.handle.net/10945/22496
Transcript of Theses and Dissertations Thesis Collection - core.ac.uk · PDF fileLieutenant,UnitedStatesNavy...
Calhoun: The NPS Institutional Archive
Theses and Dissertations Thesis Collection
1987
A statistical analysis determining effective and
efficient methods of shipboard training.
Michealson, Kirk A.
http://hdl.handle.net/10945/22496


NAVAL POSTGRADUATE SCHOOL
Monterey, California
THESISA STATISTICAL ANALYSIS DETERMINING
EFFECTIVEAND EFFICIENT METHODS OF SHIPBOARD
TRAINING
by
Kirk A. Michealson
March 1987
Thesis Advisor D. E. Neil
Approved for public release; distribution is unlimited.
T233317


SfCuOirv CiASi'fiCATiON Of TmiS PAof
REPORT DOCUMENTATION PAGEij 3fPO«T SECURITY CLASSifiCATiON
UNCLASSIFIED'b RESTRICTIVE MARKINGS
2a SECURITY CLASSifiCATiOM AUThORiTV
2i> OEClASSifiCATiON' DOWNGRADING SCHEDULE
3 DISTRIBUTION/ AVAiLABitlTy Of REPORT
Approved for public releases-distribution is unliniited
4 PERFORMING ORGANISATION REPORT NUMS£R(S) 5 MONITORING ORGANIZATION REPORT NUVBER(S)
64 NAME Of PERFORMING ORGANIZATION
Naval Postgraduate School60 OFUCE SYMBOL
(If tppimblt)
55
7i Ufi.t^i Of- MONITORING QRGANiZAT lON,Naval Postgraduate School
6< ADDRESS (Cry, $fjf». tnd /iPCodf)
Monterey/ California 93943-5000
^b AODRESS(Gfy. $fjf#, ^nd^iPCode)
Montery, California 93943-5000
8a NAME OF FUNDING/SPONSORINGORGANIZATION
8b OFFICE SYMBOL(If tpphabl*)
9 PROCUREMENT INSTRUMENT IDENTIFICATION NUMBER
8c AC>DRESS(Cify. Jfjfe. jn<* Z/'»Cod#) 10 SOURCE OF FUNDING NUMBERS
PROGRAMELEMENT NO
PROJECTNO
rAS<NO
WORK jNirACCESSION NO
n TiT-tE (indudt S«<uriry Cl^utfKttion)
A STATISTICAL ANALYSIS DETERMINING EFFECTIVE AND EFFICIENT METHODS OFSHIPBOARD TRAINING
Michealson, Kirk A.3j ->?t OF SEPQRT
Master's Thesis1 !b riME COvE^EOFROM TO
U DATE OF REPORT iYt*r Month Oiy)
1987 MarchIS PAGE CO'^NT
116"6 Supplementary notation
'
;
COSATi COOES
• ElO GROUP SUBGROUP
18 Subject terms iContmut on revtrt* if ntctmiy snd •dentify 6y block number)
COiTiparison of Training Methods, TrainingEffectiveness, Training Efficiency, Lectures,
9 ^3S''R^CT (Continut on f»v*a» i* ntceinry jrxj Otntify by 6/(Xlc numbtr)
h significant factor affecting the operational readiness of thesurface Navy is the training of personnel to operate and maintainshipboard systems and equipment. Even though the importance of trainingis not disputed, factors such as effectiveness and efficiency must stillbe considered before selecting a specific method of instructionaldelivery. This study compared the most common training methods in thesurface Navy using one-way analysis of variance (ANOVA), individualdegree of freedom hllQVh, and two sample testing techniques to determinewhich methods were the most effective and efficient. The methodsco.T.pared were live lectures, video presentations, silent reading, andaudio presentations at three different speeds. The analyses showed thataudio presentations at normal speed and at 1. 25 times normal speed werethe most effective and efficient, while the two most common methods of
:0 S'R'9UTi0N/ AVAILABILITY OF ABSTRACT
CT>.NCLASSiFiEO/UNL'MlTEO D SAME AS RPT Q OTiC USERS
21 ABSTRACT SECURITY CLASSIFICATION
UNCLASSIFIED2» SAME OF RESPONSIBLE iNOiViDUAL
non T F. Nf^i 1
22b TELEPHONE f/o</uc/* Ar»j Coc^*)
( 408) 646-241922c OFFICE SYMBOL
55NI'0 FORM 1473. 84MAR 83 APR ed'tion m jy (,« u^ed until e«h*utted
All otr\«f fditiont 4'ff ob»oi*t#SECURITY CLASSIFICATION OF t^iS PACE

SECURITY CLASSIFICATION OF THIS PAGE fWhan DMm en(«r«0
18. SUBJECT TERMS (continued)Silent Reading, Video Presentations, Audio Presentations,and Firef ighting
.
19. ABSTRACT (continued)
instructional delivery (live lectures and video presen-tations) were significantly less effective in themajority of the comparisons.
S N 0102- LF- 014- 6601
SECURITY CLASSIFICATION OF THIS PAGe(T*«n Oa(« Enfrud)
Approved for public release; distribution is unlimited.
A Statistical Analysis Determining EfTective
and Efficient Methods of Shipboard Training
by
Kirk A. MichealsonLieutenant, United States Navy
B.S., United States Naval Academy^ 1979
Submitted in partial fulfillment of the
requirements for the degree of
MASTER OF SCIENCE IN OPER.'\TIONS RESEARCH
from the
NAVAL POSTGRADUATE SCHOOLxMarch 1987

.'f,^-<l $
i51^^^
ABSTRACT
A significant factor affecting the operational readiness of the surface Nav\' is the
training of personnel to operate and maintain shipboard systems and equipment. Even
though the importance of training is not disputed, factors such as effectiveness and
efficiency must still be considered before selecting a specific method of instructional
deliver}'. This study compared the most common training methods in the surface Nav\'
using one-way analysis of variance (ANOVA), individual degree of freedom ANOVA,
and two sample testing techniques to determine which methods were the most effective
and efficient. The methods compared were live lectures, video presentations, silent
reading, and audio presentations at three different speeds. The analyses showed that
audio presentations at normal speed and at 1.25 times normal speed were the most
effective and efficient, while the two most common methods of instructional deliverv'
(live lectures and video presentations) were significantly less effective in the majority of
the comparisons.

TABLE OF CONTENTS
I. INTRODUCTION 13
II. BACKGROUND 15
A. LECTURES 15
B. VIDEO 15
C READING 15
D. AUDIO 16
E. COMPARISON OF TRAINING METHODS 16
III. INITIAL EXPERIMENTAL DESIGN 18
A. SHIPBOARD TRAINING METHODS 18
B. CHOOSING A RANDOM SAMPLE 19
C ADMINISTERING THE EXPERIMENT 19
D. SELECTING THE APPROPRIATE TRAININGMATERIAL 20
E. WRITING THE TRAINING DOCUMENT 20
F. ASCERTAINING SUITABLE BACKGROUNDINFORMATION 21
IV. EXPERIMENTAL PROCEDURES 22
A. SHIPBOARD TRAINING METHODS COMPARED 22
B. WRITING THE TRAINING MATERIAL 23
1
.
Development 23
2. Length 23
3. Readability 23
C. SELECTION OF THE REPRESENTATIVE SAMPLE 25
D. THE TR.'\INTNG SESSION 25
E. ADDITIONAL BACKGROUND INFORMATION 26
F. VARIABILITY OF THE RESULTS 26
V. RESULTS 28

A. INPUT DATA 28
B. THE CRITICAL LEVEL 28
C. DATA ANALYSIS 29
1. Data Display 29
2. Techniques of Analysis 29
D. GOODNESS OF FIT RESULTS 30
E. ANALYSIS OF THE BACKGROUNDQUESTIONNAIRE DATA 31
1. Amount of Sleep Before the Retention Test 32
2. Time Since Last Civilian School 32
F. ANALYSIS OF THE INITIAL TEST SCORES 33
G. ANALYSIS OF THE RETENTION TEST SCORES 34
H. ANALYSIS OF THE OLD QUESTION SCORES 35
I. ANALYSIS OF THE NEW QUESTION SCORES 35
J. EFFECTS DUE TO STUDYING 37
K. CONCLUSIONS 37
VI. RECOMMENDATIONS 39
APPENDIX A: GENERAL DAMAGE CONTROL - FIREFIGHTING 41
1. THE NATURE OF FIRE 41
2. THE CLASSIFICATION OF FIRES 41
3. EXTINGUISHING AGENTS 42
4. FIREFIGHTING EQUIPMENT AND SYSTEMSAVAILABLE ..... 44
5. REPORTING A FIRE / INITIAL ACTIONS 61
APPENDIX B: CASE STUDIES AND ANSWER KEYS 65
1. CASE STUDY 1 65
2. ANSWER KEY 1 66
3. CASE STUDY 2 67
4. ANSWER KEY 2 68
APPENDIX C: DAMAGE CONTROL GLOSSARY 71
APPENDIX D: BACKGROUND QUESTIONNAIRE 73

APPENDIX E: READABILITY ANALYSES 74
1. DALE-CHALL FORMULA (REFERENCE 27) 74
2. FRY READABILITY GRAPH (REFERENCE 4) 15
3. GUNNING FOG INDEX (REFERENCE 12) 75
4. RESULTS 77
APPENDIX F: INPUT DATA 78
\. ALL TEST SCORES 78
2. EQUAL GROUP SIZE DATA SCORES 78
3. BACKGROUND QUESTIONNAIRE RESULTS 79
APPENDIX G: COMPUTER PROGRAMS 81
1. CHI-SQUARE GOODNESS OF FIT TEST 81
2. ANOVA AND INDIVIDUAL DEGREES OF FREEDOMTESTS 83
3. ANOVA AND TWO SAMPLE TESTS 87
APPENDIX H: STATISTICAL ANALYSES 96
1. CHI-SQUARE GOODNESS OF FIT TEST RESULTS 96
2. ALL TEST SCORES 96
3. EQUAL GROUP SIZE DATA 102
4. BACKGROUND QUESTIONNAIRE RESULTS 107
LIST OF REFERENCES .'
., 110
BIBLIOGRAPHY 113
INITIAL DISTRIBUTION LIST 114

LIST OF TABLES
L WEEKLY TRAINING FOR HULL TECHNICIANS 13
2. SHIPBOARD TRAINING METHODS TO BE COMPARED 18
3. SHIPBOARD TR.MNTNG METHODS COMPARED 22
4. TR.MNTNG SESSION TIMES 24
5. INITIAL READABILITY LEVELS 24
6. TRAINING METHOD CODING 29
7. GOODNESS OF FIT RESULTS 31
8. BACKGROUND QUESTIONNAIRE ANOVA RESULTS 31
9. SLEEP BEFORE THE RETENTION TEST ANALYSES 32
10. ANALYSIS OF TIMES SINCE LAST CIVILIAN SCHOOLING 32
11. INITIAL TEST
12. INITIAL TEST
13. INITIAL TEST
ANOVA RESULTS 33
INDIVIDUAL DEGREE OF FREEDOM . . . 33
TWO SAMPLE TESTING 34
14. RETENTION TEST: ANOVA RESULTS 34
15. RETENTION TEST: INDIVIDUAL DEGREE OF FREEDOM 34«
16. RETENTION TEST: TWO SAMPLE TESTING 35
17. OLD QUESTIONS: ANOVA RESULTS 35
IS. OLD QUESTIONS: INDIVIDUAL DEGREE OF FREEDOM 35
19. OLD QUESTIONS: TWO SAMPLE TESTING 36
20. NEW QUESTIONS: ANOVA RESULTS 36
21. NEW QUESTIONS: INDIVIDUAL DEGREE OF FREEDOM 36
22. NEW QUESTIONS: TWO SAMPLE TESTING 36
23. CRITICAL LEVELS FOR H,-,: ^3 = ^^ 38
24. AUDIO PRESENTATION TIME SAVINGS 38
25. DALE-CHALL CORRECTION TABLE 75
26. GUNNING FOG INDEX RATINGS 77

LIST OF FIGURES
A.l All Purpose Nozzles 45
A.2 All Purpose Nozzle on High Velocity Water Fog 45
A.3 Removing a High Velocity Tip (APN) 46
A.4 Bayonet Joint on an Applicator (APN) 46
A.5 Solid Stream (APN) 46
A.6 Standard Applicators 47
A.7 Piercing Applicator . 48
A.8 Firehose Properly Rigged at Fire Station 48
A.
9
No. 1 Hose and No. 2 Hose in Action 49
A. 10 Installation of a Jumper Line 50
A. 1
1
Mechanical Foam Nozzle and Pickup Tube 51
A. 12 Nav\' Pickup Unit (NPU) Nozzle Assembly 52
A. 13 FP-180 Water Motor Proportioner 53
A. 14 Single Hose Reel '. 54
A. 15 Various Variable Stream AFFF Nozzles 55
A. 16 AFFF Spray Pattern Control 55
A. 17 Configurations of the Twin Agent System 56
A. 18 15-Pound CO2 Extinguisher 58
A. 19 Dry Chemical Extinguisher 60
E.l Fry Readability Graph 76

TABLE OF SYMBOLS
SYMBOL DEFINITION
a Alpha level; level of significance
a^ Critical level
Hq Null hypothesis
Hj Alternate hypothesis
]i^ Population mean of the test
scores from method A
cr^" Population variance of the test
scores from method A
10

TABLE OF ABBREVIATIONS
ABBREVIATION
ALL
ANOVABEcfeE
CNETINST
CRTLVL
DCADF
ESWS
EQUAL
FSTAT
GPA
HT
i.e.
MSNTC
NTSC
OPNAVINST
PQS
RGL
RTC
SS
SSC
STD DEV
U.S.
WPM
MEANING
Ail Seventy Test Scores
Analysis of Variance
Basic Electricity and Electronics
Chief of Naval Education and
Training Instruction
Critical Level
Damage Control Assistant
Degrees of Freedom
Enlisted Surface Warfare Specialist
Groups of Equal Size
Test Statistic for the F-test
Grade Point Average
Hull Technician
That is
Mean Square
Naval Training Center
Naval Training Systems Center
Naval Operating Instruction
Personnel Qualification Standards
Reading Grade Level
Recruit Training Command
Sum of Squares
Service School Command
Standard Deviation
United States
Words Per Minute
11
ACKNOWLEDGEMENTS
I gratefully acknowledge the following personnel from the Naval Training Center,
Orlando. Florida, for their support and discussions while performing the experiment:
LCDR Wright, EMCM McLaughlin, TMCM Arendts, TMCM Loechner, and Senior
Chief Hewitt from the Basic Electricity and Electronics School; HTCM Hannan and
AQCS Plocar from the Recruit Training Command; and Dr. Bob Evans. Dr. Dennis
Wightman, Dr. Bob Ahlers, Dr. Cher\'l Hamel, and Dr. Jim Driskell from the Human
Factors Division of the Naval Training Systems Center. Special thanks go to LCDRMike Lilienthal for his guidance and support. Additionally, in Pensacola, Florida, Dr.
Carl Williams support was greatly appreciated.
At the Naval Postgraduate School, thanks go to CDR Charles Hutchins. LCDRMark Vlitcheil. LCDR Chris Schnedar. and Professor Glenn Lindsay for their ideas
and encouragement, and especially Professor Doug Neil for providing source materials,
ideas and encouragement.
Finally,- to my wife. Sherrill. go my deepest thanks for her patience, her
understanding, and her support.
12

I. INTRODUCTION
A significant factor affecting the operational readiness of the surface Nav>' is the
training of personnel to operate and maintain shipboard systems and equipment;
because of this, the training of personnel is essential. Nevertheless, training programs
cannot be blindly initiated without due consideration of the cost of the program, the
amount of productivity lost, and the amount of knowledge gained. For example, a
senior Hull Technician (HT) has responsibilities in many areas which require him to
attend numerous training lectures either as a lecturer or as a trainee (Table 1). In fact,
the HT can spend over twenty percent of his workday involved in training. Therefore,
in order to maximize the amount of work completed, training programs aboard ship
must be efficient as well as effective.
TABLE 1
WEEKLY TRAINING FOR HULL TECHNICIANS
NUMBER OF LENGTH OFTYPE OF TRAINING LECTURES EACH LECTURE
Damage Control Pettv Officer 2 1 hourGeneral Damage Control 3 .5 hourFire Marshall 1 . .5 hourGas Free Engineer 1 .5 hourHull Technician 2 .5 hourSoundins and Securitv Watch 1 .5 hourDamaeeTontrol Central Watch 1 .5 hourTeam Trainine-Inport Fire Drill 2 .5 hour-Inport Fire Partv 2 .5 hour-At Sea Fire Partv 1 .5 hour-Helicopter Fireflghting 1 .5 hour-Accident and Incident 1 .5 hour
An explanation of the factors used in determining the effectiveness and efficiency
of a training program is as follows: the preparation cost includes the man-hour
investment, the development of repeatable programs (with and without instructors),
and the length of the lecture; while the material cost is the cost of the training
equipment [Ref 1: pp. 70-74]. The amount of productivity lost is a function of
whether training is held during working hours and how long the training session lasts.
Finally, to determine the amount of knowledge gained, the test results of a group that
has completed training are compared with the test results prior to training.
13

Currently the common methods of instructional delivery used in the surface Navy
are lectures given by subject matter experts, lectures on videotape, and silent reading.
Audio presentations are used to a limited extent. Research indicates that each of these
methods have strengths and weaknesses [Refs. 1,2,3,4], but what the research literature
does not show are comparisons of training effectiveness among the methods.
Therefore, the intent of this study was to determine which methods of instructional
delivery' are the most effective and efficient by contrasting the preparation and material
costs and the amounts of productivity lost and knowledge gained in each method.
The format of this paper is as follows: Chapter II summarizes the results of past
research done on the individual methods, Chapter III describes the initial experimental
design of this study, and Chapter IV contains the procedures used to compare the
common methods of instructional delivery* in the surface Navy. The results of the
experimental data's statistical analyses are in Chapter V. while this study's
recommendations are presented in Chapter VI.
14

II. BACKGROUND
A literature review suggests that most research efforts have been directed at
individual training methods' strengths and weaknesses [Refs. 1,2,3,4]. Only one study
was found which compared the effectiveness of various presentation methods [Ref 5].
This chapter will summarize the results of past research on four individual methods
{live lectures, video presentations, silent reading, and audio presentations) and on the
one study which compared the various training methods.
A. LECTURES
Lectures are presentations of course content by an instructor to a group of
trainees who remain passive during the period of instruction. Lectures may be in the
form of live, video, or audio presentations and are often the most cost efTcctive type of
training. The preparation time is only two to eight man-hours per hour of instruction
and the instructors' skill level does not need to be high in comparison to other traming
approaches. Frequently, a problem with using lectures is the lack of observable trainee
response during the presentation. Also, in view of the fact that the transfer of learned
behavior from the lecture to the job situation is frequently difficult, it is better to use
hands-on training to accomplish this objective. [Ref. 1: pp. 71-74]
B. VIDEO
Training by television (i.e., a video presentation) is an effective method of
instructional delivery that yields high knowledge retention levels in the trainees and is
generally preferred to conventional classroom instruction [Ref 2: p. 23]. The only
possible drawback would be the material cost when a video system is not already
available.
C. READING
Reading is a process of comprehending language through print, regardless of the
volume of material considered. The accuracy of comprehension is affected by the
purpose for which one reads, whether for enjoyment or learning, and comprehension
decreases in a roughly linear fashion with increasing reading rates. The norm reading
rate is 185-300 words per minute (wpm). [Ref 3]
15

The readability of an article refers to the ease or difiiculty of reading the material,
and the readability level is the equivalent grade level of the article. In order to achieve
high comprehension levels, the readability level should be equivalent to the reading
ability of the trainees. [Ref 4: pp. 3-4]
D. AUDIO
Auding is defined as the process of listening to speech to understand the thoughts
presented by the speaker. Compressed speech is recorded speech which is presented in
less than its original time by using a variable speed, pitch control tape recorder. In the
many studies comparing comprehension level with the rate of auding, a rapid decline in
comprehension was noted when the deliver\' exceeded 275 wpm, regardless of the
percent compression used to achieve that word rate. As a comparison, the norm
auding rate in ever>'day situations is 125-200 wpm. [Ref 3]
Other conclusions reached in the studies on audio presentations were: (1)
trainees were noticeably less fatigued [Ref 6: p. 17], (2) the higher the auding rate, the
more the trainees concentrated [Ref 7], (3) comprehension improved or remained
constant from 125 to 275 wpm [Ref 8], (4) retention followed the same patterns as it
did for listening normally or reading [Ref 8], (5) trainees expressed favorable attitudes
[Ref 9], and (6)- some poor readers preferred to learn by listening rather than by
reading [Ref 10].
E. COMPARISON OF TRAINING METHODSDuring a class project in a Human Factors course at the Naval Postgraduate
School, the experimenter contrasted three methods of instructional deliver}' using an
experimental group and a control group [Ref 5]. The project was designed to compare
the comprehension levels of the groups in two different ways: {1) by reducing the
amount of time alloted for reading or listening to the training material, and (2) by
reinforcing the material in the video presentation with visual aids. The results
indicated that higher comprehension levels were obtained when using visual aids in
video presentations and when the speed of the audio presentations was increased.
However, the authors indicated that significant problems were encountered while
performing the experiment and recommended that these problems be corrected before
any further studies were conducted. The problems they experienced during the
experiment were:
• the control group was not maintained,
• the sample was not selected randomly,
16

•
the lengths of the training session varied significantly, and
guesswork type of questions were used.
By using this class project [Ref 5] as a pilot study, a detailed initial design was
developed to prevent the occurrence of these above mentioned problems while
comparing various methods of instructional delivery. This initial experimental design is
presented in the following chapter.
17

III. INITIAL EXPERIMENTAL DESIGN
This chapter discusses the initial experimental design. The design was developed
in preparation for performing the experiment at the Naval Training Center (NTC) in
Orlando, Florida. Setting up the initial design included deciding which training
methods would be compared, choosing a random sample of students, administering the
experiment, selecting the appropriate topic for training, writing the training document,
and ascertaining suitable background information on trainees. A discussion of these
subjects follows.
A. SHIPBOARD TRAINING METHODSThe shipboard training methods utilized most frequently are live lectures, video
presentations, and silent reading. To a limited extent, audio presentations are also
used for training. Therefore in this experiment, nine different methods of instructional
delivers' were to be compared (see Table 2). Live lectures and video presentations were
to be contrasted using the presence of visual aids as the source of variation, while the
variation in the audio presentations and the silent readings was time. In order to
determine if any knowledge was gained by attending these training lectures, the
students in the control group were to be tested to establish the current knowledge level
of the trainees.
TABLE 2
SHIPBOARD TRAINING METHODS TO BE COMPARED
METHOD VARIATION
Live lecture ' with visual aidsLive lecture without visual aidsVideo presentation with visual aidsVideo presentation without visual aidsAudio presentation norm auding rateAudio presentations 33°o compressionSilent readin2 norm reading rateSilent reading 33'^o less timeControl group no training given
18

B. CHOOSING A RANDOM SAMPLE
The students in the nine training method groups were to be chosen randomly
with approximately twelve members per group. Although not carried out (see Chapter
IV - section C), the initial plan was to contact all commands at the Naval Training
Center requesting lists of assigned personnel. These lists were to be numbered and a
sample of 150 names selected using a random number generator. Since training
effectiveness depends on such factors as morale and enthusiasm [Ref 11: p. 183], extra
names were selected to give an individual the option of not participating in the
experiment (i.e., to increase the chances of having all volunteers in each group). It was
believed that a volunteer's morale and enthusiasm would be at a higher level than an
individual who was required to attend training.
C. ADMINISTERING THE EXPERIMENT
Each of the eight training sessions (no training would be given to the control
group) was planned to last approximately thirty to forty-five minutes. An additional
fifteen minutes would be allowed to answer fifty questions testing comprehension, and
approximately one week, later, the students would have another fifteen minutes to take
a second exam measuring retention. To reduce the possibility of guessing, both tests
were to be '^titten using fill in the blanks and short answer essays instead of multiple
choice and true; false questions.
To maintain consistency between the groups, all of the presentations were to
have the same instructor and were to be administered during the same time o.f day
without a question and answer period at the end. The same instructor was necessar\'
to ensure that each session was presented similarly, no matter which method of
instructional deliver^' was used. The time of day that the training was given was
important because crew attitudes and productivity were affected: if it was held during
working hours, attitudes were usually positive but some productivity was lost, while if
it was held after working hours, production time would be preserved but trainee
attitudes were often negative. More importantly, training performance after working
hours was not as satisfactory as performance in the same programs held during
working hours [Ref 1: p. 103]. However, since the experimenter had no control over
the NTC Orlando commands, all training sessions had to be scheduled after working
hours.
19
The purpose of not having a question and answer period was to prevent a
possible bias on the exam for the group asking the question. For instance, if a
question was asked and answered after the live lecture with visual aids, that group
would have a better chance of correctly answering that particular part of the exam
since they had been instructed on that particular material more than the other groups.
D. SELECTING THE APPROPRIATE TRAINING MATERIAL
Due to the anticipated diverse ratings of the randomly selected personnel, the
topic chosen for training should not be specific to a few rates, but should be more
general, as in an all hands type of training. General Damage Control - Firefighting is a
type of shipboard training required to be completed by all hands within their first six
months onboard and was the subject matter chosen for this study. A problem that
needed to be considered when firefighting was chosen as the subject of training was
the varying levels of damage control knowledge among personnel aboard ship. It was
believed, though, that the sample would closely represent these varied levels due to the
randomly selected individuals coming from different rates, different paygrades. and
different warfare communities.
E. WRITING THE TRAINING DOCUMENTThe readability of the material must be considered when a training document is
written. For Instance, if a trainee encounters material far beyond or even slightly
beyond his present reading ability, he may become discouraged and consider himself a
failure, but if he can read the material and comprehend it easily, hd will experience a
sense of accomplishment [Ref 12: pp. 2-3].
Readability research has been conducted involving many affective elements such
as vocabulary, sentence length, sentence structure, and linguistic factors. Three of the
more common methods of determining readabihty are the Dale-Chall Formula, the Fr\-
Readability Graph, and the Gunning Fog Index. Of these. The Dale-Chall method is
considered the most accurate. The Dale-Chall technique also has the most consistently
comparable results in terms of both correlational and grade placement data, and has
more of the high intercorrelations with other readability techniques. [Ref 4: pp. 31.36]
These readability formulas were originally designed to test the material after it
was written. Now they are also used during the writing phase. When usmg the
readability methods in this manner, there is a possibility of misunderstanding the
original content of the article [Ref 13: p. 95]. This type of problem occurs when text
20
revisions are made to achieve a specific equivalent grade level. Therefore, before this
study's training document can be used, it must be reviewed for its accuracy and its
overall content.
All three readability techniques mentioned previously were planned to be used to
compute the equivalent grade level of this study's firefighting training document. The
procedures for using these methods are contained in Appendix H, "Readability
Analyses."
F. ASCERTAINING SUITABLE BACKGROUND INFORMATION
At the initial training session, each student was to fill out a background
questionnaire. The information obtained here was to be used to determine if there
were any outliers in the sample. Outliers are "very small or very large values which are
so far removed from the mainbody of the data that the appropriateness of including
them in the sample is questionable." [Ref 14: p. 33]
Other suitable information for this type of study were the high school grade point
average (GPA), the amount of civilian schooling received, the Personnel Qualification
Standards (PQS) completed or in progress, the last time the trainee was in school, the
types of jobs held, and the amount of sleep received. The complete background
questionnaire is contained in Appendix D.
After some revisions were made to this initial design, the experiment was
conducted at the NTC in Orlando, Florida. The details of the procedures used to
perform this experiment are contained in the next chapter.
21

IV. EXPERIMENTAL PROCEDURES
This experiment was conducted at the Naval Training Center in Orlando, Florida,
from 12 May to 13 June 1986. Major changes in the initial design occurred in the
following areas:
• the methods of instructional delivers' to be compared,
• the sample selection, and
• the time of day training was held.
In addition to these changes, the following topics are also discussed in this chapter:
the writing of the training document, the administering of the training session, the
additional background information, and the variability of the results.
A. SHIPBOARD TRAINING METHODS COMPAREDIn the initial design, the intent was to compare live lectures and video
presentations to determine what effect the presence of visual aids had on
comprehension, while the audio presentations and the silent readings were to be
compared using time as the factor of variability (Table 2). Since the purpose of this
study was to determine which methods of instructional delivery were the most effective
and efficient, the nine training methods initially planned were changed to the seven
methods shown in Table 3. Also, all of the seven training methods (except the control
group) used visual aids in their presentations.
TABLE 3
SHIPBOARD TR.'MNING METHODS COMPARED
GROUP METHOD SPEED VARIATION
1 Live lecture normal2 Video presentation normal3 Silent reading normal4 Control group no trainina 2iven5 Audio presentation 1.0 x normal6- Audio presentation 1.25 x normal
—4, 5 total time7 Audio presentation 1.5 x normal—2/3 total time
22

B. WRITING THE TRAINING MATERIAL
1. Development
The training material, "General Damage Control - Firefighting" (Appendix A),
and the two case studies and answer keys {Appendix B) were developed utilizing the
shipboard General Damage Control Personnel Qualification Standards as a basis. The
PQS sections referenced covered Alpha, Bravo, Charlie, and Delta fires, and the
training document was written by combining the corresponding sections contained in
the Hull Maintenance Tech 3 & 2 manual and several Damage Control Yellow Books
[Refs. 15,16,17,18,19,20,21,22,23]. Additionally, subject matter experts were used to
write the material and to review it for its authenticity: a surface ship Damage Control
Assistant wrote it, and the division officer of the Recruit Training Command (RTC)
Damage Control School, Orlando, Florida, reviewed the material.
2. Length
As initially designed, the plan was for the training session to last between
thirty and forty-five minutes. Since the majority of the methods of instructional
delivery' compared were lectures. Reference 3's norm auding rate of 125 wpm was used
as a guideline in the initial development phase. Thus, using this word rate, the goal for
the length of the article was between 3750 words (thirty minutes) and 5625 words
(forty-five minutes).
After an initial writing with approximately 12,000 words and several revisions
that followed, the final length of the training document was 5630 words. This length
led to actual session times (in minutes and seconds) shown in Table 4. The thirty five
minutes alloted for the reading session led to a 161 word per minute reading rate which
was below the norm range of 185-300 wpm [Ref 3: p. 14]. This lower rate allowed the
student to have more time reading the material than the norm reading rate would of
allowed.
3. Readability
As stated previously. The training document had to be written in a manner
that was easily understood. According to Reference 24, many sailors lack the reading
skills necessary to cope successfully with school reading materials. In fact, the Chief of
Naval Operations has stated that "a substantial proportion of recruits read below the
tenth grade level." [Ref 24: p. 3] This statement is verified in the statistics for the
6.698 recruits entering the U.S. Nav\- in March 1986: 32.44% read below the tenth
grade level with an overall average reading grade level (RGL) of 9.7 [Ref 25].

TABLE 4
TRAINING SESSION TIMES
GROUP TR.MNTNG METHOD TIME
1 Live lecture 38:152 Video presentation 42:003 Silent reading 35:004 Control group5 Audio 1.00 33:156 Audio 1.25 26:157 Audio 1.50 22:00
OPNAVINST 1510.11 established a ninth grade reading ability as the minimum
competency level for enlisted personnel. All recruits reading below this level (as
measured by the Gate-MacGinitie Reading Tests) are given remedial instruction
[Ref. 26: p. 10]. The March 1986 Recruit RGL Statistics showed that 22.93% read
below this ninth grade level, and hence, received remedial instruction.
With these facts in mind, the Dale-Chall Formula, the Fr\' Readability Graph,
and the Gunning Fog Index were used to write the training document on or below the
ninth grade level. As required by each of these methods and due to the article's length,
twelve 100-word samples were randomly chosen. The overall readability level was then
computed by averaging the twelve samples' readability levels. Table 5 lists the initial
results obtained by using the procedures described in Appendix E. As seen by the data
in this table, all results were comparable with the Dale-Chall method. Therefore, all
additional readability level computations were made using the Dale-Chall Formula.
TABLE 5
INITIAL READABILITY LEVELS
TECHNIQUE EQUIVALENT GR.ADE LEVEL
Dale-Chall Formula 11-12Fr\' Readabilitv Graph 13Gunning Fog Index 12-13
The first revision resulted in a 9-10 equivalent grade level with many words of
the document still not on the Dale-Chall list of 3000 common words
[Ref 27: pp. 45-54]. Many of these uncommon words were technical words or Nawwords and acronyms (i.e., AFFF, underway, valve, missile, and equipment) which have
no substitutes. Therefore, as recommended by Reference 24, a supplemental list or
24

glossary was constructed (Appendix C). A final equivalent grade level of 7-8 was
achieved when the glossary was used, and in March 1986, only 6.78% of all recruits
entering the Navy read below the seventh grade level [Ref 25].
C. SELECTION OF THE REPRESENTATIVE SAMPLE
Instead of contacting the major commands at the Naval Training Center in
Orlando as planned, previously established rules and regulations had to be followed.
In accordance with CNETINST 3920. IF of 3 April 1986, a request for use of trainees
to provide research data was initiated. Permission was granted to use seventy Basic
Electricity and Electronic (BE&E) students from the Service School Command in
Orlando, Florida. Most of the seventy trainees volunteered for this experiment while
the rest were selected at random by the school.
A benefit gained by using this sample was a reduction in the overall variability of
the experiment. Since the only firefighting instruction the trainees received was given
at RTC, none of the test scores should be biased because of a student's background:
they all received eight hours of classroom instruction and three hours of hands-on
training. The only difference among the students was the amount of time since they
had the training (although not recorded, it fell somewhere between six weeks and six
months). Therefore, since ail enlisted personnel receive the same amount of instruction
at Recruit Training Command and the individual's damage control background level
was not a factor of variability, the results of this study can be applied to all enlisted
personnel in- the Navy.
D. THE TRAINING SESSION
To maintain consistency between the groups, each training session was conducted
in the same room by the same instructor (a subject matter expert). Permission was
also granted to conduct all of the training sessions during the workday (instead of at^ter
working hours as originally planned), and hence, each trainee should have had a
positive attitude.
Before any training began, the following two points were explained:
1. To prevent a possible bias on the exam, questions were not allowed to be askeddurmg the sessions.
2. Notes could be taken for study purposes, but thev could not be used during anyexam.
During the training sessions, the same document used by Group 3 (the silent
reading group) was also used by the instructor for the live, video, and audio
25

presentations. Overhead slides were substituted for the figures contained in the article.
Immediately following these sessions, the trainees were given twenty-five minutes to
take a fifty point test measuring comprehension, and about a week later, each student
had thirty five minutes to answer a fifty point retention test. The first half of the
retention test consisted of questions similar to those asked on the initial test {"old"
questions), while the second half dealt with topics discussed in the lecture but not
asked for on the initial test ("new" questions). Both tests were wTitten as case studies
requiring short essays for answers.
E. ADDITIONAL BACKGROUND INFORMATION
In addition to completing a background questionnaire during the initial session,
the following questions were asked at the retention session:
1. How much sleep did you get last night?
2. How much studying did you do
a. with your notes from last week's training session?
b. with your notes from Recruit Training Command?
c. in group study?
Again, these questions were asked for use in checking for outliers, and additionally, to
determine if studying influences the trainees' results on the retention test.
F. VARIABILITY OF THE RESULTS
The differences in test results should be attributable only to the method of
instructional deliver^' used because the following items were controlled:
The same training document was used throughout the experiment.
A low readability level was achieved.
Visual aids were used in all training sessions.
All trainees had previously received the same amount of instruction infirefighting.
The training sessions were given in the same room.
The training sessions were given by the same instructor.
All of the training sessions were given during the work day.
Questions were not allowed to be asked during the training session.
Case studies were used instead of tests with guesswork type of questions.
Time liirdts were imposed for taking tests.
26

The results of comparing the training methods for effectiveness and efficiency and
the conclusions which can be drawn from these results are discussed in the next
chapter.
27

V. RESULTS
The results from the initial test, the retention test, the old questions, and the new
questions were compared using one-way analysis of variance (ANOVA), individual
degree of freedom ANOVA, and two-sample tests. In addition to the above analyses, a
discussion of the following items is presented in this chapter: the input data, the
critical level, the data analysis approach, the goodness of fit results, an analysis of
background information, and an analysis of the effects due to studying. Finally, the
conclusions reached in this study are given at the end of this chapter.
A. INPUT DATA
Another precaution taken to reduce the variability of the results was to use the
same person to grade all of the exams. One of the previously mentioned subject matter
experts, the Damage Control Assistant, graded the initial and retention tests. These
test scores were used as input data in this experiment and are listed in Appendix F,
"Input Data."
B. THE CRITICAL LEVEL
In hypothesis testing, a Type I Error is defined as rejecting the null hypothesis
(Hq) when the null hypothesis is true. The probability of committing this type of error
is the te.st's a level or level of significance, and this level of significance defines the
probability level that is considered too low to warrant support of the hypothesis being
tested. For example, if the probability of the occurrence' of the observed data values
(when Hq is true) are smaller than the preset a level, then the data is said to contradict
the null hypothesis and a decision is made to reject Hq. A common value for a is .10.
[Ref 28: p. 10]
In significance testing, the critical level (o.^) is defined as the minimum level of
significance required to reject the null hypothesis. It is found by comparing the
computed test statistic with the tabled chi-square. normal, F, or t values as appropriate
and then selecting the corresponding p-value. If the test statistic is between two values
in the table, the critical level is determined by interpolating the corresponding p-values.
Throughout this study, the critical levels computed in each analysis were
compared to an a level of .10: if t/j? was less than or equal to .10 (i.e.. sufilciently
28
small), then the null hypothesis was concluded to be false. Conversely, if the critical
level was greater than .10, then Hq was concluded to be true.
C. DATA ANALYSIS
1. Data Display
Before proceeding with the analysis, a description of this study's data display
is presented. In analyzing the test scores, the methods of instructional delivery were
coded by group number as listed in Table 6. Also, the results analyzed in this chapter
used two different forms of the data:
• ALL - all seventy test scores
• EQUAL - groups of equal size
The second form of data was used because the individual degree of freedom ANOVAtechnique requires the same number of data points in each group. Since group sizes
varied (see Table 6), a random number table was used to reduce the number of data
points in each group to eight [Ref 14: p. 579-82]. The results of this random reduction
of test scores is listed in Appendix F, "Input Data."
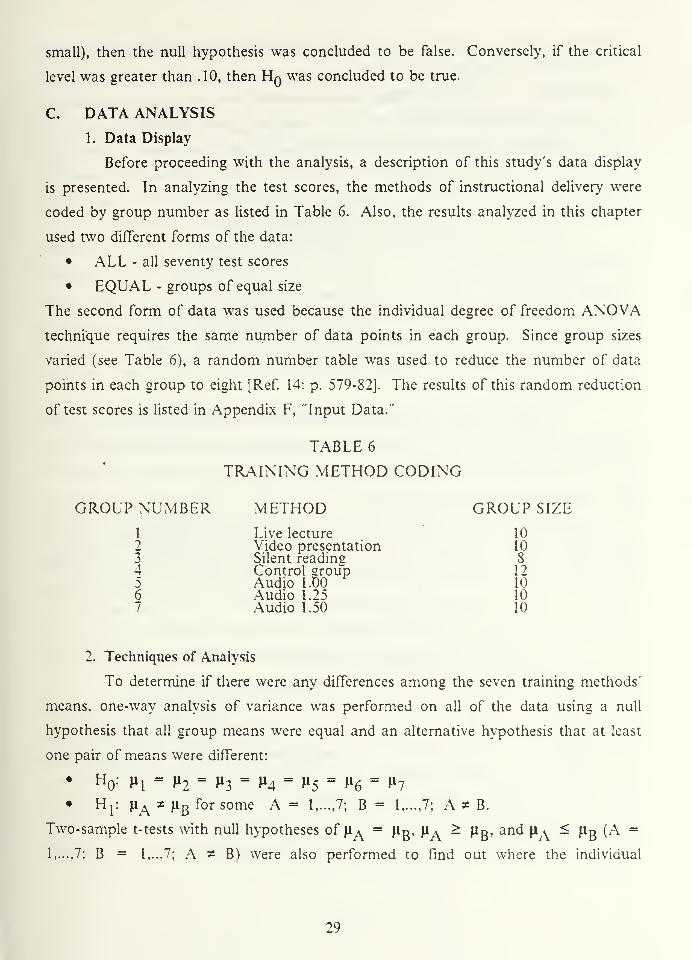
TABLE 6
TRAINING METHOD CODING
GROUP NUMBER1
234567
2. Techniques of Analysis
To determine if there were any differences among the seven training methods'
means, one-way analysis of variance was performed on all of the data using a null
hypothesis that all group means were equal and an alternative hypothesis that at least
one pair of means were different:
• Hj: ^^ * ^3 for some A = 1,...,7; B = 1,...,7; A x B.
Two-sample t-tests with null hypotheses of ]ij^ = fig, n^ > ^g, and n^ < ^g (A =
1,...,7: B = 1,...7; A ^ B) were also performed to fmd out where the individual
29
METHOD GROUP SIZE
Live lecture 10Video presentation 10Silent reading 8Control eroup 12Audio 1.00 10Audio 1.25 10Audio 1.50 10

differences were if the result of the ANOVA was significant. Since equal variances is
an assumption of the two-sample t-test, the two-sample F-test (Hq: <t^^ = a-^g) was
performed first. If the critical level computed in the F-test was highly significant (ao
^ .05), then the Welch technique was used to compute the Oj^s instead of t-tests. The
Welch technique does not require the variances of the two samples to be equal.
Reference 29 contains the procedures necessar>' for using the one-way analysis of
variance and two-sample testing techniques, and these procedures were written into the
"All Data ANOVA and Two Sample Tests" computer program in Appendix G.
Another technique used to compare the differences among the training
methods was individual degree of freedom analysis of variance. The procedures
necessary for using this technique were found in Reference 30 and were written in the
"ANOVA and Individual Degree of Freedom Tests" computer program (Appendix G).
In addition to performing the one-way and individual degree of freedom analysis of
variance techniques on the equal group size data, two-sample tests were also
performed.
The results from all four analyses of test scores (initial test, retention test, old
question, and new question) are presented in sections F - I of this chapter, while a
more detailed output is listed in Appendix H. ^
D. GOODNESS OF FIT RESULTS
An assumption when using analysis of variance and two-sample tests is that the
data came from a normal distribution. The Chi-square goodness of fit test
[Ref. 29: pp. 527-37] was used to compare the test scores from the initial test, the
retention test . the old questions, and the new questions to normal distributions. To
determine if the sample of students chosen had a reference distribution of learning that
was normally distributed, the high school grade point averages from the background
questionnaire were also compared to a normal distribution.
For each of these five groups of data (initial test, retention test, old question,
new question, and GPAs), the test scores from the seven training methods were
aggregated. The averages of the seven methods' means and standard deviations were
computed and then used as input in the "Chi-square Goodness of Fit"computer
program (Appendix G). This program calculated the critical levels required to reject
the null hypothesis that the data was normally distributed. Because this data was
aggregated, there was a strong possibility that the null hypothesis would be rejected if
30

one or more of the methods of instructional delivery were significantly more effective.
If Ha was rejected, then the test scores of each training method would have to be
compared to separate normal distributions before any further analyses could be
preformed. Since all the aj^s in Table 7 were greater than .10, it was concluded that all
of the data was normally distributed, and therefore, no further Chi-square goodness of
fit tests were required.
TABLE 7
GOODNESS OF FIT RESULTS
DATA a^
Initial test .235Retention test .167Old question .138New question .504GPAs .214
E. ANALYSIS OF THE BACKGROUND QUESTIONNAIRE DATA
Before analyzing the results from the two tests, the data obtained from the
background questionnaire was examined to determine if any biasing existed in the
seven groups (i.e., to find factor(s) that might influence an individuals' test scores).
This was accomplished by performing one-way ANOVA on the data to determine the
critical levels required to reject the hypothesis that the group means were all equal. As
shown in Table 8, further analysis was required with the two items having a j^'s less
than .10.
TABLE 8
BACKGROUND QUESTIONNAIRE ANOVA RESULTS
BACKGROUND DATA aj^
Grade point average .907Time since last civilian school .092Averase amount of sleep each nieht .353Amount of sleep before the mitial test .572Amount ot sleep before the retention test .081Years of School completed .448
31

1. Amount of Sleep Before the Retention Test
The two-sample tests for equality of means between the group with the least
amount of sleep (silent reading: 4.375 hours) and the group with the most amount of
sleep (video presentation: 7.15 hours) showed no difference in retention test, old
question, and new question scores (Table 9). Hence, it was determined that there was
not an effect among the groups due to the amount of sleep received before the
retention test.
TABLE 9
SLEEP BEFORE THE RETENTION TEST ANALYSES
TEST
RetentionOld questionsNew questions
READING
22.12516.5005.625
VIDEO
21.3016.654.65
aR.64756.85960.45905
2. Time Since Last Civilian School
There were four individuals who were found to have long lengths of time (6, 7,
8, and 10 years) since their last civilian school. As Table 10 shows, these individuals
had actual test scores greater than their respective groups' mean test scores the
majority of the time (Overall - 9 of 16). Also, those individuals with more scores lower
than their respective groups' mean test scores had GPAs less than their group's average
GPA (6 & 8 years). Therefore, the length of elapsed time since the individuals attended
civilian school appeared to have no effect on their initial or retention test scores.
TABLE 10
ANALYSIS OF TIMES SINCE LAST CIVILIAN SCHOOLING
YEARS
67810
Overall
NUMBER OF TIMES> GROUP MEAN
of 4of 4of4of4of 16
RELATION TOGROUP'S AVER.AGE GPA
BelowAboveBelowAbove
It was therefore concluded that the background information obtained did not
lead to any biasing among the groups.
32

F. ANALYSIS OF THE INITIAL TEST SCORES
First, an explanation of the data in the individual degree of freedom ANOVAand the two sample testing tables is necessar>\ The notation ABC = DEF in the
individual degree of freedom ANOVA table states that methods A, B, and C have the
same mean as methods D, E, and F. In the two-sample testing table, the aj^
associated with the notation ABCD ^ E is the maximum a^ for all tests comparing
the means from methods A, B, C, and D with the mean of method E.
Immediately following the training session, the initial test was given (Case Study
1 in Appendix B). Each student had a maximum of twenty-five minutes to complete
this initial test. As shown in Table 11, a significant difference among the means of the
seven methods of instructional delivery was found using one-way analysis of variance.
Further analysis (Tables 12 and 13) from all three techniques of comparison (individual
degree of freedom ANOVA and two-sample testing with all of the data and with
groups of equal size) were consistent in their results:
• it was better to train than not to train
• audio presentations were better than live lectures, video presentations, andsilent reading
• silent reading was better than live lectures in the two-sample testing usine theequal size dala.
TABLE 11
INITIAL TEST: ANOVA RESULTS
DATA a^
ALL .006EQUAL .001
TABLE 12
INITIAL TEST: INDIVIDUAL DEGREE OF FREEDOM
Hq: EQUAL MEANS a^
4 = 123567 .00100123 = 567 .00126
33

TABLE 13
INITIAL TEST: TWO SAMPLE TESTING
"o^ ^^A = H «R Hq: JiA ^ H «R123567 = 4 <.082 123567 < 4 <.04123567 = 4 <.017 123567 < 4 <.059567 = 1 <.107 567 < 1 <.053567 = 1 <.019 567 < 1 <.0096 =23 <.078 6 < 23 <.0535 = 23 <.181 5 < 23 <.0913 = 1 .093 3 < 1 .046
DATAALLEQUALALLEQUALEQUALEQUALEQUAL
G. ANALYSIS OF THE RETENTION TEST SCORES
Eight to ten days after the training session was administered, the retention test
was given (Case Study2 in Appendix B). Each student had a maximum of thirty-five
minutes to complete the retention test. As before, a significant difference among the
means of the seven methods was found (Table 14), and therefore, further analysis was
required (Tables 15 and 16). The results from the three techniques of comparison
were:
• it was better to train than not to train
• audio presentations at normal speed were better than live lectures and videopresentations
• audio presentations at 1.25 times normal speed were better than live lectures .
• silent reading was better than live lectures.
TABLE 14
RETENTION TEST: ANOVA RESULTS
DATA a^
ALL .04994EQUAL .04078
TABLE 15
RETENTION TEST: INDIVIDUAL DEGREE OF FREEDOM
Hq: equal means a^
4 = 123567 .00682123 = 567 .12299
34

TABLE 16
RETENTION TEST: TWO SAMPLE TESTING
DATA H0=^*A = H «R Hq: ^a ^ H «RALL 23567 = 4 <.071 123567 < 4 <.063EQUALALL
23567 = 4 <.064 23567 < 4 <.0325 = 1 .069 5 < 1 .035
EQUALALL
5 = 1 .054 5 < 1 .0275 = 2 .116 5 < 2 .058
EQUAL 5 = 2 .217 5 < 2 .108EQUAL 6 = 1 .136 6 < 1 .068EQUAL 3 = I .198 3 < 1 .099
•
H. ANALYSIS OF THE OLD QUESTION SCORES
The first half of the retention test consisted of questions similar to the ones asked
on the initial test. The results of the analyses of these "old" questions are listed in
Tables 17, 18, and 19. Here,
• it was better to train using video presentations, silent reading, and audiopresentations than not to tram
audio presentations at normal speed or at 1.25 times normal speed, videopresentations, and silent reading were better than live lectures
TABLE 17
OLD QUESTIONS: ANOVA RESULTS .
DATA a^
ALL .18372. EQUAL .03929
TABLE 18
OLD QUESTIONS: INDIVIDUAL DEGREE OF FREEDOM
Hq: equal means a^
4 = 123567 .00956123 = 567 .16141
1 = 2 .07648
I. ANALYSIS OF THE NEW QUESTION SCORES
Questions not asked on the initial test but whose topics were discussed during the
training session composed the second half of the retention test. The results of the
35

TABLE 19
OLD QUESTIONS: TWO SAMPLE TESTING
DATA^O-- ^A
= H «R Ho: Ha ^ H «RALL 23567 = 4 <.105 23567 < 4 <.053EQUALACL
2356 = 4 <.023 23567 < 4 <.0675 = 1 .159 5 < 1 .080
EQUALACL
56 = 1 <.047 56 < 1 < .0232 = 1 .205 2 < 1 .102
EQUAL 23 = 1 <.048 23 < 1 <.024
•
analysis of these "new" questions are presented in Tables 20, 21, and 22. .-Xs shown in
these three tables,
• it was better to train than not to train
audio presentations at normal speed were better than all other methods.
TABLE 20
NEW QUESTIONS: ANOVA RESULTS
DATA ap^
ALL .05614EQUAL .19699
TABLE 21
NEW QUESTIONS: INDIVIDUAL DEGREE OF FREEDOM
Hq: equal means a^
4 = 123567 .03^12123 = 567 .23536
TABLE 22
NEW QUESTIONS: TWO SAMPLE TESTING
DATA "O^ ^^A= H «R Hq: Ha - ^^B «R
ALL 13567 = 4 <.097 123567 < 4 <.0S4EQUAL 3567 = 4 <.066 13567 < 4 < .060ACL 5 = 12 < .088 5 < 123 <.095EQUALACL
5 = 12 <.1S1 5 < 12 < .0905=7 .091 5 < 67 < .087
EQUAL 5 = 7 .199 5 < 7 .099
36

J. EFFECTS DUE TO STUDYING
Six students reported studying for the retention test, and hence, the retention
test, the old question, and the new question scores of each of these six students were
analyzed (three scores from six students equaled eighteen cases). Of the eighteen cases,
studying influenced test scores in eight, while the test score's position relative to the
mean was unchanged in the remaining ten. Therefore, it was concluded that studying
had no adverse effects on the individuals' retention test scores.
K. CONCLUSIONS
As stated in Chapter I, the intent of this study was to determine the most
effective and efficient shipboard training methods. This was accomplished by
comparing the following factors in each method: the preparation costs (the man-hour
investment, the development of a repeatable program, and the lecture length), the
material costs, the amounts of productivity lost (a function of the time of day training
is held and the length of the lecture), and the amount of knowledge gained. Since the
same training document was used during all sessions, the developed program was
repeatable and the man-hour investment was the same for all groups. Additionally, all
training sessions were held during working hours, and no material costs were incurred.
Therefore, the only factors of effectiveness and efficiency remaining to be compared
were the amount of knowledge gained (effectiveness) and the length of the training
session (efficiency).
In the four areas of analysis (the initial test, the retention test, the old questions,
and the new questions), audio presentations at normal speed and at 1.25 times normal
speed were consistently the most effective methods of instructional deliver^'. In
addition, as shown in Table 23, there were no significant differences between the means
of these two audio presentations. On the other hand, the two most common training
methods in the surface Navy (live lectures and video presentations) were less effective
in the majority of the comparisons.
Additionally, since both of these audio presentations were completed in less time
than the more common types of training, the data suggests that these two methods
were also more efficient. Table 24 lists these time savings in minutes and seconds (i.e.,
the audio presentation at normal speed was completed in five minutes less time than
the live lecture).
37

TABLE 23
CRITICAL LEVELS FOR Hq: ^5 = n^
DATAALLEQUALIndividualDegrees of freedom
INITIAL
.90000
.74454
.70246
RETENTION OLD.32919.75570
.73411
.75605
.7825
1
NEW.17443.43679
.74957 .39139
TABLE 24
AUDIO PRESENTATION TIME SAVINGS
COMMON METHODLive lectureVideo presentationSilent reading
AUDIO 1.0
5:008:451:45
AUDIO 1.25
12:0015:458:45
Therefore, the audio presentation at normal speed and the audio presentation at
1.25 times normal speed were the most efTective and efficient methods of instructional
delivery in this study. Conversely, the most common shipboard training methods were
both less effective and less efficient than the other methods. ^
The recommendations of this study are presented in the next chapter.
38

VI. RECOMMENDATIONS
As stated in the preceding chapter, audio presentations at normal speed and at
1,25 times normal speed were the most effective and efficient methods of instructional
delivery in this experiment. Additionally, the following conclusions were reached in
other studies on audio presentations (stated previously in Chapter II):
1. Trainees who used speech compression finished sooner and were noticeably less
fatigued [Ref. 6: p. 17].
"^
2. Due to an increased number of inputs per unit of time (at higher auding rates),there were less lulls during which the mind can wander. Therefore, traineestended to concentrate more [Ref 7].
3. Coniprehension remained at least constant (in some cases it improved) from 125to 275 words per minute [Ref 8].
4. Retention of compressed speech followed the same patterns as it did forlistening normally or reading the material [Ref S].
5. Students expressed favorable attitudes toward the use of compressed speech asa primar\' mode for learnmg as well as a technique for review [Kef 9].
6. Some poor readers (i.e:, low RGLs) preferred to learn bv listening rather thanby reading [Ref 10].
Also, in Reference Si's study, large individual differences were obtained which
indicated that there was not one most efficient speed for ever>'one. However, this was
not a problem in this study because no significant differences were found comparing
the Audio 1.0 and the Audio 1.25 presentations. Hence, trainees have an ability to
adjust the tape recorder to find their most efficient speed. Therefore, in view of these
findings, it is highly recommended that variable speed audio presentations be used as a
method of instructional delivery in the surface Navy more frequently.
Finally, viewing the results of this experiment, the recommendations for further
study are: perform the experiment again (1) using speed listening (simultaneous
reading and listening) as an additional method of instructional delivery-, and (2) having
the same number of trainees in each training method group.
Speed listening is recommended as another training method because studies have
found
• it to be an effective alternative to reading [Ref 32].
• it improves reading comprehension and speed [Ref 8].
(Also, although not a problem in this study, the reason to have the same number of
students in each training method group is to eliminate the random reduction oC data
39

for the individual degree of freedom analysis of variance technique. Thus, all of the
data can be used in all of the analyses.)
This study has compared seven methods of instructional delivery to determine the
most effective and efficient shipboard training methods. It is hoped that the results of
this experiment will be incorporated into existing training programs in the surface
Navy.
40

APPENDIX A
GENERAL DAMAGE CONTROL—FIREFIGHTING
Fire is a constant potential hazard aboard ship. Allpossible measures must be taken to prevent the occurrence offire or to bring about its rapid extinguishment. In manycases, fires occur in conjunction with other damage, as aresult of enemy action, weather, or accident. Unless fireis rapidly and effectively extinguished, it may easily causemore damage than the initial casualty. In fact, fire maycause the loss of a ship even after the original damage hasbeen repaired or minimized.
Every member of the ship's company must realize theirresponsibility toward firefighting and the importance of thesubject. This paper deals with the fundamentals of fire-fighting, including the nature of fire, the classificationof fires, the fundamentals of extinguishment, the extin-guishing agents used, the firefighting equipment and systemsthat are available, and the basic procedures for combating afire.
THE NATURE OF FIRE
Fire, also called burning or combustion, is a rapidchemical reaction that results in the release of energy inthe form of light and noticeable heat. A fire cannot existwithout three things: (1) a combustible material, (2) asufficiently high temperature, and (3) a supply of oxygen.Because of these three requirements, the process of fire issometimes regarded as being a triangle with the three sidesconsisting of FUEL, HEAT, and OXYGEN. The control andextinguishment of fires is generally brought about byeliminating one side of the fire triangle—that is, byremoving fuel, heat, or oxygen. The heat of the fire trian-gle is transmitted in three ways: (1) conduction—heat istransferred through a substance by direct contact, (2) con-vection—heated gas transferring heat to other combustibles,and (3) radiation—heat is distributed in all directionsthrough the air.
THE CLASSIFICATION OF FIRES
Fires are classified according to the nature of thecombustibles (or fuels) involved. The classification of any
41

particular fire is of great importance, since it determinesthe manner in which the fire must be put out. Fires areclassified as being class A, class B, class C, or class Dfires.
CLASS A fires are those occurring in such ordinary com-bustible materials as wood, cloth, paper, upholstery, andsimilar materials. Class A fires are usually extinguishedwith water, using high or low velocity fog or solid streams.Class A fires leave embers or ashes, have white smoke, andthey must always be overhauled (broken up)
.
CLASS B fires are those occurring in the vapor-airmixture over the surface of flammable liquids such as gaso-line, lubricating oils, jet fuels, diesel oil, fuel oil,paints, thinners, solvents, and greases. AFFF, dry chemi-cal, carbon dioxide, or water fog can be used to extinguishclass B fires. The choice of agent depends upon the circum-stances of the fire, with AFFF usually the preferred agent.Class B fires give off a black smoke.
CLASS C fires are those occurring in electrical equip-ment with a blue flame and either blue or white smoke. Non-conducting extinguishing agents are used for extinguishingclass C fires. Carbon dioxide is the preferred agentbecause it leaves no residue. For complete safety, fires inelectrical equipment should be fought only after allcurrent, except as needed for necessary lighting, to theequipment has been shut off. This usually halts the flow ofheat to the fuel and it can readily be extinguished.
CLASS D fires are those occurring in combustible metalssuch as magnesium, titanium, and sodium. If class D firesbecome heated to a high temperature, they burn with adazzling white flame. In general, magnesium fires areextinguished only by smothering with dry sand or by acooling action using large amounts of water from a safedistance.
EXTINGUISHING AGENTS
The agents commonly used by Navy firefighters includewater, AFFF, dry chemicals (PKP) , and carbon dioxide (CO2)
.
The agent or agents used in any particular case depend uponthe classification of the fire and the generalcircumstances
.
Cooling is the most common method of fire extinguish-ment, and water is the most effective cooling agent.Fortunately, water is usually available in large quantities.Of all extinguishing agents now used by the Navy, water hasthe greatest capacity for heat absorption. Therefore, most
^2

burning substances can be cooled below their ignition pointsby the application of water.
Aboard ship, water is usually applied by means of theall-purpose nozzle. With the all-purpose nozzle, water maybe applied as a solid stream, in the form of a high velocitywater fog, or in the form of a low velocity water fog. Ingeneral, fog is preferred to the solid stream except when itis necessary to reach a fire that is some distance away orwhen the penetrating power of the solid stream is required.Under other circumstances, the fog is preferable because agiven amount of water can absorb more heat when it is in theform of fog than it can when it is in the form of a solidstream. An additional advantage of fog is that it reducesthe total amount of water that must be pumped into the shipto fight a given fire; since all water used for firefightingmust be pumped overboard or otherwise disposed of, this is adefinite advantage.
Aqueous film forming foam (AFFF) is a concentratedmixture that was developed to combat class B fires. It is aclear, slightly amber colored liquid that floats on thesurface of hydrocarbon fuels and creates a film whichprevents the escape of vapors and consequently preventsignition. The type used by the Navy is a 6 percent concen-tration, that is, six parts AFFF mixed with 94 parts ofwater. AFFF is applied to the fuel surface as a foam. Asthe AFFF solution drains from the foam, it forms a vapor-tight film on top of the fuel, thereby smothering the fire.
Carbon dioxide (CO2) is a very effective agent forextinguishing fires by smothering them, that is, by reducingthe amount of oxygen available for combustion. Thissmothering action of carbon dioxide is temporary. The fire-fighter must remember that the fire can quickly rekindle ifoxygen is again admitted to hot embers.
Carbon dioxide is a dry, noncorrosive gas that is inertwhen in contact with most substances. Carbon dioxide doesnot damage machinery or other equipment. Since it is a non-conductor of electricity, CO2 can safely be used in fightingfires that might present electric shock hazards. However,the frost that collects on the horn of the carbon dioxidecylinder IS a conductor of electricity. Therefore rubbergloves should be worn by personnel using CO2 to extinguishelectrical fires.
Although carbon dioxide is nonpoisonous, it is dangerousto the firefighter because it does not provide a suitableatmosphere for breathing. Asphyxiation can result frombreathing carbon dioxide. Oxygen Breathing Apparatus'(OBA's) must be worn when CO2 is used below decks or inconfined spaces.
Dry chemical powders extinguish a fire by a rather com-plicated chemical mechanism. They do not smother the fireand they do not cool it. Instead they interrupt thechemical reaction that is fire by suspending fine particlesin the fire. In effect, the dry chemicals put a temporaryscreen between the heat, oxygen, and fuel and maintain thisscreen just long enough for the fire to be extinguished.
Several types of dry chemicals have been used as fireextinguishing agents. For Navy use, the most importantagent of this kind at present is potassium bicarbonate, alsoknown as Purple-K-Powder or PKP. PKP is used primarily onclass B fires, however, it is also safe and effective onclass C fires. PKP should NOT be used in lieu of CO2 unlessnecessary, because PKP may foul electronic components.
FIREFIGHTING EQUIPMENT AND SYSTEMS AVAILABLE
To fight fires effectively you must have a thoroughknowledge of the firefighting equipment and systems that areavailable on your ship. The numerous fireplugs aboard yourship are served by branches of the firemain system. Mostfireplugs are 1 1/2 or 2 1/2 inches in diameter. Fireplugsare so located that any point on the ship can be reachedwith 50 feet of firehose from each of two or more fireplugs.On large ships any point can be reached with 100 feet offirehose from each of two or more fireplugs. On flightdecks any area can be reached with 150 feet of hose from atleast two fireplugs.
The two standard Navy firehoses are of double-jacketedcotton and rubber lined, and the newer black collapsiblerubber type, used mainly on flight decks, and they come in1 1/2 inch or 2 1/2 inches in diameter. Firehose is made in50 foot lengths. The 50-foot lengths of hose are normallyreferred to simply as "lengths" of hose. Thus 100 feet ofhose may be described as two lengths of hose.
The all purpose nozzle, shown in Figure A.l, comes intwo sizes: one size fits a 1 1/2-inch hose, the other fitsa 2 1/2-inch hose. A single valve controls the three opera-tions of the all purpose nozzle to project a solid stream;to project a fog; and to turn it off. To put the nozzle inoperation, the firefighter pulls the bail back from theFORWARD/CLOSED position to the VERTICAL/FOG position, or allthe way back to the REAR/OPEN or solid stream position.
Fog is generated in the all purpose nozzle (APN) byeither a low velocity fog head attached to an applicator ora high velocity nozzle tip. If a high velocity fog isdesired, as shown in Figure A. 2, the high velocity tip isleft in place in the fog outlet on the nozzle. If a low

STRAIGHT STREAMBAIL ^•FOG
FOG OUTLET
HIGH VELOCITY NOZZLE TIP
OUTLET FORSTRAIGHTSTREAM
Figure A.l All Purpose Nozzles
FOG POSITION
HIGH VELOCmr FOG••'>"S.'''<
'»•'''»*••.
Figure A. 2 All Purpose Nozzle on High Velocity Fog
velocity fog is desired, the tip is removed (Figure A. 3),and an applicator equipped with a low velocity head issnapped into place in the fog outlet on the nozzle. Abayonet joint (Figure A. 4) holds the high velocity tip orthe applicator in the nozzle when it is in use. The highvelocity tip is permanently attached to the nozzle with ashort piece of chain.
When the bail of the 1 1/2 inch all purpose nozzle ismoved to the REAR/OPEN position, the nozzle projects a solidstream of water a distance of approximately 65 feet (with100 psi of firemain available) . On the 2 1/2 inch nozzlethe projection distance is approximately 75 feet. Water inthe form of either a solid stream or fog is effectiveagainst class A fires, but a solid stream (Figure A. 5)should NOT be used on class B fires where it will have atendency to spread the fire. In combating class A fires the
'^-5

ALL PURPOSENOZZLE
RELEASEMECHANISM
HIGH VELOCITY
FOG TIP
Figure A. 3 Removing a High Velocity Tip (APN)
/O^riK\4^/^«^«x^^<<<<^.^
Figure A. 4 Bayonet Joint on Applicator (APN)
•STRAIGHT STREAMPOSITION
/SOLID STREAM
Figure A. 5 Solid Stream (APN)
^6
solid stream should be used only for breaking up and pene-trating class A material after surface fire has been reducedby water fog (i.e., overhauling the fire).
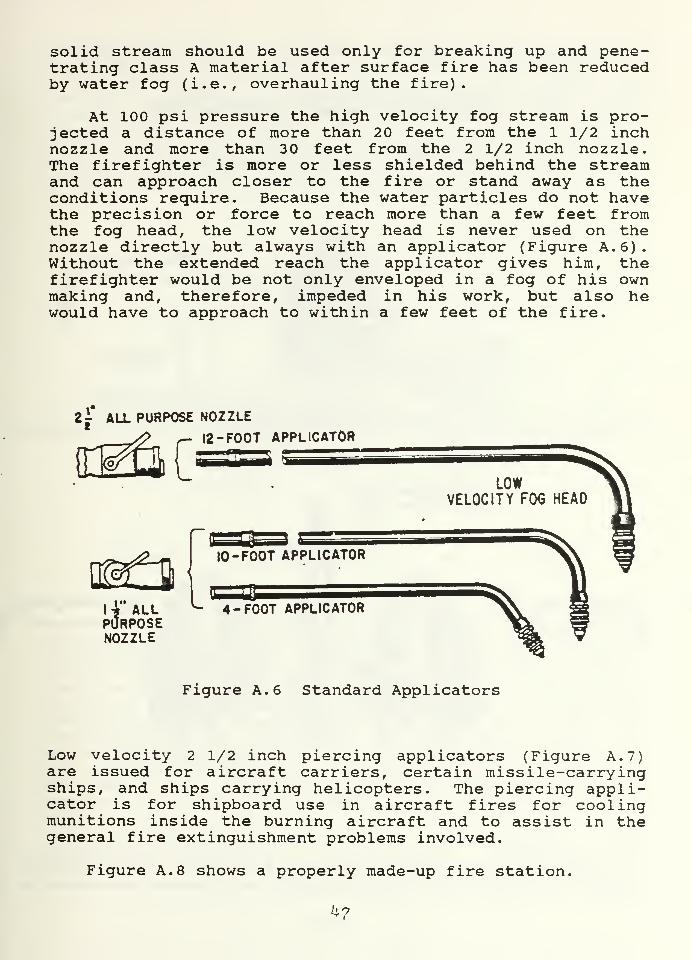
At 100 psi pressure the high velocity fog stream is pro-jected a distance of more than 20 feet from the 1 1/2 inchnozzle and more than 30 feet from the 2 1/2 inch nozzle.The firefighter is more or less shielded behind the streamand can approach closer to the fire or stand away as theconditions require. Because the water particles do not havethe precision or force to reach more than a few feet fromthe fog head, the low velocity head is never used on thenozzle directly but always with an applicator (Figure A. 6).Without the extended reach the applicator gives him, thefirefighter would be not only enveloped in a fog of his ownmaking and, therefore, impeded in his work, but also hewould have to approach to within a few feet of the fire.
Zj ALL PURPOSE NOZZLE
12-FOOT APPLICATOR
\-k ALLPURPOSENOZZLE
Figure A. 6 Standard Applicators
Low velocity 2 1/2 inch piercing applicators (Figure A. 7)are issued for aircraft carriers, certain missile-carryingships, and ships carrying helicopters. The piercing appli-cator is for shipboard use in aircraft fires for coolingmunitions inside the burning aircraft and to assist in thegeneral fire extinguishment problems involved.
Figure A. 8 shows a properly made-up fire station.
^?

ccg: 2 C
Figure A. 7 Piercing Applicator
BQUICK CLEANIN«STRAINER
INSTALLATIOM ON THE WEATHER DECKS
A0JUSTA8LCSPANNER
100 FEET OF 27 MOS£FAKED ON HOSE RACK
A0JUSTA8LE *&
SPANNER ^OUCK CLEANINGSTRAINER
WTE-<SATE
OPEN TOPROVIDEDRAIN IN
CASE OfDEFECTIVEFlRE-PLUaVALVE
100 FEET OF I ^ INCH HOSE
^4- FOOT APPLICATOR\
100 FEET Of \~ INCH HOSE2
Figure A. 8 Fire Hose Properly Rigged at Fire Station:
Now you are ready to fight the fire. At all fires atleast two hoses must be rigged with each hose connected to a
h^.
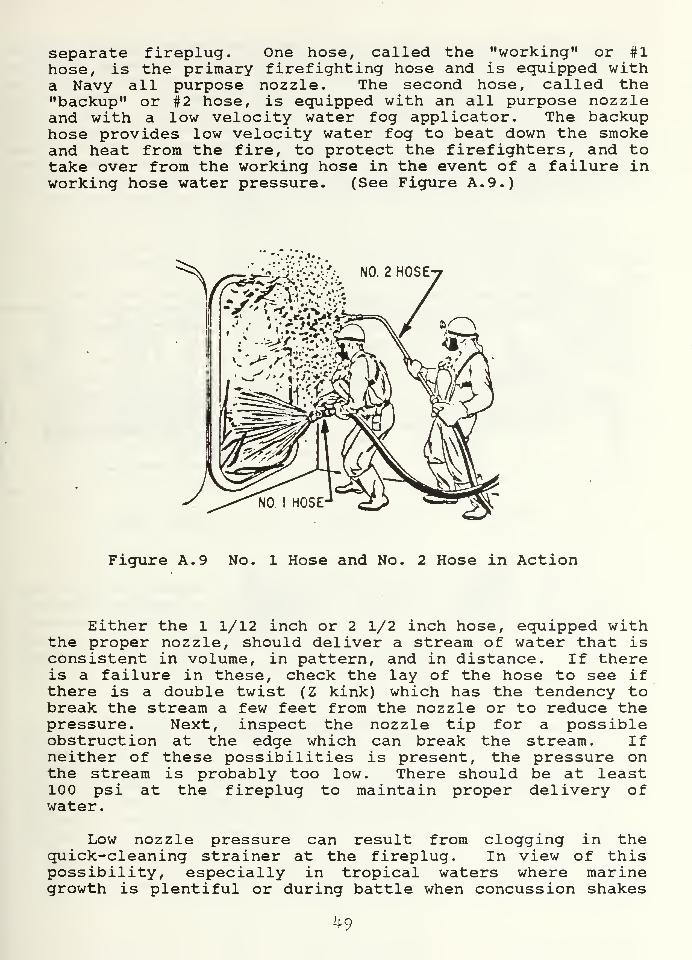
separate fireplug. One hose, called the "working" or #1hose, is the primary firefighting hose and is equipped witha Navy all purpose nozzle. The second hose, called the"backup" or #2 hose, is equipped with an all purpose nozzleand with a low velocity water fog applicator. The backuphose provides low velocity water fog to beat down the smokeand heat from the fire, to protect the firefighters, and totake over from the working hose in the event of a failure inworking hose water pressure. (See Figure A. 9.)
^?r •.'• •
NO. 2 HOSE-
Figure A. 9 No. 1 Hose and No. 2 Hose in Action
Either the 1 1/12 inch or 2 1/2 inch hose, equipped withthe proper nozzle, should deliver a stream of water that isconsistent in volume, in pattern, and in distance. If thereis a failure in these, check the lay of the hose to see ifthere is a double twist (Z kink) which has the tendency tobreak the stream a few feet from the nozzle or to reduce thepressure. Next, inspect the nozzle tip for a possibleobstruction at the edge which can break the stream. Ifneither of these possibilities is present, the pressure onthe stream is probably too low. There should be at least100 psi at the fireplug to maintain proper delivery ofwater.
Low nozzle pressure can result from clogging in thequick-cleaning strainer at the fireplug. In view of thispossibility, especially in tropical waters where marinegrowth is plentiful or during battle when concussion shakes
ij.9

encrustation particles to loose, the handle on the quick-cleaning strainer is pushed downward to the open positionwhich causes a flush to remove the marine growth or encrus-tation particles trapped in the strainer. Should theflushing operation prove ineffective, immediately lay a line(hose) into the adjoining sectionalized firemain ifpossible; or in case of ruptures, you should close the stopvalves on each side of the rupture, install a jumper line,and then open the closed stop valves to furnish the systemwith water. (See Figure A. 10.)
DOUBLE-FEMALE
.RUPTURE
^&dL=J;-x
STOP VALVECLOSED
Figure A. 10 Installation of a Jumper Line
The firemain system receives water pumped from the seaand distributes this water to fireplugs, sprinkling systems,flushing systems, machinery cooling water systems, washdownsystems, and other systems as required. The primaryfunction of the firemain system is to supply the fireplugsand the sprinkling systems; the other uses of the system aresecondary.
There are three basic types of firemain systems used onnaval ships: the single main system, the horizontal loopsystem, and the vertical loop system. The type of firemainsystem installed in any particular ship depends on the char-acteristics and functions of the ship. Small shipsgenerally have straight-line single main systems. Largeships usually have one of the loop systems or a compositesystem which is some combination or variation of the threebasic types.
50

A class B firefighting team is made up of men and equip-ment needed to effectively maneuver two 1 1/2 inch hoses.Each hose is manned by a nozzleman and three to fivehosemen. One hose, the "working hose," is a foam hose andhas the primary responsibility of extinguishing the fire.The "working hose" is equipped with a mechanical foamnozzle. The second hose, the "backup hose," is a water hoseand has the primary responsibility of protecting the fire-fighting team with low velocity water fog as necessary. Thebackup hose has a standard Navy all purpose nozzle with a 4-foot applicator attached.
The firefighting team for fighting a class B fire on ahangar deck is made up of two nozzlemen and eight or morehosemen. This team mans two 2 1/2 inch fire hoses. Onehose, the "working hose," provides foam for smothering thefire and is manned by a nozzleman and four or more hosemen.The second hose, or "backup hose," provides low velocitywater fog to act as a heat shield to protect the personnel.The backup hose is used with the Navy all purpose nozzle andthe 12-foot applicator and is manned by a nozzleman and fouror more hosemen.
The mechanical foam nozzle and pickup tube are shown inFigure A. 11.
SUTT ».
END >
SHOE ATTACHED TOPICKUP TUBE
Sal
AIR PORT
g-tyiir.iiiiiiiiiiiiiniiiiiiiiiiia^i
MECHANICAL FOAM NOZZLE
"k
PLUG
-SFOAM PICKUP TUBE
Figure A. 11 Mechanical Foam Nozzle and Pickup Tube
The mechanical foam nozzle consists of a 21 inch piece offlexible metal with a metal outlet nozzle. The butt end ofthe nozzle contains a suction chamber and an air port. The
51

mechanical foam nozzle is used with the pickup tube attachedto it except when foam liquid is introduced by means of anFP-180 water motor proportioner such as the one shown inFigure A. 13.
When the pickup tube is used with the mechanical foamnozzle, it is attached by its hose end to the suctionchamber in the butt end of the mechanical foam nozzle, justbehind the air port. The unit is then called a Navy PickupUnit (NPU) . (See Figure A. 12.) The metal pipe end of thepickup tube is inserted into a container of AFFF solution.The contents of one can of licjuid (5 gallons) will lastapproximately 1 1/2 minutes and will produce about 660gallons of foam in that time.
NOZZLEORFICE
FLOW S:
AERATION PORT
ll FIRE HOSE CONNECTION
Figure A. 12 Navy Pickup Unit (NPU) Nozzle Assembly
The FP-180 water motor proportioner consists of a foamliquid pump driven by a water motor. The unit (Figure A. 13)has 2 1/2 inch connections at both the inlet and outletsides, and it has two 1/2 inch pickup tubes. Flow throughthe water motor causes the foam pump to inject a measuredamount of foam liquid into the water stream when the foamvalve is moved to the proper position.
The foam valve has three positions, one for OFF and onefor each of the two pickup tubes. A plexiglass sight tube
52
i
I

PICKUP TUBES
CONTAINERS
Figure A. 13 FP-180 Water Motor Proportioner
allows the operator to determine when to shift from onepickup tube to the other, as an AFFF can become empty. A 5gallon can of AFFF will last approximately 1 1/2 minutes. Acontinuous supply of properly mixed foam is thus assured.The FP-180 water motor proportioner may be used also forfighting a fire with water or fog alone. When the foamvalve is in the off position, water supplied under pressurewill be discharged as water or fog, without the addition offoam.
The FP-180 water motor proportioner may also be perman-ently installed in some application. An FP-180 foam stationconsists of an FP-180 proportioner, a 50-gallon tank for thefoam liquid, and the associated piping and valves. In afixed installation, only the OFF position and one FOAMposition of the valve are used, because only one pickup tubeis used.
Although foam is an excellent agent for fighting firesin flammable liquids, some problems may be experienced inusing this agent. In general, poor foam is produced whenfiremain pressure is inadequate, when the portable orinstalled foam equipment is not correctly operated, or whenthe foam equipment is not properly maintained.
Single agent hose reels (Figure A. 14) which dispenseonly AFFF are located on the damage control deck. Thedamage control deck is normally the first complete deckbelow the main deck. The AFFF equipment consists of an FP-180 foam station described previously, a 125 foot length ofnon-collapsible hose, and a nozzle. In continuous operation
53
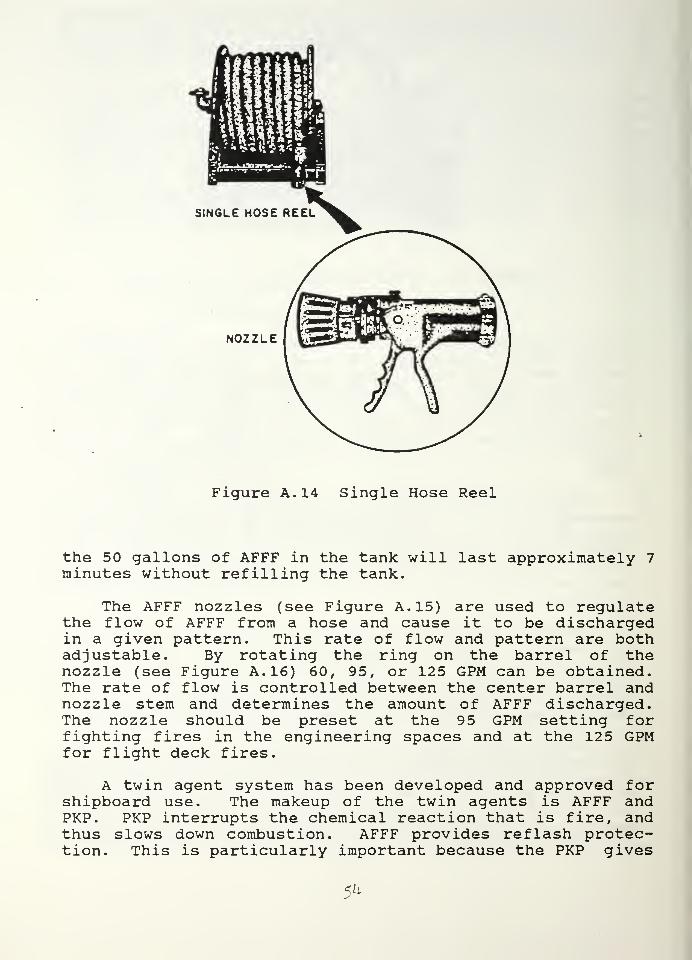
SINGLE HOSE REEL
NOZZLE
Figure A. 14 Single Hose Reel
the 50 gallons of AFFF in the tank will last approximately 7minutes without refilling the tank.
The AFFF nozzles (see Figure A. 15) are used to regulatethe flow of AFFF from a hose and cause it to be dischargedin a given pattern. This rate of flow and pattern are bothadjustable. By rotating the ring on the barrel of thenozzle (see Figure A. 16) 60, 95, or 125 GPM can be obtained.The rate of flow is controlled between the center barrel andnozzle stem and determines the amount of AFFF discharged.The nozzle should be preset at the 95 GPM setting forfighting fires in the engineering spaces and at the 125 GPMfor flight deck fires.
A twin agent system has been developed and approved forshipboard use. The makeup of the twin agents is AFFF andPKP. PKP interrupts the chemical reaction that is fire, andthus slows down combustion. AFFF provides reflash protec-tion. This is particularly important because the PKP gives
5^

Figure A. 15 Various Variable Stream AFFF Nozzles
NARROWFOG
WIDE FOG
Figure A. 16 AFFF Spray Pattern Control
55

little or no reflash protection. Once the PKP has the firepushed back, the AFFF is applied so that it floats on thesurface of the burning fuel, thereby preventing a reflashfrom combustible vapors. An additional advantage of AFFF isthat it requires only a thin film to cover the liquid (1/2inch) . The twin agent design permits the use of either AFFFor PKP, or a combination of the two to extinguish the fire.
There are two different configurations of the twin agentsystem. (See Figure A. 17.) Configurations A and B each
TWIN AGENT
HOSE REE*-
Figure A. 17 Configurations of the Twin Agent System

combine the AFFF unit and the PKP unit on a twin agent hosereel which has two hoses—one to dispense AFFF and the otherto dispense PKP. The two hoses are married for easierhandling. The only distinction between the two configura-tions is in the design of the nozzles. Although similar inperformance, they were designed by two differentmanufacturers
.
Since the twin agent system is used mainly in theengineroom and machinery spaces, the twin agent hose reelsare located in these spaces. AFFF is supplied from thedamage control deck through a system of pipes.
Aboard ship, carbon dioxide (fire extinguishing equip-ment includes 15-pound CO2 portable extinguishers (seeFigure A. 18), 50-pound CO2 hose-and-reel installations, and50-pound CO2 installed flooding systems. The carbon dioxideis contained under pressure in steel cylinders; it isreleased through a CO2 hose or fixed piping when controlvalves are opened. Any increase in temperature increasesthe pressure. Since pressure builds up rapidly as the tem-perature increases, three measures are taken to prevent thedanger of explosion:
1. Cylinders are never filled to more than 68 percent oftheir volume capacity.
2. Cylinders are designed to withstand pressures up to3000 psi.
3. Whether portable or installed, every carbon dioxidecylinder is equipped with safety release disks tosafeguard against the possibility of the cylinder'sbursting if excessive pressure should develop as theresult of heat.
Because the pressure in a CO2 cylinder varies withtemperature, the amount of carbon dioxide in a cylindercannot be determined by reading a pressure gauge. Instead,the cylinders must be weighed at least semi-annually todetermine the amount of CO2 contained. When carbon dioxideis released from a cylinder at normal temperatures, itexpands rapidly to approximately 4 50 times its storedvolume. This rapid expansion causes the temperature to dropto approximately minus 110°F. Most of the liquid carbondioxide is vaporized and becomes a gas, but some of it forms"snow." This snow will conduct electricity if it comes incontact with energized equipment and it will blister andburn if it comes in contact with human skin.
Since CO2 is 50% heavier than air, it tends to settle,covering the fire and excluding air until the fire is

SQUEEZE GRIPRELEASE VALVE
OROPERATINGHANDLE
0-YOKE RING
CARRYINGHANDLE
HORN
Figure A. 18 15-Pound CO2 Extinguisher
smothered. If there is wind or draft, the firefightershould work so that the carbon dioxide will be drawn or blowover the fire rather than away from it. Although carbondioxide reaches a very low temperature as it expands fromthe cylinder, it has only a very slight cooling effect onthe fire; it is used primarily for its smothering effect,not for its cooling effect. Since this smothering action ofcarbon dioxide is temporary, the firefighter must rememberthat the fire can quickly rekindle if oxygen is againadmitted to hot embers.
58

Carbon dioxide is most effective when it is used inconfined spaces. When you are using CO2 keep the compart-ment closed and secure the ventilation to preventunnecessary dilution of the CO2 • Except in an emergency,the firefighter should not open a compartment that has beenflooded with CO2 for at least 15 minutes after it has beenflooded. This delay is a precautionary measure to giveburning substances time to cool down so that they will notreignite when air is admitted to the compartment.
DO NOT ATTEMPT TO USE CO2 UNLESS YOU KNOW WHAT YOU AREDOING. In high concentrations, CO2 will cause suffocationas rapidly as it will smother a fire, unless proper precau-tions are taken. If necessary, you can enter a compartmentthat has been flooded with CO2 if you use an approved Navyoxygen breathing apparatus (OBA) or an air line hose mask.WARNING: Do NOT use a gas mask because it merely filtersthe air without adding the necessary oxygen to it. CO2 hasno odor, is colorless, and gives no evidence of its presencetha't can be recognized by human senses.
The 15-pound portable CO2 extinguisher is very simple tooperate. Merely remove the locking pin and squeeze the"squeeze-grip" release valve. Direct the flow of the CO2toward the base of the flame. The maximum effective rangeof a 15-pound CO2 extinguisher is 5 feet from the outer endof the horn and will last for approximately 40-45 seconds ofcontinuous use. Move the horn slowly from side to side andadvance on the flames as they recede. The squeeze-griprelease valve makes a tight seal when pressure on the gripis released; therefore, any unexpended CO2 is heldindefinitely without danger of leakage. When continuous,operation is necessary, or when the valve is to remain openfor recharging, slip the D-ring on the carrying handle overthe operating handle. The operating handle should be in thedepressed position when you put on the D-ring. This actionwill permit continuous operation of the extinguisher, aslong as any CO2 remains.
Portable CO2 extinguishers are placed throughout theship at strategic points.
Carbon dioxide is a dry, noncorrosive gas that is inertwhen in contact with most substances. Carbon dioxide doesnot damage machinery or other equipment and leaves noresidue. Since it is a nonconductor of electricity, carbondioxide can be used safely in fighting fires that mightpresent electrical shock hazards. However, the frost orsnow that collects on the horn of the carbon dioxidecylinder IS a conductor of electricity.
59

Installed CO2 systems are put in naval ships to providea dependable and readily available means of flooding (orpartial flooding) certain areas that present unusual firehazards. An installed CO2 extinguishing system has one ormore 50-pound cylinders. Except for size and releasingmechanisms, the 50-pound cylinders are essentially the sameas the 15-pound portable cylinders. There are two types ofinstalled CO2 systems: the hose-and-reel installation andthe flooding system. The flooding system is used in spacesthat are not normally occupied by personnel and are locatedin areas such as paint and inflammable liquid storerooms,paint mixing and issue rooms. The hose-and-reel installa-tion is normally located in machinery spaces such as engine-rooms, firerooms, and diesel generating rooms.
PKP is supplied in 18- and 27-pound portable dry chemi-cal extinguishers (see Figure A. 19). Most of these extin-guishers are of the cartridge type having the charge of CO2in a small cartridge on the outside of the shell. The ex-tinguishing shell is not pressurized until the extinguisher
NOZZLE VALVE
CAMNTJNaHANDLE
PUNCTURELEVER
AS TUSE
Figure A. 19 Dry Chemical Extinguisher
601

is to be used. To use the PKP bottle, stand to the side ofthe bottle and push down on the puncture lever (marked push)to cut the seal of the CO2 cartridge. The CO2 will fill theextinguisher, and it is ready to use. Approach the firefrom the windward side, no closer than 8 feet, if possible.Hold the extinguisher in one hand and the nozzle in theother hand. Discharge the dry chemical by squeezing thesqueeze grip on the nozzle. Hold the nozzle firmly anddirect the dry chemical to the base of the flame. Use awide sweeping motion from side to side to apply a dense,wide cloud of dry chemical in the area of the fire. If heatradiated by the fire is intense, a short burst of powderinto the air will serve as a heat shield between theadvancing firefighter and the fire. In confined spaces itis important that the PKP will be discharged only in shortbursts. Unnecessarily long discharges will reducevisibility, render breathing difficult, and waste the agent.This particular type extinguisher has an effective range ofapproximately 20 feet from the end of the nozzle and willlast for approximately 18-20 seconds of continuous use (18-pound bottle)
.
PKP bottles are installed in all galley spaces and inall machinery spaces where there is a danger of class B andclass C fires.
REPORTING A FIRE/INITIAL ACTIONS
The first thing to do when you discover a fire is toREPORT it to the OOD, if your ship is inport or underway.You can take this action in person or by telephone,whichever is quicker. Identify the class of fire, itslocation, and your name. The location should include thenumber of the nearest frame (example: third deck, frame 50,starboard side) or the compartment number (example: 3-50-1-L, CPO berthing compartment). Speed is essential. Aboveall, be accurate in giving the location of the fire; then,spread the alarm. Make sure all people in the surroundingarea are aware of the fire and set condition ZEBRA (fireboundaries) in the area. After you have done this, you musttake corrective action. If the fire is small, grab a CO2bottle and put it out; if the fire is fairly large, righoses and fight the fire until the fire party gets to thescene at which time you will be relieved. Before gettingrelieved, ensure the fire party leader knows the completesituation. If you can contain the fire at its earlieststage, you should be able to put it out in a few minutes.When a fire alairm is sounded on a Navy vessel, the fire-fighter goes into immediate action and proceeds with a
61

general plan. He must quickly determine the answers to thefollowing questions:
1. VThere is the fire?
2
.
What is burning?
3. What is the extent of the fire?
4. What combustibles are in the vicinity of the fire, inall surrounding spaces, and in the compartments aboveand below?
5. What vents and other channels are likely to facilitatethe spread of fire?
6. Is the firemain furnishing sufficient pressure?
7
.
What method of extinguishment is indicated?
8
.
What are the best procedures to prevent the spread offire and to put out the fire?
Preventing the spread of fire is a vital part ofshipboard firefighting, and it is a job that must be under-taken simultaneously with the job of fire extinguishment. Afire that is properly contained so that it cannot spread iswell on the way to being controlled.
The first method of preventing the spread of fire is toset fire boundaries. When the firefighter learns the loca-tion of the fire, what is burning, and the extent of thefire, he establishes fire boundaries around areas withinwhich extreme precautions are observed. This is to preventthe fire from spreading. Within these boundaries, doors,hatches, manholes, vent ducts, and all other openings notalready closed are closed as circumstances warrant and asfar as it is practicable to do so without interfering undulywith the operation of the ship. The firefighter is awarethat a fire in a compartment means that he has, in effect, afire in a metal box that is sending out heat in all direc-tions. Not only does heat pass by conduction and radiationthrough the four bulkheads of the compartment on fire, butalso it passes in the same manner down through the deck andup through the overhead. All bulkheads and the deck and theoverhead of a compartment on fire must be cooled for tworeasons:
1. To prevent the spread of the fire to combustibles inadjacent compartments, and
62

2. To prevent the heat from weakening and distortingthese structures
.
The firefighter may remove the combustibles from theimmediate vicinity of the fire, especially when the combus-tibles present a great hazard such as those presented bygasoline and explosives. He may remove them to a safe dis-tance or he may jettison them. Since it is not alwayspossible or practicable to remove the combustibles from thevicinity of the fire, the firefighter may fill the compart-ments with CO2 and seal the compartment, or he may depend oncooling and smothering the combustibles with fog spray, orhe may flood the compartment with steam or with waterthrough a sprinkling system. On occasion, fuel may bepumped to other tanks.
While the work of preventing the spread of fire isunderway, the work of extinguishment is not neglected.These actions are undertaken simultaneously and they areequally important. The experienced firefighter willprobably say that confining a fire within bounds is the mostimportant of the two actions. He considers that a fire soconfined is definitely under control. His main problem thenis to put the fire out and, until the equipment best suitedfor the task can be put into operation, he uses whatevereffective equipment there is at hand.
Another important phase of preventing the spread of firehas to do with the correct operation and^ maintenance of theventilation system. The question of whether or not tosecure the ventilation system during firefighting operationsdepends upon the particular, circumstances existing at thetime. It is important to remember, however, that any venti-lation system can provide a means by which fire may spreadfrom one compartment to another—indeed, from one end of theship to the other.
The danger of spreading fire through ventilation systemsis particularly great if there is dirt or dust in the duct-work, on screens, or in any other part of the ventilationsystem. It is very important, therefore, to make sure thatthe ventilation systems are inspected regularly and cleanedas often as necessary.
Finally, overhauling the fire also prevents the spreadof fire. After a fire has been extinguished, it must beoverhauled to make sure that it will not start burningagain. The general procedures for overhauling a fireinclude breaking up combustible materials with a fire axe orfire rake and cooling the fire with water or fog. Sincemany fires can flare up again after they appear to be out,it is
63

usually necessary to set a reflash watch after a fire hasbeen extinguished and overhauled.
<L

APPENDIX B
CASE STUDIES AND ANSWER KEYS
1. CASE STUDY 1
You are a roving watch on a DOG inport. It is after working hours, so only the
duty section is onboard. As you are walking towards the operations department
berthing, you notice a large amount of flames and white smoke coming out of the
compartment.
1. (9) FULLY describe all of your initial actions until the fire party arrives.
2. (3) What three things make up a fire?
3. (2) Besides white smoke, what are two other characteristics (descriptors) of theclass of fire described above?
4. (2) What is the primary- method of extinguishment for this fire, and how does it
put out the fire?
You are now the on-scene leader (the person in charge of the fire party at the
scene of the fire). It is your responsibility to ensure that the correct firefighting
equipment is used and that it is properly set up to combat the class of fire described in
part A.
5. (9) Explain FULLY how you would set up your firefighting equipment.
6. (1) Describe the number and type of personnel on your teams.
7. (4) What is the purpose of each of your teams?
8. (5) While fiehting the fire you notice a problem with the flow of water. Whatwill you check in order to find the cause of the problem?
On your next duty day while working in the forward machinery room, a class C
fire occurs while the electricians are testing a new pump. You report the fire.
9. (2) How could you tell it was a class C fire?
10. (1) What is the FIRST thing you would do in fighting this fire?
11. (2) What is the preferred extinguishing agent for this class of fire and why is it
preferred?
12. (6) How does this extineuishing agent put out the fire, what are its majorcharacteristics (maximum effective range and how long will it last in continuousoperation), and what are the major safety precautions of using this agent.
13. (1) If the preferred extineuishing aeent for this class C fire was not available inthe immediate area, vvhatls the next most preferred extinguishing agent?
65

14. (3) How does this agent put out a fire, and what are its major characteristics(range and time of continuos operation)?
ANSWER KEY 1
a. (1) report it to the OODb. (3) class A fire, operations department berthing, their name
c. (1) inform all personnel in the surrounding area
d. (1) set fire boundaries (material condition ZEBRA)
e. (3) take initial corrective action (for a large fire)
rig firefighting equipment and start to fight fire
stay until the fire party arrives
give a turnover of the situation to the fire party leader
2. (3) heat, fuel, oxygen
3. (2) solid combustibles, leaves an ash
4. (2) high velocity fog (water), cooling
5.
a. (3) two 1 1/2 inch hoses from two different fireplugs
b. (3) 1 hose is the working hose -v^-ith an APN in the VERTICAL/FOGposition for high velocity log
c. (3) 1 hose is the backup hose with an APN in the VERTICAL/ FOGposition with a 4-foot applicator inserted for low velocity fog
6. (!) 1 nozzleman with 3-5 hoseman
7. .
a. (1) working hose - put out the fire
b. (3) backup hose - beat down the smoke and heat from the fire- protect the.
iirefishters, and take over from the workins hose in the event of a failure inworking hose water pressure
8. (5) Z kink^ nozzle tip obstmction, water pressure less than 100 psi, clog in themarine strainer, and a rupture in the firemain
9. (2) blue fiame with blue or white smoke, electrical equipment
10. (1) secure the power to the electrical equipment
11. (2) CO2, it does not leave a residue/foul the equipment
12.
a. (1) it smothers the fire
b. (2) 5 feet, 40-45 seconds of continuous use
66

c. (3) frost on the horn will conduct electricity; frost is at -110 F and canbum/blister the human skin; and CO2 can cause suffocation (asphyxiation),an OBA must be worn
13. (1) PKP
14.
a. (1) breaks up the chemical reaction
b. (2) 20 feet, 18-20 seconds of continuous use
3. CASE STUDY 2
A. It is a week later and you are on another roving watch. As you enter the after
motor generating room, you notice a blue flame coming from the electrical
switchboard. You report the fire.
1. (4) Who do you report the fire to and what do you report?
2. (1) Besides a blue flame, what is another characteristic (descriptor) of this classoffire?
\ y J
3. (3) What three things make up a fire?
4. (1) What is the FIRST thing you would do in fighting this class offire?
5. (2) What is the preferred extinguishing agent for this class offire and whv is it
preferred?
6. (1) How does this extinguishing agent put out the fire?
7. (3) What are the major safety precautions of using this agent? .
B. Later in your watch, after the first fire was put out, you notice some sheets, some
mattresses, and some paper on fire in first division's berthing.
1. (3) What class of* fire are vou going to report and what are two othercharacteristics (descriptors) of this class offire?
2. (2) What is the primarv method of extinguishment for this class of fire andhow does it put the fire out?
3. (4) What are thepurposes of the two hose teams?
4. (3) What are the three methods of preventing the spread offire that must bedone at the same time you are fighting the fire?
C. During your rounds you pass the paint/flammable liquid storeroom, which is
normally not manned.
1. (1) What tvpe of installed firefighting system would you expect to find in thisspace?
D. The next day, since you are a member of the helicopter firefighting team, you must
attend the helicopter fire drill on the flight deck.
1. (1) Since vou know that AFFF is the preferred extineuishine agent for flishtdeck fires, what GPVI flow rate is the AFFF nozzle on !he #1 Hose preset ioT
67

2. (2) What type of applicator will be used on the #2 hose in fighting this fire andwhy?
3. (1) If all of a sudden, you notice a very, very bright flame coming from thewheels of the helicopter, what class of fire would this be?
4. (2) What are the two preferred extinguishing agents for the fire described inquestion 15?
E. On your next duty day, while on the damage control deck, you notice large
amounts of black smoke coming out of the passageway to a forward engineering space.
1. (3) What class of fire is this^ what is the preffered extinguishing agent, and howdoes this agent put out the fire?
2. (1) What is the proper "mixture" when using this agent?
3. (3) What pieces of equipment, portable and installed, are used to produce thisproper mixture?
4. (1) When using a 5 gallon can of this preferred extinguishing agent \\'ith one ofthe pieces of equipment described in question 19, approximatefv how long willone can last?
5. (2) If the H\ nozzleman is using the twin agent svstem to fight this fire, in whatspaces could he be m?
6. (2) What two extinguishing agents make up the twin agent system?
7. (3) How do these two agents work together?
8. (1) What fiow rate is the nozzle of the #1 hose preset to in order to fight a fire
m these spaces?,
4. ANSWER KEY 2
A.
a. (1) to the Officer of the Deck (OOD)
b. (3) class C fire, after motor generating room, their naine
2. (1) electrical equipment
3. (3) fuel, heat, oxygen (air)
4. (1) secure the power to the electrical equipment
5.
a. (1)C02
b. (1) does not leave a residue/does not foul the equipment
6. (1) smothers the fire
7. (3) frost on the horn conducts electricitv; frost comes out at -110 F. canburn blister the human skin; and CO-) can'cause sufibcation (asphyxiation), anOBA must be worn
B.
1.
68

3.
a. (1) class A fire
b. (2) white smoke, leaves an ash
a. (1) high velocity fog (water)
b. (1) cools the heat
a. (1) working hose - puts out the fire
b. (3) backup hose - beat down the smoke and heat from the fire: protect thefirefighters; and take over from the working hose in the event of a failure inworking hose water pressure
4. (3) setting fire boundaries, securing ventilation, and overhauling the fire
(breaking it up)
C.
1. (1) CO-) flooding system
D.
1. (l)125GPM
2.
a. (1) jtwo 1/2 inch (12 foot long) piercing applicator
b. (1) used for cooling munitions inside the burning aircraft and to assist inthe general fire extinguishment problems involved
3. (1) class D fire
4. (2) dry sand, large amounts of water (jettison)
E.
1.
a. (1) class B fire
b. (l)AFFF
c. (1) it smothers the fire
2. (1)6% AFFF, 94% water
(3) Nav\' Pickup Unit (NPU)/Mechanical Foam Nozzle, portable FP-180, andan installed FP-1 SO
4. (1) approximately one 1/2 minutes
5. (2) engineroom, fireroom
6. (2) AFFF and PKP
3
7.
(1) PKP pushes the fire back and interrupts the chemical reaction (slowsdown the rate of combustion)
69

b. (1) PKP has no reflash capability
c. (1) AFFF provides the reflash capability
8. (1)95GPM
70
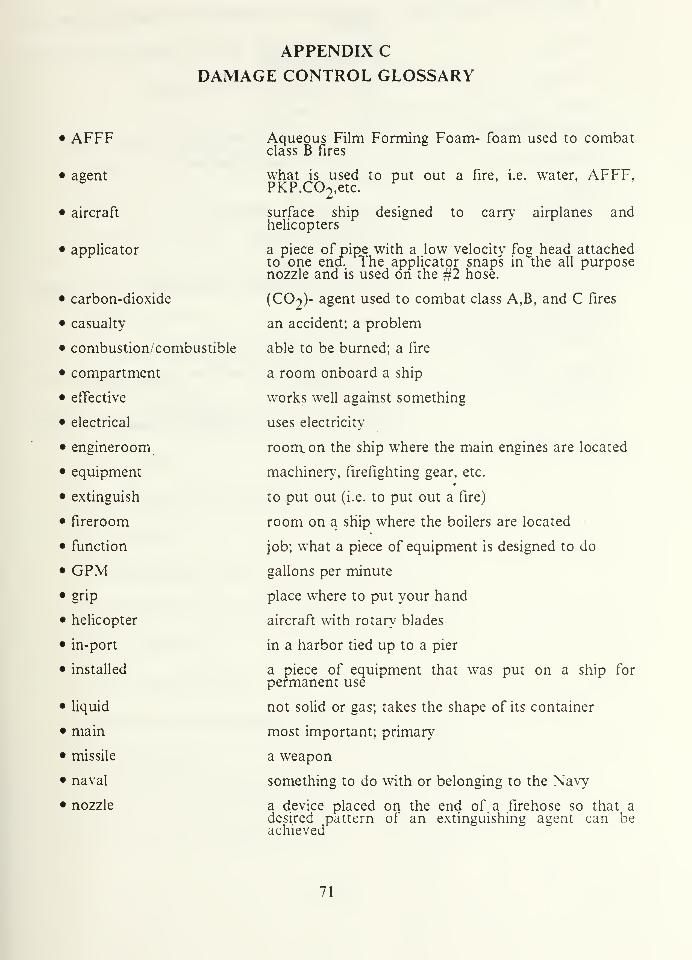
APPENDIX C
DAMAGE CONTROL GLOSSARY
AFFF
agent
aircraft
applicator
carbon-dioxide
casualty
combustion; combustible
compartment
efTective
electrical
engineroom
equipment
extinguish
fireroom
function
GPMgrip
helicopter
in-port
installed
liquid
main
missile
naval
nozzle
Aqueous Film Forming Foam- foam used to combatclass B fires
what is used to put out a fire, i.e. water, AFFF,PKP.C02,etc.
surface ship designed to carr>' airplanes andhelicopters
a piece of pipe with a low velocity fog head attachedto one end. The applicator snaps in the all purposenozzle and is used on the #2 hose.
(CO2)- agent used to combat class A,B, and C fires
an accident; a problem
able to be burned; a fire
a room onboard a ship
works well against something
uses electricity
room, on the ship where the main engines are located
machinery, firefighting gear, etc.
to put out (i.e. to put out a fire)
room on a ship where the boilers are located
job; what a piece of equipment is designed to do
gallons per minute
place where to put your hand
aircraft with rotary blades
in a harbor tied up to a pier
a piece of equipment that was put on a ship forpermanent use
not solid or gas; takes the shape of its container
most important; primary
a weapon
something to do with or belonging to the Navy
a device placed on the end of a firehose so that adesired pattern of an extinguishine aeent can beachieved
71

• Occurs/Occuring; Occurred
• OOD
• oxygen
• port
• purple-k-powder
• purpose
• rig
• smother
• starboard
• supply
• system
• underway
• unit
• valve
• ZEBR.'\ '
something that happens/that is happening/that hashappened"^
OfTicer of the Deck - person in charge of ensuring thedaily routine occurs
the air component of the fire triangle
left side of the ship
PKP- agent used to combat class B and C fires
job to do; function to perform
to put together
to take away the oxygen (air)
right side of the ship
to give; to furnish
pieces of equipment used together for a specificpurpose
at sea
a piece of equipment by itself; a component
a piece of equipment designed to direct the flow of aliquid in piping
material condition on a ship to be set at generalquarters (i.e., close all doors, hatches, ventiducts,etc.)
72

APPENDIX DBACKGROUND QUESTIONNAIRE
Social Security Number
Home of Record
Grade Point Average
Amount of Civilian Schooling Received
Location of School
Last Time In School
Favorite Subjects
Navy Schools Attended
PQS Completed
PQS in Progress {% completed)
Job Experiences •
Hobbies/Volunteer Work
Number of Books Read in the Last Year
Types of Books Read
Title of Last Book Read
Magazines Enjoy/Subscriptions Owned
Favorite TV Shows
Average Amount of Sleep Received Each Night
Amount of Sleep Received Last Night
73

APPENDIX E
READABILITY ANALYSES
Readability is the ease or difiiculty of reading, while the readability level is a
grade level equivalent of the article. Three common methods used in this study to
measure readability were the Dale-Chall Formula, the Fry Readability Graph, and the
Gunning Fog Index.
1. DALE-CHALL FORMULA (REFERENCE 27)
This formula is based on two counts - average sentence length and percentage of
unfamiliar words (words outside the Dale-Chall list of common words). The
procedures are as follows:
1) Select samples - for articles, select four 100-word samples for ever\' 2000words. Never begin or end a sample in the middle of a sentence. "(SinceAppendix A has 5530 words, twelve samples were chosen).
2) Count the number of words in the sample (W).
3) Count the number of sentences in the sample (S).
4) Count the number of unfamiliar words in the sample (U).
5) Compute the average sentence length (L):
L = W/ S (eqnE.l)
6) Compute the percentage of words outside the Dale-Chall list (P):
P = (U / W) X 100 (eqn E.2)
7) Compute formula raw score (RS):
RS = (.0496 X L) 4- (.1579 x P) + 3.6365 (eqn E.3)
8) The equivalent grade levels corresponding to the formula raw scores are listed
in Table 25.
74

TABLE 25
DALE-CHALL CORRECTION TABLE
Formula Raw Score (RS) Equivalent Grade Level
4.9 and below 4th grade and below5.0 to 5.9 5-6tR grade6.0 to 6.9 7-8th grade7.0 to 7.9 9- 10th grade8.0 to 8.9 11- 12th grade9.0 to 9.9 13-15th grade (college)10.0 and above 16-(college graduate)
2. FRY READABILITY GRAPH (REFERENCE 4)
To determine the equivalent grade level using this method, two quantities are
needed: average sentence length and number of syllables. The procedures are as
follows:
1) • Select samples - the same samples were used as in the Dale-Chall methodexcept each sample was exactly 100 words in length (required for this method).
2) Count the number of complete sentences in the sample (S). If the last
sentence is incomplete, then count the number of words from this last
sentence that are m the 100-word sample (I), count the number of wordsoutside the sample (O), and add the percentage:
S = S 4- (I / (I + O) ) . (eqn E.5)
3) Count the number of syllables in the sample (N).
4) Enter the Frv Readability Graph (Figure E.l) with S and N to fmd theequivalent gra'de level.
3. GUNNING FOG INDEX (REFERENCE 12)
The index is deterniined by computing the average sentence length and the
percentage of polysyllable words (words with three or more syllables). The procedures
are as follows:
1) Select sample - the same samples were used as in the Dale-Chall methodexcept the word count was not the same.
2) Count the number of words in the sample (W). Each word in the sample wascounted consecutivelv up to 100 words. If the closest sentence ending with aperiod was past the 100 word mark, then those extra words were addeti to theword count. If the closest sentence ending with a period was before thecompleted 100 word mark, then onlv the amount of words up to that lastcompleted sentence was counted.
3) Count the number of sentences in the sample (S).
4) Compute the average sentence length of the sample (L):
75

Awtfogt fKim^r 0* »yllo&i<t per 100 •ordl
SHORT WORDS LONG WORDS
1^ 177
OO
C
2
if -OZ
z
z;j
O
4 A
4S""X"—x^''f7"^ i /
trvpc
J_J
Figure E.l Fry Readability Graph.
L = W/ S (eqn E.6)
5) Count the number of polysyllable words in the sample (PW).
6) Compute the percentage of polysyllable words in the sample (P):
p = (PW / W) X 100 (eqn E.7)
7) Compute the Gunning Fog Index (G):
G = (.4)x(L + P) (eqn E.8)
76
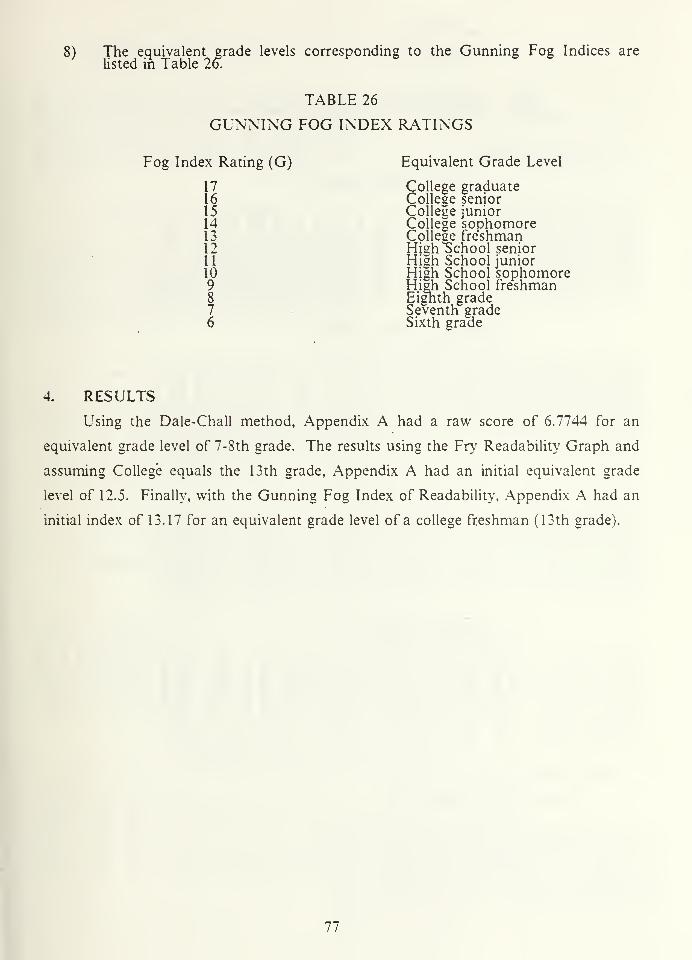
8) The equivalent grade levels corresponding to the Gunning Fog Indices arelisted in Table 2o.
TABLE 26
GUNNING FOG INDEX RATINGS
Fog Index Rating (G)
17161514131211109876
Equivalent Grade Level
College graduateCollege seniorCollege juniorCollege sophomoreCollege freshmanHigh^chool seniorHigh School juniorHigh School sophomoreHigh School freshmanEighth gradeSeventh gradeSixth grade
4. RESULTS
Using the Dale-Chall method, Appendix A had a raw score of 6.7744 for an
equivalent grade level of 7-8th grade. The results using the Fry Readability Graph and
assuming College equals the 13th grade, Appendix A had an initial equivalent grade
level of 12.5. Finally, with the Gunning Fog Index of Readability, Appendix A had an
initial index of 13.17 for an equivalent grade level of a college freshman (13th grade).
77

APPENDIX F
INPUT DATA
99.9 - Placeholder (no data)ROW - Method of Instructional Delivery
COLUMN - Individual Test Score
1. All Test Scores
Initial Test Results
12.0 14.0 15.0 26.5 15.5 21.5 16.5 34.0 11.5 18.0 99.9 99.932.0 23.0 25.5 11.5 29.0 17.0 18.5 18.0 16.0 21.0 99.9 99.926.0 17.5 26.0 23.0 23.5 16.0 14.0 26.519.5 19.0 11. 16.0 16.0 18.519.0 10.0 20.0 26.0 37.0 37.5 30.0 23.525.0 33.0 32.5 15.0 26.0 27.0 24.0 14.531.5 19.0 19.0 27.5 24.5 19.0 25.0 20.5
99. 9 99. 9 99.
9
99.
9
13.0 18.0 11.0 4. 12. 6.022.5 18.0 99. 9 99. 910.0 38.0 99. 9 99. 9
27.0 19.0 99.9 99.9
Retention Test Results
19. 15.5 21.526.5 14. 23.021.0 23. 25.519.0 15.5 14.5
22.0 28.0 22.0 14.0 27.0 13.0 20.5 99.9 99.922.0 24.0 23.5 17.516. 20.5 20. 25.0
18. 25.0 19.5 99.9 99. 9
26. 99. 9 99. 9 99.9 99. 9
20.5 15.0 21.0 18.0 24.0 10.0- 13.0 19.0 17.017.0 23.0 21.0 22.5 29.5 32.0 23.5 25.5 26.0 23.0 99.9 99.927.0 32.0 19.0 11.0 23.0 23.0 22.028.5 24.0 13.0 23.5 22.0 13.0 28.5
14.5 20. 27.5 99. 9 99. 9
22.0 24. 14.0 99. 9 99. 9
Old Question Results
13.0 14.5 18.5 15.0 18.5 16.5 10.0 19.5 11.0 14.5 99.9 99.917.0 14.0 17.0 19.0 19.0 15.0 14.5 16.0 19.0 16.0 99.9 99.917.0 17.0 17.0 14.0 15.0 16.0 19.0 17.0 99.9 99.9 99.9 99.916.5 12.0 12.0 15.0 13.0 16.0 16.0 18.0 8.0 11.0 15.0 15.013.0 16.0 15.0 19.0 18.0 21.0 18.0 17.0 19.0 14.0 99.9 99.913.0 20.0 16.0 11.0 20.0 16.5 17.0 11.0 14.0 22.0 99.9
15.5 19.0 13.0 20.519.5 18.0 11.0 17. 17.5 11.0 99. 9
99.999.9
New Question Results
6. 1.0 3.0 7.0 9.5 5.5 4.0 7. 5 2.0 6.0 99. 9 99. 99. 5 0.0 6.0 3. 5.0 8.5 3.0 2. 6.0 3.5 99. 9 99. 94. 6.0 8.5 2.0 5.5 4. 6.0 9. 99. 9 99. 9 99. 9 99. 92. 5 3.5 2.5 5.5 2. 5.0 2.0 6. 2.0 2.0 4. 2.
4. 7.0 6.0 3.5 11.5 11.0 5.5 8. 5 7.0 9. 99. 9 99. 99. 12.0 3.0 0.0 3.0 6.5 5.0 3. 5 6.0 5.5 99. 9 99. 9
9. 6.0 2.0 8.0 3. 0.0 8.0 5. 6.5 3. 99. 9 99. 9
2. Equal Group Size Test Scores
Initial Test Results
12.0 14.0 26.5 15.5 21.5 16.5 11.5 18.032.0 23.0 25.5 11.5 17.0 18.0 16.0 21.026.0 17.5 26.0 23.0 23.5 16.0 14.0 26.519.0 16.0 18.5 13.0 11.0 4.0 12.0 6.019.0 20.0 26.0 37.0 37.5 30.0 22.5 18.025.0 33.0 32.5 26.0 27.0 24.0 14.5 38.031.5 19.0 19.0 27.5 24.5 20.5 27.0 19.0
73

Retention Test Results
19.0 15.5 22.0 28.0 22.0 14.0 13.0 20.526.5 14.0 23.0 22.0 23.5 18.0 25.0 19.521.0 23.0 25.5 16.0 20.5 20.0 25.0 26.015.5 20.5 21.0 18.0 10.0 13.0 19.0 17.017.0 21.0 22.5 29.5 32.0 23.5 26.0 23.027.0 32.0 19.0 23.0 23.0 22.0 14.5 27.528.5 24.0 13.0 23.5 22.0 22.0 24.0 14.0
Old Question Results
13.0 14.5 15.0 18.5 16.5 10.0 11.0 14.517.0 14.0 17.0 19.0 15.0 16.0 19.0 16.017.0 17.0 17.0 14.0 15.0 16.0 19.0 17.012.0 15.0 16.0 16.0 8.0 11.0 15.0 15.013.0 15.0 19.0 18.0 21.0 18.0 19.0 14.018.0 20.0 16.0 20.0 16.5 17.0 11.0 22.019.5 18.0 11.0 15.5 19.0 17.0 17.5 11.0
New Question Results
6.0 1.0 7.0 9.5 5.5 4.0 2. 6.09.5 0.0 6.0 3.0 8.5 2. 6.0 3.54.0 6.0 8.5 2.0 5.5 4.0 6. 9.03.5 5.5 5.0 2. 2.0 2. 4. 2.04.0 6.0 3.5 11.5 11.0 5.5 7. 9.
9.0 12.0 3.0 3. 6.5 5.0 3.5 5.59.0 6.0 2. 8. 3. 5.0 6.5. 3.0
3. Background Questionaire Results
Grade Point Averages
1.65 3.00 2.80 3.40 2.60 3.00 2.80 3.00 3.80 2.9099.9099.902.70 2.75 3.40 3.40 2.40 3.20 3.40 2.70 1.80 3.5099.9099.902.75 2.80 2.00 2.00 3.00 2.90 3.20 3.6099.9099.9099.9099.903.80 3.00 2.50 4.00 2.00 3.00 2.75 2.98 3.00 2.00 2.50 2.003.00 2.50 3.00 2.00 2.80 3.33 3.50 2.50 3.00 3.0099.9099.903.00 1.20 3.00 2.50 2.80 3.00 2.90 2.80 2.00 3.0099.9099.903.00 2.70 2.80 3.00 3.63 2.80 2.50 2.50 2.50 2.8099.9099.90
Average Amount of Sleep
6.0 6.0 4.0 6.0 7.0 7.0 6.0 6.5 5.0 6.0 99.9 99.93.5 6.0 6.0 4.5 6. 7. 6.5 6. 5 6.0 4. 99. 9 99. 95.0 5.0 6.0 4. 6. 4. 6.0 5. 99.9 99. 9 99. 9 99. 94.5 8.0 5. 6.0 5. 5. 5 5. 7. 4.0 6.0 5. 5.5.5 6.0 8.0 5.0 7. 3. 5 6.0 6. 7.5 6.5 99. 9 99. 95.0 5.0 7.0 5. 6. 5. 5 6.0 5. 5 6.0 6.0 99. 9 99. 96.0 5.5 5.5 6.5 5. 4. 6.0 4. 5. 4. 8 99. 9 99. 9
70

Amount of Sleep Before the First Test
5.0 5.0 5.0 3.0 5. 6.5 5.0 5.0 5.0 6.0 99.9 99. 94.0 3.5 8.0 5.0 6.0 8.5 7.0 7.0 6.0 4.0 99. 9 99. 9
4.5 6.0 5.0 4.0 4.0 4.0 6.0 5.0 99.9 99.9 99.9 99. 92.0 7.0 5.0 4.0 4.0 4.5 6.0 5.5 4.0 7.0 4.5 5. 53.0 5.0 7.0 8. 4.5 3.0 6.5 6.0 7.0 6.0 99.9 99. 95.0 5.0 6.5 6.0 5.5 5.0 5.5 3. 5.0 4.0 99. 9 99. 9
5.0 5. 5.5 8.0 3.5 4.0 6.5 4.0 6.0 5. 99. 9 99. 9
Amount of Sleep Before the Second Test
6.0 14.0 6.0 7.0 5.6 7.0 2.5 4.5 0.0 3.0 99.9 99.99.0 4.5 6. 8.5 10.0 4.0 6.5 8.0 9.0 6.0 99.9 99. 93.0 5.0 5. 5 5.5 4.5 2.0 5. 4.5 99.9 99.9 99.9 99. 94.5 6.0 5. 4.0 4.0 6.0 6.0 5.0 4.5 5.0 4.5 5.
10.0 2.0 7. 5 8.0 6.0 5.0 5.0 7.0 7.0 5.5 99.9 99. 93.5 9.0 5. 5.0 4.0 6.0 7.0 5.0 9.0 8.0 99.9 99. 95.0 6.0 5. 5.5 5.0 4.0 6.0 5.0 6.0 5.0 99.9 99. 9
Years of Schooling Received
12.0 12.0 14.0 12.0 12.0 12.0 11.0 16.0 12.0 12.0 99.9 99.912.0 12.0 12.0 12.0 16.0 16.0 12.0 16.0 11.0 12.0 99.9 99.912.0 13.0 12.0 16.0 12.0 12.0 15.0 13.0 99.9 99.9 99.9 99.910.5 12.0 12.0 13.5 12.0 12.0 12.0 14.0 12.0 13.0 12.0 12.012.0 12.0 13.0 11.8 12. 12.0 12.0 12.0 13.0 12.0 99.9 99.912.0 13.0 12.0 12.0 12.0 12.0 12.5 12.0 13.0 12.0 99.9 99.912.0 12.0 12.0 12.0 12.0 12.0 12.0 13.0 12.0 15.0 99.9 99.9
Amount of Time Since Last Schooling
0.58 1.08 1.00 3.00 1.00 1.08 1.08 0.50 3.08 1.0099.9099.902. 08 6. 00 2. 08 8. 00 1. 25 2. 00 1. 50 1. 50 2. 00 1. 0099. 9099. 902. 00 0. 75 4. 08 0. 50 4. 08 3. 08 0. 50 1. 0099. 9099. 9099. 9099. 900. 25 1. 00 1. 00 1. 00 1. 00 1. 00 1. 25 3. 00 1. 00 0. 08 1. 00 1. 001. 00 3. 00 0. 50 1. 25 4. 00 1. 50 1. 00 7. 00 1. 25 4. 0099. 9099. 903. 00 2. 00 3. 00 2. 00 1. 00 3. 00 1. 00 1. 08 4. 0810. 0099. 9099. 901. 17 2. 00 2. 00 1. 00 1. 00 0. 08 1. 17 2. 50 4. 08 0. 5099. 9099. 90
Number of Books Read in the Last Year
1.0 0.0 12.0 67.0250.0 3.0 3.0 67.0 30.0 6.0 99.9 99.94. 1. 0. 4. 3. 20. 0. 5. 0250. 0. 99. 9 99. 9
3. 2. 10. 3. 1. 4. 40. 0. 99. 9 99. 9 99. 9 99. 9
50. 3. 0. 1 50. 5. 20. 3. 1. 12. 4. 3.
17. 0400. 0. 3. 7. 25. 0. 10. 30. 4. 99. 9 99. 9
15. 2. 3. 10. 3. 0. 4. 3. 0. 0. 99. 9 99. 9
20. 15. 0. 1. 7. 3. 12. 5. 5. 10. 99. 9 99. 9
30

* APPENDIX G** COMPUTER PROGRAMS
********** CHI -SQUARE Goodness of Fit Test ************ After transforming the input data (subtracting the mean and then-'dividing this whole quantity by the standard deviation) , this program'''uses a Lhi-square Goodness of Fit Test to see if the data is normally^distributed, N(0,1). The output is the critical value of the test*(i. e. , the minimum level of significance required to reject a normal^distribution)
.
^'VARIABLES:" CHI(i) - values of the appropriate chi-square random variable* D(i);D2[^i^ - used in computing the test statistic" DASH - - ; a dash, used for output"^ Efi^ - expected value of the ith interval* F(i) - counter for the number of data points in the ith interval* MU - overall grand mean of the data* NDATA - total number of data points* NTEST(i) - number of scores in the ith group* P(i) - percentiles, of the chi-square random variable* PZ(i) -. N(0,1) probabilities for the ith interval* RATIO - ratio used to determine the critical level" SCR(i, j) - test score of the ith individual in the ith group" 3IGLVL - the critical level of the test^' SIGMA - average of the methods' standard deviations
TS - test statisticUN - "_"; the underline symbol, used for outputZ,(i,j) - transformed test scores .
,J,K1,I,J,Kl,K2,K3,M -counters
REAL MUCHARACTER^a UN, DASHDIMENSION SCR(6,12), NTEST(6), Z(6,12), F(12) , E(12), PZ(12)DIMENSION P(12), D2(12), CHI(13), P(13)DATA DASH/^-7, UN/ _^/, MU/2. 82/, SIGMA/. 556/DATA P/. 005,. 01.. 025.. 05,. 1,. 25,. 5,. 75,. 9,. 95 ,. 975 , . 99 , . 995/DATA CHI/2.6,3.05,3.82,4.57,5.58,7.58,10.3,13. 7,17.3,19. 7,21.9,24.
P 7 9 ^ ft /
dAta'pZ/. 0062,.- 0165,. 0441, . 0919, . 1498, . 1915,. 1915,. 1498,. 0919,. 044CI,. 0165,. 0062/
** Initialization steps*
NDATA=0TS=0.DO 10 1=1.6
NTEST(i)=010 CONTINUE
DO 20 J=l,12F(J)=0.0
20 CONTINUEDO 110 M=l,6
READ(5,100) SCR(M,1),SCR(M,2),SCR(M,3).SCR(M,4),SCR(M,5),SCR(M,C6),SCR(M,7),SCR(M,8),SCR(M,9),SCR(M,10),SCR(M,11),SCR(M,12
100 F0RMAT(liF5. 1)110 CONTINUE
** Transforms the input data
DO 130 M=1.6DO 120 1=1,12
IF(SCR(M,I). EQ. 99.9) GOTO 120NTEST(M)=NTEST(M)+1Z(M,NTEST(M))=(SCR(M,I)-MU)/SIGMA
120 CONTINUENDATA=NDATA+NTE ST( M
)
130 CONTINUE
81

" Counts the number of data points in each interval
DO 145 M=l,6DO 140 I=1,NTEST(M)
IF(Z(M/I).LE. -2.5) THENF(ll=F(l)+l.
ELSE IF(Z(M,I).LE. -2. 0) THENF(2)=F(2)+1.
ELSE IF(Z(M,I).LE. -1.5) THENF(3)=F(3) + 1.
ELSE IF(Z(M,I).LE. -1.0) THENF(4)=F(4)+1.
ELSE IF(ZrM,I).LE. -0. 5) THENF(5)=F(5) + 1.0
ELSE IF(Z(M,I).LE.O.O) THENF(6)=F(6)+1.0
ELSE IF(Z(M,I).LE. 0. 5) THENF(7)=F(7)+1.
ELSE IF(Z(M,I).LE. 1.0) THENF(8)=F(8)+1.0
ELSE IF(Z(M,I).LE. 1.5) THENF(9)=F(9)+1.0
ELSE IF(Z(M,I).LE.2.0) THENF(10)=F(10)+1.0
ELSE IF(Z(M,I).LE. 2.5) THENF(11)=F(11)+1.
ELSEF(12)=F(12)+1.
END IF140 CONTINUE145 CONTINUE
•J.
='' Computes each interval's' expected value
DO 150 Kl=l,12E(K1)=PZ(K1)^^(REAL(NDATA))
150 CONTINUE-J*
" Computes the chi-square test statistic
DO 160 K2=l,12DrK2)=F(K2)-E(K2)
' D2(X2)=(ABS(D(K2)))'"'-2TS=TS+D2(K2)/E(K2)
160 CONTINUE
* Computes the critcal level
DO 170 K3=2,13IF(TS.LT. CHI(K3}) THEN
RATI0=(TS-CHI(K3-1))/(CHI(K3)-CHI(K3'1))SIGLVL=1-(P(K3-1)+RATI0^^(P(K3)-P(K3-1)))GOTO 180
ELSEEND IF
170 CONTINUEIF(TS.LT. CHI(l)) THEN
SIGLVL=. 995ELSESIGLVL=. 005
END IF
" Output section
130 WRITE (7, 2 10)210 FORMAT('l'/*0'/16X,' CHI -SQUARE Goodness of Fit TEST ',
1/ 0'/24X,'to a NORMAL Distribution /2( ^0 /)
.
2^0' ,4X' INPUT DATA' ,5X /mean' ,6X,'STD DEV\5X,'TEST STATISTIC',C5X/SIG LVL'^)WRITE(7,270) (UN, IC=1 , 10) , (UN, JC=1 ,5) ,
(UN,KC=1 , 7) , (UN,LC=1 , 14)
,
C(UN,MC=1,7)
82
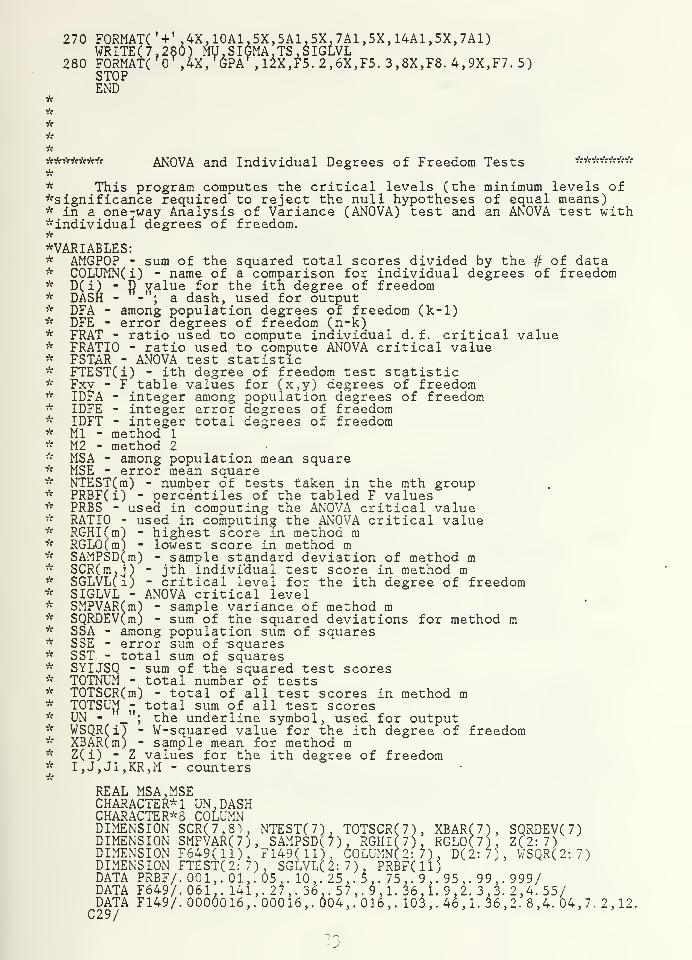
270 FORMAT('+' ,4X, 10A1,5X,5A1,5X,7A1,5X, 14A1,5X,7A1)WRITE( 7,280) MU, SIGMA. TS.SIGLVL
280 FORMAT('o^,4X/GPA^,12X,F5.2,6X,F5.3,8X,F8.4,9X,F7.5)STOPEND
*
if
if
ififkififif-if ANOVA and Individual Degrees of Freedom Tests Vf*Vf*Vf**
* This program computes the critical levels (the minimum levels of^significance required to reject the null hypotheses of eaual means)* in a one-way Analysis of Variance (ANOVA) test and an ANOVA test with"individual degrees of freedom.if
^VARIABLES:* AMGPOP - sura of the squared total scores divided by the # of data* COLUMN(i) - name of a comparison for individual degrees of freedom* D( i) - p value for the itn degree of freedom* DASH - -"; a dash, used for output* DFA - among population degrees of freedom (k-1)* DFE - error degrees of freedom (n-k)* FRAT - ratio used to compute individual d. f. critical value* FRATIO - ratio used to compute ANOVA critical value* FSTAR - ANOVA test statistic* FTEST(i) - ith degree of freedom test statistic" Fxy - F table values for (x,^) degrees of freedom" IDFA - integer among population degrees of freedom" IDFE - integer error degrees of freedom" IDFT - integer total degrees of freedom* Ml - method 1* M2 - method 2" MSA - among population mean square* MSE - error mean square* NTEST(m) - number of tests taken in the mth group* PRBF(i) - percentiles of the tabled F values* PRBS - used in computing the ANOVA critical value" RATIO - used in computing the ANOVA critical value* RGHIfm^ - highest score m method m* RGLO(m) - lowest score in method m^' SAMPSD(m) - sample standard deviation of method m" SCR(m.jl - jth individual test score in method m-' SGLVL(i) - critical level for the ith degree of freedom'^ SIGLVL - ANOVA critical level" SMPVARfm^ - sample variance of method m* SQRDEV(m) - sum of the squared deviations for method m* SSA - among population sum of squares* SSE - error sura of squares" SST - total sura of squares" SYIJSQ - sum of the squared test scores" TOTNUM - total number of tests* TOTSCR(m) - total of all test scores in method m* TOTSUfJ - total sum of all test scores" UN - _ ; the underline symbol, used for output* WSQRfil - W-squared value for the ith degree of freedom" XBAR(m) - sample mean for method ra
" Z(i) - Z values for the ith degree of freedom^- I,J,J1,KR,M - counters
REAL MSA, MSECHARACTER" 1 UN. DASHCHARACTER^--3 COLUMNDIMENSION SCR(7,8'), NTEST(7). T0TSCR(7), XBAR(7), SQRDEV(7)DIMENSION SMPVAR(7), SAMPSD(7), RGHI(7), RGL0(7), Z(2:7)DIMENSION F649( 11) , F149(ll). C0LUMN(2:7), D(2:7), WSQR(2:7)DIMENSION FTEST( 2: 7), SGLVL(2:7), PRBF(ll)DATA PRBF/. 001, . 01 , . 05 , . 10, . 25 ,. 5,. 75 ,. 9 , . 95 , . 99,. 999/DATA F649/. 061 , . 141, . 27 , . 36 . . 57 , . 9 , 1. 36 , 1. 9 , 2. 3, 3. 2,4. 55/DATA F149/. 0000016,. 00016,. 004, . 016 , . 103 , . 46 , 1. 36 , 2. 8 ,4. 04, 7. 2, 12.
C29/

*
DATA COLUMN/ '4V123567' ,'123V567 ',
' 12 V 3 ','56 V 7 ',' 1 VC,^ 5 V 6 '/
DATA UN/'_'/, DASH/'-'/, D/336. 0,48. 0,48. 0,48. 0, 16. 0, 16. 0/
Initialization steps
DO 10 1=1,7NTEST(I)=0TOTSCRf I)=0.0SQRDEV(I)=0.0RGHI(I)=0.RGLO(I) = 100.0
10 CONTINUEDO 20 L=2,7
Z(L)=0.020 CONTINUE
SYIJSQ=0.TOTSUM=0.ANGPOP=0.T0TNUM=56.DFA=6.DFE=49.
" Data input
DO 120 M=l,7READ(5,100) SCRCM.l). SCR(M.2), SCR(M,3), SCR(M,4),
CSCR(M,5), SCR(M,6), SCR(M,7), SCR(M,8)100 F0RMAT(SF5. 1)120 CONTINUE
" One-way ANOVA computations
DO 150 M=l,7DO 130 J=l,8
NTESTrM)=NTEST(M)+lTOTSCR(M)-TOTSCR(M)+SCR(M,J)SYIJSQ=SYIJSQ4-SCR(M,J)""2TOTSUM=TOTSUM+SCR( M , J)IF(SCR(M,J).GT. RGHI(M)) RGHI(M)=SCR(M, J)IF^SCR(M,J).LT. RGLO(M)) RGLOCM)=SCRCM, J)
130 CONTINUEAiMGP0P=AMGP0P+(T0TSCR(M)^''''2)/REAL(NTEST(M))XBAR( ^^) =T0TSCR( M) /REAL( NTEST( M)
)
DO 140 J1=1,NTEST(M)SQRDEV(M)=SQRDEV(M)+(SCR(M,Jl)-XBAR(M))''--^2
140 CONTINUESiMPVAR(M)=SQRDEV(M)/REAL(NTEST(M)-l)SAMPSD(M)=(SMPVAR(M))— .
5
150 CONTINUE
" Output
WRITE(7,153) (DASH,IC=1.5),(DASH,JC=1,5)153 F0RMATr22X Ja1,'NEW QUESTION RESULTS^ ,5A1)
WRITE(7,155)155 F0RMAT(20X)
WRITE (7, 15 7)157 F0RMAT(20X)
WRITE(7,160), , ,
•
160 FORMAT('0\20X, 'METHOD '.lOX,' TYPE OF TRAINING')WRITE(7,165) (UN,IC=1.6),(UN,JC=1,16)
165 FORMAT( '+', 20X, 6Al , lOX, 16A1)
WRITE(7,170)170 FCRMAT(24X/l' , 15X, ' LECTURE '
)
WRITE(7,175)175 F0RMAT(24X/2' , 15X, ' VIDEO'
)
WRITE(7,180)180 F0RMAT(24X/3' , 15X, ' READING'
)
WRITE(7,183)183 F0RMAT(24X/4' , 15X, ' CONTROL'
)
WRITE(7,1S5)

185 F0RMAT(24X,'5',15X,'AUDI0 l.OO')WRITE(7.190)
190 F0RMAT(24X^_6' ,15X,'AUDI0 1.25')
195WRITE(7.19i)
,F0RMAT(24X/7',15X,'AUDI0 1.50')WRITE(7,200)
200 FORMAT('0^20X)
* Data analysis outputif
WRITE(7,210) (DASH,IC=1,12),(DASH,JC=1,13),(DASH,KC=1,4),(DASH,LC=
210 f6rMAT( 21X. 12A1,
' SAMPLE'
, 13A1 , 9X,4A1,
' RANGE',4A1)
VRITE(7,220)220 FORMAT(20X)
WRITE(7.230), , , , , , , , ,
230 F0RMAT(22X/mEAN',6X,' VARIANCE' ,5X 'STD DEV' ,9X,'HIGH' ,5X,'L0W')WRITE(7,240) (UN,IC=1,4) ,(UN, JC=1,8) ,(UN,KC=1,7) ,(UN,LC=1 ,4) ,(UN,M
CG=1,4), ,
240 F0RMAT('+' .21X,4A1,6X,8A1,5X,7A1,9X,4A1,5X,4A1)WRITE (7, 250)
250 FORMAT(20X)DO 270 M=l,7
WRITE(7,260) M. XBAR(M) , SMPVAR(M), SAMPSD(M), RGHI(M) ,RGLO(M)260 FORMATC' METHOD^ ,12, 10X,F6. 3,4X,F9. 3,5X,F7. 3,8X,F5. 1,5X,F4. 1)270 CONTINUE
WRITE(7,273)273 FORMATC 2 OX)
WRITE(7.276)276 FORMATC 20X)
" ANOVA table computations and output
SST=SYIJSQ-(T0TSUM''f''-2)/T0TNUMSSA=AMGPOP - ( T0TSUM'''^-2 ) /TOTNUMSSE=SST-SSAMSA=SSA/DFAMSE=SSE/DFEFSTAR=MSA/MSEDO 575 KR=2,11
IFCFSTAR. LT.F649CKR)) THENFRATI0=(FSTAR-F649(KR-1))/CF649(KR]-F649CKR-1))PRBS=PRBFCKR-1)+FRATI0^-CPRBFCKR)-PRBFCKR-1))SIGLVL=1. 0-PRBSGOTO 5 78
ELSEEND IF
575 CONTINUEIFCFSTAR. LT.F649C1)) THEN
3IGLVL=. 999ELSESIGLVL=. 001
END IF578 WRITEC7,580)CDASH,IC=1,5),CPASH,JC=1,5)580 FORMATC 2 6X, 5A 1,^ANOVA TABLE^,5A1)
WRITEC7,583)583 FORMATC 0,20X)
WRITEC7,585)585 FORMATC 6X,^ SOURCE' ,9X,'SS' ,8X,'DF' ,9X,'MS' , lOX, 'FSTAT'
,8X,
'
SIGLVL'C)WRITEC7,590) CUNjIC=l,6) ,CUN, JC=1,9) ,CUN,KC=1,2) , CUN,LC=1 ,9) , CUN,MCC=1,9) j(UN,NC=l,8)
590 FORMATr+' ,5X,6A1,5X,9A1,5X,2A1,5X,9A1,5X,9A1,5X,8A1)IDFA=INTCDFA)IDFE=INTCDFE)IDFT=IDFA+IDFEWRITEC7,59?) SSA, IDFA, MSA, FSTAR, SIGLVL
592 F0RMATC6X/METH0D' 5X,F9. 3,5X,I2,5X,F9. 3,5X,F9. 5 ,5X,F8. 5)WRITE C 7, 5 95) SSE.IDFE.MSE
595 F0RMATC6Xj error' 6X,F9. 3 ,5X, 12 ,5X,F9. 3)WRITEC7,600) CUN,IC=1,68)
600 FORMATC +,5X,68A1)

WRITE(7,610) SST.IDFT610 F0RMAT(6X/TOTAL ',6X,F9. 3,5X,I2)
WRITE( 7,620)620 FORiMAT('0^,20X)
" Individual degree of freedom ANOVA calculations
DO 630 1=1,8Z(2)=Z(2)-SCR(1,I)-SCR(2,I)-SCR(3,I)+6*SCR(4,I)-SCR(5,I)-SCR(6,
CI)-SCR(7,I)630 CONTINUE
DO 640 1=1,8Z(3)=Z(3)+SCR(1,I)+SCR(2,I)+SCR(3,I)-SCR(5,I)-SCR(6,I)-SCR(7,I)
640 CONTINUEDO 650 1=1,8
Z( 4)=Z( 4)+SCR( 1 , 1 )+SCR( 2 , 1) -2^'SCR( 3,1)650 CONTINUE
DO 660 1=1,8Z( 5 )=Z( ^ )+SCR( 5 , I )+SCR( 6 , I
) -2"SCR( 7,1)660 CONTINUE
DO 663 1=1,8Z( 6>Z( 6)+SCR( 1,1) -SCR( 2,1)
663 CONTINUEDO 667 1=1,8
Z(7-)=Z(7)+SCR(5,I)-SCR(6,I)667 CONTINUE
DO 680 1=2,7WSQR(I)=(Z(IV'^'2)/D(I)FTEST(I)=WSQR(I)/MSE
680 CONTINUEWRITE(7,690)(DASH,IC=1.5).(DASH,JC=1,5)
690 F0RMAT(17X, 5Al,^ INDIVIDUAL DEGREES OF FREEDOM' ,5 Al)WRITE(7,700)
700 F0RMAT('0\20X)VRITE(7,710)
710 F0RMAT(6X, 'SOURCE' ,9X,'SS' ,8X,'DF' ,9X, 'MS' , lOX, 'FSTAT' ,8X,'SIGLVL'
WRITE(7,720) (UN,IC=1,7) ,(UN, JC=1 ,9) ,(UN,KC=1,2) ,(UN,LC=1,9),(UN,MCC=l,9),rUN,NC=l,8)
720 FORMATr+' ,5X,7A1,4X,9A1,5X,2A1,5X,9A1,5X,9A1,5X,8A1)
* Individual degree of freedom critical level computations
DO 760 1=2,7DO 730 KR=2,11
IF(FTEST(I). LT. F149(KR)) THENFRAT=(FTEST(I)-F149(KR-1))/(F149(KR)-F149(KR-1))PRB I=PRBF( KR- l)+FRAT^--( PRBF( KR) -PRBF( KR- 1 )
)
SGLVL(I) = 1. 0-PRBIGOTO 740
ELSEEND IF
730 CONTINUEIF(FTEST(I).LT. F149(l)) THEN
SGLVL(I)=. 999ELSE
SGLVL(I)=. 001END IF
740 WRITE(7,750) COLUMN( I) .WSQR( I) .VSQR( I) .FTEST( I) ,SGLVL( I)750 F0RMAT(6X,A7,4X,F9. 3,5X,^ l\5X,F9. 3,5X,F9. 5 ,5X,F8. 5)760 CONTINUE
it
WRITE(7.770) SSE.IDFE.MSE770 F0RMAT(7X/ ERROR' ,5X,F9. 3 ,5X, 12 ,5X,F9. 3)
WRITE(7,780) (UN,IC=1,68)780 FORMAT('+ ,5X,6SA1)
WRITE(7,790) SST.IDFT790 FORMAT(6X,^TOTAL',6X,F9.3,5X,I2)
STOPEND

***********Vf*Vf* ANOVA and Two Sample Tests *Vf**ycVc*VfVfVcyfyfVrVr
* This program computes the critical J.evels (the minimum levels of*signif icance required to reject the test s null hypothesis) from a*one-way Analysis of Variance (ANOVA) test and the associated two^sample tests. Before the t-tests are performed, an F-test of equal^variances is done and if the critical level is less than .05 (i. e. ,
'''unequal variances), a Behrens -Fisher-Welch test is performed instead*of a t-test.it
^VARIABLES:* ALEQMNfml,m2) - critical value for testing (mul = m2)* ALGTMN(ral,m2) - critical value for testing (mul >= m2)* ALLTMN(ml,m2) - critical value for testing (mul <= m2)* AMGPOP - sum of the squared total scores aivided by the # of data* D(ral,m2) - Welch test degrees of freedom for method ml and method m2* DASH - -"; a dash, used for output* DF(ml,m2) - t-test degrees of freedom for method ml and method m2* DFA - among population degrees of freedom (k-1)" DFE - error degrees of freedom (n-k)* DFDENR - right side of D(ml,m2) s denominator* DFDENL - left side of D(ml,ra2) s denominator* DFNUM - D(ral,m2)'s numerator* FRATIO - ratio used to compute ANOVA critical value* FSTAR - ANOVA test statistic* FSTAT(ml,m2) - test statistic in F-test of method ml and method m2* Fxy - F table values for (x,y) degrees of freedom* IDFA - integer among population degrees of freedom* IDFE - integer error degrees of freedom" IDFT - integer total degrees of freedom* Ml - method 1 .
•'
* M2 - method 2* MSA - among population mean square* MSE - error mean square* NTEST(m) - number of tests taken in the mth group* POLDEN - denominator of the t-test statistic" P0LNM2 - part of the numerator of rhe t-test statistic* POLNUM - part of the numerator of the t-test statistic* P0LVAR(ml,m2) - pooled variance of method ml and method m2* PRBFfi^ - percentiles of the tabled F, values" PRBT(i) - percentiles of the tabled t values* PRBS - used in computing the ANOVA critical value* PRBTl - used in computing the t-test critical value* RATIO - used in computing the ANOVA critical value* RGHIfm) - highest score m method m* RGLO(m) - lowest score in method m* SAMPSB(m) - sample standard deviation of method m" SCORE(m,j) - jth individual test score in method m•- SIGLVL - ANOVA critical level"'* SMPVARfm^ - sample variance of method m* SQRDEV(m) - sum of the squared deviations for method m* SSA - among population sum of squares* SSE - error sum of squares* SST - total sura of squares* SYIJSQ - sum of the squared test scores* TOTNUM - total number of tests* TOTSCR(m) - total of all test scores in method m" TOTSUM - total sum of all test scores" TSTAT(ml,m2) - t-test statistic for method ml and method m2* TWEL - t values for interpolated decrees of freedom" Tx - t table values for x degrees of freedom•• UDEN - denominator for USTAT(.ml,m2) of the Welch test* UN - _ ; the underline svmbol, used for output* UNUM - numerator for USTA'r(ml ,m2) of the Welch test" USTAT(ral,m2) - test statisric for the Welch test" XBAR(m") - sample mean for method m•^' I,J,K,KR,KT,L,M,M1,M2,N - counters
*" "Dummy variables used in the subroutines'-"" ALPHEQ used as ALEQMN(ml,m2)
^ f

'}"3'it
it-it*
ititit
•kitit
ititit
"ititif
ALPHGTALPHLTDM12FM1M2FMM12NMlNM2SVARMlSVARM2TATBTM1M2XMlXM2XXYY
used asused asused asused asis theused asused asused asused asused asused asused asused asused asused asused as
ALGTMN(ral,m2'ALLTMN(ral,m2'D(ml.m2)FSTAT(ml,m2)absolute valueNTEST(ml'NTEST(m2'SMPVARfrai"SMPVAR(ra2'TxTxTSTAT(ml,m2)XBAR(inl)XBAR(m2)Tx or FxyFD1D2 or T
of FM1M2
Variables used just in the subroutinesFHI - used in critical level computationsFLO - used in critical level computationsFRCTN - fractional part of the Welch degree of freedomsIDFINT - integer portion of the Welch degree of freedomRATIOl - used in critical level computationsRATI02 - used in critical level computations
INTEGER DFREAL MSA.MSECHARACTERS- 1 UN, DASHDIMENSION SCORE(7,12), NTEST(7)DIMENSION SMPVAR(7}, SAMPSD(7"DIMENSION FSTAT(7,/), PRBF( 11
TOTSCRC 7
POLVARC 7
,
PRBT(13)
XBAR(7), SQRDEV(7, TSTAT(/,7), T(1320(13), F663(ll)
DIMENSION Tli(13)J fi2(13), Tl^(13), T14^13), T16('l3), T18(13)DIMENSION F79(L1); F7li(lii, F97(ll5, F99(ll^, F911(li) ,F117( U)" ^ ~miN(7,7), ALLTi^N( 7 , / ) , USTAT(7^,7}DIMENSION ALEQMN().7). ALGDIMENSION D(7,7), RGHI(7), RGLODIMENSION TWEL(13)DATA PRBF/. 001,.0U.05,. 10
Ci]: DF(7,7), F119(ll), FD1D2(11)
25.. 5,. 75,. 9,. 95,. 99DATADATADATADATADATADATADATADATADATADATADATA
PRBT/.ODTil/. 13,T12/. 13,T13/. 13,T14/. 13,T16/. 13,T18/. 13,. 26;.
6,26,26,. 395,
65,.396
y,. 7^\. 8]'. 8^',. 9!! 9^',
2626,.26,
394,393,392,392;
i4,. 69754,. 695,54,. 694,54,. 692,54,. 690,53,-. 688,
87:87:87:86:
1. 69,1.1-. 08,1.1. 08,1.1. 08,1.1.071.07
^.....999/.9/5,. 99,. 995.. 9995/36,1. 3,2. 2,2. / ,3. 1,4.4/36,1. 8,2. 2,2. 7,3. 1,4. 3/35,1. 8,2. 2,2. 7,3. 0,4.2/34,1.8,2. 1,2. 6,3.0,4. 1/34,1.8,2. 1,2.6,2.9,4.0/33,1. 7,2. 1,2. 6,2. 9,3.9/
120/. 13,. 26,. 391,. 53,. 687 , . 86 . 1. 06 , 1. 32, 1. 7 ,2. 1,2. 5 ,2. 8, 3. 9/F79/.068,. 149,. 27,. 367 , . 59, . 978, 1. 6,2. 505 ,3. 29 ,5. 61, 10. //F7 11/. 07,. 15,. 27 7,. 37,. 59,. 96, 1.54, 2. 34.3.01,4. 886,8. 66/
^..... F97/. 09,. 178.. 304,. 399,. 62,1.02,1.69,2. 725,3. 677,6. 719,14. 3/DATA F99/. 099,. 187,. 315 , . 416 , . 6285 , 1. 0, 1. 59 ,2. 4,3. 179,5. 35,10. 1/DATA F9 11/. 10,. 19,. 32,. 417,. 63,. 986,1.528,2. 274,2. 896,4. 63,8. 12/DATA F117/. 115,. 205,. 33, . 427 , . 649 , 1. 037 , 1. 687,2. 69,3. 61,6. i4,13.9/DATA Fl 19/. 12,. 216,. 345,. 44,. 65,1. 014,1.58,2. 398,3. 105,5. 18,9. 73/DATA F663/. 06 , . 14 , . 267 , . 36, . 575 , . 96 , 1. 35 , 1. 86 ,2. 24, 3. 11 ,4. 35/DATA UN/^_'/, DASH/'-'/
Initialization steps
DO 10 1=1,7NTESTf I)=0TOTSCR(I)=0.SQRDEV(I)=0.0RGHiri)=0.RGLO(l) = 100.0
10 CONTINUEDO 30 L=l,7
DO 20 N=l,7ALEOMN(L,N)=0.0ALGTMN(L,N)=0.ALLTMN(L,N)=0.
20 CONTINUE30 CONTINUE
SYIJSQ=0.

TOTSUM=0.AMGPOP=0.T0TNUM=70.DFA=6.DFE=63.DO 40 1=1,11
FD1D2(I)=0.040 CONTINUE
DO 50 1=1,13'H^L(I)=0.0T(I)=0.
50 CONTINUE
* Data input
DO 120 M=l,7READ(5,100) SC0RE(M,1), SC0RE(M,2), SC0RE(M,3), SC0RE(M,4),
CSC0RE(M,5), SC0RE(M,6), SC0RE(M,7), SC0RE(M,8), SC0RE(M,9), SC0RE(CM, 10), SCOREfM.ll), SC0RE(M,12)
100 F0RMAT(12F5. 1)120 CONTINUE
* Initial computations for the ANOVA test
DO 150 M=l,7DO 130 J=1.12
IF(SCORE(M.J).EQ. 99.9) GOTO 130NTEST(M)=NTEST(M)+1TOTSCRrM)=TOTSCR(M)+SCORE(M,J)SYIJS0=SYIJSQ+SC0RE(M,J)"''2TOTSUH=TOTSUM+SCORE( M , J)IF(SCORECM,J).GT. RGHI(M)) RGHIf M)=SCORErM, J)IF(SCORE(M,J).LT. RGLO(M)) RGLO(M)=SCORE(M, J)
130 CONTINUEAMGPOP=AMGPOP+( TOTSCR( M) ^'^^2
) /REAL( NTEST( M)
)
XBAR(M)=TOTSCR(M)/REAL(NTEST(M))DO 140 J1=1,NTEST(M)
SQRDEV(M)=SQRDEV(M)+(SC0RE(M,J1)-XBAR(M))^^'>2140 CONTINUE
SMPVARf M) =SQRDEV( M) /REAL( NTESTC M) - 1
)
SAMPSD(M)=(SMPVAR(M))''-"'^ 5150 CONTINUE
Heading output
3) (DASH,IC=1,5),(DASH,JC=1,,5A1)
WRITE(7,153) (DASH,IC=1,5).(DASH,JC=1,5)153 F0RMAT(22X,5A1,'GRADE POINT AVERAGES'^,:'
WRITE(7,15^)155 F0RMAT(20X}
WRITE(7.157)157 F0RMAT(20X)
CALL ANOVA( SYIJSQ , TOTSUM , TOTNUM , AiMGPOP , DFA , DFE , F663 , PRBF , UN , DASH)
* Initial computations for the two sample testsif
DO 170 Ml=l,7DO 160 M2=l,7
IFfMl.EQ. M21 GOTO 160DF^Ml,M2)=NTEST(Ml)+NTEST(M2J-2P0LVAR(M1,M2)=(SQRDEV(M1)+SQRDEV(M2))/REAL(DF(M1,M2))P0LNUM=(XBAR(M1)-XBAR(M2))P0LNM2=((NTEST(M1)-''NTEST(M2))/REAL(NTEST(M1)+NTEST(M2)))P0LDEN=f P0LVAR(Ml.M2))'f'-. 5TSTAT(Mi ,M2)=P0LNUM^'KP0LNM2^'^^ 5)/P0LDENIF(DF(M1.M2).EQ. 16) THEN
CALL TCHECK(T16.T)ELSE IF(DF(M1.M2).EQ. 18) THEN
CALL TCHECK(T18,T)ELSE
CALL TCHECK(T20,T)END IF
- y

FSTAT(M1,M2)=SMPVAR(M1)/SMPVAR(M2)IF(NTEST(M1).EQ. 7) THEN
IF(NTEST(M2l. EQ. 9) THENCALL FCHECK(F79,FD1D2)
ELSECALL FCHECK(F711,FD1D2)
END IFELSE IF(NTEST(M1).EQ. 9) THEN
IFCNTEST(M2).EQ. 71 THENCALL FCHECK(F97,FD1D2)
ELSE IF(NTEST(M2).EQ. 9) THENCALL FCHECK(F99,FD1D2)
ELSECALL FCHECK(F911,FD1D2)
END IFELSE
IF(NTEST(M2).EQ. 7) THENCALL FCHECK(F117,FD1D2)
ELSECALL FCHECK(F119,FD1D2)
END IFEND IF
*
CALL EQUVAR(FSTAT(M1,M2),PRBF,FD1D2,TSTAT(M1,M2),T,PRBT,M1,M2.CXBAR(Ml) ,XBAR(M2) ,SMPVAR(M1) ,SMPVAR(M2) ,NTEST(Mli,NTEST(M2) ,ALEQMNC(M1,M2),ALGTMN(M1,M2),ALLTMN(M1,M2),T11,T12,T13,T14,TWEL)
160 CONTINUE170 CONTINUE
''"Data analysis output
WRITE(7,180)180 F0RMAT('l^,15X)
WRITE(7,190)190 F0RiMAT(20X)
WRITE (7, 200)200 F0RMAT(20X)
WRITE(7,210) (DASH,IC=1,12),(DASH,JC=1,13),(DASH,KC=1,4),(DASH,LC=CI. 4)
210 F0RMAT(19X,12A1, 'SAMPLE' , 13A1,9X,4A1, 'RANGE' ,4A1)WRITE(7,220)
220 F0RMATf20X)WRI'^Er7 2'^0^
230 FORMAt(i0X/MEAN',6X, 'VARIANCE' ,5X 'STD DEV' ,9X, 'HIGH' ,5X, 'LOW'
)
WRITE('7,240) (UN, IC=1 ,4) ,(UN, JC=1 ,8) , (UN,KC=1, 7) , (UN,LC=1 ,4) , (UN,M
CC=1,4)240 FORMAT('+' , 19X,4A1 ,6X,8A1 ,5X, 7A1 , 9X,4A1 ,5X,4A1)
WRITE(7,250)250 FORMAT(20X)
DO 270 M=l,7WRITE( 7,260) M, XBAR(M), SMPVAR(M), SAMPSD(M), RGHI(M) ,RGLO(M)
260 FORMAT(' METHOD' ,I2,10X,F6. 3,4X,F9. 3,5X,F7. 3,8X,F5. 1,5X,F4. 1)270 CONTINUE
WRITE(7,273)273 FORMAT(20X)
WRITE(7,276)276 FORMAT(20X)
'''Two samr)le critical level output
WRITE(7,280)280 F0RMAT(16X /table OF P-VALUES FOR REJECTING XBAR = YBAR' )
WRITE(7,290) (UN,IC=1,43)290 FORMATf '+' ,15X,43A1)
WRITE(7,300)300 F0RMAT(20X)
WRITE (7,310)310 F0RMAT(9X/ METHOD 1 METHOD 2 METHOD 3 METHOD 4 METHOD 5 METHOD 6
CMETHOD 7')
90
WRITE(7,320) (UN,IC=1 ,8) ,(UN, JC=1,8) ,(UN,KC=1,8) ,(UN,LC=1,8) ,(UN,MCC=1,81,(UN,NC=1,8),(UN,NC1=1.8)
320 FORMATC ^ + ', 9X, 8A1 , IX, 8Al , IX, 8A1 , IX, 8A1 , IX, 8A1 , IX, 8A1 , IX, 8A1)
WRITE(7,330)330 FORMATC 20X)
DO 350 M=l,7WRITE(7,340) M,ALEQMN(M, 1) ,ALEQMN(M,2) ,ALEQMN(M,3) ,ALEQMN(M,4)
,
CALEQMN(M,5 5,ALEQMN(M,6),AL£QMN(iM,7)340 FORMATC^ METHOD^ 12, 7F9. 5)350 CONTINUE
WRITE(7,360)360 FORMATC 20X)
WRITEC7,370)370 FORMATC 20X)
*WRITEC7,380)
380 FORMATC 16X/ TABLE OF P-VALUES FOR REJECTING XBAR > YEAR')WRITEC7,390) CUN,IC=1,43)
390 FORMATC +' ,15X,43A1)WRITEC7,400)
400 FORMATC 20X)WRITEC7.410)
410 FORMATC 9X/ METHOD 1 METHOD 2 METHOD 3 METHOD 4 METHOD 5 METHOD 6CMETHOD 7
'
)
WRITEC7.420) CUN,IC=1,8) ,CUN, JC=1,8) ,CUN,KC=1,8) ,CUN,LC=1,8) ,CUN,MCG^1,8),(UN,NC=1,8),CUN,NC1=1,8)
420 FORMATr+' ,9X,8A1, 1X,8A1, 1X,8A1, 1X,8A1 , 1X,8A1, 1X,8A1, 1X,8A1)WRITEC 7,430)
430 FORMATC 20X)DO 450 M=l,7
WRITEC 7,440) M,ALGTMNCM, 1) ,ALGTMNCM,2) ,ALGTMNCM,3) ,ALGTMNCM,4)
,
CALGTMNC M , 5 ) , ALGTMN( M , 6 ) , ALGTMNC M , 7
)
440 FORMATC METHOD , 12 , 7F9. 5)450 CONTINUE
WRITEC 7, 460)460 FORMATC 20X) .
*
• '
WRITEC 7, 470)470 FORMATC 20X)
.1.
WRITEC 7, 480)480 FORMATC 16X/ TABLE OJ P-VALUES FOR REJECTING XBAR < YEAR')
WRITEC7,490) CUN,IC=1,43)490 FORMATC +',15X,43A1)
WRITEC 7, 500)500 FORMATC 2 OX)
WRITEC 7,510)510 FORMATC 9X/ METHOD 1 METHOD 2 METHOD 3 METHOD 4 METHOD 5 METHOD 6
CMETHOD 7'
)
WRITEC 7, 520) CUN, IC=1,3) , CUN, JC=1,8) , CUN,KC=1,8) , CUN,LC=1 ,8) , CUN,MCC=1,8),{uN,NC=1,8),CUN,n6i=1,8)
520 FORMATC + , 9X, 8Al , IX , 8A1 , IX, 8A1 , IX, 8A1 , IX, 8A1 , IX, 8A1 , IX, 8A1)WRITEC 7, 530)
530 FORMATC 2 OX)DO 550 M=l,7
WRITEC 7,540) M,ALLTMNCM, 1) ,ALLTMNCM,2) ,ALLTMNCM,3) ,ALLTMNCM,4)
,
CALLTMNCM,5),ALLTMN(M,6).ALLTMNCM,7)540 FORMATC METH0D\I2, 7F9. 5)550 CONTINUE
WRITEC 7, 560)560 FORMATC 20X)
WRITEC 7, 570)570 FORMATC 20X)
STOPEND
*J.
SUBROUTINE AN0VACSYIJSQ,T0TSUM,T0TNUM,AMGP0P,DFA,DFE,F663,PRBF,UN,
91

CDASH)
*This subroutine uses the intial ANOVA computations, computes the final*ANOVA values, and prints an ANOVA table.
REAL MSA, MSEDIMENSION F663(ll), PRBF(ll)SST=SYIJSQ-(T0TSUM'-*2)/T0TNUMSSA=AMGP0P - ( TOTSUM" "2 ) /TOTNUMSSE=SST-SSAMSA=SSA/DFAMSE=SSE/DFEFSTAR=MSA/MSEDO 575 KR=2,11
*^Critical level computation
IF(FSTAR. LT. F663(KR)) THENFRATI0=(FSTAR-F663(KR-1))/(F663(KR)-F663(KR-1))PRBS=PRBF(KR-1)+FRATI0^''(PRBF(KR)-PRBF(KR-1))SIGLVL=1. 0-PRBSGOTO 578
ELSEEND IF
575 CONTINUE578 VRITE(7,580)(DASH,IC=1,5).(DASH,JC=1,5)580 FORMAT(26X.5A1,^ANOVA TABLE' ,5A1)
WRITE(7,583)583 FORMAT( 'o' ,20X)
WRITE (7, 5 851585 F0RMAT(6X,' SOURCE' ,9X,'SS' ,8X,'DF' ,9X,'MS' ,10X,'FSTAT' ,8X,'SIGLVL'
WRITE(7,590) (UN, IC=I,6) , (UN, JC=1,9) ,(UN,KC=1,2) ,(UN,LC=1,9) ,(UN,MCC=1,9),(UN,NC=1,8)
590 FORxMATr+ ,5X,6A1,5X,9A1,5X,2A1,5X,9A1,5X,9A1,5X,8A1)IDFA=INT(DFA)IDFE=INT(DFE) '
IDFT=IDFA+IDFEWRITE( 7,592) SSA, IDFA,MSA,FSTAR,SIGLVL
592 F0RMAT(6X. ' METHOD' ,5X,F9. 3,5X,I2,5X,F9. 3,5X,F9. 5 ,5X,F8. 5)WRITE(7,595) SSE.IDFE.MSE
595 F0RMAT(6X, 'error' 6X,F9. 3,5X, 12 ,5X,F9. 3)WRITE(7,6gO) (UN,IC=1,68)
600 F0RMAT(' + \5X,68A1)WRITE( 7,610} SST.IDFT
610 F0RMAT(6X,' TOTAL ',6X,F9. 3,5X,I2)WRITE(7,620)
620 FORMAT('0^,20X)RETURNEND
y«^y^y..^V^VrV' V'V'Vv Vv V'VcV' V'V'V» VrV'V^V*Vr^VrV(V'Vv V^VcV'VcV' Vc*VcV?V'
SUBROUTINE EQUVAR(FM1M2,PRBF.FD1D2.TM1M2,T,PRBT,M1 ,M2,XM1,XM2,SVARCM1,SVARM2,NM1,NM2,ALPHEQ,ALPHGT,ALPHLT,T11,T12,T13,T14,TWEL)
'vThis subroutine performs an F-test checking for equal variances. If"the critical value is less than .05 (i. e. . unequal variances), then"the Behrens-Fisher-Welch subroutine is called. If not (critical level"greater to or equal .05), then t-test subroutines are called.ic
DIMENSION PRBF(ll), PRBT(13), T(13), FD1D2(11)FMM12=ABS(FM1M2)RATI01=(. 025-PRBF(2))/(PRBF(3)-PRBF(2)FL0=FD1D2(2)+RATI01^'--(FD1D2(3)-FD1D2(2)RATI02=(. 975-PRBF(9))/(PRBF( 10)-PRBF(9'FHI=FD1D2(9)+RATI02^'>-(FD1D2(10)-FD1D2(9'IF(FMM12. LT. FLO. 0R.FMM12.GT. FHI) THEN
CALL WELGH(XM1,XM2,SVARM1,SVARM2,NM1,NM2,M1,M2,T11,T12,T13,TC14,r.VEL,PRBT)
ELSECALL EQMEAN(TM1M2,T,PRBT,ALPHEQ)CALL GTMEAN ( TM 1M2 , T , PRBT , ALPHGT
)

CALL LTMEAN(TM1M2,T,PRBT,ALPHLT)END IFRETURNEND
SUBROUTINE WELCH(XM1,XM2,SVARM1,SVARM2,NM1,NM2,M1,M2,T11,T12,T13,TC14,TWEL,PRBT)
ic
^'This subroutine computes the Behrens -Fisher-Welch statistics. The"Critical levels of this test are computed using the same subroutines"as the t-test.
DIMENSION USTAT(7,7), D(7,7)UNUM=XM1-XM2UDEN=SVARM1/REAL(NM1)+SVARM2/REAL(NM2)USTAT(M1,M2)=UNUM/(UDEN^''''. 5)DFNUM=UD£N""2DFDENL=(SVARM1^">2)/REAL((NM1-1)''-(NM1**2)DFDENR=( SVARiM2^^^'2l /REALC ( NM2 - 1r< NM2^-*2
)
D( Ml , M2 )=DFNUM/ ( DFDENL+DFDENR)IF(D(M1,M23. LT. 12) THEN
CALL WELCHT(T11,T12,TWEL,D(M1,M2))ELSE IF(D(M1,M2). LT. 131 THEN
CALL VELCHT(T12,T13,TWEL,D(M1,M2))ELSE
CALL WELCHT(T13,T14,TWEL,D(M1,M2))END IFCALL EQMEAN(USTAT(M1,M2),TWEL,PRBT,WALPEQ)CALL GTMEAN(USTAT(M1,M2) ,TVEL,PRBT,WALPGT)CALL LTMEAN(USTAT(M1,M2) ,TWEL,PRBT,WALPLT)lvTlITE(7,630) M1,M2,USTAT(M1,M2)
"Welch critical level output
630 F0RMAT(5X.''THE WELCH STATISTIC FOR METHOD', 12,' AND METHOD', 12,' I
CS: ,F7.3)WRITE{7,640j D(M1,M2)?0RMAT(5X, 'WITH_^^F7. 3,
',F7.3)
',F7.3)
640 ?0RMAT(5X,'WITH ',F7.3,' DEGREES OF FREEDOM.')WRITE (7,6421 WALPEQ
642 F0RMAt(5X,'THE P-VALUE FOR REJECTING XBAR = YEAR IS:WRITE (7, 644) WALPGT
644 FORMATC^X 'THE P-VALUE FOR REJECTING XBAR > YEAR IS:WRITE (7,646) WALPLT
646 FORMAT(ix,'THE P-VALUE FOR REJECTING XBAR < YEAR IS: ' ,F7. 3)WRITE(7,650)
650 F0RMAT(20X)WRITE(7,660)
660 FORMAT(20X)RETURNEND
SUBROUTINE EQMEAN(TM1M2,T,PRBT,ALPHEQ)
^'This subroutine computes the critical level of the null hvpotesis that'''MUl = MU2.
DIMENSION PRBT(13), T(13)TM12=ABS(TM1M2)IF(TM12.LT. T(l)) THEN
ALPHEQ=. 9
ELSE IF(TM12.GT.T(13)) THENALPHEQ=. 001
ELSEDO 670 K=2,13
IF(TM12.LT. T(K)) THENRATI0=(TH12-T(K-1))/(T(K)-T(K-1))PRBT1=PRBT( K- 1)+RATI0" ( PRET( K) -PRBT( K- 1 )
)
ALPHEQ=( 1. 0-PRBTl)"2.GOTO 675
ELSE
93

END IF670 CONTINUE675 END IF
RETURNEND
•ft
SUBROUTINE GTMEAN(TM1M2,T,PRBT,ALPHGT)*"This subroutine computes the critical level of the null hypotesis that^-MUl >= MU2.
DIMENSION PRBT(13), T(13)TM12=ABS(TM1M2)IF(TM12.LT. T(l)) THEN
ALPHGT=. 55IF(TM1M2. LT. 0. 0) ALPHGT=1. 0-ALPHGT
ELSE IF(TM12.GT. T(13)) THENALPHGT=. 9995IF(TM1M2. LT. 0. 0) ALPHGT=1. 0-ALPHGT
ELSEDO 680 K=2,13
IF(TM12. LT. T(K)) THENRATI0=(TM12-T(K-1))/(T(K)-T(K-1))PRBT1=PRBT(K-1)+RATI0*(PRBT(K)-PRBT(K-1))ALPHGT=PRBT1IF(TM1M2. LT. 0. 0) ALPHGT=1. 0-ALPHGTGOTO 685
ELSEEND IF
680 CONTINUE685 END IF
RETUT^NEND
y^ ij^y^y.y- J*,y.y^y^y^y^J^y«y.y^y-y^y^»uy^y*.yy^y«y.y«y«y^y^y^y^^^y^y^y^y^y^y-y.y.yuy^y.^y^y«y^y^y^y^y-y^y^y«y-y^y^y^y^ypVpy^VcV'VcVrV'^rV'VrVc
SUBROUTINE LTMEAN( TM1M2 , T , PRBT , ALPHLT)
"This subroutine computes the critical level of the null hvpotesis that"MUl <= MU2.
DIMENSION PRBT(13), T(13)TM12=ABS(TM1M2)IF(TM12.LT. T(l)} THEN
ALPHLT=. 4^IF(TM1M2. LT. 0. 0) ALPHLT=1. 0-ALPHLT
ELSE IF(TM12.GT. T(13)) THENALPHLT=. 0005IF(TM1M2. LT. 0. 0) ALPHLT=1. 0-ALPHLT
ELSEDO 690 K=2,13
IF(TM12.LT. T(K)) THENRATI0=(TM12-T(K-1))/(T(K)-T(K-1))PRBT1=PRBT(K-1)+RATI0^'-(PRBT(K)-PRBT(K-1))ALPHLT=1. 0-PRBTlIF(TM1M2. LT. 0. 0) ALPHLT=1. 0-ALPHLTGOTO 695
ELSEEND IF
690 CONTINUE695 END IF
RETL'RNEND
ydy^K'dKf.aB^i««ji»Kf*yaB'aKi'aa,'.>ajUKj«y^Kt««]^^^a^«a^aKf^»f^»f«Bi^«^«Kf^*f.aaj«Kt^«f^aj«K^«KitpK'^*JLa*f«y«Kf^»i*»f^y«KfA»^aXay^ypy'>»*^
SUBROUTINE FCHECK(XX,YY)
^'Once the degrees of freedom for an F-test are known, this subroutine"puts the associated F values in a dummy variable, YY, for use in the-program elsewhere.
DIMENSION XX(11),YY(11)

DO 700 1=1,11YY(I)=XX(I)
700 CONTINUERETURNEND
*tfm*iftJm^mmS^mS^tJm!*«l*tj^tS^»J<^j*IU^jmf»^fmtm«1m»)^mSpJpJ^tJmtfmJg mS»»3^tJ^fcf^aSfmfm^SpJf»SmJt»mJgmSm*J^Jm Jt*»J<*JUWJ wfj*«JjaJ^>JymJm 'ff^ff*'f*'f ^'f^**ff^f^f^nf"f*^f*^yfy*?f*^f"*wJ*^*
SUBROUTINE TCHECK(XX,YY)
*Once the degree of freedom for a t-test is known, this subroutine"puts the associated t values in a dummy variable, YY, for use in the^program elsewhere.
DIMENSION XX(13),YY(13)DO 710 1=1.13
YY(I)=XX(I)710 CONTINUE
RETURNEND
SUBROUTINE WELCHT(TA,TB,TWEL,DM12)
This subroutine computes the associated t values for the degrees of" ' " " h t<''freedom of the Welch test statistic
Vc
DIMENSION TA( 13), TB(13), TWEL(13)JDFINT=INT(DM12)FRCTN=DM12-REAL(JDFINT)DO 720 KT=1,13
TWEL(KT)=TA(KT)+FRCTN^KTB(KT)-TA(KT))720 CONTINUE
RETURNEND
95

APPENDIX H
STATISTICAL RESULTS
0.0000 - Placeholder (either a method was not compared againstitself or a Welch test was performed for that case)
XBAR - mu of the row methodYBAR - rau of the column method
METHOD TYPE OF TRAINING1 LECTURE2 VIDEO3 READING4 CONTROL5 AUDIO 1. 006 AUDIO 1.257 AUDIO 1.50
Chi-square Goodness of Fit Test Results
Input Data Mean Std Dev Te:St Statistic Crt Lvl
INITIAL 20.76 6.509 14.0539 0. 23525RETENTION 21.21 4.650 15.6872 0. 16720OLD QUEST 15.92 2. 730 16. 3958 0. 13768NEW QUEST 5. 13 2.640 10.2583 0.50333GPA 2. 82 0.556 14.5692 0. 21378
All Test ScoresA. Data Analysis
(1) Initial Test
METHODMETHODMETHODMETHODMETHODMETHODMETHOD
SAMPLE-'
MEAN VARIANCE
18.450 50.02521. 150 39.50321.563 • 24; 88813. 667 25.92424.350 73.94724.500 80. 88923.200 20.511
STD DEV
7.0736. 2854.9895.0928.5998.9944.529
-RANGE-
HIGH LOW
34. 11.532. 11.526.5 14.19.5 4.037. 5 10.038. 10.031.5 19.0
METHODMETHODMETHODMETHODMETHODMETHODMETHOD
(2) Retention Test
MEAN
SAMPLE
VARIANCE STD DEV
20. 25021. 30022. 12517.20824. 30021. 90021. 250
25.45815. 34411. 62514.83918.01138. 60035.014
5.
3.
3.
3.
4.
6.
5.
046917410852244213917
RANGE
HIGH LOW
28.0 13.026. 5 14.026. 16.24.0 10.032.0 17.032. 11.028.5 13.
96

(3) Old Questions
MEAN
SAMPLE
VARIANCE STD DEV
RANGE
HIGH LOW
METHOD 1 15. 100 10.267 3. 204 19.5 10.0METHOD 2 16.650 3.558 1.886 19.0 14.
METHOD 3 16.500 2.286 1.512 19.0 14.METHOD 4 13.958 7.930 2.816 18.0 8.
METHOD 5 17.000 6.222 2.494 21.0 13.METHOD 6 16.550 13.803 3. 715 22.0 11.0METHOD 7 16.200 11.956 3.458 20.5 11.0
(4) New Questions
MEAN
SAMPLE
VARIANCE STD DEV
RANGE
HIGH LOW
METHOD 1 5. 150 6.947 2.636 9.5 1.0METHOD 2 4. 650 8.614 2.935 9.5 0.
METHOD 3 5. 625 5.482 2.341 9.0 2.0METHOD 4 3.250 2. 295 1.515 6. 2.0METHOD 5 7. 300 7. 344 2. 710 11.5 3.5METHOD 6 5. 350 11. 392 3. 375 12. 0.0METHOD 7 5.050 8. 803 2.967 9.0 0.0
Analysis of the Initial Test Scores(1) One-way ANOVA
SOURCEMETHODERROR
SS992.
2843.105270
DF
63
MS165. 35145. 131
FSTAT3. 65378
CRTLVL0. 00598
TOTAL \5. 375 T9
METHODMETHODMETHODMETHODMETHODMETHODMETHOD
(2) Two Sample t-tests
Table of Critical Values for Rejecting XBAR = YBAR
METHOD 1 METHOD 2 METHOD 3 METHOD 4 METHOD 5 METHOD 6 METHOD 7
0. 000000. 379820. 309830.082210. 106570. 107540.03894
0. 379820.000000.883740.007640. 357120. 349770.41348
0. 309830. 883740.000000.005280.432690.425170.47835
0. 082210. 007640.005280. 000000.003300. 003820.00100
0. 106570. 357120.432690.003300. 000000. 900000. 71350
0. 107540. 349770.425170.003820. 900000. 000000. 00000
0. 088940.413480.478350.001000. 713500. 688230. 00000
Table of Critical values for Rejecting XBAR > YBAR
METHOD 1 METHOD 2 METHOD 3 METHOD 4 METHOD 5 METHOD 6 METHOD 7
METHODMETHODMETHODMETHODMETHODMETHODMETHOD 7
0. 000000. 810090.845090. 041100. 946710. 946230.95553
0. 189910.000000.558130. 003820. 821440. 825120. 79326
0. 154910.441870. 000000.002640. 783660. 787410. 76083
0. 958900. 996180. 997360.000000. 998350. 998090. 99950
0.053290. 178560. 216340. 001650. 000000.550000. 35675
0.053770. 174880. 212590.001910. 450000.000000.00000
0. 044470. 206740. 239170.000500. 643250. 655890. 00000
Q7

METHODMETHODMETHODMETHODMETHODMETHOD
Table of Critical Values for Rejecting XBAR < YEAR
METHOD 1 METHOD 2 METHOD 3 METHOD 4 METHOD 5 METHOD 6 METHOD 7
0.000000. 189910. 154910.958900.053290.05377
0. 810090.000000.441870. 996180. 178560. 17488
0. 845090.558130.000000.997360.216340.21259
0.041100.003820. 002640.000000.001650. 00191
0.946710.821440. 783660. 998350.000000.45000
0.946230. 825120. 787410. 998090.550000. 00000
0.955530. 793260. 760830. 999500.356750. 34411
METHOD 7 0.04447 0.20674 0.23917 0.00050 0.64325 0.00000 0.00000
(3) Welch Test Result
THE WELCH STATISTIC FOR METHOD 7 AND METHOD 6 IS: -0. 408WITH 13. 289 DEGREES OF FREEDOM.THE CRITICAL VALUE FOR REJECTING XBAR = YEAR IS: 0. 690THE CRITICAL VALUE FOR REJECTING XEAR > YEAR IS: 0. 345THE CRITICAL VALUE FOR REJECTING XBAR < YEAR IS: 0. 655
Analysis of the Retention Test Scores(1) One-way ANOVA
SOURCEMETHODERROR
SS306. 6211436.461
DF
63
MS51. 10422. 801
FSTAT2.24129
CRTLVL0. 04994
TOTAL 1743. 082 69
(2) Two Sample t-tests
Table of Critical Values for Reiecting XBAR = YBAR
METHOD 1 METHOD 2 METHOD 3 METHOD 4 METHOD 5 METHOD 6 METHOD 7
METHOD 1 b. 00000 0.60739 0.38635 0.12530 0.06969 0.52283 0.68938METHOD 2METHOD 3
METHOD 4METHOD 5METHOD 6
METHOD 7
0. 607390. 386350. 125300. 069690.522830. 68938
0.000000. 647560.022860. 115510.801280. 90000
0.647560.000000.009800.260950. 900000. 71624
0. 022860. 009800. 000000. 001000. 044860. 07124
0. 115510. 260950. 001000. 000000. 329190. 20211
0.801280. 900000. 044860. 329190. 000000. 81572
0.900000. 716240. 071240. 202110.815720. 00000
Table of Critical Values for Reiecting XBAR > YEAR
METHOD 1 METHOD 2 METHOD 3 METHOD 4 METHOD 5 METHOD 6 METHOD 7
METHOD 1 0.00000 0.30369 0.19317 0.93735 0.03484 0.26142 0.34469METHOD 2METHOD 3
METHOD 4METHOD 5METHOD 6METHOD 7
0. 696310. 806830. 062650. 965160. 738580. 65531
0. 000000.676220. 011430. 942250.599360.45000
0. 323780. 000000.004900.869530.450000. 35812
0. 988570. 995100. 000000. 999500. 977570. 96438
0. 057750. 130470.000500. 000000. 164600. 10105
0. 400640.550000. 022430.835400. 000000. 40786
0.550000. 641880.035620. 898950.592140. 00000
oo

METHODMETHODMETHODMETHODMETHODMETHODMETHOD
Table of Critical Values for Rejecting XBAR < YBAR
METHOD 1 METHOD 2 METHOD 3 METHOD 4 METHOD 5 METHOD 6 METHOD 7
0.000000. 303690. 193170.937350.034840.261420.34469
0. 696310. 000000. 323780. 988570.057750.400640.55000
0.806830. 676220.000000. 995100. 130470.550000.64188
0.062650.011430. 004900. 000000.000500.022430.03562
0. 965160. 942250. 869530. 999500. 000000.835400.89895
0. 738580.599360.450000. 977570. 164600. 000000.59214
0.655310.450000. 358120. 964380. 101050.407860. 00000
(3) Welch Tests-there were no Welch Tests performed
D. Analysis of the Old Questions(1) One-way ANOVA
SOURCEMETHODERROR
SS77. 340
515. 484
DF
63
MS12.890
FSTAT1.57535
CRTLVL0. 18372
TOTAL 592. 824 69
METHODMETHODMETHODMETHODMETHODMETHODMETHOD
(2) Two Sample t-tests
Table of Critical Values for Rejecting XBAR = YBAR
METHOD .1 METHOD 2 'METHOD 3 METHOD 4 METHOD 5 METHOD 6 METHOD 7
0. 000000. 204520.000000.385150. 159560.364470.47099
0. 204520. 00000.0.859600.017520. 728860. 900000. 72327
0. 000000.859600.000000. 036480. 629120.000000. 00000
0. 385150.017520.036480.000000. 01485•0. 079810. 10595
0. 159560. 728860. 629120.014850. 000000. 756050.55990
0. 364470. 000000. 000000.079810. 756050. 000000.33225
0.470990. 723270. 000000. 105950. 559900.832250.00000
METHODMETHODMETHODMETHODMETHODMETHODMETHOD
Table of Critical Values for Rejecting XBAR > YBAR
METHOD 1 METHOD 2 METHOD 3 METHOD 4 METHOD 5 METHOD 6 METHOD 7
0. 000000. 897740. 000000. 192570. 920220. 817760. 76451
0. 102260.000000.429800. 008760. 635570.450000. 36163
0.000000.570200. 000000. 018240. 685440. 000000. 00000
0. 807430. 991240. 981760. 000000. 992580.960090.94703
0. 079780. 364430. 314560. 007420. 000000. 378030.27995
0. 182240. 000000. 000000. 039910. 621970.000000.41613
0. 235490. 638370. 000000. 052970. 720050. 583870. 00000
Table of Critical Values for Rejecting XBAR < YBAR
METHOD 1 METHOD 2 METHOD 3 METHOD 4 METHOD 5 METHOD 6 METHOD 7
METHOD 1METHOD 2METHOD 3
METHOD 4METHOD 5METHOD 6METHOD 7
0. 000000. 102260. 000000. 807430. 079780. 182240. 23549
0. 897740.000000. 570200.991240. 364430.550000. 63837
0.000000.429800. 000000. 981760. 314560.000000. 00000
0. 192570.008760. 018240. 000000.007420. 039910. 05297
0. 920220. 635570. 685440. 992580. 000000. 621970. 72005
0. 817760. 000000. 000000. 960090. 378030.000000. 58387
0. 764510. 361630. 000000. 947030. 279950.416130. 00000
Of̂9

(3) Welch Tests
THE WELCH STATISTIC FOR METHOD 1 AND METHOD 3 IS: -1.222WITH 13. 375 DEGREES OF FREEDOM.THE CRITICAL VALUE FOR REJECTING XBAR = YEAR IS: 0. 247THE CRITICAL VALUE FOR REJECTING XBAR > YEAR IS: 0. 123THE CRITICAL VALUi: FOR REJECTING XBAR < YEAR IS: 0.877
THE WELCH STATISTIC FOR METHOD 2 AND METHOD 6 IS: 0. 076WITH 13.351 DEGREES OF FREEDOM.THE CRITICAL VALUE FOR REJECTING XBAR = YEAR IS: 0. 900THE CRITICAL VALUE FOR REJECTING XBAR > YEAR IS: 0.550THE CRITICAL VALLll FOR REJECTING XBAR < YEAR IS: 0.450
THE WELCH STATISTIC FOR METHOD 3 AND METHOD 1 ISWITH 13. 375 DEGREES OF FREEDOM.THE CRITICAL VALUE FOR REJECTING XBAR = YEAR ISTHE CRITICAL VALUE FOR REJECTING XBAR > YEAR ISTHE CRITICAL VALUE FOR REJECTING XBAR < YEAR IS
1.222
0.2470. 8770. 123
THE WELCH STATISTIC FOR METHOD 3 ANT) METHOD 6 IS: -0. 039WITH 12.427 DEGREES OF FREEDOM.THE CRITICAL VALUE FOR REJECTING XBAR = YEAR IS: 0. 900THE CRITICAL VALUE FOR REJECTING XBAR > YEAR IS: 0.450THE CRITICAL VALUE FOR REJECTING XBAR < YEAR IS: 0.550
THE WELCH STATISTIC FOR METHOD 3 AND METHOD 7 IS: 0. 246WITH 12.871 DEGREES OF FREEDOM.THE CRITICAL VALUE FOR REJECTING XBAR = YEAR IS: 0.810THE CRITICAL VALUE FOR REJECTING XBAR > YEAR IS: 0.595THE CRITICAL VALUE FOR REJECTING XBAR < YEAR IS: 0. 405
THE WELCH STATISTIC FOR METHOD 6 AND METHOD 3 IS: 0. 039WITH 12.427 DEGREES OF FREEDOM.THE CRITICAL VALUE FOR REJECTING XBAR = YEAR IS: 0. 900THE CRITICAL -VALUE FOR REJECTING XBAR > YEAR IS: 0.550THE CRITICAL VALUE FOR REJECTING XBAR < YEAR IS: 0.450
THE WELCH STATISTIC FOR METHOD 7 AND METHOD 3 ISWITH 12.871 DEGREES OF FREEDOM.THE CRITICAL VALUE FOR REJECTING XBAR = YEAR ISTHE CRITICAL VALUE FOR REJECTING XBAR > YEAR ISTHE CRITICAL VALUE FOR REJECTING XBAR < YEAR IS
-0. 246
0. 8100.4050.595
Analysis of the New Questions(1) One-way ANOVA
SOURCE SS DF
63
MSMETHODERROR
94. 317451. 526
15. 7207. 167
TOTAL 545. 343 69
FSTAT2. 19330
CRTLVL0. 05614
I
100

(2) Two Sample t-tests
Table of Critical Values for Rejecting XBAR = YBAR
METHOD 1 METHOD 2 METHOD 3 METHOD 4 METHOD 5 METHOD 6 METHOD 7
METHOD 1 0.00000 0.69361 0.69543 0.04864 0.08769 0.88639 0.90000METHOD 2METHOD 3METHOD 4METHOD 5METHOD 6METHOD 7
0.693610.695430.048640.087690.886390.90000
0.000000.459050. 167800.050280.625430. 76735
0.459050. 000000.014410. 190890. 849720.66275
0. 167800. 014410. 000000.001000.000000.08258
0.050280. 190890. 001000.000000. 174430.09117
0.625430. 849720.000000. 174430.000000. 83761
0. 767350.662750. 000000.091170.837610.00000
Table of Critical Values for Rejecting XBAR > YBAR
METHOD 1 METHOD 2 METHOD 3 METHOD 4 METHOD 5 METHOD 6 METHOD 7
METHOD 1 0.
METHOD 2 0.
METHOD 3 0.
METHOD 4 0.
METHOD ,5 0.
METHOD 6 0.
METHOD 7 0.
00000346806522902432956155568045000
65320000007704808390974866872861632
34771229520000000721904554248633138
0.975680. 916100. 992790. 000000.999500. 000000. 95871
0.043850. 025140.095450.000500. 000000.087220. 04558
0.443200. 312720.575140. 000000.912780. 000000.41880
0.550000. 383680. 668620.000000. 954420.581200. 00000
METHODMETHODMETHODMETHODMETHODMETHOD
Table of Critical Values for Rejecting XBAR < YBAR
METHOD 1 METHOD 2 METHOD 3 METHOD 4 METHOD 5 METHOD 6 METHOD 7
METHOD 1 0.000000. 653200. 347710. 975680.043850.443200.55000
0. 346800.000000. 229520. 916100.025140. 312720. 38368
0. 652290. 770480.000000. 992790.095450.575140.66862
0.024320. 083900. 007210. 000000. 000500. 000000. 04129
0. 956150. 974860. 904550. 999500. 000000. 912780. 95442
(3) Welch Tests
THE WELCH STATISTIC FOR METHOD 4 AND METHOD 6 ISWITH 11.999 DEGREES OF FREEDOM.THE CRITICAL VALUE FOR REJECTING XBAR = YBAR ISTHE CRITICAL VALUE FOR REJECTING XBAR > YBAR ISTHE CRITICAL VALUE FOR REJECTING XBAR < YBAR IS
0.556800.687280.424860. 000000.087220. 000000.58120
-1. 821
0.0970. 0490.951
0.450000. 616320. 331380.000000.045580.418800. 00000
THE WELCH STATISTIC FOR METHOD 4 AND METHOD 7 IS: -1.739WITH 12. 840 DEGREES OF FREEDOM.THE CRITICAL VALUE FOR REJECTING XBAR = YBAR IS: 0. 114THE CRITICAL VALUE FOR REJECTING XBAR > YBAR IS: 0.057THE CRITICAL VALUE FOR REJECTING XBAR < YBAR IS: 0. 943-
THE WELCH STATISTIC FOR METHOD 6 AND METHOD 4 IS: 1. 821WITH 11. 999 DEGREES OF FREEDOM.THE CRITICAL VALUE FOR REJECTING XBAR = YBAR IS: 0. 097THE CRITICAL VALUE FOR REJECTING XBAR > YBAR IS: 0.951THE CRITICAL VALUE FOR REJECTING XBAR < YBAR IS: 0. 049
101

3. Equal Group Size Test Scores
A. Data analysis
(1) Initial Test
--------- SAMPLE RANGE
MEAN VARIANCE STD DEV HIGH LOW
METHOD 1 16.938 25.460 5.046 26.5 11.5METHOD 2 20.500 40.500 6.364 32.0 11.5METHOD 3 21.563 24. 888 4. 989 26.5 14.0METHOD 4 12.438 29.674 5.447 19.0 4.METHOD 5 26.250 61.429 7. 838 37.5 18.0METHOD 6 27.500 50. 786 7. 126 38.0 14.5METHOD 7 23.500 23.286 4. 826 31.5 19.0
(2) Retention Test
. ---CAMPTTT--- . - - - -T? AMPir
MEAN VARIANCE STD DEV
---"KAINuiJ
• HIGH LOW
METHOD 1 19.250 24. 857 4.986 28.0 13.0METHOD 2 21.438 16. 603 4.075 26.5 14.METHOD 3 22. 125 11. 625 3.410 26.0 16.0METHOD 4 16. 750 14. 286 3. 780 21.0 10.0METHOD 5 24. 313 22. 710 4. 765 32.0 17.METHOD 6 23.500 29.214 5.405 32.0 14.5METHOD 7 21.375 27. 768 5.270 28.5 13.0
(3) Old Questions
SAMPLE RANGE
MEAN VARIANCE STD DEV HIGH LOW
METHOD 1 14. 125 • 7.696 2. 774 18.5 10.0METHOD 2 16.625 3. 125 1. 768 19.0 14.0METHOD 3 16.500 2.236 1.512 19.0 14.0METHOD 4 13.500 8. 286 2.878 16.0 8.0METHOD 5 17. 125 7. 839 2. 800 21.0 13.METHOD 6 17.563 11.246 3. 353 22.0 11.0METHOD 7 16.063 11. 246 3. 353 19.5 11.0
(4) New Questions
METHODMETHODMETHODMETHODMETHODMETHODMETHOD 7
MEAN
SAMPLE
VARIANCE STD DEV
5. 125 7. 482 2. 7354.813 10. 638 3.2625.625 5.482 2. 3413.250 2. 143 1.4647. 188 9. 210 3.0355. 938 10. 103 3. 1785. 313 6.353 2.520
RANGE
HIGH LOW
9.5 1.09.5 0.
9.0 2.
5.5 2.011.5 3.512. 3.
9.0 2.
102

B. Analysis of the Initial Test
(1) One-way ANOVA
SOURCE ss DF6
49
MS FSTAT CRTLVLMETHODERROR
1328. 3441792. 156
221. 39136.575
6. 05312 0. 00100
TOTAL 3120.500 55
(2) Individual Degrees of Freedom ANOVA
SOURCE SS DF1
MS FSTAT CRTLVL4V12356 723.360 723.360 19. 77765 0. 00100123V567 444. 083 1 444. 083 12. 14184 0. 0012612 V 3 43. 130 1 43. 130 1. 17924 0. 3002156 V 7 60. 750 1 60. 750 1. 66099 0. 218651 V 2 50. 766 1 50. 766 1. 38800 0. 247085 V 6 6.250 1 6.250 0. 17088 0. 70246ERROR 1792. 156 49 36.575
TOTAL 3120.500 55
METHODMETHODMETHODMETHODMETHODMETHODMETHOD
(3) Two Sample t-tests
Table of Critical Values for Rejecting XBAR = YBAR
METHOD 1 METHOD 2 METHOD 3 METHOD 4 METHOD 5 METHOD 6 METHOD 7
0.000000.238200.092730. 118660.014360.006550.01854
0. 238200. 000000. 716060. 016940. 141110.054630. 30836
0. 092730. 716060. 000000. 005960. 181080.078250.44520
0. 118660. 016940. 005960. 000000. 001060.001000.00100
0.014360. 141110. 181080. 001060. 000000. 744540.41400
0. 006550. 054630. 078250. 001000. 744540. 000000. 20979
0. 013540. 308360. 445200. 001000.414000. 209790. 00000
Table of Critical Values for Rejecting XBAR > YBAR
METHOD 1 METHOD 2 METHOD 3 METHOD 4 METHOD 5 METHOD 6 METHOD 7
METHOD 1 0.00000 0.11910 0.04637 0.94067 0.00718 0.00328 0.00927METHOD 2METHOD 3METHOD 4METHOD 5METHOD 6METHOD 7
0. 880900. 953630. 059330. 992820. 996720.99073
0.000000. 641970. 008470. 929440.972690.84582
0.358030.000000.002980. 909460.960880. 77740
0.991530.997020. 000000. 999470. 999500.99950
0. 070560. 090540. 000530. 000000. 627730.20700
0. 027310.039120. 000500. 372270.000000. 10489
0. 154180. 222600. 000500. 793000. 895110. OOGOO
Table of Critical Values for Rejecting XBAR < YBAR
METHOD 1 METHOD 2 METHOD 3 METHOD 4 METHOD 5 METHOD 6 METHOD 7
METHOD 1 0.00000 0.88090 0.95363 0.05933 0.99282 0.99672 0.99073METHODMETHODMETHODMETHODMETHODMETHOD
0. 119100.046370.940670. 007180.003280. 00927
0.000000. 358030.991530. 070560. 027310. 15418
0.641970.000000. 997020.090540.039120. 22260
0. 008470. 002980.000000.000530. 000500. 00050
0. 929440. 909460.999470. 000000. 372270. 79300
0. 972690.960880. 999500. 627730. 000000. 89511
0. 845820. 777400.999500. 207000. 104890.00000

(4) Welch Tests-no Welch Tests were performed
C. Analysis of the Retention Test
(1) One-way ANOVA
SOURCE SS
49
MS FSTAT CRTLVLMETHODERROR
316.0621029.437
52.67721.009
2.50737 0. 04078
TOTAL 1345.500 55
(2) Individual degrees of freedom ANOVA
SOURCE SS DF1
MS FSTAT CRTLVL4V12356 189. 000 189. 000 8. 99618 0. 00o82123V567 54. 188 54. 188 2.57926 0. 1229912 V 3 16.922 16.922 0. 80546 0.4040456 V 7 34. 172 34. 172 1.62654 0. 222241 V 2 19. 141 19. 141 0.91107 0. 374705 V 6 2.641 2. 641 0. 12569- 0. 73411ERROR 1029.437 49 21. 009
TOTAL 1345.500 55
METHODMETHODMETHODMETHODMETHODMETHODMETHOD
(3) Two Sample t-tests
Table of Critical Values for Rejecting XBAR = YEAR
METHOD 1 METHOD 2 METHOD 3 METHOD 4 METHOD 5 METHOD 6 METHOD 7
0.000000. 356710. 198630. 280690. 053980. 135930.42330
0. 356710. 000000. 720300. 032870. 216560. 404590. 90000
0. 198630. 720300. 000000. 010330. 311470.554890. 74136
0. 230690. 032870. 010330. 000000. 005770.012630. 06379
0. 053980.216560. 311470. 005770. 000000. 755700.26560
0. 135930.404590.554890. 012630. 755700.000000. 44145
0. 423300. 900000. 741360. 063790. 265600. 441450. 00000
Table of Critical Values for Rejecting XBAR > YEAR
METHOD 1 METHOD 2 METHOD 3 METHOD 4 METHOD 5 METHOD 6 METHOD 7
METHOD 1 0.00000 0.17836 0.09931 0.85966 0.02699 0.06796 0.21165METHODMETHODMETHODMETHODMETHODMETHOD
0. 821640. 900690. 140340. 973010.932040. 78835
0. 000000. 639850.016430.891720. 797710.45000
0. 360150. 000000. 005170. 844260. 722560. 37068
0. 983570. 994830. 000000. 997110. 993680. 96810
0. 108280. 155740.002890. 000000. 377850. 13280
0. 202290. 277440. 006320.622150. 000000. 22072
0. 550000. 629320. 031900. 867200. 779280. 00000
Table of Critical Values for Rejecting XBAR < YEAR
METHOD 1 METHOD 2 METHOD 3 METHOD 4 METHOD 5 METHOD 6 METHOD 7
METHOD 1 0.00000 0.82164 0.90069 0.14034 0.97301 0.93204 0.78835METHODMETHODMETHODMETHODMETHODMETHOD 7
0. 17S360. 099310. 859660. 026990. 067960. 21165
0. 000000. 360150. 983570. 108280. 202290.55000
0. 639850. 000000. 994830. 155740. 277440. 62932
0. 016430. 005170. 000000. 002890. 006320. 03190
0. 891720. 844260.997110. 000000. 622150. 86720
0. 797710. 722560. 993680. 377850. 000000. 77928
0. 450000. 370680. 968100. 132800. 220720. 00000
lOip

(4) Welch Tests-no Welch Tests were preformed
Analysis of the Old Questions(1) One-way ANOVA
SOURCEMETHODERRORTOTAL
SS112.652362. 062
DF-I49
MS18. 7757. 389
FSTAT2.54098
CRTLVL0. 03929
474. 715 55
(2) Individual Degrees of Freedom Anova
SOURCE SS DF MS FSTAT CRTLVL4V12356 55.048 55.048 7. 44991 0. 00956123V567 16.333 16. 333 2.21048 0. 1614112 V 3 6. 750 6. 750 0.91352 0.3740256 V 7 8.755 8.755 1. 18489 0.298641 V 2 25.000 25.000 3.38339 0.076485 V 6 0. 766 0.766 0. 10362 0. 74957ERROR 362.062 49 7. 389
TOTAL 474.715 55
(3) Two Sample t-tests
Table of Critical Values for Rejecting XBAR = YEAR
METHOD 1 METHOD 2 METHOD 3 METHOD 4 METHOD 5 METHOD 6 METHOD 7
METHOD 1 0.00000 0.04703 0.04843 0.66654 0.04683 0.04196 0.23110METHODMETHODMETHODMETHODMETHODMETHOD
0.047030. 048430.666540. 046830.041960. 23110
0.000000.883080.019580. 676810.495790. 68134
0. 883080.000000.019760.589770.429790. 74256
0.019580. 019760.000000. 022800. 020000. 13478
0. 676810.589770. 022800. 000000. 782510.50269
0.495790. 000000. 020000. 782510. 000000. 38828
0. 681840. 000000. 134780. 502690. 388280. 00000
METHODMETHODMETHODMETHODMETHODMETHODMETHOD
Table of Critical Values for Rejecting XBAR > YEAR
METHOD 1 METHOD 2 METHOD 3 METHOD 4 METHOD 5 METHOD 6 METHOD 7
0. 000000. 976490. 975780. 333270. 976580.979020. 88445
0.023510. 000000.441540. 009790. 661600. 752100. 34092
0. 024220.558460. 000000. 009880. 705120. 785100. 37128
0. 666730. 990210. 990120. 000000. 988600.990000.93261
0. 023420. 338400. 294880.011400.000000. 608740.25135
0.020980. 247900. 000000. 010000.391260. 000000. 19414
0. 115550.659080. 000000.067390. 748650. 805860. 00000
METHODMETHODMETHODMETHODMETHODMETHOD
Table of Critical Values for Rejecting XEAR < YEAR
METHOD 1 METHOD 2 METHOD 3 METHOD 4 METHOD 5 METHOD 6 METHOD 7
METHOD 7
0.000000.023510. 024220. 666730.023420.020980. 11555
0.976490. 000000. 558460. 990210. 338400.247900. 65908
0.975780.441540. 000000. 990120. 294880. 214900. 62872
0. 333270. 009790.009880. 000000. 011400.010000. 06739
0.976580. 661600. 705120. 988600.000000. 391260. 74865
0.979020. 752100.000000. 990000. 608740. 000000. 80586
0. 884450. 340920. 000000. 932610. 251350. 194140. 00000
105
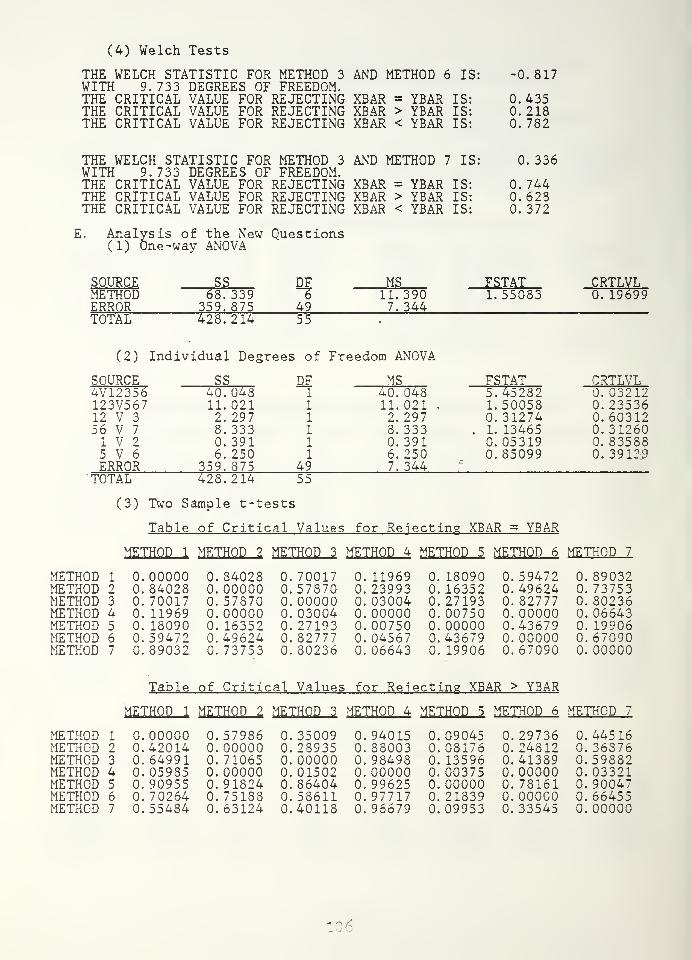
(4) Welch Tests
THE WELCH STATISTIC FOR METHOD 3 AND METHOD 6 IS: -0.817WITH 9.733 DEGREES OF FREEDOM.THE CRITICAL VALUE FOR REJECTING XBAR = YEAR IS: 0.435THE CRITICAL VALUE FOR REJECTING XBAR > YEAR IS: 0.218THE CRITICAL VALUE FOR REJECTING XBAR < YEAR IS: 0. 782
THE WELCH STATISTIC FOR METHOD 3 AND METHOD 7 IS: 0. 336WITH 9. 733 DEGREES OF FREEDOM.THE CRITICAL VALUE FOR REJECTING XBAR = YEAR IS: 0. 744THE CRITICAL VALUE FOR REJECTING XBAR > YEAR IS: 0. 623THE CRITICAL VALUE FOR REJECTING XBAR < YEAR IS: 0. 372
l. Analysis of the New Questions(1) One-way ANOVA
SOURCEMETHODERROR
SS68. 339
359. 875
DF
49
MS11. 3907. 344
FSTAT1.55083
CRTLVL0. 19699
TOTAL 428.214 55
(2) Individual Degrees of Freedom ANOVA
SOURCE SS DF MS FSTAT CRTLVL4V12356 40. 048 40. 048 5.45282 0. 03212123V567 11.021 11.021 . 1.50058 0.2353612 V 3 2. 297 2.297 0. 31274 0. 6031256 V 7 8. 333 8.333 . 1. 13465 0. 312601 V 2 0. 391 0. 391 0. 05319 0. 835885 V 6 6.250 6.250 0.85099 0. 39139ERROR 359. 875 49 7. 344
TOTAL 428.214 55
(3) Two Sample t-tests
Table of Critical Values for Rejecting XBAR = YEAR
METHOD 1 METHOD 2 METHOD 3 METHOD 4 METHOD 5 METHOD 6 METHOD 7
METHOD 1 0. 00000 0. 84028 0. 70017 0. 11969 0. 18090 0.59472 0. 89032METHOD 2 0. 84028 0.00000 0.57870 0. 23993 0. 16352 0. 49624 0. 73753METHOD 3 0. 70017 0.57870 0. 00000 0. 03004 0. 27193 0. 82777 0. 80236METHOD 4 0. 11969 0. 00000 0. 03004 0. 00000 0. 00750 0. 00000 0. 06643METHOD 5 0. 18090 0. 16352 0. 27193 0. 00750 0. 00000 0.43679 0. 19906METHOD 6 0.59472 0.49624 0. 82777 0. 04567 0.43679 0. 00000 0. 67090METHOD 7 0.89032 0.73753 0.80236 0.06643 0.19906 0.67090 0.00000
Table of Critical Values for Rejecting XBAR > YEAR
METHOD 1 METHOD 2 METHOD 3 METHOD 4 METHOD 5 METHOD 6 METHOD 7
METHOD 1 0.00000 0.57986 0.35009 0.94015 0.09045 0.29736 0.44516METHOD 2METHODMETHODMETHODMETHODMETHOD
0. 420140. 649910. 059850. 909550. 702640.55484
0. 000000. 710650. 000000. 918240. 751830. 63124
0.239350. 000000.015020. 864040.586110.40118
0. 880030. 984980. 000000. 996250. 977170. 96679
0. 081760. 135960. 003750. 000000. 218390.09953
0. 248120.413890. 000000. 781610. 000000.33545
0. 368760.598820.033210. 900470.664550.00000
106

Table of Critical Values for Rejecting XBAR < YEAR
METHOD 1 METHOD 2 METHOD 3 METHOD 4 METHOD 5 METHOD 6 METHOD 7
METHOD 1 0.00000 0.42014 0.64991 0.05985 0.90955 0.70264 0.55484METHODMETHODMETHODMETHODMETHODMETHOD
0.579860.350090.940150.090450.297360.44516
0.000000.289350. 000000.081760. 248120. 36876
0. 710650.000000.984980. 135960.413890.59882
0. 119970.015020. 000000. 003750.022830.03321
0. 918240. 864040.996250.000000. 781610. 90047
0. 751880.586110.000000.218390.000000.66455
0. 631240.401180. 966790. 099530. 335450.00000
(4) Welch Tests
THE WELCH STATISTIC FOR METHOD 4 AND METHOD 2 IS: -1.236WITH 9.710 DEGREES OF FREEDOM.THE CRITICAL VALUE FOR REJECTING XBAR = YEAR IS: 0. 248THE CRITICAL VALUE FOR REJECTING XBAR > YEAR IS: 0. 124THE CRITICAL VALUE FOR REJECTING XBAR < YEAR IS: 0. 876
THE WELCH STATISTIC FOR METHOD 4 AND METHOD 6 IS: -2. 172WITH 9.842 DEGREES OF FREEDOM.THE CRITICAL VALUE FOR REJECTING XBAR = YEAR IS: 0. 055THE CRITICAL VALUE FOR REJECTING XBAR > YEAR IS: 0. 028THE CRITICAL VALUE FOR REJECTING XBAR < YEAR IS: 0. 972
BACKGROUND QUESTIONNAIRE RESULTSA. Coding of Background Areas
GPA - Grade point averagesSLPAVE - Average amount of sleepSLPIST - Amount of sleep before the first testSLP2ND - Amount of sleep before the second testYOS - Years of schooling receivedTSLS - Time since last schoolingNOBR - Number of books read in the last year
B. Data Analysis(1) Grade Point Averages
--------- SAMPLE RANGE
MEAN VARIANCE STD DEV HIGH LOW
METHOD 1 2. 895 0. 307 0.554 3.8 1. 6
METHOD 2 2.925 0. 306 0.553 3. 5 1. 8METHOD 3 2. 781 0. 304 0.552 3. 6 2.0METHOD 4 2. 794 0.427 0.653 4.0 2.0METHOD 5 2.863 0. 190 0.436 3.5 2.
METHOD 6 2.620 0. 348 0.590 3.0 1.2METHOD 7 2.823 0. 116 0.341 3.6 2.5
(2) Average Amount of Sleep
SAMPLE-
MEAN VARIANCE STD DEV
•RANGE-
HIGH LOW
METHOD 1 5.950 0.803 0.896 7.0 4.METHOD 2 5. 600 1.378 1. 174 7.0 3.5METHOD 3 5. 125 0. 696 0.835 6. 4.METHOD 4 5.500 1. 227 1. 108 8. 4.METHOD 5 6. 100 1. 656 1.287 8. 3.5METHOD 6 5. 700 0.400 0. 632 7.0 5.METHOD 7 5.230 0.696 0. 834 6.5 4.
10?

(3) Amount of Sleep Before the First Test
SAMPLE
MEAN VARIANCE STD DEV
-RANGE--
HIGH LOW
METHOD 1 5.050 0.803 0.896 6.5 3.0METHOD 2 5.900 3.044 1. 745 8.5 3.5METHOD 3 4.813 0. 710 0. 843 6.0 4.0METHOD 4 4.917 1.992 1.412 7.0 2.0METHOD 5 5. 600 2.878 1.696 8.0 3.0METHOD 6 5.050 0.969 0.985 6.5 3.0METHOD 7 5.250 1.792 1.339 8.0 3.5
METHODMETHODMETHODMETHODMETHODMETHODMETHOD
(4) Amoxont of Sleep Before the Second Test
MEAN VARIANCE STD DEV
5.560 13.747 3. 7087. 150 4. 169 2.0424. 375 1.554 1.2464.958 0.521 0. 7226. 300 4. 622 2. 1506. 150 4. 003 2. 0015.250 0.403 0.635
•RANGE-
HIGH LOV
14.0 0.010.0 4.05.5 2.
6.0 4.010.0 2.
9. 3. 5
6.0 4.
METHODMETHODMETHODMETHODMETHODMETHODMETHOD
(5) Years of Schooling Received
SAMPLE
MEAN VARIANCE
12.500 2.05613. 100 4. 10013. 125 2.41112. 250 0. 79512. 180 0. 19112.250 . 0. 18112.400 0. 933
STD DEV
1.4342. 0251.5530. 8920.4370.4250. 966
KAf>)Uh
HIGH LOW
16.0 11.016.0 11.016.0 12.014. 10.513. 11.813.0 12.15.0 12.0
METHODMETHODMETHODMETHODMETHODMETHODMETHOD
(6) Time Since Last Schooling
MEAN VARIANCE STD DEV
1. 340 0. 846 0.9202. 741 5. 398 2. 3231. 999 2. 412 1.5531. 043 0.495 0. 7032.450 4. 178 2.0443. 016 7. 094 2.6641.550 1. 318 1. 148
RANGE
HIGH LOW
3. 1 0.58. 1.04. 1 0.53.0 0. 1
7. 0.510. 1.04. 1 0. 1
lOS

METHODMETHODMETHODMETHODMETHODMETHODMETHOD
(7) Number of Books Read in the Last Year
SAMPLE
MEAN
43. 90028. 7007.875
12.83349. 6004. 0007.800
VARIANCE
5922.7626081. 121177.554331.424
15265. 10923.55641.067
STD DEV
76. 95977.98213.32518. 205
123.5524.8536.408
RANGE-
HIGH
250.0250.40.50.0
400.015.020.0
LOW
0.
0.
0.00.
0.00.00.0
C. One-way ANOVA Results
Background AreaGPASLPAVESLPISTSLP2ND
. YOSTSLSNOBR
Test Statistic0. 3481. 1900.8492.0071. 0421.9200. 867
Critical Level. 907. 353
. .572.081.448.092.560
109

LIST OF REFERENCES
1. Warren. M.W., Training for Results - A Systems Approach to the Development ofHuman Resources in industry, pp. 70-/4, 103, Addison-Weslev PublishingCompanv, 1969.
2. Special Devices Center Report 476-02-3. Training by Television: A Study in
Learning and Retention, by R.T. Rock, Jr., J.S. Duva, and J.E. Vlurray. p. 23."
3. Fulmer, R^ Rate of Reading and Auding, Qualifying Paper, Harvard University ofGraduate Education, May 1976.
4. Rakes, T.A., A Readability Analysis of Reading Materials Used in Adult BasicEducation, speech eiven at the annual convention of the International ReadingAssociation. 17th, Detroit, Michigan, 10-13 May 1972.
5. Goodwin. J.W., and others. Comparison of Comprehension Levels, HumanFactors class project. Naval Postgraduate School. Monterev, California.December 1985. •
'
6. "Speech Compression Units Cut Training Time and Fatigue and Boost Learning,"TRAINING: The Magazine of Human Resources Development, p. 17, January198Q.
. ^ K
7. "Cut Training Course Reviewing Time in Half," T.H.E. Journal, TechnologicalHorizons in Education, v. 6-4, May 1979.
8. "Overcoming the Time Barrier EfTectivelv," T.H.E. Journal, TechnologicalHorizons in Education, v. 6-3, March 1979.
9. Challis. A.J., The Effect of Fixed and Learner Selected Rates of CornpressedSpeech in an Audio-tutorial" Learning Environment of the .Achievement of' CollegeLevel Students, paper presented a^t the third conference of Rate-ControlledSpeech, Louisville, Kentucky, 1975.
10. Sticht, T.G.. Learning by Listening in Relation to Aptitude, Reading, and Rate-Controlled Speech: Addi'iional Studies, paper presented at the third conference ofRate-Controlled Speech, Louisville, Kentucky, 1975.
11. Odiorne, G.S., Training by Objectives: .4n Economic Approach to ManagementTraining, p. 183, The MacMillan Company, 1970.
12. Londoner, C.A., A Readability Analysis of Randomly Selected Basic Education andVocational Education Curriculum Materials Useci at the Atterbury Job CorpsCenter as Measured by the Gunning Fog Index, report for the Indiana UniversitySchool of Education. Bloominton, Indiana. January 1967.
13. Davison. A.. Text Readability: Proceedings of the March 1980 Conference, acollection of papers presented at the Text Readability Conference. University ofIllinois, Urbana-Champaign. Illinois. August 1981.
110

14. Fruend, J.E. and Williams. F.J., Elementary Business Statistics: The ModernApproach, 4th ed., pp. 33, 579-S2, Prendce-Hall Inc., 1982.
15. Navy Training Command. Hull Maintenance Tech 3 & 2, Government PrintingOffice, Washington, D.C., 1972.
16. Naval Education and Training Support Command. Combustible Gas Indicator andFlame Safety Lamp, Government Printing Office, Washington, D.C., 1979.
17. Naval Education and Training Support Command. Compartmentation andWatertight Integrity, Government Printing Office, Washington, D.C., 1979.
18. Naval Education and Training Support Command. Desmoking and EmergencyVentilation Equipment Red Devil and Pneumatic Blower, Government PrmtmgOffiice, Washington, D.C., 1979.
19. Naval Education and Training Support Command, Extinguishing Agents,Government Printing Offiice, Washington, D.C., 1974.
20. Naval Education and Training Support Command, Fire and Firefighting,Government Printing Offiice, Washington. D.C.. 1979.
21. Naval Education and Training Program Development Center. Life SupportDevices, Government Printing Offiice, Washington, D.C.. 1981.
22. Naval Education and Training Support Command, Nozzles and Applicators,Government Printing Offiice. Washington, D.C., 1974.
23. Naval Education and Training Support Command, Portable FP-ISO WaterProportioner, Government Printmg Offiice, Washington, D.C., 1974.
24. Training Analvsis and Evaluation Group Technical Memorandum 83-2,ReadabUlitv Grade Levels of Selected Navv Technical School Curricula, bv J.W.Losa. J.a: Aagard, and J. P. Kincaid, PP.3,"' 11, February- 1983.
25. U.S. Naw Recruit Training Command, U.S. Navy CMI Recruit Reading GradeLevel Analysis Report, Vlarcn 1986.
26. Training Analysis and Evaluation ,Group Technical Memorandurn 82-5.Readability Levels of Representative Naw Job Reading Materials for NonratedPersonnel, by C.J. Hamel, J.A. Aagard, and J. P. Kincaid, p. 10, October 1982.
27. Dale. E. and Chall, J.S.. "A Formula for Predicting Readability: Instructions,"Educational Research Bulletine, v. 27, pp. 37-54, Februar\' 1948.
28. Winer. B.J^ Statistical Principles in Experimental Design, 5th ed., p. 10, McGraw-Hill Book Co., 1962.
29. Larson. H.J.. Introduction to Probability Theory and Statistical Inference, 3rd ed.,
pp. 444-461, 492-506. 527-541. John Wiley and Sons Inc.. 1982.
Ill

30. Duncan, A.J., Ouality Control and Industrial Statistics, 4th ed., pp. 620-31,Richard D. Irwin, Inc , 1974.
31. Gropper, R.L., Comprehension of Narrative Passages by Fourth Grade Children asa Function of Listening Rate and Eleven Predictor Variables, paper presented atthe Third Conference on Rate-Controlled Speech, Louisville, Kentucky, 1975.
32. Winters, S.N.. Speed Listening: A Promising Path to Remediation of ReadingDisabilities, paper presented at the Third Conierence on Rate-Controlled Speech,Louisville, KentucKy, 1975.
112

BIBLIOGRAPHY
McNinch, G.H., ed., Comprehension: Process and Product. First Yearbook of theAmerican Reading Forum, a collection of papers delivered at the First AmericanReading Forum, Athens, Georgia, 1981.
Navv Personnel Research and Development Center Report TR-74-6, Investigation ofRate-Controlled Speech for Training Applications, bv J.H. Steinemann and O.A. Larson,October 1973.
Smith, B.G.. "Speed Reading Scores in Perspective," Journal of Reading, v. 19-2,November 1975.
Training Analysis and Evaluation Group Technical Memorandum 81-1. Reading GradeLevels of Surface Warfare Officers School {SWOSCOL) Basic Curriculum Materials, bvJ.A. Aagard, B.M. Pereyra, and J. P. Kincaid, February 1981.
U.S.. Department of Health. Education, and Welfaje. National Center for EducationalStatistics. Reading Rate ana Cornvrehension: 1970-7 1 Assessment, Government PrintingOtFice, Washington, D.C., Deceniber 1972.
113

INITIAL DISTRIBUTION LIST
No. Copies
1. Defense Technical Information Center 2Cameron StationAlexandria, Virginia 22304-6145
2. Librar\', Code 0142 2Naval Postgraduate SchoolMonterey, California 93943-5002
3. LCDR Mike Lilienthal. Code 711 2Naval Training Svstems CenterNaval Trainine CenterOrlando, Florida 32813-7100
4. LCDR Wright, Code 40 1
Service School CommandNaval Tramins CenterOrlando. Florida 32813-7100
5. HTCM Hannan. Code 53 1
Damage Control SchoolRecrinl Training CommandNaval Training tlenter o
Orlando, Florfda 32813-7100
6. AQCS Plocar. Code 30 1
TraimngSupport DivisionRecruit 1 raining CommandOrlando, Florida 32813-7100
7. Dr. Carl Williams, Code 24 1
Naval Aerospace VIedical Research LaboratoryNaval Air StationPensacola, Florida 32507-5700
S. Chief of Naval Research 1
Office of the Chief of Naval ResearchArlington, Virginia 22217-5000ATTN: Library
9. Dr. Stan CoUver. Code MAT-072 1
Office ol Naval Technology800 N. Qumcv StreetArlington, Virginia 22217-5000
10. Commanding Offiicer I
Air Force Offiice of Scientific ResearchWashington. D.C. 20319
11. Research Director 1
National Defense UniversityFort VIcNairWashington. D.C. 20319
12. Chief of Naval Education and Training, Code L02 1
Naval Air StationPensacola. Florida 32508-5700ATTN: Dr. Robert Williams
114

13. LCDR Craie Knouse 1
1029 Frankland RoadTampa, Florida 33629
14 LCDR Mark MitchelL Code 55MI 1
Operations Analysis DepartmentNaval Postgraduate SchoolMonterey, California 93943-5000
15. Dr. Douglas Neil, Code 55NI 1
Operations Analysis DepartmentNaval Postgraduate SchoolMonterey, California 93943-5000
16. Dr. Glenn Lindsav, Code 55LS 1
Operations Analvsis DepartmentNaval Postgraduate SchoolMonterey, California 93943-5000
17. LT Richard Phares 1
Operations OfficerUSS Bronstein (FF1037)FPO San Francisco, California 96661-1400
18. Mr. John Baskovich 3211 Sandv LanePiano, Illinois 60545
19. Mr. Lester McKinnev 1
1324 Belleaire Circle'Orlando, Florida 32S04
20. Commandine Officer 1
Naval Education and TrainingProgram Development CenterPensacola, Florida 32509-5000
21. Commanding Officer 1
Naval Research Laboratory'Washington, D.C. 20375
22. LCDR Chris Schnedar 1
2007 S. PennRoswell, New Mexico 88201
23. MAJ David Tvner 1
1 1 Maple AvenueAvoca, New York 14809
24. Dr. Henrv Smith 1
Command Instructional Svstems CoordinatorPatrol Squadron Thirtv OneMolTet Field, California 94035
115

18 3 5 4/r


DUDLEY KNOX^^^^fI'il^gcHOOL
ThesisM57531c.l
MichealsonA statistical analysis
determining effective and d
efficient methods of
shipboard training.
11 FEB 9015 OCT S?
3 5 8023803U
Thesis
M57531
c. 1
Michealson
A statistical analysis
determining effective and
efficient methods of
shipboard training.