Thermoset Composite Concrete Reinforcement -...
131
Max L. Porter Eric A. Lorenz Bruce A. Barnes Kasi P. Viswanath Thermoset Composite Concrete Reinforcement October 1992 Submitted to: Iowa Department of Transportation and Iowa Highway Research Board Project Number: HR-325 Engineering Research Institute Iowa State University
Transcript of Thermoset Composite Concrete Reinforcement -...
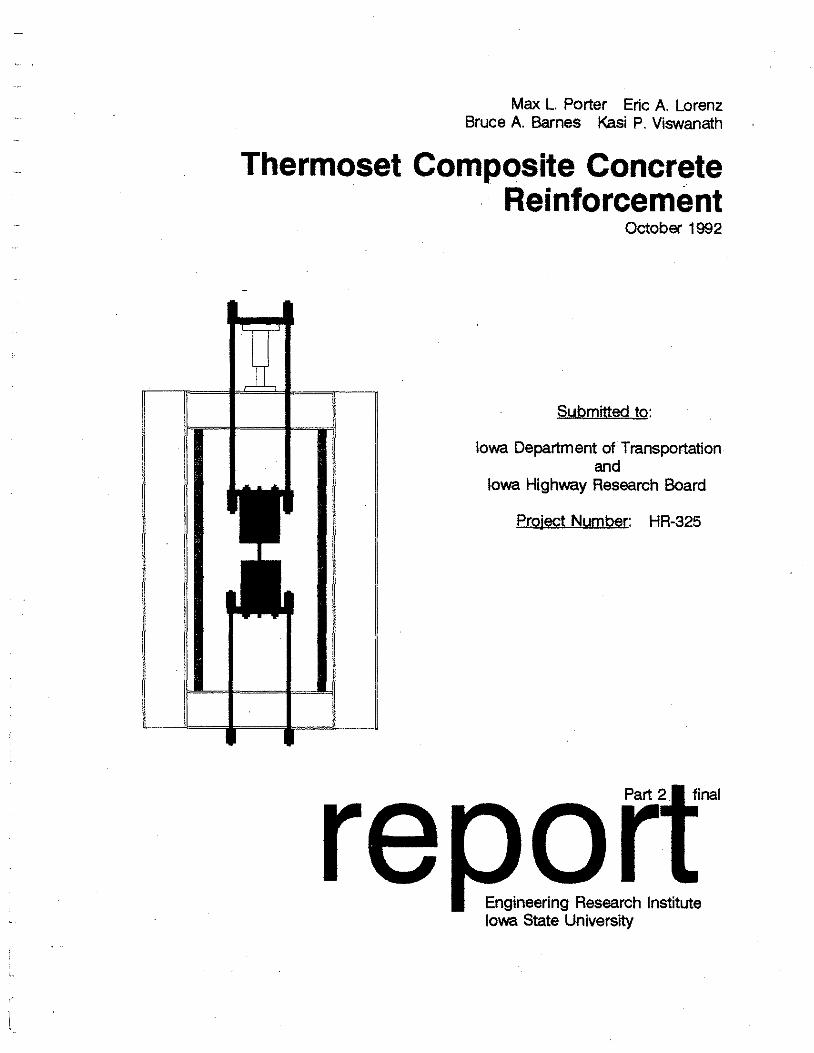
Max L. Porter Eric A. Lorenz Bruce A. Barnes Kasi P. Viswanath
Thermoset Composite Concrete Reinforcement
October 1992
Submitted to:
Iowa Department of Transportation and
Iowa Highway Research Board
Project Number: HR-325
Engineering Research Institute Iowa State University
i
Disclaimer
The contents of this report do not represent a warranty of the products used on behalf of the state of Iowa, Iowa State University, Iowa Department of Transportation, Highway Research Board, or the authors. The opinions, findings, and conclusions expressed in this publ.ication are those of the author and not necessarily those of the Highway Division of the Iowa Department of Transportation. Engineering data, design, details, with recognized professional principals and practices are for general information only. The data, designs, and suggested conclusions should not be used without first securing competent advice with respect to the suitability for any given application. The responsibility for the use of information in this report remains with the user. This report is for information purposes and is made available with the understanding that it will not be cited without the permission of the authors.
r '
.j
ii
Preface
This is the second part of the final report submitted to the Iowa Department of Transportation. Part 1 contained a comparison of unaged fiber composite and steel dowels and derivation of the appropriate theoretical model for analyzing the results. Part 2 of this final report covers the theoretical and experimental models for accelerated aging of fiber composite reinforcing bars and dowels cast in a concrete environment.
Part 2 contains results from testing of unaged and aged fiber composite dowels and steel dowels, in addition to unaged and aged fiber composite reinforcing bars. Additional tests have been performed on unaged dowels (both steel and fibercomposite) to verify results from Part 1 and to keep the testing program consistent. Slight modifications have been made to the dowel specimens presented in Part 1. These modifications are noted in the Section 3.4 of this report.
The flexural modulus of elasticity for the FC dowel bar given in Part 1 of the final report (Table 3. 2) was for the incorrect structural shape (non-circular cross section). The value is corrected and given in Part 2 of the final report (Table 3.4 for the.modulus of elasticity supplied by the manufacturer, and Tables 3. 5 and 3. 6 for experimentally determined modulus of elasticities) • The value in Part 1 was not used for any analysis of the FC dowel bars.

iii
Abstract
The introduction of new materials into industry requires that both the unaged load-carrying capabilities and a knowledge of the long term effects of aging must be determined before comparisons can actually be made between these new materials and materials that have been in use for decades. studying the effects of aging in a natural real weather environment can be unrealistic if the life expectancy of this material is greater than a few years. The life expectancy of fiber composite materials can span over many tens of years, therefore, this report presents a method of accelerated aging to predict the long term capabilities of fiber composite materials. This report also looks at the possibility of using fiber composite reinforcing bars and dowels as a viable alternative to steel as concrete reinforcement.
Accelerated aging entails submersion of fiber composite materials (these fiber composite materials are cast in a concrete system) in a water solution at an elevated temperature. Two theories have been suggested for the loss in strength of fiber composite materials. First, the hot, wet environment accelerates the reaction between the glass fibers and the alkali in the concrete. A hydration product is deposited between the individual glass fibers causing them to become brittle. Second, direct attack by the alkali in the cement on the glass fibers, results in etching and pitting of the glass fibers and loss of tensile capacity. This process of strength loss (due to accelerated aging) has been compared to strength loss in real weather aging in the natural environment. Accelerated aging was used by Pilkington Brothers Limited of the United Kingdom and further testing by other experimenters has verified that accelerated aging can be used to approximate real weather aging of fiber composite materials. The results of accelerated aging on glass fibers embedded in a mortar environment (strand-in-cement test) and glass fiber reinforced concrete (GFRC) were used predict long term aging of these glass fibers.
The effects of accelerated aging on fiber composite reinforcing bars and dowel bars composed of E-glass fibers encapsulated in a vinyl ester resin matrix are presented in this report. These fiber composite specimens were cast in concrete and exposed to three different aging bath solutions (water, lime, and salt) at an elevated temperature of 140°F for nine weeks. Control ( unaged) specimens were compared with aged , specimens, and the affects of aging could then be observed. The aged fiber composite reinforcing bars cast in concrete specimens were tested in direct tension to determine the degradation, if any, in bond between the concrete and fiber composite material. The aged fiber composite dowel bars in concrete specimens were tested in direct shear to find the effects of accelerated aging on the shear capacity.
I
iv
Degradation of uncoated E-glass fibers has been proven by other researchers to be extensive in a mortar environment due to alkali attack. Vinyl ester resin has been tested by Dow Chemical and proven to be highly resistant to chemical attack. The Eglass/vinyl ester resin fiber composite (both dowels and reinforcing bars) have been shown through testing at Iowa state University to be highly resistant to the detrimental affects of accelerated aging and can be considered a potential substitute for steel.
v
Table of Contents
List of Symbols vii
List of Figures· ix
List of Tables xi
1.0. Introduction 1
2.0.
3.0.
1.1. Experimental and Analytical Investigation 1 1. 1. 1. Objective . . . 1 1 • 1 • 2 • Scope . . . . . . . . . . . • . • . 1
1.2. Literature Review . . • . . . . . • . . . 2 1.2.1. Accelerated aging of composite materials 2 1.2.2. Testing to determine the affects of
accelerated aging • • • • . • . 3 1.2.3. Theoretical model for pullout and dowel
specimens
Accelerated Aging . . . 2.1. Introduction .•. 2.2. Accelerated Aging Compared with Real Weather
Aging . . . • . . . • . • . . • . . • . . . 2.2.1. Strand-in-cement test ...••... 2.2.2. Accelerated aging of fiber composite
materials . • • . . • . • . . . . 2.3. Effects of Accelerated Aging on Concrete
2.3.1. Alkali-silica reactivity 2.3.2. Corrosion of steel •..• 2.3.3. Sulfate attack ..•.•.
2.4. Composites used in ISU Research 2.4.1. Effects of accelerated aging on E-glass
fibers • . • • . . • . . . 2.4.2. Effects of accelerated aging on vinyl ester
resin . . . . .
Experimental Investigation 3.1. Introduction 3.2. Objective ..... . 3.3. Scope •••...•• 3.4. Materials and Specimens 3.5. Accelerated Aging Conducted at ISU 3 . 6. Testing Procedure . . • . . • 3 .. 7. Results . . . . . . . . . . .. ·.
3.7.1. FC specimens under scanning electron
3.7.2. 3.7.3. 3.7.4.
microscope . . . . . . . . . . . . . Chemical analysis of aging solutions Pullout specimen results Dowel specimen r.esul ts . . • . . . .
3
5 5
5 6
7 9
10 10 11 12
12
12
14 14 14 15 15 28 35 38
38 41 42 52
vi
4.0. Development of Failures for Dowel Specimens 4.1. Truncated Pyramid Concrete Failure 4.2. Modified Concrete Failures .
5.0.
4.2.1. FC dowel specimens 4.2.2. Steel dowel specimens
4.3. Split cylinder Test ••.• 4.3.1. FC dowel specimens 4.3.2. Steel dowel specimens 4.3.3. Model for the dowel bars
Modified Test Frame 5.1. Test Procedure 5.2. Results
for Dowel Specimen Testing
6.0. Verification of the Theoretical Moment Model
7.0. conclusions .. 7.1. Accelerated Aging 7.2. Pullout Specimens 7.3. Dowel Specimens
8.0. Acknowledgements
References
Appendix A
58 58 61 62 63 64 66 67 68
71 71 72
75
85 85 85 86
87
88
91
vii
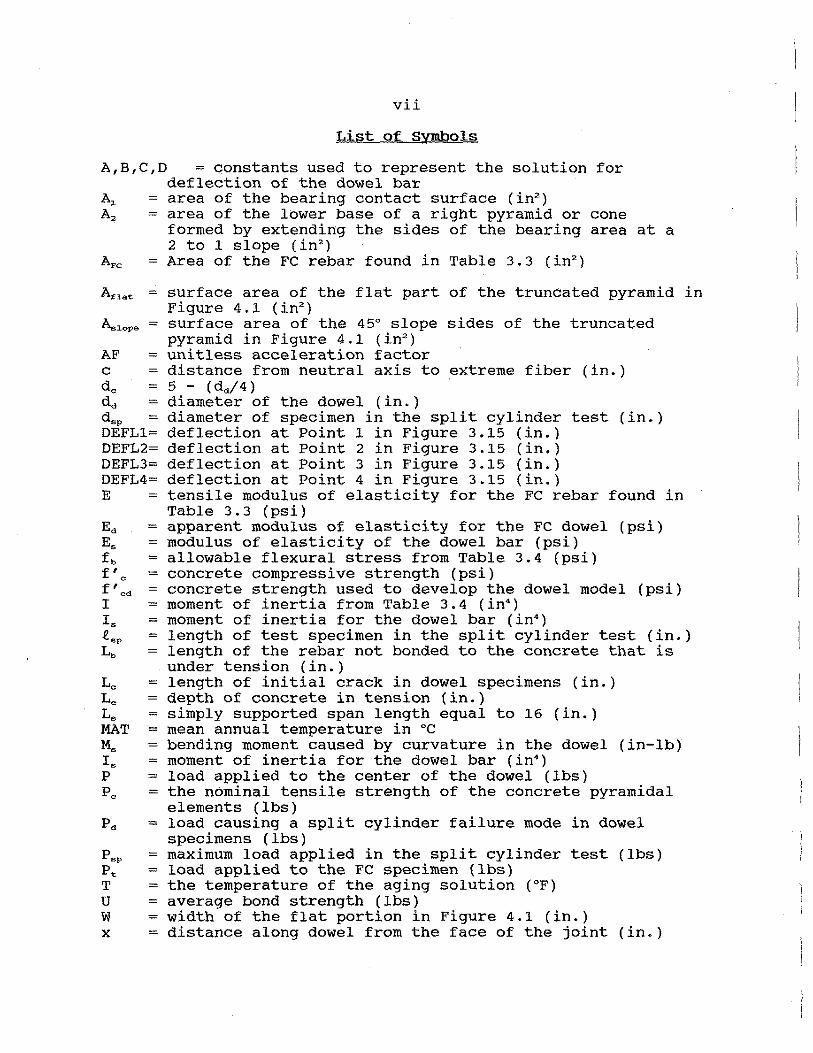
List of Symbols
A,B,C,D = constants used to represent the solution for deflection of the dowel bar
A, = area of the bearing contact surface (in2)
A2 area of the lower base of a right pyramid or cone formed by extending the sides of the bearing area at a 2 to 1 slope (in2
)
AFc = Area of the FC rebar found in Table 3. 3 ( in2)
surface area of the flat part of the truncated pyramid in Figure 4 .1 ( in2
)
surf ace area of the 45° slope sides of the truncated pyramid in Figure 4.1 (in2
)
AF c
= unitless acceleration factor
de dd dsp DEFLl= DEFL2= DEFL3= DEFL4= E
distance from neutral axis to extreme fiber (in.) 5 - (dd/4) diameter of the dowel (in.) diameter of specimen in the split cylinder test (in.) deflection at Point 1 in Figure 3.15 (in.) deflection at Point 2 in Figure 3.15 (in.) deflection at Point 3 in Figure 3.15 (in.) deflection at Point 4 in Figure 3.15 (in.) tensile modulus of elasticity for the FC rebar found in Table 3. 3 (psi) apparent modulus of elasticity for the FC dowel (psi) modulus of elasticity of the dowel bar (psi)
Ed Es fh ft c
= allowable flexural stress from Table 3.4 (psi)
f 1 cd
I r. esp
Lb
P.P pt T u w x
concrete compressive strength (psi) - · concrete strength used to develop the dowel model (psi) moment of inertia from Table 3.4 (in•) moment of inertia for the dowel bar (in4
)
length of test specimen in the split cylinder test (in.) length of the rebar not bonded to the concrete that is under tension (in.) length of initial crack in dowel specimens (in.) depth of concrete in tension (in.) simply supported span length equal to 16 (in.) mean annual temperature in °C bending moment caused by curvature in the dowel (in-lb)
= moment of inertia for the dowel bar (in•) load applied to the center of the dowel (lbs) the nominal tensile strength of the concrete pyramidal elements (lbs) load causing a split cylinder failure mode in dowel specimens (lbs)
= maximum load applied in the split cylinder test (lbs) load applied to the FC specimen (lbs) the temperature of the aging solution (°F) average bond strength (lbs) width of the flat portion in Figure 4.1 (in.) distance along dowel from the face of the joint (in.)
x y y B ¢ €. = 0 Su & µ
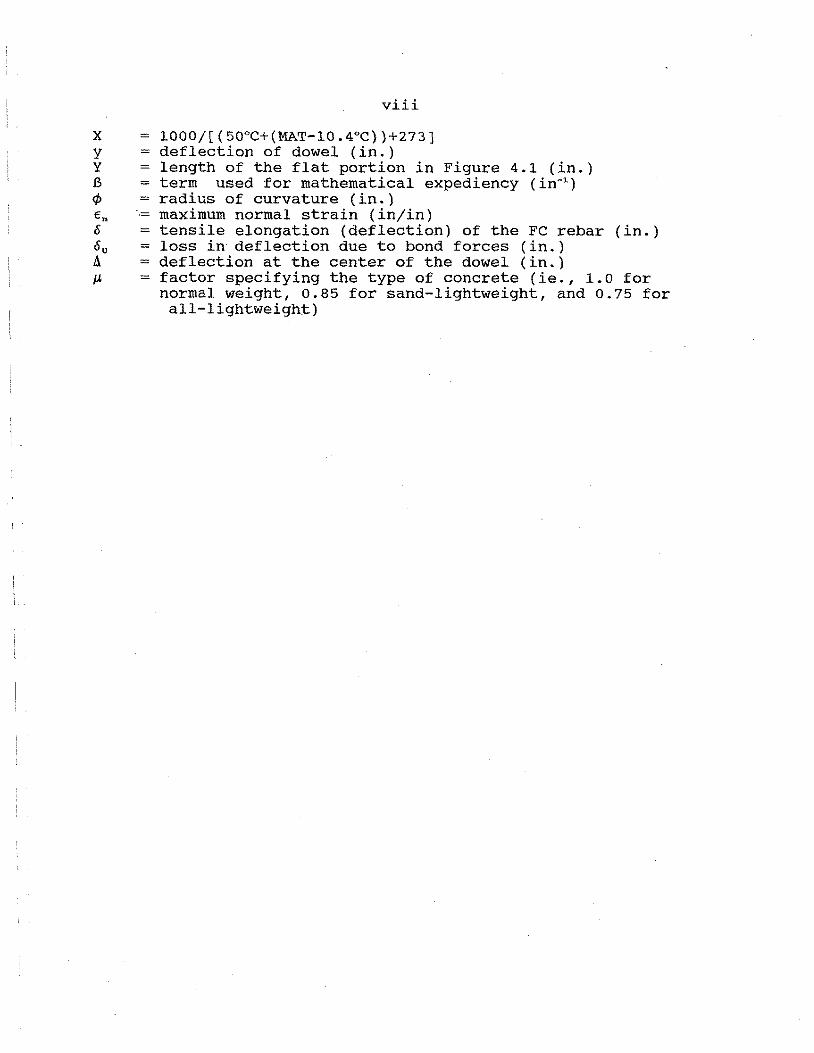
viii
1000/[(50°C+(MAT-10.4°C))+273J deflection of dowel (in.) length of the flat portion in Figure 4.1 (in.) term used for mathematical expediency (in-1
)
radius of curvature (in.) maximum normal strain (in/in) tensile elongation (deflection) of the FC rebar (in.) loss in deflection due to bond forces (in.) deflection at the center of the dowel (in.) factor specifying the type of concrete (ie., 1.0 for normal weight, o.85 for sand-lightweight, and 0.75 for all-lightweight)

\
Figure 2.1. Figure 2.2.
Figure 2.3. Figure 3.1. Figure 3.2. Figure 3.3. Figure 3.4. Figure 3.5. Figure 3.6. Figure 3.7. Figure 3.8. Figure 3.9. Figure 3.10.
Figure 3 .11.
Figure 3 .12. Figure 3.13.
Figure 3.14.
Figure 3.15. Figure 3.16.
Figure 3.17.
Figure 3.18.
Figure 3 .18. Figure 3.19.
Figure 3.20.
Figure 4.1. Figure 4.2. Figure 4.3. Figure 5.1. Figure 5.2. Figure 5.3. Figure 5.4. Figure 6.1.
Figure 6.2. Figure 6.3.
Figure 6.4.
ix
List of Figures
Strand-in-cement specimens [1,3] Strength of GFRC composites in water and weather . . . . • . • . • • . . • . Corrosion of steel [12] •..... Test assemblies for pullout specimens Dowel specimens • . • . . Failure modes in dowel specimens Aging tanks . . . . . . • . • . Acceleration factor curve . • • Temperature-time criteria curve Pullout frame . . • . . • . . Dowel-shear frame • . • . . . . Specimen identification system •
..
surf ace microstructure of an unaged and untested B-FC-P rebar parallel to the long direction . . . • . . . . • . . . . • . . surf ace microstructure of an unaged and untested C-FC-P rebar parallel to the long direction . . . • . . . . • . • . . . . surface microstructure of C-FC-P-L rebar comparison of aged and unaged B-FC-P assemblies . . • . . • . • . . . comparison of aged and unaged c-FC-P assemblies • . . . . • . . • . . Bond failure for the pullout specimens comparison of approximated and experimental load-deflection curves for B-FC-P-U assembly Comparison of approximated and experimental load-deflection curves for C-FC-P-U assembly Splitting failure modes for the dowel specimens . . . • . . . . • . . continued . . . . . • . . • . . comparison of aged and unaged A-FC-D assemblies . . . • . . • . . . • Comparison of aged and unaged o-s-D assemblies . . . . . . • Tensile-failure mechanisms for dowel bars Split cylinder test [21] . . .. Splitting failure mode for the dowel specimens Clamping method for dowel specimens • . • Modified clamping method for dowel testing . Tests on PV dowel bars • • • . . . . . . • . Tests of PV dowel bars using modified grips Theoretical moment distribution along the dowel bar . • • • . . • • . • . . . . . . Strain gage locations on the dowel bar . Load versus moment diagram at 1.5 inches from the centerline of dowel bar . • . . Load versus moment diagram at 5.0 inches from the centerline of dowel bar . . .
6
8 11 16 18 19 28 31 33 36 37 38
39
39 40
44
45 46
49
50
54 55
56
57 59 64 66 71 72 73 74
76 77
80
81
I
I
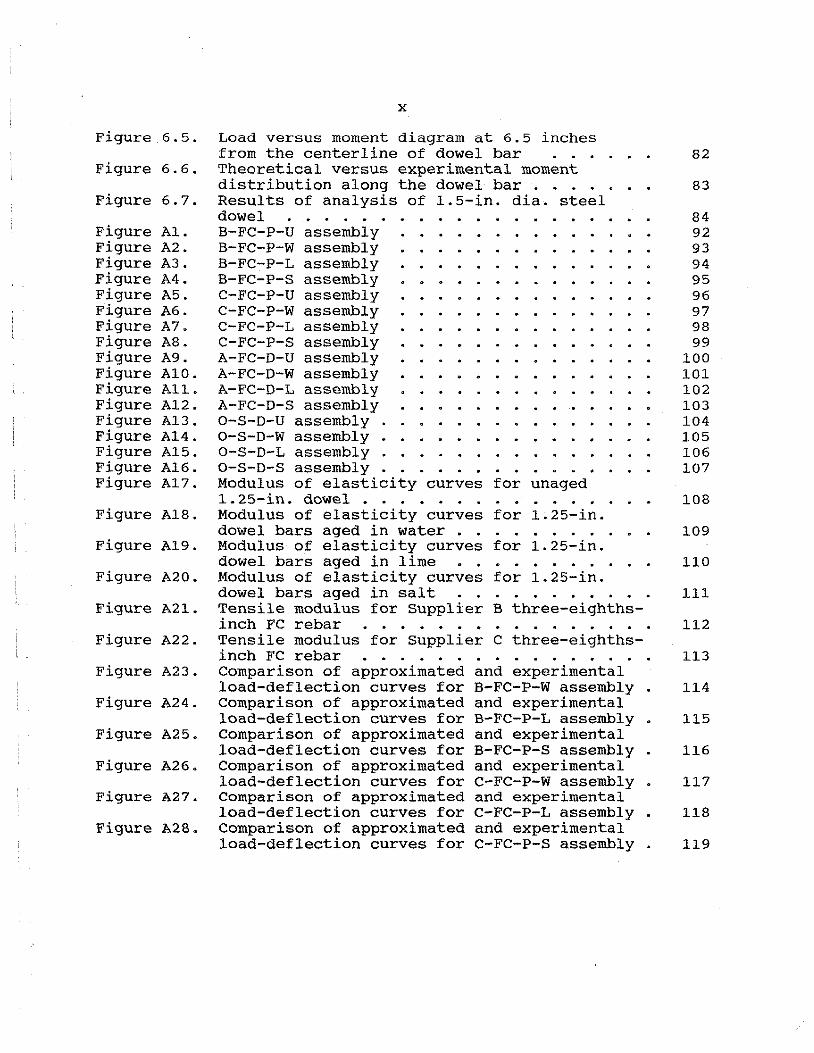
Figure 6.5.
Figure 6.6.
Figure 6.7.
Figure Al. Figure A2. Figure A3. Figure A4. Figure A5. Figure A6. Figure A7. Figure AS. Figure A9. Figure AlO. Figure All. Figure A12. Figure A13. Figure A14. Figure A15. Figure A16. Figure A17.
Figure A18.
Figure A19.
Figure A20.
Figure A21.
Figure A22.
Figure A23.
Figure A24.
Figure A25.
Figure A26.
Figure A27.
Figure. A28.
x
Load versus moment diagram at 6.5 inches from the centerline of dowel bar Theoretical versus experimental moment distribution along the dowel bar . . • Results of analysis of 1.5-in. dia. steel dowel . . . • . B-FC-P-U assembly B-FC-P-W assembly B-FC-P-L assembly B-FC-P-S assembly C-FC-P-U assembly C-FC-P-W assembly C-FC-P-L assembly C-FC-P-S assembly A-FC-D-U assembly A-FC-D-W assembly A-FC-D-L assembly A-FC-D-S assembly o-s-o-u assembly o-s-o-w assembly . o-s-D-L assembly . o-s-o-s assembly . Modulus of elasticity curves for unaged 1.25-in. dowel •...... Modulus of elasticity curves for 1.25-in. dowel bars aged in water • . Modulus of elasticity curves for 1.25-in. dowel bars aged in lime Modulus of elasticity curves for 1.25-in. dowel bars aged in salt Tensile modulus for Supplier B three-eighthsinch FC rebar . . . . . . • Tensile modulus for Supplier c three-eighthsinch FC rebar . . . • • . Comparison of approximated load-deflection curves for Comparison of approximated load-deflection curves for Comparison of approximated load-deflection curves for Comparison of approximated load-deflection curves for Comparison of approximated load-deflection curves for Comparison of approximated load-deflection curves for
and experimental B-FC-P-W assembly and experimental B-FC-P-L assembly and experimental B-FC-P-S assembly and experimental C-FC-P-W assembly and experimental C-FC-P-L assembly and experimental c-FC-P-S assembly
82
83
84 92 93 94 95 96 97 98 99
100 101 102 103 104 105 106 107
108
109
110
111
112
113
114
115
116
117
118
119
\
Table 3.1. Table 3.2. Table 3.3.
Table 3.4.
Table 3.5.
Table 3.6. Table 3.7. Table 3.8. Table 3.9. Table 3 .10. Table 3.11. Table 3.12.
Table 3.13. Table 3.14.
Table 3.15. Table 3.16. Table 4.1. Table 4.2.
Table 4.3.
Table 6.1.
Table 6.2.
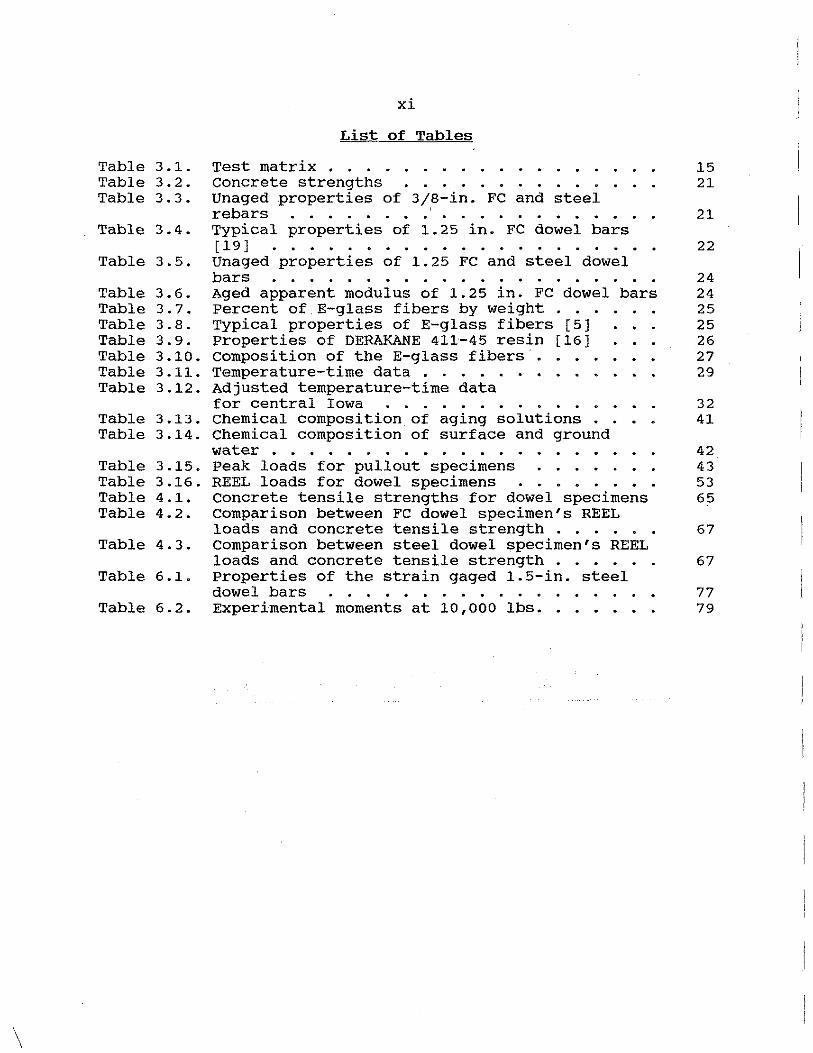
xi
List of Tables
Test matrix • . . • . . . . . Concrete strengths . . . . . Unaged properties of 3/8-in. FC and steel rebars . . . . . . . . . . . . Typical properties of 1.25 in. FC dowel bars [ 19 l . . . . . . . . . . . . . . . . . . . . Unaged properties of 1.25 FC and steel dowel bars . . . . . . . . . . .. . . . . . . . . . Aged apparent modulus of 1.25 in. FC dowel bars Percent of E-glass fibers by weight • . . Typical properties of E-glass fibers (5] Properties of DERAKANE 411-45 resin [16] composition of the E-glass fibers Temperature-time data . . . . . . • Adjusted temperature-time data for central Iowa . . . . . . chemical composition of aging solutions Chemical composition of surface and ground water .. . . . . .. . . .. .. . . . . Peak loads for pullout specimens . . . . REEL loads for dowel specimens . • • . concrete tensile strengths for dowel specimens comparison between FC dowel specimen's REEL loads and concrete tensile strength • . . . . . Comparison between steel dowel specimen's REEL loads and concrete tensile strength . . • • . Properties of the strain gaged 1.5-in. steel dowel bars . . . . .. . .. . . . . o
Experimental moments at 10,000 lbs •....•
15 21
21
22
24 24 25 25 26 27 29
32 41
42 43 53 65
67
67
77 79
1
1.0. Introduction
The presentation of the final report to the Iowa Department of Transportation has been submitted in two parts (this report being Part 2). Part 1 presented a comparison between steel and fiber composite dowels both theoretically and experimentally. Part 2 contains results from aging studies on fibercomposite reinforcing bars and dowel bars. For convenience, the overall objectives and scope requirements for the entire project are covered in both parts of the final report.
1.1. Experimental and Analytical Investigation
The use of fiber composites (FC) as an alternative to steel in reinforcing bars and dowel bars requires a knowledge of the effects of long term aging on fiber composite materials. The experimental aging portions of the project focused on developing a model (based on previous work done by Pilkington Brothers Limited [ 1 J) to approximate the real weather aging of fiber composite materials in a relatively short period of time.
The investigation described herein was conducted at Iowa State University (ISU) in coordination with the Iowa Department of Transportation . ( IDOT). This work was conducted at the ISU structural Engineering Laboratory under the auspices of the Engineering Research Institute (ERI) with research funds as recommended by the Iowa Highway Research Board and as provided by the IDOT.
1.1.1. Objective
The objectives of this research project were to determine the following:
1. Shear behavior and strength of FC dowel bars without aging,
2. Shear behavior and strength of FC dowel bars with aging,
3. Potential aging effects on bond of FC reinforcing bars.
1.1.2. Scope
The scope of this research project included:
1. Selecting an appropriate theoretical model for analyzing the results,
2. Design and construction of experimental tests for Objectives 1 and 2,
2
3. Testing the dowel-shear specimens both aged and unaged,
4. Analyzing the dowel shear testing results, 5. Design and construction of the test specimen details
for examining the aging effects on bond behavior of FC reinforcing gars in concrete, and
6. Conducting experiments and analyze results for FC reinforcing bars.
1.2. Literature Review
1.2.1. Accelerated aging of composite materials
An extensive reference search was conducted on accelerated aging of fiber composite materials. The material covered, in depth, the accelerated aging of glass fiber reinforced composites (GFRC) but did not deal with the accelerated aging of glass fibers coated with a vinyl ester resin. The fiber composites (FC) being investigated at ISU were composed of E-glass fibers, encapsulated in a vinyl ester resin matrix. Three different types of FC materials were investigated; two types of three-eighths-inch diameter reinforcing bars and one type of one-and-one quarter-inch diameter dowel bars.
The degradation of E-glass fibers exposed to an alkali environment (within a concrete system) occurs due to chemical etching and pitting of tbe glass fibers or deposition of hydration product (namely calcium) between the individual glass fibers. As explained in References 1 through 8, the process of chemical degradation and deposition of hydration product is accelerated between the concrete and FC material if this system is exposed to water at an elevated temperature. Based on work done by Pilkington Brothers Inc. given in References 1 and 3 a temperature-aging criteria was developed to indicate the accelerated aging of FC materials. According to References 1 and 3 this temperature-aging criteria should be adjusted to account for the differences in the mean annual temperature (MAT). Once the temperature-aging criteria was developed and adjusted for the MAT, the number of days aged per day, in the aging tanks at an elevated temperature, could be determined. The FC material was aged 50 years based on this criteria in a little over two months.
Problems may develop during accelerated aging tests as presented in References 9 through 15. These problems include; alkali-silica reactivity, corrosion of steel (spalling), and sulfate attack. Accelerated aging involves submersing a fiber composite specimen in a water solution at an elevated temperature. The hot, wet environment may be conducive to the previously listed problems and accelerate their detrimental affects.
References 16, 17, 18, and 19 cover the composition of the
3
vinyl ester resin and E-glass fibers that make up the fiber composite materials currently being tested at ISU. The material properties of the E-glass fibers and the vinyl ester resin are listed in this report.
1.2.2. Testing to determine the affects of accelerated aging
Aged and unaged reinforcing bars cast in concrete were tested in direct tension and the relative bond was monitored to determine any (if any) degradation to the bond capacity due to accelerated aging. The testing apparatus was based on a common pullout testing procedure.
Aged and unaged FC dowel bars cast in concrete were tested in direct shear. Based on the Iosipescu shear test in Reference 20, a modified ISU direct shear test apparatus was constructed to determine if any degradation to the FC materials shear capacity occurred during accelerated aging.
1.2.3. Theoretical model for pullout and dowel specimens
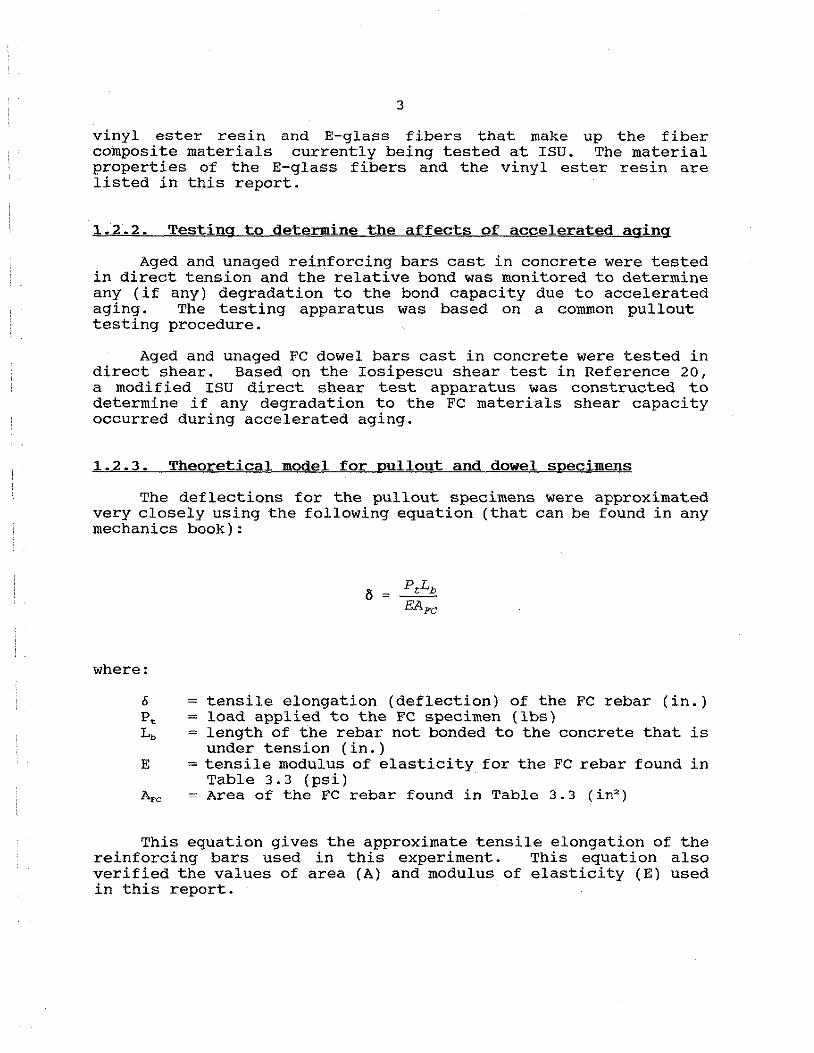
The deflections for the pullout specimens were approximated very closely using the following equation (that can be found in any mechanics book) :
where:
6 =tensile elongation (deflection) of the FC rebar (in.) P. load applied to the FC specimen (lbs) L. length of the rebar not bonded to the concrete that is
under tension (in.) E = tensile modulus of elasticity for the FC rebar found in
Table 3.3 (psi) A,c = Area of the FC rebar found in Table 3. 3 ( in2
)
This equation gives the approximate tensile elongation of the reinforcing bars used in this experiment. This equation also verified the values of area (A) and modulus of elasticity (E) used in this report.
4
A theoretical model was developed for the dowel specimens based on References 21 and 22. An equation was developed for a truncated pyramid failure mode (based on work in Reference 22) that is a possible failure mode for the dowels. The splitting of the concrete was modeled using the split cylinder test equation (found in Reference 21). This model accounted for the initial concrete failure that was exhibited by the concrete specimens.
Dowel analysis based on Timoshenko's finite beam on an elastic foundation (using References 23 and 24) was developed in Part 1 of the final report. Part 2 of the final report the theoretical moment diagram was verified for the 1.5-inch steel dowel specimens using strain gages. The strain gage analysis was based on Reference 25.
The aforementioned models in this report and will be associated test discussion.
are developed and utilized further shown in more detail with each
5
2.0. Accelerated Aging
2.l. Introduction
With the introduction of fiber composites into industry, the knowledge of how long term aging affects the strength behavior of this material must be understood. One approach would involve exposing fiber composites to real weather conditions for a long period of time, while another method would entail subjecting this material to accelerated aging (this process involves casting the fiber composite material in a concrete system and submersing this system in a hot, wet, aggressive environment (l]), reflecting the real weathering capabilities of fiber composites over a shorter time period. Due to the recent interest in fiber composites, the latter approach (accelerated aging) has helped play an important role in understanding the long term strength of fiber composite materials. This chapter will introduce the reader to the analysis involved in determining the effects of accelerated aging on fiber composite materials.
The information obtained from the references, used to determine accelerated aging properties of composite materials in this report, was based on the "strand in cement" test. The strand in cement test is used to determined the alkali resistance of glass fibers in a concrete environment. The data in this report was obtained from tensile, bond, and shear tests of fiber composite materials composed of E-glass fibers encapsulated in a vinyl ester i--esirl 111at:r ix arid cas-t in a cor1c.t·ete speci1ue11. Obtair1i11g ti1e t:t"'Ue aging of a specific fiber composite material can only be accomplished through natural aging under normal environmental conditions. The use of accelerated aging on fiber composites is considered to be a good approximation to real weather aging.
2.2. Accelerated Aging Compared with Real Weather Aging
The process of comparing accelerated aging with natural weathering of composite materials was determined in References 2 and 3 as follows:
- determining the tensile strength of alkali resistant (AR) glass fibers in a mortar mix (see Section 2.2.1) that have been exposed to accelerated aging,
- determining the strength of glass fiber reinforced concrete (GFRC) composites that have been exposed to similar accelerated aging process (see Section 2. 2. 2) ,
- comparison of the tensile strengths obtained from above to similar composites exposed to real weather aging in different regions.
The two subsections to follow give details of these above-mentioned
6
comparison processes.
2.2.1. strand-in-cement test
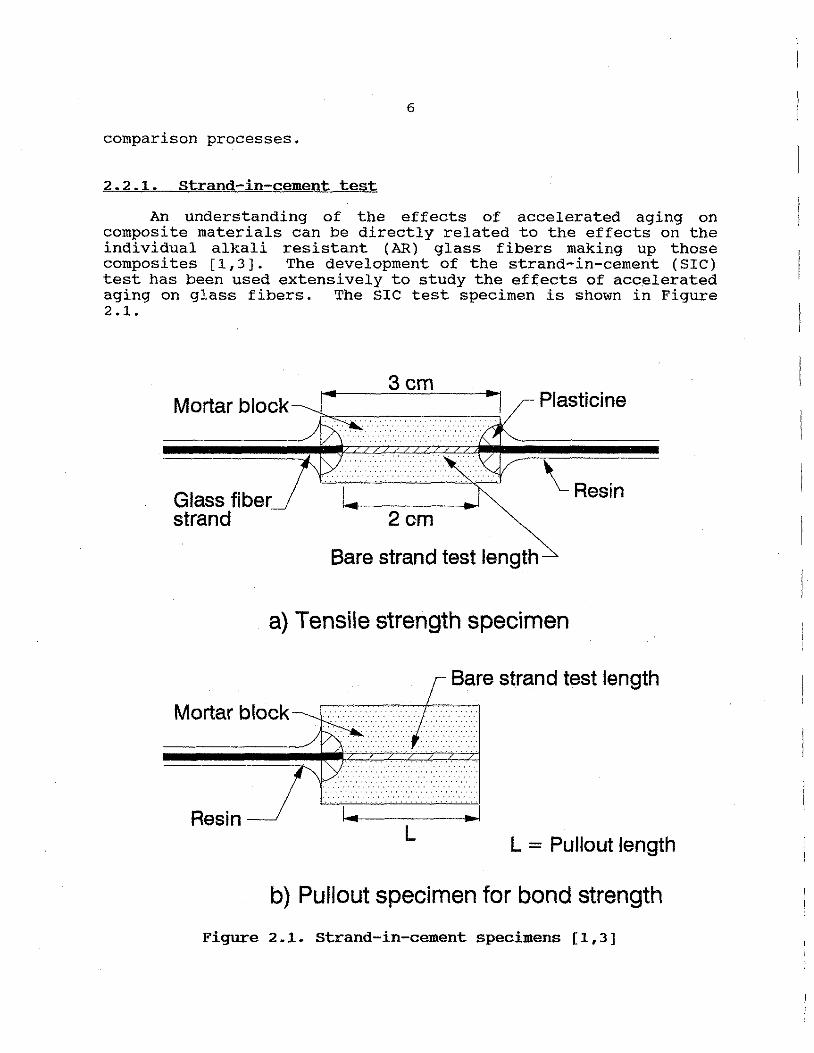
An understanding of the effects of accelerated aging on composite materials can be directly related to the effects on the individual alkali resistant (AR) glass fibers making up those composites [1,3]. The development of the strand-in-cement (SIC) test has been used extensively to study the effects of acc.elerated aging on glass fibers. The SIC test specimen is shown in Figure 2 .1.
Mortar block
Glass fiber strand
3cm
2cm
Bare strand test length
Plasticine
\_Resin
a) Tensile strength specimen
Bare strand test length
Mortar block
Resin .. I
L L = Pullout length
b) Pullout specimen for bond strength
Figure 2.1. Strand-in-cement specimens [1,3]
7
The SIC specimens are submersed in water at elevated temperatures and subsequently tested in direct tension. The test was used to determine the affects of aging on the AR glass fibers when exposed to different mortar environments and alkaline solutions and to make a strength comparison between glass fibers and composite materials [ 3] . The bare strand test length (see Figure 2.1) is exposed to the concrete, which is a highly alkaline material with pH of 12.5-13.0 [4]. The elevated temperature of the aging solution is used to speed up the cement hydration process and accelerate the reactions occurring between the glass fibers and the concrete [5]. Figure 2.la determines the degradation in tensile capacity due to aging of a glass material. Figure 2.lb is used to determine the effects of aging on the bond of a glass material.
Strength comparisons between accelerated aging and real weather aging have shown that one chemical reaction was occurring over the entire range of accelerated temperatures ( 20°c to 80°C) and that long term aging predictions, made over a very short period of time, at higher temperatures are possible [1,3]. This chemical reaction occurring between the mortar and glass fibers is due to an alkaline attack and creates pits in glass fibers reducing the effective area [3]. Reduction of this alkaline attack by use of protective coating (such as alkali resistant (AR) glass fibers or possibly vinyl ester resin in composites) results in greater strength retention of the glass fibers [1].
References 1, 6, and 7 state that the activation energy for the strength loss reaction occurring in glass composites during accelerated aging tests remains unchanged for different glass compositions (AR, E-glass, etc.) and surface coatings (poly vinyl chloride, etc.) used to protect the glass fibers. The strength loss reaction affects certain glasses more severely due to the differences in glass surface chemistry (8].
2.2.2. Accelerated aging of fiber composite materials
Accelerated aging of composite materials involves submersing these materials in water at different elevated temperatures ranging from 4°C to 80°C (39°F to 176°F) for various periods of time and relating the strength loss to similar composite materials aged in real weather conditions [1,3]. The real weather aging effects have been determined for different climates around the world.
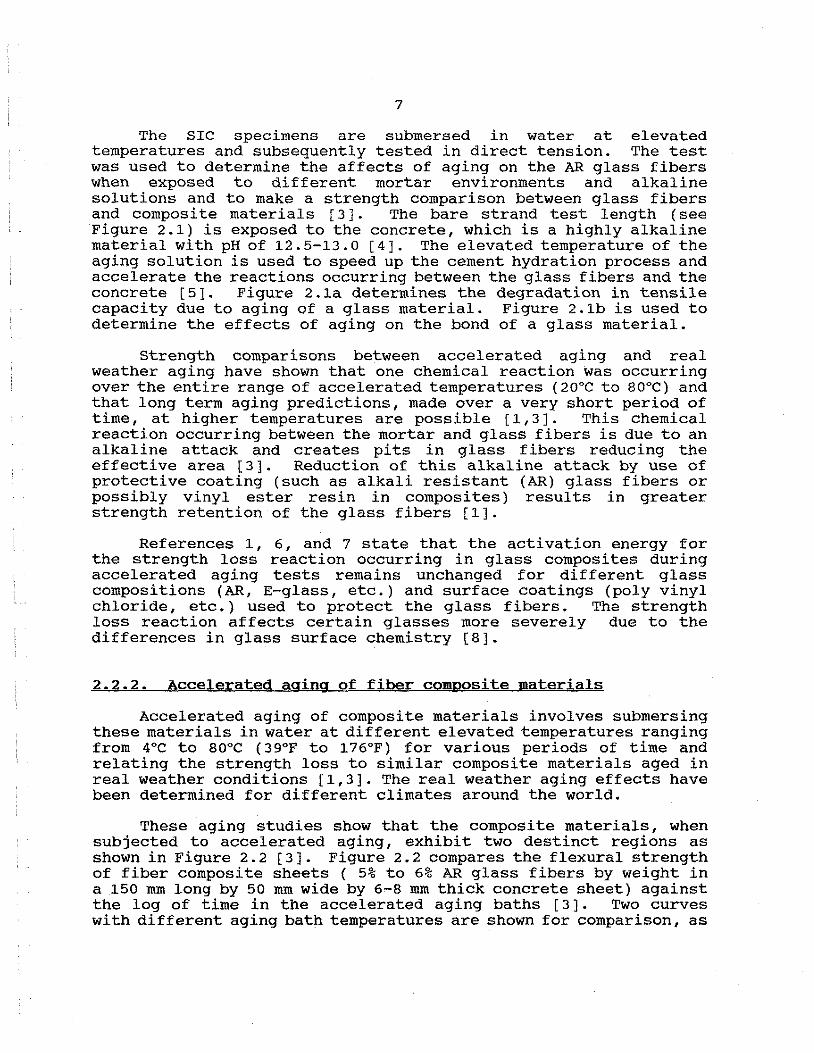
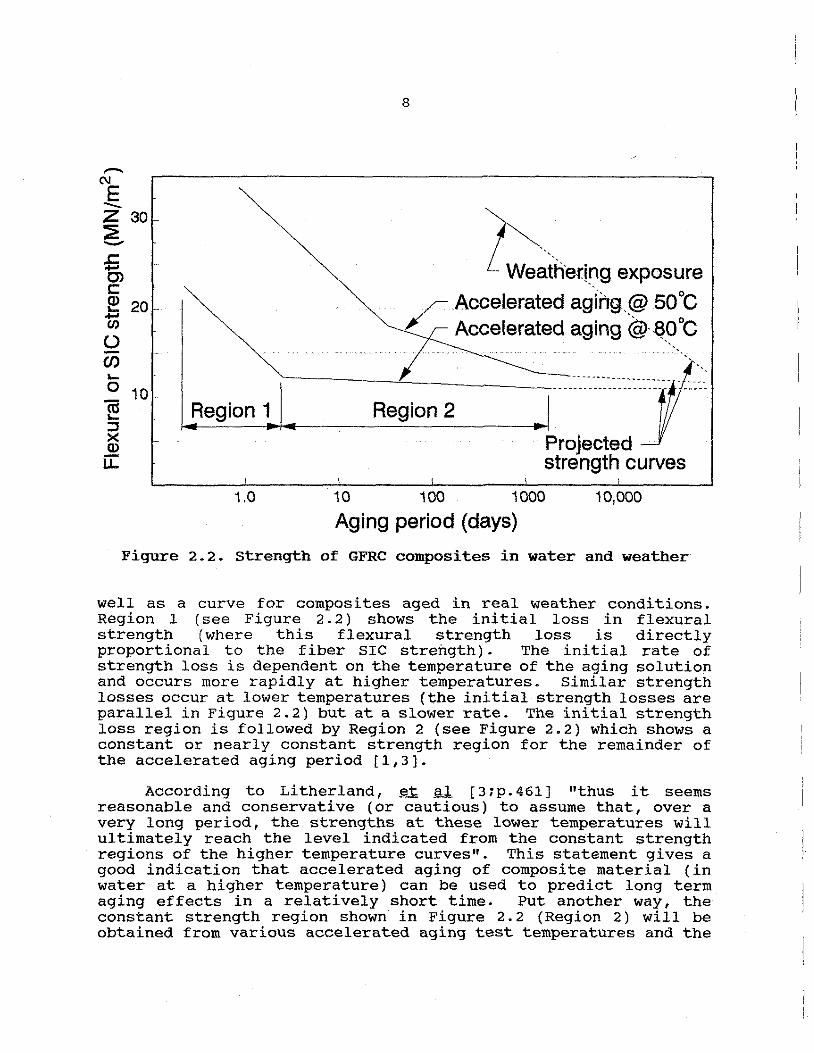
These aging studies show that the composite materials, when subjected to accelerated aging, exhibit two destinct regions as shown in Figure 2. 2 [ 3] . Figure 2. 2 compares the flexural strength of fiber composite sheets ( 5% to 6% AR glass fibers by weight in a 150 mm long by 50 mm wide by 6-8 mm thick concrete sheet) against the log of time in the accelerated aging baths [3]. Two curves with different aging bath temperatures are shown for comparison, as
,....._ N
~ z 30 ::;? -:5 O') c: ~ 20 ..... (/)
0 (/) ,_ 0
~ :J
~ u::
10 Region 1
1.0
8
~aiilerirg exposure
r Accelerated aging,@ so0c > ~ Accelerated aging @,-&,~_0c
Region 2
Projected strength curves
10 100 1000 10,000
Aging period (days)
Figure 2.2. strength of GFRC composites in water and weather
well as a curve for composites aged in real weather conditions. Region 1 (see Figure 2.2) shows the initial loss in flexural strength (where this flexural strength loss is directly proportional to the fiber SIC strength). The initial rate of strength loss is dependent on the temperature of the aging solution and occurs more rapidly at higher temperatures. Similar strength losses occur at lower temperatures (the initial strength losses are parallel in Figure 2. 2) but at a slower rate. The initial strength loss region is followed by Region 2 (see Figure 2.2) which shows a constant or nearly constant strength region for the remainder of the accelerated aging period [1,3].
According to Litherland, et al [ 3; p. 461] "thus it seems reasonable and conservative (or cautious) to assume that, over a very long period, the strengths at these lower temperatures will ultimately reach the level indicated from the constant strength regions of the higher temperature curves". This statement gives a good indication that accelerated aging of composite material (in water at a higher temperature) can be used to predict long term aging effects in a relatively short time. Put another way, the constant strength region shown in Figure 2. 2 (Region 2) will be obtained from various accelerated aging test temperatures and the
9
results of long term strength is not dependent on temperature. Therefore, the long term aging (greater than 50 years) of composites will u~timately reach the same level of constant strength whether aging occurs in natural real weather or artificial accelerated conditions.
The temperature-time dependence exhibited by composite materials has been covered extensively in Reference 1. The general slopes of the lines in Figure 2.2 are not effected by changes in climate (i.e., rainfall, humidity, periods of heat and cold) but rather depend on the mean annual temperature (MAT) occurring in a particular climate [1,3]. The rate of decrease in strength occurs more rapidly for a warmer MAT than for a cooler MAT (the same dependence exhibited by accelerated aging). This indicates that one set of temperature-time criteria for an accelerated aging test can not be used for two different climates (with different MAT's). Based on the MAT for a given climate, acceleration factors (AF) are used to adjust the temperature-time criteria and provide a way of estimating the real weather aging of composite materials. The accelerated aging temperature-time criteria's dependence on the MAT is covered in Section 3.5 of this report.
The accelerated aging studies in References 1 and 3 are based on one type of composite material (5% to 6% glass fibers by weight) . But according to Proctor et al [ 1; p .177] "research to date on a variety of fibers indicates that the procedure, and possibly even the actual acceleration factors, should be applicable across a range of glass compositions".
2.3. Effects of Accelerated Aging on Concrete
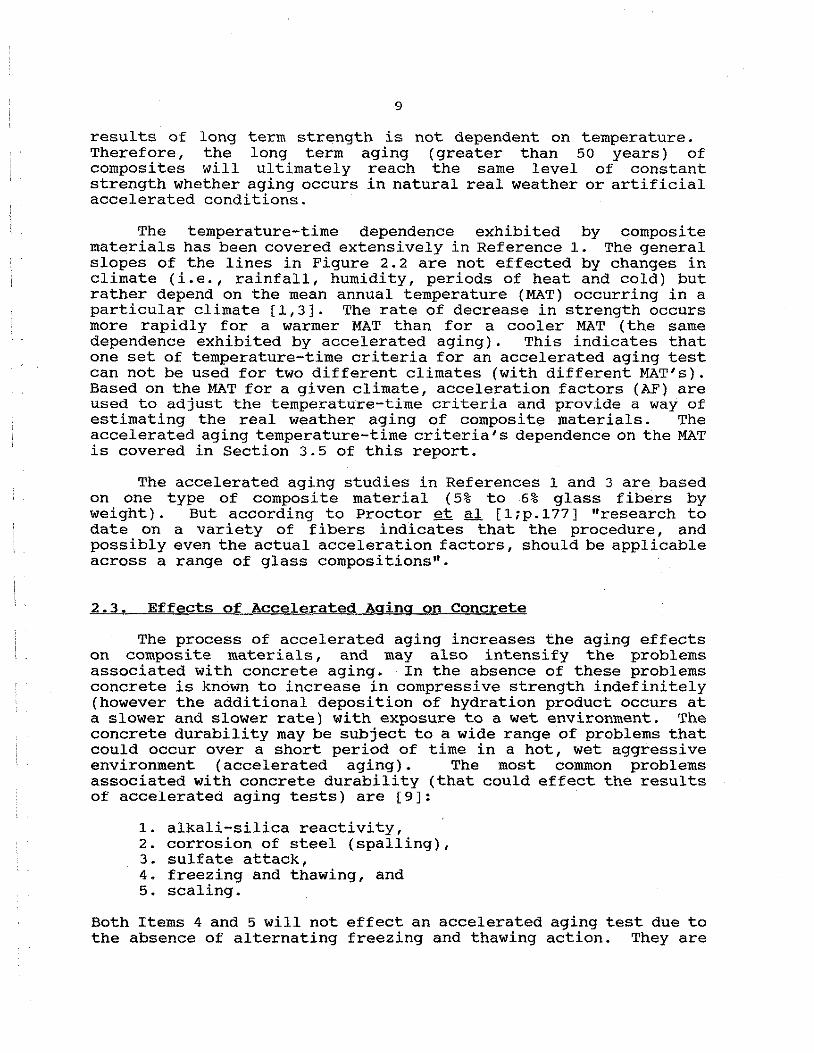
The process of accelerated aging increases the aging e.ffects on composite materials, and may also intensify the problems associated with concrete aging. In the absence of these problems concrete is known to increase in compressive strength indefinitely (however the additional deposition of hydration product occurs at a slower and slower rate) with exposure to a wet environment. The concrete durability may be subject to a wide range of problems that could occur over a short period of time in a hot, wet aggressive environment (accelerated aging). The most common problems associated with concrete durability (that could effect the results of accelerated aging tests) are [9]:
1. alkali-silica reactivity, 2. corrosion of steel (spalling), 3. sulfate attack, 4. freezing and thawing, and 5. scaling.
Both Items 4 and 5 will not effect an accelerated aging test due to the absence of alternating freezing and thawing action. They are
10
listed for completeness and may affect the natural aging of concrete in real weather conditions.
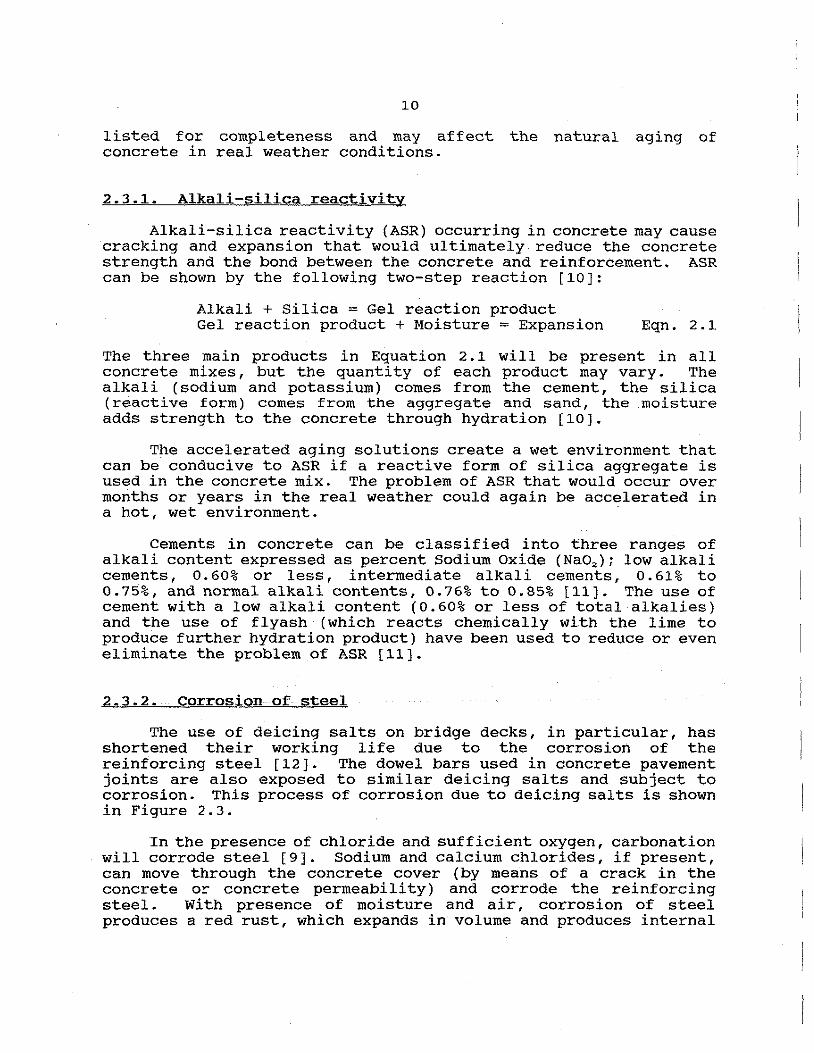
2.3.1. Alkali-silica reactivity
Alkali-silica reactivity (ASR) occurring in concrete may cause cracking and expansion that would ultimately reduce the concrete strength and the bond between the concrete and reinforcement. ASR can be shown by the following two-step reaction [10]:
Alkali + Silica = Gel reaction product Gel reaction product + Moisture = Expansion Eqn. 2.1
The three main products in Equation 2 .1 will be present in all concrete mixes, but the quantity of each product may vary. The alkali (sodium and potassium) comes from the cement, the silica (reactive form) comes from the aggregate and sand, the moisture adds strength to the concrete through hydration [10].
The accelerated aging solutions create a wet environment that can be conducive to ASR if a reactive form of silica aggregate is used in the concrete mix. The problem of ASR that would occur over months or years in the real weather could again be accelerated in a hot, wet environment.
Cements in concrete can be classified into three ranges of alkali content expressed as percent Sodium Oxide (Na02 ); low alkali cements, o. 60% or less, intermediate alkali cements, o. 61% to O. 75%, and normal alkali contents, O. 76% to o. 85% [ 11). The use of cement with a low alkali content (0.60% or less of total alkalies) and the use of flyash (which reacts chemically with the lime to produce further hydration product) have been used to reduce or even eliminate the problem of ASR [11).
2.3.2. corrosion of. steel
The use of deicing salts on bridge decks, in particular, has shortened their working life due to the corrosion of the reinforcing steel [12]. The dowel bars used in concrete pavement joints are also exposed to similar deicing salts and subject to corrosion. This process of corrosion due to deicing salts is shown in Figure 2.3.
In the presence of chloride and sufficient oxygen, carbonation will corrode steel [9]. Sodium and calcium chlorides, if present, can move through the concrete cover (by means of a crack in the concrete or concrete permeability) and corrode the reinforcing steel. With presence of moisture and air, corrosion of steel produces a red rust, which expands in volume and produces internal

11
Crackoverrebar~,---~~~~~~~~~~~~
Concrete slab
I f Salt solution
Concrete permeability
Corrosion products
Figure 2.3. Corrosion of steel [12]
forces on the concrete [ 12, 13]. The rust formed from the corrosion of steel can occupy twice the volume as the original steel material applying a force of as much as'4700 psi on the concrete, exceeding the concrete tensile capacity [13].
2.3.3. Sulfate attack
Sulfate attack requires that an external source of sulfate reacts with the cement paste [9]. The external source comes from soil or water that contains the sulphate and magnesium ions [14]. Also, the use of deicing salts on highways contributes to the problems of increased sulphate. The expansion due to sulphate attack can result in deterioration of concrete.
Examples of structures that can be affected by sulphate attack include canals, pipelines, transmission tower footings, and highway pavement [15]. The problem with sulphate attack lies in locating areas where sulfates are in high concentrations [15]. These high concentrations may effect only certain portions of a structure, requiring repair of the damaged areas.
certain aggregates used in concrete may contain quantities of sulphate [ 15] . When exposed to moisture these aggregates may expand and cause damage to the concrete. This leads the authors to believe that an accelerated aging bath can be conducive to sulphate attack by exposing concrete to a hot, wet environment (accelerated aging).
Sulphate attack is prevalent in only 10% of concrete structures built in the United states [15]. This low probability, along with testing for sulfates and use of sulphate resistant concrete (ASTM Type V) have reduced the chances of a problem
12
associated with sulphate attack [15).
2.4. Composites used in ISU Research
The fiber composite specimens used in this research program (pullout and dowel) contain E-glass fibers that are susceptible to degradation from aging. To reduce this degradation, the E-glass fibers are coated with a vinyl ester resin. The vinyl ester resin/E-glass composite is under investigation at ISU to determine its resistance to aging in harsh chemical environments. Properties of the vinyl ester resin and the composition of the E-glass fibers are given in Section 3.4 of this report.
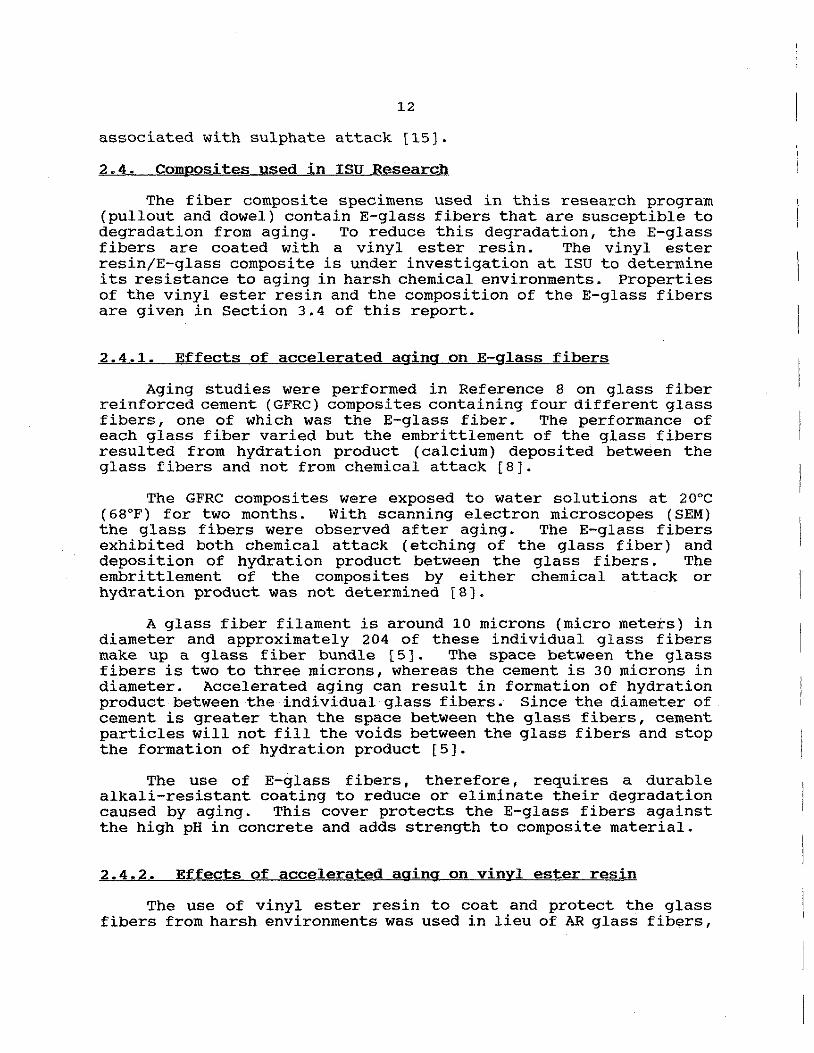
2.4.1. Effects of accelerated aging on E-glass fibers
Aging studies were performed in Reference 8 on glass fiber reinforced cement (GFRC) composites containing four different glass fibers, one of which was the E-glass fiber. The performance of each glass fiber varied but the embrittlement of the glass fibers resulted from hydration product (calcium) deposited between the glass fibers and not from chemical attack [8].
The GFRC composites were exposed to water solutions at 20°c (68°F) for two months. With scanning electron microscopes (SEM) the glass fibers were observed after aging. The E-glass fibers exhibited both chemical attack (etching of the glass fiber) and deposition of hydration product between the glass fibers. The embrittlement of the composites by either chemical attack or hydration product was not determined [8).
A glass fiber filament is around 10 microns (micro meters) in diameter and approximately 204 of these individual glass fibers make up a glass fiber bundle [5]. The space between the glass fibers is two to three microns, whereas the cement is 30 microns in diameter. Accelerated aging can result in formation of hydration product between the individual glass fibers. Since the diameter of cement is greater than the space between the glass fibers, cement particles will not fill the voids between the glass fibers and stop the formation of hydration product [5].
The use of E-glass fibers, therefore, requires a durable alkali-resistant coating to reduce or eliminate their degradation caused by aging. This cover protects the E-glass fibers against the high pH in concrete and adds strength to composite material.
2.4.2. Effects of accelerated aging on vinyl ester resin
The use of vinyl ester resin to coat and protect the glass fibers from harsh environments was used in lieu of AR glass fibers,
13
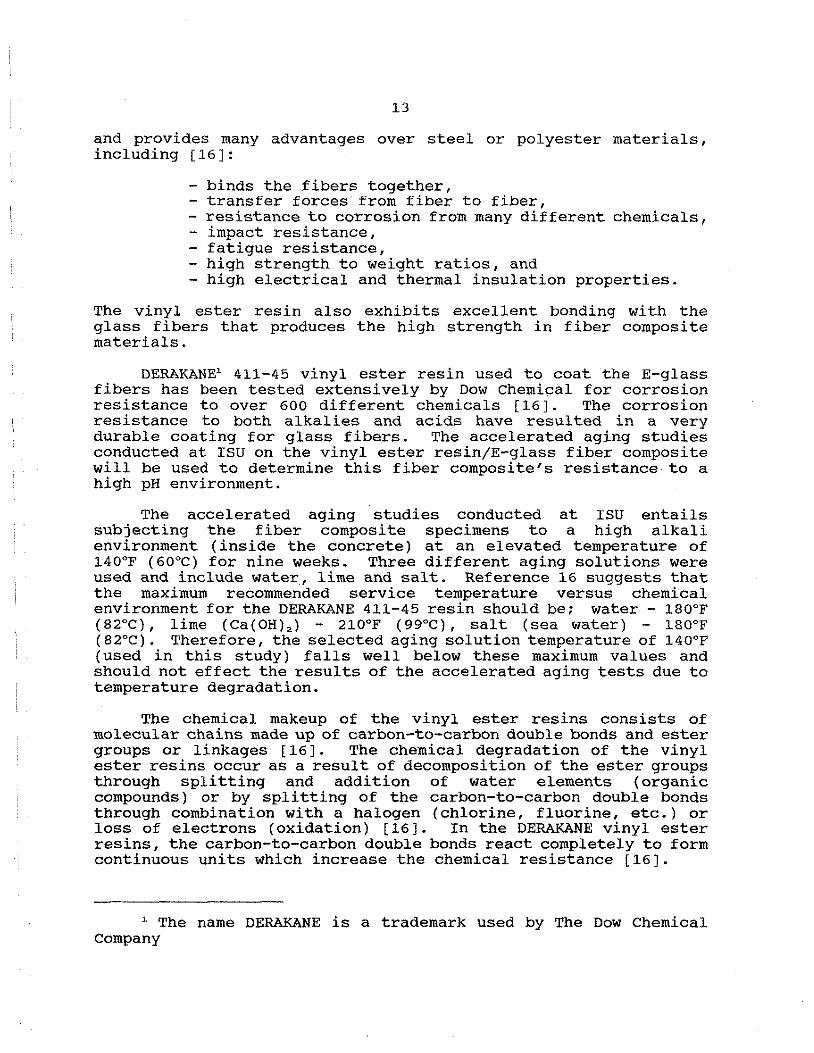
and provides many advantages over steel or polyester materials, including (16]:
- binds the fibers together, - transfer forces from fiber to fiber, - resistance to corrosion from many different chemicals, - impact resistance, - fatigue resistance, - high strength to weight ratios, and - high electrical and thermal insulation properties.
The vinyl ester resin also exhibits excellent bonding with the glass fibers that produces the high strength in fiber composite materials.
DERAKANE1 411-45 vinyl ester resin used to coat the E-glass fibers has been tested extensively by Dow Chemical for corrosion resistance to over 600 different chemicals (16]. The corrosion resistance to both alkalies and acids have resulted in a very durable coating for glass fibers. The accelerated aging studies conducted at ISU on the vinyl ester resin/E-glass fiber composite will be used to determine this fiber composite's resistance to a high pH environment.
The accelerated aging studies conducted at ISU entails subjecting the fiber composite specimens to a high alkali environment (inside the concrete) at an elevated temperature of 140°F (60°C) for nine weeks. Three different aging solutions were used and include water, lime and salt. Reference 16 suggests that the maximum recommended service temperature versus chemical environment for the DERAKANE 411-45 resin should be; water - 180°F (82°C), lime {Ca{OH),) - 210°F (99°C), salt (sea water) - 180°F ( 82°C). Therefore, the selected aging solution temperature of 140°F (used in this study) falls well below these maximum values and should not effect the results of the accelerated aging tests due to temperature degradation.
The chemical makeup of the vinyl ester resins consists of molecular chains made up of carbon-to-carbon double bonds and ester groups or linkages [16]. The chemical degradation of the vinyl ester resins occur as a result of decomposition of the ester groups through splitting and addition of water elements (organic compounds) or by splitting of the carbon-to-carbon double bonds through combination with a halogen (chlorine, fluorine, etc.) or loss of electrons (oxidation) [16]. In the DERAKANE vinyl ester resins, the carbon-to-carbon double bonds react completely to form continuous units which increase the chemical resistance (16].
1 The name DERAKANE is a trademark used by The Dow Chemical Company
14
3.0. Experimental Investigation
3.1. Introduction
The experimental investigation described herein was conducted at ISU in coordination with the Iowa Department of Transportation ( IDOT). This section repeats a brief description of the objectives and scope given in Sections 1.1.1 and 1.1.2, respectively, which focused on:
3.2. Objective
1) determining the effects of accelerated aging on the bond strength fiber composite (FC) reinforcing bars (rebars) embedded in concrete,
2) the suitability of substituting FC dowels for steel dowels.
The objectives of this research project are stated in Section 1.1.1 of this report and focused on a direct comparison between FC and steel dowel bars and a direct comparison between two types of FC rebars. The objectives consequently entailed testing of two specimen types; namely, pullout and dowel. Dowel-specimen types included FC dowels from Supplier A2 and steel dowels. Pulloutspecimen types included supplier's B and c FC rebars. Both specimen type objectives were accomplished by studying the effects of accelerated aging on specimens (either pullout or dowel) and comparing these effects with control (reference) specimens that were not exposed to accelerated aging (unaged).
The objective of the pullout testing portion of the research program was to determine the FC rebar's relative bond performance with concrete over the design life of a structure. The pullout tests were conducted for the purpose of a performance comparison of aging parameters and were not used to determine the explicit development length per se. Another important point was to observe if a significant degradation of the FC rebars pullout tensile strength occurred.
The objective of the dowel testing portion was to determine the suitability of substituting FC dowel bars for steel pavement dowels, which are currently used in practice. The important point of this portion of the research was to determine the effects in the FC dowel's shear capacity due to accelerated aging.
2 Each type of FC supplier is identified by a letter, omitting the name of the supplying company, to avoid direct comparison.

15
3.3. Scope
The scope of the research (Part 2) included experimental testing of 40 pullout specimens (including Suppliers B and C FC rebars) subjected to axial tension and 40 dowel specimens (including Supplier A FC dowels and steel dowels) subjected to direct shear. The test matrix for the 40 pullout and 40 dowelshear specimens was developed by ISU in coordination with the !DOT and can be found in Table 3.1. The test matrix is shown in two different subtables, designated Series 1 and 2. Series 1 shows the rebar type, the supplier designation and the number of test specimens for the pullout tests. Series 2 shows the dowel type, the supplier designation and the number of test specimens for the dowel-shear tests. The solutions used in the accelerated natural aging process are indicated in Table 3.1 and include air (unaged), water, lime and salt.
Table 3.1. Test matrix
Series 1 (pullout specimens):
Number of test specimens Rebar Supplier type Unaged Aged in Aged in Aged in
(air) Water lime salt
FC B 5 5 5 5
FC c 5 5 5 5
Series 2 (dowel specimens):
Number of test specimens Dowel Supplier type Unaged Aged in Aged in Aged in
(air) water lime salt
FC A 5 5 5 5
steel 0 5 5 5 5
3.4. Materials and Specimens
Pullout specimens were constructed as shown in Figure 3.1. The three-eights-inch FC rebars were embedded into the concrete a certain length (depending on the specimen type) on both s.ides of the gap (shown in Figure 3.1). Specimens containing Suppliers B and c FC rebar had out-to-out dimensions of 10 by 10 by 23 inches and 10 by 10 by 17 inches, respectively. These embedment lengths used in this research project were significantly less than the

16
1/2 II
~ FC rebar
Threaded rod ....... " ........ ' . " ....... . ::.: :.::::: ::::.:.:.:.-.:.: ::::.::: -:. t:s :sts::!.-::::.:::::-:::::: :.:::-:::::::::::::::::::::::::.
__ ,__ ___, .. [ 311 __ [.. _ ___, .. [
10"
7" , ..
10"
Supplier B
3"Gap I 7"
..I / I... ..I
FC rebar
Supplier C
10"
10"
Figure 3.1. Test assemblies for pullout specimens

17
development length of the rebar to insure a pullout failure of the rebar and preempt a tensile failure (that did not exhibit any bond failure). The proportion decided upon, without specifically testing for it, was roughly two-thirds of the development length of the individual rebars. Due to the surface texture (Supplier B was without surface roughness) each rebar had different embeddment lengths). A three-inch gap (refer to Figure 3.1) was constructed in the center of the specimens in order to expose the rebar to the effects of the accelerated aging process and provide ·a way to monitor the bond failure. One-half inch of the rebar was exposed on either side of the specimen (see Figure 3.1) providing a way to monitor the bond failure.
The gap in the pullout specimens was formed using three-inch Styrofoam3 pieces. Three-eighths-inch diameter threaded rods were cast in each corner of the pullout specimens (see Figure 3.1.) in the longitudinal direction to eliminate twisting or flexing of the FC rebar during handling. The threaded rods were kept in the specimens until testing.
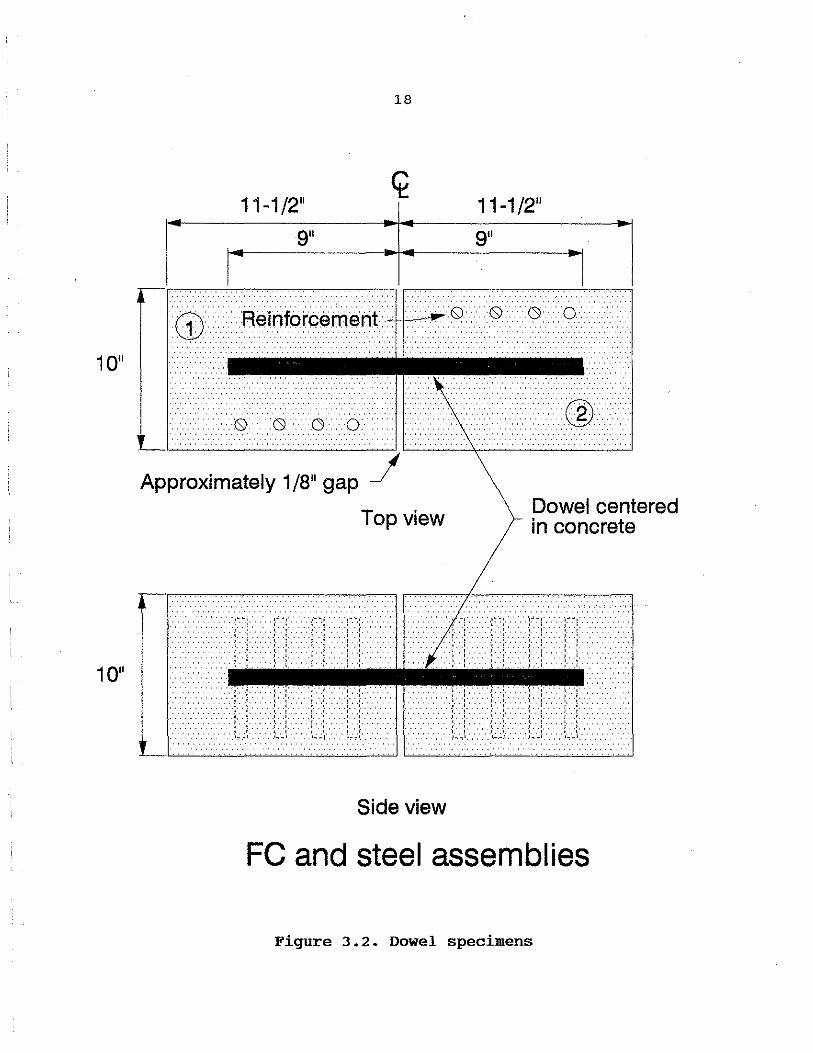
Dowel-shear specimens were constructed as shown in Figure 3. 2. These specimens consisted of a 10- by 10- by 23-inch concrete member (Part 1 of this report used a 10- by 10- by 24-inch concrete member) with a pavement dowel centered in the concrete (1.25-inch FC dowels or 1.50-inch steel dowels). A gap in the specimen (see Figure 3.2) helped insure that no force was transferred by aggregate interlock, and that all of the force was transferred through the dowel being tested. To keep the specimen close to field conditions a gap of approximately one-eighth inch was used.
The gap in the dowel-shear specimens was constructed using two-half sheets of plexiglass approximately one-eighth inch wide. The plexiglass was removed after curing of the specimens and before placement in the aging.tanks.
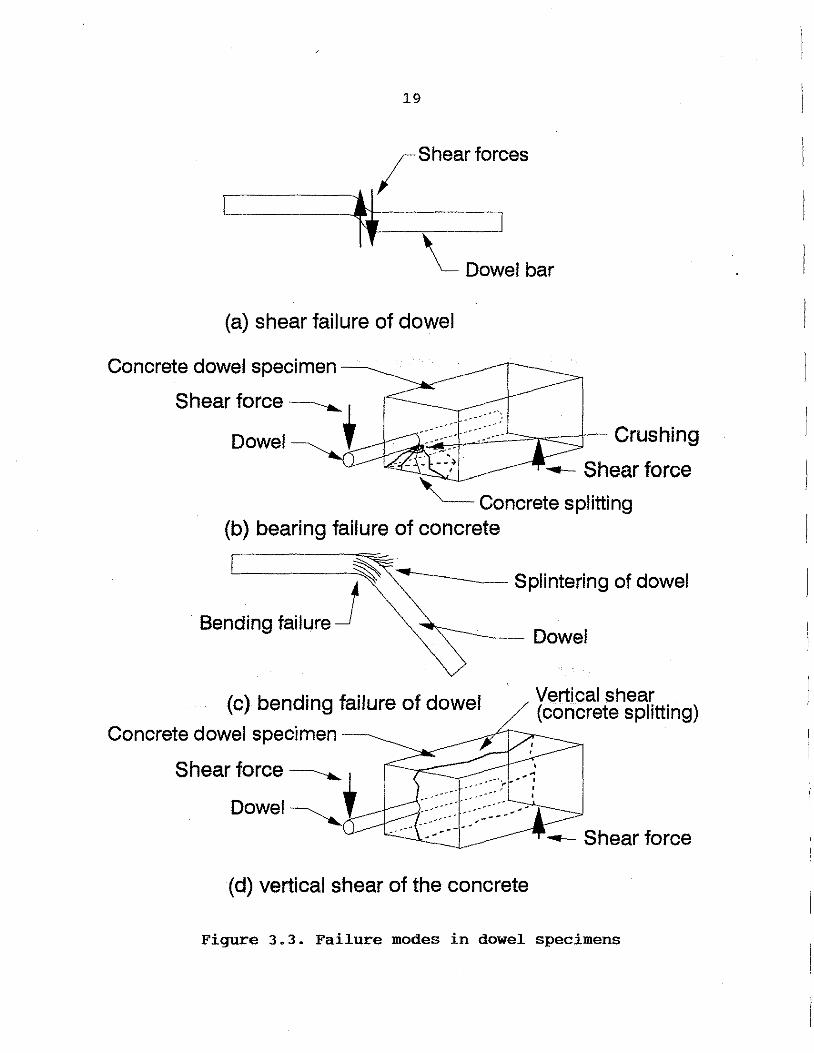
During the testing of the dowel bars, four possible modes of failure may occur in the specimens:
- shear failure of the dowel bar, - bearing failure of the concrete beneath the dowel bar, - bending failure of the dowel bar, and - a vertical shear of the concrete surrounding the dowel bar.
These four failure modes are depicted in Figure 3. 3. Vertical shear also named splitting of the concrete is presented in Section 4.3 of this report. All of the failure modes, with the exception of the vertical shear mode, can occur to dowel bars in pavement, as well as in test specimens. A vertical shear mode is possible only ·
3 Styrofoam is a registered trademark of the Dow Chemical company
10"
1011
18
11-1/2" 11-1/2"
9" 911
·····························································@••············
Approximately 1 /8 11 gap _/
Top view
........... ""'
Dowel centered in concrete
.::.::.::.::.· •. ::.::.::.· .. ::.::.::: .. ;.::.::,:.: <<<·>:-:r:.::. ·::.:-; -:-:-:c:-:-:.:.: . . . :.:-:.:.:-:-: :-:·.:-:.:1 ....... {·>)· .::.::.::.•,::.• .. •,; :.:.:-.:-:-:::<<· ·: .. . ·.·.·.·.:.·:.:,:.·' -.· ...... ·,! ·::.l::::.-: . ...................... :.·.-.:, .•.·.·.·.•.·.•.·:: ... ·.·.· .. ·.:.· . "1 . ; ..... .
I ' I ' '· . ! . .'.'.>.'."!' .".'.', . . ············,··, · .. .'.i.".i."."." .• .. ! ·.:_<.'.'!'.'.'.''" .. , .... ,··; ' ' ! '
· .. ·.·.·.·.·.·.·.·.·.·.·.·.·.·.·.·.·.·.·.·.·.·.·.:····.·.·,:.·. ' I < ' ' ' •• , ••• ···,··, '.'.'\'.'1.''.".'."."(,"." .... ·::.·.::-:-;:-:: ;.: J· ·:.::.y:: . ... ·.•·.• .. ·.•.•.•.··.> ... :.:~:~; ... >.•.·> .. :.· ......... : .. · .. · .. ·. ·.: .. ~-~: .. ·: . ; '-:·.' ............ -'~;-\ .... • ... -.•.. ,•.-.-! ·::_;_~;.:... " .,.. :: .. :.:~;:::::.
Side view
FC and steel assemblies
Figure 3.2. Dowel specimens
19
/Shear forces
._____________~--.--------' \_Dowel bar
(a) shear failure of dowel
-.--. " -. '
Concrete dowel specimen ---
Shear force ----.....1
Dowel ' "-· '
t;;l~~~~r~~ Crushing
-- Shear force
'= Concrete splitting (b) bearing failure of concrete
~---~
Bending failure J :------___ Splintering of dowel
~-----'--- Dowel
(c) bending failure of dowel Vertical shear (concrete splitting)
Concrete dowel specimen -..__
Shear force ----.....1
Dowel~{
(d) vertical shear of the concrete
-- Shear force
Figure 3.3. Failure modes in dowel specimens
20
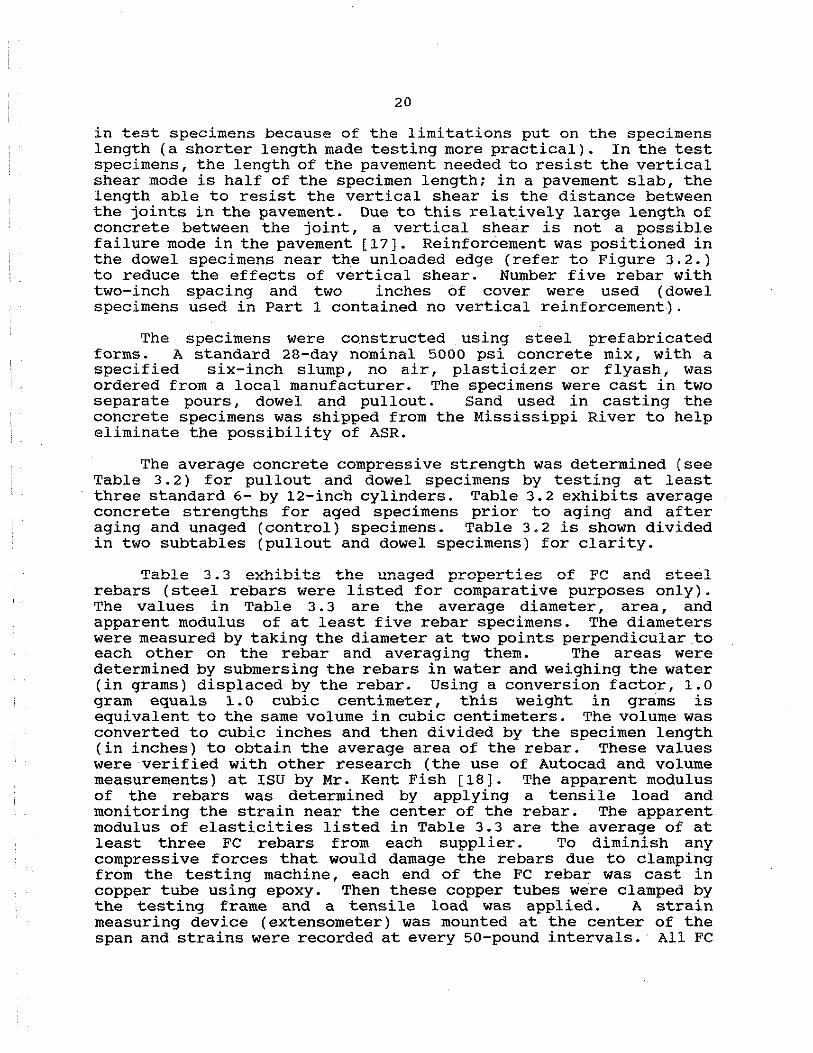
in test specimens because of the limitations put on the specimens length (a shorter length made testing more practical). In the test specimens, the length of the pavement needed to resist the vertical shear mode is half of the specimen length; in a pavement slab, the length able to resist the vertical shear is the distance between the joints in the pavement. Due to this relatively large length of concrete between the joint, a vertical shear is not a possible failure mode in the pavement [17]. Reinforcement was positioned in the dowel specimens near th.e unloaded edge (refer to Figure 3. 2.) to reduce the effects of vertical shear. Number five rebar with two-inch spacing and two inches of cover were used (dowel specimens used in Part 1 contained no vertical reinforcement).
The specimens were constructed using steel prefabricated forms. A standard 28-day nominal 5000 psi concrete mix, with a specified six-inch slump, no air, plasticizer or flyash, was ordered from a local manufacturer. The specimens were cast in two separate pours, dowel and pullout. Sand used in casting the concrete specimens was shipped from the Mississippi River to help eliminate the possibility of ASR.
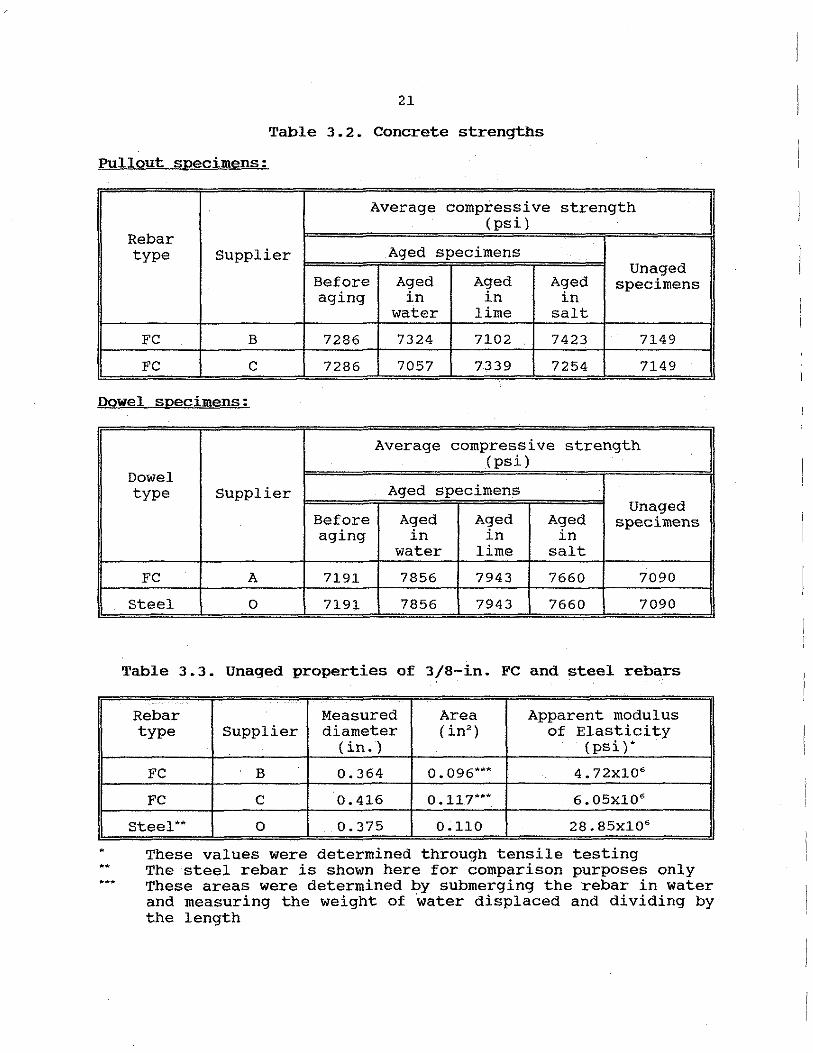
The average concrete compressive strength was determined (see Table 3. 2) for pullout and dowel specimens by testing at least three standard 6- by 12-inch cylinders. Table 3. 2 exhibits average concrete strengths for aged specimens prior to aging and after aging and unaged (control) specimens. Table 3.2 is shown divided in two subtables (pullout and dowel specimens) for clarity.
Table 3. 3 exhibits the unaged properties of FC and steel rebars (steel rebars were listed for comparative purposes only). The values in Table 3. 3 are the average diameter, area, and apparent modulus of at least five rebar specimens. The diameters were measured by taking the diameter at two points perpendicular to each other on the rebar and averaging them. The areas were determined by submersing the rebars in water and weighing the water (in grams) displaced by the rebar. Using a conversion factor, 1.0 gram equals 1.0 cubic centimeter, this weight in grams is equivalent to the same volume in cubic centimeters. The volume was converted to cubic inches and then divided by the specimen length (in inches) to obtain the average area of the rebar. These values were verified with other research (the use of Autocad and volume measurements) at ISU by Mr. Kent Fish [18]. The apparent modulus of the rebars was determined by applying a tensile load and monitoring the strain near the center of the rebar. The apparent modulus of elasticities listed in Table 3.3 are the average of at least three FC rebars from each supplier. To diminish any compressive forces that would damage the rebars due to clamping from the testing machine, each end of the FC rebar was cast in copper tube using epoxy. Then these copper tubes were clamped by the testing frame and a tensile load was applied. A strain measuring device (extensometer) was mounted at the center of the span and strains were recorded at every 50-pound intervals.· All FC
21
Table 3.2. Concrete strengths
Pullout specimens:
Average compressive strength (psi)
Rebar type Supplier Aged specimens
Unaged Before Aged Aged Aged specimens aging in in in
water lime salt
FC B 7286 7324 7102 ·. 7423 7149
FC c 7286 7057 7339 7254 7149
Dowel specimens:
..
Average compressive strength (psi)
Dowel type Supplier Aged specimens
Unaged Before Aged Aged Aged specimens aging in in in
water lime salt
FC A 7191 7856 7943 7660 7090
steel 0 7191 7856 7943 7660 7090
Table 3.3. unaged properties of 3/8-in. FC and steel rebars
Rebar Measured Area Apparent modulus type Supplier diameter ( in2
) of Elasticity (in.) (psi)•
FC B 0.364 0. 096*** 4. 72x10•
FC c 0.416 0 .117 ... 6. 05x10•
steel** 0 0.375 0.110 28.85xl06
These values were determined through tensile testing The steel rebar is shown here for comparison purposes only These areas were determined by submerging the rebar in water and measuring the weight of water displaced and dividing by the length ·
22
rebars were loaded to 60 percent of ultimate tensile capacity to insure no failure of the FC rebar (failure would damage the instrumentation). The tensile loads were divided by the area of the rebar and a corresponding stress was determined. The strain was plotted against the stress, and the slope of the stress-strain diagram gave the apparent tensile modulus of elasticity.
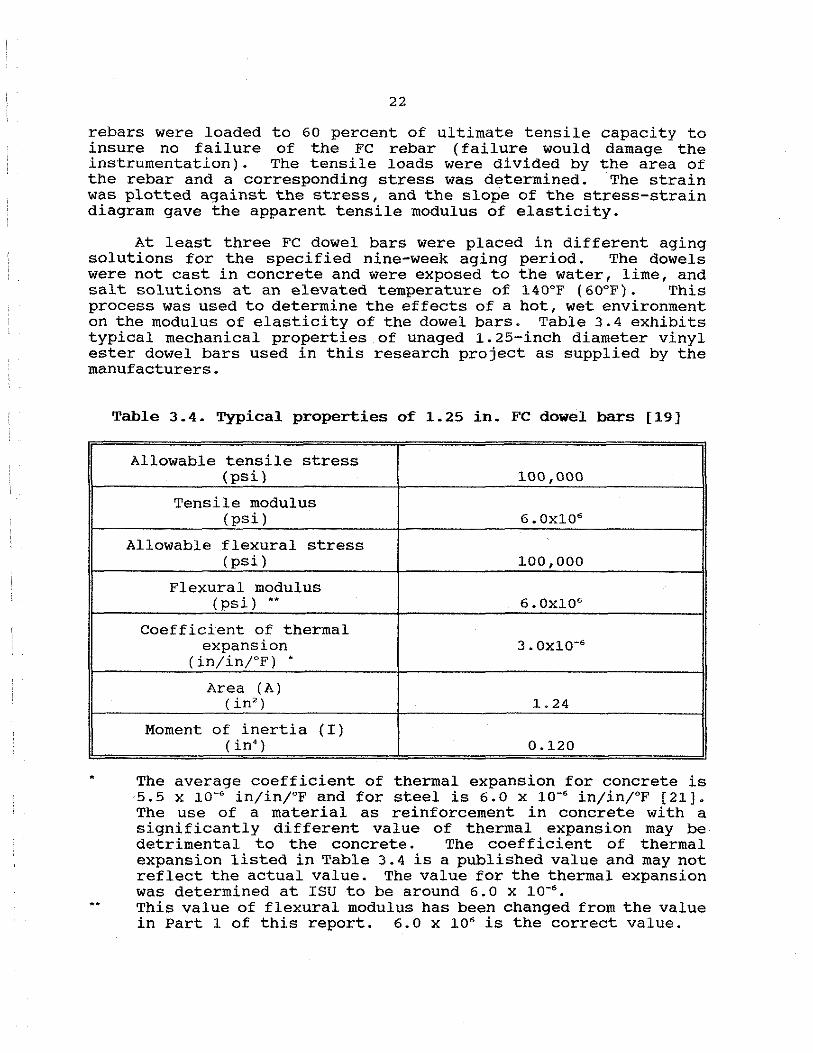
At least three FC dowel bars were placed in different aging solutions for the specified nine-week aging period. The dowels were not cast in concrete and were exposed to the water, lime, and salt solutions at an elevated temperature of 140"F (60"F). This process was used to determine the effects of a hot, wet environment on the modulus of elasticity of the dowel bars. Table 3. 4 exhibits typical mechanical properties of unaged 1.25-inch diameter vinyl ester dowel bars used in this research project as supplied by the manufacturers.
•
Table 3.4. Typical properties of 1.25 in. FC dowel bars [19]
Allowable tensile stress (psi) 100,000
Tensile modulus (psi) 6. ox10•
Allowable flexural stress (psi) 100,000
Flexural modulus (psi) •• 6. ox10•
Coefficient of thermal expansion 3. ox10-•
( in/in/°F) . Area (A)
(in') 1.24
Moment of inertia (I) (in') 0.120
The average coefficient of thermal expansion for concrete is 5.5 x 10~ in/in/"F and for steel is 6.0 x 10~ in/in/"F [21]. The use of a material as reinforcement in concrete with a significantly different value of thermal expansion may be detrimental to the concrete. The coefficient of thermal expansion listed in Table 3.4 is a published value and may not reflect the actual value. The value for the thermal expansion was determined at ISU to be around 6. O x 10-•. This value of flexural modulus has been changed from the value in Part 1 of this report. 6.0 x 10• is the correct value.
\
23
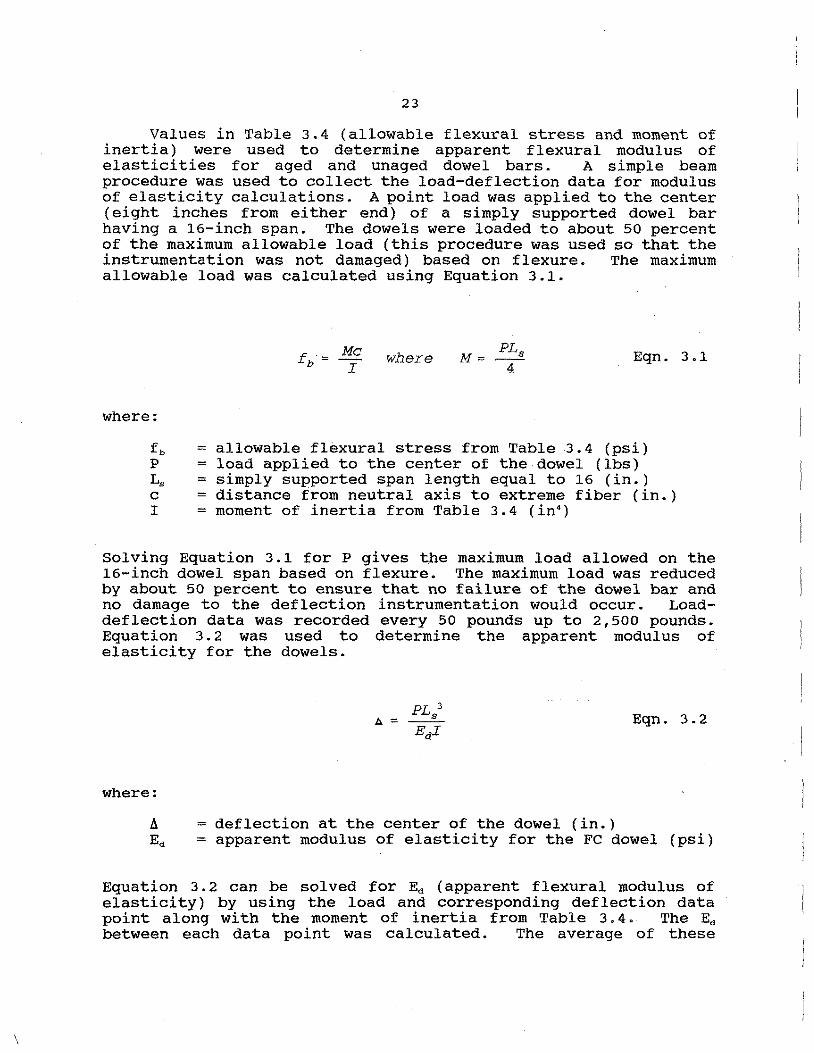
Values in Table 3.4 (allowable flexural stress and moment of inertia) were used to determine apparent flexural modulus of elasticities for aged and unaged dowel bars. A simple beam procedure was used to collect the load-deflection data for modulus of elasticity calculations. A point load was applied to the center (eight inches from either end) of a simply supported dowel bar having a 16-inch span. The dowels were loaded to about 50 percent of the maximum allowable load (this procedure was used so that the instrumentation was not damaged) based on flexure. The maximum allowable load was calculated using Equation 3.1.
f · - Mc where b - I Eqn. 3.1
where:
fb allowable flexural stress from Table 3.4 (psi) P load applied to the center of the dowel (lbs) L. simply supported span length equal to 16 (in.) c distance from neutral axis to extreme fiber (in.) I moment of inertia from Table 3.4 (in')
Solving Equation 3.1 for P gives the maximum load allowed on the 16-inch dowel span based on flexure. The maximum load was reduced by about 50 percent to ensure that no failure of the dowel bar and no damage to the deflection instrumentation would occur. Loaddeflection data was recorded every 50 pounds up to 2,500 pounds. Equation 3.2 was used to determine the apparent modulus of elasticity for the dowels.
Eqn. 3.2
where:
~ deflection at the center of the dowel (in.) Ed apparent modulus of elasticity for the FC dowel (psi)
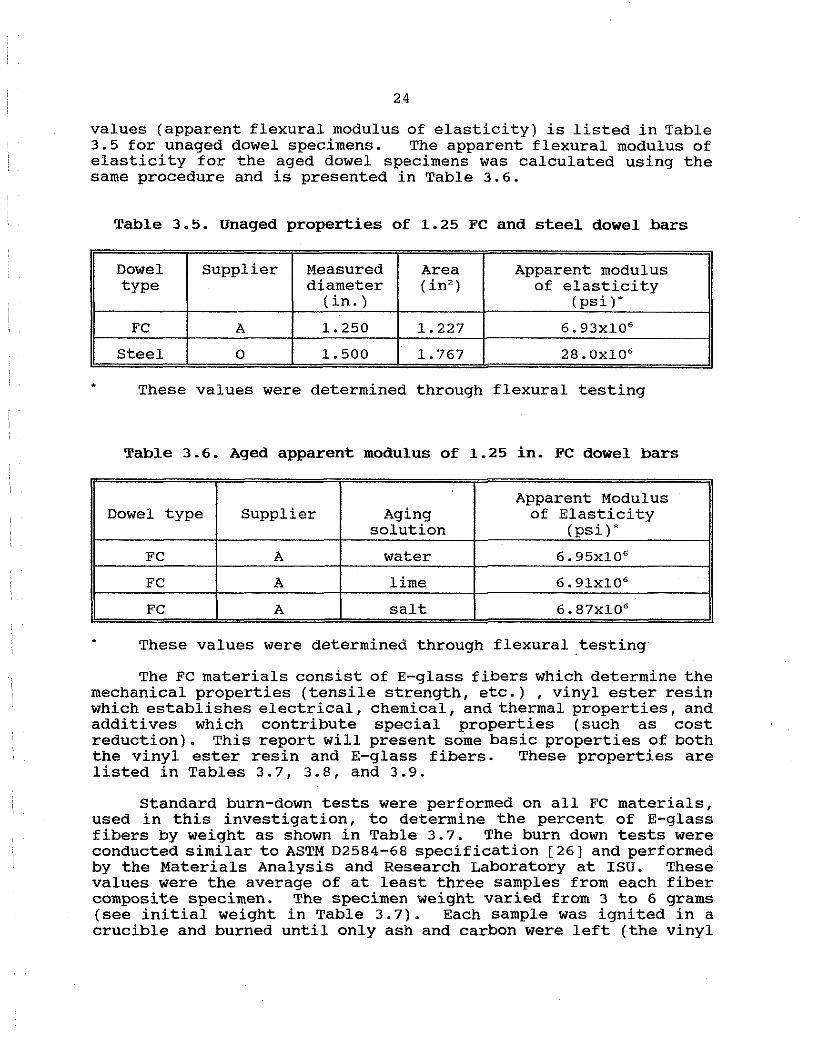
Equation 3. 2 can be solved for Ed (apparent flexural modulus of elasticity) by using the load and corresponding deflection data point along with the moment of inertia from Table 3. 4. The Ed between each data point was calculated. The average of these
24
values (apparent flexural modulus of elasticity) is listed in Table 3.5 for unaged dowel specimens. The apparent flexural modulus of elasticity for the aged dowel specimens was calculated using the same procedure and is presented in Table 3.6.
Table 3.5. Unaged properties of 1.25 FC and steel dowel bars
Dowel Supplier Measured Area Apparent modulus type diameter ( in 2
) of elasticity (in.) (psi)*
FC A 1.250 1.227 6. 93xl06
Steel 0 1.500 1.767 28. ox10•
These values were determined through flexural testing
Table 3.6. Aged apparent modulus of 1.25 in. FC dowel bars
Apparent Modulus Dowel type Supplier Aging of Elasticity
solution (psi)*
FC A water 6. 95xl06
FC A lime 6.91xl06
FC A salt 6. 87xl06
• These values were determined through flexural.testing
The FC materials consist of E-glass fibers which determine the mechanical properties (tensile strength, etc.) , vinyl ester resin which establishes electrical, chemical, and thermal properties, and additives which contribute special properties (such as cost reduction). This report will present some basic properties of both the vinyl ester resin and E-glass fibers. These properties are listed in Tables 3.7, 3.8, and 3.9.
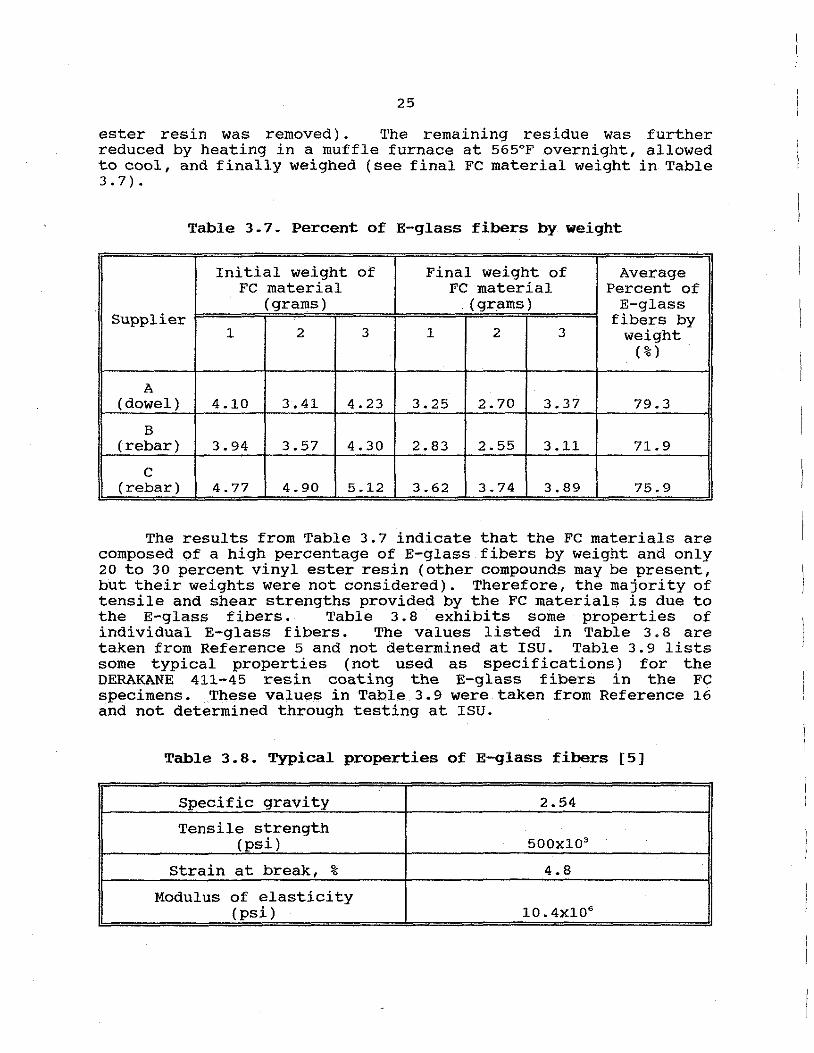
Standard burn-down tests were performed on all FC materials, used in this investigation, to determine the percent of E-glass fibers by weight as shown in Table 3.7. The burn down tests were conducted similar to ASTM D2584-68 specification (26) and performed by the Materials Analysis and Research Laboratory at ISU. These values were the average of at least three samples from each fiber composite specimen. The specimen weight varied from 3 to 6 grams (see initial weight in Table 3.7). Each sample was ignited in a crucible and burned until only ash and carbon were left (the vinyl
25
ester resin was removed) . The remaining residue was further reduced by heating in a muffle furnace at 565°F .overnight, allowed to cool, and finally weighed (see final FC material weight in Table 3. 7) •
Table 3.7. Percent of E-glass fibers by weight
Initial weight of Final weight of Average FC material FC material Percent of
(grams) . (grams) E-glass Supplier fibers by
1 2 3 1 2 3 weight ( % )
A (dowel) 4.10 3.41 4.23 3.25 2.70 3.37 79.3
B (rebar) 3.94 3.57 4.30 2.83 2.55 3.11 71.9
c (rebar) 4.77 4.90 5.12 3.62 3.74 3.89 75.9
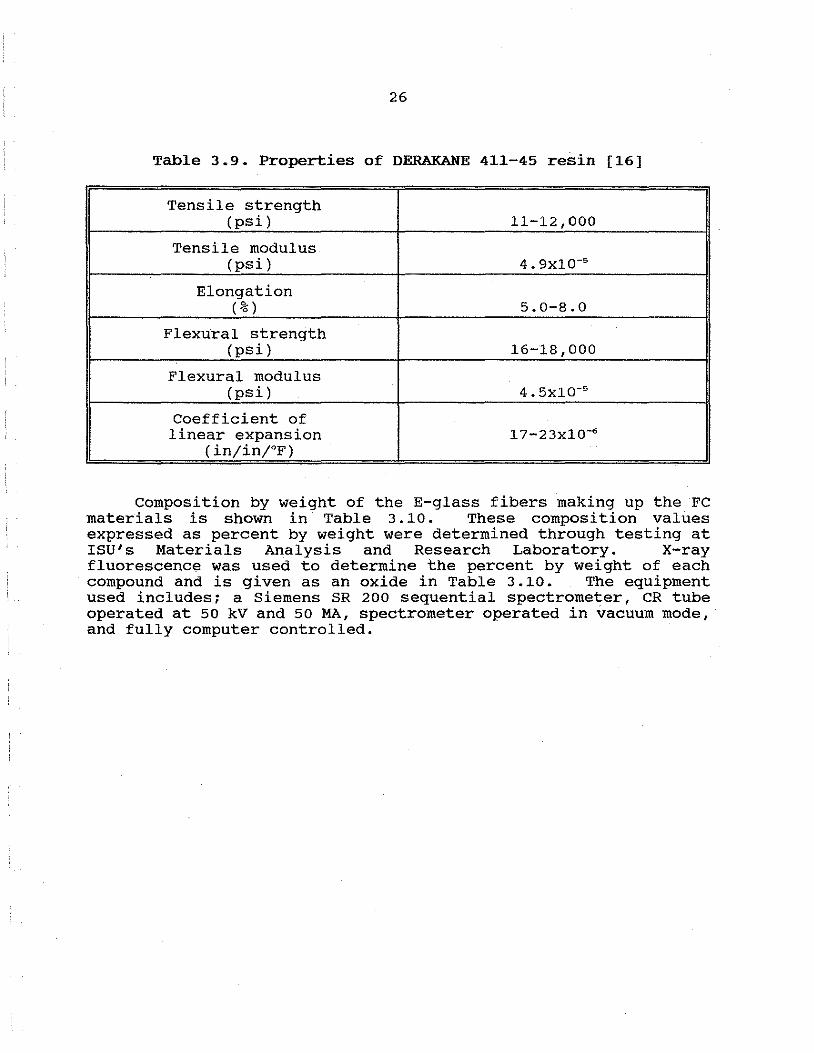
The results from Table 3.7 indicate that the FC materials are composed of a high percentage of E-glass fibers by weight and only 20 to 30 percent vinyl ester resin (other compounds may be present, but their weights were not considered). Therefore, the majority of tensile and shear strengths provided by the FC materials is due to the E-glass fibers. Table 3.8 exhibits some properties of individual E-glass fibers. The values listed in Table 3. 8 are taken from Reference 5 and not determined at ISU. Table 3.9 lists some typical properties (not used as specifications) for the DERAKANE 411-45 resin coating the E-glass fibers in the FC specimens. These values in Table 3.9 were taken from Reference 16 and not determined through testing at ISU.
Table 3.8. Typical properties of E-glass fibers [5]
Specific gravity 2.54
Tensile strength (psi) 500xlO'
Strain at break, % 4.8
Modulus of elasticity (psi) 10. 4x10•
26
Table 3.9. Properties of DERAKANE 411-45 resin [16]
Tensile strength (psi) 11-12,000
Tensile modulus (psi) 4. 9x10-s
Elongation ( % ) 5.0-8.0
Flexural strength (psi) 16-18,000
Flexural modulus (psi) 4. 5x10-s
Coefficient of linear expansion 17-23x10-•
( in/in/°F)
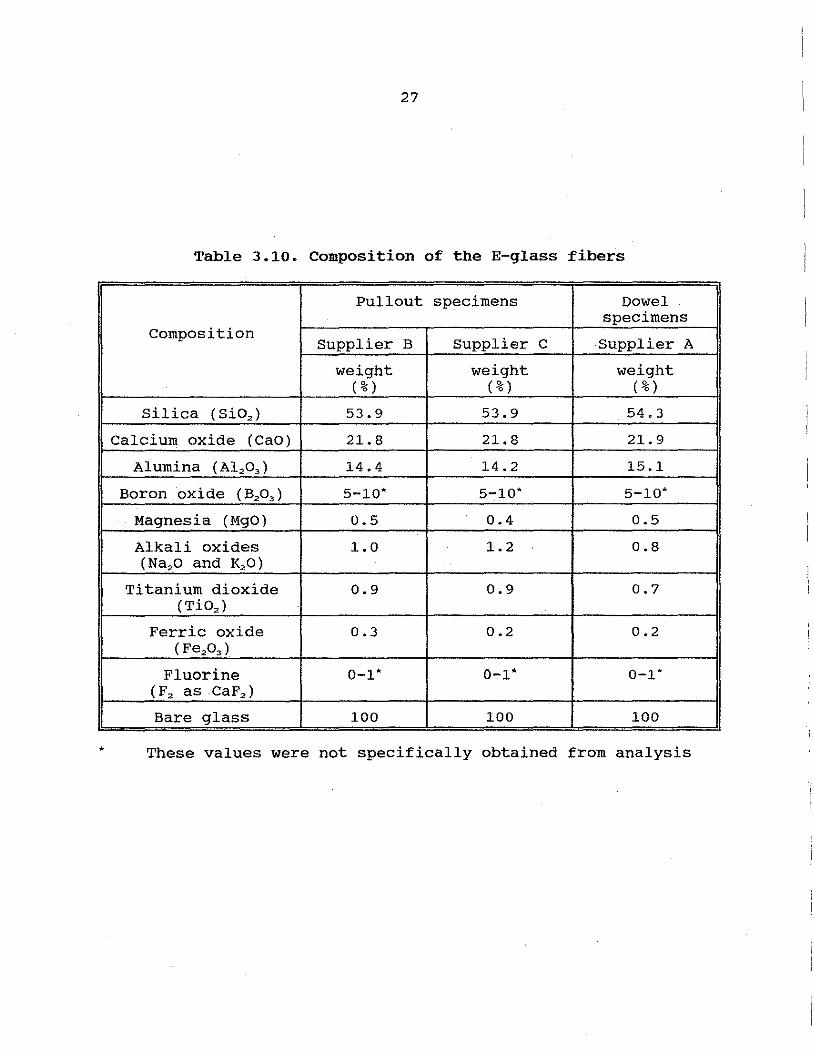
Composition by weight of the E-glass fibers making up the FC materials is shown in Table 3 .10. These composition values expressed as percent by weight were determined through testing at ISU's Materials Analysis and Research Laboratory. X-ray fluorescence was used to determine the percent by weight of each compound and is given as an oxide in Table 3.10. The equipment used includes; a Siemens SR 200 sequential spectrometer, CR tube operated at 50 kV and 50 MA, spectrometer operated in vacuum mode, and fully computer controlled.
27
Table 3.10. Composition of the E-glass fibers
Pullout specimens Dowel specimens
Composition Supplier B supplier c supplier A
weight weight weight (%) (%) ( % )
Silica ( SiO,) 53.9 53.9 54.3
Calcium oxide (Cao) 21.8 21.8 21.9
Alumina (Al203 ) 14.4 14.2 15.1
Boron oxide ( B20,) 5-10* 5-10* 5-10*
Magnesia (MgO) 0.5 0.4 0.5
Alkali oxides 1.0 1.2 0.8 ( Na2 0 and K20)
Titanium dioxide 0.9 0.9 0.7 (Ti02 )
Ferric oxide 0.3 0.2 0.2 ( Fe20 3 )
Fluorine 0-1 • 0-1 • 0-1· (F2 as CaF2 )
Bare glass 100 100 100
• These values were not specifically obtained from analysis
28
3.5. Accelerated Aging Conducted at ISU
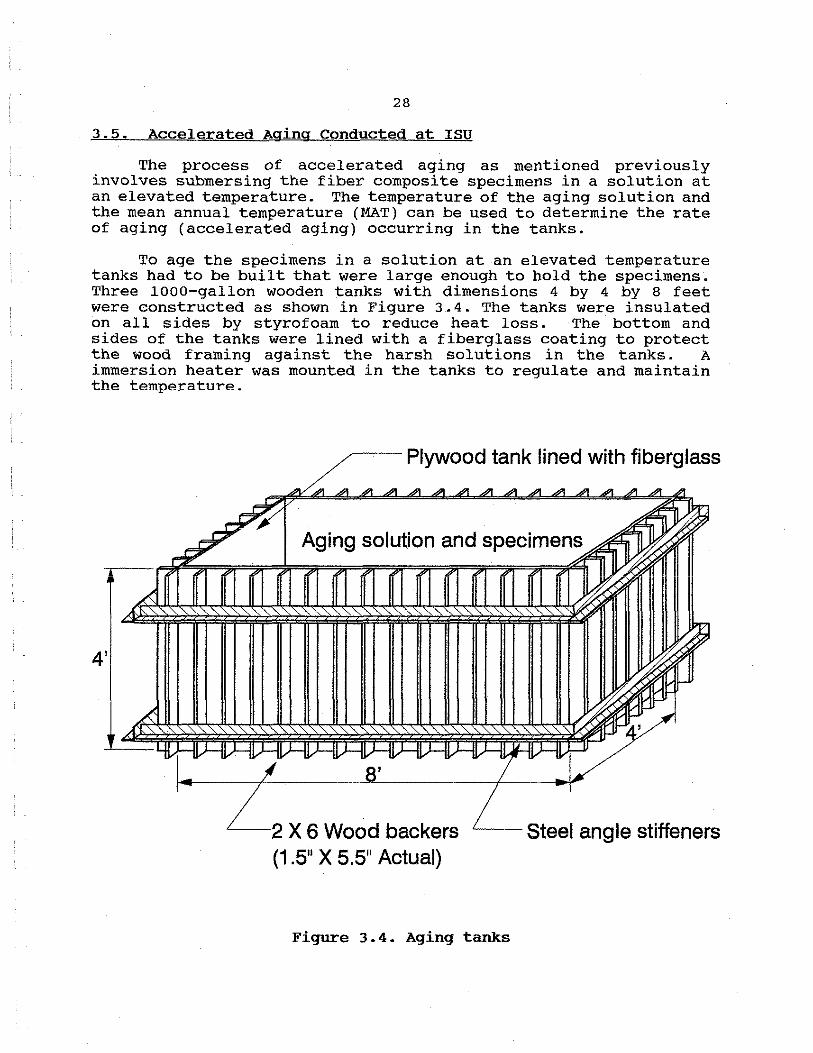
The process of accelerated aging as mentioned previously involves submersing the fiber composite specimens in a solution at an elevated temperature. The temperature of the aging solution and the mean annual temperature (MAT) can be used to determine the rate of aging (accelerated aging) occurring in the tanks.
To age the specimens in a solution at an elevated temperature tanks had to be built that were large enough to hold the specimens. Three 1000-gallon wooden tanks with dimensions 4 by 4 by 8 feet were constructed as shown in Figure 3.4. The tanks were insulated on all sides by styrofoam to reduce heat loss. The bottom and sides of the tanks were lined with a fiberglass coating to protect the wood framing against the harsh solutions in the tanks. A immersion heater was mounted in the tanks to regulate and maintain the temperature.
4'
Plywood tank lined with fiberglass
'---2 X 6 Wood backers (1.5" X 5.5" Actual)
Figure 3.4. Aging tanks
Steel angle stiffeners
29
Prior to the start of accelerated aging, all FC specimens were stored at room temperature ( 60°F to 65°F) for a standard 28-day curing period. On the 28th day the specimens were separated and placed in three temperature-controlled baths. Each tank contained two layers of specimens; pullout and dowel. The bottom layer {dowel specimens) was placed on the floor of the tanks wh.ile the second layer (pullout specimens) was placed on a support rack. This support rack kept the two layers of specimens separate and allowed the aging solutions to affect the specimens equally and to eliminate pre-loading of the specimens in the tanks.
The IDOT suggested that the following three solutions should be used in the accelerated aging process of the specimens:
- water, - lime, and - salt.
Unaged (air) specimens were used as reference. The water solution was ordinary tap water. The lime solution contained reagent grade calcium hydroxide {Ca(OH) 2 ). A sufficient amount of Ca(OH), was added to create a basic solution with a pH of 11-12 that was maintained throughout the aging process. The salt solution contained three-percent sodium chloride salt (NaCl) by weight and was maintained throughout the aging process. The salt water solution had the same concentrations of salt as that of sea water. The tanks were stirred on a regular basis to keep the lime and salt
.in solution and to prevent stagnation of the aging baths.
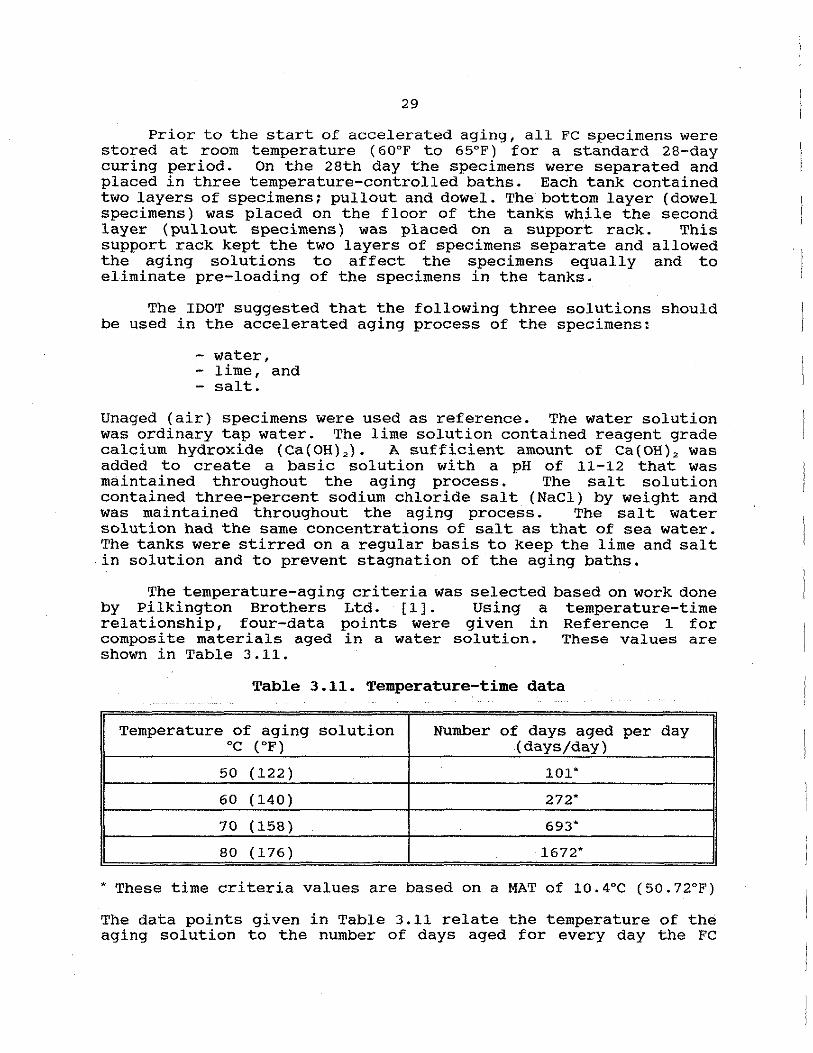
The temperature-aging criteria was selected based on work done by Pilkington Brothers Ltd. [1]. Using a temperature-time relationship, four-data points were given in Reference 1 for composite materials aged in a water solution. These values are shown in Table 3.11.
Table 3.11. Temperature-time data
Temperature of aging solution Number of days aged per day oc {oF) {days/day)
50 (122) 101·
60 (140) 272*
70 (158) 693*
80 (176) 1672*
•These time criteria values are based on a MAT of 10.4°C (50.72°F)
The data points given in Table 3.11 relate the temperature of the aging solution to the number of days aged for every day the FC
. I
I
30
specimens remain in the aging solution. These data points were established for a mean annual temperature (MAT) of 10.4°C (50.72°F). The process of aging in real weather is dependent on the MAT, where the rate of decrease in strength of FC materials occurs more rapidly in warmer climates (higher MAT) than in cooler climates (lower MAT) ( 3 ] .
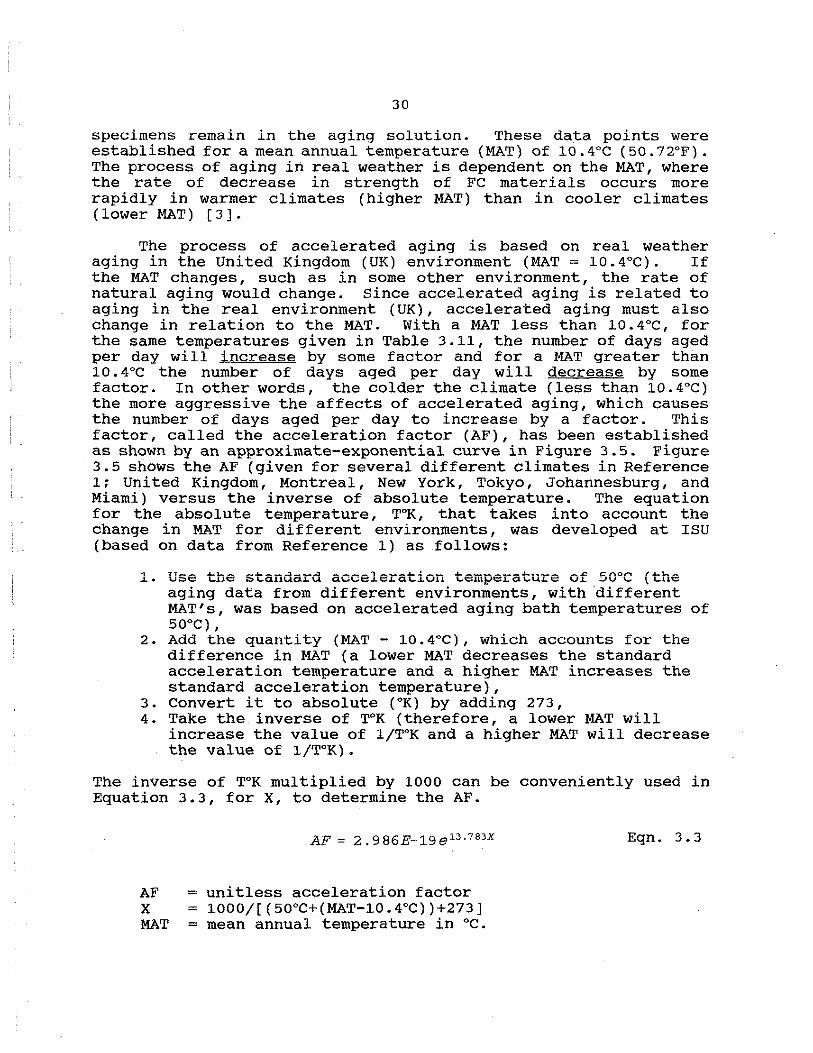
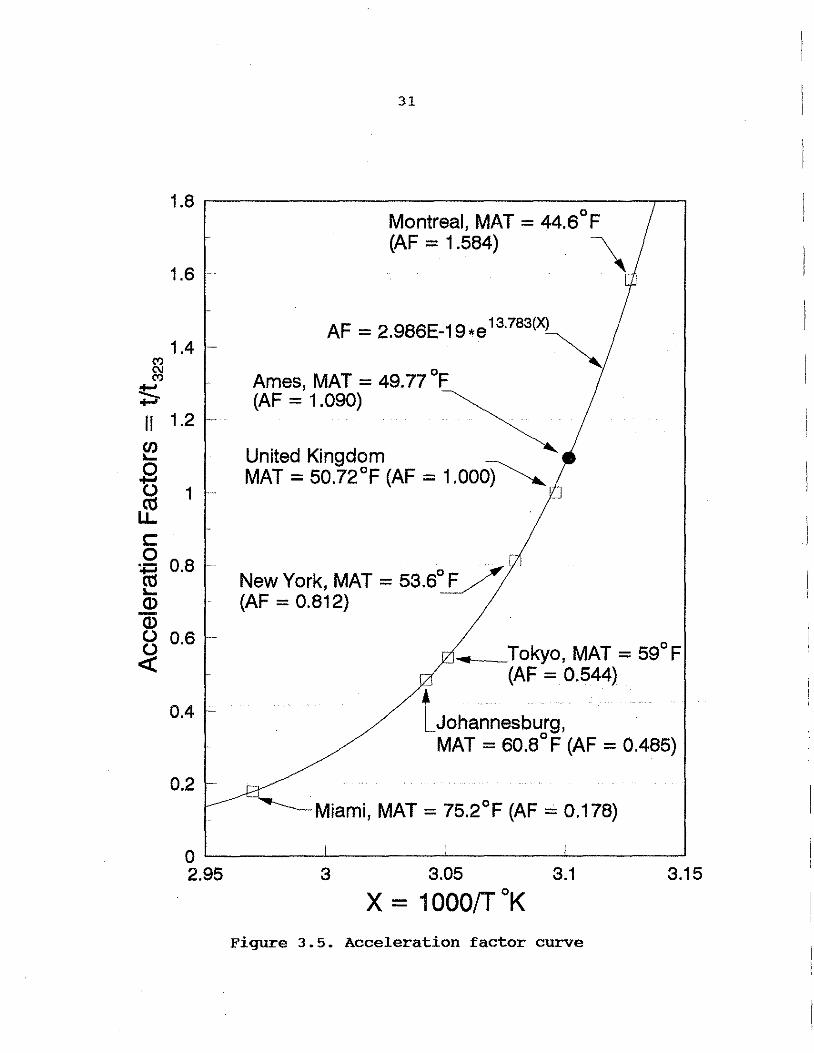
The process of accelerated aging is based on real weather aging in the United Kingdom (UK) environment (MAT= 10.4°C). If the MAT changes, such as in some other environment, the rate of natural aging would change. Since accelerated aging is related to aging in the real environment (UK), accelerated aging must also change in relation to the MAT. With a MAT less than 10.4°C, for the same temperatures given in Table 3.11, the number of days aged per day will increase by some factor and for a MAT greater than 10. 4°C the number of days aged per day will decrease by some factor. In other words, the colder the climate (less than 10.4°C) the more aggressive the affects of accelerated aging, which causes the number of days aged per day to increase by a factor. This factor, called the acceleration factor (AF), has been established as shown by an approximate-exponential curve in Figure 3. 5. Figure 3.5 shows the AF (given for several different climates in Reference 1; United Kingdom, Montreal, New York, Tokyo, Johannesburg, and Miami) versus the inverse of absolute temperature. The equation for the absolute temperature, T°K, that takes into account the change in MAT for different environments, was developed at ISU (based on data from Reference 1) as follows:
1. Use the standard acceleration temperature of 50°C (the aging data from different environments, with 'different MAT's, was based on accelerated aging bath temperatures of 50°C),
2. Add the quantity (MAT - 10.4°C), which accounts for the difference in MAT (a lower MAT decreases the standard acceleration temperature and a higher MAT increases the standard acceleration temperature),
3. Convert it to absolute (°K) by adding 273, 4. Take the inverse of T°K (therefore, a lower MAT will
increase the value of 1/T°K and a higher MAT will decrease the value of 1/T°K).
The inverse of T°K multiplied by 1000 can be conveniently used in Equation 3.3, for X, to determine the AF.
AF= 2 .986E-19e13 · 783x Eqn. 3.3
AF = unitless acceleration factor X 1000/( ( 50°C+(MAT-10. 4°C) )+273] MAT mean annual temperature in °c.
31
1.8 r-------------------,.---,
1.6 -
1.4
~ ~ +-'
11 1.2
~
~ 1
c 0
+:; 0.8 ttS .... Q)
Q) (,) 0.6 -.;£
0.4 -
0.2 -
0 Montreal, MAT= 44.6 F (AF = 1.584) \
AF= 2.986E-19*e 13·793(~
Ames, MAT= 49.77°F (AF= 1.090)
United Kingdom MAT= 50.72°F (AF= 1.000~.
New York, MAT= 53.6':£,/; -(AF= 0.812)
.... Tokyo, MAT= 59°F (AF= 0.544)
lJohannesburg, MAT= 60.8°F (AF= 0.485)
Miami, MAT= 75.2°F (AF= 0.178)
0 ~---~----~----~---~ 2.95 3 3.05 3.1 3.15
X = 1000/T°K
Figure 3.5. Acceleration factor curve
I

32
Using Equation 3.3 the time values given in Table 3.11 can be adjusted for any MAT to develop approximate real weather aging effects on FC materials. The MAT for central Iowa over the past 35 years is given as 9.87°C (49.77°F) [27,28]. Using Equation 3.3 the AF for this climate can be established as 1.09. This AF is then applied to the number of days aged per day in Table 3.11 and a new set of temperature-time data is determined for central Iowa as shown in Table 3.12.
Table 3.12. Adjusted temperature-time data for central Iowa
Temperature of aging solution Number of days aged per oc (oF) (days/day)
50 (122) 1.09(101) = 110·
60 (140) 1.09(272) = 296*
70 (158) 1.09(693) = 755*
80 (176) 1. 09 ( 1672) = 1822*
day
•These time criteria values are based on a MAT of 9.87°C (49.77°F)
The data points given in Tables 3 .11 and 3 .12 are plotted using best fit approximated-exponential curves in Figure 3. 6 (Curves A and Curve B exhibit data from Tables 3 .11 and 3 .12, respectively). These curves help establish temperature-time criteria for aging solution temperatures other than those stated in Tables 3.11 and 3.12. Accelerated aging effects have been studied for elevated temperatures as high as 80°C (176°F) with good correlation of results compared with real weather aging [1]. Use of higher temperatures than 80°C requires extrapolation of data and is not recommended.
The equations developed from the data in Tables 3.11 and 3.12 are given by Equations 3.4 and 3.5, respectively.
where:
Age( days)= 0.18:he(o.osa•Tl day
Age( days) day
T =the temperature of the aging solution (°F).
Eqn. 3.4
Eqn. 3. 5

~ Q.
33
2,000 .-------------------~~ I
1,500
(0.052*T) Ag6(Days/Day) = 0.183 *6 --..___
l (0.052*T) I
Ag6(Days/Day) = 0.200*6 ~/
Curv6B~/
I I
I
I I
~ Cl 1,000 I I
I ......... 0) c ·-0) <(
500 / /
/ /
/ /
I
I I
I
I I
!'L /1
1 Curv6A
0 '-----'---_J_---'---'----'-----'----' 110 120 130 140 150 160 170 180
Temperature (°F) Figure 3.6. Temperature-time criteria curve

34
Equations 3.3 through 3.5 were developed by ISU researchers based upon data given in Reference 1. Equation 3.4 should be used for a MAT of 10.4°C (50.72°F) and Equation 3.5 was used to determine the temperature-time criteria for central Iowa (Ames). The temperature-time curve in Figure 3. 6 (see curve B) relates the temperature (in Fahrenheit) of the aging solution to the number of days aged per day. For example, a specimen in a solution at 130°F will age approximately 171.5 days for every day it remains in the solution (i.e., a specimen left in a solution at 130°F for 10 days will age approximately 1715 days or 4.7 years).
The solutions in all three tanks were maintained at a constant temperature of 140°F. Using Equation 3.6, with T equal to 140°F, the equivalent number of days aged per day was determined as 288.4. The specimens were aged 50 years (as suggested by the IDOT) which is equivalent to 18262.5 days (including 12.5 days for leap year). Therefore, an accelerated aging period of 63.3 days at an elevated temperature of 140°F in the solutions was equivalent to 50 years in the Ames environment.
Upon completion of the accelerated aging tests, the solutions in the tanks were allowed to cool and samples were taken for chemical analysis (see the section 3.7.2 of this report). The tanks were drained and the specimens allowed to dry for one day. The specimens were tested and an observation of both aged and unaged FC rebars and dowels was made under a scanning electron microscope (see the Section 3.7.1 of this report).
35
3.6. Testing Procedure
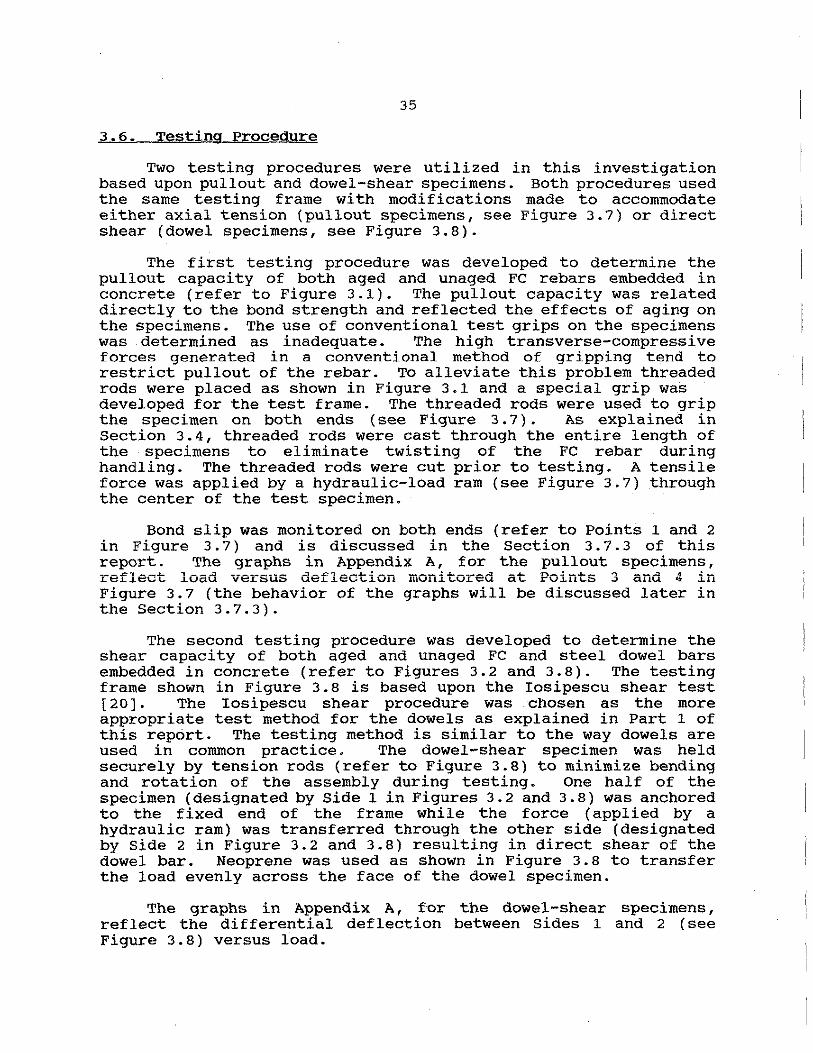
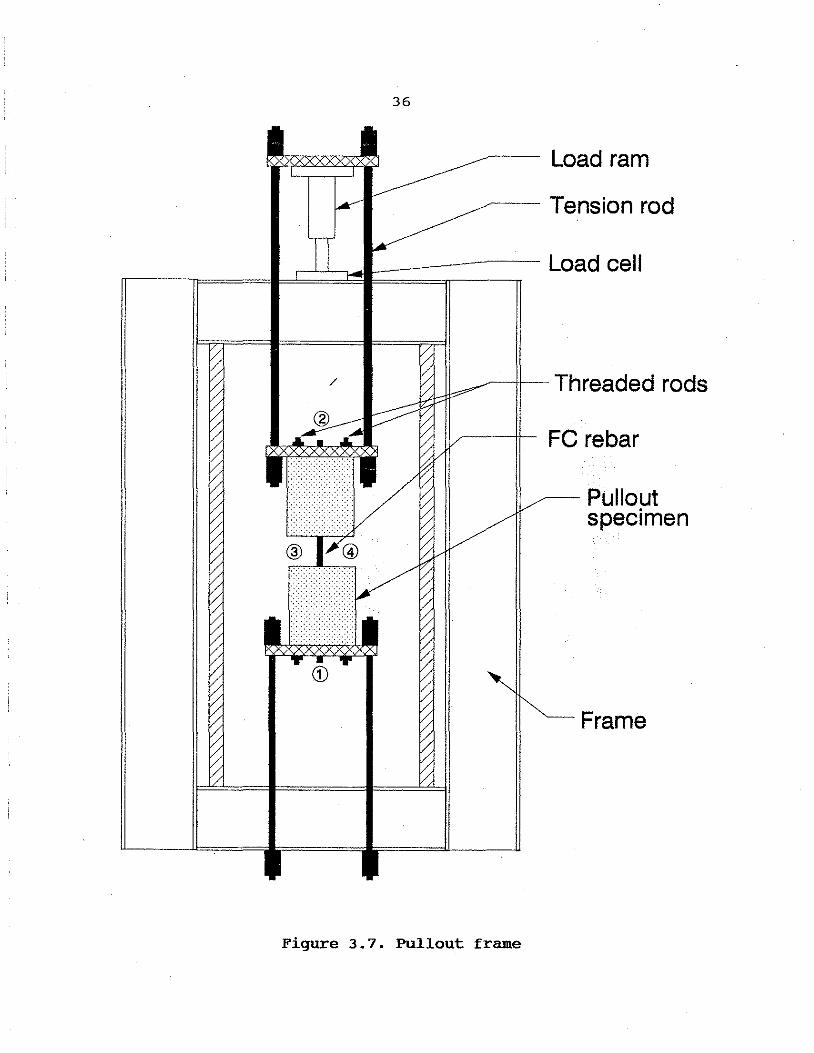
Two testing procedures were utilized in this investigation based upon pullout and dowel-shear specimens. Both procedures used the same testing frame with modifications made to accommodate either axial tension (pullout specimens, see Figure 3.7) or direct shear (dowel specimens, see Figure 3.8).
The first testing procedure was developed to determine the pullout capacity of both aged and unaged FC rebars embedded in concrete (refer to Figure 3.1). The pullout capacity was related directly to the bond strength and reflected the effects of aging on the specimens. The use of conventional test grips on the specimens was determined as inadequate. The high transverse-compressive forces generated in a conventional method of gripping tend to restrict pullout of the rebar. To alleviate this problem threaded rods were placed as shown in Figure 3.1 and a special grip was developed for the test frame. The threaded rods were used to grip the specimen on both ends (see Figure 3. 7) . As explained in Section 3.4, threaded rods were cast through the entire length of the specimens to eliminate twisting of the FC rebar during handling. The threaded rods were cut prior to testing. A tensile force was applied by a hydraulic-load ram (see Figure 3.7) through the center of the test specimen.
Bond slip was monitored on both ends (refer to Points 1 and 2 in Figure 3. 7) and is discussed in the Section 3. 7. 3 of this report. The graphs in Appendix A, for the pullout specimens, reflect load versus deflection monitored at Points 3 and 4 in Figure 3.7 (the behavior of the graphs will be discussed later in the Section 3.7.3).
The second testing procedure was developed to determine the shear capacity of both aged and unaged FC and steel dowel bars embedded in concrete (refer to Figures 3.2 and 3.8). The testing frame shown in Figure 3.8 is based upon the Iosipescu shear test [20]. The Iosipescu shear procedure was chosen as the more appropriate test method for the dowels as explained in Part 1 of this report. The testing method is similar to the way dowels are used in common practice. The dowel-shear specimen was held securely by tension rods (refer to Figure 3.8) to minimize bending and rotation of the assembly during testing. One half of the specimen (designated by Side 1 in Figures 3.2 and 3.8) was anchored to the fixed end of the frame while the force (applied by a hydraulic ram) was transferred through the other side (designated by Side 2 in Figure 3.2 and 3.8) resulting in direct shear of the dowel bar. Neoprene was used as shown in Figure 3.8 to transfer the load evenly across the face of the dowel specimen.
The graphs in Appendix A, for the dowel-shear specimens, reflect the differential deflection between Sides 1 and 2 (see Figure 3.8) versus load.
36
------- Load ram
------ Tension rod
rr---=== =1;;;;;;;:;;;;~ ~;;;::;;;:===:-- Load cell
-----H-- Threaded rods
~-- FC rebar
Figure 3.7. Pullout frame
,,,-- Pullout specimen
Frame

37
Guides
11'-----ll---Dowel-shear specimen
Figure 3.8. Dowel-shear frame
Tension rod
Rails
38
3.7. Results
A description of the specimen identification system used for each test series is depicted in Figure 3.9. This identification system indicates the supplier, specimen type, specimen designation, and aging solution.
1!
L Aging solution: (U=Unaged, W=Water, L=Lime,S=Salt)
'--~~~~~~~~~~-:Specimen designation: (P=Pullout, D=Dowel)
Specimen type: '--~~~~~~~~~~~~~~~-(FC=Fiber composite,
S=Steel)
'--~~~~~~~~~~~~~~~~~~~~~.suppliers's
identification: (O=None used, A,B,C)
Figure 3.9. Specimen identification system
3.7.1. FC specimens under scanning electron microscope
Samples of FC rebars and dowels taken from all three aging tanks were observed under a scanning electron microscope (SEM). The concrete was split to expose the FC rebar that was in contact with the concrete. FC rebars failing in both tension and bond were examined for any etching of the glass fibers or deposition of hydration product between the glass fibers. Also a surface analysis was made to determine any degradation of the vinyl ester resin coating.
Specimens that were not tested and not aged (not exposed to concrete) were used as reference. The outer surface of an unaged and untested FC rebar from Supplier B is shown parallel to the glass strands and magnified 500 times in Figure 3.10. The outer surface of an unaged and untested FC rebar from Supplier c is shown parallel to long direction of the rebar and magnified 100 times in Figure 3.11. A difference in glass fiber orientation between the two FC rebars is depicted in Figures 3.10 and 3.11.
Figure 3.12 shows the magnified surface (100 times) of a sample length of rebar taken from C-FC-P-L specimen that exhibited a bond failure with slight fraying of the rebar. Figure 3.12
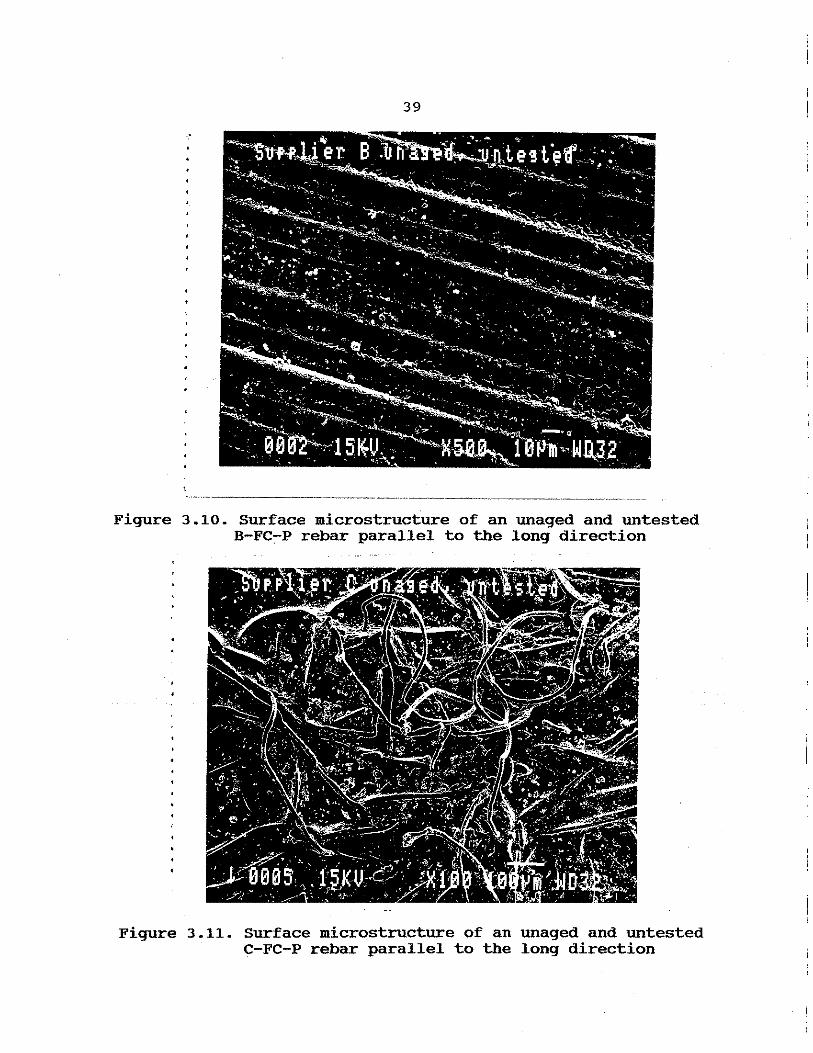
39
----- ·-----···----······-----
Figure 3.10. Surface microstructure of an unaged and untested B-FC~P rebar parallel to the long direction
Figure 3.11. Surface microstructure of an unaged and untested C-FC-P rebar parallel to the long direction
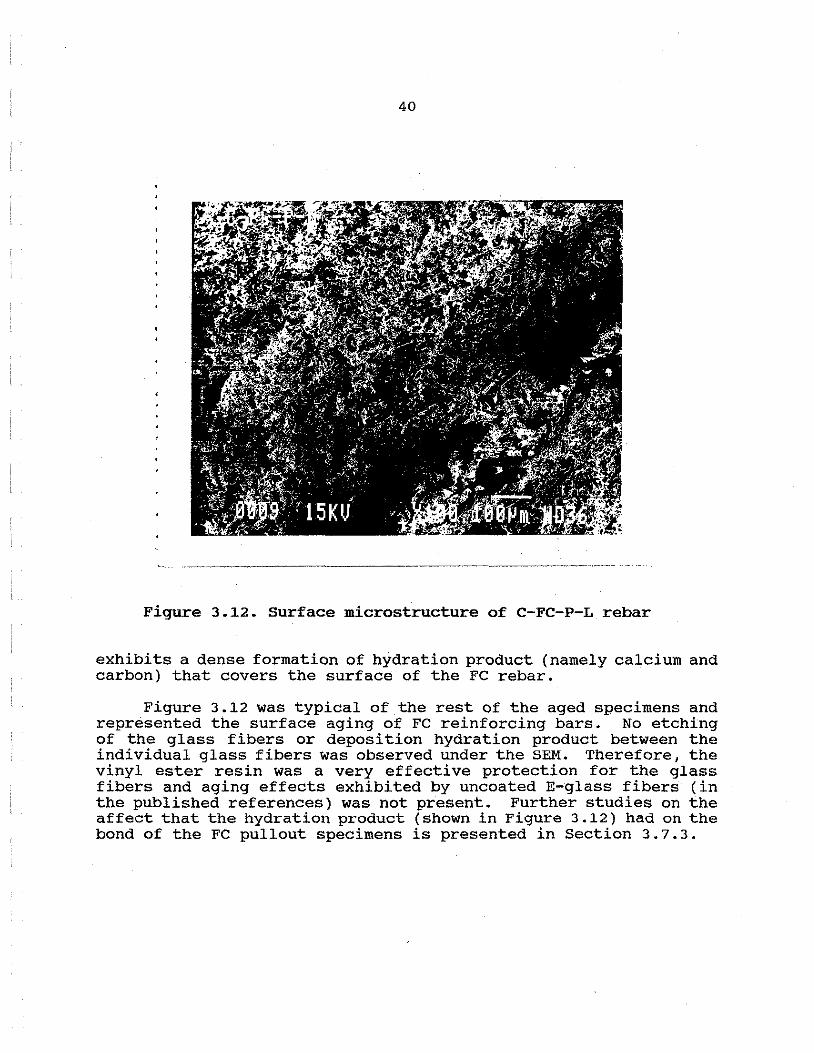
40
···---·-··---
Figure 3.12. Surface microstructure of C-FC-P-L rebar
exhibits a dense formation of hydration product (namely calcium and carbon) that covers the surface of the FC rebar.
Figure 3.12 was typical of the rest of the aged specimens and represented the surface aging of FC reinforcing bars. No etching of the glass fibers or deposition hydration product between the individual glass fibers was observed under the SEM. Therefore, the vinyl ester resin was a very effective protection for the glass fibers and aging effects exhibited by uncoated E-glass fibers (in the published references) was not present. Further studies on the affect that the hydration product (shown in Figure 3.12) had on the bond of the FC pullout specimens is presented in Section 3.7.3.
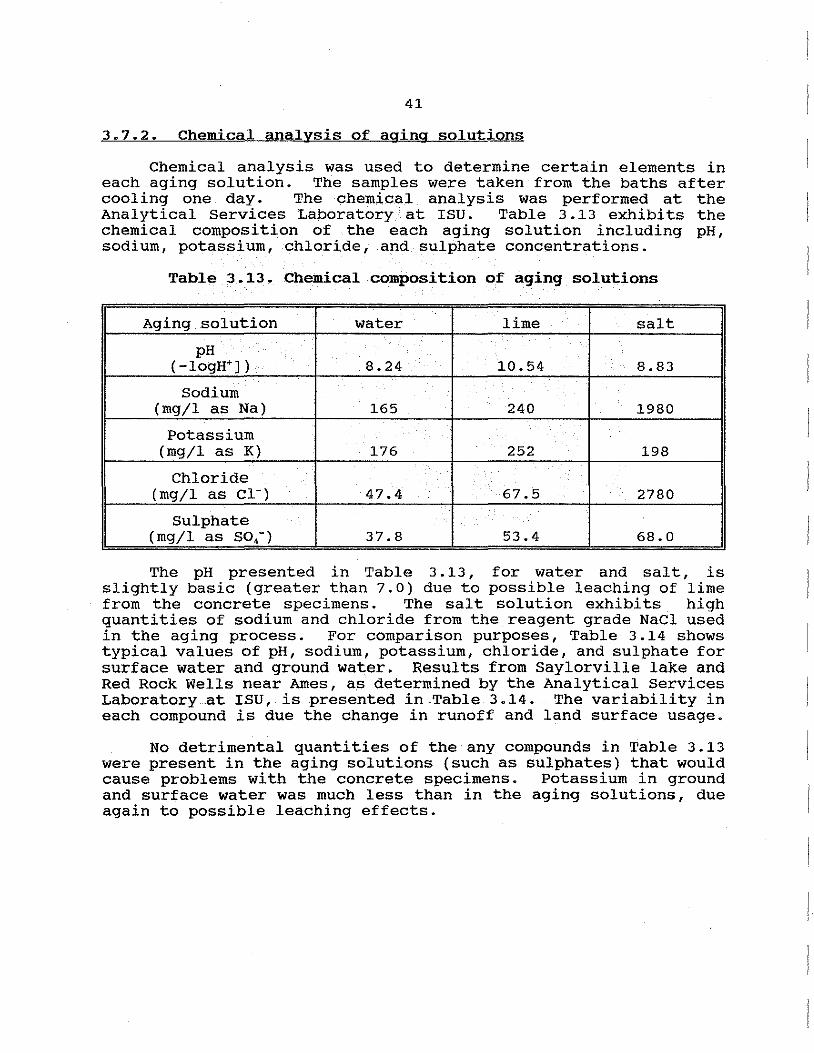
41
3.7.2. Chemical analysis of aging solutions
Chemical analysis was used to determine certain elements in each aging solution. The samples were taken from the baths after cooling one day. The chemical analysis was performed at the Analytical Services Laboratory at ISU. Table 3.13 exhibits the chemical composition of the each aging solution including pH, sodium, potassium, chloride, and sulphate concentrations.
Table 3.13. Chemical composition of aging solutions . .
Aging .solution water lime salt
pH (-logH•]) 8.24 10.54 8.83
Sodium (mg/l as Na) 165 240 1980
Potassium (mg/l as K) 176 252 198
Chloride (mg/l as c1-) 47.4 67.5 2780
Sulphate (mg/l as so.-) 37.8 53.4 68.0
The pH presented in Table 3 .13, for water and salt, is slightly basic (greater than 7.0) due to possible leaching of lime from the concrete specimens. The salt solution exhibits high quantities of sodium and chloride from the reagent grade NaCl used in the aging process. For comparison purposes, Table 3.14 shows typical values of pH, sodium, potassium, chloride, and sulphate for surface water and ground water. Results from Saylorville lake and Red Rock Wells near Ames, as determined by the Analytical Services Laboratory at ISU, is presented in Table 3.14. The variability in each compound is due the change in runoff and land surface usage.
No detrimental quantities of the any compounds in Table 3.13 were present in the aging solutions (such as sulphates) that would cause problems with the concrete specimens. Potassium in ground and surface water was much less than in the aging solutions, due again to possible leaching effects.
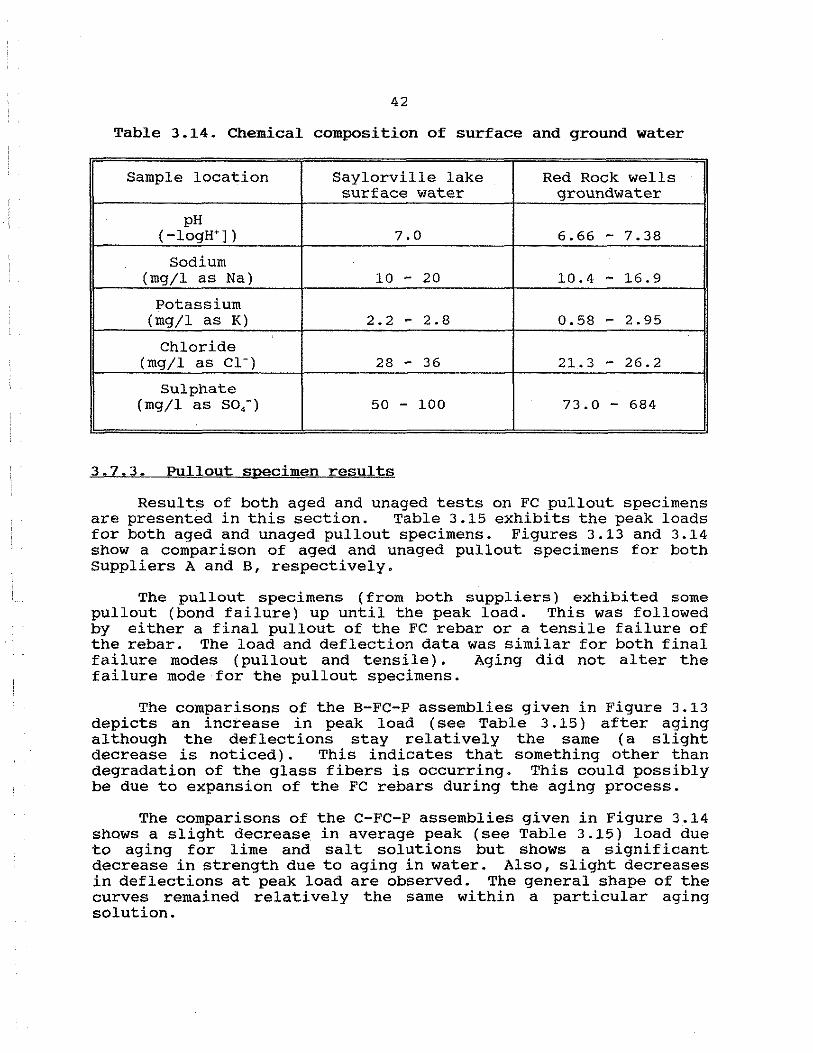
42
Table 3.14. Chemical composition of surface and ground water
Sample location Saylorville lake Red Rock wells surf ace water groundwater
pH (-logW]) 7.0 6.66 - 7.38
Sodium (mg/l as Na) 10 - 20 10.4 - 16.9
Potassium (mg/l as K) 2.2 - 2.8 0.58 - 2.95
Chloride (mg/l as c1-) 28 - 36 21.3 - 26.2
Sulphate (mg/l as SO,") 50 - 100 73.0 - 684
3.7.3. Pullout specimen results
Results of both aged and unaged tests on FC pullout specimens are presented in this section. Table 3 .15 exhibits the peak loads for both aged and unaged pullout specimens. Figures 3.13 and 3.14 show a comparison of aged and unaged pullout specimens for both Suppliers A and B, respectively.
The pullout specimens (from both suppliers) exhibited some pullout (bond failure) up until the peak load. This was followed by either a final pullout of the FC rebar or a tensile failure of the rebar. The load and deflection data was similar for both final failure modes (pullout and tensile). Aging did not alter the failure mode for the pullout specimens.
The comparisons of the B-FC-P assemblies given in Figure 3.13 depicts an increase in peak load (see Table 3 .15) after aging although the deflections stay relatively the same (a slight decrease is noticed). This indicates that something other than degradation of the glass fibers is occurring. This could possibly be due to expansion of the FC rebars during the aging process.
The comparisons of the C-FC-P assemblies given in Figure 3.14 shows a slight decrease. in average peak (see Table 3 .15) load due to aging for lime and salt solutions but shows a significant decrease in strength due to aging in water. Also, slight decreases in deflections at peak load are observed. The general shape of the curves remained relatively the same within a particular aging solution.
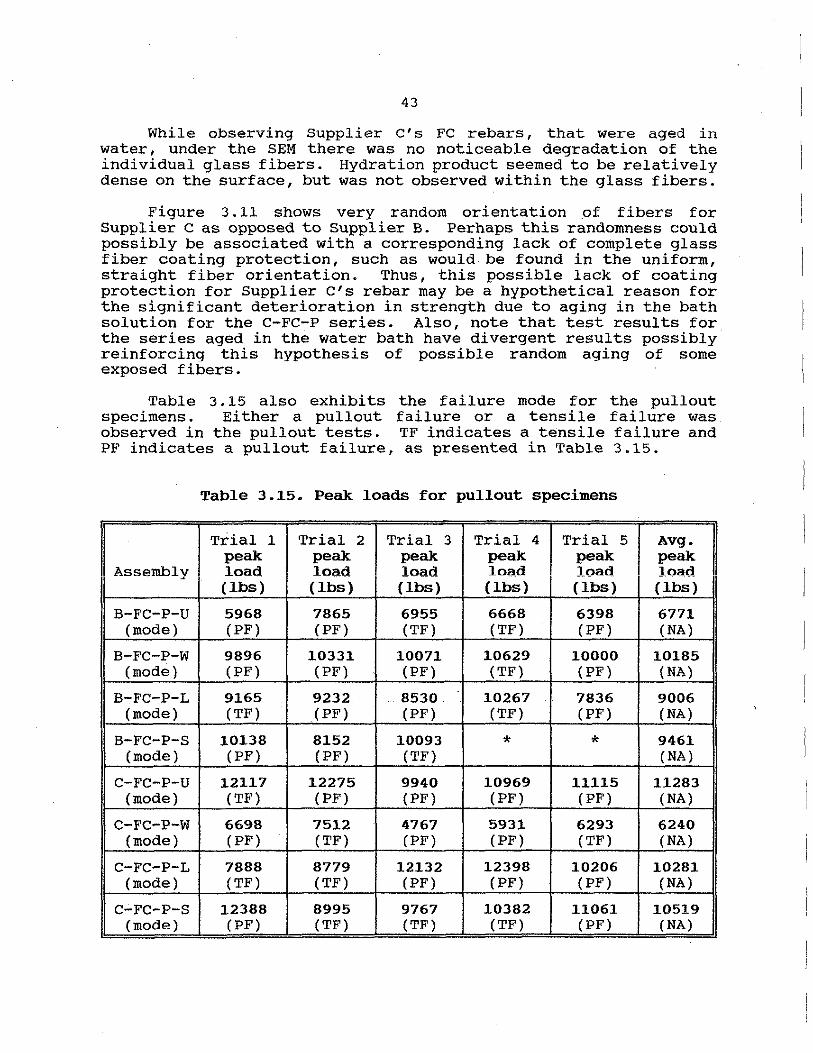
43
While observing Supplier C's FC rebars, that were aged in water, under the SEM there was no noticeable degradation of the individual glass fibers. Hydration product seemed to be relatively dense on the surface, but was not observed within the glass fibers.
Figure 3 .11 shows very random orientation of fibers for Supplier c as opposed to Supplier B. Perhaps this randomness could possibly be associated with a corresponding lack of complete glass fiber coating protection, such as would be found in the uniform, straight fiber orientation. Thus, this possible lack of coating protection for Supplier C's rebar may be a hypothetical reason for the significant deterioration in strength due to aging in the bath solution for the C-FC-P series. Also, note that test results for the series aged in the water bath have divergent results possibly reinforcing this hypothesis of possible random aging of some exposed fibers.
Table 3. 15 also exhibits the failure mode for the pullout specimens. Either a pullout failure or a tensile failure was observed in the pullout tests. TF indicates a tensile failure and PF indicates a pullout failure, as presented in Table 3.15.
Table 3.15. Peak loads for pullout specimens
Trial 1 Trial 2 Trial 3 Trial 4 Trial 5 Avg. peak peak peak peak peak peak
Assembly load load load load load load (lbs) (lbs) (lbs) (lbs) (lbs) (lbs)
B-FC-P-U 5968 7865 6955 6668 6398 6771 (mode) (PF) (PF) (TF) (TF) (PF) (NA)
B-FC-P-W 9896 10331 10071 10629 10000 10185 (mode) (PF) (PF) (PF) (TF) (PF) (NA)
B-FC-P-L 9165 9232 8530 10267 7836 9006 (mode) (TF) (PF) (PF) (TF) (PF) (NA)
B-FC-P-S 10138 8152 10093 * * 9461 (mode) (PF) (PF) (TF) (NA)
C-FC-P-U 12117 12275 9940 10969 11115 11283 (mode) (TF) (PF) (PF) (PF) (PF) (NA)
C-FC-P-W 6698 7512 4767 5931 6293 6240 (mode) (PF) (TF) (PF) (PF) (TF) (NA)
C-FC-P-L 7888 8779 12132 12398 10206 10281 (mode) (TF) (TF) (PF) (PF) (PF) (NA)
C-FC-P-S 12388 8995 9767 10382 11061 10519 (mode) (PF) (TF) (TF) (TF) (PF) (NA)
.
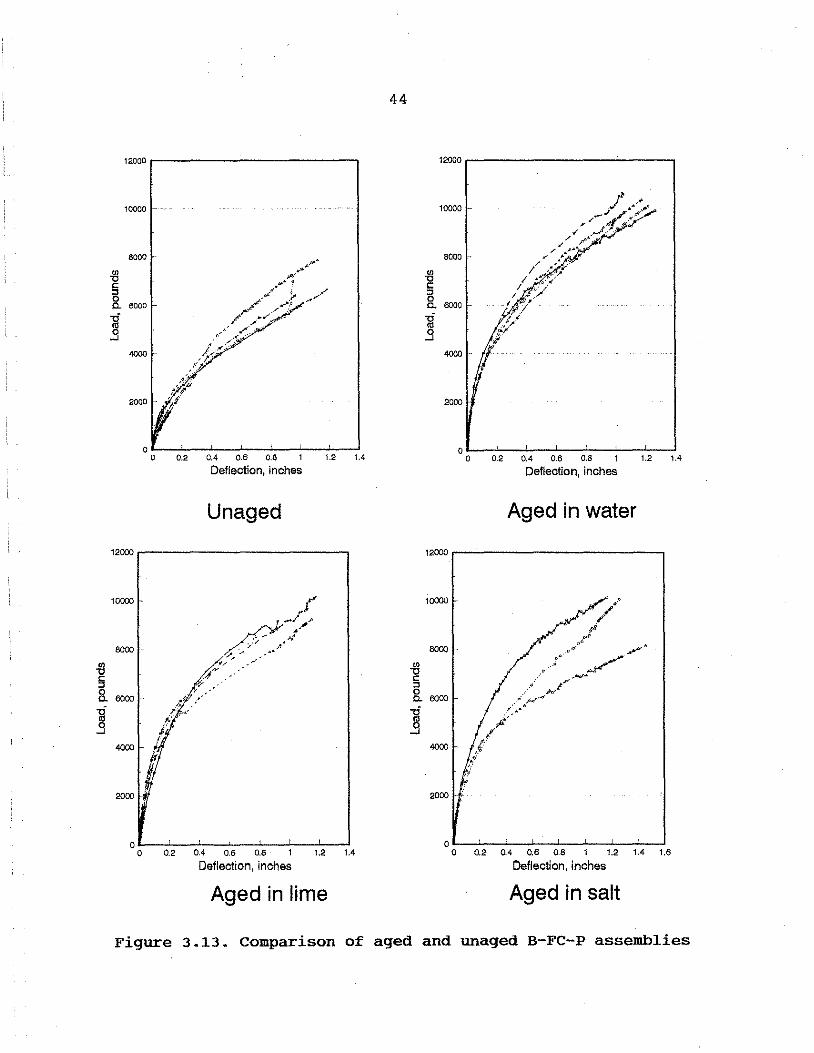
"' "C c :J 0 "--g .9
12000 .----------------,
10000
8000 -
fl c :i g_ 6000 -.:;
"' .9 4000
2{)00
oL---'---'---'--.....J--'---'---' o 0.2 0.4 0.6 0.8 1
Deflection, inches
Unaged
1.2 1.4
12000 ~--------------~
10000
8000 -
6000
4000
2000
0.2 0.4 0.6 0.8 1
Deflection, inches 1.2 1.4
Aged in lime
44
12000 ..-----------"""----~
10000
8000
fl c :J 0 "- 6000 -g .9
4000 -
2000
oL-~'----''----'~-'~-'~.....J.~-' 0 0.2 0.4 0.6 0.8 1 1.2 1.4
Deflection, inches
Aged in water
12000 ..---------------~
10000
8000 -
"' "C c :J 0 "- 6000
af ..9
4000
2000
0'--'---'---'---''---'---''---.l---' o 0.2 o.4 a.a a.a 1 1.2 1.4 t6
Deflection, inches
Aged in salt
Figure 3.13. Comparison of aged and unaged B-FC-P assemblies

14-000 ~-------------
12000
10000
~ 8000
g_ -g .9
6000
4000
2000 .
. ~· ' ,.,
'·
•. ,.._,.~·
,.,.,.·· ~·'"" "'·n~"~
ol----'---'---_,_ __ ...._ _ _J 0 0.2 0.4 0.6 0,6
Deflection, inches
Unaged
14000,--------------~
12000 -
10000 -
~ 8000 L
g_
1i 5000
.9
4000 L
2000
. ' 0 o '----'-0.2---0'-.. --o-'-.• --..Jo.-e-_.J
Deflection, inches
Aged in lime
45
12000 -
10000 -
oL---'----'----'-----'--~ 0 0.2 0.4 0.6 0.8
Deflection, Inches
Aged in water
1~00.-------------~
12000
10000
t 6000
l 6000
4000
t 2000 ~
.Y o&.. _ __, __ _,_ __ _,_ __ ....__....J 0 0.2 0.4 0.6 0.8
Deflection, inches
Aged in salt
Figure 3.14. Comparison of aged and unaged C-FC-P assemblies
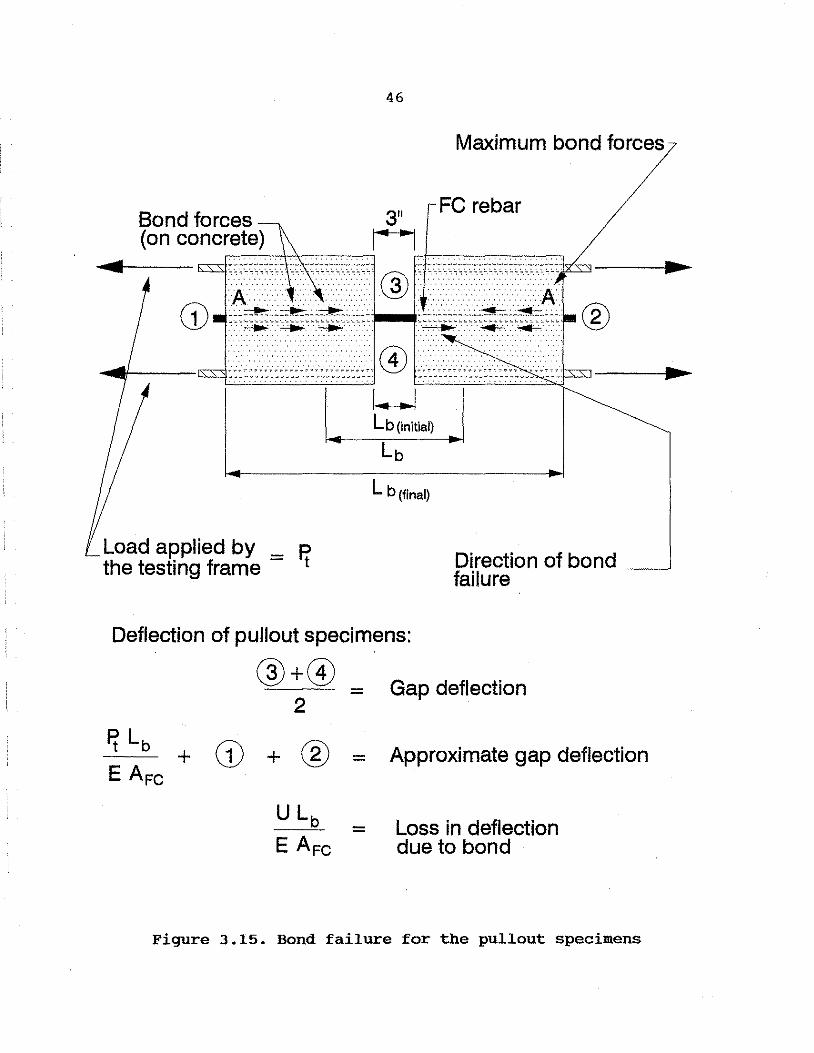
Bond forces (on concrete)
46
3" Ii
Maximum bond forces
FC rebar
eeeeeeceeeeeeeeCHCC•ceee······ @ ....................... ,. .. ·•· : .. :.: ---- -- ---------- ---- --- -- --- -- -- -- ---- ------------- ---
Load applied by _ ~ the testing frame -
u Lb (initial)
Lb (final)
Direction of bond _ _, failure
Deflection of pullout specimens:
@+@ 2
+ Ci> + ® -
Gap deflection
Approximate gap deflection
Loss in deflection due to bond
Figure 3.15. Bond failure for the pullout specimens
47
A pullout specimen is shown in Figure 3.15. The load versus deflection data given in Appendix A for the pullout specimens (as explained previously in Section 3.6) is a result of load applied to the pullout specimen, and an average deflection at the gap (Points 3 and 4 in Figures 3.7 and 3.15). The bond slip was monitored at the ends of the pullout specimens (Points 1 and 2 in Figures 3.7 and 3.15).
The deflection at the gap is the sum of bond slip (at Points 1 and 2 in Figure 3.15) and tensile elongation of the FC reinforcing bar. The theoretical relationship for the tensile elongation of the reinforcing bars is given by Equation 3.6.
Eqn. 3.6
where:
o tensile elongation (deflection) of the FC rebar (in.) Pt load applied to the FC specimen (lbs) Lb length of the rebar not bonded to the concrete that is
under tension (in.) E = tensile modulus of elasticity for the FC rebar found in
Table 3.3 (psi) A,c = Area of the FC rebar found in Table 3. 3 ( in2
)
The value of Lb (see Figure 3 .15) increases throughout the test as the load Pt is increased. Length, Lb is initially equal for both suppliers Band C rebars (3-inch gap length). As the load increases, bond continues to fail from the gap (center of the specimen) outward (see Figure 3.15). The bond did not fail at equal rates on both sides of the specimen. Therefore, the actual value was not known during the test. The length, Lb (length of rebar in tension), could be initially approximated as three inches (the gap dimension in Figure 3.15). As the bond failure progressed, the value of Lb increased on both sides of the specimen (certain specimens exhibited bond failure on only one side). When end slip was noticed at one end of the specimen (the bond had failed over the entire length of the specimen side) the length (Lb) could be approximated as 13 inches for Supplier B and 10 inches for supplier c. Finally, when end slip was noticed on both sides of the specimen the length could be approximated as 23 inches for Supplier B and 17 inches for Supplier C.
When endslip is noticed on one side of the specimen, the value of Lb assumes that the surf ace of the rebar is completely free from bonding to the concrete except for all but a small portion shown at Point A in Figure 3.15. Therefore, the value of Lb (the length of the rebar in tension) can be taken as the gap length plus the
48
length of one side of the pullout specimen. noticed on both sides of the specimen, Lb can the gap length plus the length of rebar on pullout specimen.
When endslip is be approximated as both sides of the
Using these values of Lb in Equation 3.6, a deflection due to tensile forces could be determined. This added to the deflection at Points 1 and 2 gave an approximated total deflection at the gap. The approximated deflection versus load is plotted with the actual deflection versus load in Figures 3.16 and 3.17. These are typical curves for unaged pullout specimens, both suppliers B and c. The approximated curve (Curve B, in Figures 3.16 and 3.17) exhibits good correlation to the actual curve (Curve A, in Figures 3.16 and 3.17). Typical curves for pullout specimens aged in water, lime, and salt are shown in Appendix A (Figures A23 through A28).
There is only slight variation in Figure 3 .16 between the approximated deflection and actual deflection for the B-FC-P-U assembly (measured at the gap). The trend for the aged B-FC-P specimens in Appendix A (Figures A23 through A25) is for the approximated load-deflection values to exceed the actual loaddeflection values. The authors feel that this is due to increased mechanical anchorage (where Lb is not equal to the entire rebar length in tension) • The increased mechanical anchorage may account for the increased deflections at peak load in Figure 3.13 (due to aging) and may be caused by the dense formation of hydration product on the surface of rebar as shown in Figure 3 .12. The surface texture is relatively smooth for unaged rebars from Supplier B, but the formation cf hydration product created a rough surface, therefore, increasing the bond.
The opposite affect is exhibited by the C-FC-P assemblies. A slight decrease in peak load and deflections at peak load due to aging (as shown in Figure 3.14) for the salt and lime bathes can be observed and a corresponding significant decrease in load is shown for the water bath. As shown in Figure 3 .17 and Appendix A (Figures A26 through A28), the trend is towards a slight decrease in mechanical anchorage due to aging effects (curves move closer together). The surface texture (see Figure 3.11) is relatively rough for an unaged specimen but the possible aging in the water for random orientation of fibers near the surface as discussed in Section 3.7.3, may have completely offset any potential surface roughness benefits.
The value of the average bond strength is given by U in Equation 3 • 7. The average bond strength can be determined by integrating the bond stresses over the length of the rebar in concrete. Equation 3.7 in Figure 3.15 could be used to obtain an approximation of the loss in deflection due to bond forces.
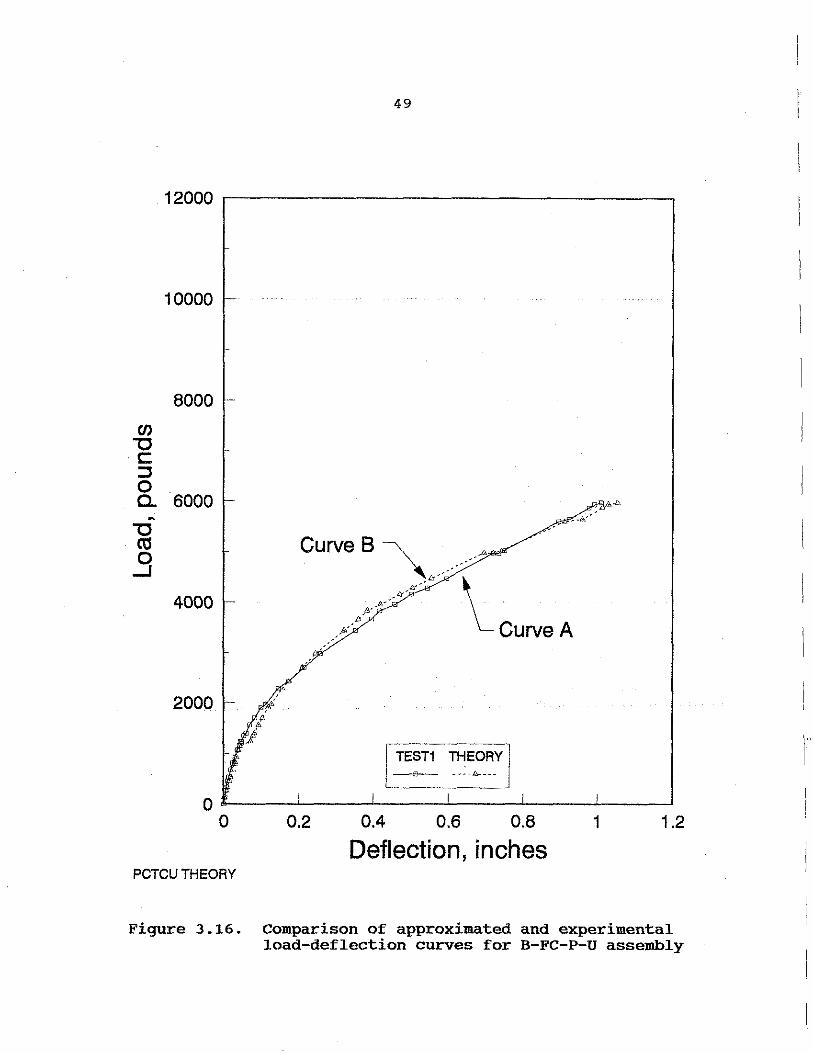
49
10000
8000 -
en '"C c: ::I 0 a. 6000 -'"C ctS
.9 4000 -
,'
2000 :
TEST1 ~~E~Rj
a li-~~-'-~~--''--~~...J-~~_,_~~~.l---~~-' 0 0.2 0.4 0.6 0.8 1 1.2
Deflection, inches PCTCU THEORY
Figure 3.16. Comparison of approximated and experimental load-deflection curves for B-FC-P-U assembly
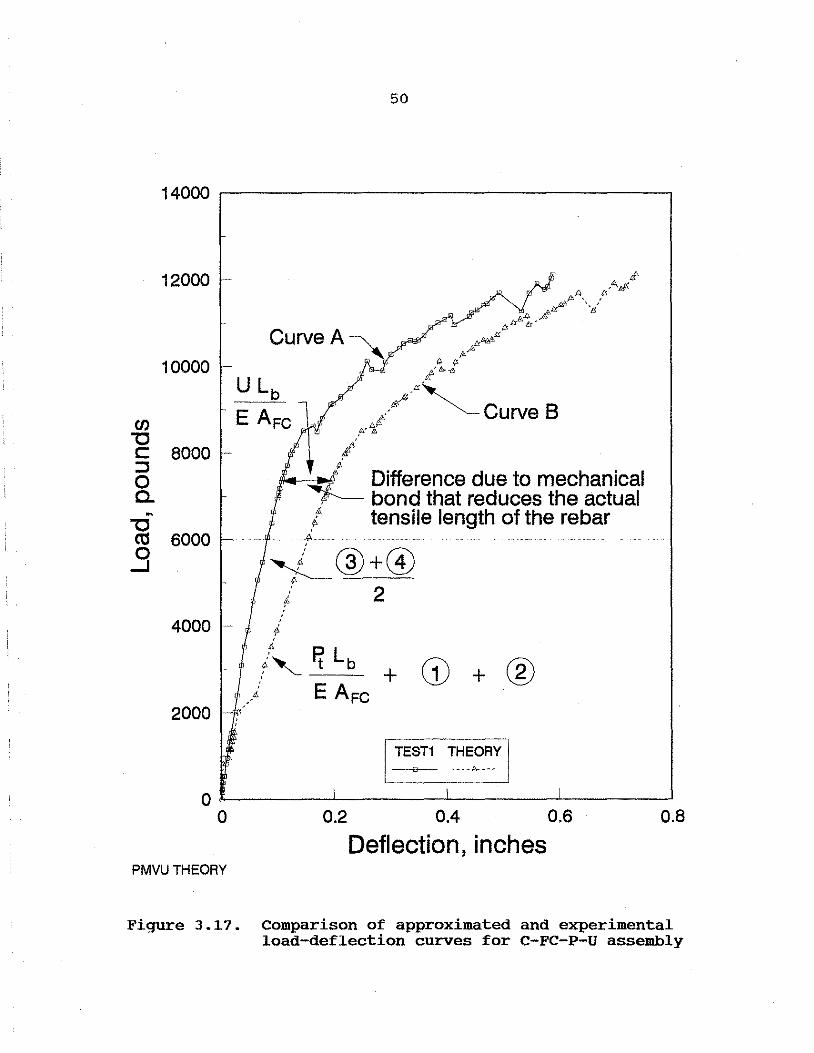
CJ)
"C c:: :J 0 a.
12000
10000 -
6000
50
Curve A
Difference due to mechanical ""---- bond that reduces the actual
l tensile length of the rebar ¢,
~@+@ ~
i 2 4000 - ~
,/, FT Lb + CD + ® ' __ ;: E AFC
2000 ,·
0 ,._~~~~~~~~~~~~~~~~~~~~ 0 0.2 0.4 0.6 0.8
Deflection, inches PMVUTHEORY
Figure J.17. Comparison of approximated and experimental load-deflection curves for C-FC-P-U assembly

51
Eqn. 3.7
where:
00 loss in deflection due to bond forces (in.) U = average bond strength (lbs)
In Figure 3.17, the "Curve A" is found by Equation 3.8:
DEFL3 + DEFL4 2
Eqn. 3. 8
where:
DEFL3 DEFL4
=deflection at Point 3 in Figure 3.15 (in.) =deflection at Point 4 in Figure 3.15 (in.)
whereas, the "Curve B" is found by Equation 3.9:
where:
DEFLl DEFL2
+ DEFL2 Eqn ..
=deflection at Point 1 in Figure 3.15 (in.) =deflection at Point 2 in Figure 3.15 (in.)
3.9
The difference in these values reflect the contribution by Equation 3.7. Therefore, the total approximated deflection at the gap can therefore be given by Equation 3.10.
DEFL3 + DEFL4 2
ULb
EA Fe + DEFLl + DEFL2 Eqn. 3 .10
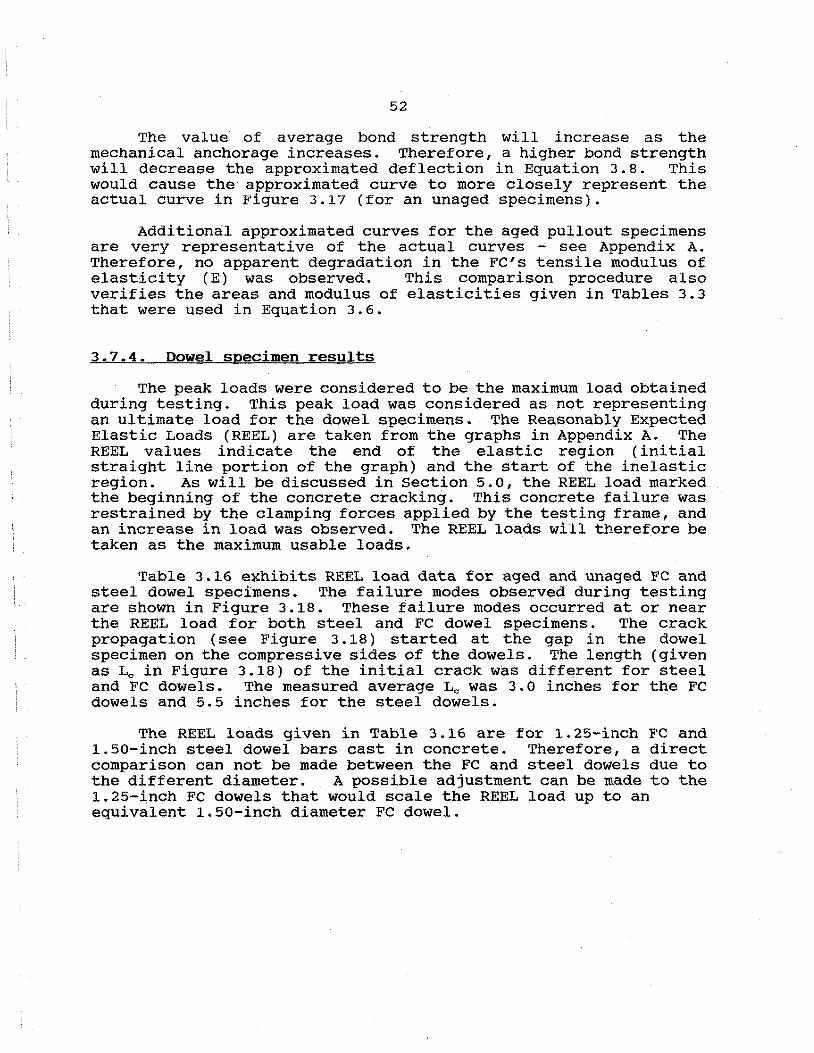
52
The value of average bond strength will increase as the mechanical anchorage increases. Therefore, a higher bond strength will decrease the approximated deflection in Equation 3.8. This would cause the approximated curve to more closely represent the actual curve in Figure 3.17 (for an unaged specimens).
Additional approximated curves for the aged pullout specimens are very representative of the actual curves - see Appendix A. Therefore, no apparent degradation in the FC's tensile modulus of elasticity (E) was observed. This comparison procedure also verifies the areas and modulus of elasticities given in Tables 3.3 that were used in Equation 3.6.
3.7.4. Dowel specimen results
The peak loads were considered to be the maximum load obtained during testing. This peak load was considered as not representing an ultimate load for the dowel specimens. The Reasonably Expected Elastic Loads (REEL) are taken from the graphs in Appendix A. The REEL values indicate the end of the elastic region (initial straight line portion of the graph) and the start of the inelastic region. As will be discussed in Section 5. O, the REEL load marked the beginning of the concrete cracking. This concrete failure was restrained by the clamping forces applied by the testing frame, and an increase in load was observed. The REEL loads will theref.ore be taken as the maximum usable loads.
Table 3.16 exhibits REEL load data for aged and unaged FC and steel dowel specimens. The failure modes observed during testing are shown in Figure 3.18. These failure modes occurred at or near the REEL load for both steel and FC dowel specimens. The crack propagation (see Figure 3 .18) started at the gap in the dowel specimen on the compressive sides of the dowels. The length (given as Le in Figure 3.18) of the initial crack was different for steel and FC dowels. The measured average Le was 3.0 inches for the FC dowels and 5.5 inches for the steel dowels.
The REEL loads given in Table 3.16 are for 1.25-inch FC and 1.50-inch steel dowel bars cast in concrete. Therefore, a direct comparison can not be made between the FC and steel dowels due to the different diameter. A possible adjustment can be made to the 1.25-inch FC dowels that would scale the REEL load up to an equivalent 1.50-inch diameter FC dowel.
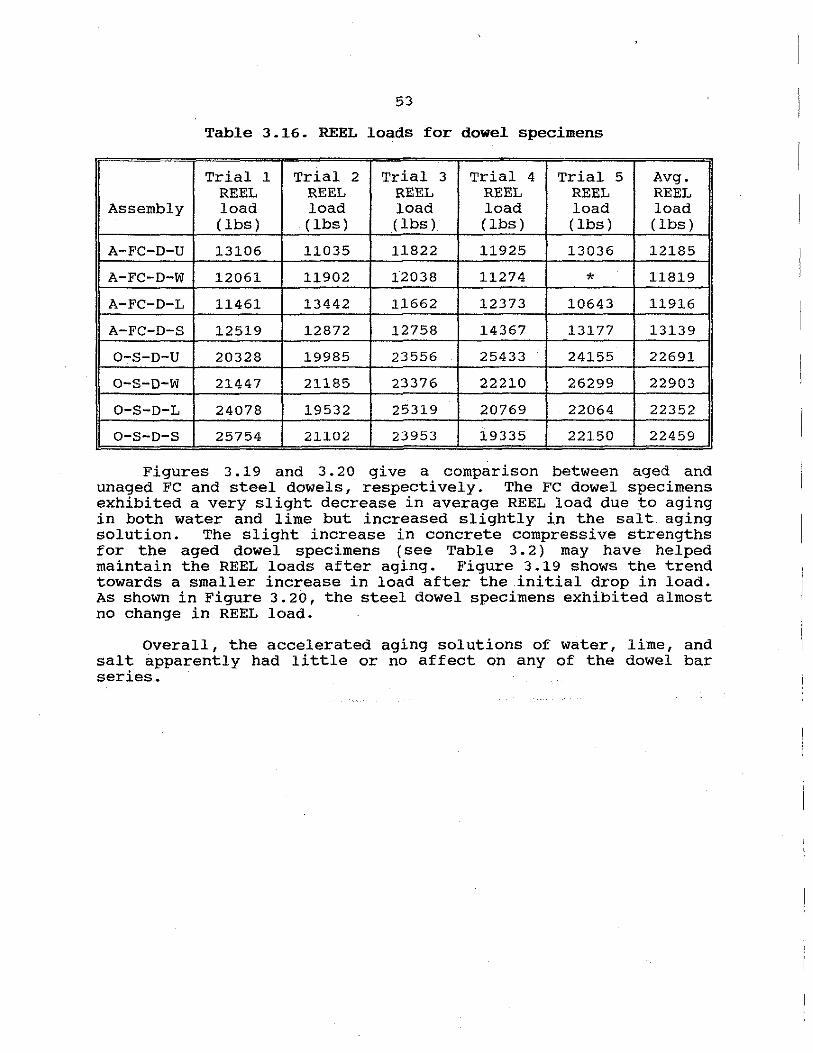
53
Table 3.16. REEL loads for dowel specimens
Trial 1 Trial 2 Trial 3 Trial 4 Trial 5 Avg. REEL REEL REEL REEL REEL REEL
Assembly load load load load load load (lbs) (lbs) (lbs) (lbs) (lbs) (lbs)
A-FC-D-U 13106 11035 11822 11925 13036 12185
A-FC-D-W 12061 11902 12038 11274 * 11819
A-FC-D-L 11461 13442 11662 12373 10643 11916
A-FC-D-S 12519 12872 12758 14367 13177 13139
0-S-D-U 20328 19985 23556 25433 24155 22691
0-S-D-W 21447 21185 23376 22210 26299 22903
0-S-D-L 24078 19532 25319 20769 22064 22352
0-S-D-S 25754 21102 23953 19335 22150 22459 =
Figures 3 .19 and 3. 20 give a comparison between aged and unaged FC and steel dowels, respectively. The FC dowel specimens exhibited a very slight decrease in average REEL load due to aging in both water and lime but increased slightly in the salt aging solution. The slight increase in concrete compressive strengths for the aged dowel specimens (see Table 3. 2) may have helped maintain the REEL loads after aging. Figure 3.19 shows the trend towards a smaller increase in load after the .initial drop in load. As shown in Figure 3.20, the steel dowel specimens exhibited almost no change in REEL load.
overall, the accelerated aging solutions of water, lime, and salt apparently had little or no affect on any of the dowel bar series.
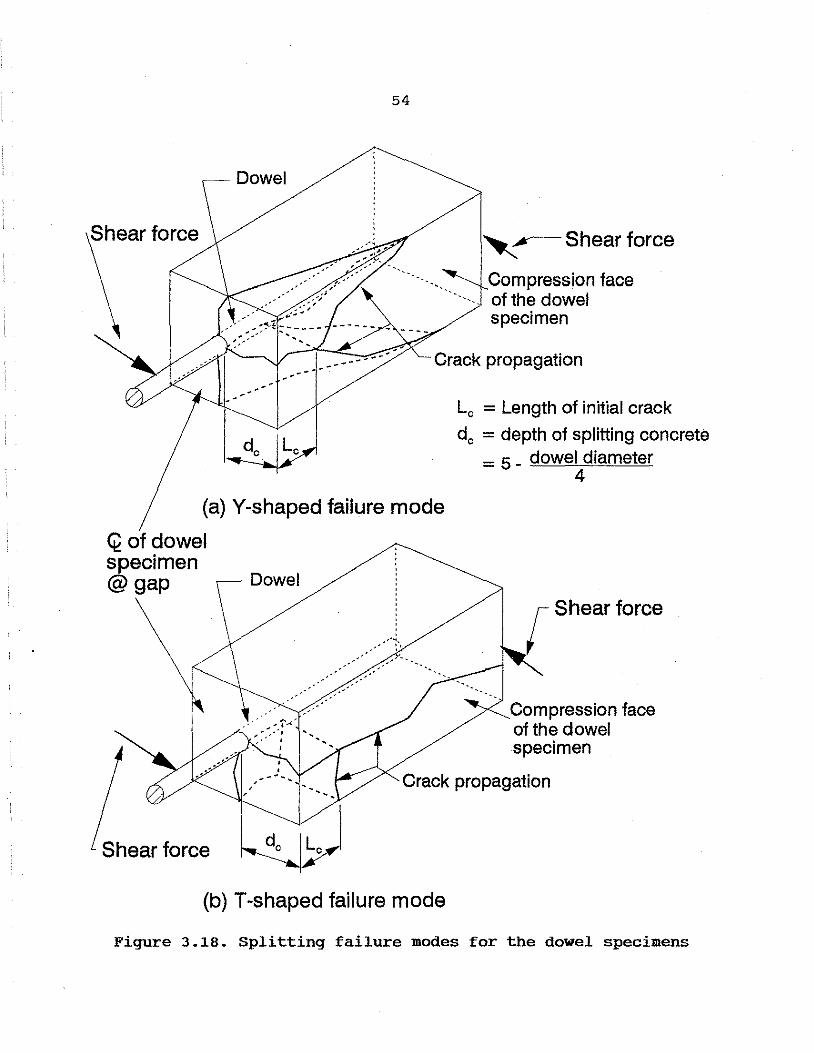
54
Dowel
Shear force ~Shear force
Compression face ------ of the dowel
specimen
Crack propagation
(a) Y-shaped failure mode
Q of dowel specimen @gap
Le = Length of initial crack
de = depth of splitting concrete = 5 _ dowel diameter
4
r Shear force
Compression face of the dowel specimen
Crack propagation
Shear force
(b) T-shaped failure mode
Figure 3.18. Splitting failure modes for the dowel specimens
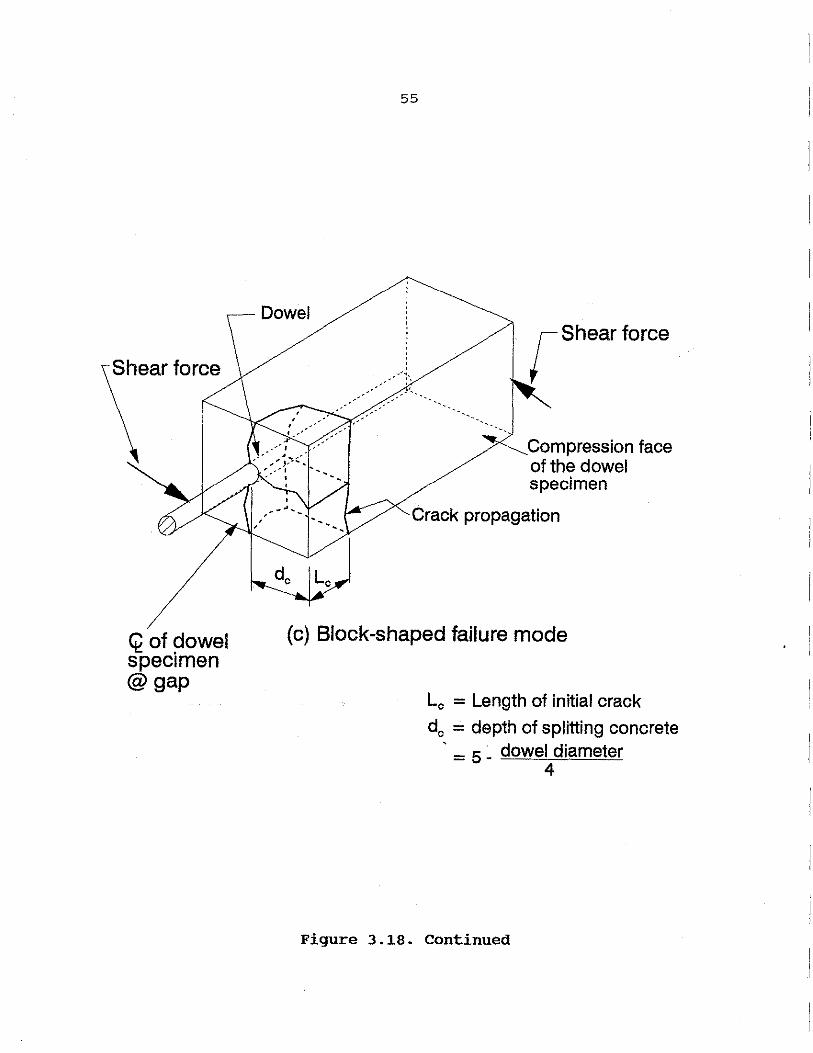
Shear force
Q of dowel specimen @gap
--
55
r Shear force
Compression face of the dowel specimen
Crack propagation
(c) Block-shaped failure mode
Le = Length of initial crack
de = depth of splitting concrete ' = 5 _ dowel diameter
4
Figure 3.18. Continued
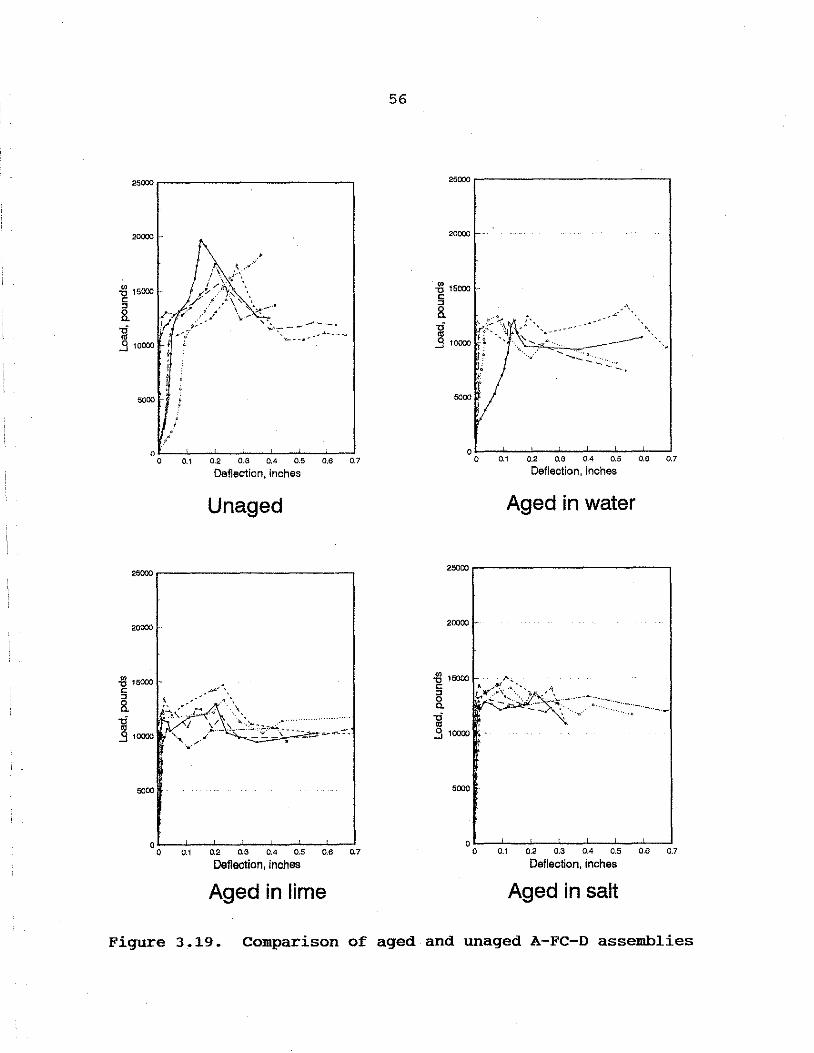
25000~-------------~
20000
{3 15000 c
8. 1.i .s 10000
5000
/' o'--.l.---'---'---"----"---'---1
0 0.1 0.2 O.G 0.4 0.5 0.6 0.7
Deflection, inches
Unaged
25000~-------------~
20000
~ 15CXXl c
8. 1.i .9 10000
5000
~' .~.\ ...
I
,,.,,,, \
·"·" .,; ·-........
;,/_ \_ ~"~-:..-.... : '·,,, ,,,..··· --"'"·~..;'.-'"""''°'""'" ....... --
O'---'---~--'---"---'"--'--~ 0 0.1 0.2 0.3 0.4 o.s 0.6 0.7
Deflection, inches
Aged in lime
56
20000
i3 15000 § 8.
5000 \
..:.'' "'·," ',,
-~ -........:-.:.:.··::_
'•
-,
0.1 0.2 0.3 0.4 0.5 0.6 0.7
Deflection, inches
Aged in water
25000~-------------~
20000
-a 15000 c
8. 1.i .9 10000
·' ',.., .. -··-·····-~ ,· ....... ·· -··-.. ._
·······"·
0.1 0.2 0.3 0.4 0.5 0.6 0.7
Deflection, Inches
Aged in salt
Figure 3.19. Comparison of aged and unaged A-FC-D assemblies
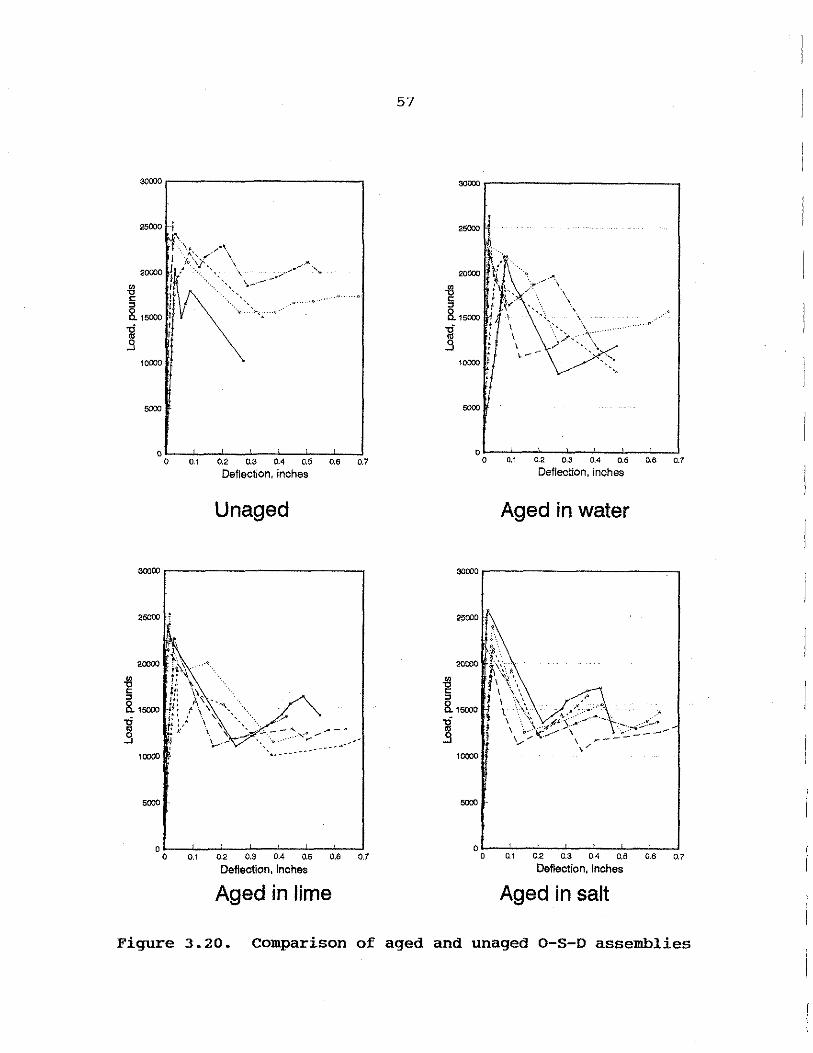
10000
5000
.. o-···· ·..,,,. ·"•;···~····
0.1 0.2 o.3 oA o.e; o.a o.7
Deflection, Inches
Unaged
30000..--------------~
25000 -t
6000
0.1 0.2 0,3 0.4 0.5 0.6 0.1
Deflection, inches
Aged in lime
57
25000 l :! •l .
10000
.•
..
0,1 0.2 0.3 0.4 0.5 0.6 0.7
Deflection, inches
Aged in water
00000.---------------~
25000
-g " 8.1sooo
l 10000
0.1 0.2 0.3 0.4 0.5 0.6 0. 7
Deflection, inches
Aged in salt
Figure 3.20. comparison of aged and unaged 0-S-D assemblies
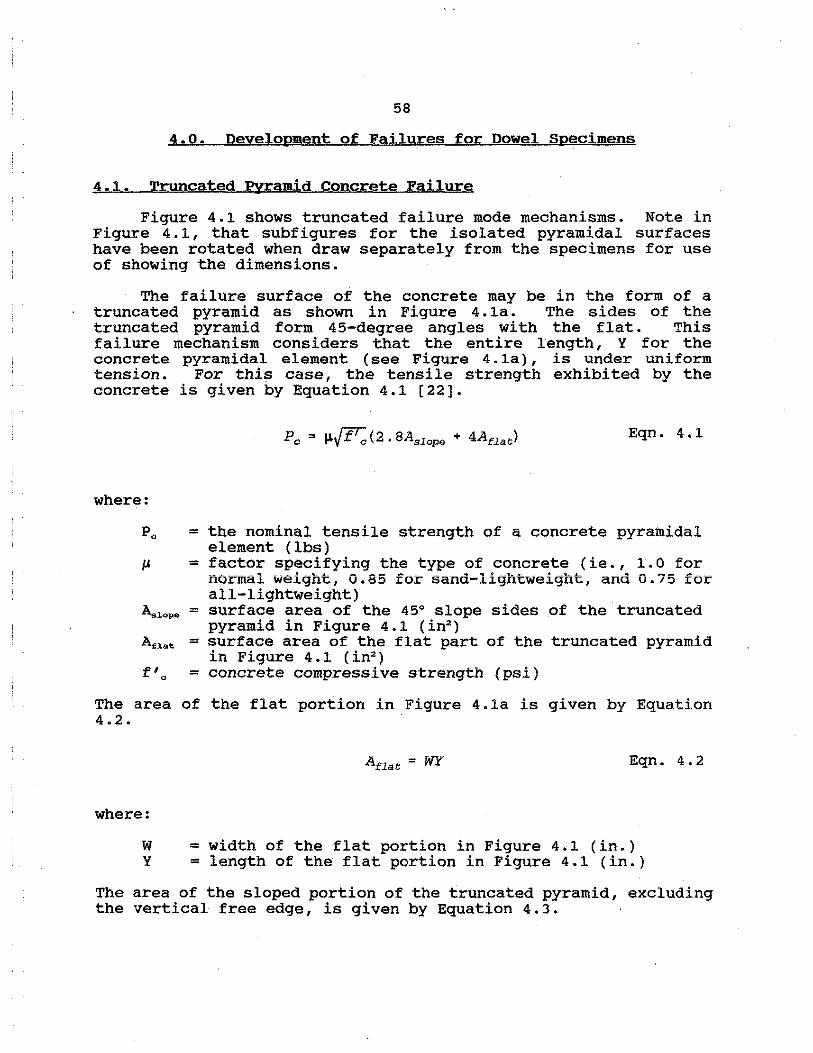
58
4.0. Development of Failures for Dowel Specimens
4.1. Truncated Pyramid Concrete Failure
Figure 4.1 shows truncated failure mode mechanisms. Note in Figure 4.1, that subfigures for the isolated pyramidal surfaces have been rotated when draw separately from the specimens for use of showing the dimensions.
The failure surface of the concrete may be in the form of a truncated pyramid as shown in Figure 4. la. The sides of the truncated pyramid form 45-degree angles with the flat. This failure mechanism considers that the entire length, Y for the concrete pyramidal element (see Figure 4. la) , is under uniform tension. For this case, the tensile strength exhibited by the concrete is given by Equation 4.1 [22].
where:
po
µ
Aai.ope
Afia.t
f' 0
=
=
=
=
=
Eqn. 4.1
the nominal tensile strength of a concrete pyramidal element (lbs) factor specifying the type of concrete (ie., 1.0 for normal weight, 0.85 for sand-lightweight, and 0.75 for all-lightweight) surface area of the 45° slope sides of the truncated pyramid in Figure 4.1 (in2
)
surface area of the flat part of the truncated pyramid in Figure 4.1 (in2
)
concrete compressive strength (psi)
The area of the flat portion in Figure 4.la is given by Equation 4.2.
Anat = WY Eqn. 4.2
where:
W =width of the flat portion in Figure 4.1 (in.) Y =length of the flat portion in Figure 4.1 (in.)
The area of the sloped portion of the truncated pyramid, excluding the vertical free edge, is given by Equation 4.3.
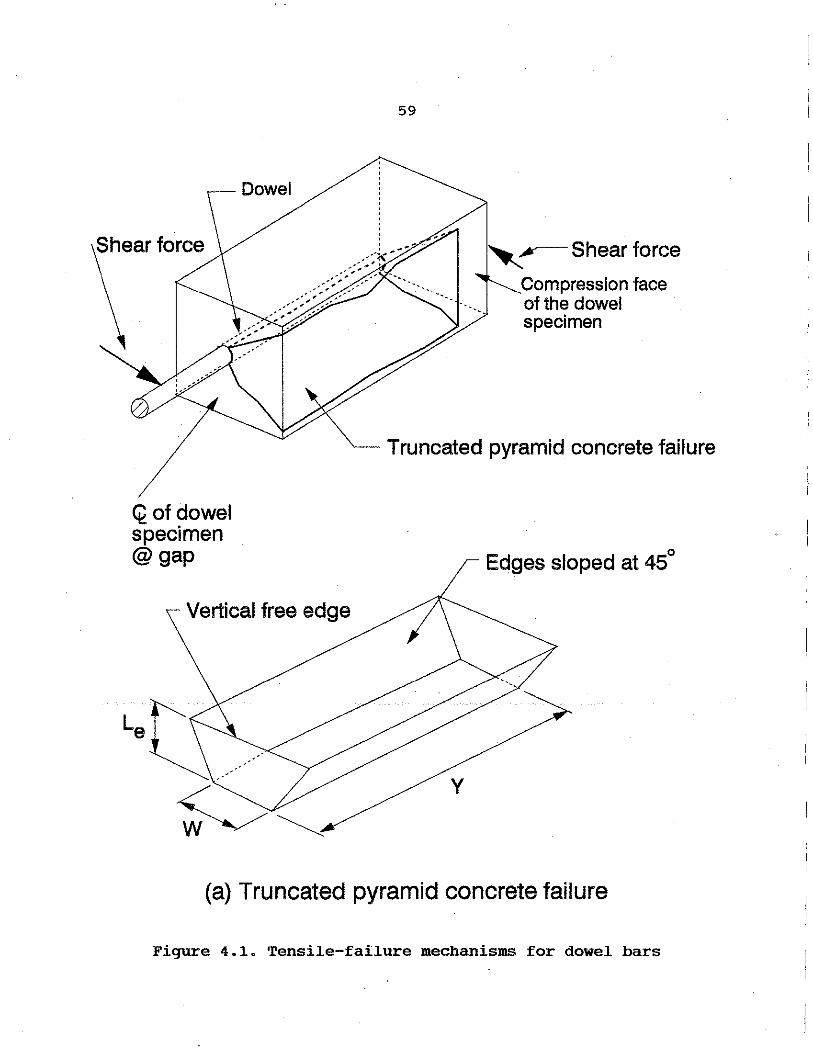
Shear force
~of dowel specimen @gap
Vertical free edge
59
-. Compression face of the dowel specimen
Truncated pyramid concrete failure
0 Edges sloped at 45
y
(a) Truncated pyramid concrete failure
Figure 4.1. Tensile-failure mechanisms for dowel bars
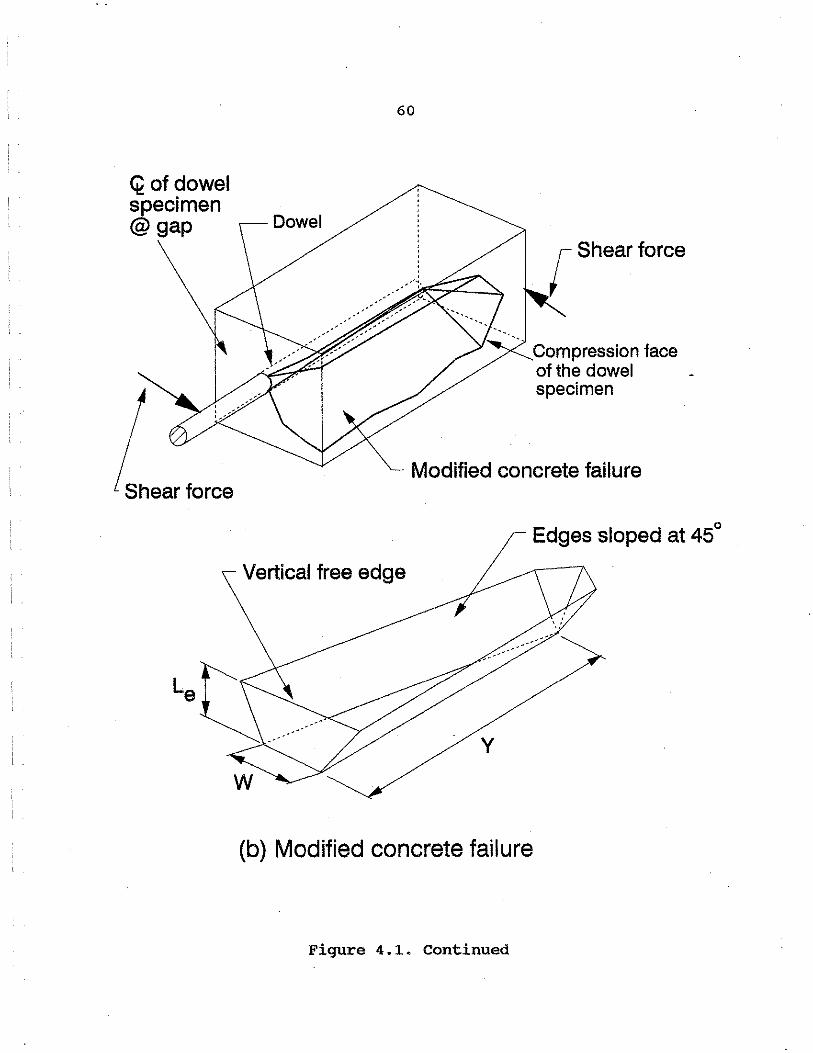
Q of dowel specimen @gap
Shear force
60
r Shear force
Compression face of the dowel specimen
Modified concrete failure
Edges sloped at 45
Vertical free edge
y
(b) Modified concrete failure
Figure 4.1. continued
0
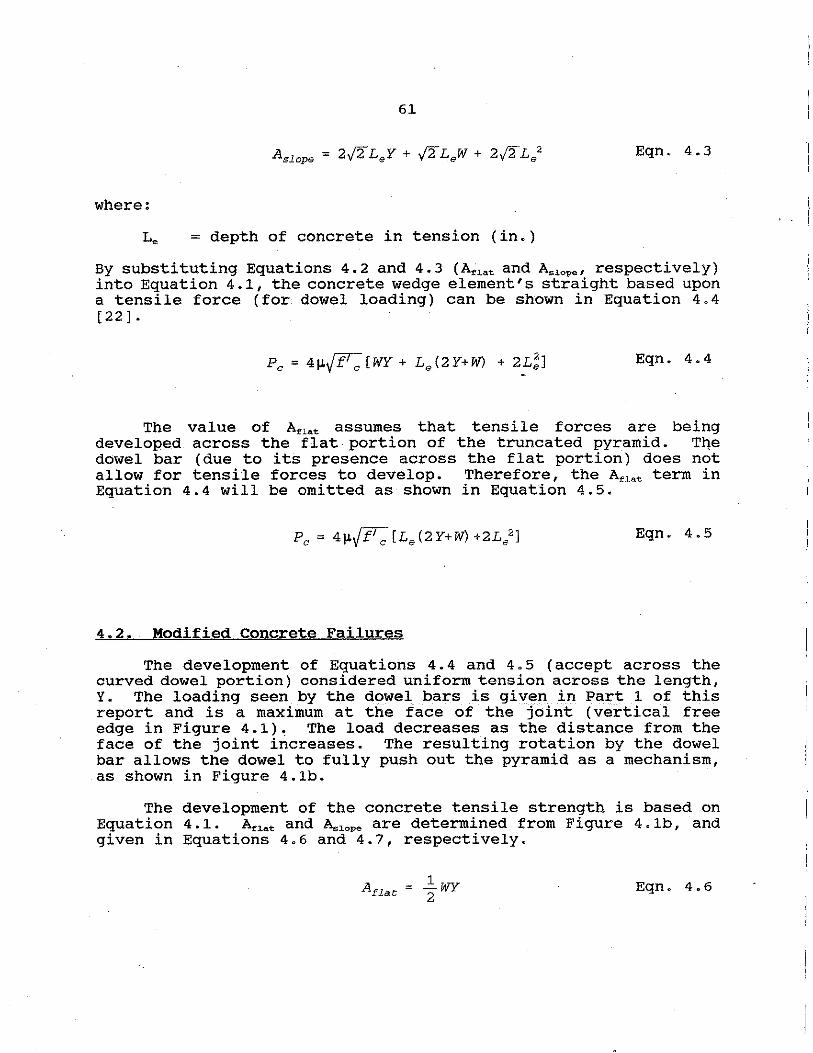
61
Eqn. 4.3
where:
L. =depth of concrete in tension (in.)
By substituting Equations 4.2 and 4.3 (Aflat and Asiopei respectively) into Equation 4.1, the concrete wedge element's straight based upon a tensile force (for dowel loading) can be shown in Equation 4.4 [ 22] •
Eqn. 4.4
The value of A,,.. assumes that tensile forces are being developed across the flat portion of the truncated pyramid. T~e dowel bar (due to its presence across the flat portion) does not allow for tensile forces to develop. Therefore, the An •• term in Equation 4.4 will be omitted as shown in Equation 4.5.
Eqn. 4.5
4.2. Modified Concrete Failures
The development of Equations 4.4 and 4.5 (accept across the curved dowel portion) considered uniform tension across the length, Y. The loading seen by the dowel bars is given in Part 1 of this report and is a maximum at the face of the joint (vertical free edge in Figure 4.1). The load decreases as the distance from the face of the joint increases. The resulting rotation by the dowel bar allows the dowel to fully push out the pyramid as a mechanism, as shown in Figure 4.lb.
The development of the concrete tensile strength is based on Equation 4 .1. Anat and A.iope are determined from Figure 4. lb, and given in Equations 4.6 and 4.7, respectively.
= l:_ WY 2
Eqn. 4.6

62
Eqn. 4.7
Using the same reasoning that the tensile strength can not be developed across a circular surface then zero will be substituted for the A,1.t term in Equation 4 .1. By eliminating the A,1 .t term and subs ti tu ting Equation 4. 7 for Asiop• into Equation 4 .1 gives Equation 4.8.
Eqn 4.8
4.2.1. FC dowel specimens
Using typical values from the unaged FC dowel specimens and applying them to Equations 4.5 and 4.8 gives a comparison between the two equations. Typical values include:
w y
L. µ f' c
= =
1.25 in. 3 in. (same as L0 value in Figure 3 .18) 4.69 in.(distance from midheight of dowel) 1.0 (normal weight concrete) 7090 psi (from Table 3.2)
Applying these values to Equation 4.5 gives the following results:
P0
= 4(1)y'7090 [4.69(2(3) + 1.25) + 2(4.69)2]
Pc = 26271 lbs
Applying these values to Equation 4.8:
Pc= 2(1)y'7090 [4(4.69)~ ~1.25 2 + 32 + 1.4/3(4.69) 2]
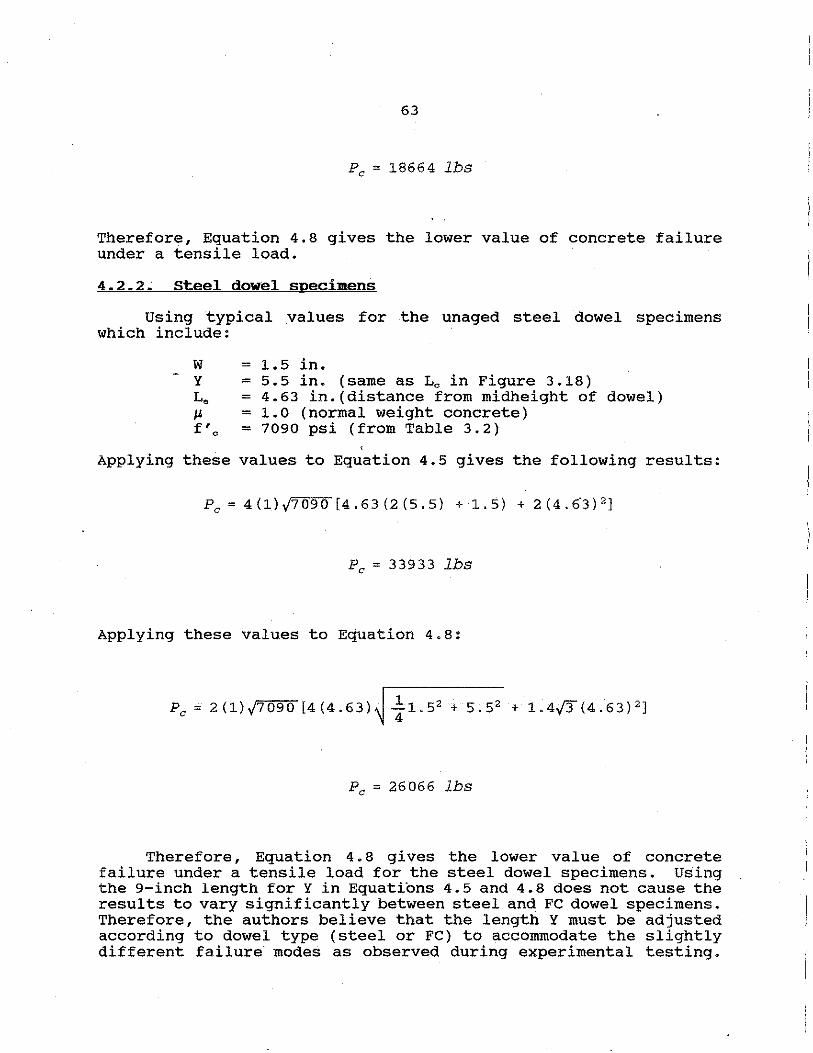
63
Pc = 18664 lbs
Therefore, Equation 4.8 gives the lower value of concrete failure under a tensile load.
4.2.2~ Steel dowel specimens
Using typical _values for the unaged steel dowel specimens which include:
w y
L. µ f' c
= = = = =
1.5 in. 5.5 in. (same as L0 in Figure 3.18) 4.63 in.(distance from midheight of dowel) 1.0 (normal weight concrete) 7090 psi (from Table 3.2)
' Applying these values to Equation 4.5 gives the following results:
pc = 4 ( 1) v'7 09 0 [ 4 . 6 3 ( 2 ( 5 . 5) + 1. 5) + 2 ( 4 . 6"3) 2 ]
Pc = 33933 lbs
Applying these values to Equation 4.8:
Pc= 2 (l)y'7090 (4 (4.63)~ ! 1.52 + 5.52 + 1.4{3(4.63) 2 ]
Pc = 26066 lbs
Therefore, Equation 4.8 gives the lower value of concrete failure under a tensile load for the steel dowel specimens. Using the 9-inch length for Y in Equations 4.5 and 4.8 does not cause the results to vary significantly between steel and FC dowel specimens. Therefore, the authors believe that the length Y must be adjusted according to dowel type (steel or FC) to accommodate the slightly different failure modes as observed during experimental testing.
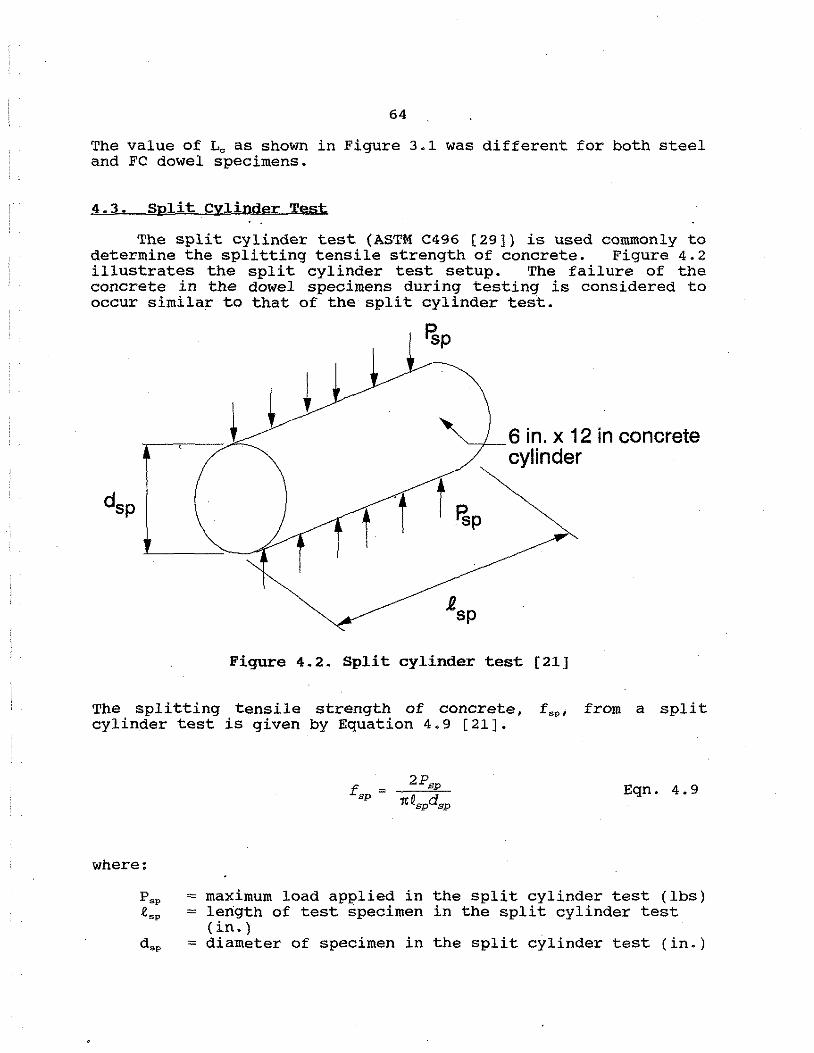
64
The value of L0 as shown in Figure 3.1 was different for both steel and FC dowel specimens.
4.3. Split cylinder Test
The split cylinder test (ASTM C496 [29]) is used commonly to determine the splitting tensile strength of concrete. Figure 4.2 illustrates the split cylinder test setup. The failure of the concrete in the dowel specimens during testing is considered to occur similar to that of the split cylinder test.
t
'-f--6 in. x 12 in concrete cylinder
Figure 4.2. Split cylinder test (21]
The splitting tensile strength of concrete, f.P, from a split cylincter test is given by Equation 4.9 [21].
Eqn. 4.9
where:
P.P =maximum load applied in the split cylinder test (lbs) tsp = length of test specimen in the split cylinder test
(in.) d•P =diameter of specimen in the split cylinder test (in.)
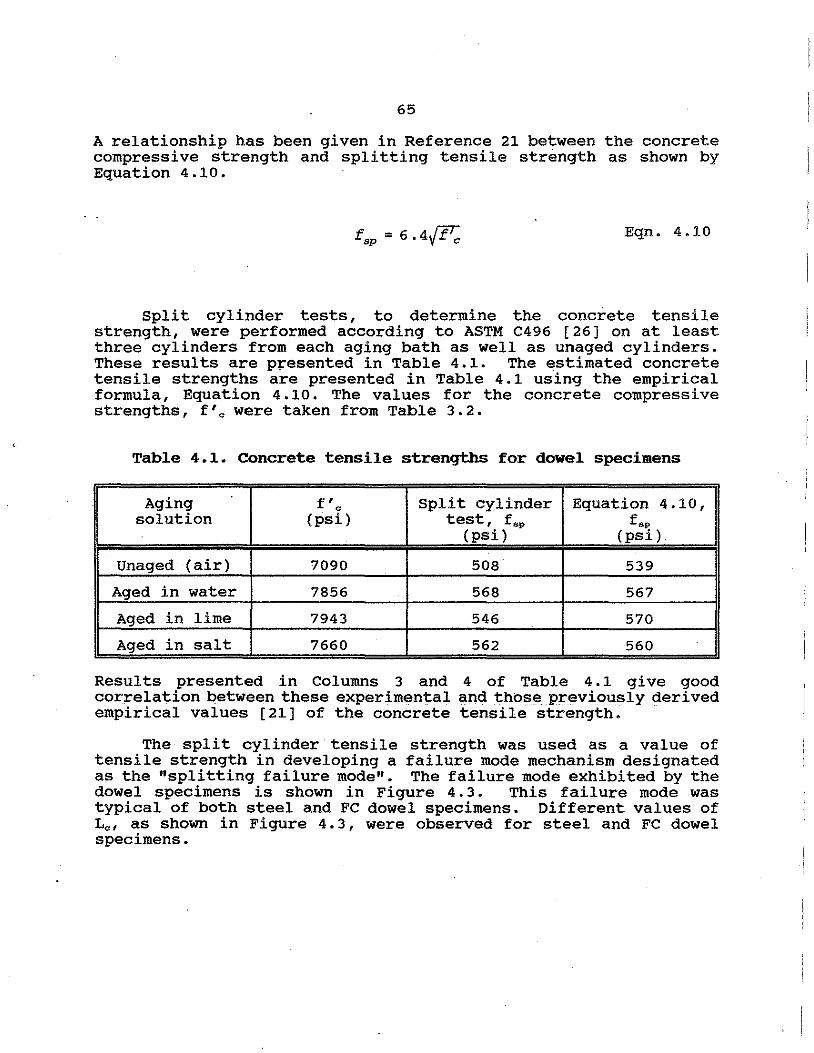
65
A relationship has been given in Reference 21 between the concrete compressive strength and splitting tensile strength as shown by Equation 4.10.
Eqn. 4.10
Split cylinder tests, to determine the concrete tensile strength, were performed according to ASTM C496 [26] on at least three cylinders from each aging bath as well as unaged cylinders. These results are presented in Table 4.1. The estimated concrete tensile strengths are presented in Table 4.1 using the empirical formula, Equation 4.10. The values for the concrete compressive strengths, f'c were taken from Table 3.2.
Table 4.1. Concrete tensile strengths for dowel specimens
Aging f' c Split cylinder Equation 4.10, solution (psi) test, f •• f ••
(psi) (psi).
Unaged (air) 7090 508 539
Aged in water 7856 568 567
Aged in lime 7943 546 570 ' ed in salt 7660 562 560
Results presented in Columns 3 and 4 of Table 4 .1 give good correlation between these experimental and those previously derived empirical values [21] of the concrete tensile strength.
The split cylinder tensile strength was used as a value of tensile strength in developing a failure mode mechanism designated as the "splitting failure mode". The failure mode exhibited by the dowel specimens is shown in Figure 4. 3. This failure mode was typical of both steel and FC dowel specimens. Different values of Le, as shown in Figure 4.3, were observed for steel and FC dowel specimens.

Q of powel specimen @gap
Shear force
66
~Shear force
Compression face of the dowel specimen
Crack propagation
Le = Length of initial crack
de = depth of splitting concrete = 5 _ dowel diameter
4 .
Figure 4.3. Splitting failure mode for the dowel specimens
4.3.1. FC dowel specimens
Solving Equation 4.9 for P.P (and substituting Pd, Le, and d0
for P•P' t•P' and d•P' respectively) gives Equa.tion 4.11.
Eqn. 4.11
Where the following typical values for the FC dowel specimens are:
Pd = load causing a splitting failure mode in dowel specimens (lbs)
f.P = split cylinder test results presented in Table 4 .1 (psi)
Le = 3 in. (length of crack as shown in Figure 4.3 as measured on the FC dowel specimens)
d0 = 5 - (dd/4) = 4.69 in. dd =diameter of the dowel (in.)
Utilizing the aforementioned values in Equation 4 .11 gives the values of Pd as shown in Table 4.2.

67
The values in Table 4. 2 for Pd correspond very .close to the average REEL loads given in Table 3.14 for the A-FC-D assemblies, which are presented again in Table 4.2 for comparison.
Table 4.2. Comparison between FC dowel specimen's REEL loads and concrete tensile strength
Avg. REEL Aging solution fsp load pd
(psi) (lbs) (lbs)
Unaged (air) 508 12185 11227
Aged in water 568 11819 12553
Aged in lime 546 11916 12067
Aged in salt 562 13139 12421
4.3.2. Steel dowel specimens
Substituting the following typical values for steel <:iowel specimens
fsp = split cylinder test results presented in Table 4.1 (psi)
Le = 5.5 in., (length of crack as shown in Figure 4.3 as measured on the steel dowel specimens)
de = 5 - ( dd/4) = 4.63 in.
into Equation 4.11 gives the values of Pd as shown in Table 4.3.
Table 4.3. comparison between steel dowel specimen's REEL loads and concrete tensile strength
Avg. REEL Aging solution fsp load pd
(psi) (lbs) (lbs)
Unaged (air) 508 22691 20320
Aged in water 568 22903 22720
Aged in lime 546 22352 21840
Aged in salt 562 22459 22480
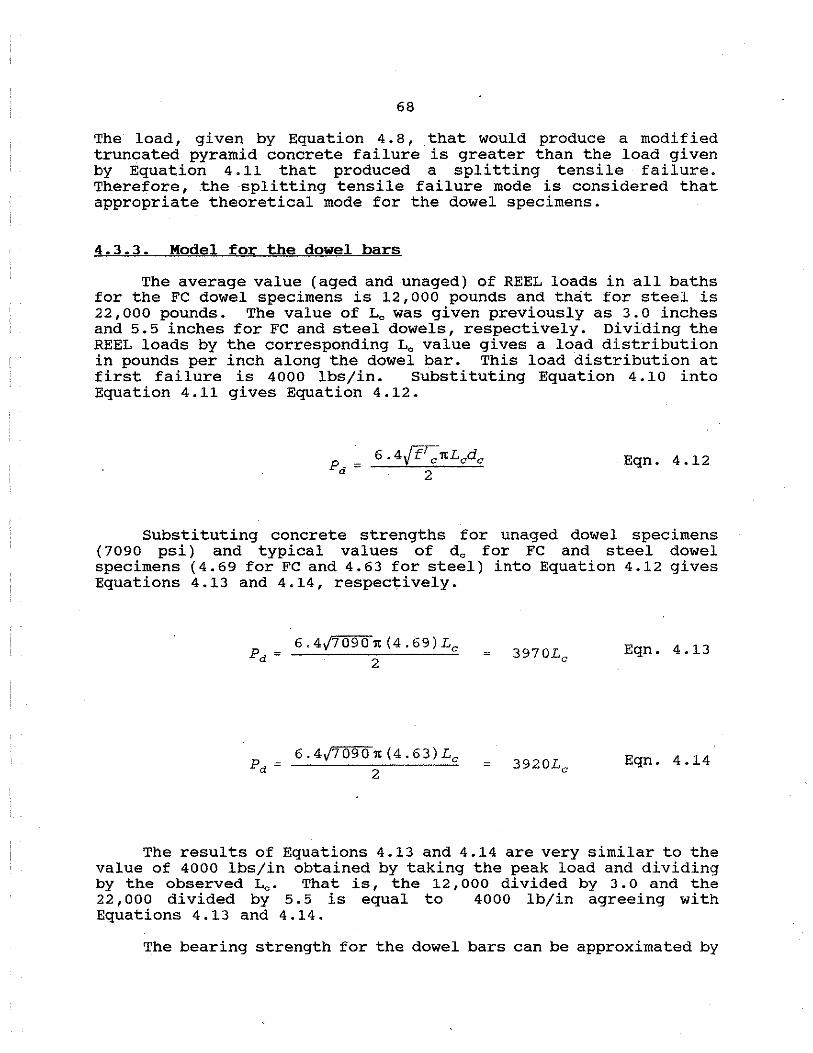
68
The load, given by Equation 4. 8, .that would produce a modified truncated pyramid concrete failure is greater than the load given by Equation 4.11 that produced a splitting tensile failure. Therefore, the splitting tensile failure mode is considered that appropriate theoretical mode for the dowel specimens.
4.3.3. Model for the dowel bars
The average value (aged and unaged) of REEL loads in all baths for the FC dowel specimens is 12,000 pounds and that for steel is 22,000 pounds. The value of L0 was given previously as 3.0 inches and 5. 5 inches for FC and steel dowels, respectively. Dividing the REEL loads by the corresponding L0 value gives a load distribution in pounds per inch along the dowel bar. This load distribution at first failure is 4000 lbs/in. Substituting Equation 4.10 into Equation 4.11 gives Equation 4.12.
Eqn. 4.12
Substituting concrete strengths for unaged dowel specimens ( 7090 psi) and typical values of d 0 for FC and steel dowel specimens (4.69 for FC and 4.63 for steel) into Equation 4.12 gives Equations 4.13 and 4.14, respectively.
6.4/709011 (4.69)Lc pd;
2 Eqn. 4.13
6 . 4/7 09 0 1t ( 4 . 6 3) LC pd; 2 Eqn. 4.14
The results of Equations 4.13 and 4.14 are very similar to the value of 4000 lbs/in obtained by taking the peak load and dividing by the observed L0 • That is, the 12,000 divided by 3.0 and the 22, 000 divided by 5. 5 is equal to 4000 lb/in agreeing with Equations 4.13 and 4.14.
The bearing strength for the dowel bars can be approximated by
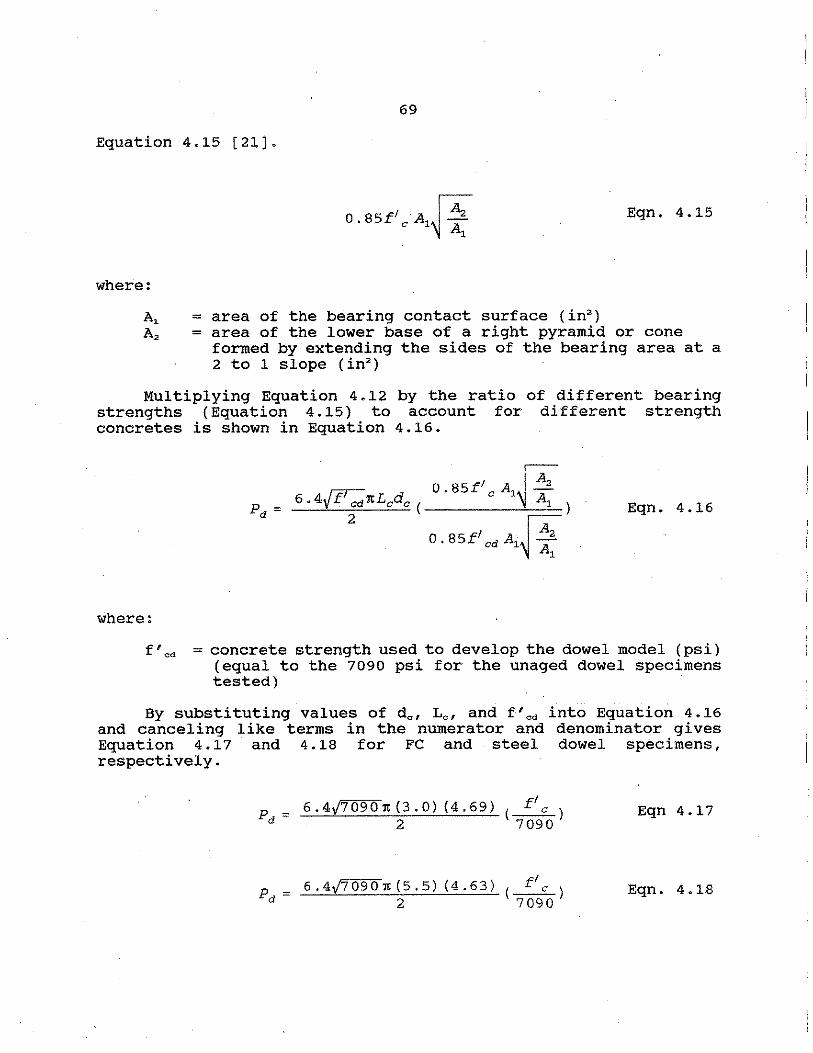
69
Equation 4.15 [21].
I ff2 0. 85f c A1 -Ai
Eqn. 4.15
where:
A, = area of the bearing contact surface (in2)
A2 = area of the lower base of a right pyramid or cone formed by extending the sides of the bearing area at a 2 to 1 slope (in2)
Multiplying Equation 4.12 by the ratio of different bearing strengths (Equation 4.15) to account for different strength concretes is shown in Equation 4.16.
I ff' ~ 0.85f CA1 .-- 6 • 4y f cd 1tL0 d 0 ( A 1 ) Pa - -----~~-
2 0. 85f1 ca A1~ _A_, Ai
Eqn. 4.16
where:
f 'ed = concrete strength used to develop the dowel model (psi) (equal to the 7090 psi for the unaged dowel specimens tested)
By substituting values of de, Le, and f'ed into Equation 4.16 and canceling like terms in the numerator and denominator gives Equation 4.17 and 4.18 for FC and steel dowel specimens, respectively.
Pd; 6.4f70901t(3.0) (4.69) f'
2 ( 709c0) Eqn 4.17
6 . 4f7 09 0 'Jt ( 5. 5) ( 4. 6 3) f' c pd ; 2 ( 7 090 )
Eqn. 4.18
70
Equations 4.17 and 4.18 reduce to give Equations 4.19 and 4.20 for 1.25-inch FC dowels and 1.50-inch steel dowels, respectively, cast in a 10-inch thick specimen.
For 1.25-inch FC dowel specimens:
I . pd = 1.68 £ c
For 1.50-inch steel dowel specimens:
Eqn. 4.19
Eqn. 4.20
The approximate equations can be used to determine the maximum load applied to 1.25-inch FC and 1.50-inch steel dowel bars cast in a 10-inch thick concrete specimen. The variability of concrete strength is taken into account for both Equations 4.19 and 4.20.
The unaged 1. 25-inch poly vinyl dowel specimens that were tested and results presented in Section 5.0 had an average compressive strength of 6100 psi. Using f 'c = 6100 psi in Equation 4.19 gives a value of Pd equal to 10,248 pounds. The actual average value of dowel specimen failure is 994 7 pounds. This approximates the dowel failure very well.
The use of Equation 4.19 and 4.20 is for a 1.25-inch and 1.50-inch diameter dowel, respectively, cast in a 10-inch thick concrete specimen. From the data collected thus far, the effect of pavement thickness or dowel diameter is not known. This model (for FC and steel) represents variation in concrete strength for· a single diameter dowel bar.
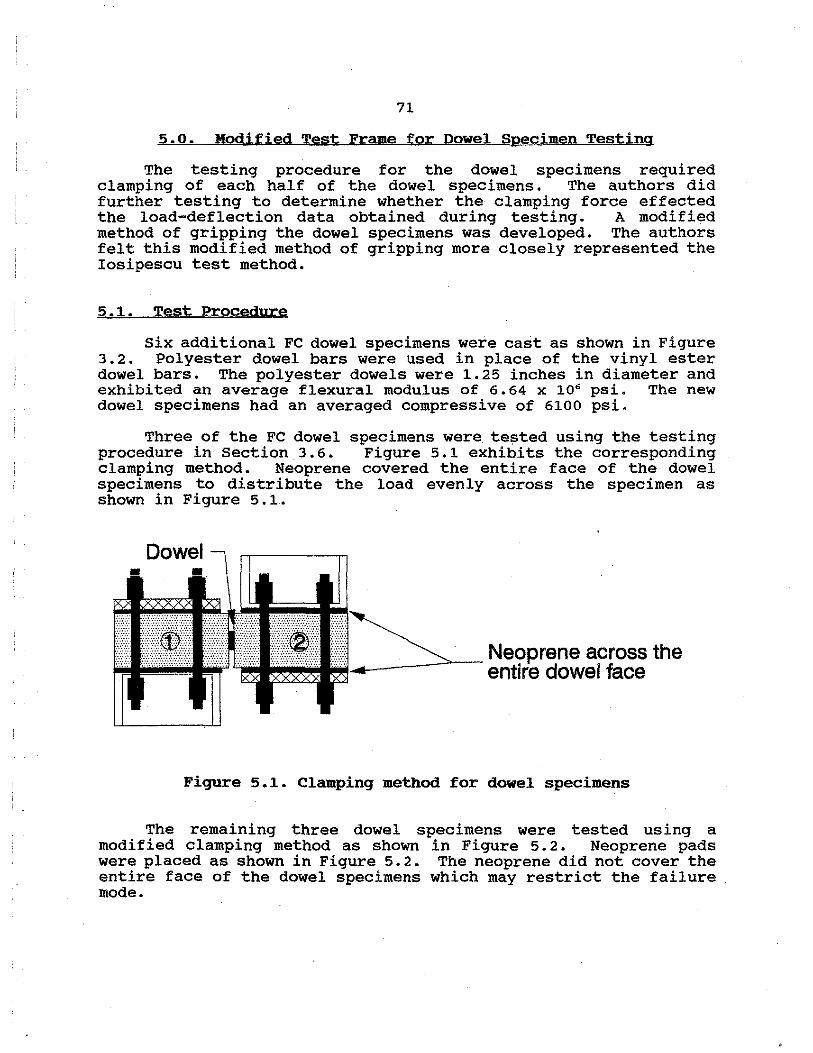
71
5.0. Modified Test Frame for Dowel Specimen Testing
The testing procedure for the dowel specimens required clamping of each half of the dowel specimens. The authors did further testing to determine whether the clamping force effected the load-deflection data obtained during testing. A modified method of gripping the dowel specimens was developed. The authors felt this modified method of gripping more closely represented the Iosipescu test method.
5.1. Test Proce<iure
Six additional FC dowel specimens were cast as shown in Figure 3.2. Polyester dowel bars were used in place of the vinyl ester dowel bars. The polyester dowels were 1.25 inches in diameter and exhibited an average flexural modulus of 6.64 x 10• psi. The new dowel specimens had an averaged compressive of 6100 psi.
Three of the FC dowel specimens were tested using the testing procedure in Section 3.6. Figure 5.1 exhibits the corresponding clamping method. Neoprene covered the entire face of the dowel specimens to distribute the load evenly across the specimen as shown in Figure 5 .1.
Figure 5.1. Clamping method for dowel specimens
The remaining three dowel specimens were tested using a modified clamping method as shown in Figure 5.2. Neoprene pads were placed as shown in Figure 5.2. The neoprene did not cover the entire face of the dowel specimens which may restrict the failure mode.
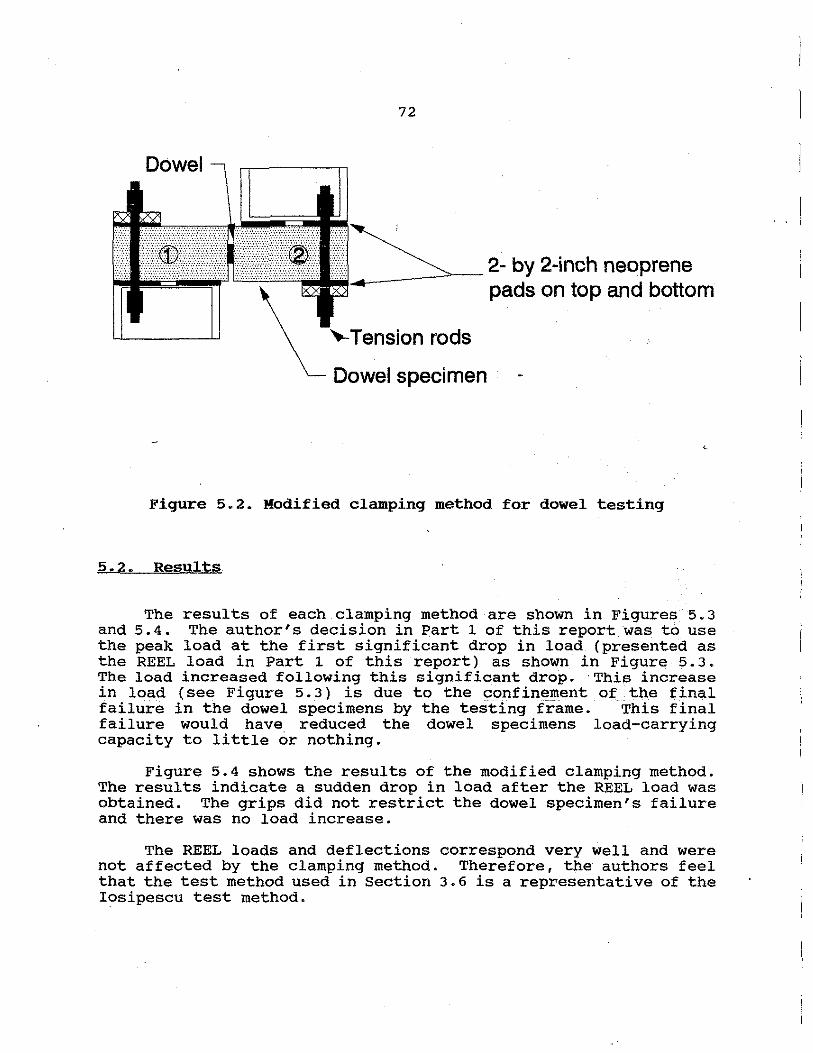
72
~Tension rods
Dowel specimen
Figure 5.2. Modified clamping method for dowel testing
5.2. Results
The results of each clamping method are shown in Figures 5.3 and 5.4. The author's decision in Part 1 of this report was to use the peak load at the first significant drop in load (presented as the REEL load in Part 1 of this report) as shown in Figure 5.3. The load increased following this significant drop. This increase in load (see Figure 5.3) is due to the confinement of the final failure in the dowel specimens by the testing frame. This final failure would have reduced the dowel specimens load-carrying capacity to little or nothing.
Figure 5.4 shows the results of the modified clamping method. The results indicate a sudden drop in load after the REEL load was obtained. The grips did not restrict the dowel specimen's failure and there was no load increase.
The REEL loads and deflections correspond very well and were not affected by the clamping method. Therefore, the authors feel that the test method used in Section 3.6 is a representative of the Iosipescu test method.

en "O c· :J 0 c. -"O ctS
.9
73
16000 ...--------------------.
14000
12000
10000
8000
' ·:
' 6000 i • & : : . ' 4000 . ' . ' . '
·~ . ' f :
~ : 2000 :
REEL load
~Peakload
? ~
Behavior due to clamping forces
TEST1 TEST2 TESTS
0 ,.__~~~~~~~~~~~~~~~~~~~ 0 '0.2 0.4 0.6 0.8 1
Deflection, inches DOPV
Figure 5.3. Tests on PV dowel bars
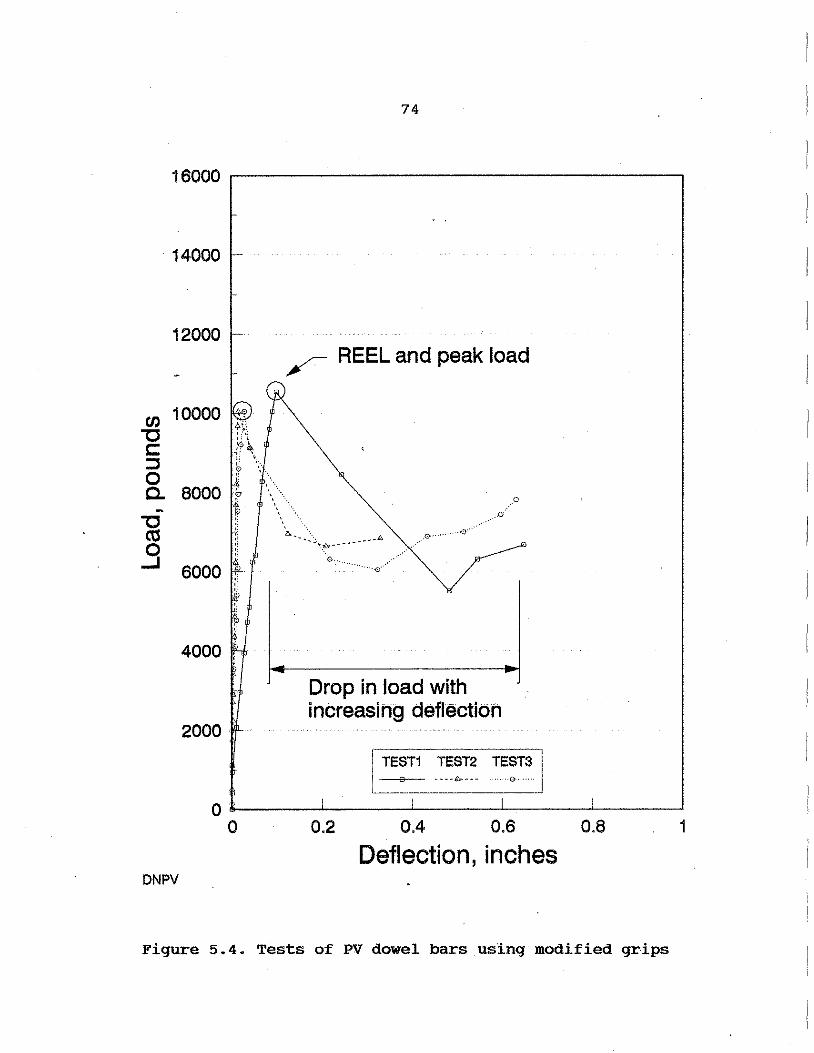
CJ)
"'O c: :::> 0 a. -"'O ca .9
74
16000 ~----------------~
14000
12000
10000
8000
6000
4000
2000.
~ REEL and peak load
Drop in load with increasing deflection
ST1 TEST2 TEST3 I •MHHJ]:;,..H~~ "''"''0'"'"''
---------o,._ __ __. ___ ~---~---~--~
0 0.2 OA 0.6 0.8 1
Deflection, inches DNPV
Figure 5.4. Tests of PV dowel bars using modified grips
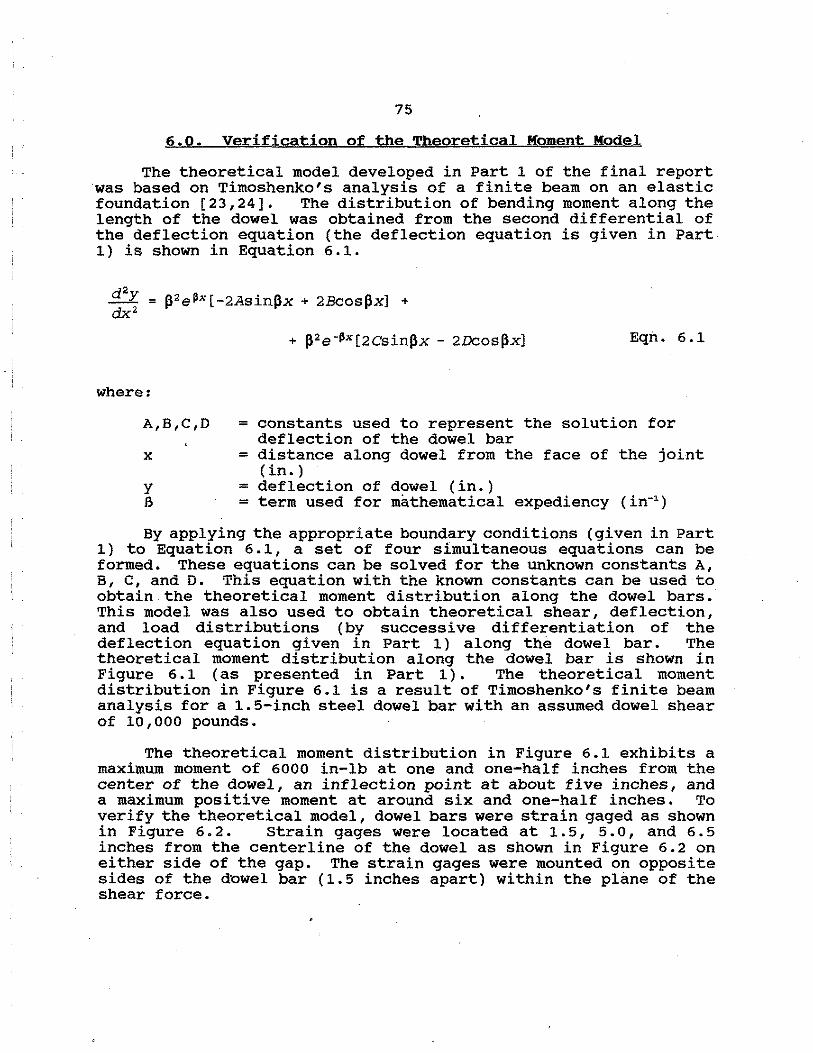
75
6.0. Verification of the Theoretical Moment Model
The theoretical model developed in Part 1 of the final report was based on Timoshenko's analysis of a finite beam on an elastic foundation [23,24]. The distribution of bending moment along the length of the dowel was obtained from the second differential of the deflection equation (the deflection equation is given in Part 1) is shown in Equation 6.1.
d2y . j3 2 e~x[-2Asinpx + 2Bcosj3x] +
dx2
where:
A,B,C,D
x
y B
Eqn. 6.1
= constants used to represent the solution for deflection of the dowel bar
= distance along dowel from the face of the joint (in.)
=deflection of dowel (in.) = term used for mathematical expediency ( in-1
)
By applying the appropriate boundary conditions (given in Part 1) to Equation 6 .1, a set of four simultaneous equations can be formed. These equations can be solved for the unknown constants A, B, C, ana 1J. This equation with the known constants can be used to obtain the theoretical moment distribution along the dowel bars. This model was also used to obtain theoretical shear, deflection, and load distributions (by successive differentiation of the deflection equation given in Part 1) along the dowel bar. The theoretical moment distribution along the dowel bar is shown in Figure 6 .1 (as presented in Part 1) • The theoretical moment distribution in Figure 6.1 is a result of Timoshenko's finite beam analysis for a 1.5-inch steel dowel bar with an assumed dowel shear of 10,000 pounds.
The theoretical moment distribution in Figure 6.1 exhibits a maximum moment of 6000 in-lb at one and one-half inches from the center of the dowel, an inflection point at about five inches, and a maximum positive moment at around six and one-half inches. To verify the theoretical model, dowel bars were strain gaged as shown in Figure 6.2. strain gages were located at 1.5, 5.0, and 6.5 inches from the centerline of the dowel as shown in Figure 6.2 on either side of the gap. The strain gages were mounted on opposite sides of the d~wel bar (1.5 inches apart) within the plane of the shear force.
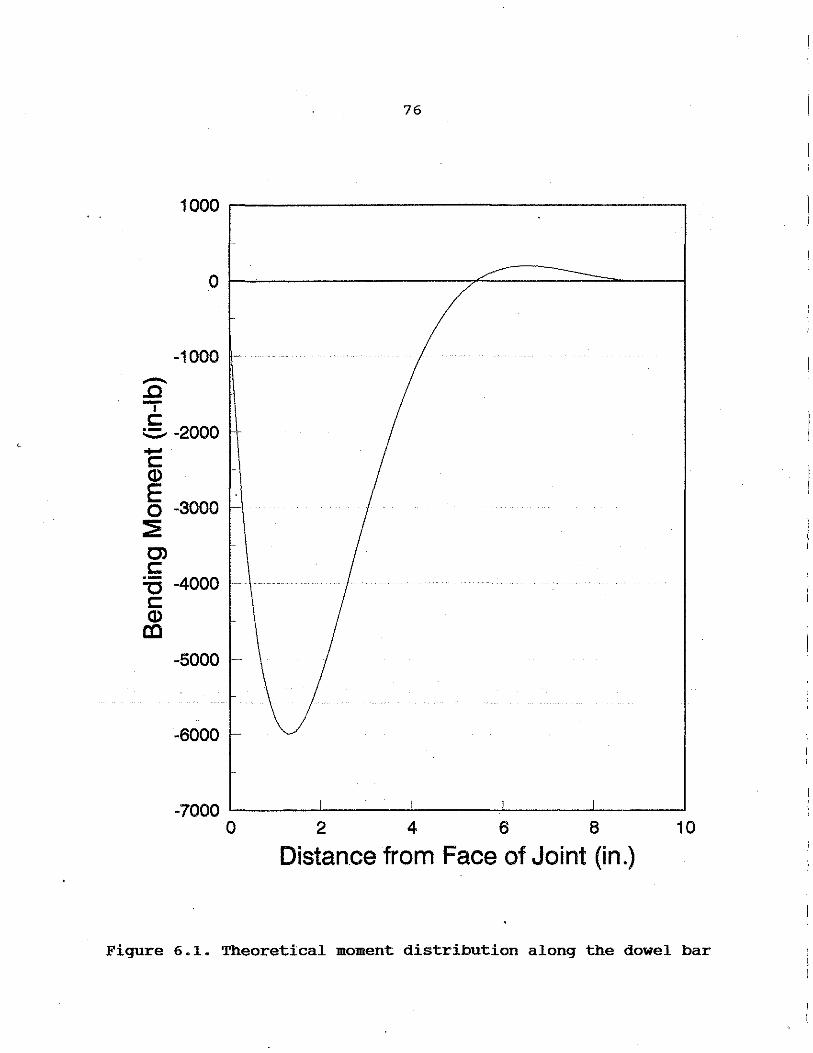
-1000 -.c .,. c:
:.::- -2000 -c: (1)
E 0 -3000 :E O') c: =o -4000 c: (1) cc
-5000
-6000
76
-7000 '-------"-----'----....,..._ ___ _.__ __ ____, 0 2 4 6 8 10
Distance from Face of Joint (in.)
Figure 6.1. Theoretical moment distribution along the dowel bar
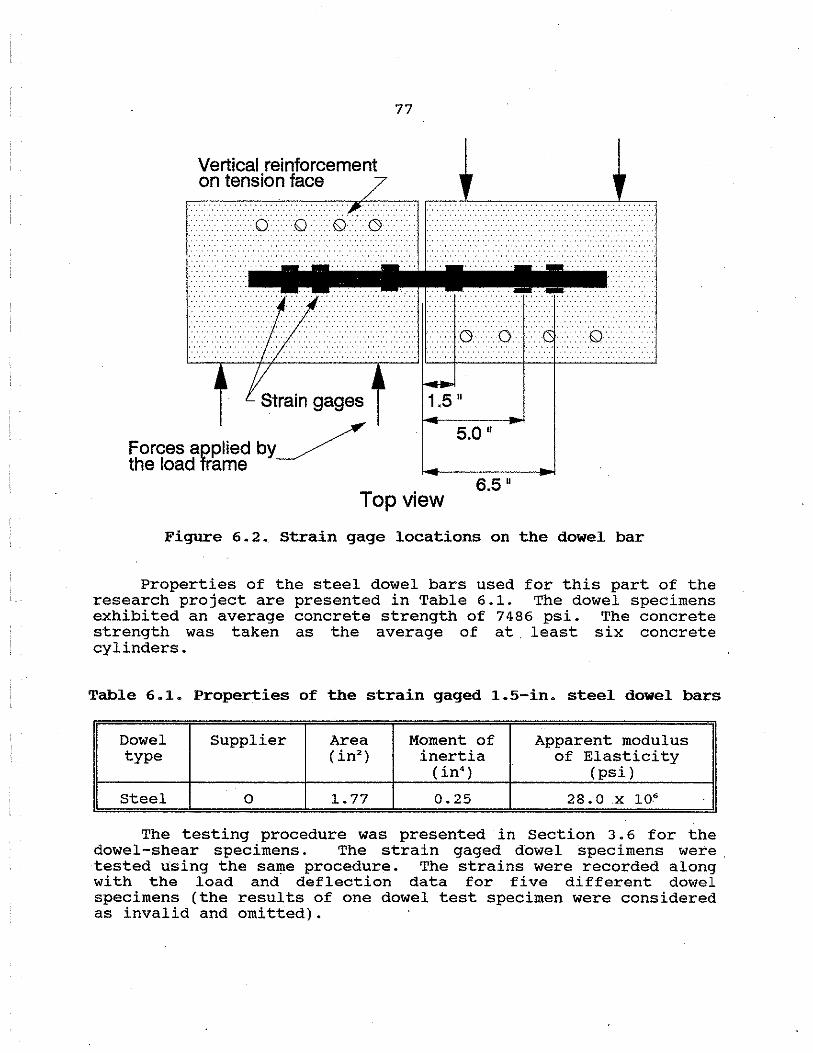
Vertical reinforcement on tension face
Forces applied by~ the load frame
77
1,5 II
5.0 II
6.5" Top view
Figure 6.2. Strain gage locations on the dowel bar
Properties of the steel dowel bars used for this part of the research project are presented in Table 6.1. The dowel specimens exhibited an average concrete strength of 7486 psi. The concrete strength was taken as the average of at . least six concrete cylinders.
Table 6.1. Properties of the strain gaged 1.5-in. steel dowel bars
Dowel Supplier Area Moment of Apparent modulus type ( in2
) inertia of Elasticity (in•) (psi)
.
Steel 0 1.77 0.25 28.0 .x 10.•
The testing procedure was presented in Section 3.6 for the dowel-shear specimens. The strain gaged dowel specimens were . tested Using the same procedure. The strains were recorded along with the load and deflection data for five different dowel specimens (the results of one dowel test specimen were considered as invalid and omitted).

78
The analysis of the strain gage results was completed based on Reference 25. The deformation of the dowel bar is measured by the curvature of neutral axis. The value of the curvature (the inverse of the radius of curvature) can be determined using Equation 6.2 (25].
Eqn. 6.2
where:
¢ =radius of curvature (in.) cm =maximum normal strain (in/in) c = distance from the neutral axis to the extreme fiber
(in.)
Using the following expressions,
and
and substituting them into Equation 6.2 gives Equation 6.3.
Eqn. 6.3
where:
M. =bending moment causing curvature in the dowel (in-lb) E. = modulus of elasticity of the dowel bar (psi) r. =moment of inertia for the dowel bar (in•)
Setting Equation 6.2 equal to Equation 6.3 and solving for M. gives Equation 6.4.
Eqn. 6.4
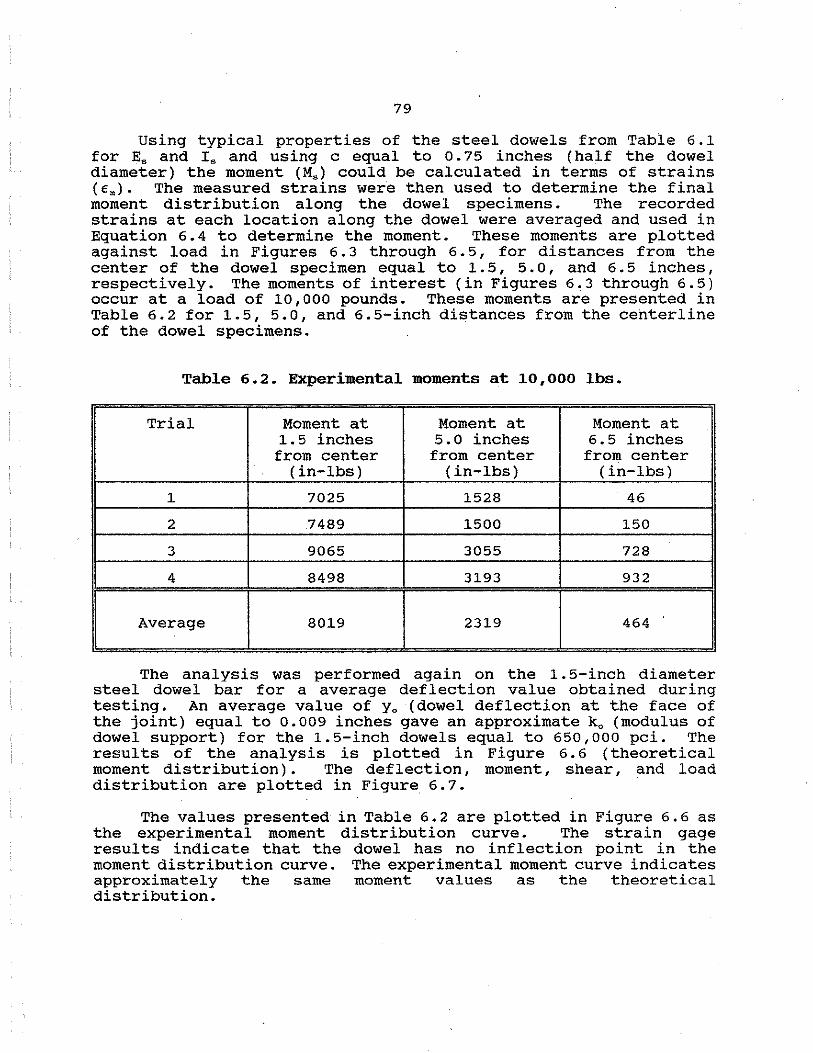
79
Using typical properties of the steel dowels from Table 6.1 for E. and I. and using c equal to o. 75 inches (half the dowel diameter) the moment (M.) could be calculated in terms of strains (€.). The measured strains were then used to determine the final moment distribution along the dowel specimens. The recorded strains at each location along the dowel were averaged and used in Equation 6.4 to determine the moment. These moments are plotted against load in Figures 6.3 through 6.5, for distances from the center of the dowel specimen equal to 1.5, 5.0, and 6.5 inches, respectively. The moments of interest (in Figures 6, 3 through 6. 5) occur at a load of 10,000 pounds. These moments are presented in Table 6.2 for 1.5, 5.0, and 6.5-inch distances from the centerline of the dowel specimens.
Table 6 .• 2. Experimental moments at 10,000 lbs.
Trial Moment at Moment at Moment at 1.5 inches 5.0 inches 6.5 inches
from center from center from center (in-lbs) (in-lbs) (in-lbs)
1 7025 1528 46
2 7489 1500 150
3 9065 3055 728
4 8498 3193 932
Average 8019 2319 464
The analysis was performed again on the 1. 5-inch diameter steel dowel bar for a average deflection value obtained during testing. An average value of y 0 (dowel deflection at the face of the joint) equal to 0.009 inches gave an approximate k 0 (modulus of dowel support) for the 1.5-inch dowels equal to 650,000 pci. The results of the analysis is plotted in Figure 6. 6 (theoretical moment distribution) • The deflection, moment, shear, and load distribution are plotted in Figure 6.7.
The values presented in Table 6.2 are plotted in Figure 6.6 as the experimental moment distribution curve. The strain gage results indicate that the dowel has no inflection point in the moment distribution curve. The experimental moment curve indicates approximately the same moment values as the theoretical distribution.

..c ""'j' c:: ·-
15000
80
TEST1 TEST2 TEST3 TEST4 ----'- ----.fl---- ·"'·····0···-·· --+--
Moment at 1.5 inches from the centerline of dowel specimen due to load of 10,000 lbs
0 I
I' I I
' I I I I
I I
f f. ,d.
I fo'
I ·"
I a' if; :{: ,. j fl{
·' I 0. I r,f, ' / _,,.
i I . - ... o ;/ .-':u'
~ 10000 0 Jr' ..
:' /
<ii' ,.._J.< ' -' r t:s.
E 0
::::?
. / !;{'
;/ ,fo
/. ·"
5000
0 £'-~~~~.....l-~~~~--'~~~~~..l.-~~~~....J 0 5000 10000 15000 20000
Load, pounds Moment @ 1.5 inches
Figure 6.3. Load versus moment diagram at 1.5 inches from the centerline of dowel bar

.c I c:
81
10000 ~----------------~
8000
6000
TEST1 TEST2 TEST3 TEST4
Moment at 5 inches from the centerline of dowel specimen due
Q I
I I ,
I
I
I
• I I
I I
I I
I
r I I I
t I
-
to load of 10,000~
I -c: Q)
E 0 ~ 4000
2000
p I
I I
¢· t
... / .: ;j(
ii /! / :t < I
.: I ,,
•
o~::_ __ _J.. ____ _L. ____ ..:__ ___ __J
0 5000 1 0000 15000 20000
Load, pounds Moment @ 5 inches
Figure 6.4. Load versus moment diagram at 5.0 inches from the centerline of dowel bar
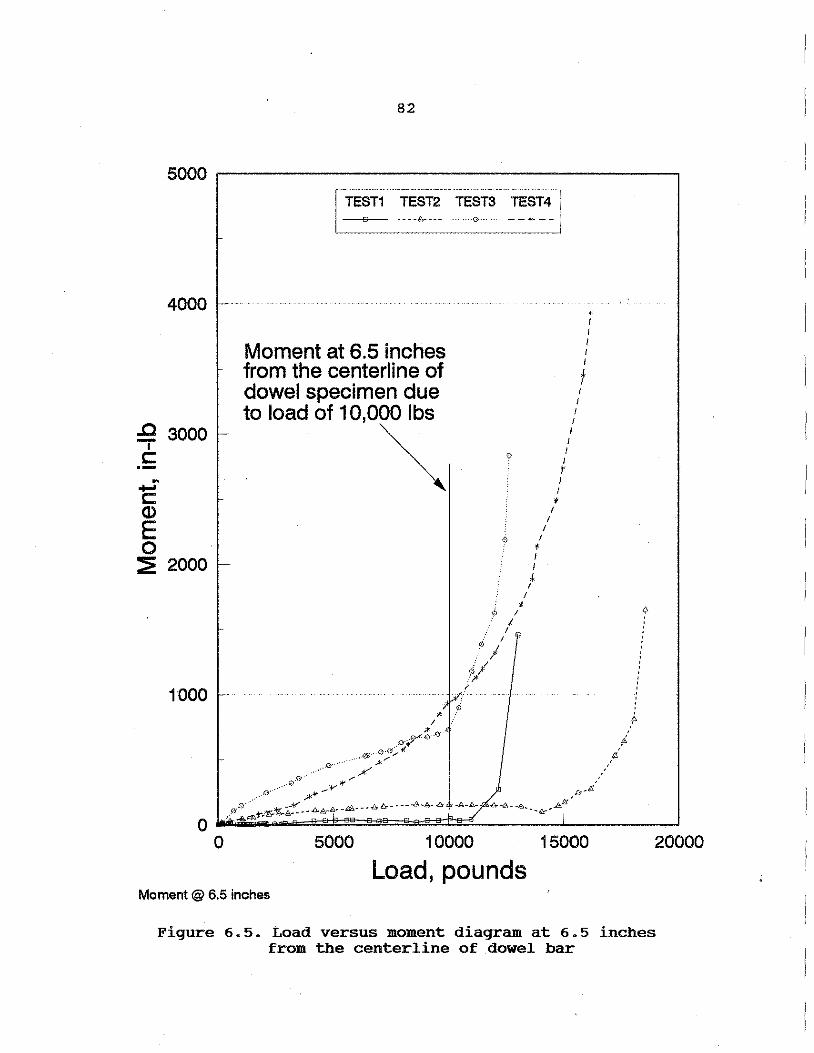
4000
:9 3000 I
c:: ·-ft .....
c:: a> E 0 ::? 2000
1000
82
Moment at 6.5 inches from the centerline of dowel specimen due lo load of 10,~
0
, ¢; I i I
./ ,1 lil
P; ·' I (/)/
·'!'
I
I I
I
• I I ;
I
I
' I I I I I
f I I I
I I I I
I r I I ,
-~~,;/ -&../A--A. __ h'~,AIX
5000 1 0000 15000
Load, pounds Moment @ 6.5 inches
l ;,
,',ts
20000
Figure 6.5. Load versus moment diagram at 6.5 inches from the centerline of dowel bar
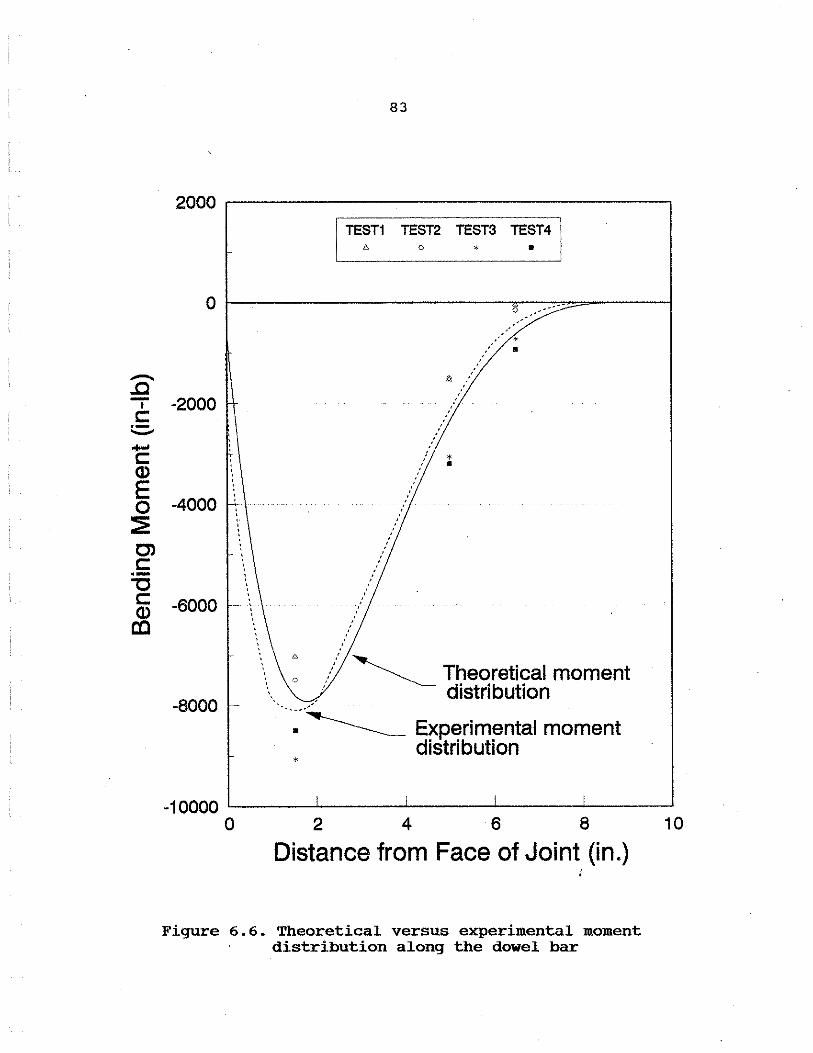
-..c I c
:,::.. ...... c Q)
E 0 :::: C) c ·-"O c Q) co
83
TEST1 TEST2 TEST3 TEST4 0 * •
0 t--~~~~~~~~~~~-,,..o~-":':""O::=>~~~~ --
-2000
-4000
-6000
-8000
0
I * •
'
--* •
,:/ ~ Theoretical moment ' distribution
·-~--~ Experimental moment distribution
*
-10000 '-----'-----'------J-----'------'
0 2 4 6 8
Distance from Face of Joint (in.)
Figure 6.6. Theoretical versus experimental moment distribution along the dowel bar
10
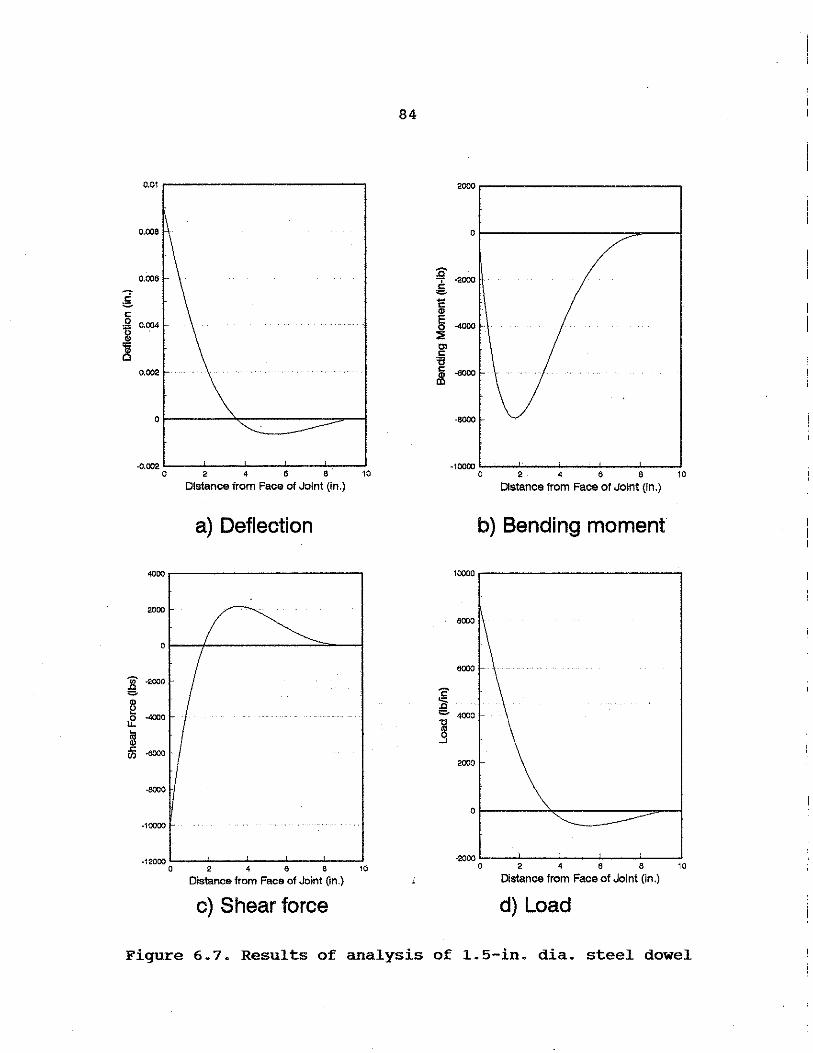
0.01 ~-----------~
g c
~ ~
0.002
0
-0.002 0 2 4 6 • 10
Distance from Face of Joint (in.)
a) Deflection
4000
2000
0
:B ·2000
= @ if ·400<l
si .c ·6000 '" "' -6000
·10000
·12000 0 2 4 • ' 10
Distance from Face of Joint (in.)
c) Shear force
84
·8000
·10000 '----'----'-~-'----'---'
~ ,e - 4000 ,, ~
2000
a 2 4 e a 10
Distance from Face ol Joint (In.)
b) Bending moment
-~oo'----'----'---'----'--J 0 2 4 6 8 10
Distance from Face of Joint (in.)
d) Load
Figure 6.7. Results of analysis of 1.5-in. dia. steel dowel
85
7.0. Conclusions
7.1. Accelerated Aging
A very good approximate model was developed for accelerated aging of FC materials that will approximate real weather aging. Two equations were developed for accelerated aging in central Iowa (Ames). The first equation (Equation 7.1) relates the temperature of the aging bath to the number of days aged per day. The second, the acceleration factor (AF) equation (Equation 7.2) adjusts the number of days aged per day to account for a mean annual temperature (MAT), that is different than the United Kingdom (UK) where the accelerated aging process was developed.
Age(days) =o.2ooeo.os2•T day
AF= 2. 986E-19e13 •783x
Eqn. 7.1
Eqn. 7.2
The E-glass fibers encapsulated in a vinyl ester resin matrix has proven in this research to be very resistant to accelerated aging effects.
7.2. Pullout Specimens
The pullout specimens for supplier B exhibited increase in peak load for all three aging solutions. specimens from Supplier c exhibited a slight decrease in with exception of those specimens aged in water.
a slight Pullout
peak load
A theoretical model was developed to approximate the mechanical bond degradation in the pullout specimens. Using Equation 7.3, the tensile elongation could be approximated using a varying length L,,, that took into account the mechanical bond failure.
Eqn. 7.3
86
This model indicated that a slight increase in mechanical bond was exhibited by Supplier B's rebar cast in concrete, due to accelerated aging. Also, Supplier C's rebar exhibited a slight decrease in mechanical bond due to accelerated aging.
7.3. Dowel Specimens
overall, the accelerated aging solutions of water, lime, and salt apparently had little or no affect on the shear strength behavior of any of the dowel bar series.
Approximate equations were developed for FC and steel dowels and accounted for both concrete splitting and concrete bearing type failure modes. These equations were developed for unaged dowel specimens and approximated the dowel specimens failure very close. Equation 7.4 is for a 1.25-inch diameter FC dowel cast in a 10-thick concrete specimen. Equation 7.5 is for a 1.50-inch diameter steel dowel cast in a 10-inch thick concrete specimen.
For the 1.25-inch FC dowel specimens:
Eqn. 7.4
For the 1.50-inch steel dowel specimens:
Pd= 3.00 f 1c Eqn. 7.5
Verification was made on the testing procedure (clamping method) for the dowel specimens. The authors determined that it was a representative testing procedure based upon the Iosipescu shear test. The clamping method was modified to more closely represent the. Iosipescu shear test. Upon doing so, the REEL loads, deflections, and failure modes were very consistent between the two testing procedures.
The steel dowel bars in the dowel-shear specimens were strain gaged to check the theoretical moment distribution along the dowel bar as presented in Part 1 of this report. An experimental moment distribution was developed based upon the strain gaged dowel specimens. The theoretical moment distribution was approximately equal to the experimental moment distribution. An inflection point was not observed in the experimental moment distribution. overall the authors feel that the theoretical model developed in Part 1 is representative of the steel dowel specimens and is also representative of the FC dowel specimens:
87
8.0. Acknowledgements
This investigation on fibercomposite rods as described herein was conducted at Iowa State University (ISU) through the auspices of the Engineering Research Institute with sponsorship provided by the Iowa Department of Transportation and the Highway Research Board. This work was conducted at the ISU structural Engineering Research Laboratories. The authors wish to thank the sponsors and all those individuals involved in the .coordination of the project at the IDOT, particularly Brian Mcwaters and Vernon Marks for their consultation, time, and coordination with the project. The authors wish to acknowledge and thank the following firms for donation of material as well as for consultation advice during the course of the project: Economy Forms of Des Moines, Iowa; w. G. Block of Des Moines, Iowa; Composite Technologies Corporation of Ames, Iowa; Marshal Vega of Harrison, Arkansas; and Morrison Molded Fiber Glass of Bristol, Virginia. In addition, the authors wish to thank the following individuals: Jerry Mass, Robert Long, Ed Sauter, and Phil catsman.
The work of the several undergraduate assistants (namely Brent Brubaker, Dave Neuberger, and Paul Boring) who spent many hours in preparing the . specimens and collecting the data is gratefully acknowledged along with the help of the structural Engineering Laboratory Supervisor, Mr. Douglas L. Wood.

88
References
1. Proctor, B.A., Oakley, D.R., Litherland, K.L., "Developments in the Assessment and Performance of GRC Over 10 Years", composites, April 1982, pages 173-179.
2. Aindow, A.J., Oakley, D.R., Proctor, B.A., "Comparison of the Weathering Behavior of GRC with Predictions Made from Accelerated Ageing Tests", Cement and Concrete Research. Volume 14, August 1983, pages 271-274.
3. Litherland, K.L., Oakley, D.R., Proctor, B.A., "The Use of Accelerated Ageing Procedures to Predict the Long Term Strength of GRC Composites", Cement and Concrete Research. Volume 11, February 1981, pages 455-466.
4. Majumdar, A.J., Ryder, J.F., "Glass Fibre reinforcement of cement Products", Building Research Station, Ministry of Public Building and Works, Garston Watford, Herts, Glass Technology, Volume 9 No. 3, June 1968, pages 78-84.
5. "Glass Fiber Reinforced concrete", Fiber Reinforced Concrete, Portland cement Association, Skokie, Illinois, 1991, pages 11-21.
6. Oakley, D.R., Litherland, K.L., Proctor, B.A., "The Development of a Method of Predicting the Weathering Behavior of Glass Reinforced Cement composites", Proceedings 2nd International Conference on Durability of Building Materials and components, Gaithersburg, Maryland, USA, September 1981, pages 225-231.
7. Janninck, D.R., Venta, J.G., "An Accelerated Aging Procedure to Predict the Long-Term strength of Poly Vinyl Chloride Coated E-Glass in Cement Composite . Panels", ProceedingsDurability of Glass Fiber Reinforced Concrete Symposium, Holiday Inn Mart Plaza, Chicago, Illinois, November 12-15, 1985, pages 230-238.
8. Bentur, A. and Diamond, s., "Aging and Microstructure of Glass Fiber Cement Composites Reinforced with Different Types of Glass Fibers", Durability of Building Materials, Volume 4.1 pages 201-226.
9. Diamond, Sidney, "The GFRC Durability Problem: Nature, Characteristics, and Test Methods", Proceedings- Durability of Glass fiber Reinforced Concrete Symposium, Holiday Inn Mart Plaza, Chicago, Illinois, November 12-15, 1985, pages 199-209.

89
10. Handbook For The Identification Of Alkali-Silica Reactivity In Highway Structures, Strategic Highway Research Program, National Research Council, 1991.
11. Struble, Leslie, and Diamond, Sidney, "Influence of Cement Alkali Distribution on Expansion Due to Alkali-Silica Reaction", (Alkalies in Concrete), Symposium Sponsored by ASTM Committees C-9 on Concrete and Concrete Aggregates and C-1 on Cement, Los Angeles, California, June 1985, pages 31-45.
12. Kilareski, W.P., "Epoxy Coating for Corrosion Protection of Reinforcement steel", Chloride Corrosion of Steel in Concrete, ASTM STP 629, D.E. Tonini and s.w. Dean, Jr.,Eds., American Society for Testing and Materials, 1977, pages 82-88.
13. Peterson, P.C., "Concrete Bridge Deck Deterioration in Pennsylvania", Chloride Corrosion of Steel in concrete, ASTM STP 629, D. E. Tonini and S. W. Dean, Jr. , Eds. , American Society for Testing and Materials, 1977, pages 61-68.
14. Performance of Concrete: Resistance of Concrete to Sulphate and other Environmental Conditions. A Symposium in Honour of Thorbergur Thorvaldson, E.G. Swenson, Technical Editor, University of Toronto Press., 1968., pages 45-47.
15. Harboe, E.M., "Longtime Studies and Field Experiences with Sulphate Attack", George Verbeck Symposium on Sulfate Resistance of Concrete, American Concrete Institute, Detroit, Michigan, 1982, pages 1-20.
16. DERAKANE Resins, Chemical Resistance and Engineering Guide, The Dow Chemical Company, 1990.
17. Porter, . M. L., Albertson, M.D., Barnes, B.A. , concrete Reinforcement: Progress Report for 1990", University, Engineering Research Institute, Ames,
"Thermoset Iowa State IA., 1990.
18. Porter, M.L., Fish, K.E., Barnes, B.B., "Fiber-Composite Rods as Reinforcing for Concrete Structures", Thermoset and Thermoplastic Composite Reinforcement for the Concrete Industry, Center for Advanced Technology Development, Iowa State University, Ames, IA., January 1992, pages 6-11.
19 EXTREN Fiberglass Structural Shapes, Design Manual, Morrison Molded Fiber Glass Company, 1989.
20. Walrath, D.E., and Adams, D.F., "The Iosipescu Shear Test as Applied to Composite Materials", Experimental Mechanics, March 1983, pages 105-110.
90
21. MacGregor, J.G., Reinforced Concrete: Mechanics and Design. Copyright 1988, Prentice Hall, Englewood Cliffs, New Jersey, pages 52-53.
22. Prestressed concrete Institute: Design Handbook. Third Edition, Copyright 1985, Chicago, Illinois, Part 6, pages 6-8.
23.
24.
Timoshenko, s., "Strength of Materials edition, Robert E. Krieger Publishing.Company, York, 1976.
Part II", 3rd Huntington, New
Timoshenko, S. , and Lessels, Westinghouse Technical Night Pennsylvania, 1925.
J.M., "Applied School Press,
Elasticity", Pittsburgh,
25. Beer, F.P., Johnston, Jr., E.R., Mechanics of Materials, McGraw Hill Book Company, 1981, page 158.
26. American Society for Testing and Materials, Annual Book of ASTM Standards, Volume 8. 02, Plastics (II), Philadelphia Pennsylvania, 1991, pages 328-329.
27. Weather of U.S. Cities, Third edition, Volume 1, 1987, page 386.
28. The Weather Almanac, Sixth Edition, 1992, page 542.
29. American Society for Testing and Materials, Annual Book of ASTM Standards, Volume 4.02, Philadelphia Pennsylvania, 1991, pages 266-269.
91
Appendix A
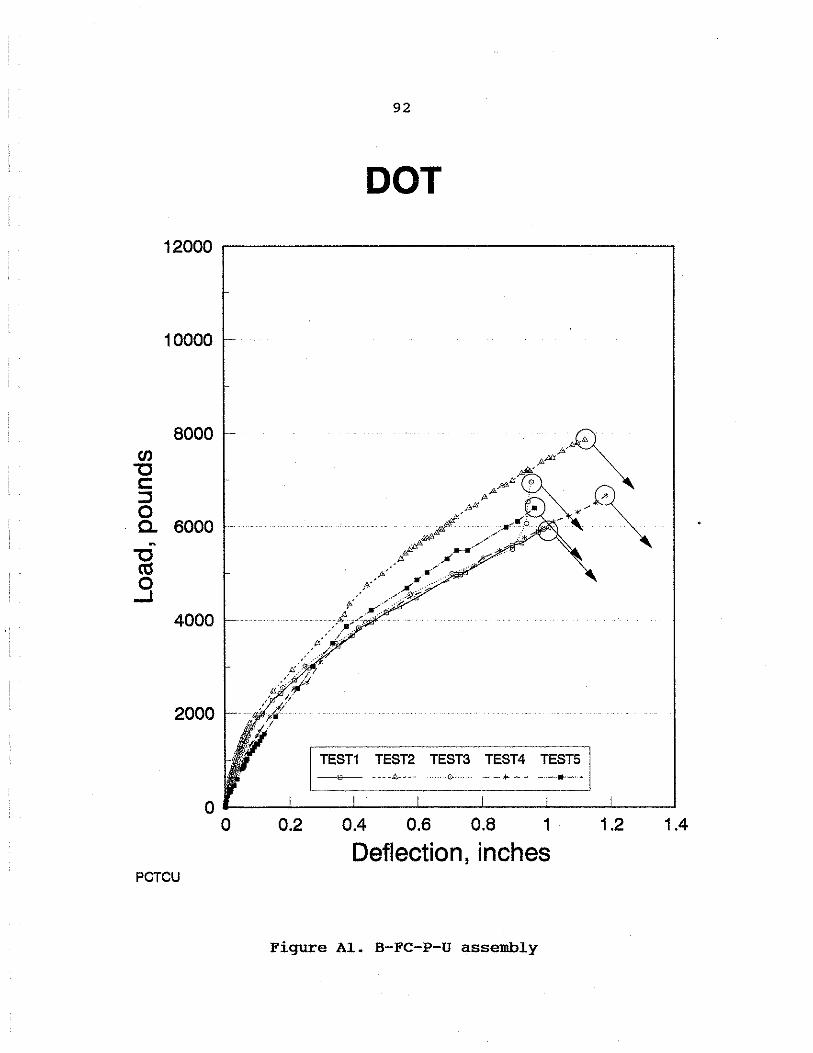
(JJ
'"C c: ::I 0 0. ~
'"C ca _g
10000
8000
6000
4000
2000
""
92
DOT
f"rEsr1 resT2 TEsTa TEST4 TEsTs ~~---=~=-~ -~---··-··•"-··-
0 ---~~~~~~~~~~~~~~~~~~~~ 0 0.2 0.4 0.6 0.8 1 1 .2 1 .4
Deflection, inches PCT CU
Figure Al. B-FC-P-U assembly

93
DOT
10000
8000 (/)
"'O c: :J 0 a. ·eooo -"'O ca .9
4000 -
2000
ITESr1 TEST2 TESTS TEST4 TESTil L~ ----8---- ........ o ....... --~-- -··-··· .. -··J
0 -----~~'--~--''--~--'~~--'~~--'-~~-'-~~--' 0 0.2 0.4 0.6 0.8 1 1.2 1.4
Deflection, inches PCT CW
Figure A2. B-FC-P-W assembly
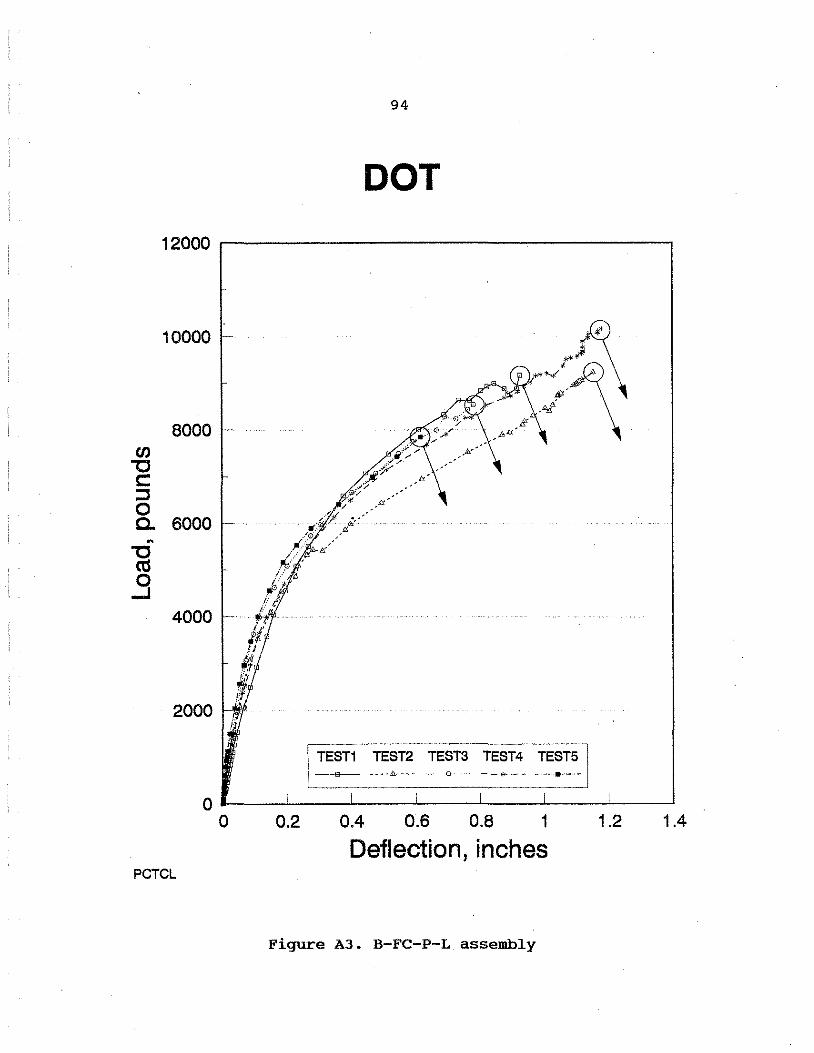
94
DOT
10000 . *' .,.)
"' ....... ,"'ea:
6000 e ,A-'"'
en "'O c: ::J 0 c.. 6000 -"'O ctS
.9 4000
2000
~--------·------,
TEST1 TEST2 TESTS TEST4 TESTS
0 11-~~"--~~'--~---''--~---'~~--l.~~-.J..~--' 0 0.2 0.4 0.6 0.6 1 1.2 1.4
Deflection, inches PCT CL
Figure A3. B-FC-P-L assembly
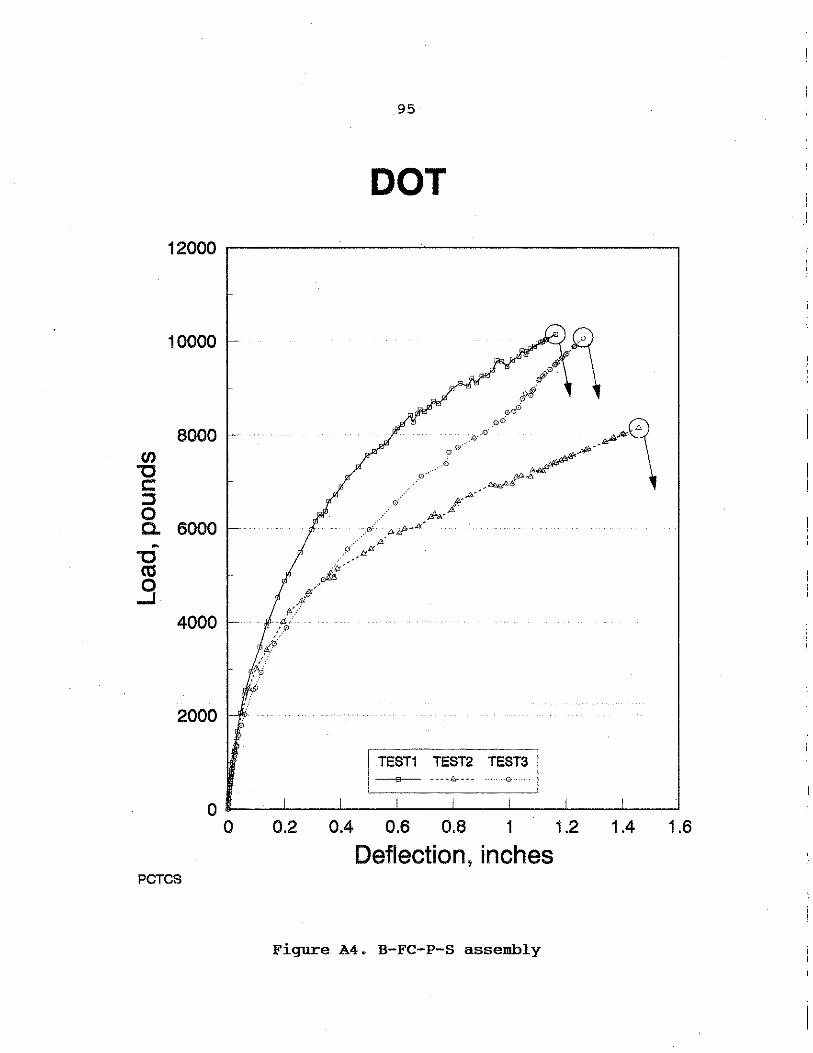
95
DOT
12000 ~----------------~
10000
8000 en
'"C c: :J 0 a. 6000 ~
'"C ctS
.9 4000
2000
TEST1 TEST2 TEST3
oa-~~~~~~~~~~~~~~~~~~~
0 0.2 0.4 0.6 0.8 1 1.2 1.4 1.6
Deflection, inches PCT CS
Figure A4. B-FC-P-S assembly
I
I
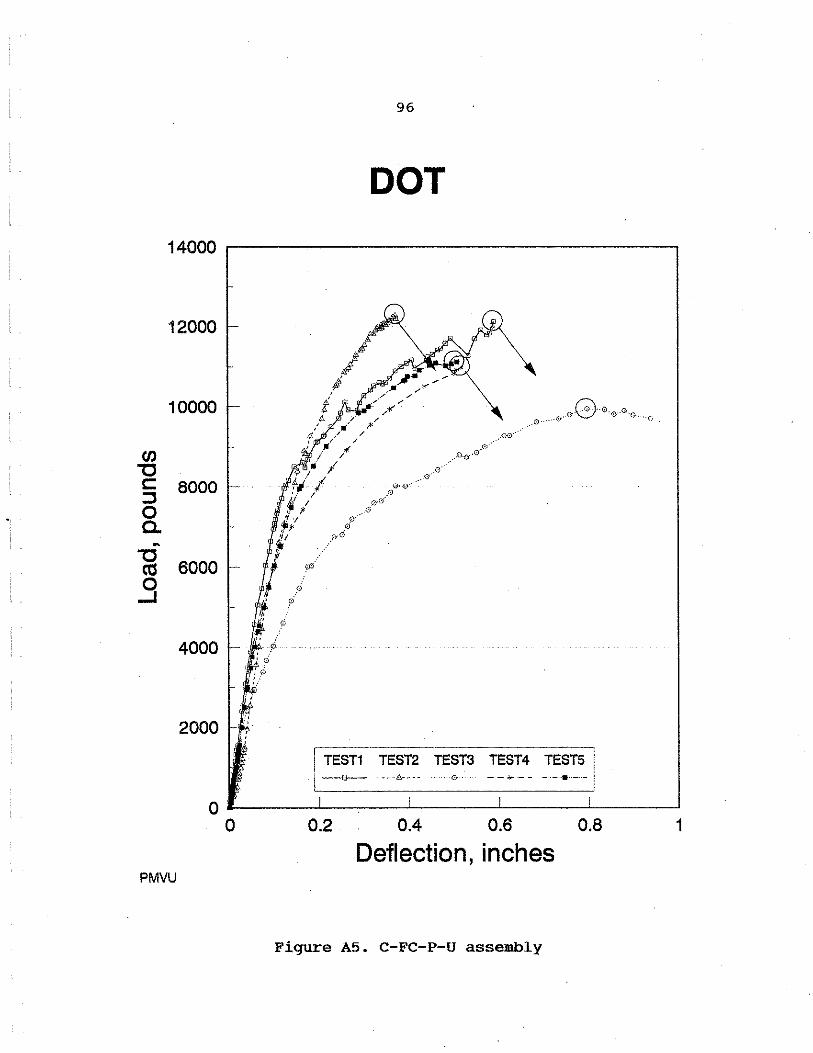
(/) "'O c: ::::J 0 0. -"'O ca 0
....I
14000
12000
10000
8000
6000
4000
2000
96
DOT
I TEST1 . TEST2 TEST3
I TEST4 TESTS I --;..-- -··-··•··-··-1
0 ,.._~~~-'-~~~~'---~~~~~~~~'--~~~~ 0 0.2 0.4 0.6 0.8 1
Deflection, inches PMVU
Figure A5. C-FC-P-U assembly
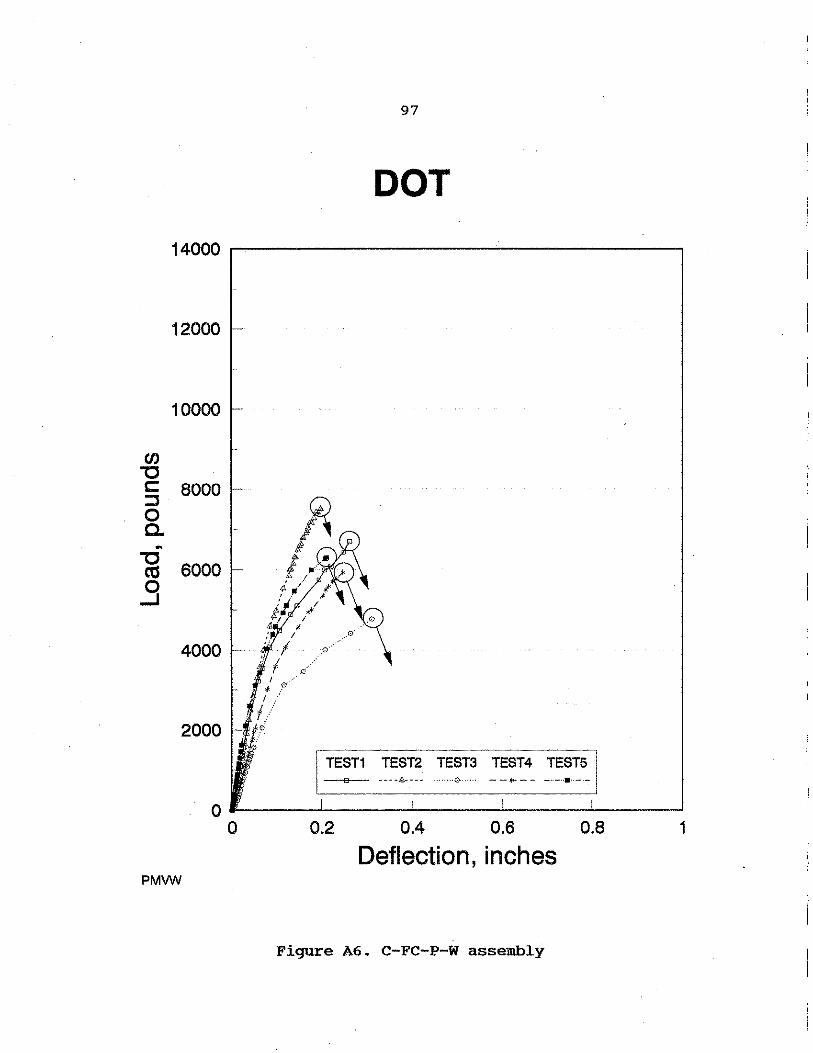
97
DOT
12000
10000
en "C c:: 8000 ::J 0 0.
ft
"C 6000 ca
.9
4000
TEST1 TEST2 TEST3 TEST4 TESTS
0 --~~--'~~~-'-~~~-'--~~~-'--~~---' 0 0.2 0.4 0.6 0.8 1
Deflection, inches PMVW
Figure A6. C-FC-P-W assembly
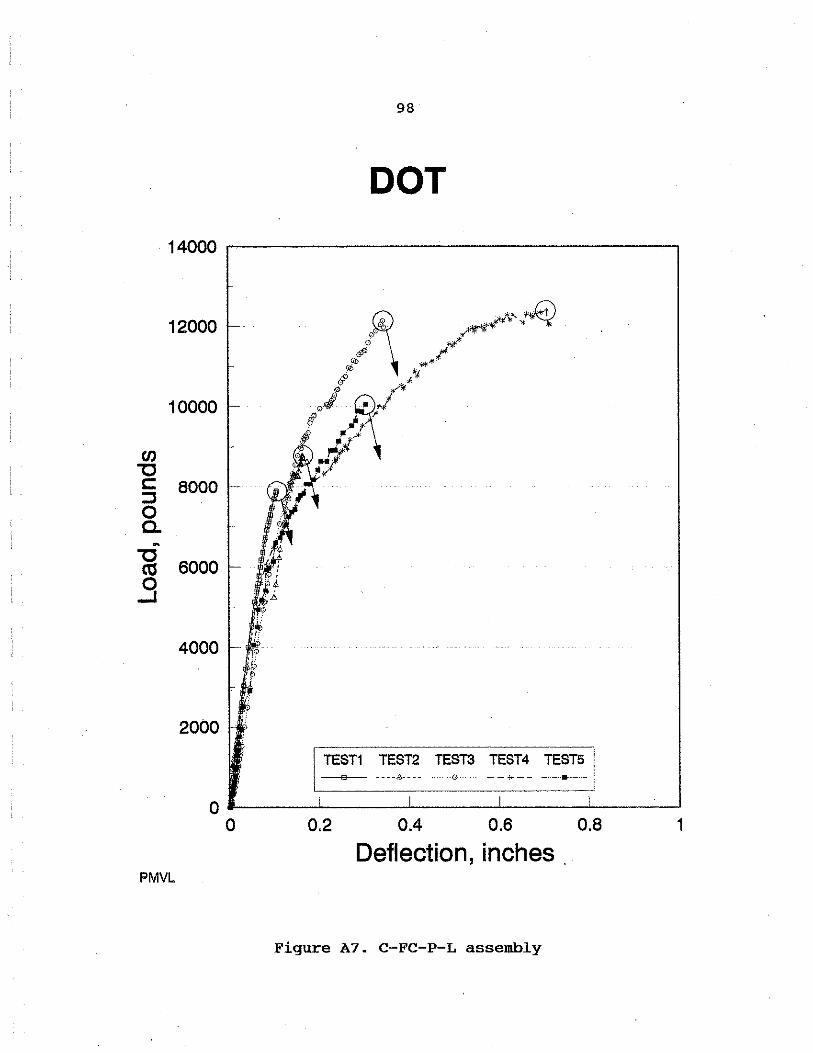
98
DOT
12000
10000
en "O c: 8000
::::J 0 a. -"O
6000 «S
.9
4000
2000
0 .,_~~~~~~~~~~~~~~~~~~~ 0 0.2 0.4 0.6 0.8 1
Deflection, inches . PMVL
Figure A7. C-FC-P-L assembly
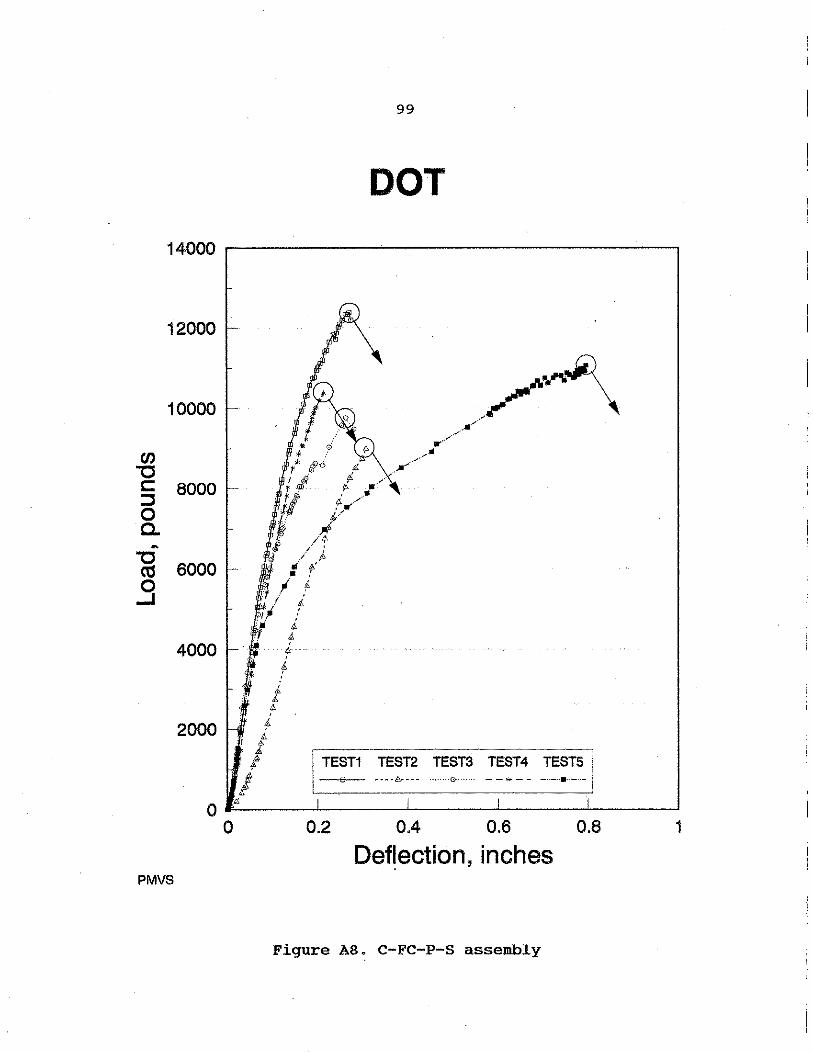
(/)
"C c:: :::::s 0 c. -"C ca .9
12000
10000
6000 -
6000
4000
2000
& l A
4' l
'I I
99
DOT
I TEST1 ____ :_~-~-:~_-_r_E_~_rs_!_~-~T-_4 ____ r_·~--~-~s~·-0 ~~~~~-L.~~-_J_~-~--l~~~.......J~~~--'
0 0.2 OA 0.6 OB 1
Def!ection, inches PMVS
Figure A8'. C-FC-P-S assembly

25000
20000
en "'O 15000 c: ::J 0 a.
ft
"'O ca 0 10000
....I
1 '
5000 - '
100
DOT
0
6
TEST1 TEST2 TEST3 TEST4 TEST51 --€l-- ----£;---- ········0"····· - - - - -"-··•··-··- I
0 --~~..J.-~~-'-~~-'-~~--'~~~...__~~-'--~~~ 0
DFCU
0.1 0.2 0.3 0.4 0.5
Deflection, inches
Figure A9. A-Fc-o-u assembly
0.6 0.7
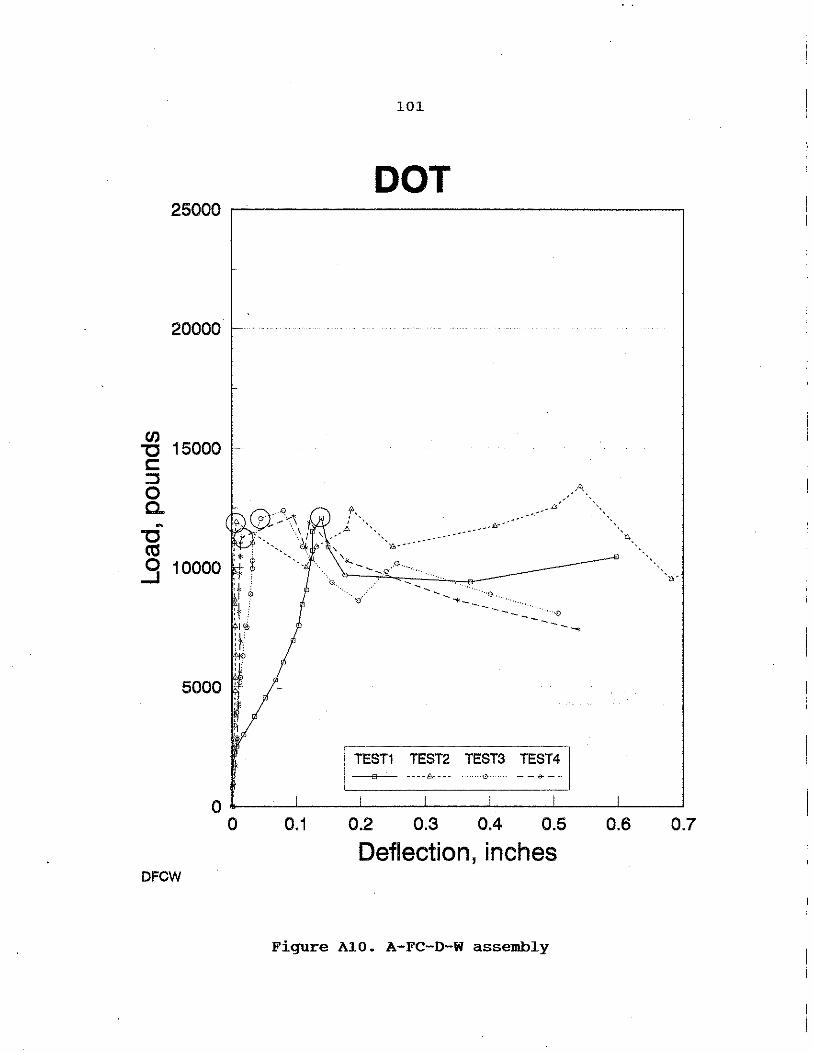
20000
~ 15000 c:: :::s 0 c.. ~
"C co ..9 10000
101
DOT
.Q. •• .._ -..0
0 .,___~--'~~-'-~~-'-~~-"-~~'---~--'~~--' 0
DFCW
0.1 0.2 0.3 0.4 0.5
Deflection, inches
Figure AlO. A-FC-D-W assembly
0.6 0.7
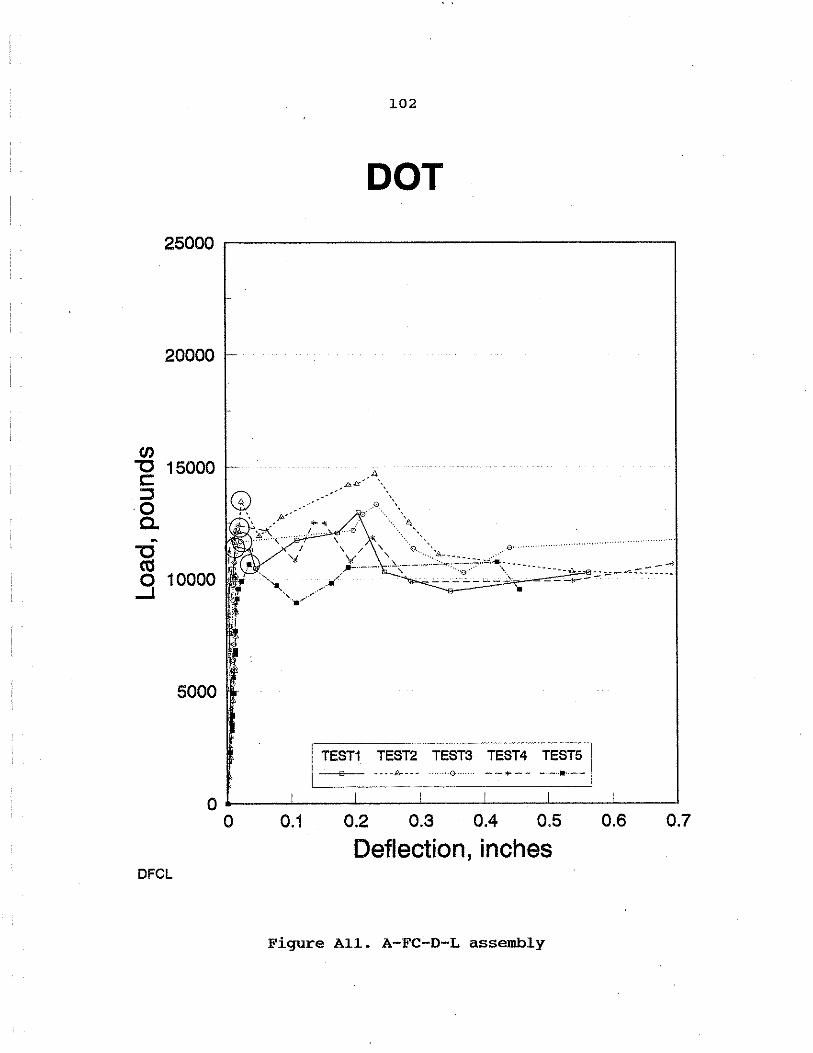
102
DOT
20000
CJ)
..... e)
~=~\· :\'\ '• . 0···"···········->········'"'" ... ······· ··············· ....
j_/_ - ~~,-: ~·:::.:::,:; "'"'~;. ---. ------ _,, __ :.; ~ -~,;:. :-. ::.:-'. )ti/ --- ___ .:::. -----;.--
"'C 15000 c: :::J Q 0 fo• a. .... '
- ?\, ......... "'C I
ca 'I
.9 10000 ,.
•'
_.4, ,A& '',
.. -'>1. "., .,,_
5000
0 --~~'--~----'~~--'-~~~~~-'-~~--'--~~~ 0 0.1 0.2 0.3 OA 0.5 0.6 0.7
Deflection, inches DFCL
Figure All. A-FC-D-L assembly
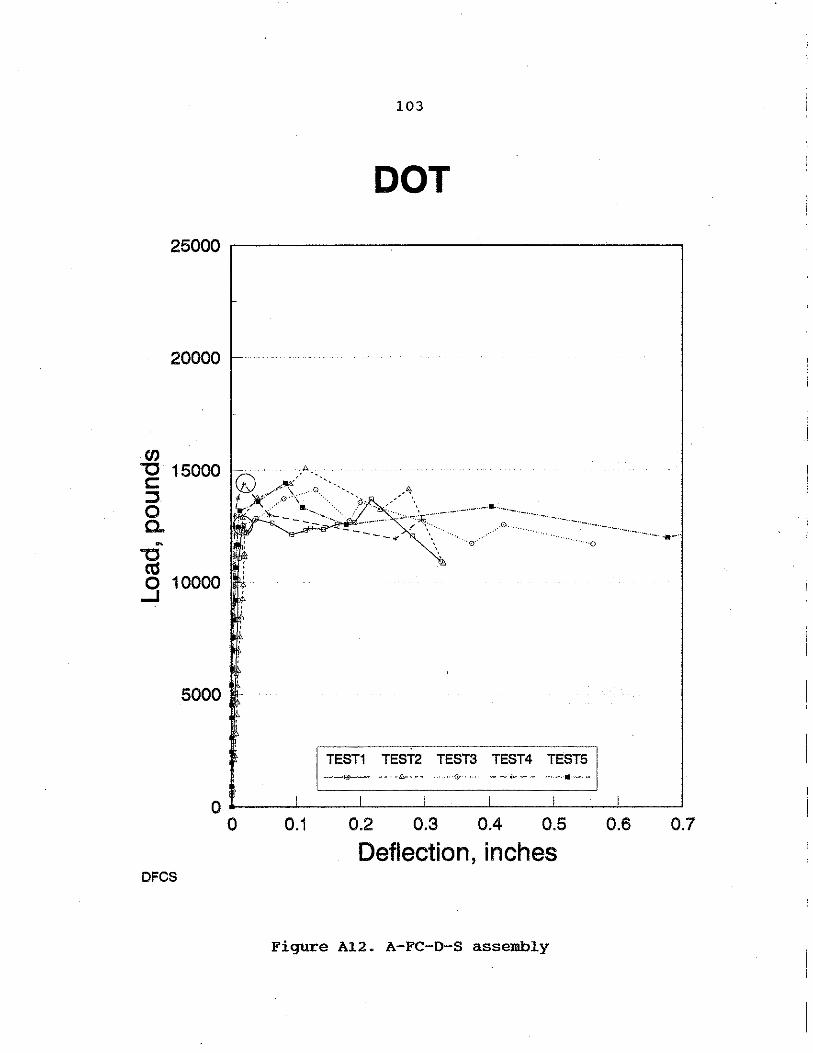
103
DOT
20000
(/)
"'C c: 15000 :J 0 c. -"'C Ctl 0 10000
...J
5000
TEST1 TEST2 TEST3 TEST4 TESTS I --s-- -~~~8---~ ....... 0 .... " - - ... - - -··-··•"-.. -1
0 --~~~~~~~~~~~~~~~~~~ 0
DFCS
0.1 0.2 0.3 0.4 0.5
Deflection, inches
Figure Al2. A-FC-D-S assembly
0.6 0.7
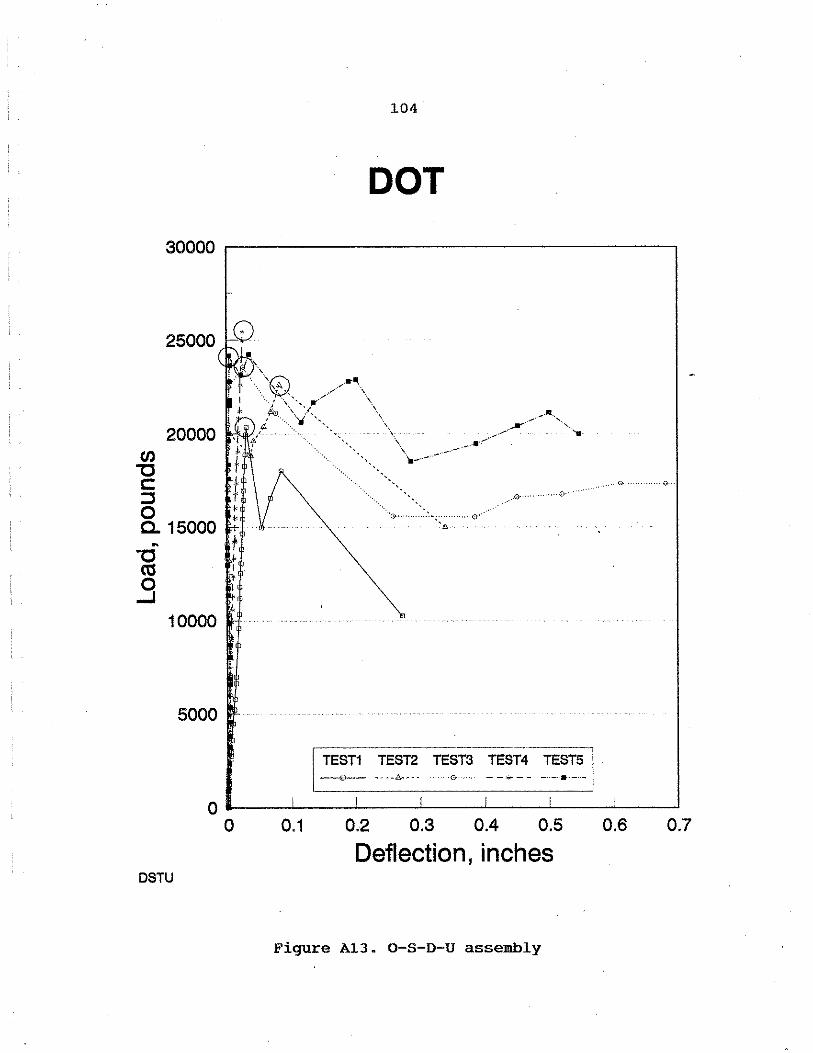
(()
"C c: :J
25000
20000
0 * c.. 15000 * ft
~ ..9
10000
5000
't t
"
104
DOT
. &·········
··········0·· ··--·····~·--··· ...... 0····"··· .. ··
',"
0 · ..... ""G··· , .. 0············· ....
TEST1 TEST2 TEST3 TEST4 TESTS
0 --~~"'--~~'--~--'~~~~~~~~~~~~ 0
DSTU
0.1 0.2 0.3 0.4 0.5
Deflection, inches
Figure AlJ. 0-S-D-U assembly
0.6 0.7

en '"C c:: ::J 0
25000
20000
a. 15000 ~
-g ..9
4' ' • . : •
10000 ?
5000
··········0:
/
...... ;..~
105
DOT
\ \ \
\
' \ \
'\. \ .,
\
TEST1 _r:~:~. TE~T3 !=~~4- -~ ~-----
0 --~~~~~~~~~~~~~~~~~~~~~ 0
DSTW
0.1 0.2 0.3 0.4 0.5
Deflection, inches
Figure A14. 0-S-D-W assembly
0.6
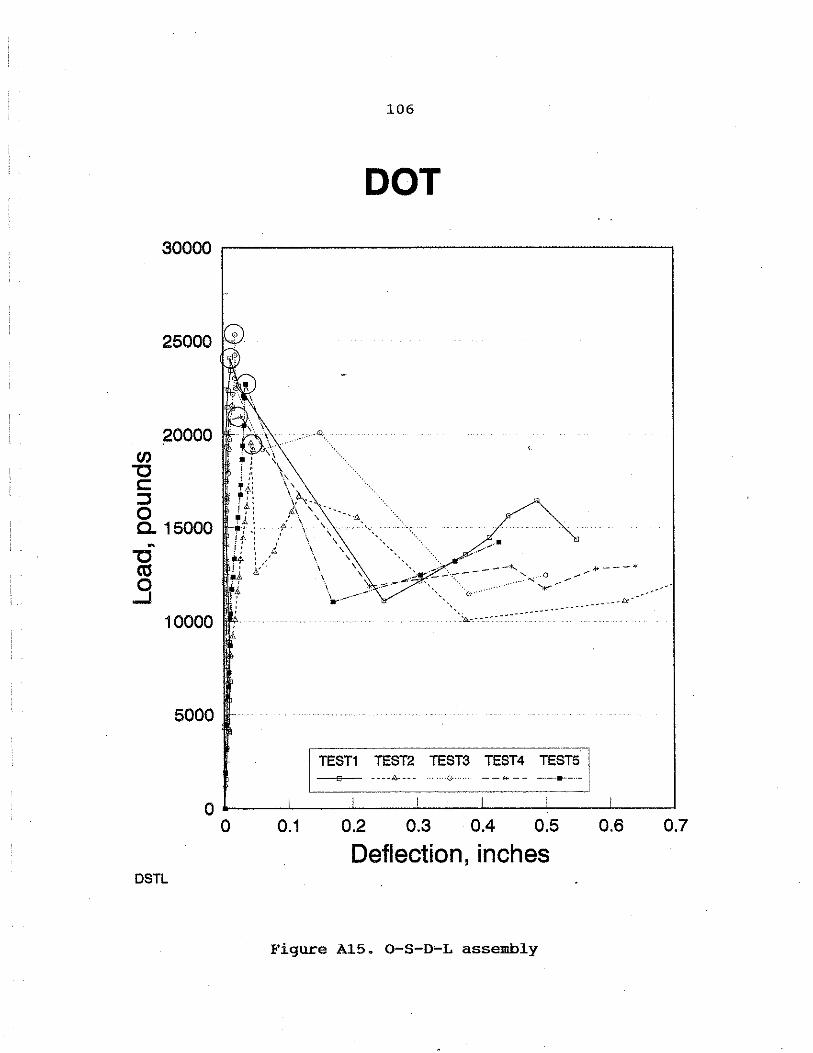
(/)
'"C c: ::s 0
25000 CV
20000
c. 15000 -'"C C'CS
.9 10000
5000
106
DOT
_...;1o----*
~EST1 _:~~:~- TE:T3 !=:~4- _T=~~S--0 j,.-~~-'--~~-'-~~-'-1~~--'~~~'--~~-'--~~~
0 0.1 0.2 0.3 0.4 0.5 0.6 0.7
Deflection, inches DSTL
Figure A15. o-s-o~L assembly
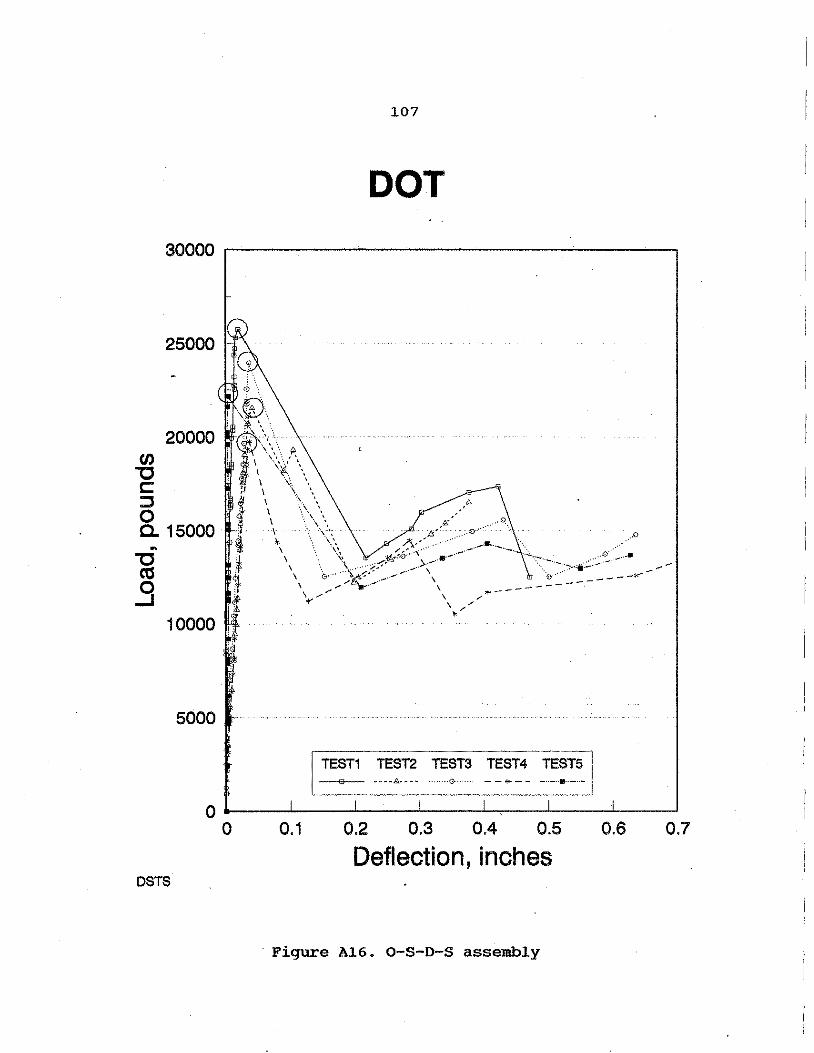
107
DOT
30000 .----------------'----~
"' '"C c:: :J 0
20000
a. 15000 --g .9
10000
5000
... 0
0 ---~~"--~~~~~~~~---.,.-~~~~~~~~ 0
DSTS
0.1 0.2 0.3 0.4 0.5
Deflection, inches
· Figure A16. o-s-o-s assembly
0.6 0.7
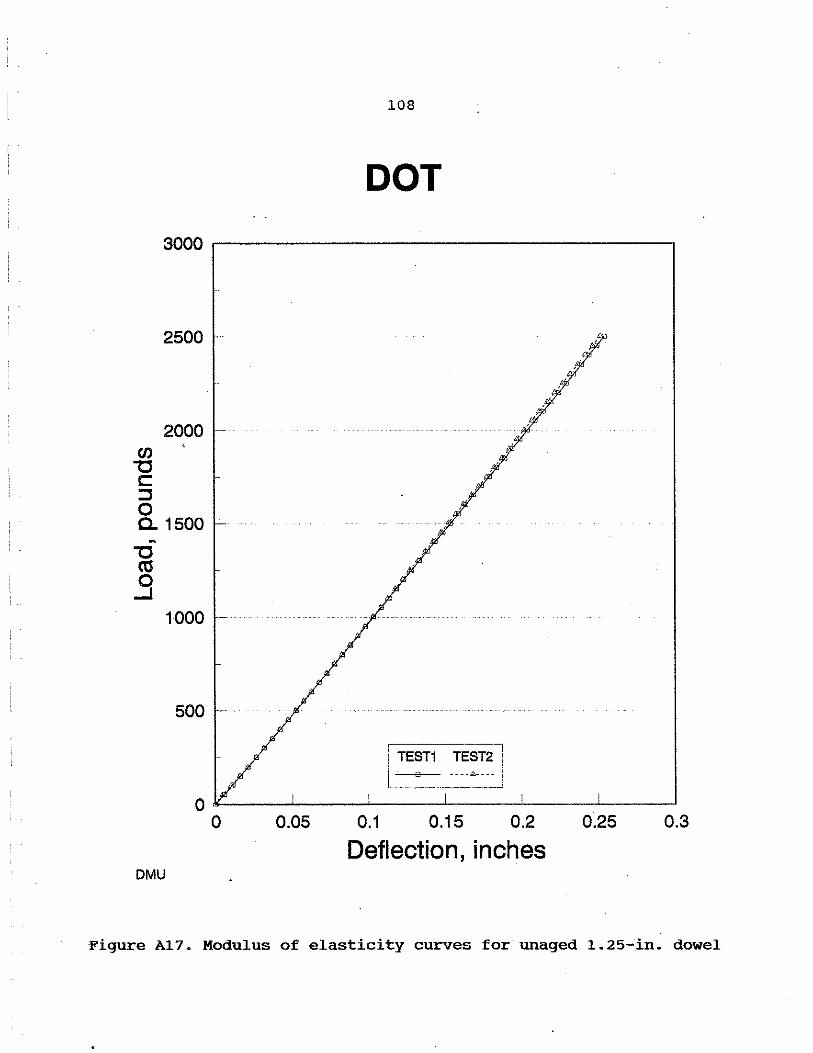
en "C c: ::I 0
2500
2000
c. 1500
1000
500
108
DOT
0 o:--~~-'-~~~'---~~-'-~~--''--~~-'-~~--' 0 0.05 0.1 0.15 0.2 0.25 0.3
Deflection, inches DMU
Figure A17. Modulus of elasticity curves for unaged 1.25-in. dowel
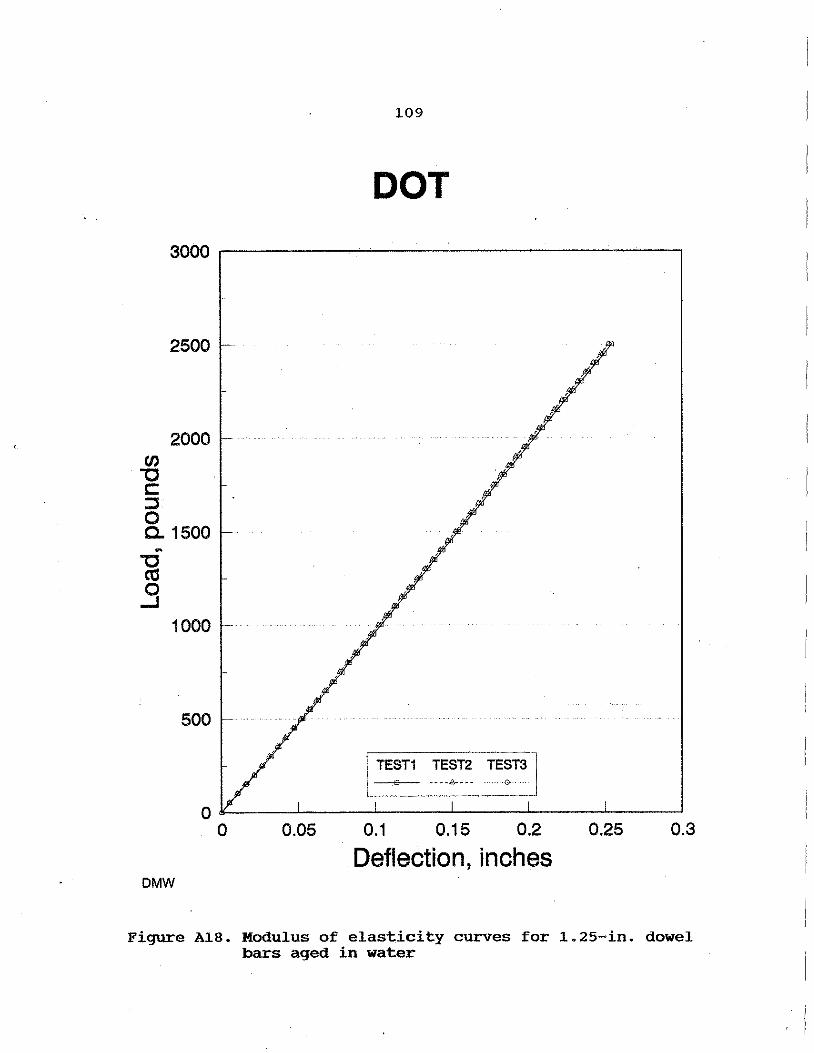
CJ)
"O c: :::::s 0
2500
2000
a. 1500
1000
500
109
DOT
0 !l'-~~-'-~~-'-~~~.1.-~~....J_~~-'-~~--' 0 0.05 0.1 0.15 0.2 0.25 0.3
Deflection, inches DMW
Figure Al8. Modulus of elasticity curves for 1.25-in. dowel bars aged in water
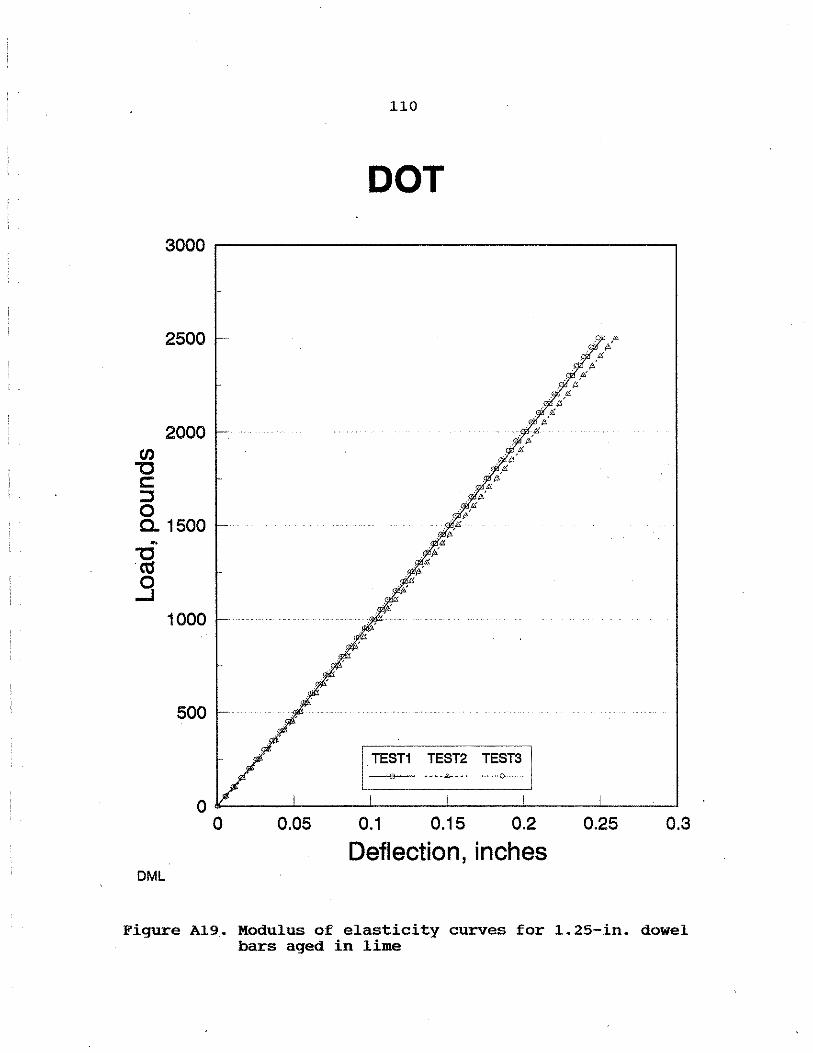
en "'O c: ::::J 0
2500 "
2000
0. 1500 -"'O ca .9
1000
500
110
DOT
TEST1 TEST2 TESTS
0 lt'--~~~~~~'--~~-'-~~~'--~~-'-~--'--' 0 0.05 0.1 0.15 0.2 0.25 0.3
Deflection, inches DML
Figure A19. Modulus of elasticity curves for 1.25-in. dowel bars aged in lime

(JJ "O c:: :l 0
2500 -
2000
c.. 1500 ~
-g .9
1000
500
111
DOT
TEST1 TEST2 TEST3
0 ""-~~-'-~~--'-~~~-'--~~-'-~~--'-~~---' 0 0.05 0.1 0.15 0.2 0.25 0.3
Deflection, inches OMS
Figure A20. Modulus of elasticity curves for 1.25-in. dowel bars aged in salt
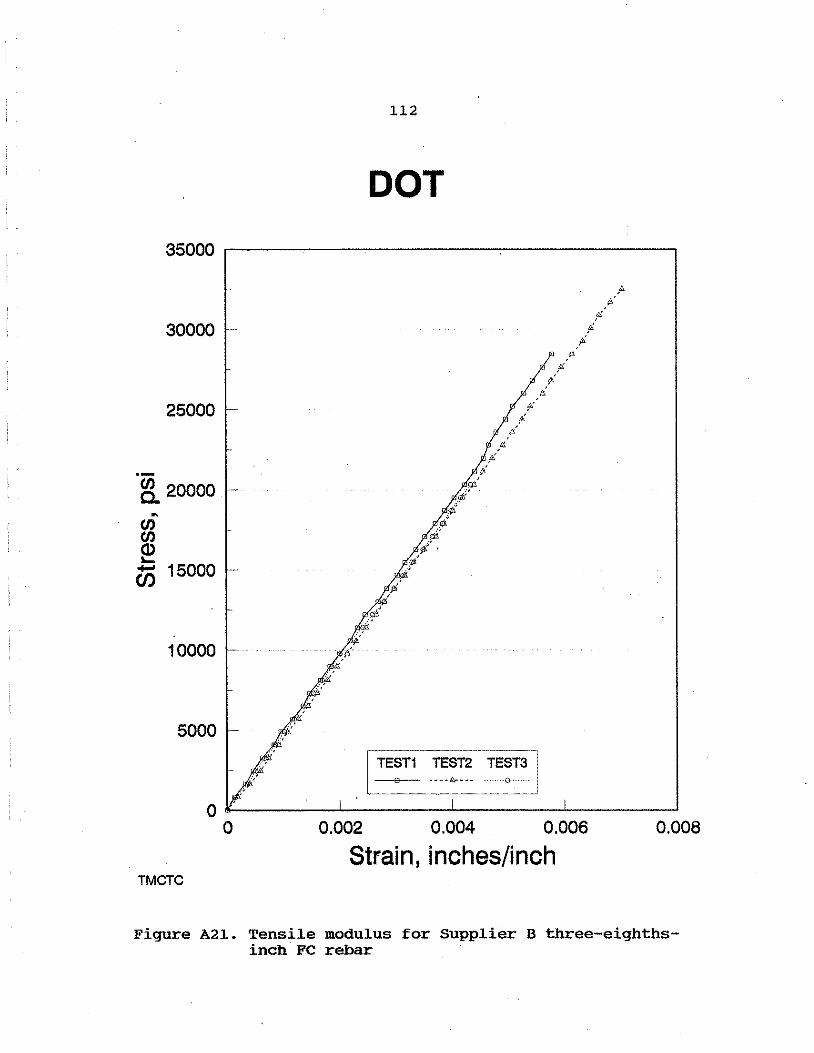
30000 -
25000
·-~ 20000 ~
en en ~ Ci5 15000
10000
5000
112
DOT
"'' <%' ,.,<tt.i¢.'
,/P.;{5,
Ji~ @'
•• i.' 1'
" ,/ i
,,, " i
TEST1 TEST2 TEST3
"' t:' ,11::.'
d
i a'
" i ,i
0 !'---~~~~-'-~~~~-'-~~~~~-'--~~~~~ 0 0.002 0.004 0.006 0.008
Strain, inches/inch TMCTC
Figure A21. Tensile modulus for Supplier B three-eighthsinch FC rebar
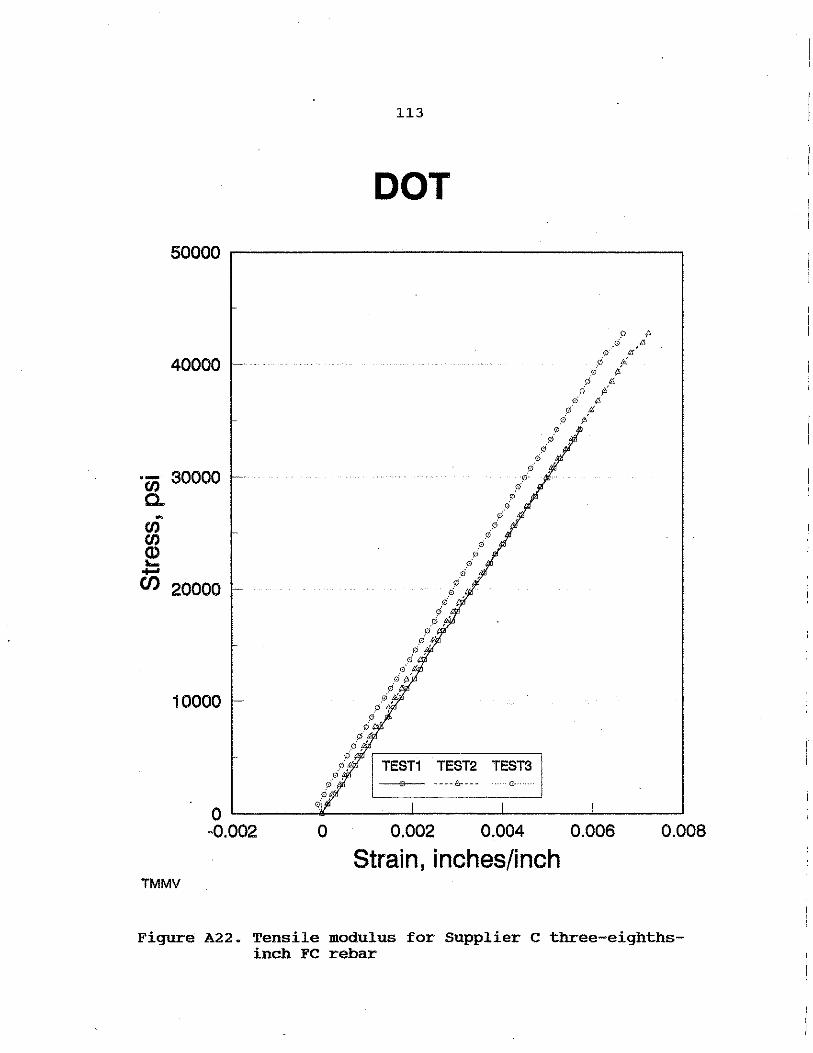
40000
·- 30000
"' c.. ~
"' ~ -en 20000
10000
113
DOT
0 t;J !);'
i:r) ' vf ti
f>° 1/ 0
~T2 TEST31 ~~--- ....... Q········
p ~ 0 4
f:/ ,a' 0 &
v/ i .d ,!J.
,0 {Si 0 ti
p" t{
.0 ~: 0
-;;:;
0 '--~~--1!'.--~~--'~~~--'-~~~-L~~~-' -0.002 0 0.002 0.004 0.006 0.008
Strain, inches/inch TMMV
Figure A22. Tensile modulus for Supplier C three-eighthsinch FC rebar
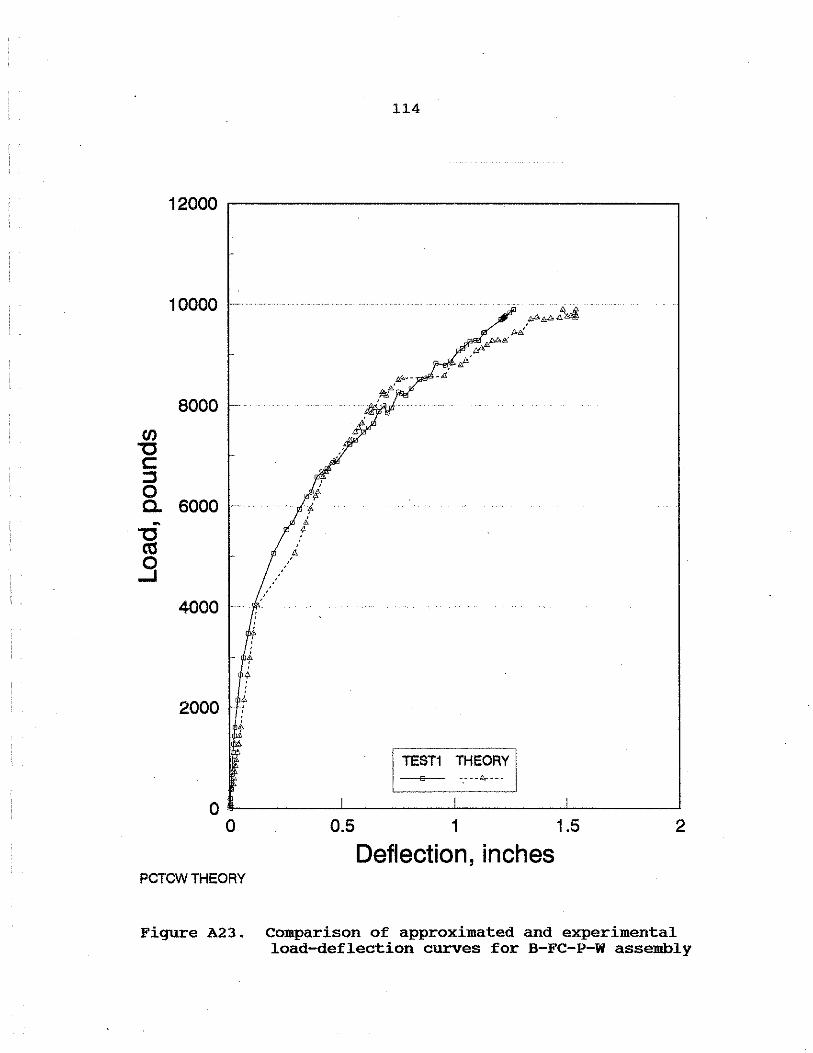
114
12000 ~----------------~
10000
8000 -
en "C c: :::J 0 ~ a. 6000 $ - f.
"C ~
ca /·
.9 4000
t ?
2000 ~
"
0 !!!-~~~~---'-~~~~~-'-~~~~--'~~~~~-' 0 0.5 1 1.5 2
Deflection, inches PCTCW THEORY
Figure A23. Comparison of approximated and experimental load-deflection curves for B-FC-P-W assembly
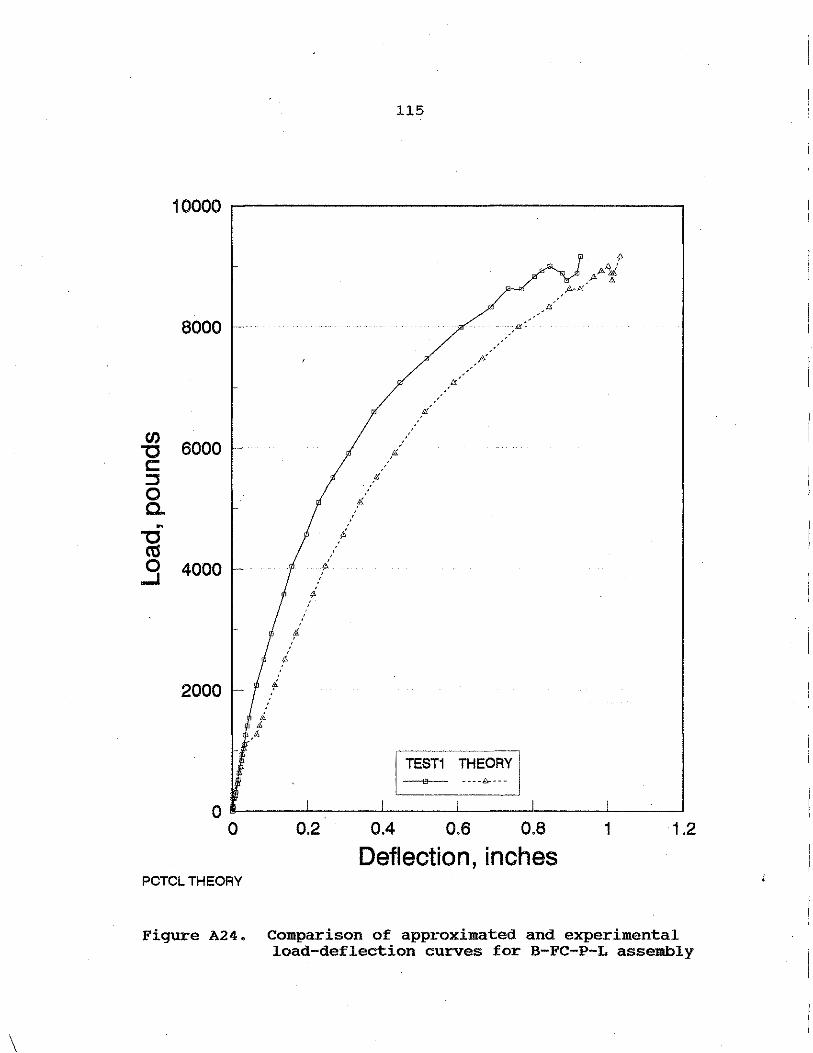
\
115
10000 ~----------------~
8000
~ 6000 c: :::J 0 a. ~
-g .9 4000
2000
f,
f,
,'rt..
. :It
f..,
,c:'
0 --~~~~~~~~~~~~~~~~~~~~~ o 0.2 0.4 0.6 0.8 1 1.2
Deflection, inches PCTCLTHEORY
Figure A24. Comparison of approximated and experimental load-deflection curves for B-FC-P-L assembly
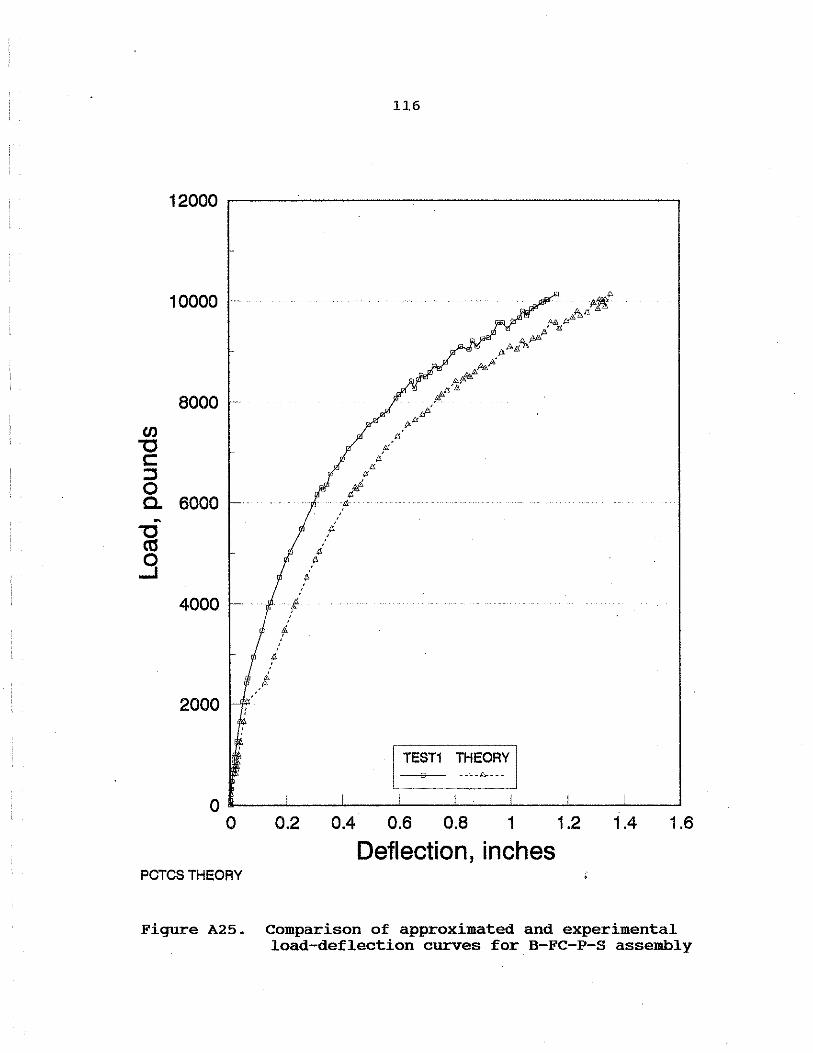
116
10000
8000 (/)
"'O c: :J 0 c. 6000 ~
"'O ca .3
4000
2000
TEST1 THEORY --'--/;;,----
0 ,.__~~~~~~~~~~~~~~~~~~~~~ 0 0.2 0.4 0.6 0.8 1 1.2 1.4 1.6
Deflection, inches PCTCS THEORY
Figure A25. Comparison of approximated and experimental load-deflection curves for B-FC-P-S assembly
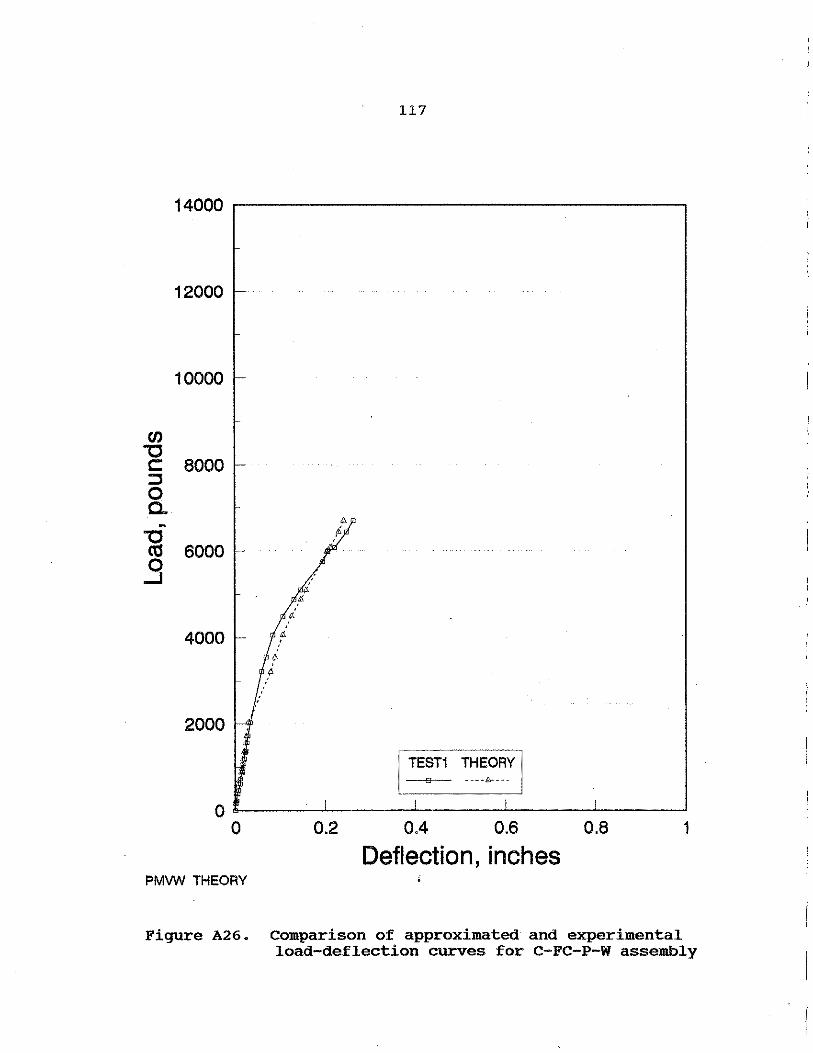
117
12000
10000
(J) "C c: 8000 ::J 0 a.
A ~
"C f,
ca 6000 .9
~
~
4000
2000
TEST1 THEORY
-----~
0 &-------'------J..----'-----..1..-----' 0 Q2 OA OB 0.8 1
Deflection, inches PMVW THEORY
Figure A26. Comparison of approximated and experimental load-deflection curves for C-FC-P-W assembly

118
12000
10000 -
en "C c: 8000 ::::s 0 c.. -. "C 2 ctS 6000 ;. ..
.9 .. ii t + .
4000 - ';.
~
2000
TEST1 THEORY ----&----
0 --~~~--'-~~~--"-~~~---'~~~~-"--~~~~ 0 0.2 0.4 0.6 0.8 1
Deflection, inches PMVL THEORY ;
Figure A27. Comparison of approximated and experimental load-deflection curves for C-FC-P-L assembly
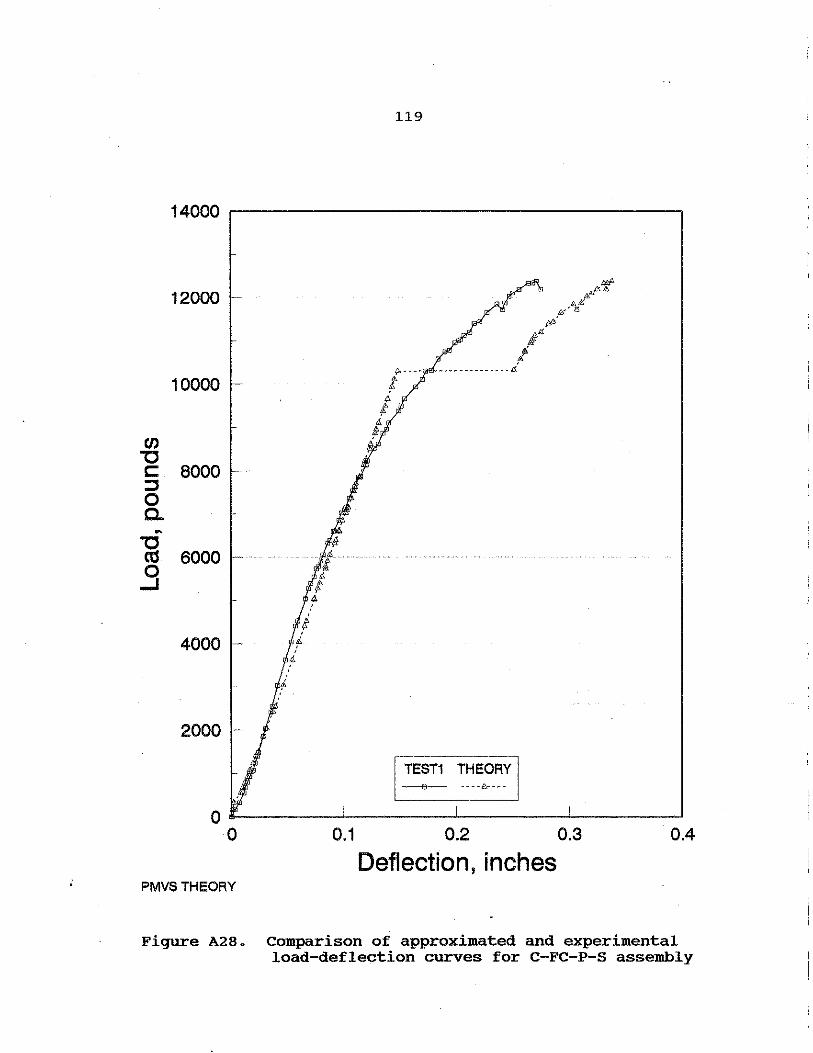
en "C c: ::::J 0 a. -~ .9
12000
10000
8000
6000
4000
2000 -
119
TEST1 THEORY ----/&----
0 ,._~~~~-'--~~~~-'-~~~~~.!..-~~~~~ 0 0.1 0.2 0.3 0.4
Deflection, inches PMVSTHEORY
Figure A28. comparison of approximated and experimental load-deflection curves for C-FC-P-S assembly