Thermorheological properties of LLDPE/LDPE blends · ORIGINAL CONTRIBUTION Thermorheological...
13
ORIGINAL CONTRIBUTION Thermorheological properties of LLDPE/LDPE blends O. Delgadillo-Velázquez & S. G. Hatzikiriakos & M. Sentmanat Received: 9 November 2006 / Accepted: 2 April 2007 / Published online: 7 May 2007 # Springer-Verlag 2007 Abstract The thermorheological behavior of a number of linear low-density polyethylene and low-density polyethyl- ene (LLDPE/LDPE) blends was studied with emphasis on the effects of long chain branching. A Ziegler–Natta, LLDPE (LL3001.32) was blended with four LDPEs having distinctly different molecular weights. The weight fractions of the LDPEs used in the blends were 1, 5, 10, 20, 50, and 75%. Differential scanning calorimetry (DSC) analysis has shown that all blends exhibited more than one crystal type. At high LDPE weight fractions, apart from the two distinct peaks of the individual components, a third peak appears which indicates the existence of a third phase that is created from the co-crystallization of the two components. The linear viscoelastic characterization was performed, and master- curves at 150 °C were constructed for all blends to check miscibility. In addition, Van Gurp Palmen, zero-shear viscos- ity vs composition, Cole–Cole, and the weighted relaxation spectra plots were constructed to check the thermorheolog- ical behavior of all blends. In general, good agreement is found among these various methods. The elongational behavior of the blends was studied using a uniaxial exten- sional rheometer, the SER universal testing platform from Xpansion Instruments. The blends exhibit strain-hardening behavior at high rates of deformation even at LDPE concentrations as low as 1%, which suggests the strong effect of branching added by the LDPE component. Keywords Activation energy . PE Blend . Block copolymer . Mastercurve . Phase separation . Polymer blend Introduction The thermodynamic behavior of linear and branched polyethylene (BPE) blends using rheological methods has been the subject of many studies (Yamaguchi and Abe 1999; Lee and Denn 2000; Liu et al. 2002; Ho et al. 2002; Hussein et al. 2003; Hussein and Williams 2004a, b; Fang et al. 2005). It has been reported that the thermorheological and processing properties of the blend are largely deter- mined by molecular parameters, which include: (1) long chain branching content (LCB), which is the number of long branches, typically branches which have a number of carbon atoms more than 13 (Wagner et al. 2004; Kissin 2005), (2) compositional distribution (CD), which is the number and length of long chain branches for a given LCB macromolecule, or the amount and type of comonomer in the case of LLDPE (Gabriel and Münstedt 2003; Hussein and Williams 2004b; Fang et al. 2005; Kissin 2005), (3) molecular weight, M w (Hussein and Williams 2004b; Gabriel and Lilge 2006), and (4) molecular weight distribution (MWD; Dealy and Wissbrun 1990). Most studies agree that linear low-density polyethylene and low-density polyethylene (LLDPE/LDPE) are miscible blends at low LDPE contents, which become immiscible at higher LDPE (Lee and Denn 2000; Ho et al. 2002). Hexene comonomer promotes immiscibility (Hussein et al. 2003; Hussein and Williams 2004b), whereas octene comonomer promotes miscibility (Fang et al. 2005). In addition, low molecular weight LLDPEs promote miscibility better than high M w ones (Hussein and Williams 2004a). In a recent review, Zhao and Choi (2006) have reported that LLDPE/ Rheol Acta (2008) 47:19–31 DOI 10.1007/s00397-007-0193-8 O. Delgadillo-Velázquez : S. G. Hatzikiriakos (*) Department of Chemical and Biological Engineering, The University of British Columbia, Vancouver, BC, Canada e-mail: [email protected] M. Sentmanat Xpansion Instruments, Tallmadge, OH, USA
-
Upload
trinhxuyen -
Category
Documents
-
view
227 -
download
1
Transcript of Thermorheological properties of LLDPE/LDPE blends · ORIGINAL CONTRIBUTION Thermorheological...

ORIGINAL CONTRIBUTION
Thermorheological properties of LLDPE/LDPE blends
O. Delgadillo-Velázquez & S. G. Hatzikiriakos &
M. Sentmanat
Received: 9 November 2006 /Accepted: 2 April 2007 / Published online: 7 May 2007# Springer-Verlag 2007
Abstract The thermorheological behavior of a number oflinear low-density polyethylene and low-density polyethyl-ene (LLDPE/LDPE) blends was studied with emphasis onthe effects of long chain branching. A Ziegler–Natta, LLDPE(LL3001.32) was blended with four LDPEs having distinctlydifferent molecular weights. The weight fractions of theLDPEs used in the blends were 1, 5, 10, 20, 50, and 75%.Differential scanning calorimetry (DSC) analysis has shownthat all blends exhibited more than one crystal type. At highLDPE weight fractions, apart from the two distinct peaks ofthe individual components, a third peak appears whichindicates the existence of a third phase that is created fromthe co-crystallization of the two components. The linearviscoelastic characterization was performed, and master-curves at 150 °C were constructed for all blends to checkmiscibility. In addition, Van Gurp Palmen, zero-shear viscos-ity vs composition, Cole–Cole, and the weighted relaxationspectra plots were constructed to check the thermorheolog-ical behavior of all blends. In general, good agreement isfound among these various methods. The elongationalbehavior of the blends was studied using a uniaxial exten-sional rheometer, the SER universal testing platform fromXpansion Instruments. The blends exhibit strain-hardeningbehavior at high rates of deformation even at LDPEconcentrations as low as 1%, which suggests the strongeffect of branching added by the LDPE component.
Keywords Activationenergy . PEBlend . Block copolymer .
Mastercurve . Phase separation . Polymer blend
Introduction
The thermodynamic behavior of linear and branchedpolyethylene (BPE) blends using rheological methods hasbeen the subject of many studies (Yamaguchi and Abe1999; Lee and Denn 2000; Liu et al. 2002; Ho et al. 2002;Hussein et al. 2003; Hussein and Williams 2004a, b; Fanget al. 2005). It has been reported that the thermorheologicaland processing properties of the blend are largely deter-mined by molecular parameters, which include: (1) longchain branching content (LCB), which is the number oflong branches, typically branches which have a number ofcarbon atoms more than 13 (Wagner et al. 2004; Kissin2005), (2) compositional distribution (CD), which is thenumber and length of long chain branches for a given LCBmacromolecule, or the amount and type of comonomer inthe case of LLDPE (Gabriel and Münstedt 2003; Husseinand Williams 2004b; Fang et al. 2005; Kissin 2005), (3)molecular weight,Mw (Hussein and Williams 2004b; Gabrieland Lilge 2006), and (4) molecular weight distribution(MWD; Dealy and Wissbrun 1990).
Most studies agree that linear low-density polyethyleneand low-density polyethylene (LLDPE/LDPE) are miscibleblends at low LDPE contents, which become immiscible athigher LDPE (Lee and Denn 2000; Ho et al. 2002). Hexenecomonomer promotes immiscibility (Hussein et al. 2003;Hussein and Williams 2004b), whereas octene comonomerpromotes miscibility (Fang et al. 2005). In addition, lowmolecular weight LLDPEs promote miscibility better thanhigh Mw ones (Hussein and Williams 2004a). In a recentreview, Zhao and Choi (2006) have reported that LLDPE/
Rheol Acta (2008) 47:19–31DOI 10.1007/s00397-007-0193-8
O. Delgadillo-Velázquez : S. G. Hatzikiriakos (*)Department of Chemical and Biological Engineering,The University of British Columbia,Vancouver, BC, Canadae-mail: [email protected]
M. SentmanatXpansion Instruments,Tallmadge, OH, USA
LDPE blends were immiscible in the melt state, with LCBbeing the determining factor of their immiscibility behavior.
Recently, Wagner et al. (2004) performed a quantitativeanalysis of melt elongational behavior of LLDPE/LDPEblends. They have reported that the complex behavior ofthese blends can be understood by assuming the existence oftwo phases; one phase composed of the highly branched lowMw chains of both polyethylenes and a second phasecomposed of the high Mw chains (mostly linear) of bothpolyethylenes. Differential scanning calorimetry (DSC)thermograms of LLDPE/LDPE blends reported by Fang etal. (2005) support the existence of a third phase composed ofchains from the two polyethylenes that have the ability to co-crystallize; additionally, enhancement in the crystallizationbehavior of BPE blended with linear polyethylene (LPE) wasexplained in terms of co-crystallization due to the incorpo-ration of the linear segments of BPE into rich-LPE lamellaeand the segregation of the most branched chains (Puig 2001).
The LLDPE/LDPE blend miscibility studies mentionedabove make use of thermal techniques, such as DSC, andrheometrical techniques, such as linear viscoelasticity ofblends at different temperatures (Van Gurp and Palmen1998; Mavridis and Shroff 1992; Hatzikiriakos 2000).Failure of time–temperature superposition can be interpretedas an immiscibility criterion (Van Gurp and Palmen 1998;Peón et al. 2003; Wagner et al. 2004; Pérez et al. 2005).Positive deviation of zero shear rate viscosity from the log-additivity-mixing rule is also an indication of immiscibility(Lee and Denn 2000; Liu et al. 2002; Hussein et al. 2003).The Cole–Cole plot, representation between the imaginary(η0) and real part (η00) of the complex viscosity, has beenused by several authors as criteria for miscibility in poly-ethylene blends (Kim et al. 2000; Ho et al. 2002).
The determination of the weighted relaxation spectrabased on linear viscoelasticity is another method used toinfer the thermorheological behavior of polyethyleneblends. The spectra have been used to determine whetherthe blend components are immiscible due to an additionalrelaxation mechanism associated with interfacial tension(Gramespacher and Meissner 1992; Lacroix et al. 1997;Fang et al. 2005).
In this paper, we study systematically the thermorheo-logical behavior of a LLDPE with four LDPEs that haveviscosity curves that lie above, about the same, and belowthat of the LLDPE. The miscibility of the various blends isstudied with DSC and linear viscoelastic measurementswith the application of several thermorheological complex-ity criteria [time–temperature superposition (TTS), VanGurp plot, Cole–Cole plot, zero-shear viscosity vs compo-sition, and relaxation spectrum]. All the methods are com-pared to check consistency of the results. The extensionalrheological properties of the blends are also studied toexamine the effects of LCB.
Materials and methods
Polyethylene resins and blends
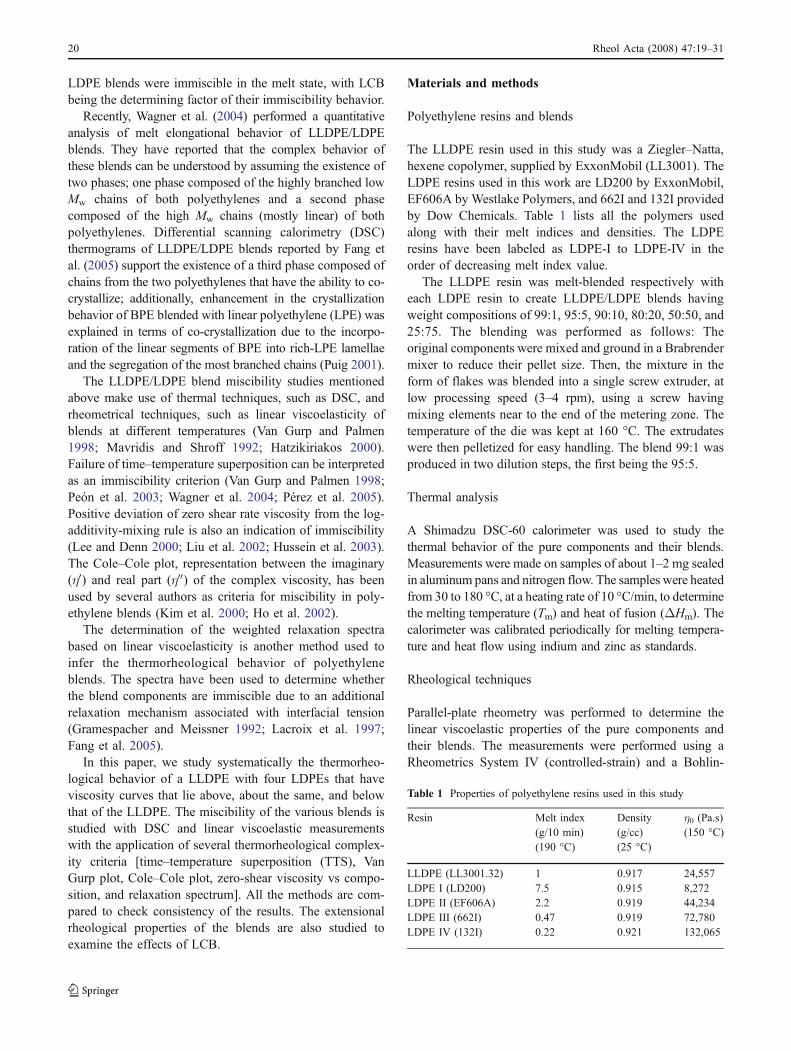
The LLDPE resin used in this study was a Ziegler–Natta,hexene copolymer, supplied by ExxonMobil (LL3001). TheLDPE resins used in this work are LD200 by ExxonMobil,EF606A by Westlake Polymers, and 662I and 132I providedby Dow Chemicals. Table 1 lists all the polymers usedalong with their melt indices and densities. The LDPEresins have been labeled as LDPE-I to LDPE-IV in theorder of decreasing melt index value.
The LLDPE resin was melt-blended respectively witheach LDPE resin to create LLDPE/LDPE blends havingweight compositions of 99:1, 95:5, 90:10, 80:20, 50:50, and25:75. The blending was performed as follows: Theoriginal components were mixed and ground in a Brabrendermixer to reduce their pellet size. Then, the mixture in theform of flakes was blended into a single screw extruder, atlow processing speed (3–4 rpm), using a screw havingmixing elements near to the end of the metering zone. Thetemperature of the die was kept at 160 °C. The extrudateswere then pelletized for easy handling. The blend 99:1 wasproduced in two dilution steps, the first being the 95:5.
Thermal analysis
A Shimadzu DSC-60 calorimeter was used to study thethermal behavior of the pure components and their blends.Measurements were made on samples of about 1–2 mg sealedin aluminum pans and nitrogen flow. The samples were heatedfrom 30 to 180 °C, at a heating rate of 10 °C/min, to determinethe melting temperature (Tm) and heat of fusion (ΔHm). Thecalorimeter was calibrated periodically for melting tempera-ture and heat flow using indium and zinc as standards.
Rheological techniques
Parallel-plate rheometry was performed to determine thelinear viscoelastic properties of the pure components andtheir blends. The measurements were performed using aRheometrics System IV (controlled-strain) and a Bohlin-
Table 1 Properties of polyethylene resins used in this study
Resin Melt index(g/10 min)(190 °C)
Density(g/cc)(25 °C)
η0 (Pa.s)(150 °C)
LLDPE (LL3001.32) 1 0.917 24,557LDPE I (LD200) 7.5 0.915 8,272LDPE II (EF606A) 2.2 0.919 44,234LDPE III (662I) 0.47 0.919 72,780LDPE IV (132I) 0.22 0.921 132,065
20 Rheol Acta (2008) 47:19–31
CVOR (controlled-stress rheometer). Experiments per-formed at different temperatures, namely, 130, 150, 170,190, and 210 °C. Mastercurves were obtained, and mostresults are presented at the reference temperature of 150 °C.
Finally, the blends were rheologically characterized insimple extension using an SER universal testing platform(Sentmanat 2003, 2004) from Xpansion Instruments. Asdescribed by Sentmanat (2003, 2004), the SER unit is a dualwindup extensional rheometer that has been specificallydesigned for use as a fixture on a variety of commerciallyavailable rotational rheometer host platforms. The particularSER model used in this study, a model SER-HV-B01, wasdesigned for use on a VOR Bohlin rotational rheometer hostsystem. Specimens were prepared by compression moldingthe polymer samples between polyester films to a gauge ofabout 1 mm, under 20 MPa and 170 °C, using a hydraulicpress. Individual polymer specimens were then cut to a widthof 6.4–12.7 mm. Typical SER extensional melt rheologyspecimens range from 40–150 mg in mass. Measurementswere conducted at the reference temperature of 150 °C, morethan 25° above the peak melting point of the polymers.
Results and discussion
Rheological characterization of pure resins
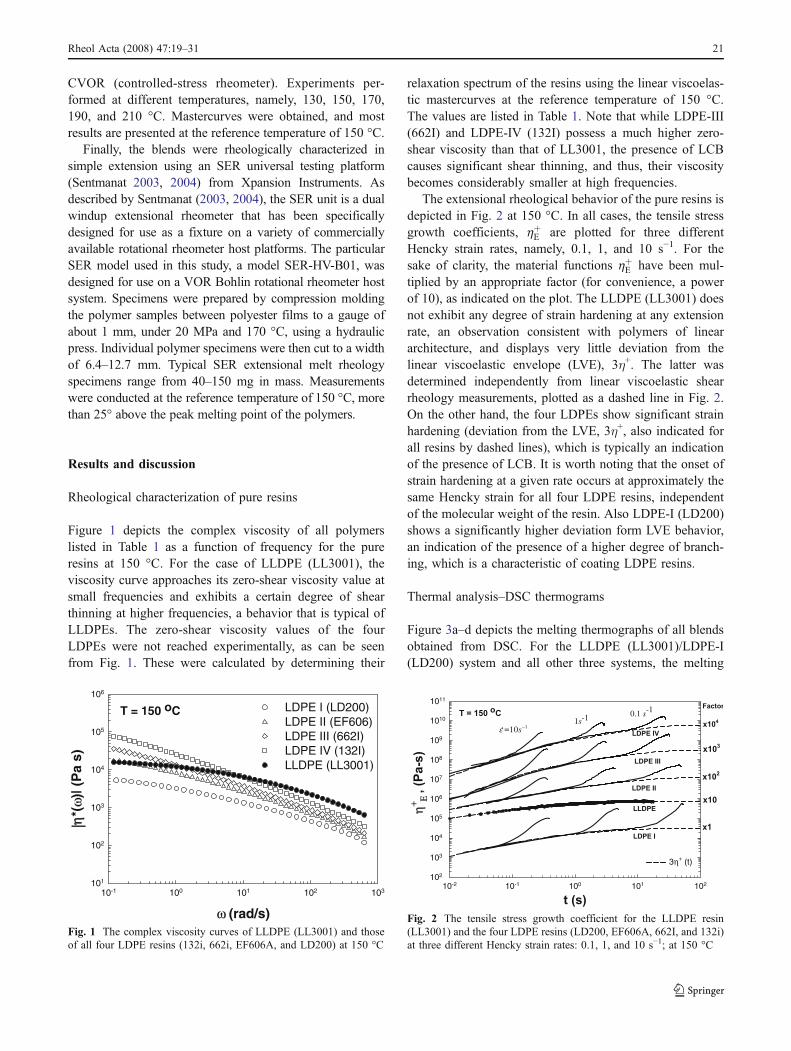
Figure 1 depicts the complex viscosity of all polymerslisted in Table 1 as a function of frequency for the pureresins at 150 °C. For the case of LLDPE (LL3001), theviscosity curve approaches its zero-shear viscosity value atsmall frequencies and exhibits a certain degree of shearthinning at higher frequencies, a behavior that is typical ofLLDPEs. The zero-shear viscosity values of the fourLDPEs were not reached experimentally, as can be seenfrom Fig. 1. These were calculated by determining their
relaxation spectrum of the resins using the linear viscoelas-tic mastercurves at the reference temperature of 150 °C.The values are listed in Table 1. Note that while LDPE-III(662I) and LDPE-IV (132I) possess a much higher zero-shear viscosity than that of LL3001, the presence of LCBcauses significant shear thinning, and thus, their viscositybecomes considerably smaller at high frequencies.
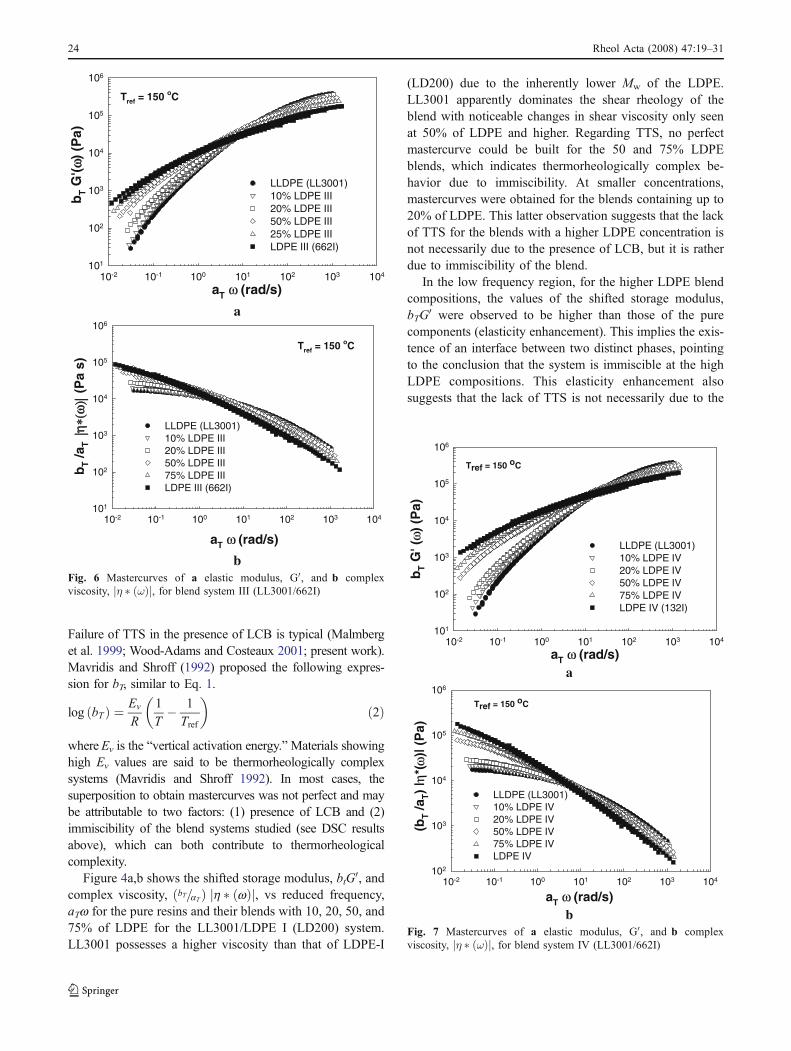
The extensional rheological behavior of the pure resins isdepicted in Fig. 2 at 150 °C. In all cases, the tensile stressgrowth coefficients, hþE are plotted for three differentHencky strain rates, namely, 0.1, 1, and 10 s−1. For thesake of clarity, the material functions hþE have been mul-tiplied by an appropriate factor (for convenience, a powerof 10), as indicated on the plot. The LLDPE (LL3001) doesnot exhibit any degree of strain hardening at any extensionrate, an observation consistent with polymers of lineararchitecture, and displays very little deviation from thelinear viscoelastic envelope (LVE), 3η+. The latter wasdetermined independently from linear viscoelastic shearrheology measurements, plotted as a dashed line in Fig. 2.On the other hand, the four LDPEs show significant strainhardening (deviation from the LVE, 3η+, also indicated forall resins by dashed lines), which is typically an indicationof the presence of LCB. It is worth noting that the onset ofstrain hardening at a given rate occurs at approximately thesame Hencky strain for all four LDPE resins, independentof the molecular weight of the resin. Also LDPE-I (LD200)shows a significantly higher deviation form LVE behavior,an indication of the presence of a higher degree of branch-ing, which is a characteristic of coating LDPE resins.
Thermal analysis–DSC thermograms
Figure 3a–d depicts the melting thermographs of all blendsobtained from DSC. For the LLDPE (LL3001)/LDPE-I(LD200) system and all other three systems, the melting
ω (rad/s)
10-1 100 101 102 103
|η|η*(
ω)| (
Pa
s)
101
102
103
104
105
106
LDPE I (LD200)LDPE II (EF606)LDPE III (662I)LDPE IV (132I)LLDPE (LL3001)
T = 150 oC
Fig. 1 The complex viscosity curves of LLDPE (LL3001) and thoseof all four LDPE resins (132i, 662i, EF606A, and LD200) at 150 °C
3
t (s)
10-2 10-1 100 101 102102
103
104
105
106
107
108
109
1010
1011
η+ Ε ,
(Pa-s
)
T = 150 oC
101 −sε. =1s-1
0.1 s-1
x1
x10
x102
x103
x104
Factor
LDPE I
LLDPE
LDPE II
LDPE III
LDPE IV
3η+ (t)
Fig. 2 The tensile stress growth coefficient for the LLDPE resin(LL3001) and the four LDPE resins (LD200, EF606A, 662I, and 132i)at three different Hencky strain rates: 0.1, 1, and 10 s−1; at 150 °C
Rheol Acta (2008) 47:19–31 21

peak of LDPEs are lower than that of LL3001. At lowweight fractions of LDPE, 5, 10, and 20% the melting isdominated by the LPE, LL3001, as such, the melting peakfor these blends is the same as that of the pure LL3001. Forthe blends containing 50 and 75% LDPE-I, multiplemelting peaks are observed denoting an immiscible system,with one peak corresponding to the melting of the LL3001component, another corresponding to the melting of theLDPE-I component, and a third peak suggesting the exis-tence of a transitional phase.
Co-crystallization was first proposed by Clampitt (1963) toexplain the presence of an intermediate peak in differentialthermal analysis (DTA) of linear and BPE blends. This isformed with chains segregated from the two polymers (linearand branched), which have the ability to co-crystallize andthus form distinct lamellae morphologies and thicknesses(Wignall et al. 2000; Puig 2001; Fang et al. 2005). This leadsto multiple melting behavior (Zhang et al. 2002; Arnal et al.2001; Mirabella et al. 1988). The formation of a third meltingpeak for LLDPE/LDPE blends has also been observed byHussein and Hameed (2005) and Xu et al. (2001). As they
have suggested, it is possible that the co-crystalline phase isformed from LLDPE and LDPE chains, which segregateselectively from their individual components. It is wellknown that Ziegler–Natta LLDPE resins segregate infractions ranging from high molecular weight chains withlow short chain branching content and low molecular weightchains with high amounts of short chain branching (Mirabellaand Ford 1987; Mirabella et al. 1988; Schouterden et al. 1987;Karbashewski et al. 1992; Wignall et al. 1996, 2001; Zhanget al. 2001). Lee and Denn (2000) have suggested a hybridsystem in which a small fraction of LDPE is miscible withLLDPE, forming the matrix phase; more recently, Wagner et al.(2004) explained the strain hardening of a LLDPE/LDPEsystem by assuming the existence of a phase composed of highmolecular weight molecules from both LLDPE (linear) andLDPE (branched) segregated together to form a matrix phase.
The second set of blends, LL3001/LDPE-II (EF606A),exhibits similar behavior to the aforementioned blend, thatis, dominated melting by the linear component up to a 20%LDPE-II blend composition, while the higher blend systemsexhibit multiple melt peaks characterized by a second peak
80 90 100 110 120 130 140 150
T (oC)
Hea
t F
low
LLDPE (LL3001)
5% LDPE I
10% LDPE I
20% LDPE I
50% LDPE I
75% LDPE I
LDPE I (LD200)
a
80 90 100 110 120 130 140 150
T (oC)
Hea
t F
low
LDPE II (EF606A)
75% LDPE II
50% LDPE II
20% LDPE II
10% LDPE II
5% LDPE II
LLDPE (LL3001)
b
80 90 100 110 120 130 140 150
T (oC)
Hea
t F
low
LDPE III (DOW 662i)
75% LDPE III
50% LDPE III
20% LDPE III
10% LDPE III
5% LDPE III
LLDPE (LL3001)
c
80 90 100 110 120 130 140 150
T (oC)
Hea
t F
low
LLDPE (LL3001)
5% LDPE IV
10% LDPE IV
20% LDPE IV
50% LDPE IV
75% LDPE IV
LDPE IV (DOW 132I)
dFig. 3 DSC thermograms for the LLDPE/LDPE blend systems: a LL3001/LDPE I (LD200); b LL3001/LDPE II (EF606A); c LL3001/LDPE III(662I); d LL3001/LDPE IV (132I)
22 Rheol Acta (2008) 47:19–31

corresponding to the LDPE-II component and the occurrenceof a third peak, likely resulting from the co-crystallization ofchains from both polyethylene components and the possibleformation of the third phase. Finally, the same behavior canbe observed with regard to the third and fourth set of blends,namely, LL3001/LDPE-III (662i) and LL3001/LDPE-IV(132i).
The thermograms plotted in Fig. 3a–d support theobservation that LLDPE/LDPE blends form different crystaltypes at high LDPE weight fractions, typically more than20 wt%. On the other hand, DSC is unable to resolve thethermodynamic behavior of blends at low LDPE concen-trations, as the dominant melting peak at these compositionsappears to be only that of the LLDPE component. TheseDSC results will be compared with several rheologicaltechniques below. However, it should be realized that theDSC thermograms provide information on the crystalpopulation of the various blend systems in the solid state,which might not be necessarily true in the melt state.
Linear viscoelastic measurements
The linear viscoelastic behavior of pure components and alltheir blends was studied in details over a wide range oftemperatures 130–210 °C. TTS was applied to shift the datahorizontally and vertically (whenever necessary) to obtain amastercurve at a reference temperature, Tref, in the present case150 °C. Horizontal shift factors, aT, which reflect temperaturedependence of relaxation time, were obtained following theprocedure proposed by Mavridis and Shroff (1992), where aTis described by an Arrhenius equation as follows:
log aTð Þ ¼ Ea
R
1
T� 1
Tref
� �ð1Þ
where Ea is the “horizontal activation energy,” and R is theuniversal gas constant. Due to the presence of LCB in themacromolecular structure of all LDPE resins, it was necessaryto apply vertical shift factors (bT) on the viscoelastic modulito obtain better superposition (Mavridis and Shroff 1992).
aT ω (rad/s)10-2 10-1 100 101 102 103 104
bT G
'( ω)
(Pa)
102
103
104
105
106
LLDPE (LL3001)10% LDPE I20% LDPE I 50% LDPE I75% LDPE ILDPE I (LD200)
Tref = 150 oC
a
aT ω (rad/s) 10-2 10-1 100 101 102 103 104
(bT/a
T)
| η∗(
ω)
η∗(ω
)| (P
a s)
102
103
104
105
LLDPE (LL3001 )10% LDPE I20% LDPE I50% LDPE I75% LDPE ILDPE I (LD200)
Tref = 150 oC
bFig. 4 Mastercurves of a elastic modulus, G0, and ′b complexviscosity, η � ωð Þj j, for blend system I (LL3001/LD200)
aT ω (rad/s)10-2 10-1 100 101 102 103 104
bT G
' (ω
) (P
a)
102
103
104
105
106
LLDPE (LL3001) 10% LDPE II20% LDPE II50% LDPE II75% LDPE IILDPE II (EF606)
Tref = 150 oC
a
aT ω (rad/s)
10-2 10-1 100 101 102 103 104
(bT/a
T)
| η*(
ω)|
(P
a s)
102
103
104
105
LLDPE (LL3001)10% LDPE II20% LDPE II50% LDPE II50% LDPE IILDPE II (EF606)
Tref = 150 oC
bFig. 5 Mastercurves of a elastic modulus, G0, and ′b complexviscosity, η � ωð Þj j, for blend system II (LL3001/EF606)
Rheol Acta (2008) 47:19–31 23
Failure of TTS in the presence of LCB is typical (Malmberget al. 1999; Wood-Adams and Costeaux 2001; present work).Mavridis and Shroff (1992) proposed the following expres-sion for bT, similar to Eq. 1.
log bTð Þ ¼ Ev
R
1
T� 1
Tref
� �ð2Þ
whereEv is the “vertical activation energy.”Materials showinghigh Ev values are said to be thermorheologically complexsystems (Mavridis and Shroff 1992). In most cases, thesuperposition to obtain mastercurves was not perfect and maybe attributable to two factors: (1) presence of LCB and (2)immiscibility of the blend systems studied (see DSC resultsabove), which can both contribute to thermorheologicalcomplexity.
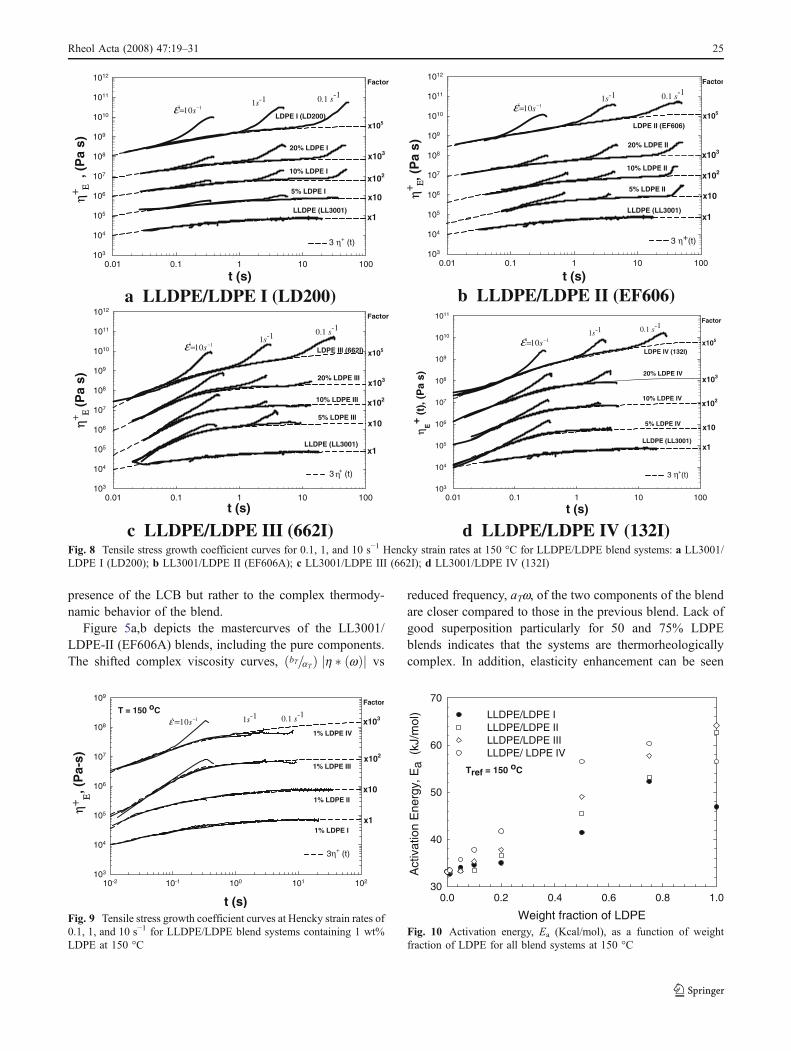
Figure 4a,b shows the shifted storage modulus, btG0, andcomplex viscosity, bT=aTð Þ h � wð Þj j, vs reduced frequency,aTw for the pure resins and their blends with 10, 20, 50, and75% of LDPE for the LL3001/LDPE I (LD200) system.LL3001 possesses a higher viscosity than that of LDPE-I
(LD200) due to the inherently lower Mw of the LDPE.LL3001 apparently dominates the shear rheology of theblend with noticeable changes in shear viscosity only seenat 50% of LDPE and higher. Regarding TTS, no perfectmastercurve could be built for the 50 and 75% LDPEblends, which indicates thermorheologically complex be-havior due to immiscibility. At smaller concentrations,mastercurves were obtained for the blends containing up to20% of LDPE. This latter observation suggests that the lackof TTS for the blends with a higher LDPE concentration isnot necessarily due to the presence of LCB, but it is ratherdue to immiscibility of the blend.
In the low frequency region, for the higher LDPE blendcompositions, the values of the shifted storage modulus,bTG0 were observed to be higher than those of the purecomponents (elasticity enhancement). This implies the exis-tence of an interface between two distinct phases, pointingto the conclusion that the system is immiscible at the highLDPE compositions. This elasticity enhancement alsosuggests that the lack of TTS is not necessarily due to the
bT G
'( ωω)
(Pa)
Tref = 150 oC
aT ω (rad/s)10-2 10-1 100 101 102 103 104
101
102
103
104
105
106
LLDPE (LL3001)10% LDPE III20% LDPE III50% LDPE III 25% LDPE III LDPE III (662I)
Tref = 150 oC
a
Tref = 150 oC
bT /a
T|η
∗(ω
)||η
∗(ω
)|(P
a s)
aT ω (rad/s)
10-2 10-1 100 101 102 103 104101
102
103
104
105
106
LLDPE (LL3001) 10% LDPE III20% LDPE III50% LDPE III75% LDPE IIILDPE III (662I)
Tref = 150 oC
bFig. 6 Mastercurves of a elastic modulus, G0, and ′b complexviscosity, η � ωð Þj j, for blend system III (LL3001/662I)
10-2 10-1 100 101 102 103 104
bT G
' (ω
) (P
a)
101
102
103
104
105
106
LLDPE (LL3001)10% LDPE IV20% LDPE IV50% LDPE IV75% LDPE IVLDPE IV (132I)
aT ω (rad/s)
Tref = 150 oC
a
10-2 10-1 100 101 102 103 104102
103
104
105
106
LLDPE (LL3001)10% LDPE IV 20% LDPE IV50% LDPE IV 75% LDPE IV LDPE IV
Tref = 150 oC
(bT /a
T)
| η*(
ω)|
(P
a)
aT ω (rad/s)
bFig. 7 Mastercurves of a elastic modulus, G0, and ′b complexviscosity, η � ωð Þj j, for blend system IV (LL3001/662I)
24 Rheol Acta (2008) 47:19–31
presence of the LCB but rather to the complex thermody-namic behavior of the blend.
Figure 5a,b depicts the mastercurves of the LL3001/LDPE-II (EF606A) blends, including the pure components.The shifted complex viscosity curves, bT=aTð Þ h � wð Þj j vs
reduced frequency, aTw, of the two components of the blendare closer compared to those in the previous blend. Lack ofgood superposition particularly for 50 and 75% LDPEblends indicates that the systems are thermorheologicallycomplex. In addition, elasticity enhancement can be seen
a LLDPE/LDPE I (LD200) b LLDPE/LDPE II (EF606)
c LLDPE/LDPE III (662I) d LLDPE/LDPE IV (132I) t (s)
0.01 0.1 1 10 100
η E
+ (t)
, (P
a s)
103
104
105
106
107
108
109
1010
1011
x1
x10
x102
x103
x105
Factor
LLDPE (LL3001)
5% LDPE IV
10% LDPE IV
20% LDPE IV
LDPE IV (132I)
1s-1 0.1 s-1
3 η +(t)3 + (t)
t (s)0.01 0.1 1 10 100
η+ Ε
(Pa
s)
103
104
105
106
107
108
109
1010
1011
1012
x1
x10
x102
x103
x105
Factor
LLDPE (LL3001)
5% LDPE III
10% LDPE III
20% LDPE III
LDPE III (662I)1s-1
0.1 s-1
3 + (t)
t (s)0.01 0.1 1 10 100
η+ Ε, (
Pa
s)
103
104
105
106
107
108
109
1010
1011
1012
x1
x10
x102
x103
x105
Factor
LLDPE (LL3001)
5% LDPE II
10% LDPE II
20% LDPE II
LDPE II (EF606)
1s-1 0.1 s-1
3 η+(t)
t (s)0.01 0.1 1 10 100
η+ Ε
, (P
a s)
103
104
105
106
107
108
109
1010
1011
1012
x1
x10
x102
x103
x105
Factor
LLDPE (LL3001)
5% LDPE I
10% LDPE I
20% LDPE I
LDPE I (LD200)101 −= sε. 1s-1 0.1 s-1
3 η+ (t)
101 −= sε.
101 −= sε.101 −= sε.
η
Fig. 8 Tensile stress growth coefficient curves for 0.1, 1, and 10 s−1 Hencky strain rates at 150 °C for LLDPE/LDPE blend systems: a LL3001/LDPE I (LD200); b LL3001/LDPE II (EF606A); c LL3001/LDPE III (662I); d LL3001/LDPE IV (132I)
t (s)
10-2 10-1 100 101 102103
104
105
106
107
108
109
η+ Ε
, (P
a-s)
1% LDPE I
1% LDPE II
1% LDPE III
1% LDPE IV
x1
x10
x102
x103101 −= sε. 1s-1 0.1 s-1 T = 150 oC
3η+ (t)
Factor
Fig. 9 Tensile stress growth coefficient curves at Hencky strain rates of0.1, 1, and 10 s−1 for LLDPE/LDPE blend systems containing 1 wt%LDPE at 150 °C
Weight fraction of LDPE
0.0 0.2 0.4 0.6 0.8 1.0
Act
ivat
ion
Ene
rgy,
Ea
(kJ
/mol
)
30
40
50
60
70
LLDPE/LDPE ILLDPE/LDPE IILLDPE/LDPE IIILLDPE/ LDPE IV
Tref = 150 oC
Fig. 10 Activation energy, Ea (Kcal/mol), as a function of weightfraction of LDPE for all blend systems at 150 °C
Rheol Acta (2008) 47:19–31 25

for 50 and 75% LDPE blends. Similar observations ofelasticity enhancement were reported by Hussein andWilliams (2004a, b) for ZN-LLDPE/LDPE blends at 90and 70% LDPE compositions. Elasticity enhancementimplies the existence of interface and thus immiscibilityof the blends at these compositions.
For the third set of blends, LL3001/LDPE-III (662i), thestorage modulus, bTG0, and complex viscosity, bT=αTð Þ η�jwð Þj, mastercurves are plotted in Fig. 6a,b, respectively.Due to its high Mw, the values of bT=aTð Þ h � wð Þj j forLDPE-III (662i) at low frequencies are higher than those ofLL3001. Again, failure of TTS implies that the systems areimmiscible at high LDPE compositions. No elasticityenhancement is seen for this system due to the muchhigher viscosity of LDPE-III. Similar conclusions can bedrawn for the fourth set of blends LL3001/LDPE-IV (132i),where the viscosity and elasticity of LDPE-IV dominatesthe properties of these series of blends (see Fig. 7a,b). Forexample, with the addition of 10% of LDPE-IV into theLLDPE, significant changes are seen in the complexviscosity of the blend.
Extensional measurements
Extensional rheological measurements were conducted forall blends at 150 °C, the stress growth curves of which areplotted in Fig. 8a,d, using scaling factors as before (powersof 10). As observed in Fig. 8a,d, the strain-hardeningbehavior is a function of LDPE content with the degree ofstrain hardening increasing with LDPE weight fraction inthe blend and becoming more evident at higher Henckystrain rates. In addition, at similar Hencky strain rates, theonset for strain hardening (deviation from LVE behavior)occurs at smaller Hencky strains with increasing LDPEcontent. Note that the presence of LDPE at a weight contentof just 5% is clearly evident from the strain-hardeningbehavior witnessed in the tensile stress growth curves of theblends. Comparatively, differences in the linear viscoelasticshear rheology behavior of the polymer blends were onlyevident for LDPE weight contents greater than 20%.
Figure 9 contains plots of the tensile stress growthcoefficient curves for each blend with a LDPE weight of1%. Although no strain-hardening behavior is observedwith the LDPE-I and LDPE-II blends because of theirinherently lower molecular weight, note that significantstrain-hardening behavior is clearly evident with the LDPE-III and LDPE-IV blends at high rates of extension, anobservation that could not be elucidated from the shearrheology data. It is therefore concluded that the extensionalrheology is an extremely sensitive tool to describe anddetect subtle macrostructural features in polymer blends.
Activation energy
The presence of LCB in the blend can also be reflected byits effect on the activation energy, Ea (Mark et al. 1986).This is seen in Fig. 10, where the activation energy isplotted as a function of weight fraction of LDPE, for allfour systems. The activation energy of each LDPE resinis higher than the energy of the LL3001. The value forLL3001 is 33.5 kJ/mol, a value very typical for LLDPEs,whereas the LDPEs range from 46.6 to 64.9 kJ/mol, valuesagain typical for LDPEs. In general, it can be seen that theactivation energy increases monotonically with LDPEconcentration in the blend systems with the exception ofthe blend systems I and IV at composition 75% LDPE thatexhibit an activation energy higher than the correspondingvalue for pure LDPE (existence of maximum). The differ-ences in these values are 9 and 6%, respectively, which mightbe due to elasticity and in general shear viscosity enhance-ment due to the presence of the interface (note that the blendsare immiscible at these high LDPE compositions). However,as these effects are relatively small (less than 10% for adifference in composition of more than 25%), experimentalerror might also play a role.
It is noted that the vertical shift factors, bT, applied toobtain the mastercurves for the various blend systems weresmall ranging from 0.72 to 1.14, with the higher valuescorresponding to the blends having higher amounts of
Table 2 Thermodynamical behavior of LLDPE (LL3001)/LDPE-I(LD200) blends, at 150 °C, as concluded by various methods
5%LDPE
10%LDPE
20%LDPE
50%LDPE
75%LDPE
DSC U U U I Iη0 vs w M M I I ITTS M1 M1 M1 I Ivan Gurp-Palmen M M M I IRelax. spectrum I I I I ICole-Cole M M M I I
U: Unable to resolve, M: miscible system, I immiscible system; M1 :elasticity enhancement of G0(w) observed
Table 3 Thermodynamical behavior of LLDPE (LL3001)/LDPE-II(EF606A) at 150 °C, as concluded by various methods
5%LDPE
10%LDPE
20%LDPE
50%LDPE
75%LDPE
DSC U U U I Iη0 vs w I I M I ITTS M1 M1 M1 I Ivan Gurp–Palmen M M M I IRelax. spectrum I I I I ICole–Cole M M M I I
U: Unable to resolve, M: miscible system, I: immiscible system, M1 :elasticity enhancement of G0(w) observed
26 Rheol Acta (2008) 47:19–31

LDPE. The corresponding calculated vertical activationenergies, Ev, ranged from 1.76 to 8 kJ/mol for the variouscompositions of all four blend systems with no particulartrends worthy of reporting.
Rheological criteria for miscibility
In this section, several rheological criteria for miscibilitywill be examined for the various blends systems. First,
TTS has already been used as a method to assessmiscibility in LLDPE/LDPE blends (Yamaguchi andAbe 1999; Pérez et al. 2005). As discussed before, theblends rich in LDPE composition have shown difficulty inapplying the TTS principle. This is an indication ofdifferent relaxation times, possibly due to the existenceof different phases comprised by linear and branchedchains, respectively. In addition, elasticity enhancementfor certain blends was observed, pointing to the conclu-sion that some these blends were immiscible as well (seeTables 2, 3, and 4). A possible third phase exists in theseblends composed of chains from both pure componentsthat have the ability to co-crystallize, i.e., high Mw
branched chains from LDPE with high Mw of linearchains from LLDPE.
Use of the Van Gurp–Palmen plots has been used in the pastto infer miscibility of the blends. These are phase angle (δ°) vscomplex modulus (bTG*) plots. Figure 11a,d depicts suchplots for all four sets of blends. First, it is clear that for thepure LL3001, the time–temperature superposition (TTS) isexcellent. For low LDPE blend composition (10%), in all the
bT G* (Pa)103 104 105 106
20
30
40
50
60
70
80
90LLDPE (LL3001)10% LDPE I20% LDPE I50% LDPE I75% LDPE ILDPE I (LD200)
a LL3001/LDPE I (LD200) bT G*(Pa)
103 104 105 10620
30
40
50
60
70
80
90LLDPE (LL3001)10% LDPE II20% LDPE II50% LDPE II75% LDPE II LDPE II (EF606)
b LL3001/LDPE II (EF606)
bT G* (Pa) 103 104 105 106
δ (o)
δ (o) δ (o)
20
30
40
50
60
70
80
90LL300110% LDPE III 80% LDPE III 50% LDPE III 75% LDPE III LDPE III (662I)
c LL3001/LDPE III (662I) bT G* (Pa)
103 104 105 106
δ (o)
20
30
40
50
60
70
80
90LLDPE (LL3001)10% LDPE IV20% LDPE IV 50% LDPE IV75 % LDPE IV LDPE IV (132I)
d LL3001/LDPE IV (132I) Fig. 11 van Gurp–Palmen plots for all four LLDPE/LDPE blend systems using linear viscoelastic data at 130, 150, 170, 190, and 210 °C
Table 4 Thermodynamical behavior of LLDPE (LL3001)/LDPE-III(662I) at 150 °C, as concluded by various methods
5%LDPE
10%LDPE
20%LDPE
50%LDPE
75%LDPE
DSC U U U I Iη0 vs w M M M I ITTS M M M I Ivan Gurp–Palmen M M M I IRelax. spectrum I I I I ICole–Cole M M M I I
U: Unable to resolve, M: miscible system, I: immiscible system
Rheol Acta (2008) 47:19–31 27
blend systems of this study, TTS is obtained. For systems IIIand IV, failure of superposition was clearly observed at 20%LDPE composition, perhaps due to the higher molecularweights of LDPE III and IV compared to that of LLDPE. Forhigh LDPE composition, i.e., 50 and 75% of LDPE, all blendsystems exhibit lack of superposition. Hence, these blends arethermorheologically complex fluids.
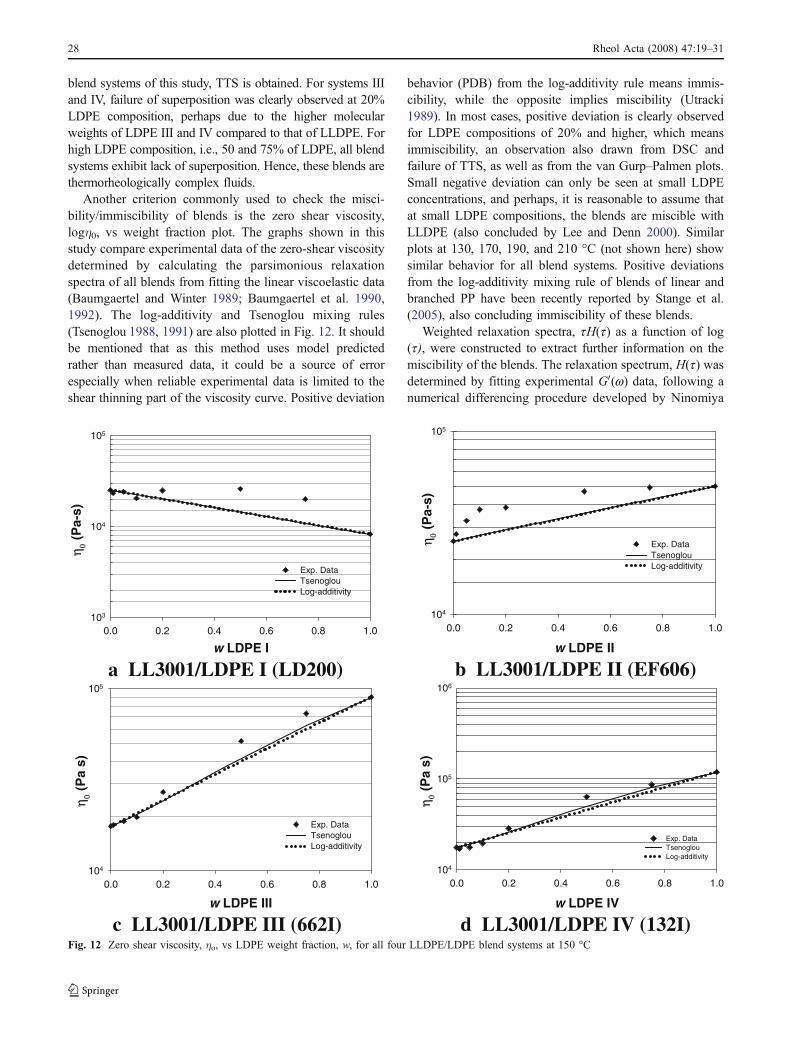
Another criterion commonly used to check the misci-bility/immiscibility of blends is the zero shear viscosity,logη0, vs weight fraction plot. The graphs shown in thisstudy compare experimental data of the zero-shear viscositydetermined by calculating the parsimonious relaxationspectra of all blends from fitting the linear viscoelastic data(Baumgaertel and Winter 1989; Baumgaertel et al. 1990,1992). The log-additivity and Tsenoglou mixing rules(Tsenoglou 1988, 1991) are also plotted in Fig. 12. It shouldbe mentioned that as this method uses model predictedrather than measured data, it could be a source of errorespecially when reliable experimental data is limited to theshear thinning part of the viscosity curve. Positive deviation
behavior (PDB) from the log-additivity rule means immis-cibility, while the opposite implies miscibility (Utracki1989). In most cases, positive deviation is clearly observedfor LDPE compositions of 20% and higher, which meansimmiscibility, an observation also drawn from DSC andfailure of TTS, as well as from the van Gurp–Palmen plots.Small negative deviation can only be seen at small LDPEconcentrations, and perhaps, it is reasonable to assume thatat small LDPE compositions, the blends are miscible withLLDPE (also concluded by Lee and Denn 2000). Similarplots at 130, 170, 190, and 210 °C (not shown here) showsimilar behavior for all blend systems. Positive deviationsfrom the log-additivity mixing rule of blends of linear andbranched PP have been recently reported by Stange et al.(2005), also concluding immiscibility of these blends.
Weighted relaxation spectra, tH(t) as a function of log(t), were constructed to extract further information on themiscibility of the blends. The relaxation spectrum, H(t) wasdetermined by fitting experimental G0(w) data, following anumerical differencing procedure developed by Ninomiya
w LDPE I0.0 0.2 0.4 0.6 0.8 1.0
η 0 (P
a-s)
103
104
105
Exp. Data TsenoglouLog-additivity
a LL3001/LDPE I (LD200)
w LDPE II
0.0 0.2 0.4 0.6 0.8 1.0
η 0 (P
a-s)
104
105
Exp. DataTsenoglouLog-additivity
b LL3001/LDPE II (EF606)
w LDPE III
0.0 0.2 0.4 0.6 0.8 1.0
η 0 (P
a s)
104
105
Exp. DataTsenoglouLog-additivity
c LL3001/LDPE III (662I) w LDPE IV
0.0 0.2 0.4 0.6 0.8 1.0
η 0 (P
a s)
104
105
106
Exp. DataTsenoglouLog-additivity
d LL3001/LDPE IV (132I) Fig. 12 Zero shear viscosity, ηo, vs LDPE weight fraction, w, for all four LLDPE/LDPE blend systems at 150 °C
28 Rheol Acta (2008) 47:19–31

and Ferry (Ferry 1980). All spectra were calculated fromlinear viscoelastic data at 150 °C. Figure 13a shows theweighted relaxation spectra of LL3001/LDPE-I (LD200).Pure LLDPE (LL3001) shows a very broad spectrum aswell as a “shoulder” at the high Mw end. This is possiblydue to phase separation that results from non-uniformbranch content distribution previously observed in Ziegler–Natta LLDPE resins (Mirabella and Ford 1987; Mirabellaet al. 1988; Schouterden et al. 1987; Karbashevski et al.1992). On the other hand, weighted relaxation spectrum forLDPE-I (LD200) shows a much smaller peak than LL3001,which is due to their apparent difference in molecularweight. The weighted spectra for 5 and 10% LDPE blendswere observed to be identical as that of pure LLDPE, whichindicates that the relaxation of the blends is dominated bythe major component. For the rest of the blends, with 20,50, and 75% compositions of LDPE, the distribution of thespectrum is narrower; however, they do not show singlepeak and smooth peak transitions from one pure componentto the other, conditions required for a blend to be consideredas miscible as discussed by Gramespacher and Meissner(1992). Thus, based on the weighted relaxation spectra
data, all the blends are suggested to be immiscible by thismethod. Similar conclusions can be drawn for the rest ofblends LL3001/LDPE-II (III) (IV).
Finally, Cole–Cole plots, η00 vs η0, were constructed for allthe blend systems to check for immiscibility. It is said that fora miscible blend, Cole–Cole plots give semicircular relation-ships of almost identical radii (Utracki 1989; Cho et al.1998; Kim et al. 2000; Kwag et al. 2000). Cole–Cole plotswere constructed for the four blend systems using the reduced
τ (s)
0.001 0.01 0.1 1 10 100 1000 10000
τH
( τ)
0
2000
4000
6000
8000
10000
12000LLDPE (LL3001) 5% LDPE I10% LDPE I20% LDPE I50% LDPE I75% LDPE ILDPE I (LD200)
T = 150 o C
a LL3001/LDPE I (LD200) τ (s)
0.001 0.01 0.1 1 10 100 1000 10000
τ H
( τ)
0
5000
10000
15000
20000LLDPE (LL3001) 5% LDPE II10% LDPE II20% LDPE II50% LDPE II75% LDPE IILDPE II (EF606A)
T = 150 o C
b LL3001/LDPE II (EF606)
τ (s)
0.001 0.01 0.1 1 10 100 1000 10000
τ H
( τ)
0
10000
20000
30000
40000
LLDPE (LL3001) 5% LDPE III 10% LDPE III20% LDPE III50% LDPE III75% LDPE IIILDPE III (662I)
T = 150 o C
c LL3001/LDPE III (662I) τ (s)
0.001 0.01 0.1 1 10 100 1000 10000
τ H
( τ)
0
20000
40000
60000
80000
LLDPE (LL3001) 5% LDPE IV 10% LDPE IV20% LDPE IV50% LDPE IV75% LDPE IVLDPE IV (132I)
T = 150 o C
d L3001/LDPE IV (132I) Fig. 13 Weighted relaxation spectra for all four LLDPE/LDPE blend systems at 150 °C
Table 5 Thermodynamical behavior of LLDPE (LL3001)/LDPE-IV(132I) at 150 °C, as concluded by various methods
5%LDPE
10%LDPE
20%LDPE
50%LDPE
75%LDPE
DSC U U U I Iη0 vs w M M M I ITTS M M M I Ivan Gurp–Palmen M M M I IRelax. spectrum I I I I ICole–Cole M M M I I
U: Unable to resolve, M: miscible system, I: immiscible system
Rheol Acta (2008) 47:19–31 29

values of η″ vs η′ at all temperatures by applying theirrespective vertical shift factors bT=aTh
0; bT=aThð Þ. The Cole–Cole plots for LL3001 gave a semicircle, demonstrating itsthermorheological simplicity (also concluded from otherrheological methods). On the other hand, Cole–Cole plotsfor all the LDPE resins did not result in semicircular shapes,suggesting a different signature due to the presence of LCB(thermorheological complexity). Regarding the blends sys-tems, for 1, 5, 10, and 20% LDPE compositions, Cole–Coleplots (not shown here for the sake of simplicity) observedcircular relationships, thus suggesting miscible blends. How-ever, for 50 and 75% LDPE compositions, the behavior issimilar to the LDPE resin and thus suggesting immiscibility.This was observed to be the case for all four blend systems.
The results of all the methods for examining miscibilityare shown in Tables 2, 3, 4, and 5 for the different blendsystems: All methods agree that at high LDPE composition,the blends are immiscible. At low LDPE composition, theagreement is only partial among the various methods; mostmethods appear to indicate a transition from miscibility toimmiscibility for all the blend systems studied, andtherefore, we can conclude that miscibility at smaller LDPEconcentrations exist, which changes to immiscibility athigher LDPE concentrations (essentially higher than 20%).As the failure of TTS might be due to the presence of LCB,TTS is not a good indicator for miscibility unless elasticityenhancement is observed that points immiscibility (blendsystems I and II). Overall, it is reasonable to conclude thatLDPEE (hexane)–LDPE blends are immiscible at highLDPE concentrations (Lee and Denn 2000).
Conclusions
The rheological effects of LCB was studied using severalLDPE resins as pure and as blends with a hexene copolymer ofLLDPE by means of linear viscoelastic measurements, i.e.,shear thinning and strain hardening in tensile stress growthbehavior. While LLDPE essentially follows the LVE of 3η+,the LLDPE/LDPE blends exhibit clearly strain hardening,which is found to be a function of LDPE concentration;moreover, strain hardening was observed even for someblends with only a 1% LDPE weight fraction for blend withthe higher Mw LDPE’s. At these low compositions of LDPE,linear viscoelastic experiments in simple shear have shownno effect; hence, the rheological characterization of polymersin uniaxial extension could be used as a very sensitive toolfor detecting and describing subtle differences in blendcomposition and morphology.
DSC thermographs for high LDPE compositions haveshown the presence of a third melting peak, possibly due tothe existence of a co-crystallization reaction. At low LDPEcompositions, the thermographs exhibit a single melting
peak suggesting that the LLDPE is dominating the melting,thus yielding inconclusive results with regard to the issue ofmiscibility.
Several rheological criteria were applied to all blends forassessing polymer miscibility. First, by inspection of visco-elastic moduli mastercurves, failure of TTS was observed forall blends at high LDPE compositions; the same behavior wascorroborated with van Gurp–Palmen plots. Therefore, it can beconcluded that LCB promotes thermorheologically complexbehavior at high compositions of LDPE. Positive deviationbehavior (PDB) from log-additivity rule was observed, in thewhole range of temperatures, for all blend systems with LDPEcompositions in LDPE of 20% and up.
Finally, the broad distribution of the weighted relaxationspectrum in pure LLDPE suggests an inherent and non-homogeneous chain composition and immiscibility for allblends. In general, all blends of hexene–LLDPE wereimmiscible with amounts of LDPE greater than 20%,regardless of the molecular weight.
Acknowledgments We would like to thank NSERC for financialsupport, DOW Chemicals (S. Costeux) for the LDPE supplied andvaluable comments. One of the authors (D-V O.) would like toacknowledge CONACyT for financial support in the form of ascholarship.
References
Arnal ML, Sánchez JJ, Müller AJ (2001) Miscibility of linear andbranched polyethylene by thermal fractionation: use of thesuccessive self-nucleation and annealing (SSA) technique.Polymer 42:6877–6890
Baumgaertel M, Winter HH (1989) Determination of discreterelaxation and retardation time spectra from dynamic mechanicaldata. Rheol Acta 28:511–519
Baumgaertel M, Schausberger A, Winter HH (1990) The relaxation ofpolymers with linear flexible chains of uniform length. RheolActa 29:400–408
Baumgaertel M, De Rosa ME, Machado J, Masse M, Winter HH(1992) The relaxation time spectrum of nearly monodispersepolybutadiene melts. Rheol Acta 31:75–82
Cho K, Lee BH, Hwang K, Lee H, Choe S (1998) rheological andmechanical properties in polyethylene blends. Polym Eng Sci38:1969–1975
Clampitt BH (1963) differential thermal analysis of linear polyethylene-high pressure polyethylene blends. Anal Chem 33:577–579
Dealy JM, Wissbrun KF (1990) Melt rheology and its role in plasticsprocessing. Theory and Applications. Van Nostrand Reinhold,New York
Fang Y, Carreau PJ, Lafleur PG (2005) Thermal and rheologicalproperties of mLLDPE/LDPE blends. Polym Eng Sci 45:1254–1269
Ferry JD (1980) Viscoelastic properties of polymers. Wiley, New YorkGabriel C, Lilge D (2006) Molecular mass dependence of the zero
shear-rate viscosity of LDPE melts: evidence of an exponentialbehavior. Rheol Acta 45:995–1002
Gabriel C, Münstedt H (2003) Strain hardening of various polyolefinsin uniaxial elongational flow. J Rheol 47:619–630
30 Rheol Acta (2008) 47:19–31
Gramespacher H,Meissner J (1992) Interfacial tension between polymermelts measured by shear oscillations of their blends. J Rheol 36:1127–1141
Hatzikiriakos SG (2000) Long chain branching and polydispersityeffects on the rheological properties of polyethylenes. Polym EngSci 40:2279–2287
Ho K, Kale L, Montgomery S (2002) Melt strength of linear-lowdensity polyethylene/low density polyethylene blends. J ApplPolym Sci 85:1408–1418
Hussein IA, Hameed T (2005) Influence of branching characteristicson thermal and mechanical of Ziegler-Natta and metallocenehexene linear low density polyethylene blends with low densitypolyethylene. J Appl Polym Sci 97:2488–2498
Hussein IA,WilliamsMC (2004a) Rheological study of heterogeneities inmelt blends of ZN-LLDPE and LDPE: influence of Mw andcomonomer type, and implications for miscibility. Rheol Acta43:604–614
Hussein IA, Williams MC (2004b) Rheological study of the influenceof branch content on the miscibility of octene m-LLDPE and ZN-LLDPE in LDPE. Polym Eng Sci 44:660–672
Hussein IA, Hameed T, Sharkh BFA, Khaled M (2003) Miscibility ofhexene-LLDPE and LDPE blends: influence of branch contentand composition distribution. Polymer 44:4665–4672
Karbashewski E, Kale L, Rudin A, Tchir WJ, Cook DG, Pronovost JO(1992) Characterization of linear low density polyethylene bytemperature rising elution fractionation and by differentialscanning calorimetry. J Appl Polym Sci 44:425–434
Kim LH, Rana D, Kwag H, Choe S (2000) Melt rheology of ethylene1-octene copolymer blends synthesized by Ziegler-Natta andmetallocene catalysts. Korea Polym J 8:34–43
Kissin YV (2005) Polyethylene, linear-low density. Kirk–Othmerencyclopedia of chemical technology. Wiley, New York
Kwag H, Rana D, Cho K, Rhee J, Woo T, Lee BH, Choe S (2000)Binary blends with conventional polyolefins: rheological andmorphological properties. Polym Eng Sci 40:1672–1681
Lacroix C, Aressy M, Carreau PJ (1997) Linear viscoelastic behaviorof molten polymer blends: a comparative study of the Palierneand Lee and Park models. Rheol Acta 36:416–428
Lee HS, Denn MM (2000) Blends of linear and branched poly-ethylenes. Polym Eng Sci 40:1132–1142
Liu C, Wang J, He J (2002) Rheological and thermal properties of m-LLDPE blends with m-HDPE and LDPE. Polymer 43:3811–3818
Malmberg A, Liimatta J, Lehtinen A, Löfgren B (1999) Character-istics of long chain branching in ethane polymerization withsingle site catalysts. Macromolecules 32:6687–6696
Mark HF, Bikales NM, Overberger CG, Menges G (1986) Encyclo-pedia of polymer science and engineering, 2nd edn, vol. 6. Wiley,New York, p 477
Mavridis H, Shroff RN (1992) Temperature dependence of polyolefinmelt rheology. Polym Eng Sci 32:1778–1787
Mirabella FM, Ford EA (1987) Characterization of linear low-densitypolyethylene: cross-fractionation according to copolymer composi-tion and molecular weight. J Polym Sci Polym Phys Ed 25: 777–790
Mirabella FM, Westphal SP, Fernado PL, Ford EA, Williams JG(1988) Morphological explanation of the extraordinary fracturetoughness of linear low density polyethylene. J Polym Sci PolymPhys Ed 26:1995–2005
Peón J, Domínguez C, Vega JF (2003) Viscoelasticity behavior ofmetallocene-catalyzed polyethylene and low-density polyethyl-ene blends: use of the double reptation and Palierne viscoelasticmodels. J Mater Sci 38:4757–4764
Pérez R, Rojo E, Fernández M, Leal V, Lafuente P, Santamaría A(2005) Basic and applied rheology of m-LLDPE/LDPE blends:miscibility and processing features. Polymer 46:8045–8053
Puig CC (2001) Enhanced crystallization in branched polyethylenes whenblended with linear polyethylene. Polymer 42: 6579–6585
Schouterden P, Groeninckx G, Van der Heijden B, Jansen F (1987)Fractionation and thermal behavior of linear low densitypolyethylene. Polymer 28:2099–2104
Sentmanat ML (2003) Dual windup extensional rheometer. US Patent6,578,413
Sentmanat M (2004) Miniature universal testing platform: fromextensional melt rheology to solid state deformation behavior.Rheol Acta 43:657–699
Stange J, Uhl C, Munstedt H (2005) Rheological behavior of blendsfrom a linear and a long-chain branched polypropylene. J Rheol49:1059–1079
Tsenoglou C (1988) Network architecture and modulus of miscibleheteropolymer blends. J Polym Sci Polym Phys 26:2329–2339
Tsenoglou C (1991) Molecular weight polydispersity effects on theviscoelasticity of entangled linear polymers. Macromolecules24:1762–1767
Utracki LA (1989) Polymer alloys and blends. thermodynamics andrheology. Hanser, Munich
Van Gurp M, Palmen J (1998) Time-temperature superposition forpolymer blends. Rheol Bull 67:5–8
Wagner MH, Kheirandish S, Yamaguchi M (2004) Quantitativeanalysis of melt elongational behavior of LLDPE/LDPE blends.Rheol Acta 44:198–218
Wignall GD, Alamo RG, Londono JD, Mandelkern L, Stehling FC(1996) Small-angle neutron scattering investigations of liquid–liquid phase separation in heterogeneous linear low-densitypolyethylene. Macromolecules 29:5332–5335
Wignall GD, Alamo RG, Londono JD, Mandelkern L, Kim MH,Lin JS, Brown GM (2000) Morphology of blends of linear andshort-chain branched polyethylenes in the solid state by small-angle neutron and X-ray scattering, differential scanning calo-rimetry, and transmission electron microscopy. Macromolecules33:551–561
Wignall GD, Alamo RG, Ritchson EJ, Mandelkern L, Schwahn D(2001) SANS studies of liquid-liquid phase separation in hetero-geneous and metallocene-based linear-low density polyethylene.Macromolecules 34:8160–8165
Wood-Adams P, Costeaux S (2001) Thermorheological behavior ofpolyethylene: effects of microstructure and long chain branching.Macromolecules 34:6281–6290
Xu J, Xu X, Chen L, Feng L, Chen W (2001) Effect of compositiondistribution on miscibility and co-crystallization phenomena inthe blends of low density polyethylene with conventional andmetallocene-based ethylene-butene copolymers. Polymer 42:3867–3874
Yamaguchi M, Abe S (1999) LLDPE/LDPE blends I. Rheological,thermal and mechanical properties. J Appl Polym Sci 74:3153–3159
Zhang MD, Lynch T, Wanke SE (2001) Effect of molecular structuredistribution of melting and crystallization behavior of 1-butene/ethylene copolymers. Polymer 42:3067–3075
Zhang F, Liu J, Xie F, Fu Q, He T (2002) Polydispersity of ethylenesequence length in metallocene ethylene/α-olefin copolymers.II. Influence on crystallization and melting behavior. Polym SciPolym Physics Ed 40:822–830
Zhao L, Choi P (2006) A review of the miscibility of polyethyleneblends. Mater Manuf Process 21:135–142
Rheol Acta (2008) 47:19–31 31