Thermodynamics and Kinetics of Adsorption
58
Organization 1. Introduction; terms and definitions 2. Thermodynamics of adsorption • Adsorption as a macroscopic (thermodynamic) phenomenon • Equilibrium thermodynamics and adsorption isotherms: Langmuir and BET isotherm • The adsorption energy: Initial adsorption energy and a-priori heterogeneity • Coverage dependence of the adsorption energy: lateral interactions and a-posteriori heterogeneity 3. Kinetics of adsorption and desorption • The rate of adsorption; trapping and sticking • The rate of desorption; order of desorption and frequency factor • The desorption energy: Binding states and lateral interactions • Experimental procedure and evaluation of TD spectra 4. Summary and conclusions Thermodynamics and Kinetics of Adsorption subtitle: What can we learn about adsorption systems from thermodynamic and kinetic measurements? IMPRS-Lecture Series 2012: ‘Experimental and Theoretical Methods in Surface Science’ Klaus Christmann Institut für Chemie und Biochemie, Freie Universität Berlin
Transcript of Thermodynamics and Kinetics of Adsorption

Organization1. Introduction; terms and definitions2. Thermodynamics of adsorption
• Adsorption as a macroscopic (thermodynamic) phenomenon• Equilibrium thermodynamics and adsorption isotherms: Langmuir and BET isotherm• The adsorption energy: Initial adsorption energy and a-priori heterogeneity• Coverage dependence of the adsorption energy: lateral interactions and a-posteriori heterogeneity
3. Kinetics of adsorption and desorption• The rate of adsorption; trapping and sticking• The rate of desorption; order of desorption and frequency factor• The desorption energy: Binding states and lateral interactions• Experimental procedure and evaluation of TD spectra
4. Summary and conclusions
Thermodynamics and Kinetics of Adsorption subtitle:
What can we learn about adsorption systems from thermodynamic and kinetic measurements? IMPRS-Lecture Series 2012: ‘Experimental and Theoretical Methods in Surface Science’
Klaus ChristmannInstitut für Chemie und Biochemie, Freie Universität Berlin

Technical applications of adsorption:• Separation processes of gaseous and liquid mixtures via molecular sieves• Heterogeneous catalysis• Chemical analyses (various types of chromatography)• Flotation processes• Gas mask filters• Lubrication phenomena• Optical coatings• corrosion-resistant coatings (Lotus effect)
Practical relevance of adsorption processes
As we will see later, one distinguishes chemical adsorption (chemisorption) and physical adsorption (physisorption),
depending of the strengths of the interaction between adsorbent and adsorptive.
While chemisorption is most essential for heterogeneous surface reactions, physisorption plays a major role during separation and enrichment processes at and near phase boundaries.

1. Terminology: Strength of interaction forces -physisorption and chemisorption
Interaction forces responsible for adsorptive bonds
Kind of interaction Strength of interaction
van-der-Waals Very weak (usually less than 50 kJ/mole)
ionic Strong (Coulombic origin)> 100 kJ/mole
covalent Strong (quantum-chemical origin)> 50 kJ/mole
metallic Strong (quantum-chemical origin), E > 50 kJ/mole
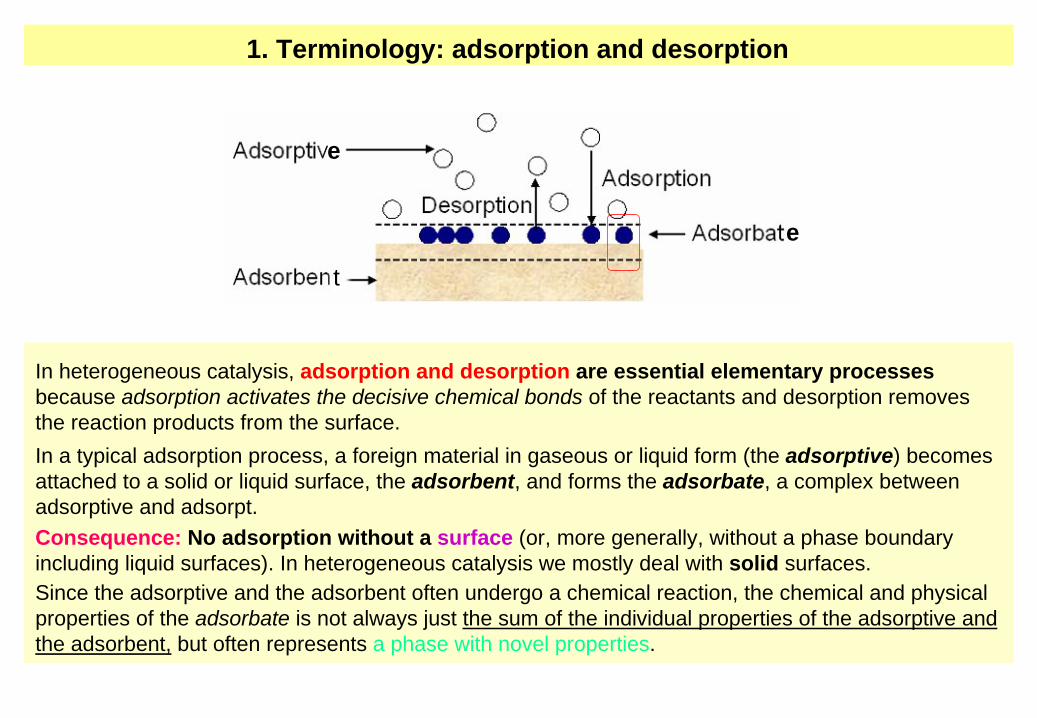
In heterogeneous catalysis, adsorption and desorption are essential elementary processes because adsorption activates the decisive chemical bonds of the reactants and desorption removes the reaction products from the surface.In a typical adsorption process, a foreign material in gaseous or liquid form (the adsorptive) becomes attached to a solid or liquid surface, the adsorbent, and forms the adsorbate, a complex between adsorptive and adsorpt. Consequence: No adsorption without a surface (or, more generally, without a phase boundary including liquid surfaces). In heterogeneous catalysis we mostly deal with solid surfaces.Since the adsorptive and the adsorbent often undergo a chemical reaction, the chemical and physical properties of the adsorbate is not always just the sum of the individual properties of the adsorptive and the adsorbent, but often represents a phase with novel properties.
1. Terminology: adsorption and desorption
t
e
e

There exist a lot of definitions among which the most rigorous ones are:• A surface represents the outer or the topmost boundary of a solid or liquid object,
where the bulk properties are no longer sufficient to describe the system‘s properties.• A surface is the boundary between the ‚inner‘ and ‚outer‘ world of a given phase. • A surface always determines a thermodynamic phase boundary, where the
physical and chemical properties of the adjacent phases change abruptly.
1. Terminology: what is a surface?
Consequence:In the surface region, the interaction forces responsible for the bulk properties become asymmetric, since the outermost bonds are unsaturated, resulting in a peculiar chemical reactivity of the surface. In our context the most important consequence is that the surface becomes capable of adsorbing foreign atoms or molecules.

Consequences: Clean surfaces try to rearrange their atoms‘ positions in order to minimize the surface free energy.
One distinguishes:
• multilayer relaxation, i.e., in the surface region the distances perpendicular to the surface differ from those of the bulk• reconstruction, i.e., the surface atoms take on new periodic positions parallel to the surface (formation of superstructures)
• Both phenomena can (and usually will) be affected by adsorption.
1. Terminology: asymmetry of binding forces

Adsorbate-induced surface reconstruction
Free energy as a function of the surface configuration. This configuration is determined by the adsorbate coverage. At a critical value of this coverage, the surface flips to a more stable equilibrium configuration.
Asymmetry of binding forces and its consequence

We shall subdivide our surfaces in two classes:
• Single crystal surfaces are geometrically well-defined. While they are not really used in heterogeneous catalysis, they have the advantage to provide access to the physics and chemistry of the elementary steps of a catalytic reaction (“model systems”). The scientific field of classical Surface Science - introduced among others, by Gerhard Ertl - can be most successfully applied.
1. Terminology: surfaces of interest
• Polycrystalline, heterogeneous surfaces are very important in practical heterogeneous catalysis, since they have a large surface area due to micro-, meso- or macropores. Among these solids are charcoal (active carbon), alumina, silica, zeolites or carbon nanotubes. Adsorption on these porous surfaces is often well described by the BET adsorption isotherm. In addition, the existence of mesopores (pore radius rp) can modify the thermodynamic phase equilibria due to a vapor pressure depression or elevation predicted by the Kelvin equation (curvature effect). The Kelvin equation, which contains both the size and the surface tension of the dispersed material also governs growth and nucleation phenomena (Ostwald ripening etc.)
⎟⎟⎠
⎞⎜⎜⎝
⎛
⋅−=
Kelvinp
m
rRTV
pp
,0
2exp σ
Kelvin equation
Pconcave < p0 < pconvex

Associative (molecular) adsorption leaves the adsorbing molecule intact. Example: CO adsorption on a palladium(100) surface. The adsorption energy equals the depth of the potential energy well: Ead = Echem . Dissociative (atomic) adsorption cleaves the adsorbing molecule either homolytically (H — H = H• + H•) or heterolytically (H — H = H- + H+). Example: H2 adsorption on a nickel (111) surface. The adsorption energy is the difference between twice the Ni — H bond energy and the heat of H2 dissociation (435 kJ/mol): Ead = 2 EMe-H - Ediss
CO-Pd interaction potential
Terminology: associative and dissociative adsorption
H2 -Ni interaction potential
Information on the mechanism of adsorption may be obtained from measurements of adsorption isotherms or from thermal desorption spectra as will be discussed later.

The dissociation of a diatomic molecule can be better characterized by a two-dimensional potential energy representation. In these so-called elbow-plots the perpendicular distance of the molecule, y,is plotted against the internuclear distance, x. Whether or not the molecule can successfully dissociate depends on its translational and/or vibrational excitation.
Terminology: associative and dissociative adsorption
early barrier late barrier

The dissociation of molecular hydrogen has been studied theoretically in great detail, for example on Pd(100) surfaces by A. Groß et al.. Quite important is the so-called ‘dynamical steering’ where the H2 molecule is guided to the optimum dissociation sites.
Terminology: associative and dissociative adsorption

In the adsorbed state and in thermal equilibrium the trapped particle resides at the bottom of the potential well. It is either physically or chemically adsorbed on the solid.In order to desorb it from the surface, one has to supply it thermally or electronically with the energy required to return to the gas phase. If activation barriers are involved, these have to be additionally overcome, and the desorbing particles then possess more energy than they had if they were in thermal equilibrium with the surface.
Non activated (spontaneous) adsorption: CO on Ni(111) activated adsorption: hydrogen on a Cu(111) surface
Terminology: activated and non-activated (spontaneous) adsorption
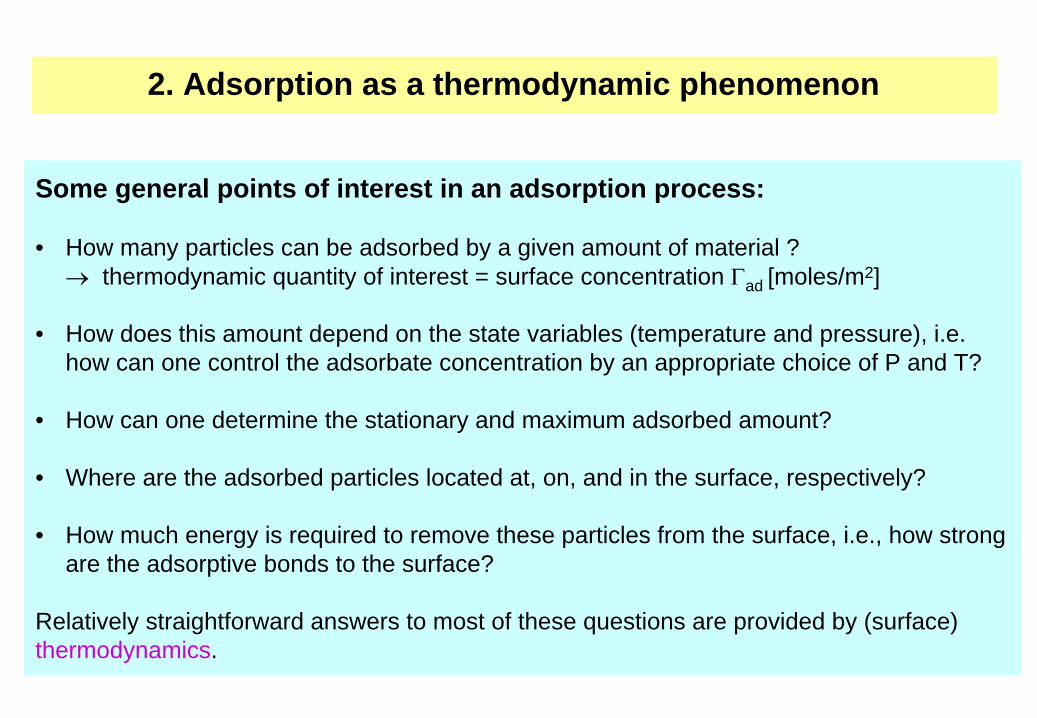
Some general points of interest in an adsorption process:
• How many particles can be adsorbed by a given amount of material ? →
thermodynamic quantity of interest = surface concentration Γad [moles/m2]
• How does this amount depend on the state variables (temperature and pressure), i.e. how can one control the adsorbate concentration by an appropriate choice of P and T?
• How can one determine the stationary and maximum adsorbed amount?
• Where are the adsorbed particles located at, on, and in the surface, respectively?
• How much energy is required to remove these particles from the surface, i.e., how strong are the adsorptive bonds to the surface?
Relatively straightforward answers to most of these questions are provided by (surface)thermodynamics.
2. Adsorption as a thermodynamic phenomenon

Consider the differential change of Free Enthalpy (Gibbs Energy), dG, of a thermodynamic system during any change of state:
with P = pressure, T = temperature, A = surface area, σ
= surface tension, V = system volume, μ
= chemical potential and S = entropy. The third term becomes decisive, when the surface area is large in relation to the bulk volume (high degree of dispersion). Example: Raney-Nickel as a catalyst is often utilized in hydrogenation reactions.
The surface tension [N/m] is entirely equivalent to the surface energy σ
[Nm/m2], which is the driving force for all surface phenomena.
2. Thermodynamics of adsorption - Fundamental Gibbs equation
iAPTiTPAPAT
dnnGdA
AGdT
TGdP
PGdG
,,,,,⎟⎟⎠
⎞⎜⎜⎝
⎛∂∂
+⎟⎠⎞
⎜⎝⎛
∂∂
+⎟⎠⎞
⎜⎝⎛
∂∂
+⎟⎠⎞
⎜⎝⎛
∂∂
=
ii
idndAdTSdPVdG ∑++−= μσ σ=⎟⎠⎞
⎜⎝⎛
∂∂
−=⎟⎠⎞
⎜⎝⎛
∂∂
+=⎟⎠⎞
⎜⎝⎛
∂∂
TP
AP
AT
AG
STG
VPG
,
,
,
;
Thermodynamics describes the behaviour of matter as a function of state variables (P, T, chemical composition etc.). However, since it is just a continuum description of the chemical state of systems, it is unable to describe or predict microscopic details or elementary processes on the atomic scale, nor is it capable of predicting activation energies and, hence, provides hardly any information about kinetics (time dependences) of chemical reactions.

Thermodynamical derivation of the so-called isosteric enthalpy of adsorption, qst :
Chemical equilibrium between adsorbate and gas phase leads to a constant surface concentration Γ [moles/m2]. Constant Γ
is maintained when the fluxes of adsorbing and
desorbing particles are equal. We now consider the pressure and temperature dependence of this phase equilibrium. A common procedure is to equate the chemical potentials and their derivatives of the phases involved. Remember that the chemical potential μ
is the derivative of
the Gibbs energy with respect to the mole number in question, ni :
In the (dynamical) phase equilibrium, the chemical potentials μad and μgas are equal and remain equal (“persisting” or “ongoing” equilibrium):
μad = μgas and dμad = dμgas ; Γ
= nad /A
dμad+OF = -sad+OF dT + vad+OF dP + = dμgas = - Sg dT + Vg dP.
(small letters denote partial molar quantities)
numbersmoleotherTPii dn
dG
,,⎟⎟⎠
⎞⎜⎜⎝
⎛=μ
2. Thermodynamics of adsorption - the heat of adsorption
Γ⎟⎠⎞
⎜⎝⎛
Γ∂∂ + d
Tp
OFad
,
μ

Setting and applying the ideal gas equation, I.e., yields the relation
. Recalling that the entropy is the “reduced” heat finally
leads to the expression:
qst is called differential isosteric heat of adsorption and represents the energy difference between the state of the system before and after the adsorption of a differential amount of particles on that surface. It can be obtained from equilibrium, i.e., adsorption isotherm measurements. These considerations apply particularly well for homogeneous single crystal surfaces, for which we shall provide examples later. Nevertheless, qst is often coverage-dependent due to lateral particle – particle interactions.Inhomogeneous, porous surfaces that one encounters in practical heterogeneous catalysis require a modified view and more complicated thermodynamic treatment, since they can provide a whole variety of energetically and geometrically different adsorption sites.
22
ln1RTq
dTPd
RThh
dTdP
PstOFadg =⎟
⎠⎞
⎜⎝⎛=
−=⎟
⎠⎞
⎜⎝⎛
Γ
+
Γ
gOFad VV <<+ PRTVg =
RTss
dTdP
POFadg +
Γ
−=⎟
⎠⎞
⎜⎝⎛1
Ths Δ
=Δ
Rearranging and considering that the term gets zero for constant coverage (dΓ=0) yields the well-known Clausius - Clapeyron equation for the “ongoing” phase equilibrium between gas phase and adsorbate phase(s):
VS
VVss
dTdP
OFadg
OFadg
ΔΔ
=−
−=⎟
⎠⎞
⎜⎝⎛
+
+
Γ
2. Thermodynamics of adsorption - the heat of adsorption
Γ⎟⎠⎞
⎜⎝⎛
Γ∂∂ + d
Tp
OFad
,
μ

The adsorption isotherm displays information of how much material will adsorb for a given set of state variables (pressure P and temperature T when using gases as adsorptives, concentration c and temperature T when dealing with adsorption from solutions). The amount of adsorbed material can be introduced as surface coverage Θ, i.e., the fraction of occupied/available sites, or by the total volume vm taken up by the sum of particles adsorbed in the first monolayer.
The adsorption isotherm is one of the most characteristic quantities for an adsorption process. In practice, the uptake of adsorptive of a given catalyst material is decisive, since a high uptake usually means a good catalyst efficiency. The respective uptake is often called ‚sorption capacity‘ and characterised by the sorption (or adsorption) isotherm. The form of the sorption isotherm provides a lot of first-glance information about the chemical and physical properties of the catalyst material and about how the adsorption process proceeds. In principle, various kinds of isotherms can be distinguished, depending on the nature of the catalyst and the kind of interaction.
2. Thermodynamics of adsorption: Concept of the adsorption isotherm

Some examples of experimental adsorption isotherms
2. Thermodynamics of adsorption: The concept of the adsorption isotherm
Langmuir isotherms (type I) are usually observed during adsorption of chemically active gases on metal surfaces, but also with non-polar gases (methane, nitrogen N2 , ethane) on zeolites, whereas the adsorption of water vapour on γ-Al2 O3 leads to isotherms of type II with condensation. Using an unpolar surface like charcoal and polar molecules as adsorptive (methanol or H2 O) the situation is characterised by initially rather repulsive interactions leading to a reduced uptake, while the increasing presence of adsorbate molecules facilitate the ongoing adsorption leading to isotherms of type III. If porous adsorbents are used, additional capillary condensation effects lead to isotherms of type IV and V.

2. Thermodynamics: monolayer and multilayer adsorption
Multilayer adsorption/condensation on a homogeneous surface at equilibrium pressure p/p0 . The heat of adsorption of the first (blue) layer is comparable to the heat of condensation of the subsequent (red) layers. Often observed during physisorption.
Monolayer adsorption on a homogeneous surface at equilibrium pressure p/p0 . The heat of adsorption of the first monolayer is much stronger than the heat of adsorption of the second (and all following) layers (typical chemisorption case)

A way of getting to the adsorption isotherm is to consider the adsorption - desorption equilibrium.
2. Thermodynamics of adsorption: the Langmuir adsorption isotherm
The adsorption process between gas phase molecules, A, vacant surface sites, S, and occupied surface sites, SA, can be described by the equation
assuming that there are a fixed number of surface sites present on the surface. An equilibrium constant, K, can be written:
SAAS ↔+
If we introduce the symbol θ
for the fraction of surface sites occupied (0 < θ
< 1) and consider that [SA] is proportional to the surface coverage of adsorbed molecules, i.e., proportional to θ, whilst [S] is proportional to the number of vacant sites, 1 - Θ, and [A] is proportional to the collision number, i.e., the gas pressure P, we arrive atan expression:
or, rearranged for Θ,
which has been derived as early as 1916 by Irving Langmuir. Note that K is only a constant if the enthalpy of adsorption is independent of coverage. As with all equilibrium constants, K and, hence, the position of adsorption - desorption equilibrium, will depend on (i) the relative stabilities of the adsorbed and gas phase species involved, (ii) on the temperature of the system, and (iii) on the pressure of the gas above the surface. Factors (ii) and (iii) exert opposite effects on the concentration of adsorbed species - that is to say that the surface coverage may be increased by raising the gas pressure but will be reduced if - at constant pressure - the surface temperature is raised.
( )PKΘ−
Θ=
1 PKPK⋅+
⋅=Θ
1
[ ][ ] [ ]SA
SAK⋅
=

A somewhat more revealing derivation of the Langmuir adsorption isotherm is based on the fact that in adsorption - desorption equilibrium the rates of adsorption and desorption are equal. While the rate of adsorption is determined by the collision frequency of the gas phase particles with the surface according to:
(S0 stands for the uncovered fraction of the surface (∝
(1 - Θ)), P for the gas pressure), the desorption rate can easily be formulated as being proportional to the fraction of the surface covered by adsorbed particles (here denoted as S1 , i.e., ∝ Θ), a frequency factor ν, and an exponential term containing the depth of the potential well, i.e., the adsorption energy (Arrhenius equation):
Equating Rad and Rdes and introducing the coverage Θ
by noting that S1 ∝ Θ and S0 ∝
(1 - Θ) yields immediately the Langmuir expression derived before.
2. Thermodynamics of adsorption -The Langmuir adsorption isotherm
⎥⎦
⎤⎢⎣
⎡==
smparticlesSPkS
mkTPR adad 20
)1(02π
( ) ⎥⎦
⎤⎢⎣
⎡=⎟
⎠⎞
⎜⎝⎛−=
smparticlesTkS
kTESR des
desdes 2)1()1( expν

A closer inspection of the adsorption/desorption equilibrium helps to interpret the constant K(T) which comes out as :
with s0 representing the initial sticking coefficient, ν
the frequency factor of the desorption reaction and Nmax the maximum number of adsorbed particles: For non-activated adsorption, the desorption energy Edes is equal to the energy of adsorption, Ead . In the derivation given above we have assumed first-order processes both for the adsorption and the desorption reaction. For second-order processes, e.g. adsorption/desorption reactions involving rate-limiting dissociation and recombination steps, a similar expression can be derived
From the initial slope of a log - log plot of a Langmuir adsorption isotherm (K(T)P << 1), the order of adsorption can easily be determined (slope 1 = 1st order adsorption; slope 0,5 = 2nd order adsorption).
( ) )(exp2)( 21
max
0
kTEmkT
NsTK des−= π
ν
( )PTKPTK
p T '1)('
)(+
=Θ
2. Thermodynamics of adsorption -The Langmuir adsorption isotherm

2. Thermodynamics of adsorption -The Langmuir adsorption isotherm
If we plot the surface coverage against the concentration or the pressure of particles of the adsorbing phase, we arrive at typical saturation curves: Near the monolayer capacity all surface sites are occupied, and higher pressures cannot increase the coverage Θ
or surface concentration Γ
beyond Θ
= 1 anymore.
For single crystal surfaces, this well-known Langmuir isotherm describes the adsorption processes often quite well, especially at low and medium coverages. However, it fails if porous polycrystalline surfaces are used as adsorbents. Then, better the BET isotherm is applied.
What are the prerequisites for applying the Langmuir adsorption model?
• All adsorption sites must be equivalent regardless of whether we look at the very first or the final adsorbing particle: All have the same binding energy to the surface, and consequently, there is no coverage dependence of the heat of adsorption.
• The adsorption capacity is strictly limited to one and only one monolayer. Adsorption into multilayers is ruled out.
Apparently, the Langmuir model is quite limited and seldom applicable for practical purposes - in fact, the coverage dependence of the heat of adsorption must be taken into account as well as the possibility that more than just a single monolayer will adsorb. Various more sophisticated isotherms have been developed, among others the Temkin isotherm or the BET isotherm. The Temkin isotherm resembles somewhat the Langmuir isotherm except that a (linear) decrease of qst with Θ
is included, but still the
adsorption is restricted to a single monolayer.
2. Thermodynamics of adsorption -The Langmuir adsorption isotherm, cont‘d

The famous BET Isotherm first introduced in the 1930s by Brunauer, Emmett and Teller now considers also the possibility of multilayer adsorption and condensation as shown below.
2. Thermodynamics of adsorption -The BET adsorption isotherm

The forces responsible for the build-up of the second, third, and all following layers are van-der-Waals- like and are supported by low temperatures and high gas pressures. In contrast to the Langmuir behaviour, no saturation occurs at high pressures, but a true condensation of a liquid phase. Concerning the adsorption energies involved, one can clearly distinguish the adsorption enthalpy of the very first layer (which may well behave Langmuir-like), i.e., Echem , and the heat of condensation (= heat of evaporation) of all following layers, Econd . For the derivation of the BET isotherm it is essential to use a strict terminology, and we distinguish the following quantities:
• the rate of adsorption into the ith layer (clean surface = index o)P = pressure, S(i) = free surface area ( to empty surface sites)
• the rate of desorption from the ith layer
2. Thermodynamics of adsorption -The BET adsorption isotherm
)()()(
ii
adi
ad SPkR ⋅⋅=
kTE
ii
desi
des
i
eSkR)(
)()()( −
⋅=
∝

We deal with a strict (dynamic) equilibrium between adsorbate and the gas phase containing the adsorptive molecules, which is characterised by the identity of adsorption rate and desorption rate. Hence, for the first layer and the bare surface sites we have:
If we now consider the principal situation we first have a look how the surface S1 can change:
Altogether we have four processes that cause a change, namely:
• adsorption of a particle on the bare surface (1.) →
• desorption of a particle from the sample (2.) →
• adsorption of a particle onto the first layer (3.) →
• desorption of a particle from the second layer (4.) →
In equilibrium, however, the surface area S1 does NOT change, and all four processes taken together must not change the overall concentration c. Hence, processes I and IV increase S1 , while II and III decrease it:
(eq. (II))
2. Thermodynamics of adsorption -The BET adsorption isotherm
).()1(
)1()1(
)0()1( IeqeSkSPk kT
E
desad
−⋅=⋅⋅
kTE
desdes eSkR)1(
)1()1()1( −
⋅=0
)1()1( SPkR adad =
kTE
desdes eSkR)2(
)2()2()2( −
⋅=
PSkR adad ⋅= )1()2()2(
PSkeSkeSkPSk adkTE
deskT
E
desad )1()2(
)1()1(
)2()2(
)0()1(
)1()2(
+=+−−

Subtracting Eq. (1) from Eq. (2) yields immediately
Following this scheme, one realizes that we can continue these considerations for all following layers and obtain a general expression of the kind:
for all surface parts Si , with i = 1, 2, 3...∞. The total volume adsorbed is obtained when we multiply the surface part Si of each layer with the number of layers below and additionally multiply this with the specific volume per surface part S, V0
Vtotal = V0 = V0 (S0 + 1⋅S1 + 2 ⋅S2 + 3 ⋅S3 + ...)
2. Thermodynamics of adsorption -The BET adsorption isotherm
).()1()2(
)2()2(
)2(
IIIeqPSkeSk adkT
E
des ⋅=⋅−
).()()1(
)1()1(
)1(
IVeqPSkeSk ii
adkT
E
ii
des
i
⋅=⋅ +−
++
+
∑∞
=
⋅1i
iSi

Of interest is now the ratio between the total adsorbed volume Vtot and the volume of a perfect complete monolayer, Vm (which is nothing but the coverage Θ) :
In order to carry out these summations we have to make some (plausible) assumptions: First, all adsorption energies of the second and all higher layers will be set equal = EL , and second, we assume that all the ratios of adsorption/desorption constants are equal to a constant g:
as expected for a liquid-like behaviour. Note that the very first adsorbed layer is treated differently, because its rate constants as well as its adsorption energy is largely different from those of the higher layers. By defining
and introducing the constant c = y/x we can express all surface parts Si by S0 according to:
2. Thermodynamics of adsorption -The BET adsorption isotherm
∑
∑∞
=
∞
=
⋅==Θ
1
1
ii
ii
mono
total
S
Si
VV
gkk
kk
kk
nad
ndes
ad
des
ad
des ==== )(
)(
)3(
)3(
)2(
)2(
...
⎟⎠⎞
⎜⎝⎛=≥⎟
⎠⎞
⎜⎝⎛=
RTE
kkyandLwith
RTE
gPx
des
adL 1)1(
)1(
exp2exp

S1 = y S0 ;
S2 = x S1 = x y S0 ;
S3 = x S2 = x2 S1 = x2 y S0 ;
S4 = x S3 = x3 S1 = x3 y S0; or generally: Si = x Si - 1 = xi - 1 S1 = c xi S0
If we define the ratio of the total volume adsorbed / the volume of the monolayer as coverage Θ
(as we did before) we obtain:
In the denominator we have the sum of an infinite geometric progression: And similarly, we have:
2. Thermodynamics of adsorption -The BET adsorption isotherm
⎟⎠
⎞⎜⎝
⎛+
⋅=
⎟⎠
⎞⎜⎝
⎛+
⋅⋅⋅==Θ
∑
∑
∑
∑∞
=
∞
=∞
=
∞
=
1
1
10
10
11i
i
i
i
i
i
i
i
mono
total
xc
xic
xcS
xiSc
VV
xxx
ii −=∑
∞
= 11
( )211
2321
1 11...321...32
xx
xx
dxdxx
dxdxxxxxxxxi
i
i
iii −
=⎟⎠⎞
⎜⎝⎛
−=⋅=+++=+++=⋅ ∑∑∑
∞
=
∞
=
∞
=

2. Thermodynamics of adsorption -The BET adsorption isotherm
( ) ( ) ( ) ( ) ( ) ( )cxxxcx
xcx
xxc
VV
xcxx
xcx
mono
total
+−⋅−=
⋅−=
+⋅
−⋅
==Θ−+−
− 11111
1 112
12
This expression can be rearranged to yield:
The unknown quantity x can be substituted by the fact that the volume Vtotal must become infinity for p = p0. Since Vmono is always finite, x has to become 1 for this case. Otherwise, X = p/p0 . Since p as well as p0 are measurable quantities, we have thus eliminated the unknown quantity x and finally arrive at the famous BET isotherm in the common form:
Two limiting cases can be distinguished: a) the constant C >> 1, then the heat of adsorption of the very first monolayer is large compared to the condensation enthalpy, and adsorption into the second layer only occurs once the first layer is completely filled. For C >> 1 and p << p0 the BET isotherm changes to the Langmuir isotherm. b) Conversely, if C is small, then E1 is smaller or comparable to EL, and a multilayer adsorption already occurs while the first layer is still incomplete.
xVc
ccVx
xV monomonotot
1111
1⋅
−+
⋅=⎟
⎠⎞
⎜⎝⎛
−
00
1111pp
Vcc
Vcppp
V monomonototal
⋅⋅−
+⋅
=⎟⎟⎠
⎞⎜⎜⎝
⎛−

2. Thermodynamics of adsorption -The BET adsorption isotherm
For a successful determination of a „BET surface“ the limiting case a) is required, i.e., C >> 1. In this
case, a plot of yields a straight line with positive slope and intercept from
which the constant c and the monolayer sorption capacity can be obtained. Knowing the space
requirement of the adsorbed gas then enables one to calculate the specific active surface of the
respective catalyst material.
0
.1ppvs
ppp
V ototal − monoVc ⋅1
2. Thermodynamics: practical measurement of adsorption isotherms
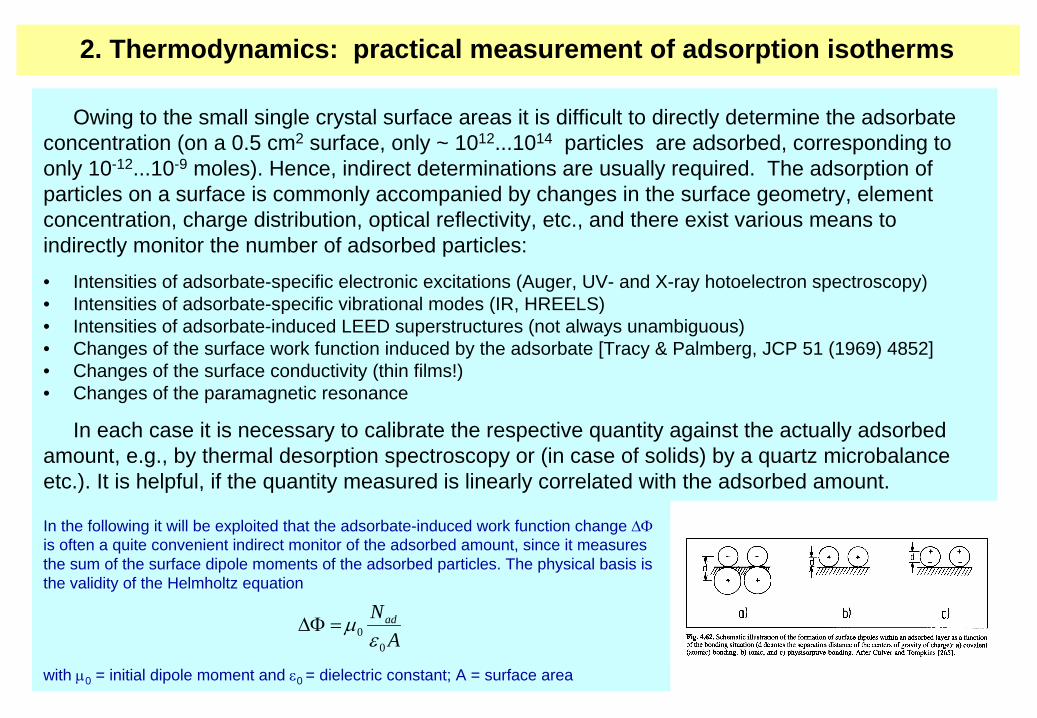
Owing to the small single crystal surface areas it is difficult to directly determine the adsorbate concentration (on a 0.5 cm2 surface, only ~ 1012...1014 particles are adsorbed, corresponding to only 10-12...10-9 moles). Hence, indirect determinations are usually required. The adsorption of particles on a surface is commonly accompanied by changes in the surface geometry, element concentration, charge distribution, optical reflectivity, etc., and there exist various means to indirectly monitor the number of adsorbed particles:
• Intensities of adsorbate-specific electronic excitations (Auger, UV- and X-ray hotoelectron spectroscopy)• Intensities of adsorbate-specific vibrational modes (IR, HREELS) • Intensities of adsorbate-induced LEED superstructures (not always unambiguous)• Changes of the surface work function induced by the adsorbate [Tracy & Palmberg, JCP 51 (1969) 4852]• Changes of the surface conductivity (thin films!)• Changes of the paramagnetic resonance
In each case it is necessary to calibrate the respective quantity against the actually adsorbed amount, e.g., by thermal desorption spectroscopy or (in case of solids) by a quartz microbalance etc.). It is helpful, if the quantity measured is linearly correlated with the adsorbed amount.
In the following it will be exploited that the adsorbate-induced work function change ΔΦ
is often a quite convenient indirect monitor of the adsorbed amount, since it measures the sum of the surface dipole moments of the adsorbed particles. The physical basis is the validity of the Helmholtz equation
with μ0 = initial dipole moment and ε0 = dielectric constant; A = surface area
ANad
00 ε
μ=ΔΦ
2. Thermodynamics: practical measurement of adsorption isotherms
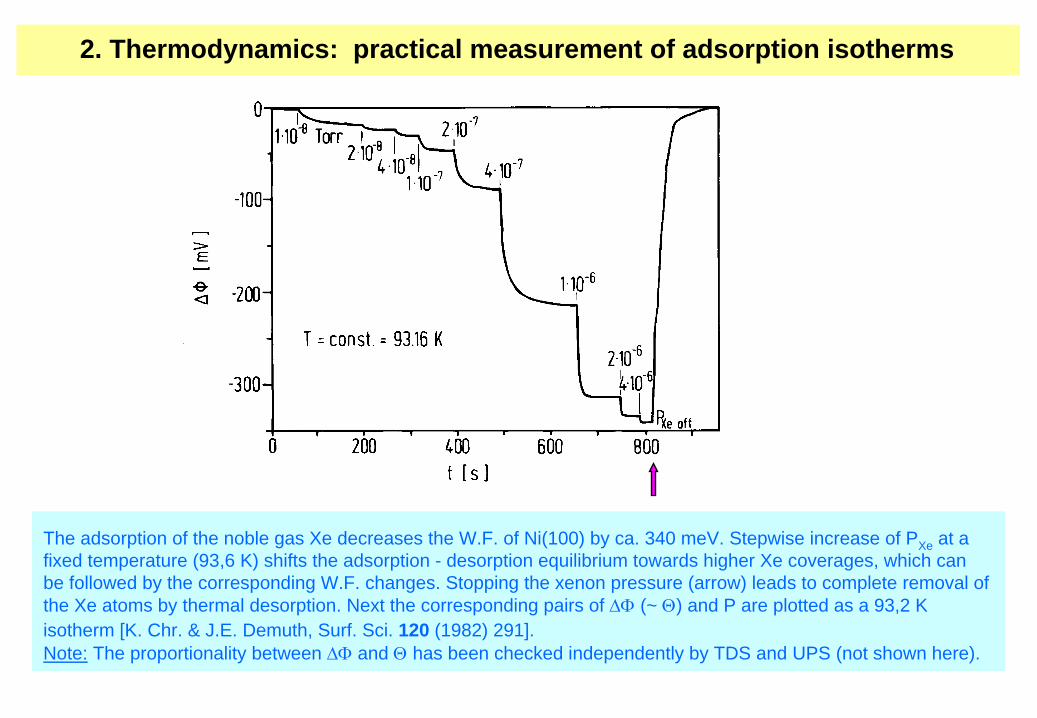
The adsorption of the noble gas Xe decreases the W.F. of Ni(100) by ca. 340 meV. Stepwise increase of PXe at a fixed temperature (93,6 K) shifts the adsorption - desorption equilibrium towards higher Xe coverages, which can be followed by the corresponding W.F. changes. Stopping the xenon pressure (arrow) leads to complete removal of the Xe atoms by thermal desorption. Next the corresponding pairs of ΔΦ
(~ Θ) and P are plotted as a 93,2 K isotherm [K. Chr. & J.E. Demuth, Surf. Sci. 120 (1982) 291].Note: The proportionality between ΔΦ
and Θ
has been checked independently by TDS and UPS (not shown here).

One immediately realises that the adsorption - desorption equilibrium leading to a given Xe coverage (e.g., Θ
= 0,5) can be achieved by different pressures and temperatures. This leads us to the important quantity hidden in the adsorption isotherm, namely, the differential heat of adsorption: The strength of the adsorbate bond determines how high the temperature must be to remove an adsorbed particle from the surface and to what extent one has to increase the pressure in order to push this particle back to the surface. At this point we recall the Clausius-Clapeyron equation describing the adsorption - desorption equilibrium:
22
ln1RT
qdT
PdRT
hhdTdP
PstOFadg Δ
=⎟⎠⎞
⎜⎝⎛=
−=⎟
⎠⎞
⎜⎝⎛
Θ
+
Γ
2. Thermodynamics: practical measurement of adsorption isotherms
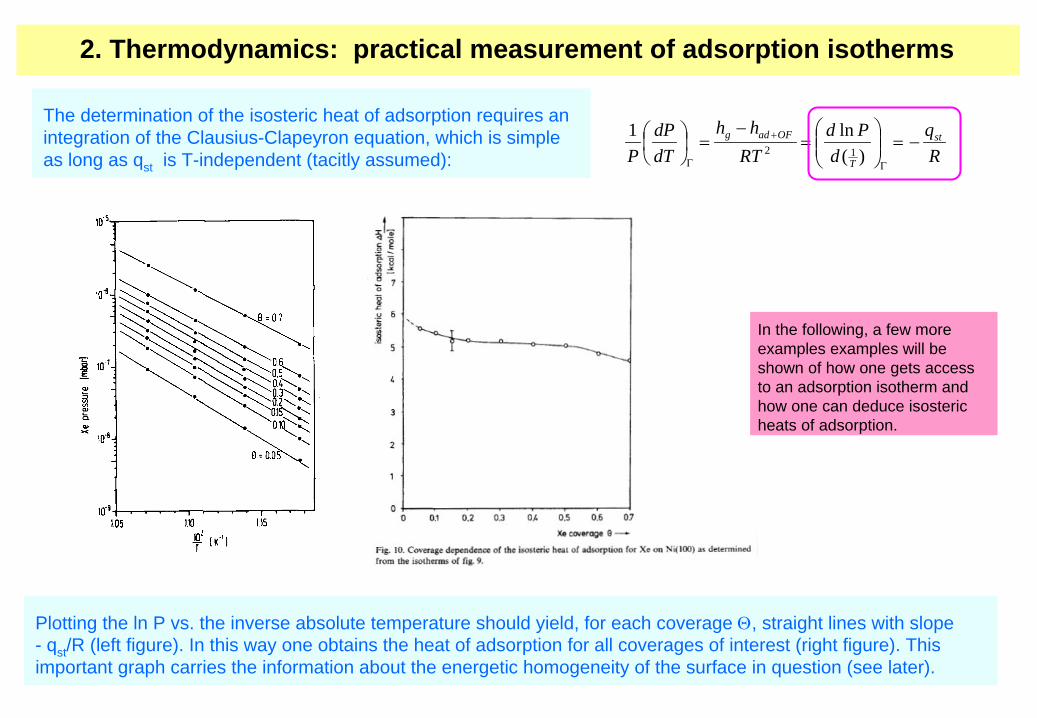
The determination of the isosteric heat of adsorption requires an integration of the Clausius-Clapeyron equation, which is simple as long as qst is T-independent (tacitly assumed): R
qd
PdRT
hhdTdP
Pst
T
OFadg −=⎟⎟⎠
⎞⎜⎜⎝
⎛=
−=⎟
⎠⎞
⎜⎝⎛
Γ
+
Γ )(ln1
12
Plotting the ln P vs. the inverse absolute temperature should yield, for each coverage Θ, straight lines with slope - qst /R (left figure). In this way one obtains the heat of adsorption for all coverages of interest (right figure). This important graph carries the information about the energetic homogeneity of the surface in question (see later).
In the following, a few more examples examples will be shown of how one gets access to an adsorption isotherm and how one can deduce isosteric heats of adsorption.
2. Thermodynamics: practical measurement of adsorption isotherms

Example: CO + Pd(111) G. Ertl & J. Koch, Z. Naturf. 25a (1970) 1906
2. Thermodynamics: practical measurement of adsorption isotherms
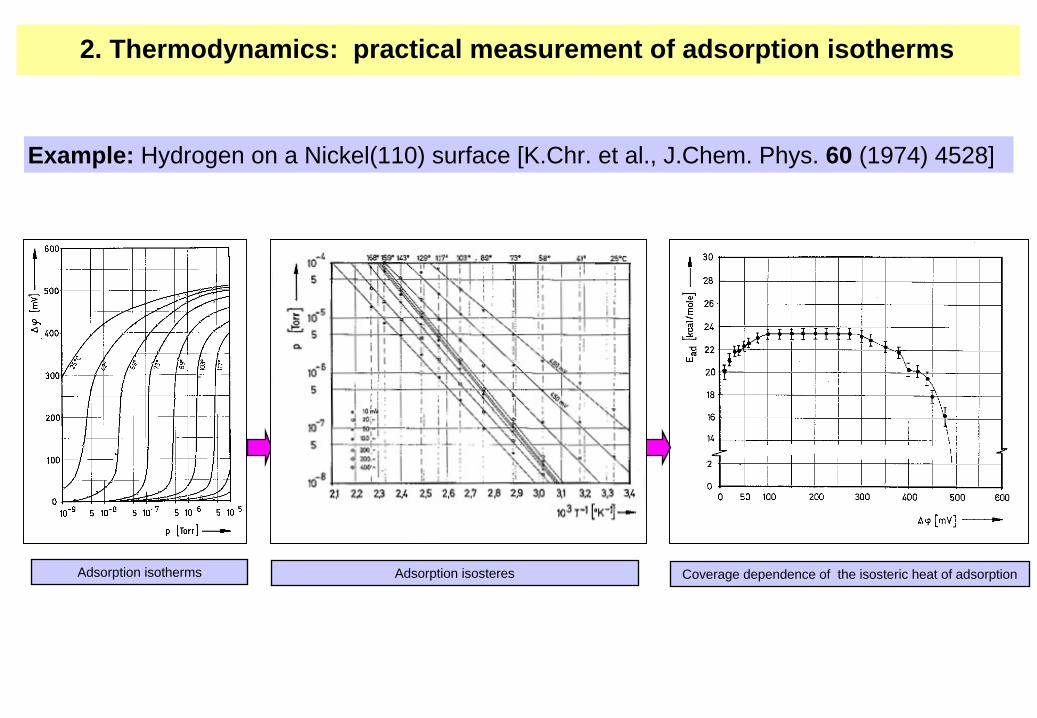
Example: Hydrogen on a Nickel(110) surface [K.Chr. et al., J.Chem. Phys. 60 (1974) 4528]
Adsorption isosteres Coverage dependence of the isosteric heat of adsorption Adsorption isotherms
2. Thermodynamics: practical measurement of adsorption isotherms
2. Thermodynamics: calorimetric measurements of the heat of adsorption
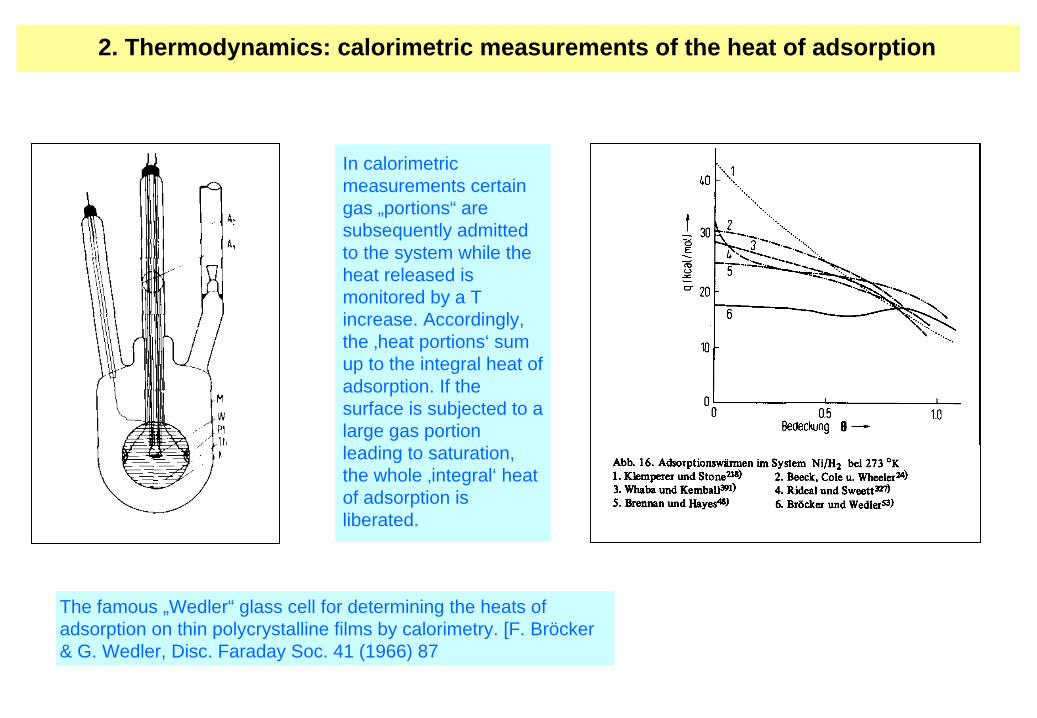
The famous „Wedler“ glass cell for determining the heats of adsorption on thin polycrystalline films by calorimetry. [F. Bröcker & G. Wedler, Disc. Faraday Soc. 41 (1966) 87
In calorimetric measurements certain gas „portions“ are subsequently admitted to the system while the heat released is monitored by a T increase. Accordingly, the ‚heat portions‘ sum up to the integral heat of adsorption. If the surface is subjected to a large gas portion leading to saturation, the whole ‚integral‘ heat of adsorption is liberated.

2. Thermodynamics: calorimetric measurements of the heat of adsorption
The technique of calorimetric measurements has been revived by modern instrumentation, c.f., M.C. Crowe & C.T. Campbell, Annu. Rev. Anal. Chem. 4 (2011) 41 - 58 and references therein. Pioneering first work performed in the group of D.A. King (Cambridge): • Stuckless
JT, Al-Sarraf
N, Wartnaby
C, King DA. Calorimetric heats of adsorption for CO onnickel single crystal surfaces. J. Chem. Phys. 99 (1993) 2202•
Brown WA, Kose R, King DA., Femtomole adsorption calorimetry on single-crystal surfaces. Chem.Rev. 98 (1998) 797
(a) The Campbell group’s single-crystal adsorption calorimetry (SCAC) pyroelectric heat detector assembly, which houses a polyvinylidene fluoride (PVDF) ribbon (4 mm wide, held in a 6-mm-diameter arc), shownretracted from a single-crystal sample holder that exposes an 8-mm-diameter area of the Pt(111) sample’s surface. A linear translator is used to press the pyroelectric detector into good thermal contact with the backface of the sample during heat measurement. The ribbon is fully coated on the front and back faces with a thin layer of aluminum, as received from the manufacturer (Goodfellow).
(b) Schematic of an SCAC experiment. The molecular beam emits spatiotemporally resolved pulses of gas-phase atoms or molecules that impinge on the sample surface; the pyroelectric heat detector, shown pressed into contact with the back face of a single-crystal sample, measures temperature changes associated with adsorption events.
(c) Exploded view of the detector assembly, showing the PVDF ribbon with patterned aluminum electrodes, ribbon- mounting hardware, and a portion of the associated electronic circuitry.

2. Thermodynamics: calorimetric measurements of the heat of adsorption
Measured heat
of Ag atom adsorption
on oxide surfaces, versus the diameter
of the
Ag particle
to which it adsorbs, for four
different surfaces: two
4-nm-thick
CeO2
(111) films with
different extents
of surface reduction
(CeO2-x , x = 0.1 and 0.2), a 1-nm-thick
CeO
1.9
(111) film, and a 4-nm-thick MgO(100) film. The first three films were grown
on Pt(111), and the fourth
was grown
on Mo(100). (Right) Structural models for perfect
CeO2
(111) and MgO(100); black lines indicate their unit cells. After Farmer JA, Campbell CT. 2010. Ceria maintains smaller
metal catalyst particles by strong
metal-support binding. Science 329:933–36

The so-called initial adsorption energy E0 is released by the very first particle arriving at the clean surface. It is a characteristic quantity for any given adsorption system and reflects the principal strength of the interaction between adsorbate and substrate (cf. Table on the left-hand side).
Initial heats of adsorption for some selected adsorption systems
On a given surface there can inherently exist adsorption sites with different local geometry providing different chemical coordination; good examples being surfaces with regular steps. Usually, the strength of adsorbate – substrate interaction increases with the coordination number. Example: H/Pd.
Real-space model of a real surface with various defects (steps, kinks, holes etc.)
Coverage dependence of Ead for Pd(111)/H: full circles: smooth (111) surface; open circles: periodically stepped Pd(111) surface (after Conrad et al.)
Adsorbate Surface E0 from...to [kJ/Mol] hydrogen H2 Ru(0001)(1x1)-H 2...5 oxygen O2 Ru 10...20 carbon dioxide CO2 Cu 10...30 xenon Xe Ni 15...25 xenon Xe Pd 20...40 hydrogen H (from H2) Pt 60...80 hydrogen H (from H2) Co, Ni, Ru, Rh, Pd 30...100 hydrogen H (from H2) Mo, W, Re 125...175 carbon monoxide CO Ni, Pd 100...150 oxygen O (from O2) Ru, Pd 200...250 oxygen O (from O2) Rh, Re 200...300 copper Cu Ru, W, Re 250...330
2. Thermodynamics of adsorption: initial heat of adsorption and a-priori heterogeneity

Schematic representation of the potential modulation
Even the very first adsorbing particle may alter both shape and depth of the adsorption potentials of neigh-boring sites, due to lateral interactions. The respective forces can be attractive or repulsive. The distance dependence of the total potential (c) is a superposition of the periodic potential of the uncovered crystal surface (a) and the particle pair potential (b).The interactions can be mediated either by direct orbital – orbital repulsions („direct“ interactions) or through the substrate („indirect“ interactions). The reason is that the charge associated with a given adsorption site is shared between adjacent ad- particles, as illustrated below.
2. The adsorption energy: a-posteriori heterogeneity; induced lateral interactions
Often, lateral interactions become feasible only beyond a certain critical adsorbate surface concentration. Since they are mostly repulsive, one observes a sudden drop in the heat of adsorption. Example: CO adsorption on Ru(0001) [Pfnür et al.]: Up to a -R30° structure the CO molecules can occupy equivalent sites; thereafter the adsorbed COs feel the repulsive forces to the neighbors. Consequently, the heat of adsorption falls abruptly by ca. 50 kJ/Mol.
33 x

3. Adsorption and desorption as kinetic phenomena
• As in any chemical reaction, surface processes involve breaking and making of bonds. This can involve substantial amounts of energy.
• However, as one can see from the stability of a mixture of hydrogen and oxygen gas, there are many metastable reaction systems which cannot (at least not without external support) reach equilibrium. Reason: Large activation barriers slow down the reaction rate.
• This is what catalysis is all about: A catalyst provides an easier reaction path offering a greatly reduced activation energy barrier. In a sense, an active surface which readily adsorbs and dissociates molecules from the gas phase is nothing but an efficient catalyst.

Consider the rate of an ordinary chemical reaction of type A → B. The general definition of the reaction rate is change per time, i.e. number of molecules per time, or concentration change of a certain species per unit time interval:
For surface reactions, two-dimensional concentrations must be considered instead (quantities related to unit area)
Often, rates are expressed in terms of change of coverage Θ
= , with 0 < Θ
< 1.
][][][][3 sVolume
particlesindt
dNdt
dNRorsdm
molesindtPd
dtAdRRate PA
⋅+=−=
⋅+=−=
dtd
sareaunitparticlesin
dtdN
dtdN
Rorsdm
molesindtPd
dtAdRRate PSAS Θ
=⋅
+=−=⋅
+=−= ][][][][ ,,2
3. Adsorption and desorption kinetics:The rate of adsorption – terminology
max,ad
ad
NN

In an adsorption experiment, an initially bare surface is exposed to a certain gas pressure P, and the rate of collision of the gas particles with the unit surface is given by kinetic theory:
“Collision frequency”
The decisive process now is the so-called trapping or sticking: Will the impinging particle stay on the surface or will it be reflected? The respective probability is called (initial) “sticking probability” s0 and varies between zero and one. As the surface is gradually covered, s decreases – simply because the number of empty adsorption sites becomes smaller.If an adsorbed particle statistically occupies • a single site, s(Θ) = 1 - Θ; →
1st order adsorption; if it dissociates, two sites are blocked by one collision event, and accordingly • s(Θ) = (1- Θ)(1- Θ) = (1 - Θ)2 →
2nd order adsorption. Sometimes, the adsorption reaction requires a certain activation energy . Only particles having at least this energy will be able to stick.
⎥⎦⎤
⎢⎣⎡
⋅=
⋅ smparticles
mkTP
dtAdN
22π
3. Adsorption and desorption kinetics: The rate of adsorption – terminology
*adE
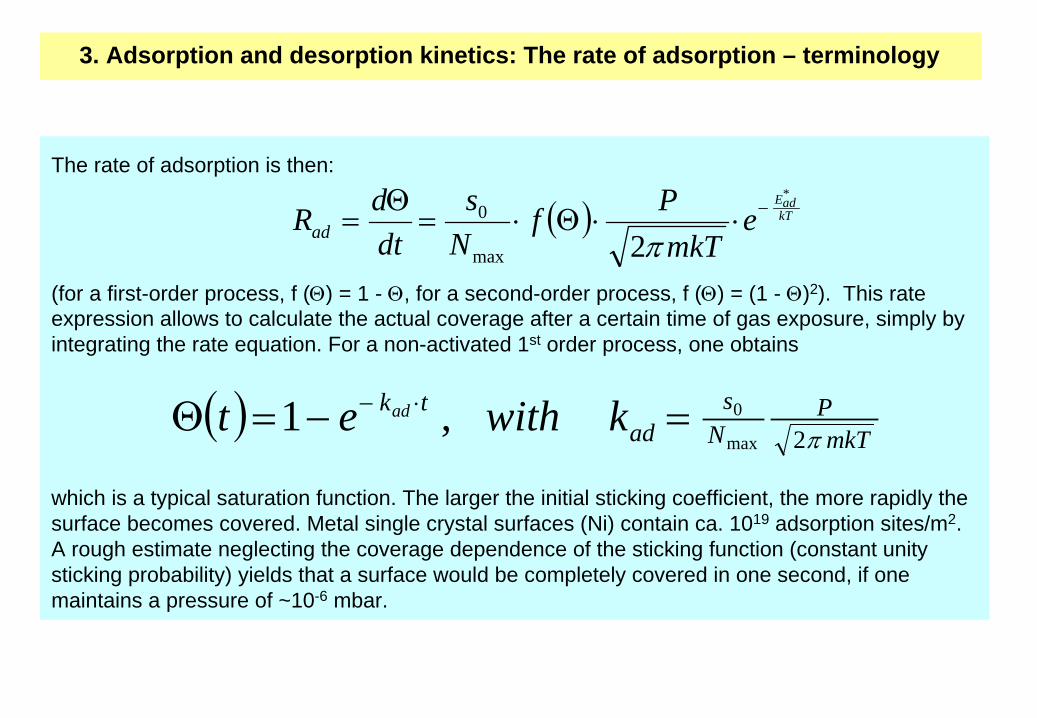
The rate of adsorption is then:
(for a first-order process, f (Θ) = 1 - Θ, for a second-order process, f (Θ) = (1 - Θ)2). This rate expression allows to calculate the actual coverage after a certain time of gas exposure, simply by integrating the rate equation. For a non-activated 1st order process, one obtains
which is a typical saturation function. The larger the initial sticking coefficient, the more rapidly the surface becomes covered. Metal single crystal surfaces (Ni) contain ca. 1019 adsorption sites/m2. A rough estimate neglecting the coverage dependence of the sticking function (constant unity sticking probability) yields that a surface would be completely covered in one second, if one maintains a pressure of ~10-6 mbar.
( ) kTadE
emkT
PfN
sdtdRad
*
2max
0 −⋅⋅Θ⋅=Θ
=π
( )mkT
PN
sad
tk kwithet ad
π2max
0,1 =−=Θ ⋅−
3. Adsorption and desorption kinetics: The rate of adsorption – terminology

The initial sticking probability s0 is an interesting quantity; it contains all dynamical and steric effects and is governed by the ability or effectiveness of a given particle to dissipate its kinetic energy to the heat bath of the surface (phonon excitation; electron – hole pair excitation). The sticking of diatomic molecules, hydrogen in particular, is of special interest, since the sticking at finite temperatures includes the dissociation reaction (activated and non-activated dissociation paths).
An extensive consideration of the quantum-dynamical background of sticking can be found in the book by A. Groß (“Theoretical Surface Science”, Springer Berlin 2003)
Complications can arise when the colliding particle is trapped for some time (typically microseconds) in a weak potential in which it can freely move across the surface and search for an empty adsorption site. This weakly bound state is called a precursor. Major consequence of a precursor state: The sticking – coverage function f(Θ) is no longer linear, but has a convex shape: At not too large coverages the sticking remains high, but as the diffusion length in the precursor state becomes shorter than the mean diameter of the already covered area (island), the particles can no longer be accommodated and are finally reflected back into the gas phase before they can find an empty site.
3. Adsorption and desorption kinetics: The rate of adsorption – terminology
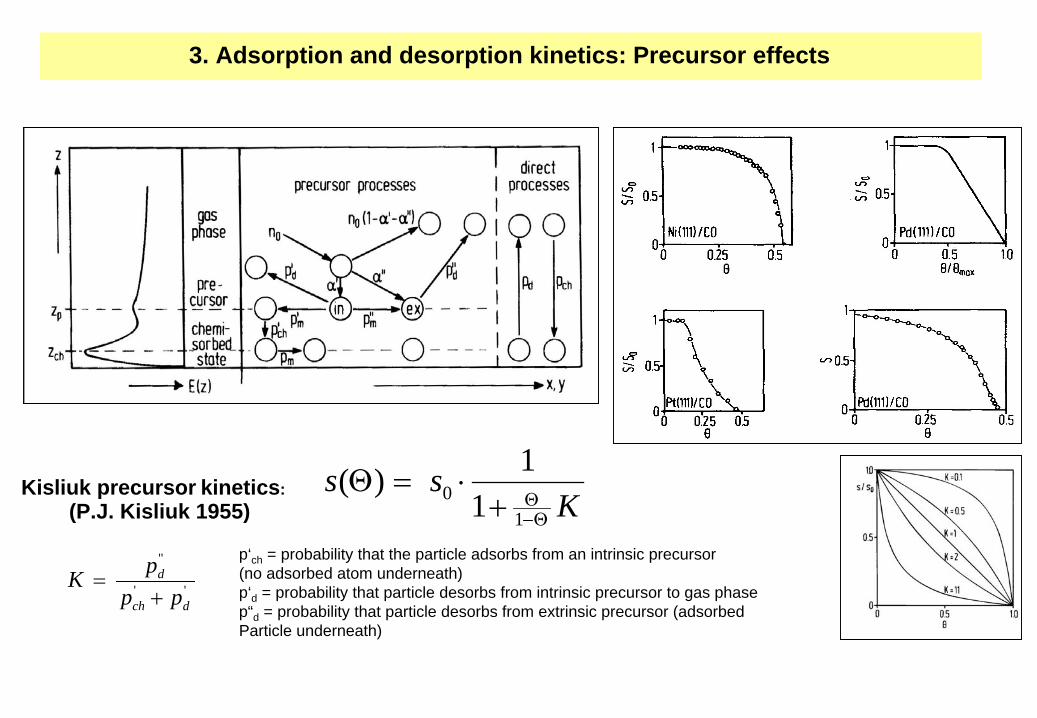
Kss
Θ−Θ+
⋅=Θ1
0 11)(Kisliuk precursor kinetics:
''
"
dch
d
pppK+
=
(P.J. Kisliuk 1955)
p‘ch = probability that the particle adsorbs from an intrinsic precursor(no adsorbed atom underneath)p‘d = probability that particle desorbs from intrinsic precursor to gas phasep“d = probability that particle desorbs from extrinsic precursor (adsorbedParticle underneath)
3. Adsorption and desorption kinetics: Precursor effects

3. Adsorption and desorption kinetics: The rate of desorption – terminology
The removal of particles from the adsorbed state into the gas phase is called desorption. It can be achieved bythermal energy (thermal desorption, temperature-programmed desorption), electron impact (EID, DIET), ion impact, resonant photon irradiation etc. Here, only thermal desorption is considered. Again, desorption is understood as a normal chemical reaction and described by the respective kinetic formalism: Aad →
Agas with rate constant kdes .
Upon introducing again the coverage Θ
= Nad /Nmax we obtain:
As in any chemical reaction with an activation barrier, kdes can be expressed as a product of a pre-exponential factor, ν
des , and an exponential term containing the activation energy :
Inserting this in the first equation yields the well-known Polanyi-Wigner equation which is the basis for a determination of both energetic and kinetic quantities from a thermal desorption spectrum:
Rate of desorption: R = R (Θ, T) =
1max
−⋅Θ⋅=Θ
− xxdes Nk
dtd
⎟⎠⎞
⎜⎝⎛−⋅=
kTEk des
des expν
⎥⎦
⎤⎢⎣
⎡⋅
⋅=−sm
particlesNkdt
dN xaddes
ad2
kTdesE
eNdtd xx
x−− ⋅⋅Θ⋅=
Θ− 1
maxν
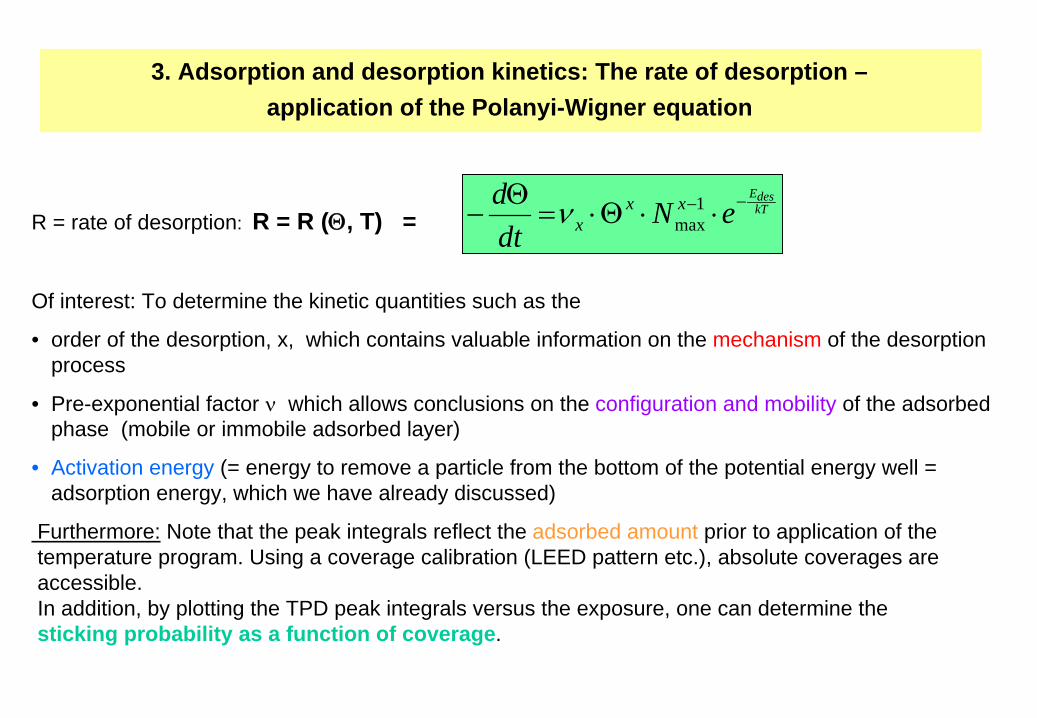
R = rate of desorption: R = R (Θ, T) =
Of interest: To determine the kinetic quantities such as the
• order of the desorption, x, which contains valuable information on the mechanism of the desorption process
• Pre-exponential factor ν
which allows conclusions on the configuration and mobility of the adsorbed phase (mobile or immobile adsorbed layer)
• Activation energy (= energy to remove a particle from the bottom of the potential energy well = adsorption energy, which we have already discussed)
Furthermore: Note that the peak integrals reflect the adsorbed amount prior to application of thetemperature program. Using a coverage calibration (LEED pattern etc.), absolute coverages areaccessible. In addition, by plotting the TPD peak integrals versus the exposure, one can determine thesticking probability as a function of coverage.
kTdesE
eNdtd xx
x−− ⋅⋅Θ⋅=
Θ− 1
maxν
3. Adsorption and desorption kinetics: The rate of desorption –application of the Polanyi-Wigner equation

3. The rate of desorption: Visualisation of the Polanyi-Wigner equation
The desorption rate of Cu from Re(0001) as a function of two variables T and Θ
[R. Wagner + K.C. Surf. Sci. 469 (2000) 55]

Thermal Desorption spectroscopy
is probably the most frequently used method to gain information on the energetics and kinetics of adsorbed particles.
The adsorbate-covered surface is heated (mostly in a time-linear fashion), while the desorbing particles are collected and monitored with a mass spectrometer. In a pumped recipient one obtains pressure maxima right at those temperatures, where most of the substrate – adsorbate bonds are thermally cleaved. The obtained desorption peaks contain all relevant information about activation energies for desorption, reaction orders and surface concentrations as pointed out before.
Typical experimental set-up for a TD experiment
3. The experimental procedure: Taking TPD spectra

There exist different procedures to evaluate TD spectra. Relatively simple is the Redhead analysis [P.A. Redhead, Vacuum 12 (1962) 201], which neglects coverage dependences. More accurate, but more complex, are line-shape analyses such as the ones described by E. Bauer [Surf.Sci. 53 (1975) 87] or by D.A. King [Surf.Sci. 47 (1975) 384], which explicitly consider Θ
dependences. Here briefly commented: line shape analysis by King.
3. The experimental procedure: Evaluating TPD spectra
a) Family of thre TD curves. After various desorption times t different amounts of adsorbates σt are left on the surface. These times vary linearly with the surface temperatures T. At times t1 , t2 , t3 different desorption rates dσ/dt are obtained for each individual TD curve.
b) For each TD curve 1, 2 and 3, σt is plotted against time t or temperature T; one obtains s-like descending curves. Horizontal cuts at various σt values establish the condition that a fixed coverage is obtained at different temperatures T1 , T2 , and T3 for each TD curve.
c) A plot of ln(dσ/dt) vs T-1 yields isosteric straight lines whose slopes contain the´desorption energy Edes at the respective coverage σt . If either the pre-exponential v or the desorption order x is known, the respective other quantity can be evaluated from the intercept. [D.A. King, Surf.Sci. 47 (1975) 384]

TD spectra of Ag from Re(0001) Θ-dependence of ν
and Edes Ag/Re
D. Schlatterbeck et al, Surf.Sci. 418 (1998) 240
3. The experimental procedure: Evaluating TPD spectra

Depending on the strength of the interaction energy one distinguishes between physisorption and chemisorption. This distinction is, however, not rigid. Below, say, 20 kJ/Mol there is genuine physisorption, the interaction is dominated by van- der-Waals-forces. Example: Rare gas adsorption on graphite, hydrogen adsorption on Ru(0001)/(1x1)-H. Beyond 50 kJ/Mol there dominates chemisorption with „chemical“ binding forces. Example: oxygen adsorption on a rhodium(110) face.
Oxygen desorption from a Rh(110)-surface
The heats of adsorption and desorptionrange between 200 and 300 kJoule/Mol !
TD spectra of H2 from a Ru(0001) surface (after Frieß et al.)
Notice the extremely lowdesorption temperatures !
Notice the extremely highDesorption temperatures!
The heats of adsorption and desorption range only between 1,6 and 2,9 kJoule/Mol !
Physisorption and chemisorption as monitored by thermal desorption spectroscopy

In heterogeneous catalysis surfaces help to concentrate the reactants from the gas phase at phase boundaries and, more importantly, to stretch or even break inner-molecular bonds and to facilitate bond- making with coadsorbed species. However, too loosely bound molecules may stay only very shortly on the surface and are immediately lost by desorption, while too strongly bound species are immobile and cannot take part in Langmuir-Hinshelwood surface reactions. Consequently, it is advantageous, if adsorbates are bound moderately strong. This is illustrated in the right-hand frame showing the activity for methane formation from synthesis gas (CO+H2 ). These typical vulcano curves are known for various adsorbates.
One additional remark about the importance of the adsorption in heterogeneous catalysis
A second effect is crucial: In surface reactions, often homonuclear diatomic molecules with strong covalent bonds must be cleaved. Their potential energy minima lie far away from the surface, and there exist strong activation barriers for dissociation, an example being nitrogen N2 interacting with Fe surfaces. Adding electropositive or –negative species changes the local surface charge density and often increases the adsorption energy of the molecules. Consequently, activation barriers for dissociation are reduced. An effect of this kind was found, for example, by Ertl and coworkers for nitrogen molecules interacting with clean and potassium-covered Fe single crystal surfaces. It can also be made responsible for the acceleration of CO hydration reactions by coadsorbed alkali metals.
Summary and outlook

1) G. Ertl & J. Küppers, Low-energy Electrons and Surface Chemistry, 2. Auflage, Verlag Chemie, Weinheim 1985
2) W. Göpel & M. Henzler, Oberflächenphysik des Festkörpers, Teubner-Verlag, Stuttgart 1993
3) K. Christmann, Introduction to Surface Physical Chemistry, Steinkopff-Verlag, Darmstadt 1991
4) M.W. Roberts & C.S. McKee, Chemistry of the Metal-Gas Interface, Clarendon, Oxford 1978
5) A. Clark, The Theory of Adsorption and Catalysis, Academic Press, New York 1970
6) A. Clark, The Chemisorptive Bond - Basic Concepts , Academic Press, New York 1974
7) E. Shustorovich, Hrsg., Metal - Surface Reaction Energetics, VCH-Verlagsges. Weinheim 1991
8) G. Ertl, in: The Nature of the Surface Chemical Bond (G. Ertl & T.N. Rhodin, eds.), North Holland Publishing Company, 1979, Ch. V, pp. 315 - 380.
9) D. Menzel in: Interactions on Metal Surfaces (R. Gomer, ed.), Series: Topics in Applied Physics, Vol. 4, Springer-Verlag Berlin, Heidelberg, New York, 1975, Ch. 4, pp. 101 - 142
10) R.I. Masel, Principles of Adsorption and Reaction on Solid Surfaces, Wiley, New York 1996
As well as various original publications and textbooks on adsorption/desorption phenomena.
Some literature for further reading