THERMODYNAMIC ANALYSIS OF THE NET POWER OXY- COMBUSTION …
12
Paper ID: ETC2019-030 Proceedings of 13-th European Conference on Turbomachinery Fluid dynamics & Thermodynamics ETC13, April 8-12, 2018; Lausanne, Switzerland OPEN ACCESS Downloaded from www.euroturbo.eu 1 Copyright © A. Rogalev et al. THERMODYNAMIC ANALYSIS OF THE NET POWER OXY- COMBUSTION CYCLE A. Rogalev 1 - V. Kindra 2 - S. Osipov 3 - N. Rogalev 2 1 Department of Innovative Technologies of High-Tech Industries 2 Department of Thermal Power Plants 3 Department of Steam and Gas Turbines National Research University “Moscow Power Engineering Institute” 14 Krasnokazarmennaya Street, 111250, Moscow, Russia [email protected] - [email protected] - [email protected] - [email protected] ABSTRACT This study presents the thermodynamic analysis results of the NET Power cycle featuring nearly 100% CO2 capture level. Significant initial pressure, low turbine pressure ratio, recuperation of heat in regenerator allow achieving very high net efficiency. The cycle design parameters are set up on the basis of the component technologies of today’s state-of-the-art gas turbines. The models of cooled gas turbine compartment and multi-flow high temperature regenerator were developed. The potential pinch points were analyzed. An influence of turbine inlet temperature and pressure, turbine outlet pressure, turbine coolant temperature, cooling water temperature on cycle efficiency was estimated. The performance penalty due to the oxygen production and carbon dioxide capture was examined. For the optimal parameters, the net efficiency of the NET Power cycle is 56.5%. An influence of equipment characteristics adopted in simulation such as turbine and compressor polytropic efficiency on the results was estimated. The sensitivity analysis of the main cycle parameters was provided. KEYWORDS SUPERCRITICAL CARBON DIOXIDE, THERMODYNAMIC ANALYSIS, OXY-FUEL COMBUSTION CYCLE NOMENCLATURE B coefficient depending on the BIOT number, [-] Cp isobaric mass heat capacity, [kJ/(kg·°C)] G massflow [kg/s] Kcool cooling flow factor, [-] P pressure, [Pa] T temperature, [°C] S turbine efficiency factor, [-] Ψ cooling flow fraction, [-] ε0 cooling effectiveness, [-] εf film-cooling effectiveness, [-] ηint internal model effectiveness, [-] ηoi.cool polytropic efficiency of a cooled stage, [%] ηoi.i polytropic efficiency of a stage without cooling losses, [%] ASU air separation unit
Transcript of THERMODYNAMIC ANALYSIS OF THE NET POWER OXY- COMBUSTION …

Paper ID: ETC2019-030 Proceedings of 13-th European Conference on Turbomachinery Fluid dynamics & Thermodynamics ETC13, April 8-12, 2018; Lausanne, Switzerland
OPEN ACCESS Downloaded from www.euroturbo.eu
1 Copyright © A. Rogalev et al.
THERMODYNAMIC ANALYSIS OF THE NET POWER OXY-
COMBUSTION CYCLE
A. Rogalev1 - V. Kindra2 - S. Osipov3 - N. Rogalev2
1Department of Innovative Technologies of High-Tech Industries 2Department of Thermal Power Plants
3Department of Steam and Gas Turbines
National Research University “Moscow Power Engineering Institute”
14 Krasnokazarmennaya Street, 111250, Moscow, Russia
[email protected] - [email protected] - [email protected] - [email protected]
ABSTRACT
This study presents the thermodynamic analysis results of the NET Power cycle featuring
nearly 100% CO2 capture level. Significant initial pressure, low turbine pressure ratio,
recuperation of heat in regenerator allow achieving very high net efficiency. The cycle design
parameters are set up on the basis of the component technologies of today’s state-of-the-art gas
turbines. The models of cooled gas turbine compartment and multi-flow high temperature
regenerator were developed. The potential pinch points were analyzed. An influence of turbine
inlet temperature and pressure, turbine outlet pressure, turbine coolant temperature, cooling
water temperature on cycle efficiency was estimated. The performance penalty due to the
oxygen production and carbon dioxide capture was examined. For the optimal parameters, the
net efficiency of the NET Power cycle is 56.5%. An influence of equipment characteristics
adopted in simulation such as turbine and compressor polytropic efficiency on the results was
estimated. The sensitivity analysis of the main cycle parameters was provided.
KEYWORDS
SUPERCRITICAL CARBON DIOXIDE, THERMODYNAMIC ANALYSIS, OXY-FUEL
COMBUSTION CYCLE
NOMENCLATURE
B coefficient depending on the BIOT number, [-]
Cp isobaric mass heat capacity, [kJ/(kg·°C)]
G massflow [kg/s]
Kcool cooling flow factor, [-]
P pressure, [Pa]
T temperature, [°C]
S turbine efficiency factor, [-]
Ψ cooling flow fraction, [-]
ε0 cooling effectiveness, [-]
εf film-cooling effectiveness, [-]
ηint internal model effectiveness, [-]
ηoi.cool polytropic efficiency of a cooled stage, [%]
ηoi.i polytropic efficiency of a stage without cooling losses, [%]
ASU air separation unit
2
INTRODUCTION
In the last three decades, the main trends of the power industry are an improvement of power
production efficiency, mitigation of harmful emissions and reduction of specific metal consumption
in power facilities. The combined cycle facilities are approved leaders that combine these factors. Net
efficiency of these natural gas firing facilities may be above 60% (Chiese and Macchi, 2002). This
high performance is remarkably lower when it is necessary to capture the carbon dioxide that is the
main non-condensing greenhouse gas. When the carbon dioxide is 85% captured, the combined cycle
net efficiency may get 10% lower and the power production expenses may be about twice higher
(Gibbins and Chalmers, 2008).
Shortages of the existing flue gas cleaning from carbon dioxide cause the development of oxy-
fuel combustion cycles (Zheng, 2011). Specific features of this technology are oxygen combustion of
gas fuel, closed cycle and two-component working fluid that allows efficient separation of carbon
dioxide and water by condensing (Rogalev et al., 2018). The widely known Allam cycle has the
natural gas firing net efficiency up to 58.9%, the specific installed power cost 800-1000 $/kW (Allam
et al, 2013). In a coal firing facility the net efficiency and installed power cost are 51.4% and 1500-
1800 $/kW respectively and the carbon dioxide capture degree nearly 100%. Therefore, the Allam
cycle causes worldwide researches interest
This paper is devoted to the detailed thermodynamic studies of the gas firing Allam cycle. To
pursue the research goal, the mathematical model of the cycle was created using Aspen Plus software.
Furthermore, the models of cooled gas turbine compartment and multithread regenerator were
created. The potential pinch points were analyzed. The investigation of the turbine inlet parameters
was performed for the wide ranges of temperatures and pressures from 600 to 1400 °C and from 200
to 400 bar correspondingly. The optimal turbine inlet temperature for each level of the turbine inlet
pressure considered in the study was identified. The investigation of turbine outlet pressure, turbine
coolant temperature, cycle minimal temperature, turbine, and compressor flowpath efficiency
influence on cycle efficiency was conducted afterwards. The final part of the research is devoted to
the sensitivity analysis of the main cycle parameters.
NET POWER TECHNOLOGY FOR ELECTRICITY PRODUCTION WITH ZERO
EMISSIONS
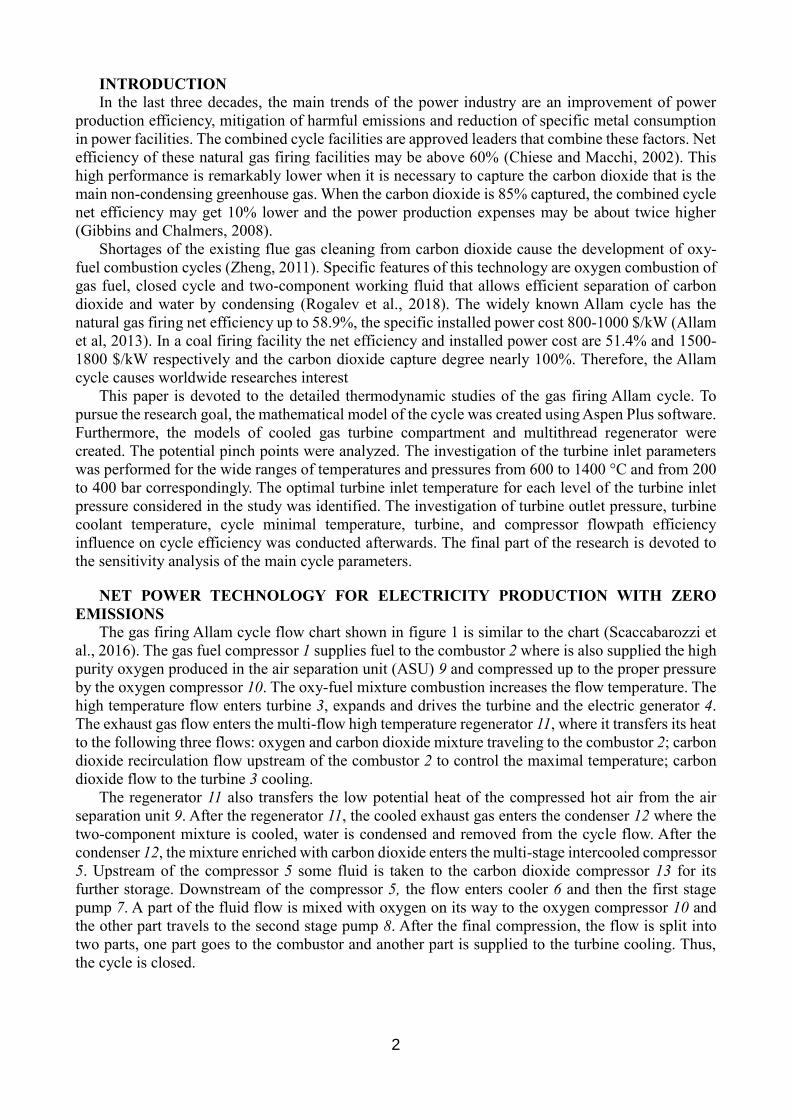
The gas firing Allam cycle flow chart shown in figure 1 is similar to the chart (Scaccabarozzi et
al., 2016). The gas fuel compressor 1 supplies fuel to the combustor 2 where is also supplied the high
purity oxygen produced in the air separation unit (ASU) 9 and compressed up to the proper pressure
by the oxygen compressor 10. The oxy-fuel mixture combustion increases the flow temperature. The
high temperature flow enters turbine 3, expands and drives the turbine and the electric generator 4.
The exhaust gas flow enters the multi-flow high temperature regenerator 11, where it transfers its heat
to the following three flows: oxygen and carbon dioxide mixture traveling to the combustor 2; carbon
dioxide recirculation flow upstream of the combustor 2 to control the maximal temperature; carbon
dioxide flow to the turbine 3 cooling.
The regenerator 11 also transfers the low potential heat of the compressed hot air from the air
separation unit 9. After the regenerator 11, the cooled exhaust gas enters the condenser 12 where the
two-component mixture is cooled, water is condensed and removed from the cycle flow. After the
condenser 12, the mixture enriched with carbon dioxide enters the multi-stage intercooled compressor
5. Upstream of the compressor 5 some fluid is taken to the carbon dioxide compressor 13 for its
further storage. Downstream of the compressor 5, the flow enters cooler 6 and then the first stage
pump 7. A part of the fluid flow is mixed with oxygen on its way to the oxygen compressor 10 and
the other part travels to the second stage pump 8. After the final compression, the flow is split into
two parts, one part goes to the combustor and another part is supplied to the turbine cooling. Thus,
the cycle is closed.

3
Figure 1: NET Power cycle
COMPUTER SIMULATION APPROACH
The Allam cycle computer simulation was performed with the Aspen Plus code. The turbine
cooled compartment and the multi-flow regenerator models were specially developed.
Carbon dioxide is the main component of the working fluid of the Allam cycle and the correct
definition of CO2 thermodynamic properties is very important to ensure the accuracy of simulation
results. Several approaches for estimation of CO2 thermodynamic properties were considered: the
Peng-Robinson equation of state (Peng and Robinson, 1976), the Redlich-Kwong equation of state
(Soave, 1972) and the NIST REFPROP database. Reference values were taken from (Vargaftik,
1972).
The results of the comparison of thermodynamic properties defined using several approaches
showed that the minimum average deviation of the CO2 specific volume definition equal to 0.03% is
achieved for NIST REFPROP database based on the Span and Wagner equation of state (Span and
Wagner, 1996). An increase in CO2 pressure usually leads to an increase in deviation. However, the
temperature increase affects ambiguously. To simulate the Allam cycle we used the NIST REFPROP
database because of the highest accuracy.
The computer simulation concept is illustrated in figure 2. The first stage of simulation involves
an analysis of the chart shown in figure 1 without the turbine cooling losses. The modeling process
starts with an input of the initial data presented in table 1. Then it is necessary to carry out a sequential
calculation of the compressor, combustion chamber, and uncooled turbine. The resulting
thermodynamic flow parameters form input data for the 1D turbine flowpath calculation.
а) scheme
b) log(p)-h diagram
1
23
4
Fuel
ASU
Air
Water
Compressed CO2
Cooled gas turbine compartment
5
6 7 8
9
12
13
11
10

4
The main outputs of the second stage of the simulation are the number of stages, parameters along
the stages and the stage dimensions. To estimate these parameters for each input data set the stage
reaction equal to 0.25 and the ratio of tip speed to the isentropic spouting velocity equal to 0.36 were
considered in calculations.
The results of the two previous stages were used for stage III. To estimate cooling massflow for
each turbine vane/blade row, it is necessary to choose coolant source, blade cooling scheme and the
maximum acceptable average temperature of the blade metal outer surface.
Stage IV is devoted to the turbine efficiency cooling losses, which largely depend on the coolant
massflow and blade cooling system (open-loop or closed-loop).
The last stage V was the flow chart calculation together with the turbine cooling losses.
Figure 2. The concept of the Allam cycle computer simulation
The cycle thermodynamic simulation included the specially developed air separation unit model.
The model includes the energy consumption for oxygen production and compression and the amount
of low potential heat transferred to the regenerator. The ASU power consumption depends upon the
produced oxygen purity and pressure and the production technology. The technical and financial
reasons determine the ASU type as the cryogenic high pressure two-stage.
The analysis of ASU with different oxygen purity production is disclosed in the relation between
oxygen purity and power consumption shown in figure 3. The oxygen purity above 90-91% requires
a remarkable power consumption increase. In this work the purity degree is assumed as 91.25% with
the argon main impurity, then the ASU power consumption is 900 kW/(kg/s).
а) two-column rectification facility b) relation of O2 purity and ASU power consumption
Figure 3: Evaluation of power consumption for oxygen production
According to the data provided in (Mancuso et al, 2015), the maximum of the NET Power cycle
efficiency could be achieved at a higher value of the oxygen purity equal to 99.5%. The main reason
I
1D thermal and
aerodynamic
calculation of the CO2
turbine flow path
Estimation of the
coolant mass flow for
each turbine blade row
Thermodynamic
analysis of the oxy-
fuel combustion cycle
considering turbine
cooling losses
Thermodynamic
analysis of the oxy-
fuel combustion cycle
without considering
turbine cooling losses
II III IV V
Estimation of the
turbine efficiency
reduction due to the
cooling
N2
O2
Air
Compressed
air
700
900
1100
1300
1500
1700
84 86 88 90 92 94 96 98 100
NA
SU,
kW
e/(k
g/s
)
O2 purity,%
5
for the mismatch of the optimal oxygen purity is due to the lower efficiency of the ASU models
discussed in this study.
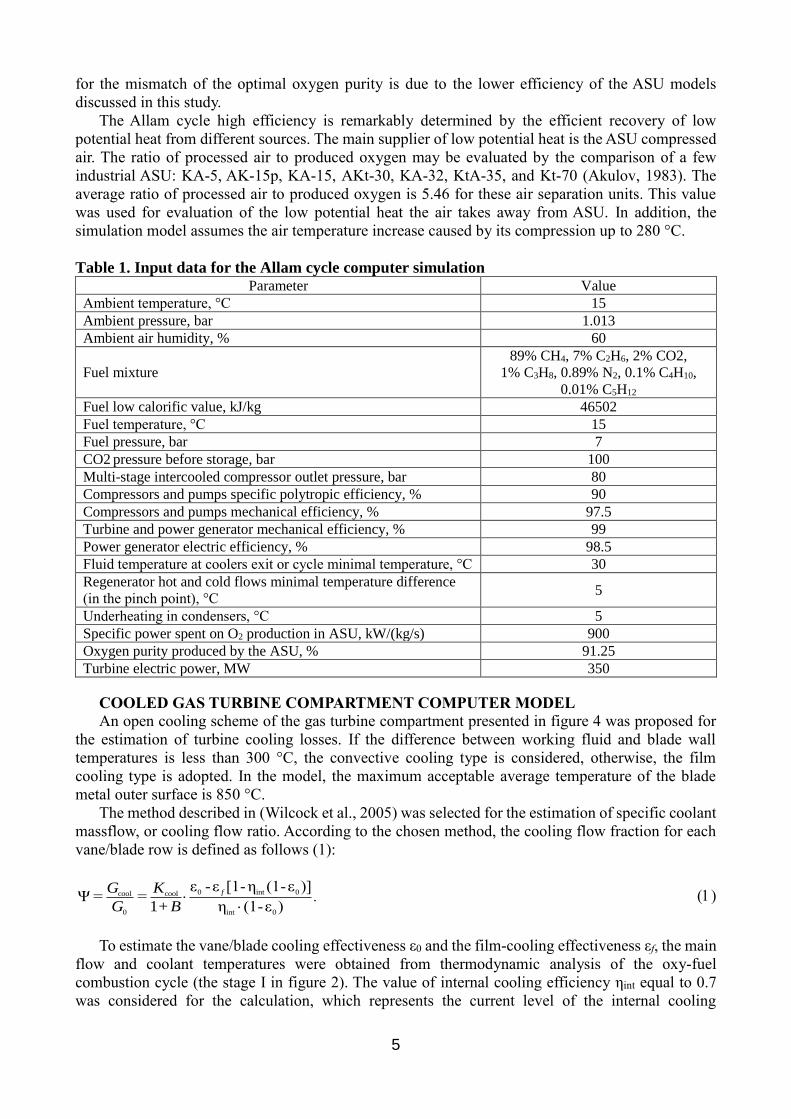
The Allam cycle high efficiency is remarkably determined by the efficient recovery of low
potential heat from different sources. The main supplier of low potential heat is the ASU compressed
air. The ratio of processed air to produced oxygen may be evaluated by the comparison of a few
industrial ASU: KA-5, AK-15p, KA-15, AKt-30, KA-32, KtA-35, and Kt-70 (Akulov, 1983). The
average ratio of processed air to produced oxygen is 5.46 for these air separation units. This value
was used for evaluation of the low potential heat the air takes away from ASU. In addition, the
simulation model assumes the air temperature increase caused by its compression up to 280 °C.
Table 1. Input data for the Allam cycle computer simulation Parameter Value
Ambient temperature, °C 15
Ambient pressure, bar 1.013
Ambient air humidity, % 60
Fuel mixture
89% CH4, 7% C2H6, 2% CO2,
1% C3H8, 0.89% N2, 0.1% C4H10,
0.01% C5H12
Fuel low calorific value, kJ/kg 46502
Fuel temperature, °C 15
Fuel pressure, bar 7
CO2 pressure before storage, bar 100
Multi-stage intercooled compressor outlet pressure, bar 80
Compressors and pumps specific polytropic efficiency, % 90
Compressors and pumps mechanical efficiency, % 97.5
Turbine and power generator mechanical efficiency, % 99
Power generator electric efficiency, % 98.5
Fluid temperature at coolers exit or cycle minimal temperature, °C 30
Regenerator hot and cold flows minimal temperature difference
(in the pinch point), °C 5
Underheating in condensers, °C 5
Specific power spent on O2 production in ASU, kW/(kg/s) 900
Oxygen purity produced by the ASU, % 91.25
Turbine electric power, MW 350
COOLED GAS TURBINE COMPARTMENT COMPUTER MODEL
An open cooling scheme of the gas turbine compartment presented in figure 4 was proposed for
the estimation of turbine cooling losses. If the difference between working fluid and blade wall
temperatures is less than 300 °C, the convective cooling type is considered, otherwise, the film
cooling type is adopted. In the model, the maximum acceptable average temperature of the blade
metal outer surface is 850 °C.
The method described in (Wilcock et al., 2005) was selected for the estimation of specific coolant
massflow, or cooling flow ratio. According to the chosen method, the cooling flow fraction for each
vane/blade row is defined as follows (1):
0 int 0cool cool
0 int 0
ε -ε [1-η (1-ε )]Ψ = =
1+ η (1-ε )f
.G K
G B
To estimate the vane/blade cooling effectiveness ε0 and the film-cooling effectiveness εf, the main
flow and coolant temperatures were obtained from thermodynamic analysis of the oxy-fuel
combustion cycle (the stage I in figure 2). The value of internal cooling efficiency ηint equal to 0.7
was considered for the calculation, which represents the current level of the internal cooling

6
technology. To evaluate the cooling flow factor Kcool, the values of the required geometry parameters
were obtained from 1D thermal and aerodynamic calculation of the CO2 turbine flow path (stage II
in figure 2). To estimate the coefficient B, the metal and TBC Biot numbers equal to 0.3 and 0.15
correspondingly were chosen according to the recommendations in (Wilcock et al., 2005).
Figure 4: Coolant flow distribution in the gas turbine compartment
After determining the cooling flow factor for each turbine vane/blade row, the polytropic
efficiency of a cooled stage is estimated with the method described in (Thorbergsson and Grönstedt,
2016) (2):
0out 0inin
cool
out in out 0in
-η = η - ln
-i
oi. oi.i
PP,
P P P
G GS
G
(2)
where Pin – the total pressure at the turbine inlet; Pout – the total pressure at the turbine outlet; G0in
– the working fluid mass flow at the turbine inlet; G0out – the working fluid mass flow at the turbine
outlet; Pi – the total pressure at the inlet of the rotor blade row, S – the turbine efficiency factor equal
to 0.2 according to the recommendations in (Thorbergsson and Grönstedt, 2016).
The polytropic efficiency of stages without cooling losses ηoi.i estimating as a result of the
calculation of the turbine flow path (stage II) is defined as follows (3):
η =
02
01
oi.i
02
01
Plog( )
Pk 1,
Tklog( )
T
(3)
where k – specific heat ratio; P01 – the total pressure at the stage inlet; P02 – the total pressure at
the stage outlet; T01 – the total temperature at the stage inlet; T02 – the total temperature at the stage
outlet.
MULTITHREAD REGENERATOR COMPUTER SIMULATION MODEL
Figure 5a presents a computer simulation model of the high-temperature multithread regenerator.
The regenerator has five flows, two heating and three heated. The regenerator computer simulation
employs the pinch analysis technique (Scaccabarozzi et al., 2016; Kemp, 2011). The cycle
thermodynamic optimization assumed the pinch-point equal to 5 °C as to provide equivalence of the
simulation conditions.
The hot flows input data are the turbine exhaust parameters (temperature, massflow, heat capacity,
and saturation point temperature) and the ASU hot air parameters (temperature, massflow and heat
capacity). The cold flows input data are the coolant parameters (temperature fixed at a definite level,
calculation determined massflow and heat capacity), the oxidizer/working fluid mixture parameters
T0
Р0G0

7
(temperature, massflow and heat capacity), and the heated fluid parameters (temperature, massflow,
heat capacity). The only limit is the fixed temperature at the regenerator exit. The temperature is fixed
because the schemes are simulated at equivalent conditions.
Figure 5b presents integral relations of the hot flows cooling and cool flows heating that are
calculated after the data and limits input. The local curve inclination at any point is proportional to
the massflow multiplied by the isobaric mass heat capacity. If the two flows are cooled together, this
inclination is proportional to the sum of these products. If the moisture is condensed, the inclination
is also determined by the phase transition heat and the condensate massflow.
a) flow diagram b) T-q diagram
Figure 5: The pinch analysis of the multithreaded regenerator
Then are determined possible pinch points that are the integral curve inflection points of the hot
and cool flows, or the beginning point of the cool flow heating. All possible pinch points of the system
are shown in figure 5b.
The cold flows integral curves have two inflection points. The first point is the beginning of the
three cold flows heating at temperatures below 100 °C. The flow initial temperatures are different and
the coldest flow is determined by the temperature of oxidizer supplied by ASU. The second point is
the completion of coolant flow heating. These two points cannot be assumed as pinch points because
the first is in the low temperature area, and at the second point, the integral curve has a downward
convexity caused by the reduction of the flow thermal equivalent.
The hot flow integral curves also have two inflection points. The first point is the beginning of
the turbine exhaust flow and the hot air ASU exhaust flow combined cooling. The second point is the
beginning of the water condensing. Both points may be the pinch points because in the both of them
the flow heat equivalent grows, which produces the downward sag of the integral cooling curve.
The beginning of the moisture condensing produces a rapid increase in the effective heat capacity
of flow. Thus, if the condensing beginning temperature is sufficiently high to heat the cold flows by
the moisture condensing heat, this point is the potential pinch point.
Figure 6 presents the analysis results of the turbine exhaust flow dew point influence. In the
considered 20-40 bar range of turbine outlet temperature, the dew point is as high as 90-115 °C. Thus,
it should be considered as a potential pinch point.
tc11, G
c11, Cp
c11
tc21, G
c21, Cp
c21
tc31, G
c31, Cp
c31
tc12, G
c12, Cp
c12
tc22, G
c22, Cp
c22
tc32, G
c32, Cp
c32
th11, G
h11, Cp
h11
th12, G
h12, Cp
h12
th21, G
h21, Cp
h21
th22, G
h22, Cp
h22
Beginning of a cooling
of the turbine exhaust flow
Beginning of a cooling
of the air from ASU
Beginning of a
moisture condensation
End of a cooling
the hot streams
Beginning of a warming of the coldest stream
Beginning of a warming of all cold streams
End of a coolant warming
End of a
warming of
cold streams
q
T

8
Figure 6: Turbine exhaust dew point related to the turbine exhaust pressure
The beginning of cooling of the hot flow cannot be the pinch point. Simulation with minimal
temperature difference in the point shows the heating and cooling integral curves intersection due to
the moisture condensing beginning at the existing initial inclination of the cold flow heating integral
curve.
Thus, the potential pinch points of the considered heat exchange system configuration are the
following three versions:
1) Beginning of the moisture condensing from the working fluid hot flow (version 1).
2) Kink point in the hot flow cooling integral curve at the beginning of ASU supplied hot air
cooling (version 2).
3) Beginning of the turbine exit hot flow cooling (version 3).
Therefore, figure 7 shows possible versions of the T-q diagram that are the integral cooling and
heating curves. In the plots, the coolant temperature of 180 °C and the ASU exit hot air temperature
of 280 °C are assumed.
a) version 1 b) version 2 c) version 3
Figure 7: Regenerator T-q diagram versions
The multi-parametric study shows that in terms of maximal heat transfer the pinch point location
1 is optimal. This pinch point location shows the nearest location of the hot and cold flows integral
curves. Location 3 shows the smallest effectiveness.
THERMODYNAMIC OPTIMIZATION RESULTS
The results of thermodynamic investigations of the turbine inlet parameters influence upon the
Allam cycle net efficiency are presented in figure 8. The maximum value of cycle net efficiency of
56.5% (including air separation unit penalty and carbon capture and storage at 100 bar) is achieved
for the turbine inlet temperature of 1083 °C and pressure of 300 bar. The turbine outlet pressure value
0
30
60
90
120
150
180
0 10 20 30 40 50 60 70 80 90 100
Dew
poin
t, °
C
Pressure, bar
T
q
280 °C
180 °C
Dew point
Hot streams
Cold
streams
T
q
280 °C
180 °C
Dew point
Hot streams
Cold
streams
T
q
280 °C
180 °C
Dew point
Hot streams
Cold
streams

9
was fixed at 30 bar and turbine coolant temperature – at 200 °C during the optimization of turbine
inlet parameters.
Figure 8: Net efficiency as a function of the turbine inlet temperature
The turbine inlet temperature optimum at a fixed pressure may be explained by specific features
of the high temperature regenerator thermodynamic process. Usually, the turbine inlet temperature
increase is followed by growth of the cycle mean integral heat intake temperature that increases the
equivalent Carnot cycle efficiency, and the cycle thermodynamic efficiency also grows. On the other
side, the regenerator analysis shows that the excessive increase of the turbine inlet temperature
increases its exhaust temperature that changes the pinch point.
Figure 9 illustrates the power consumption for oxygen production and compression and carbon
dioxide storage at 100 bar pressure. The solid line is similar to the curve in figure 8 at the turbine inlet
pressure of 300 bar. The analysis assumes the produced oxygen purity of 91.25% and the specific
oxygen production consumption of 900 kW/(kg/s). Production and compression of the oxygen
supplied to the combustor reduce the cycle net efficiency in average for 7.2%, and the compression
of carbon dioxide before storage – for 0.4%. The low energy consumption of the CO2 compressor is
due to the high cycle minimal pressure, which is equal to 30 bar.
Figure 9. Influence of oxygen production and compression and the carbon dioxide storage
upon the Allam cycle efficiency
The results of studies of the turbine outlet pressure influence upon the cycle efficiency are shown
in Figure 10a. The maximum net efficiency of 56.5% is achieved for the turbine outlet pressure of 30
bar. The turbine inlet temperature of 1083 °C and the turbine inlet pressure of 300 bar were fixed
during the optimization of the turbine outlet pressure.
40
44
48
52
56
60
600 700 800 900 1000 1100 1200 1300 1400 1500
Net
eff
icie
ncy
, %
Turbine inlet temperature, °С
200 bar
250 bar
300 bar
350 bar
400 bar
40
45
50
55
60
65
600 800 1000 1200 1400
Net
eff
icie
ncy
, %
Turbine inlet temperature, °С
Net efficiency including
ASU and CCS penalties
Net efficiency including
CCS penalties
Net efficiency without
ASU and CCS penalties

10
The results of thermodynamic investigations of the turbine coolant temperature are shown in
Figure 10b. The maximum net efficiency of 56.5% is achieved for the turbine coolant temperature of
200 °C. The turbine inlet temperature of 1083 °C, the turbine inlet pressure of 300 bar and the turbine
outlet pressure of 30 bar were fixed during the optimization of the turbine coolant temperature.
The optimal coolant temperature may be explained by the following. Deviations of the coolant
temperature are followed not only by changes of the turbine cooling massflow and the turbine cooling
losses but also by the changes of heat utilized in the regenerator. The latter drastically influences cycle
efficiency. At the coolant temperature of 200 °C, the amount of heat transferred in the regenerator is
maximal.
a) influence of turbine outlet pressure on the
cycle net efficiency
b) influence of turbine coolant temperature on
the cycle net efficiency
Figure 10: The results of thermodynamic parameters optimization for the Allam cycle
The temperature of cooling water supplied to the cooler-separators also remarkably influences the
cycle efficiency. The simulation results show the 2.1% cycle net efficiency increase at the 10 °C water
temperature reduction. The temperature reduction below 20 °C is undesirable because of the risk of
liquid phase formation in the multi-stage compressor flowpath.
The analysis of flowpath efficiency influence upon the cycle efficiency included the compressor
and turbine efficiency varying from 80 to 90% with a 2% step. The internal turbine and compressor
efficiency increases of 1% cause the Allam cycle facility increase of 0.28-0.43% and 0.09-0.12%
respectively.
CONCLUSIONS
The thermodynamic investigation of the Allam cycle operated on the natural gas was performed
using the combination of the Aspen plus simulations and the specially developed mathematical
models. The detailed cooled gas turbine compartment model allowing to estimate the coolant flow
coefficients by stages taking into account an influence of the thermodynamic parameters of the
multicomponent working fluid on the flow path geometry characteristics. The mathematical model
of the multi-flow regenerator allowing to perform cycle thermodynamic investigation at a fixed pinch
point was elaborated. Using the regenerator model the potential pinch points were analyzed.
The results of consistent optimization of the main cycle parameters showed that maximal net
efficiency of 56.5% is reached at the turbine inlet pressure and temperature of 300 bar and 1083 °C,
turbine exhaust pressure of 30 bar and the coolant temperature of 200 °C. These parameters could be
considered for the supercritical carbon dioxide gas turbine design.
The sensitivity analysis of the main parameters was conducted. A decrease of the turbine inlet
pressure by 1 MPa from the optimal value (30 MPa) leads to a decrease of the cycle net efficiency by
0.19% in the pressure range from 25 to 30 MPa and by 0.34% in the pressure range between 20 and
25 MPa. In turn, an increase of the turbine inlet pressure by 1 MPa leads to a decrease of the cycle
net efficiency by 0.29% in the pressure range from 30 to 35 MPa and by 0.06% in the pressure range
48
50
52
54
56
58
0 1 2 3 4 5
Net
eff
icie
ncy
,%
Turbine outlet pressure, MPa
52
53
54
55
56
57
100 200 300 400 500 600
Net
eff
icie
ncy
,%
Tcool, °С

11
between 35 and 40 MPa. Therefore, the turbine inlet pressure fluctuation in the range between 25 and
30 MPa will not lead to significant efficiency reduction.
A decrease of the turbine inlet temperature by 1 °C from the optimal value (1083 °C) leads to a
to a decrease of the cycle net efficiency by 0.01% in the temperature range from 1025 to 1083 °C and
by 0.02-0.05% in the temperature range between 600 to 920 °C. In turn, an increase of the turbine
inlet temperature by 1 °C leads to a decrease of the cycle net efficiency by 0.01% in the temperature
range from 1083 to 1210 °C and by 0.03-0.04% in the temperature range between 1240 to 1400 °C.
Therefore, the acceptable range of the turbine inlet temperatures for the Allam cycle is between 1025
°C and 1210 °C. Exceeding the limits results in a more intensive efficiency reduction.
A decrease of the turbine outlet pressure by 1 bar from the optimal value (30 bar) leads to a
decrease of the cycle net efficiency by 0.05-0.12% in the pressure range from 20 to 30 bar and by
0.12-0.34% in the pressure between 1 and 15 bar. In turn, an increase of the turbine outlet pressure
by 1 bar leads to a decrease of the cycle net efficiency by 0.19-0.26% in the pressure from 30 to 50
bar. Therefore, the turbine outlet pressure fluctuation in the range between 20 and 35 bar will not lead
to significant efficiency reduction.
The 10 °C coolant temperature decrease from the optimal value (200 °C) leads to a decrease of
the cycle net efficiency by 0.03% in the temperature range from 100 to 200 °C. In turn, the 10 °C
coolant temperature increase leads to a decrease of the cycle net efficiency by 0.01% in the
temperature range from 200 to 300 °C and by 0.02-0.22% in the temperature range between 300 and
600 °C. Therefore, the coolant temperature between 100 and 300 °C is recommended for the
supercritical carbon dioxide gas turbine. Herewith the coolant flow coefficient is in the range between
9.3 and 14.9%.
The 1 °C cooling water temperature reduction reduces the cycle net efficiency by 0.21%. The
water temperature reduction below 20 °C is not recommended because of the risk of liquid formation
in the compressor flowpath.
The 1% internal turbine and compressor efficiency increase produce the facility efficiency
increases by 0.28-0.43% and 0.09-0.12% respectively.
The 91.25% pure oxygen production and compression reduce the average cycle net efficiency by
7.2% and the precipitated carbon dioxide compression consumes 0.4%.
The Allam cycle facility studies at different initial parameters show combinations of the turbine
inlet pressure and temperature that provide the maximal net efficiency as the following:
- at the 996 °C temperature and 200 bar pressure, the facility net efficiency is 54.6% and the
coolant flow coefficient is 3.9%;
- at the 1054 °C temperature and 250 bar pressure, the facility net efficiency is 55.7% and the
coolant flow coefficient is 6.6%;
- at the 1083 °C temperature and 300 bar pressure, the facility net efficiency is 56.5% and the
coolant flow coefficient is 11.4%;
- at the 1164 °C temperature and 350 bar pressure, the facility net efficiency is 55.8% and the
coolant flow coefficient is 11.4%;
- at the 1058 °C temperature and 400 bar pressure, the facility net efficiency is 55.8% and the
coolant flow coefficient is 10.5%.
ACKNOWLEDGEMENTS
This study conducted by National Research University “Moscow Power Engineering Institute”
was supported by the Russian Science Foundation under Agreement No. 17-79-20371 dated July 28,
2017.
REFERENCES
Chiesa, P., Macchi, E., (2002). A thermodynamic analysis of different options to break 60%
electric efficiency in combined cycle power plants. Proceedings of the ASME Turbo Expo 2002:
Power for Land, Sea, and Air, Amsterdam, the Netherlands.

12
Gibbins, J., Chalmers, H., (2008). Carbon capture and storage. Energy Policy, 36(12), 4317-
4322.
Zheng, L., (2011). Oxy-fuel combustion for power generation and carbon dioxide (CO2) capture.
Cambridge: Woodhead Publishing Limited, p. 373.
Rogalev, A.N., Kindra, V.O., Osipov, S.K., (2018). Modeling methods for oxy-fuel combustion
cycles with multicomponent working fluid. Proceedings of the 17th Conference of Power System
Engineering, Thermodynamics and Fluid Mechanics, Pilsen, Czech, 2047(1), 020020.
Allam, R.J., Palmer, M.R., Brown, Jr.G.W., Fetvedt, J., Freed, D., Nomoto, H., Itoh, M., Okita, N.,
Jones Jr.C., (2013). High efficiency and low cost of electricity generation from fossil fuels while
eliminating atmospheric emissions, including carbon dioxide. Energy Procedia, 37, 1135-1149.
Scaccabarozzi, R., Gatti, M., Martelli, E., (2016). Thermodynamic analysis and numerical
optimization of the NET Power oxy-combustion cycle. Applied Energy, 178, 505-526.
Peng, D.Y., Robinson, D.B., (1976). A new two-constant equation of state. Industrial &
Engineering Chemistry Fundamentals, 15(1), 59-64.
Soave, G., (1972). Equilibrium constants from a modified Redlich-Kwong equation of state.
Chemical engineering science, 27(6), 1197-1203.
Vargaftik, N.B., (1972). Handbook of thermophysical properties of gases and liquids. Nauka,
Moscow.
Span, R., Wagner, W., (1996). A new equation of state for carbon dioxide covering the fluid region
from the triple‐point temperature to 1100 K at pressures up to 800 MPa. Journal of physical and
chemical reference data. 25(6), 1509-1596.
Mancuso L., Ferrari N., Chiesa P., Martelli E., Romano M.C. Oxy-combustion turbine power
plants. IEAGHG report 2015/05.
Akulov L.A., (1983). Installations for separation of gas mixtures. Mechanical engineering, St.
Petersburg.
Wilcock, R.C., Young, J.B., Horlock, J.H., (2005). The effect of turbine blade cooling on the cycle
efficiency of gas turbine power cycles. Journal of Engineering for Gas Turbines and Power, 127(1),
109-120.
Thorbergsson, E., Grönstedt, T., (2016). A thermodynamic analysis of two competing mid-sized
oxyfuel combustion combined cycles. Journal of Energy, 2438431.
Kemp, I.C., (2011). Pinch analysis and process integration: a user guide on process integration
for the efficient use of energy. Oxford: Elsevier, p. 396.