Thermochemistry of Silicates · • Thermochemistry of Silicates - Stability of silicates in...
31
National Aeronautics and Space Administration www.nasa.gov Thermochemistry of Silicates Gustavo Costa and Nathan Jacobson NASA Glenn Research Center Cleveland, OH [email protected] https://ntrs.nasa.gov/search.jsp?R=20150007887 2020-03-09T21:23:58+00:00Z
Transcript of Thermochemistry of Silicates · • Thermochemistry of Silicates - Stability of silicates in...

National Aeronautics and Space Administration
www.nasa.gov
Thermochemistry of Silicates
Gustavo Costa and Nathan Jacobson
NASA Glenn Research Center
Cleveland, OH
https://ntrs.nasa.gov/search.jsp?R=20150007887 2020-03-09T21:23:58+00:00Z

National Aeronautics and Space Administration
www.nasa.gov
Outline of Presentation
• Silicates in Materials Science, Mineralogy, Geology and Planetary Science
- Silicate Mineral Subclasses
• Thermochemistry of Silicates
- Stability of silicates in different environments and their acid-base chemistry
- Partial thermodynamics quantities (activity): An indicator of reactivity
- Thermodynamic activity in silicates
- Methods to measure activity
• Thermochemistry of Olivine
• Thermochemistry of Rare earth Silicates
-Results for Y2O3-SiO2 and Yb2O3-SiO2 systems
• Summary: Silicates

National Aeronautics and Space Administration
www.nasa.gov
Coating applications:
3
Ceramics in non-moving parts:
• Combustor liners
• Exhaust nozzles
Eventually moving parts!
Modern Solid-state Chemistry• Mesoporous based Silicates Sensors: pH, metal cation and humidity
• Rare-Earth Silicates and Vitreous Silica:
- Electronic devices: microwave, semiconductors, ferromagnetics, ferroelectrics,
lasers and phosphors
- High-Temperature Materials: refractory bricks and coatings
Silicates in Materials Science
Felsche, “The Crystal Chemistry of the Rare-Earth Silicates, Springer 1973, 99-197. Melde et al, Sensors, 2008, 8, 5202-5228.

National Aeronautics and Space Administration
www.nasa.gov 4
Ocurrence
- Over 90 % of the Earth’s crust consists of silicate minerals
Silicates in Geology, Mineralogy and Planetary Science
- Moon, Mars, Asteroids, Comets, Interplanetary dust particles and..
..Hot, rocky
exoplanets
8%
3%
5%
5%5%
11%12%
12%
39%
Plagioclase
Alkali feldspar
Quartz
Pyroxene
Amphibole
Mica
Clay
Other Silicates
Nonsilicates
G. E. Brown, Rev. Mineral. Geochem., 5, 275-381, 1980. M. T. DeAngelis etal., Am. Mineral., 97, 653-656, 2012.
D. Perkins, Mineralogy, 3, Prentice Hall, 2011.

National Aeronautics and Space Administration
www.nasa.gov
- (FexMg1-x)2SiO4
- Ortorrombic structure (Pbnm).
- Red – oxygen.
- Blue –A sites, silicon.
- Green – B sites, magnesium or iron.
Silicate Mineral Subclasses
D. Perkins, Mineralogy, 3, Prentice Hall, 2011.

National Aeronautics and Space Administration
www.nasa.gov
Thermodynamics and Acid-Base Chemistry
Enthalpy of formation of orthosilicates
vs. ionic potential (z/r) of divalent cations
z/r < 2 strongly basic
2 z/r < 4 basic
4 < z/r < 7 amphoteric
z/r > acidic
MgO + SiO2= MgSiO3 Ionic Potential (z/r)
and
Acid-Basic ScaleBase Acid Enstatite
A. Navrotsky, American Mineralogist, 79, 589-605, 1994..
Thermodynamic
Activity as Indicator
of Stability?
C a
Concentration
Activity
coefficient
National Aeronautics and Space Administration
www.nasa.gov
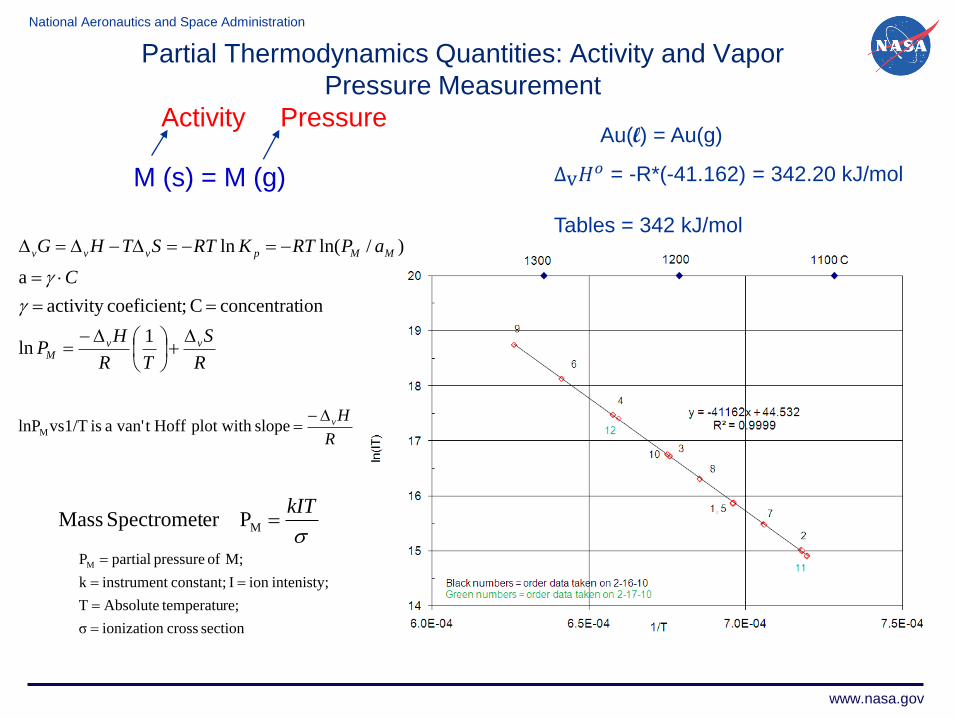
Partial Thermodynamics Quantities: Activity and Vapor
Pressure Measurement
R
S
TR
HP
C
aPRTKRTSTHG
vvM
MMpvvv
1ln
ionconcentrat C ;coeficientactivity
a
)/ln(ln
M (s) = M (g)
Activity Pressure
R
Hvslopeplot with Hofft van'a is vs1/TlnP M
kITMPerSpectromet Mass
Au(l) = Au(g)
∆v𝐻𝑜 = -R*(-41.162) = 342.20 kJ/mol
Tables = 342 kJ/mol
section cross ionizationσ
re; temperatuAbsoluteT
intenisty;ion I constant; instrumentk
M; of pressure partialPM
National Aeronautics and Space Administration
www.nasa.gov
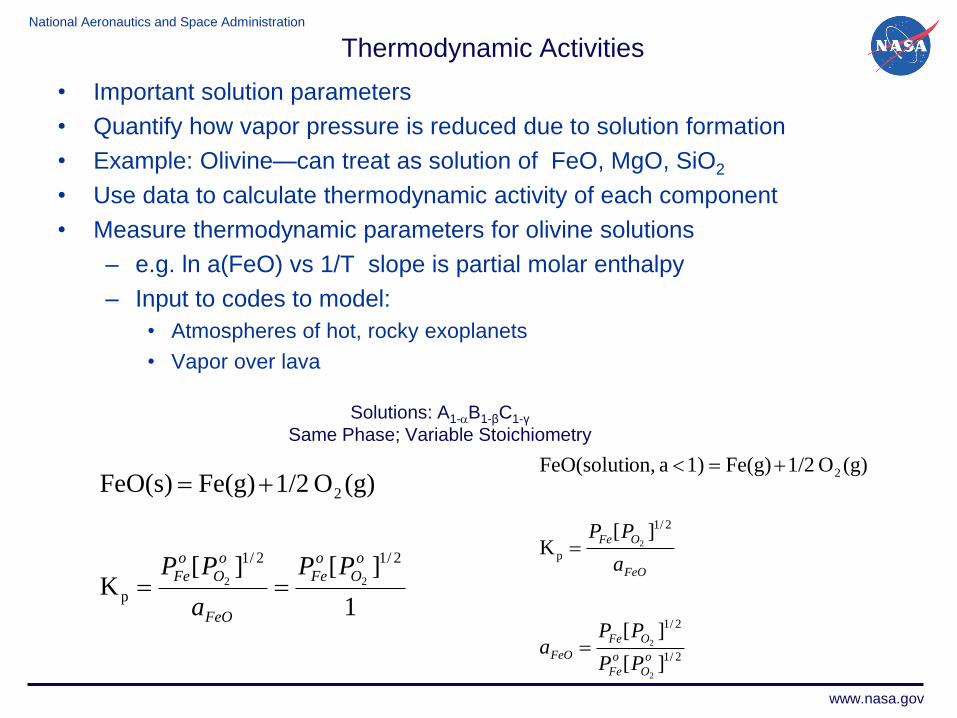
Solutions: A1-B1-βC1-γ
Same Phase; Variable Stoichiometry
• Important solution parameters
• Quantify how vapor pressure is reduced due to solution formation
• Example: Olivine—can treat as solution of FeO, MgO, SiO2
• Use data to calculate thermodynamic activity of each component
• Measure thermodynamic parameters for olivine solutions
– e.g. ln a(FeO) vs 1/T slope is partial molar enthalpy
– Input to codes to model:
• Atmospheres of hot, rocky exoplanets
• Vapor over lava
1
][][K
(g)O 1/2Fe(g)FeO(s)
2/12/1
p
2
22
o
O
o
Fe
FeO
o
O
o
Fe PP
a
PP
Thermodynamic Activities
2/1
2/1
2/1
p
2
][
][
][K
(g)O 1/2Fe(g)1) a on,FeO(soluti
2
2
2
o
O
o
Fe
OFe
FeO
FeO
OFe
PP
PPa
a
PP
National Aeronautics and Space Administration
www.nasa.gov
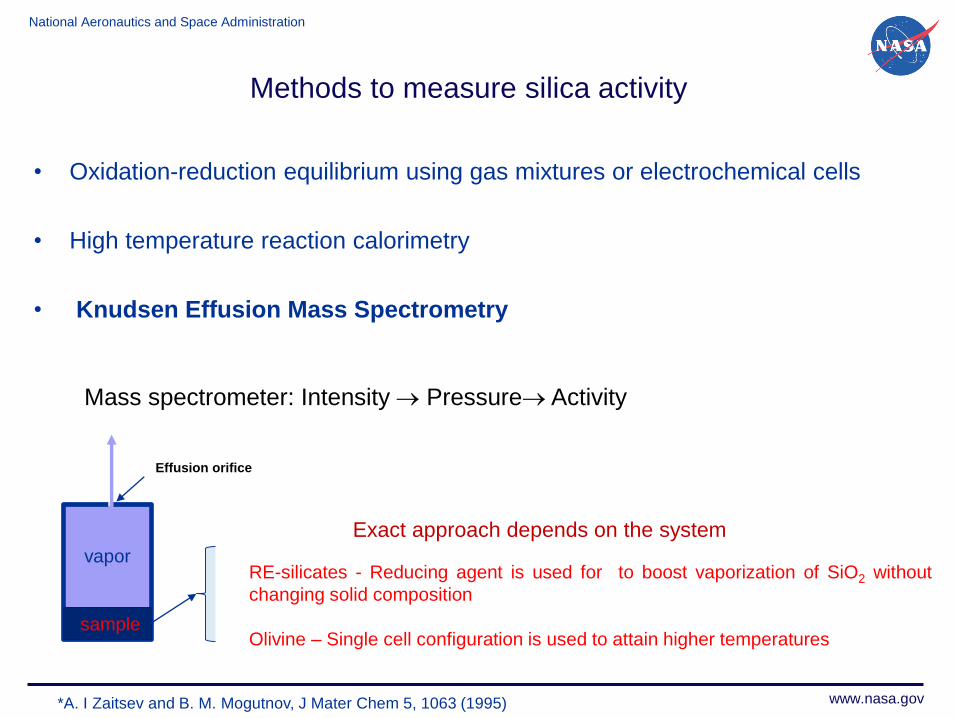
Methods to measure silica activity
• Oxidation-reduction equilibrium using gas mixtures or electrochemical cells
• High temperature reaction calorimetry
• Knudsen Effusion Mass Spectrometry
vapor
sample
Effusion orifice
Mass spectrometer: Intensity Pressure Activity
Exact approach depends on the system
*A. I Zaitsev and B. M. Mogutnov, J Mater Chem 5, 1063 (1995)
RE-silicates - Reducing agent is used for to boost vaporization of SiO2 without
changing solid composition
Olivine – Single cell configuration is used to attain higher temperatures
National Aeronautics and Space Administration
www.nasa.gov
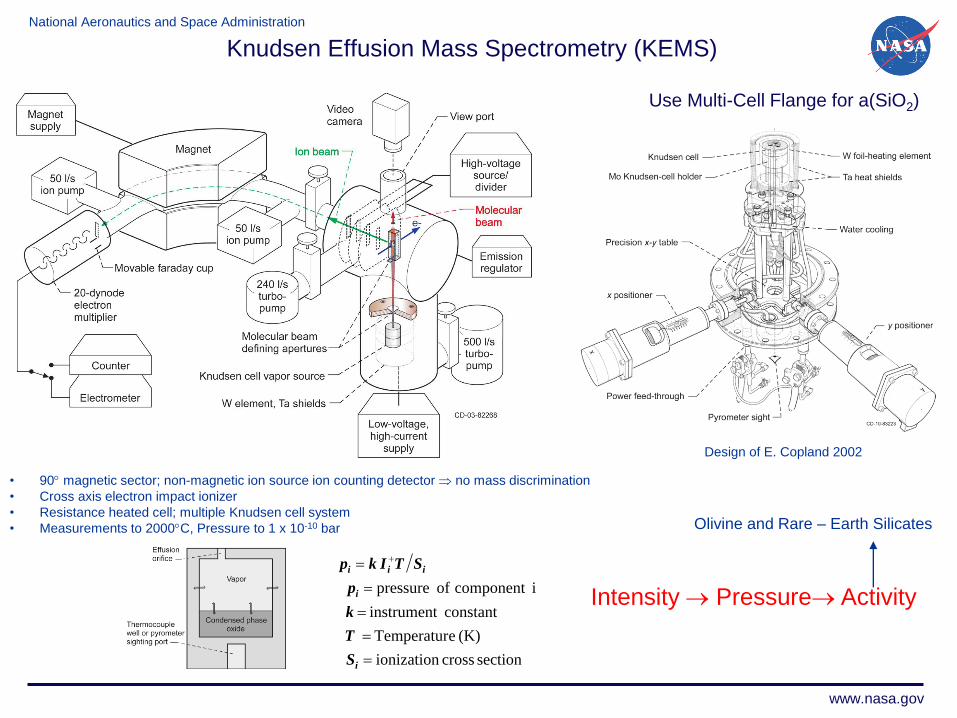
Knudsen Effusion Mass Spectrometry (KEMS)
• 90 magnetic sector; non-magnetic ion source ion counting detector no mass discrimination
• Cross axis electron impact ionizer
• Resistance heated cell; multiple Knudsen cell system
• Measurements to 2000C, Pressure to 1 x 10⁻¹⁰ bar
section cross ionization
(K) eTemperatur
constant instrument
i component of pressure
i
i
iii
S
T
k
p
STIkp
Use Multi-Cell Flange for a(SiO2)
Design of E. Copland 2002
Intensity Pressure Activity
Olivine and Rare – Earth Silicates

National Aeronautics and Space Administration
www.nasa.gov
Olivine - Results

National Aeronautics and Space Administration
www.nasa.gov
93% forsterite and 7% fayalite, Fo93Fa7 - (Fe0.7Mg0.93)2SiO4
*Uncertainties of
the analyses are
given in
parentheses.
807876747270686664626058565452504846444240383634323028262422201816141210
13,000
12,500
12,000
11,500
11,000
10,500
10,000
9,500
9,000
8,500
8,000
7,500
7,000
6,500
6,000
5,500
5,000
4,500
4,000
3,500
3,000
2,500
2,000
1,500
1,000
500
0
-500
-1,000
-1,500
-2,000
-2,500
-3,000
-3,500
-4,000
forsterite 87.68 %
enstatite 7.08 %
Silica 0.84 %
Sapphirine 0.45 %
Clinochlore 3.94 %
XRD pattern and Rietveld refinement of the as received olivine samples.
ICP-OES analysis
of the as received
olivine samples.
Forsterite – 87.7 ± 0.3%
Enstatite – 7.1 ± 0.2%
Silica – 0.84 ± 0.6%
Sapphirine – 0.5 ± 0.1%
Clinochlore – 3.9 ± 0.2%
Phase content
Olivine – Starting Material and Characterization
National Aeronautics and Space Administration
www.nasa.gov
10 20 30 40 50 60 70 80
Rela
tiv
e I
nte
nsit
y (
a. u
.)
2 (degree)
A
B
C*
Olivine
Protoenstatite*
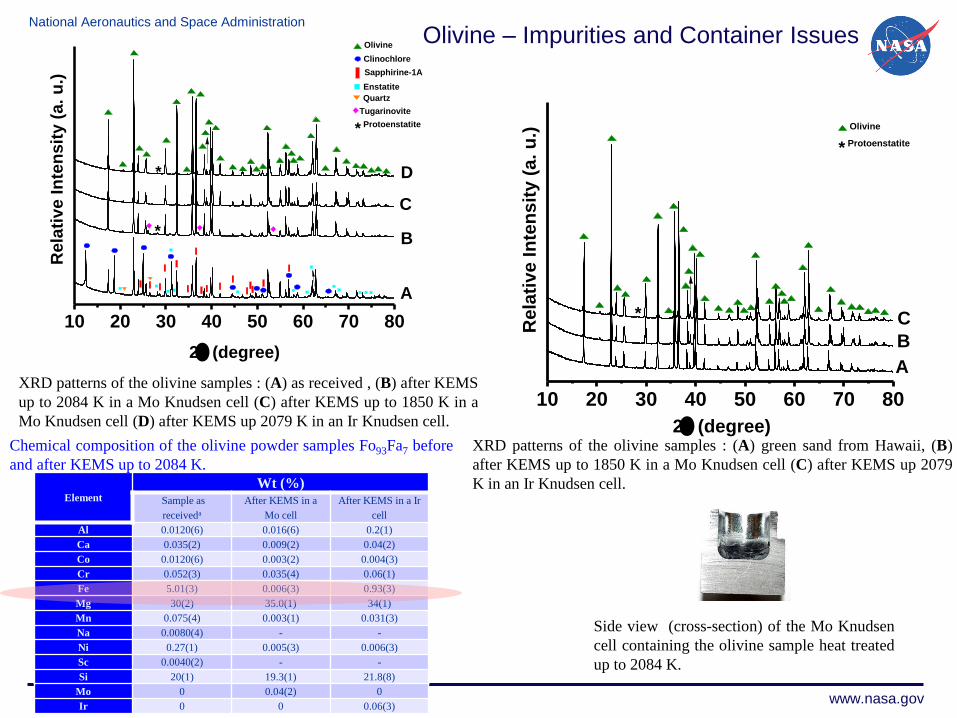
XRD patterns of the olivine samples : (A) green sand from Hawaii, (B)
after KEMS up to 1850 K in a Mo Knudsen cell (C) after KEMS up 2079
K in an Ir Knudsen cell.
XRD patterns of the olivine samples : (A) as received , (B) after KEMS
up to 2084 K in a Mo Knudsen cell (C) after KEMS up to 1850 K in a
Mo Knudsen cell (D) after KEMS up 2079 K in an Ir Knudsen cell.
10 20 30 40 50 60 70 80
Protoenstatite*
*
D
Sapphirine-1A
C
B
Tugarinovite
Olivine
Quartz
Enstatite
Rela
tiv
e I
nte
nsit
y (
a. u
.)
2 (degree)
Clinochlore
A
*
Side view (cross-section) of the Mo Knudsen
cell containing the olivine sample heat treated
up to 2084 K.
Element
Wt (%)Sample as
receiveda
After KEMS in a
Mo cell
After KEMS in a Ir
cell
Al 0.0120(6) 0.016(6) 0.2(1)
Ca 0.035(2) 0.009(2) 0.04(2)
Co 0.0120(6) 0.003(2) 0.004(3)
Cr 0.052(3) 0.035(4) 0.06(1)
Fe 5.01(3) 0.006(3) 0.93(3)
Mg 30(2) 35.0(1) 34(1)
Mn 0.075(4) 0.003(1) 0.031(3)
Na 0.0080(4) - -
Ni 0.27(1) 0.005(3) 0.006(3)
Sc 0.0040(2) - -
Si 20(1) 19.3(1) 21.8(8)
Mo 0 0.04(2) 0
Ir 0 0 0.06(3)
Chemical composition of the olivine powder samples Fo93Fa7 before
and after KEMS up to 2084 K.
Olivine – Impurities and Container Issues
National Aeronautics and Space Administration
www.nasa.gov
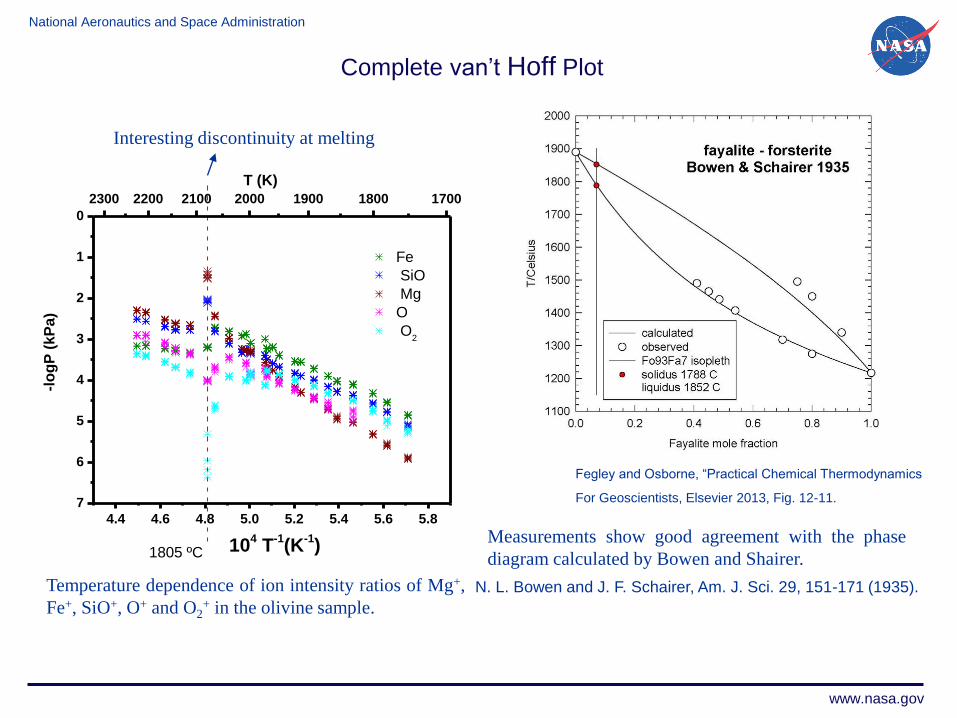
Temperature dependence of ion intensity ratios of Mg+,
Fe+, SiO+, O+ and O2+ in the olivine sample.
Measurements show good agreement with the phase
diagram calculated by Bowen and Shairer.
Fegley and Osborne, “Practical Chemical Thermodynamics
For Geoscientists, Elsevier 2013, Fig. 12-11.
4.4 4.6 4.8 5.0 5.2 5.4 5.6 5.8
7
6
5
4
3
2
1
0
Fe
SiO
Mg
O
O2
104 T
-1(K
-1)1805 ºC
2300 2200 2100 2000 1900 1800 1700
-lo
gP
(kP
a)
T (K)
N. L. Bowen and J. F. Schairer, Am. J. Sci. 29, 151-171 (1935).
Complete van’t Hoff Plot
Interesting discontinuity at melting

National Aeronautics and Space Administration
www.nasa.gov
4.9 5.0 5.1 5.2 5.3 5.4 5.5 5.6 5.7 5.8
-1.4
-1.2
-1.0
-0.8
-0.6
-0.4
-0.2
0.0
0.2
0.4
log
(aS
iO)
10-4T
-1(K
-1)
2000 1950 1900 1850 1800 1750T (K)
2/1
2/1
2/1
p
][
][
][K
2
2
2
o
O
o
M
OM
MO
FeO
OM
PP
PPa
a
PP
Thermodynamic Activities in Olivine - (FexMg1-x)2SiO4
MO(solution, a<1) = M(g) + 1/2O2(g)
From FactSage or measured by KEMS
SiO
4.9 5.0 5.1 5.2 5.3 5.4 5.5 5.6 5.7 5.8
-2.0
-1.8
-1.6
-1.4
-1.2
-1.0
-0.8
-0.6
-0.4
-0.2
0.0
log
(aM
gO)
10-4T
-1(K
-1)
2000 1950 1900 1850 1800 1750T (K)
Fe, Mg or Si
Fe
MgO
4.9 5.0 5.1 5.2 5.3 5.4 5.5 5.6 5.7 5.8
-2.0
-1.8
-1.6
-1.4
-1.2
-1.0
-0.8
-0.6
-0.4
-0.2
0.0
log
(aF
eO)
10-4T
-1(K
-1)
2000 1950 1900 1850 1800 1750T (K)

National Aeronautics and Space Administration
www.nasa.gov
Rare earth Silicates

National Aeronautics and Space Administration
www.nasa.gov
Low Reactivity of Rare earth Silicates
17
Si(OH)4(g) , MOH(g) H2O(g)
SiO2, MO(Underline indicates in solution)SiC + 3/2 O2(g) = SiO2 + CO(g)
• SiO2 + 2 H2O(g) = Si(OH)4(g)
Meschter and Opila., Annu Rev Mater Res 43, 559 (2013)
N. S. Jacobson, J Am Ceram Soc 97, 1959 (2014)
P[Si(OH)4] = K a SiO2 [P(H2O)]2
Y and Yb silicates
Need to be measured!
Exposure Time (hrs)
0102030405060708090100
Wt. Change (mg/cm2 )
-2.5
-2.0
-1.5
-1.0
-0.5
0.0
0.5
CVI (ACI)[1232 C]
Ml[1232 C]
CVI (ACI)[1274 C]
MI[1107 C]
SiC/SiC CMC HPBR Paralinear Weight Change
(1100 -1300C, 6 atm; Robinson/Smialek 1998)
Si(OH)4 volatility (Opila et al., 1998-2006)
National Aeronautics and Space Administration
www.nasa.gov
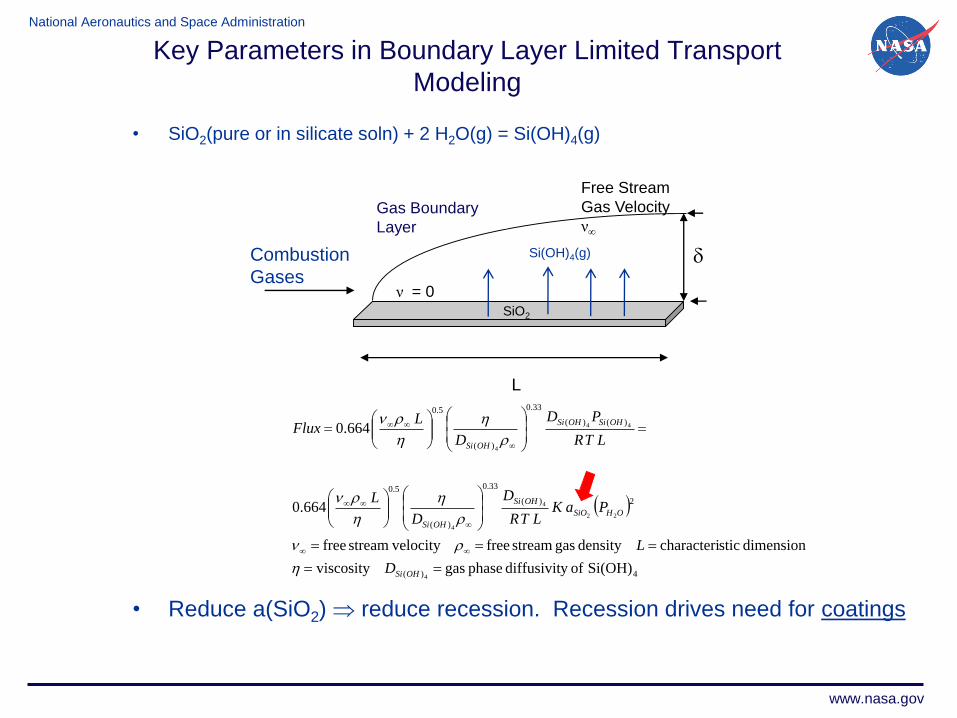
Key Parameters in Boundary Layer Limited Transport
Modeling
• SiO2(pure or in silicate soln) + 2 H2O(g) = Si(OH)4(g)
• Reduce a(SiO2) reduce recession. Recession drives need for coatings
4)(
2)(
33.0
)(
5.0
)()(
33.0
)(
5.0
Si(OH) ofy diffusivit phase gasviscosity
dimension sticcharacteridensity gas stream free velocitystream free
664.0
664.0
4
22
4
4
44
4
OHSi
OHSiO
OHSi
OHSi
OHSiOHSi
OHSi
D
L
PaKLTR
D
D
L
LTR
PD
D
LFlux
L
Combustion
Gases
Gas Boundary
Layer
Si(OH)4(g)
SiO2
ν = 0
Free Stream
Gas Velocity
ν

National Aeronautics and Space Administration
www.nasa.gov
Calculated Y2O3-SiO2 Phase Diagram:
Fabrichnaya-Seifert Database
19
Indirect evidence suggests that the SiO2 thermodynamic activity is
lower in the Y2O3-Y2SiO5 and Y2SiO5-Y2Si2O7 regions
But there are no direct measurements!
1600
1800
2000
2200
2400
2600
2800
TE
MP
ER
AT
UR
E_
KE
LV
IN
0 0.1 0.2 0.3 0.4 0.5 0.6 0.7 0.8 0.9 1.0
MOLE_FRACTION SIO2
THERMO-CALC (2010.08.10:09.24) : DATABASE:USER AC(O)=1, N=1, P=1.01325E5;
Y2O3 + MSY2O3 + MS
MS
+ D
S
MS
+ D
S MS
+ S
iO2
National Aeronautics and Space Administration
www.nasa.gov
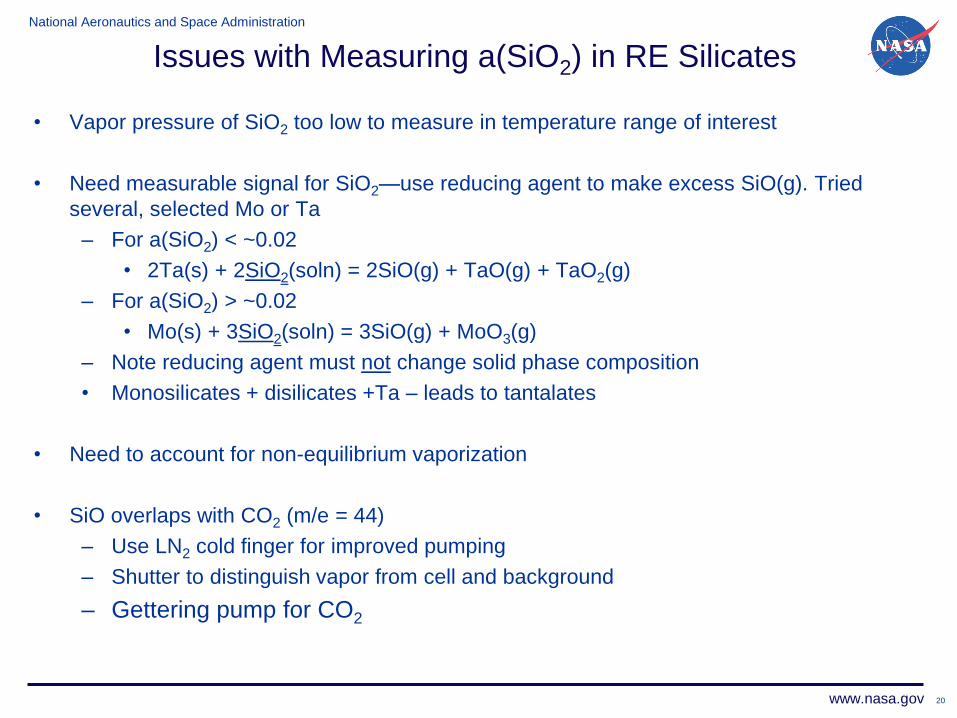
• Vapor pressure of SiO2 too low to measure in temperature range of interest
• Need measurable signal for SiO2—use reducing agent to make excess SiO(g). Tried
several, selected Mo or Ta
– For a(SiO2) < ~0.02
• 2Ta(s) + 2SiO2(soln) = 2SiO(g) + TaO(g) + TaO2(g)
– For a(SiO2) > ~0.02
• Mo(s) + 3SiO2(soln) = 3SiO(g) + MoO3(g)
– Note reducing agent must not change solid phase composition
• Monosilicates + disilicates +Ta – leads to tantalates
• Need to account for non-equilibrium vaporization
• SiO overlaps with CO2 (m/e = 44)
– Use LN2 cold finger for improved pumping
– Shutter to distinguish vapor from cell and background
– Gettering pump for CO2
20
Issues with Measuring a(SiO2) in RE Silicates
National Aeronautics and Space Administration
www.nasa.gov
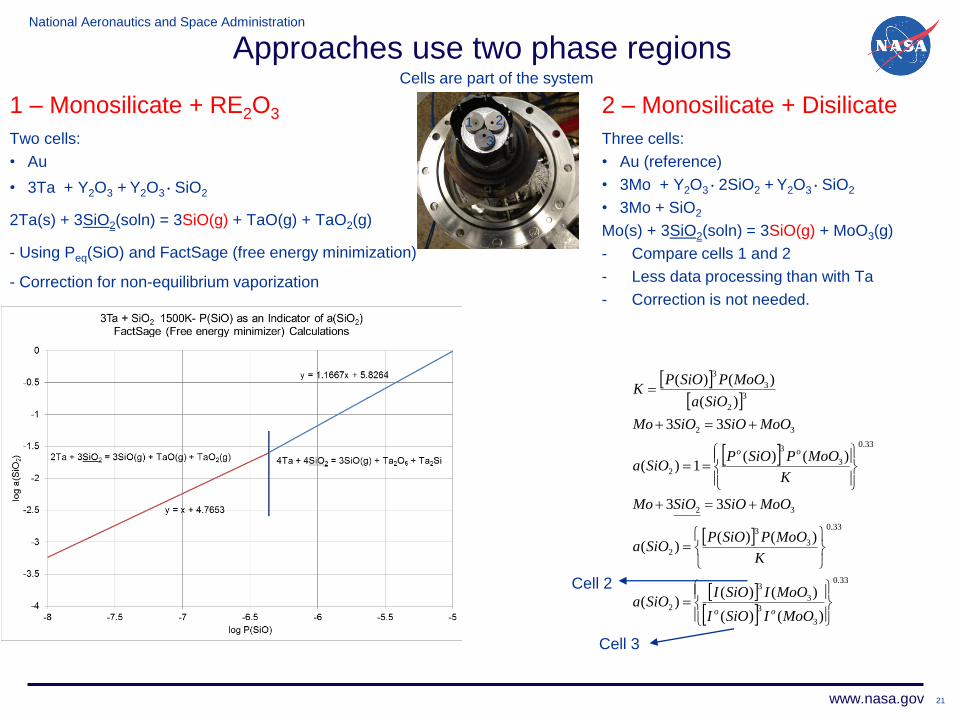
Approaches use two phase regions
Two cells:
• Au
• 3Ta + Y2O3 + Y2O3 SiO2
2Ta(s) + 3SiO2(soln) = 3SiO(g) + TaO(g) + TaO2(g)
- Using Peq(SiO) and FactSage (free energy minimization)
- Correction for non-equilibrium vaporization
21
1 – Monosilicate + RE2O3 2 – Monosilicate + Disilicate
33.0
3
3
3
3
2
33.0
3
3
2
32
33.0
3
3
2
32
3
2
3
3
)()(
)()()(
)()()(
33
)()(1)(
33
)(
)()(
MoOISiOI
MoOISiOISiOa
K
MoOPSiOPSiOa
MoOSiOSiOMo
K
MoOPSiOPSiOa
MoOSiOSiOMo
SiOa
MoOPSiOPK
oo
oo
Three cells:
• Au (reference)
• 3Mo + Y2O3 2SiO2 + Y2O3 SiO2
• 3Mo + SiO2
Mo(s) + 3SiO2(soln) = 3SiO(g) + MoO3(g)
- Compare cells 1 and 2
- Less data processing than with Ta
- Correction is not needed.
Cell 3
Cell 2
1 2
3
Cells are part of the system
National Aeronautics and Space Administration
www.nasa.gov
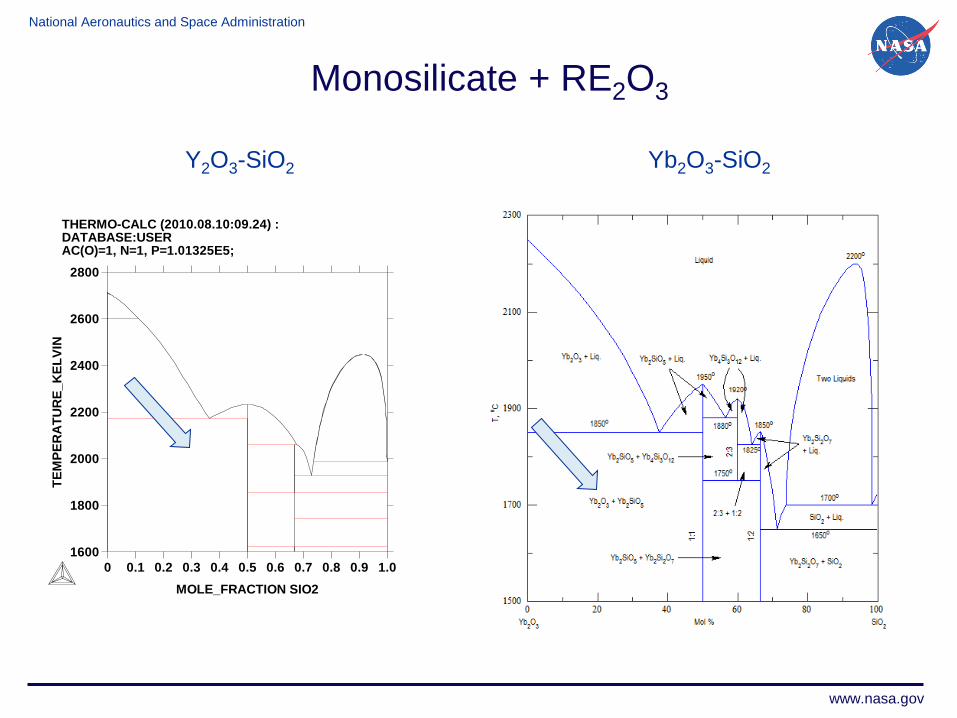
Monosilicate + RE2O3
1600
1800
2000
2200
2400
2600
2800
TE
MP
ER
AT
UR
E_
KE
LV
IN
0 0.1 0.2 0.3 0.4 0.5 0.6 0.7 0.8 0.9 1.0
MOLE_FRACTION SIO2
THERMO-CALC (2010.08.10:09.24) : DATABASE:USER AC(O)=1, N=1, P=1.01325E5;
Y2O3-SiO2 Yb2O3-SiO2
National Aeronautics and Space Administration
www.nasa.gov
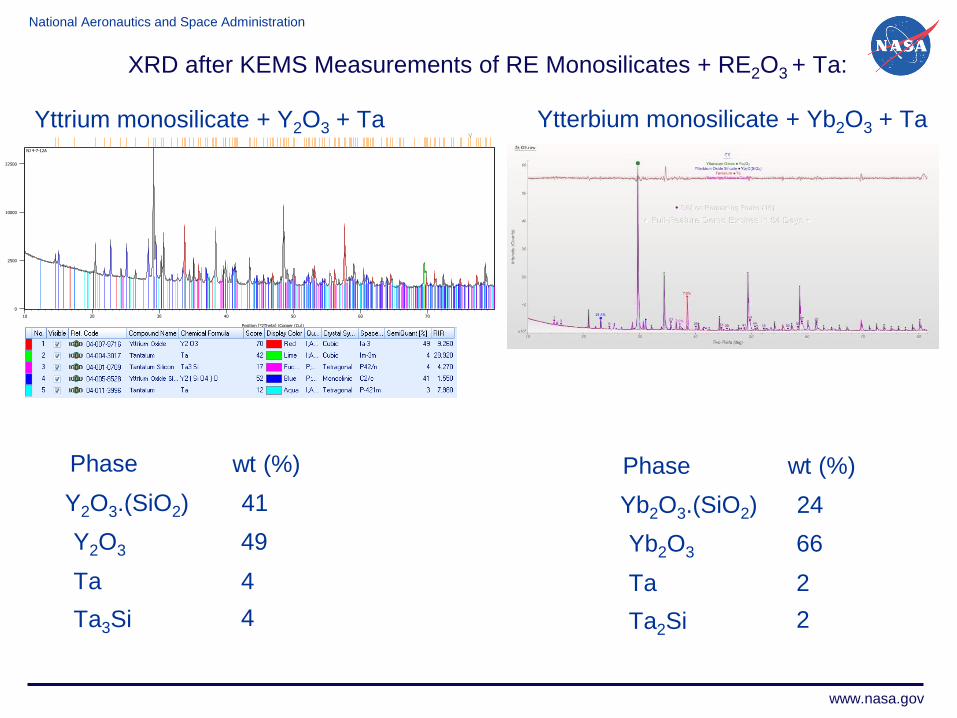
XRD after KEMS Measurements of RE Monosilicates + RE2O3 + Ta:
Sample: 4-7-12A
Position [°2Theta] (Copper (Cu))
10 20 30 40 50 60 70
Counts
0
2500
10000
22500
NJ 4-7-12A
Y2O3
Y2O3.(SiO2)
Ta
Ta3Si
41
49
4
4
wt (%)Phase
Yb2O3
Yb2O3.(SiO2)
Ta
Ta2Si
24
66
2
2
wt (%)Phase
Yttrium monosilicate + Y2O3 + Ta Ytterbium monosilicate + Yb2O3 + Ta

National Aeronautics and Space Administration
www.nasa.gov 24
Raw Data—log (IT) vs 1/T
Cell (1): Au Reference Cell (2): Ta + Y2O3 + MS
Tabulated 346.3 kJ/mol
National Aeronautics and Space Administration
www.nasa.gov 25
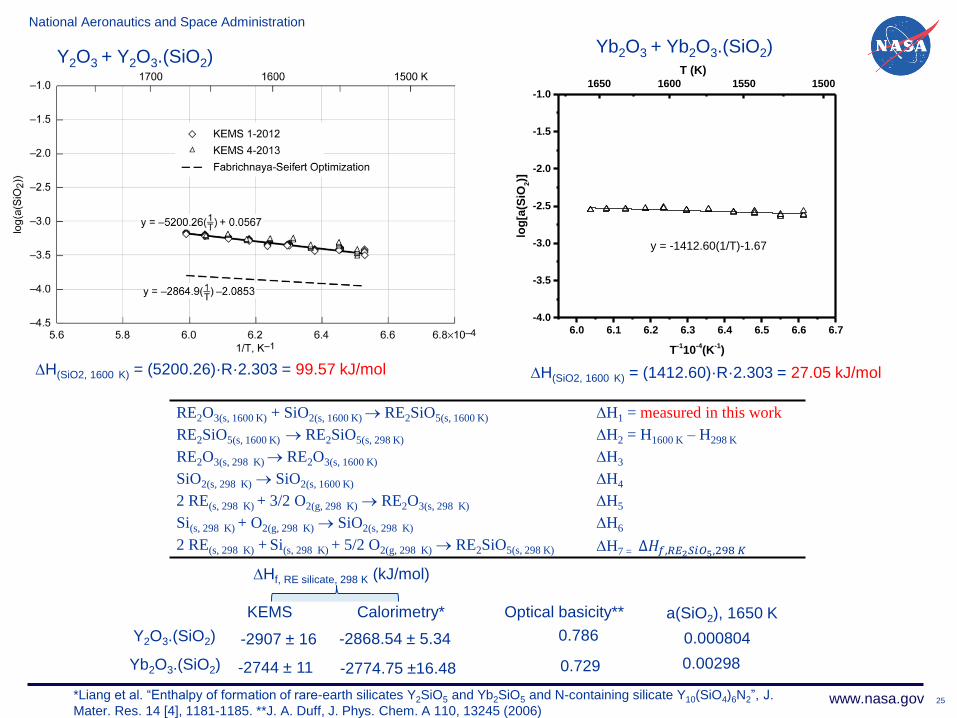
Y2O3 + Y2O3.(SiO2)
*Liang et al. “Enthalpy of formation of rare-earth silicates Y2SiO5 and Yb2SiO5 and N-containing silicate Y10(SiO4)6N2”, J.
Mater. Res. 14 [4], 1181-1185. **J. A. Duff, J. Phys. Chem. A 110, 13245 (2006)
Yb2O3 + Yb2O3.(SiO2)
RE2O3(s, 1600 K) + SiO2(s, 1600 K) RE2SiO5(s, 1600 K) H1 = measured in this work
RE2SiO5(s, 1600 K) RE2SiO5(s, 298 K) H2 = H1600 K – H298 K
RE2O3(s, 298 K) RE2O3(s, 1600 K) H3
SiO2(s, 298 K) SiO2(s, 1600 K) H4
2 RE(s, 298 K) + 3/2 O2(g, 298 K) RE2O3(s, 298 K) H5
Si(s, 298 K) + O2(g, 298 K) SiO2(s, 298 K) H6
2 RE(s, 298 K) + Si(s, 298 K) + 5/2 O2(g, 298 K) RE2SiO5(s, 298 K) H7 = ∆𝐻𝑓,𝑅𝐸2𝑆𝑖𝑂5,298 𝐾
H(SiO2, 1600 K) = (5200.26)·R·2.303 = 99.57 kJ/mol
Y2O3.(SiO2) -2907 ± 16 -2868.54 ± 5.34
Yb2O3.(SiO2) -2744 ± 11 -2774.75 ±16.48
KEMS Calorimetry*
Hf, RE silicate, 298 K (kJ/mol)
a(SiO2), 1650 KOptical basicity**
0.786
0.729
0.000804
6.0 6.1 6.2 6.3 6.4 6.5 6.6 6.7
-4.0
-3.5
-3.0
-2.5
-2.0
-1.5
-1.0
log
[a(S
iO2)]
T-110
-4(K
-1)
y = -1412.60(1/T)-1.67
1650 1600 1550 1500
T (K)
H(SiO2, 1600 K) = (1412.60)·R·2.303 = 27.05 kJ/mol
0.00298

National Aeronautics and Space Administration
www.nasa.gov
Monosilicate + Disilicate
1600
1800
2000
2200
2400
2600
2800
TE
MP
ER
AT
UR
E_
KE
LV
IN
0 0.1 0.2 0.3 0.4 0.5 0.6 0.7 0.8 0.9 1.0
MOLE_FRACTION SIO2
THERMO-CALC (2010.08.10:09.24) : DATABASE:USER AC(O)=1, N=1, P=1.01325E5;
Y2O3-SiO2+ Y2O3-2SiO2 Yb2O3-SiO2+ Yb2O3-2SiO2

National Aeronautics and Space Administration
www.nasa.gov
XRD after KEMS Measurements of RE Monosilicates + Disilicates + Mo:
Y2O3.(SiO2)
Phase
Yb2O3.(SiO2)
Mo
56
36
8
wt (%)Phase
Ytterbium monosilicate + disilicate + Mo
Yb2O3.2(SiO2)
Yttrium monosilicate + disilicate +Mo
Position [°2Theta] (Copper (Cu))
10 20 30 40 50 60 70
Counts
0
400
1600
3600
6400
NJ 2-07824
Peak List
Y2 ( Si O4 ) O; Monoclinic; 04-007-4730
Mo; Cubic; 04-004-8483
Y2 Si2 O7; Monoclinic; 00-038-0440
Ln2 Si2 O7; Monoclinic; 00-021-1014
Y2 Si2 O7; Monoclinic; 00-042-0167
Y2O3.2(SiO2)
Mo

National Aeronautics and Space Administration
www.nasa.gov
Y2O3.(SiO2) + Y2O3.2(SiO2) Yb2O3.(SiO2) + Yb2O3.2(SiO2)
5.30 5.35 5.40 5.45 5.50 5.55 5.60 5.65
-1.2
-1.0
-0.8
-0.6
-0.4
-0.2
0.0
log
[a(S
iO2)]
T-1 10
-4 (K
-1)
1880 1860 1840 1820 1800 1780
T (K)
a(SiO2), 1650 KOptical basicity**
0.786
0.729 0.194
Y2O3.(SiO2)
Yb2O3.(SiO2)
Y2O3.2(SiO2)
0.699
0.657
Yb2O3.2(SiO2)
0.281
National Aeronautics and Space Administration
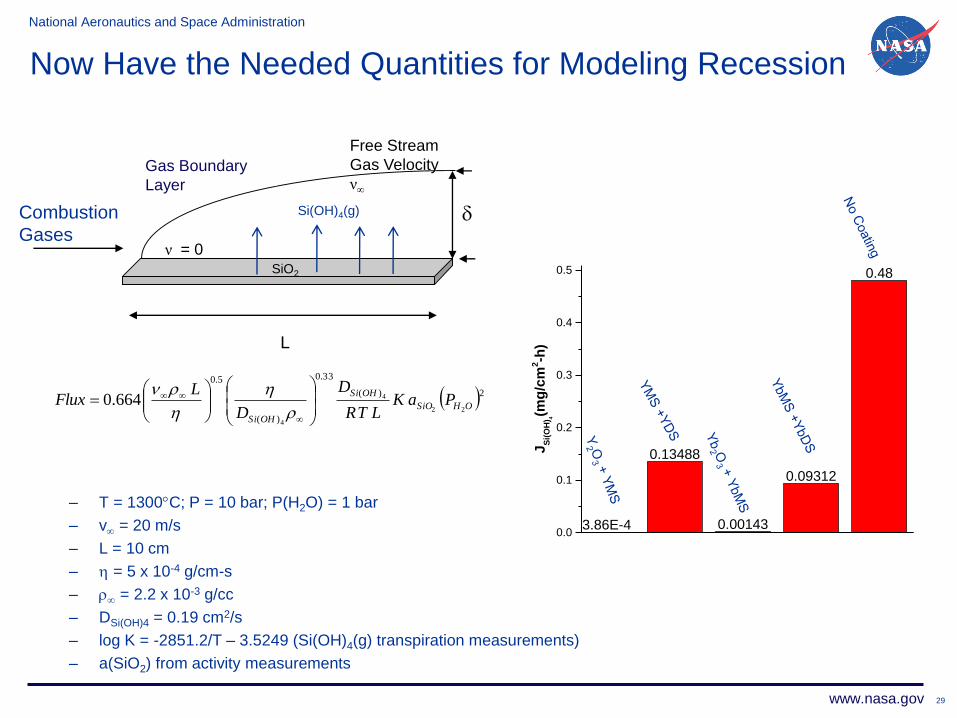
www.nasa.gov 29
L
Combustion
Gases
Gas Boundary
Layer
Si(OH)4(g)
SiO2
ν = 0
Free Stream
Gas Velocity
ν
Now Have the Needed Quantities for Modeling Recession
3.86E-4
0.13488
0.00143
0.09312
0.48
0.0
0.1
0.2
0.3
0.4
0.5
JS
i(O
H) 4
(mg
/cm
2-h
)
– T = 1300C; P = 10 bar; P(H2O) = 1 bar
– v = 20 m/s
– L = 10 cm
– = 5 x 10⁻⁴ g/cm-s
– = 2.2 x 10⁻³ g/cc
– DSi(OH)4 = 0.19 cm2/s
– log K = -2851.2/T – 3.5249 (Si(OH)4(g) transpiration measurements)
– a(SiO2) from activity measurements
2)(
33.0
)(
5.0
22
4
4
664.0 OHSiO
OHSi
OHSi
PaKLTR
D
D
LFlux
National Aeronautics and Space Administration
www.nasa.gov
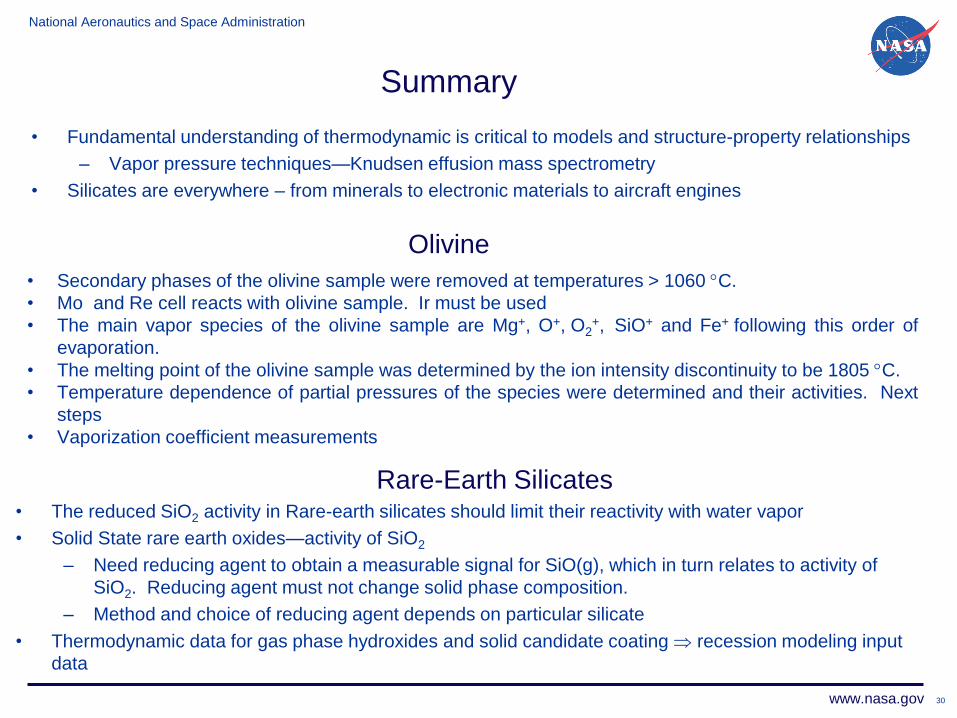
Summary
• The reduced SiO2 activity in Rare-earth silicates should limit their reactivity with water vapor
• Solid State rare earth oxides—activity of SiO2
– Need reducing agent to obtain a measurable signal for SiO(g), which in turn relates to activity of
SiO2. Reducing agent must not change solid phase composition.
– Method and choice of reducing agent depends on particular silicate
• Thermodynamic data for gas phase hydroxides and solid candidate coating recession modeling input
data
30
• Secondary phases of the olivine sample were removed at temperatures > 1060 C.
• Mo and Re cell reacts with olivine sample. Ir must be used
• The main vapor species of the olivine sample are Mg+, O+, O2+, SiO+ and Fe+ following this order of
evaporation.
• The melting point of the olivine sample was determined by the ion intensity discontinuity to be 1805 C.
• Temperature dependence of partial pressures of the species were determined and their activities. Next
steps
• Vaporization coefficient measurements
• Fundamental understanding of thermodynamic is critical to models and structure-property relationships
– Vapor pressure techniques—Knudsen effusion mass spectrometry
• Silicates are everywhere – from minerals to electronic materials to aircraft engines
Olivine
Rare-Earth Silicates

National Aeronautics and Space Administration
www.nasa.gov
Acknowledgements
• Helpful discussions with B. Opila (Formerly NASA Glenn now
University of Virginia)
• Multiple cell and sampling system improvements to mass
spectrometer: E. Copland (formerly NASA Glenn now CSIRO,
Sydney, Australia)
• XRD: R. Rogers (NASA Glenn)
• NASA/ORAU Post-doctoral Fellowship Program