Thermo-mechanical cementation effects in bentonite ... · Thermo-mechanical cementation effects in...
45
Svensk Kärnbränslehantering AB Swedish Nuclear Fuel and Waste Management Co Box 250, SE-101 24 Stockholm Phone +46 8 459 84 00 Technical Report TR-10-41 Thermo-mechanical cementation effects in bentonite investigated by unconfined compression tests Ann Dueck, Clay Technology AB January 2010
Transcript of Thermo-mechanical cementation effects in bentonite ... · Thermo-mechanical cementation effects in...
Svensk Kärnbränslehantering ABSwedish Nuclear Fueland Waste Management Co
Box 250, SE-101 24 Stockholm Phone +46 8 459 84 00
Technical Report
TR-10-41
Thermo-mechanical cementation effects in bentonite investigated by unconfined compression tests
Ann Dueck, Clay Technology AB
January 2010
CM
Gru
ppen
AB
, Bro
mm
a, 2
010
Tänd ett lager:
P, R eller TR.
Thermo-mechanical cementation effects in bentonite investigated by unconfined compression tests
Ann Dueck, Clay Technology AB
January 2010
Keywords: Bentonite, Unconfined compression test, Reduced strain at failure.
This report concerns a study which was conducted for SKB. The conclusions and viewpoints presented in the report are those of the author. SKB may draw modified conclusions, based on additional literature sources and/or expert opinions.
A pdf version of this document can be downloaded from www.skb.se.
ISSN 1404-0344
SKB TR-10-41
TR-10-41 3
Abstract
Results from the project LOT /Karnland et al. 2009/ showed that specimens exposed to warm conditions had a significantly reduced strain at failure compared to reference material. The objective of the present study was to investigate the impact of parameters such as temperature, density, water content and degree of saturation on the occurrence of brittleness at failure of bentonite specimens.
To quantify the influence of the different parameters the unconfined compression test was used on specimens with a height and diameter of 20 mm. In this test the relation between stress and strain is determined from axial compression of a cylindrical specimen.
Brittle failure is in this investigation mainly seen on specimens having a density of ρ ≥ 2,060 kg/m3 or on specimens exposed to high temperature T ≥ 150°C in the laboratory. Brittle failure behaviour was also seen on unsaturated specimens with a degree of saturation less than Sr < 90%. Failure at reduced strain was seen in this investigation on specimens exposed to T = 150°C, on specimens having a water content of wi = 0% before saturation, on specimens with a final degree of saturation of Sr ≤ 97% and also on one specimen subjected to consolidation during preparation.
Brittle failure and reduced strain were noticed in the heated field exposed material in the LOT project. Similar behaviour was also observed in the present short term laboratory tests. However, the specimens in the present study showing this behaviour had higher density, lower degree of saturation or were exposed to higher temperatures than the field exposed specimens.
4 TR-10-41
Sammanfattning
Resultat från projektet LOT /Karnland et al. 2009/ visade att prover som utsatts för varma förhållanden i fält uppvisade signifikant minskade töjningar vid brott jämfört med referensmaterialet. Syftet med den aktuella studien har varit att undersöka betydelsen av parametrar som till exempel temperatur, densitet, vattenkvot och vattenmättnadsgrad för bentonitprovers sprödhet vid brott.
För att kvantifiera inverkan av olika parametrar har enaxliga tryckförsök utförts på prover med dimensionerna höjd och diameter lika med 20 mm. Från denna typ av försök kan relationen mellan spänning och töjning bestämmas utifrån axiell belastning av en cylindrisk provkropp.
Sprött brott har i denna undersökning huvudsakligen observerats på prover med en densitet motsvarande ρ ≥ 2 060 kg/m3 eller på prover som utsatts för höga temperaturer T ≥ 150 °C i laboratoriet. Sprött brott har också iakttagits på omättade prover med en vattenmättnadsgrad lägre än Sr < 90%. Brott vid reducerad töjning har observerats på prover som utsatts för T = 150 °C, på prover med vattenkvot wi = 0 % före vattenmättnad, på prover med slutlig vattenmättnadsgrad Sr ≤ 97 % och även på ett prov som utsatts för konsolidering under prepareringen.
Sprött brott eller reducerad töjning vid brott observerades på prover som exponerats för varma fält-förhållanden i projektet LOT. Liknande uppförande har observerats i de aktuella laboratorieförsöken. Proverna i den aktuella studien där detta uppförande observerades hade dock högre densitet, lägre vattenmättnadsgrad eller hade exponerats för högre temperatur än de fältexponerade proverna.
TR-10-41 5
Contents
1 Introduction 71.1 Background 71.2 Objective 71.3 Unconfined compression tests in the LOT project 7
2 Determination of base variables 92.1 General 9
3 Unconfined compression test 113.1 General 113.2 Equipment 113.3 Preparation of specimen 113.4 Test procedure 123.5 Test results 12
4 Materials and test series 134.1 General 134.2 Materials used 134.3 Test series 13
5 Results 155.1 General 155.2 Results of test series A–O 15
A. Influence of swelling and initial stresses of MX-80 15B. Influence of different preparation of MX-80 16C. Influence of time of exposure of MX-80 to 150°C 17D. Influence of initial water content of MX-80 18E. DepCaN exposed to 150°C 19F. MX-80 exposed to 200°C 20G. Purified WyNa and WyCa exposed to 150°C 21H. Influence of water content at compaction of MX-80 22IJ. MX-80 field exposed to 80–110°C 23K. Effect of stress anisotropy of MX-80 24L. Effect of stress path of MX-80 25M. Effect of degree of saturation of MX-80 26N. Influence of freezing of MX-80 and DepCaN 27O. Influence of gypsum content in MX-80 28
6 Analysis 296.1 General 296.2 Comparison and determining factors 30
6.2.1 Impact of preparation – stress path 306.2.2 Impact of preparation – initial water content 316.2.3 Impact of test technique 326.2.4 Impact of temperature 336.2.5 Impact of dominating exchangeable ions 366.2.6 Impact of gypsum content 376.2.7 Impact of degree of saturation 376.2.8 Impact of stress anisotropy 396.2.9 Impact of field condition 406.2.10 Impact of milling and re-compaction 416.2.11 Impact of shear rate 41
6.3 Brittle failure, table 42
7 Discussion and conclusions 437.1 Deviator stress at failure 437.2 Strain at failure 43
6 TR-10-41
7.3 Brittle failure behaviour 437.4 General conclusions from this study 44
References 45
Appendix 1 Preparation of specimens to test series L 47
TR-10-41 7
1 Introduction
1.1 BackgroundMechanical properties such as shear strength are important parameters required by models used for predicting the physical behaviour of saturated buffer in the final disposal of spent nuclear fuel /Börgesson et al. 1995/. The LOT project /Karnland et al. 2009/ provided an opportunity to compare such mechanical properties of buffer material exposed to field conditions relative to the initial properties of reference buffer material. Unconfined compression tests were used to determine the relation between stress and strain.
The results showed that specimens exposed to warm field conditions had a significantly reduced strain at failure compared to reference material. In addition some of the specimens exposed to the most extreme conditions developed a failure surface that deviated from the failure surface which is common in this type of material.
1.2 ObjectiveThe objective with the present study was to investigate the impact of parameters as temperature, stress, strain, density, water content, degree of saturation, gypsum content and dominating exchangeable ions on the failure behaviour and the occurrence of brittleness at failure. In addition the following possible experimental artefacts were studied; initial conditions and friction during shearing. To quantify the influence the unconfined compression test was used.
In this project the word cementation is used as a general term for the process involving a change in mechanical properties including brittleness at failure.
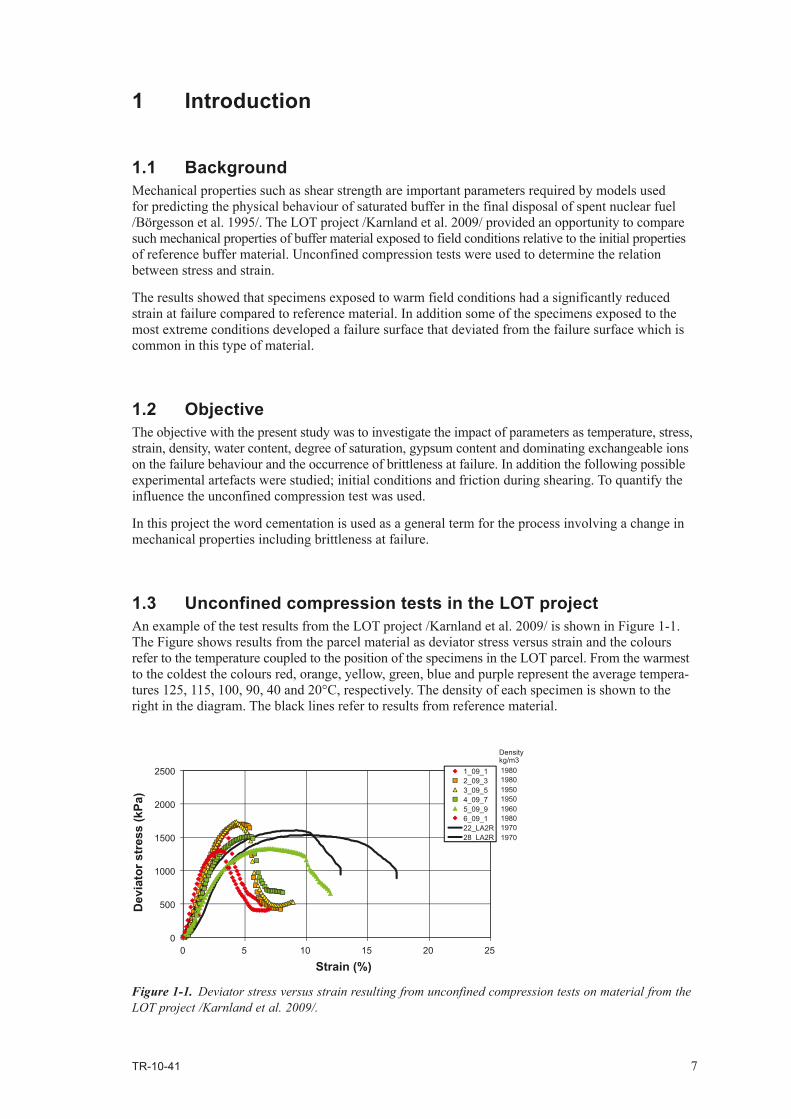
1.3 Unconfined compression tests in the LOT projectAn example of the test results from the LOT project /Karnland et al. 2009/ is shown in Figure 1-1. The Figure shows results from the parcel material as deviator stress versus strain and the colours refer to the temperature coupled to the position of the specimens in the LOT parcel. From the warmest to the coldest the colours red, orange, yellow, green, blue and purple represent the average tempera-tures 125, 115, 100, 90, 40 and 20°C, respectively. The density of each specimen is shown to the right in the diagram. The black lines refer to results from reference material.
Figure 1-1. Deviator stress versus strain resulting from unconfined compression tests on material from the LOT project /Karnland et al. 2009/.
0
500
1000
1500
2000
2500
0 5 10 15 20 25
Dev
iato
r str
ess
(kPa
)
Strain (%)
1_09_12_09_33_09_54_09_75_09_96_09_122_LA2R28_LA2R
19801980195019501960198019701970
Density kg/m3
8 TR-10-41
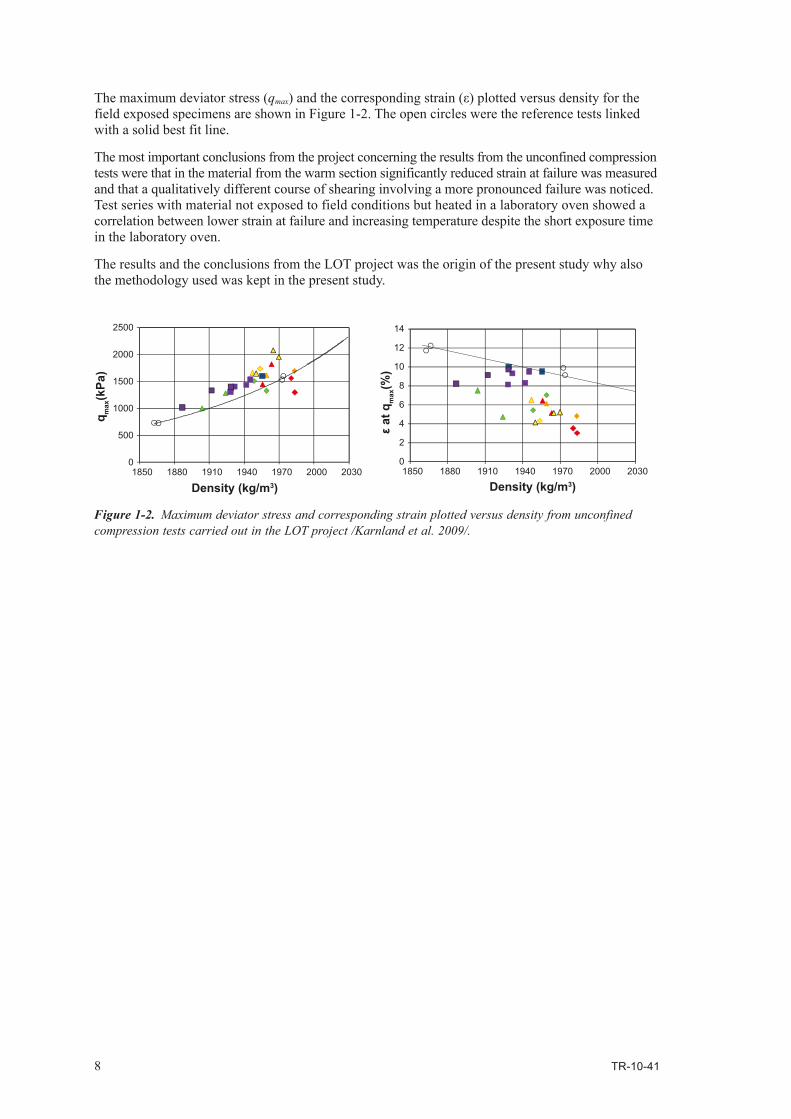
The maximum deviator stress (qmax) and the corresponding strain (ε) plotted versus density for the field exposed specimens are shown in Figure 1-2. The open circles were the reference tests linked with a solid best fit line.
The most important conclusions from the project concerning the results from the unconfined compression tests were that in the material from the warm section significantly reduced strain at failure was measured and that a qualitatively different course of shearing involving a more pronounced failure was noticed. Test series with material not exposed to field conditions but heated in a laboratory oven showed a correlation between lower strain at failure and increasing temperature despite the short exposure time in the laboratory oven.
The results and the conclusions from the LOT project was the origin of the present study why also the methodology used was kept in the present study.
Figure 1-2. Maximum deviator stress and corresponding strain plotted versus density from unconfined compression tests carried out in the LOT project /Karnland et al. 2009/.
0
500
1000
1500
2000
2500
1850 1880 1910 1940 1970 2000 2030
q max
(kPa
)
Density (kg/m3)
0
2
4
6
8
10
12
14
1850 1880 1910 1940 1970 2000 2030
ε at
qm
ax(%
)
Density (kg/m3)
TR-10-41 9
2 Determination of base variables
2.1 GeneralThe base variables include water content w (%), void ratio e and degree of saturation Sr (%) and were determined according to Equation 2-1–Equation 2-3.
s
stot
mmmw −
⋅= 100 2-1
1)100/1( −+= we s
ρρ 2-2
ewS
w
sr ⋅
⋅=ρρ 2-3
where
mtot = total mass of the specimen (g)
ms = dry mass of the specimen (g)
ρs = particle density (kg/m3)
ρw = density of water (kg/m3)
ρ = bulk density of the specimen (kg/m3)
The dry mass of the specimen was obtained from drying the wet specimen at 105°C for 24h. The bulk density was calculated from the total mass of the specimen and the volume determined by weighing the specimen above and submerged into paraffin oil.
TR-10-41 11
3 Unconfined compression test
3.1 GeneralThe unconfined compression test has been used in several studies where the mechanical or physical properties of bentonite were of interest. For example has the test been used for evaluating relative physical changes between different positions in the field exposed material and the reference material by /Karnland et al. 2009/. The test has also been used for evaluating effects of different test techniques and effects of material composition by /Dueck et al. 2010/. Another example is the study on influence of shear rate reported by /Börgesson et al. 2004/.
The unconfined compression test is an experimentally simple method where a specimen is compressed axially with a constant rate of strain and no radial confinement or external radial stress. Cylindrical samples are used and the dimensions of the specimen are often a height which is double the size of the diameter. However, in the present study the height of the specimens has been equal to the diameter of the specimens and below is a description of the methodology used.
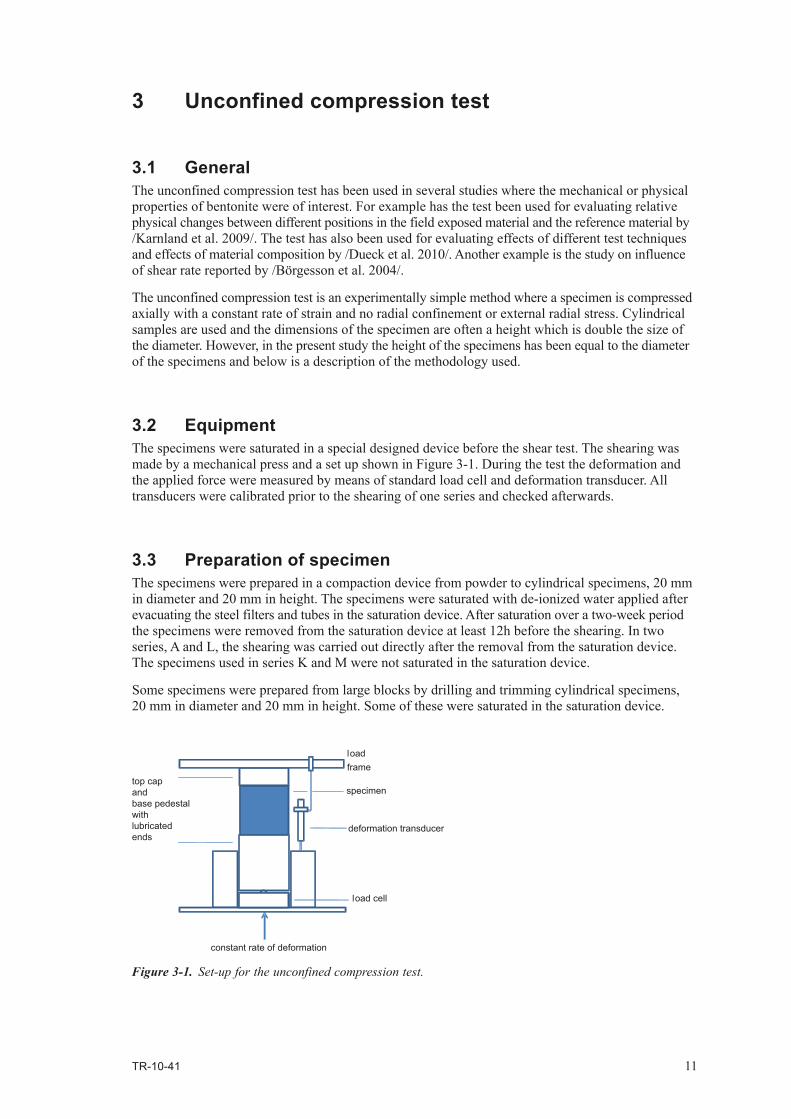
3.2 EquipmentThe specimens were saturated in a special designed device before the shear test. The shearing was made by a mechanical press and a set up shown in Figure 3-1. During the test the deformation and the applied force were measured by means of standard load cell and deformation transducer. All transducers were calibrated prior to the shearing of one series and checked afterwards.
3.3 Preparation of specimenThe specimens were prepared in a compaction device from powder to cylindrical specimens, 20 mm in diameter and 20 mm in height. The specimens were saturated with de-ionized water applied after evacuating the steel filters and tubes in the saturation device. After saturation over a two-week period the specimens were removed from the saturation device at least 12h before the shearing. In two series, A and L, the shearing was carried out directly after the removal from the saturation device. The specimens used in series K and M were not saturated in the saturation device.
Some specimens were prepared from large blocks by drilling and trimming cylindrical specimens, 20 mm in diameter and 20 mm in height. Some of these were saturated in the saturation device.
Figure 3-1. Set-up for the unconfined compression test.
loadframe
specimen
load cell
deformation transducer
top capandbase pedestalwith lubricatedends
constant rate of deformation
12 TR-10-41
3.4 Test procedureThe specimens were placed in the mechanical press and the compression started and continued at a constant deformation rate of 0.16 mm/min (or 0.003 mm/s). To minimize boundary effects from the top and bottom during shearing the specimen’s ends were lubricated by use of vacuum grease. During shearing the specimens were surrounded by a protective plastic sheet to prevent or minimize evaporation. After failure the water content and density were determined according to Chapter 2.
The heated specimens were, still inside the saturation device, exposed to the maximum temperature during 24h. The increase and decrease in temperature were made in steps of approximately 40°C and each temperature was kept for a minimum of 1h. In one of the series some specimens were only exposed to the maximum temperature during 5h. In series with heated specimens a water pressure was applied to all specimens during the saturation and heating. After the heating the water pressure was reduced to zero for 12h, before the removal from the saturation device. The water pressures 700 kPa and 2,000 kPa were used for specimens exposed to T = 150°C and T = 200°C, respectively.
3.5 Test resultsThe specimens were considered as undrained during shearing and no volume change was taken into account. The deviator stress q (kPa) and the strain ε (%) were derived from Equation 3-1 and Equation 3-2, respectively.
)(0
0
0 lll
AFq ∆−⋅= 3-1
0ll∆=ε 3-2
where
F = applied vertical load (kN) A0 = original cross section area (m2) l0 = original length (m) ∆l = change in length (m)
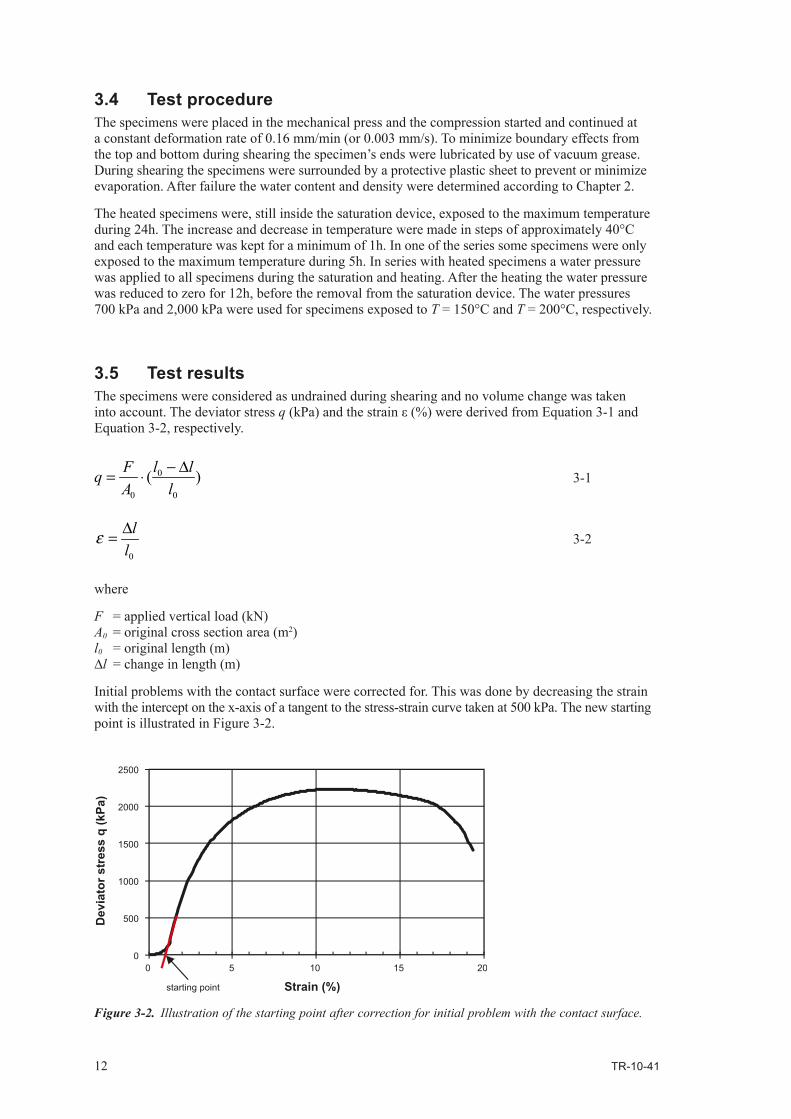
Initial problems with the contact surface were corrected for. This was done by decreasing the strain with the intercept on the x-axis of a tangent to the stress-strain curve taken at 500 kPa. The new starting point is illustrated in Figure 3-2.
Figure 3-2. Illustration of the starting point after correction for initial problem with the contact surface.
0
500
1000
1500
2000
2500
0 5 10 15 20
Dev
iato
r str
ess
q (k
Pa)
Strain (%)starting point
TR-10-41 13
4 Materials and test series
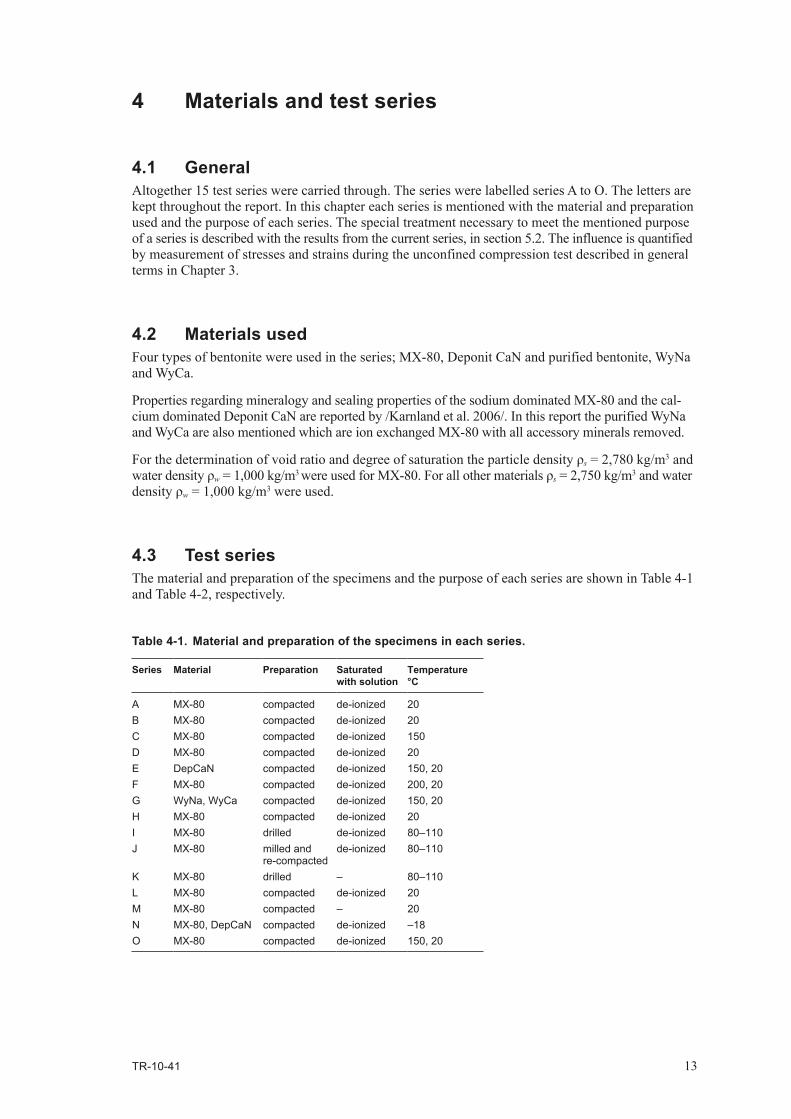
4.1 GeneralAltogether 15 test series were carried through. The series were labelled series A to O. The letters are kept throughout the report. In this chapter each series is mentioned with the material and preparation used and the purpose of each series. The special treatment necessary to meet the mentioned purpose of a series is described with the results from the current series, in section 5.2. The influence is quantified by measurement of stresses and strains during the unconfined compression test described in general terms in Chapter 3.
4.2 Materials usedFour types of bentonite were used in the series; MX-80, Deponit CaN and purified bentonite, WyNa and WyCa.
Properties regarding mineralogy and sealing properties of the sodium dominated MX-80 and the cal-cium dominated Deponit CaN are reported by /Karnland et al. 2006/. In this report the purified WyNa and WyCa are also mentioned which are ion exchanged MX-80 with all accessory minerals removed.
For the determination of void ratio and degree of saturation the particle density ρs = 2,780 kg/m3 and water density ρw = 1,000 kg/m3 were used for MX-80. For all other materials ρs = 2,750 kg/m3 and water density ρw = 1,000 kg/m3 were used.
4.3 Test seriesThe material and preparation of the specimens and the purpose of each series are shown in Table 4-1 and Table 4-2, respectively.
Table 4-1. Material and preparation of the specimens in each series.
Series Material Preparation Saturated with solution
Temperature °C
A MX-80 compacted de-ionized 20B MX-80 compacted de-ionized 20C MX-80 compacted de-ionized 150D MX-80 compacted de-ionized 20E DepCaN compacted de-ionized 150, 20F MX-80 compacted de-ionized 200, 20G WyNa, WyCa compacted de-ionized 150, 20H MX-80 compacted de-ionized 20I MX-80 drilled de-ionized 80–110J MX-80 milled and
re-compactedde-ionized 80–110
K MX-80 drilled – 80–110L MX-80 compacted de-ionized 20M MX-80 compacted – 20N MX-80, DepCaN compacted de-ionized –18O MX-80 compacted de-ionized 150, 20
14 TR-10-41
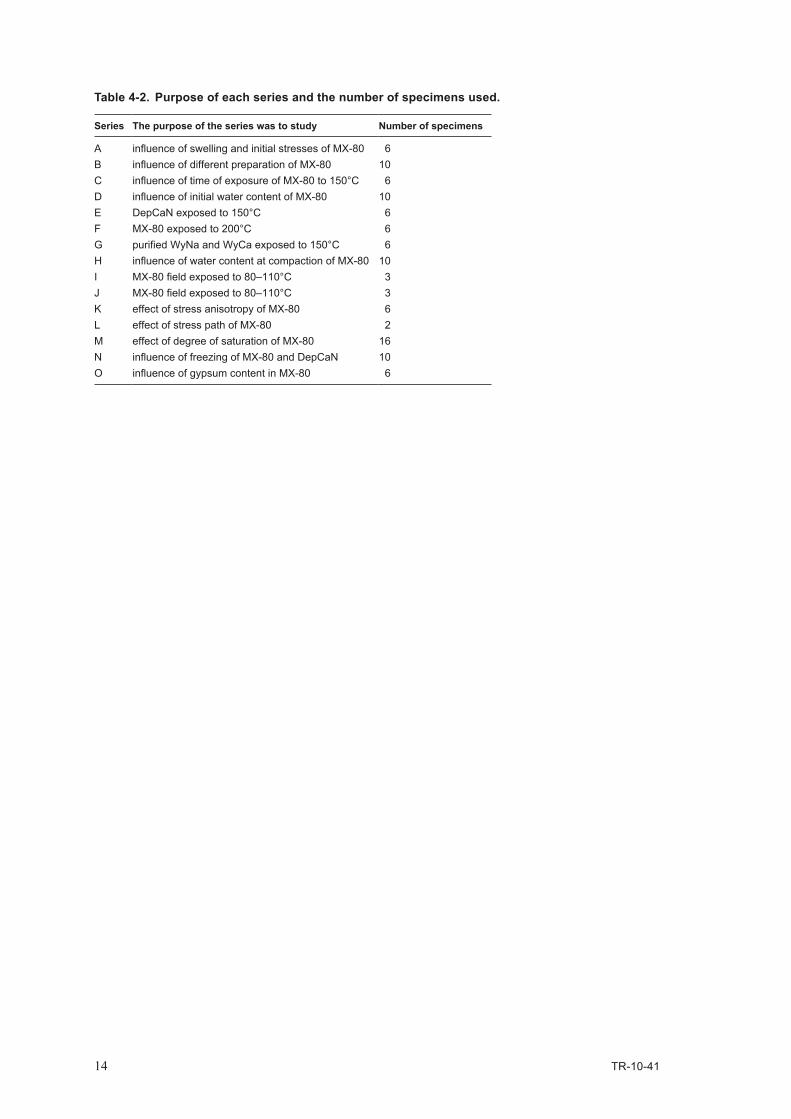
Table 4-2. Purpose of each series and the number of specimens used.
Series The purpose of the series was to study Number of specimens
A influence of swelling and initial stresses of MX-80 6B influence of different preparation of MX-80 10C influence of time of exposure of MX-80 to 150°C 6D influence of initial water content of MX-80 10E DepCaN exposed to 150°C 6F MX-80 exposed to 200°C 6G purified WyNa and WyCa exposed to 150°C 6H influence of water content at compaction of MX-80 10I MX-80 field exposed to 80–110°C 3J MX-80 field exposed to 80–110°C 3K effect of stress anisotropy of MX-80 6L effect of stress path of MX-80 2M effect of degree of saturation of MX-80 16N influence of freezing of MX-80 and DepCaN 10O influence of gypsum content in MX-80 6
TR-10-41 15
5 Results
5.1 GeneralAll test series carried out in this project are presented in separate sections below. Each section starts with a brief description of the objective of the test series and details regarding deviations from the preparation and test procedure presented in Chapter 3. Each section ends with the test results presented as a graph and in tabular form.
Each test is denoted by a letter A–O, representing the test series, and a serial number. This notation is used in the legends of each graph together with values of characteristic variables as maximum temperature, density or initial water content, e.g. C107 150 1900 denoting test number_maximum temperature (°C)_density (kg/m3). The notations are described in the captions of each graph. The density ρ used in this chapter is the bulk density.
The tests were numbered according to the following. Tests 100–136 were carried out in test series with 6 specimens and tests 200–240 were carried out in series with 10 specimens. The series I to L were numbered differently. Tests I01–I03 and J01–03 were carried out together with a total of 6 specimens. None of the specimens in test series K and M were saturated in the saturation device. The tests in series K were numbered K01–K06 and in series M the first two figures represent the water content and the third represents a serial number.
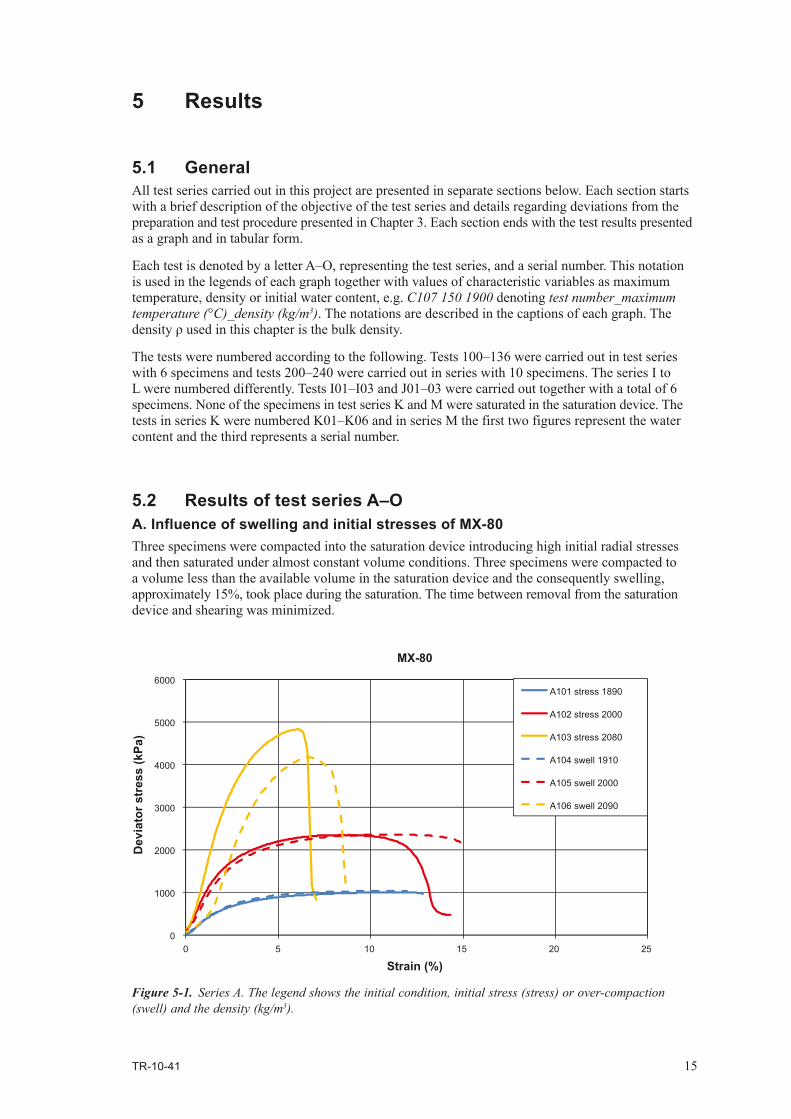
5.2 Results of test series A–OA. Influence of swelling and initial stresses of MX-80Three specimens were compacted into the saturation device introducing high initial radial stresses and then saturated under almost constant volume conditions. Three specimens were compacted to a volume less than the available volume in the saturation device and the consequently swelling, approximately 15%, took place during the saturation. The time between removal from the saturation device and shearing was minimized.
Figure 5-1. Series A. The legend shows the initial condition, initial stress (stress) or over-compaction (swell) and the density (kg/m3).
0
1000
2000
3000
4000
5000
6000
0 5 10 15 20 25
Dev
iato
r str
ess
(kPa
)
Strain (%)
MX-80
A101 stress 1890
A102 stress 2000
A103 stress 2080
A104 swell 1910
A105 swell 2000
A106 swell 2090
16 TR-10-41
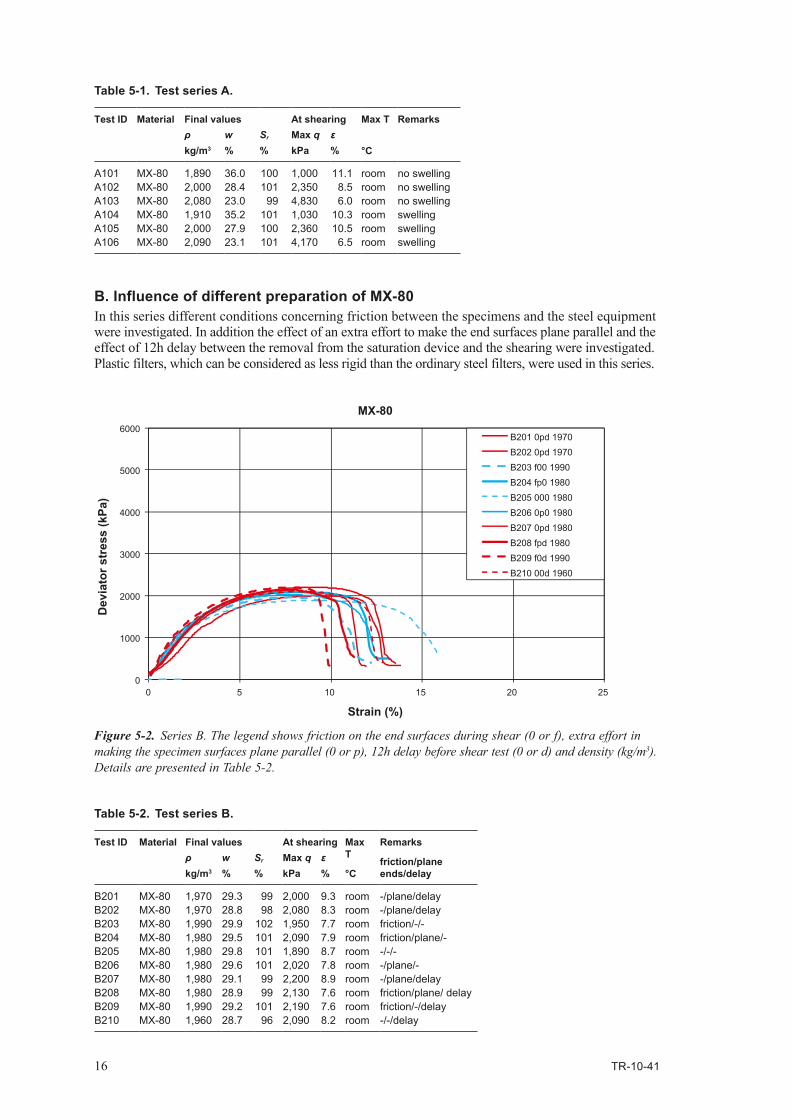
B. Influence of different preparation of MX-80In this series different conditions concerning friction between the specimens and the steel equipment were investigated. In addition the effect of an extra effort to make the end surfaces plane parallel and the effect of 12h delay between the removal from the saturation device and the shearing were investigated. Plastic filters, which can be considered as less rigid than the ordinary steel filters, were used in this series.
Table 5-1. Test series A.
Test ID Material Final values At shearing Max T
°C
Remarksρkg/m3
w%
Sr
%Max qkPa
ε%
A101 MX-80 1,890 36.0 100 1,000 11.1 room no swellingA102 MX-80 2,000 28.4 101 2,350 8.5 room no swellingA103 MX-80 2,080 23.0 99 4,830 6.0 room no swellingA104 MX-80 1,910 35.2 101 1,030 10.3 room swellingA105 MX-80 2,000 27.9 100 2,360 10.5 room swellingA106 MX-80 2,090 23.1 101 4,170 6.5 room swelling
Figure 5-2. Series B. The legend shows friction on the end surfaces during shear (0 or f), extra effort in making the specimen surfaces plane parallel (0 or p), 12h delay before shear test (0 or d) and density (kg/m3). Details are presented in Table 5-2.
Table 5-2. Test series B.
Test ID Material Final values At shearing Max T
°C
Remarks
friction/plane ends/delay
ρkg/m3
w%
Sr
%Max qkPa
ε%
B201 MX-80 1,970 29.3 99 2,000 9.3 room -/plane/delayB202 MX-80 1,970 28.8 98 2,080 8.3 room -/plane/delayB203 MX-80 1,990 29.9 102 1,950 7.7 room friction/-/-B204 MX-80 1,980 29.5 101 2,090 7.9 room friction/plane/-B205 MX-80 1,980 29.8 101 1,890 8.7 room -/-/-B206 MX-80 1,980 29.6 101 2,020 7.8 room -/plane/-B207 MX-80 1,980 29.1 99 2,200 8.9 room -/plane/delayB208 MX-80 1,980 28.9 99 2,130 7.6 room friction/plane/ delayB209 MX-80 1,990 29.2 101 2,190 7.6 room friction/-/delayB210 MX-80 1,960 28.7 96 2,090 8.2 room -/-/delay
0
1000
2000
3000
4000
5000
6000
0 5 10 15 20 25
Dev
iato
r str
ess
(kPa
)
B201 0pd 1970B202 0pd 1970B203 f00 1990B204 fp0 1980B205 000 1980B206 0p0 1980B207 0pd 1980B208 fpd 1980B209 f0d 1990B210 00d 1960
Strain (%)
MX-80
TR-10-41 17
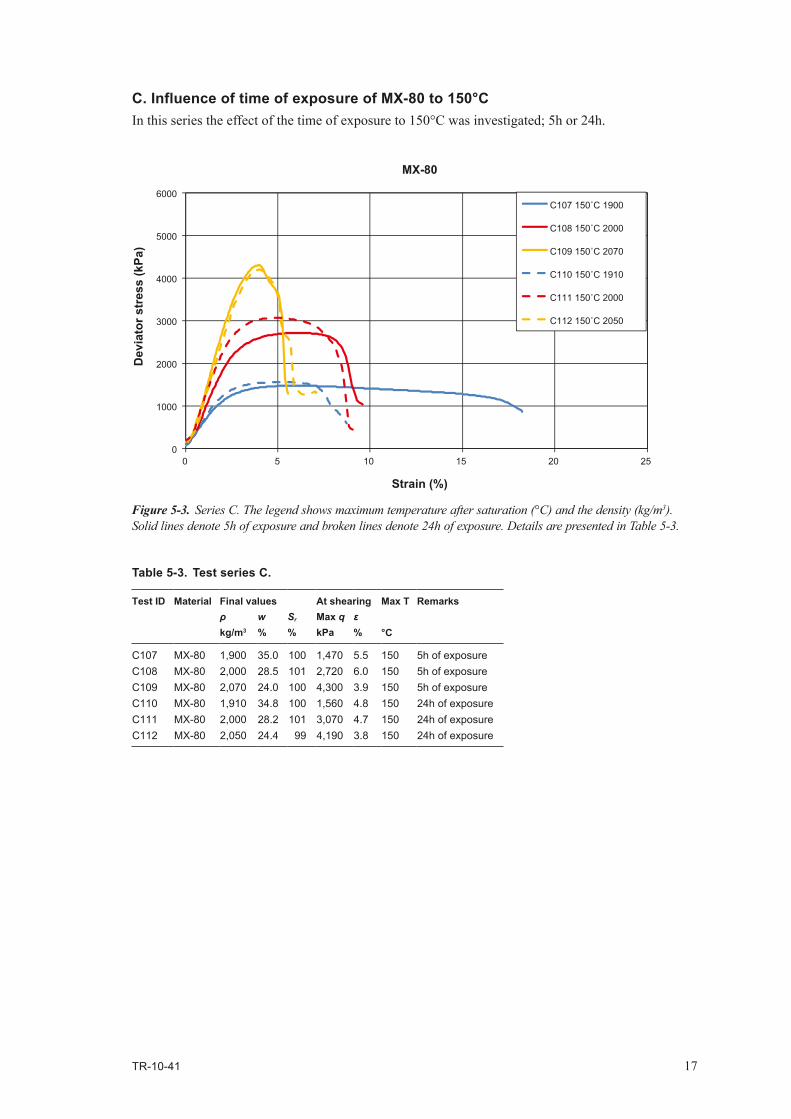
C. Influence of time of exposure of MX-80 to 150°CIn this series the effect of the time of exposure to 150°C was investigated; 5h or 24h.
Figure 5-3. Series C. The legend shows maximum temperature after saturation (°C) and the density (kg/m3). Solid lines denote 5h of exposure and broken lines denote 24h of exposure. Details are presented in Table 5-3.
Table 5-3. Test series C.
Test ID Material Final values At shearing Max T
°C
Remarksρkg/m3
w%
Sr
%Max qkPa
ε%
C107 MX-80 1,900 35.0 100 1,470 5.5 150 5h of exposureC108 MX-80 2,000 28.5 101 2,720 6.0 150 5h of exposureC109 MX-80 2,070 24.0 100 4,300 3.9 150 5h of exposureC110 MX-80 1,910 34.8 100 1,560 4.8 150 24h of exposureC111 MX-80 2,000 28.2 101 3,070 4.7 150 24h of exposureC112 MX-80 2,050 24.4 99 4,190 3.8 150 24h of exposure
0
1000
2000
3000
4000
5000
6000
0 5 10 15 20 25
Dev
iato
r str
ess
(kPa
)
C107 150˚C 1900
C108 150˚C 2000
C109 150˚C 2070
C110 150˚C 1910
C111 150˚C 2000
C112 150˚C 2050
Strain (%)
MX-80
18 TR-10-41
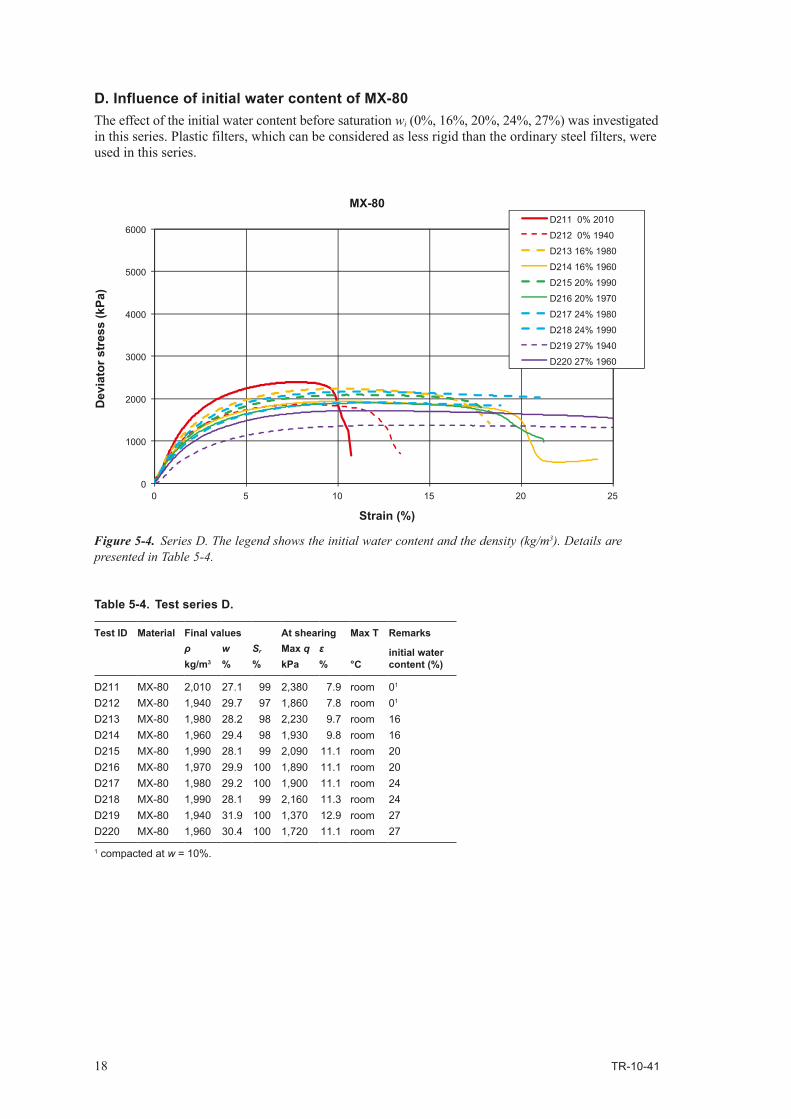
D. Influence of initial water content of MX-80The effect of the initial water content before saturation wi (0%, 16%, 20%, 24%, 27%) was investigated in this series. Plastic filters, which can be considered as less rigid than the ordinary steel filters, were used in this series.
Figure 5-4. Series D. The legend shows the initial water content and the density (kg/m3). Details are presented in Table 5-4.
Table 5-4. Test series D.
Test ID Material Final values At shearing Max T
°C
Remarks
initial water content (%)
ρkg/m3
w%
Sr
%Max qkPa
ε%
D211 MX-80 2,010 27.1 99 2,380 7.9 room 01
D212 MX-80 1,940 29.7 97 1,860 7.8 room 01
D213 MX-80 1,980 28.2 98 2,230 9.7 room 16D214 MX-80 1,960 29.4 98 1,930 9.8 room 16D215 MX-80 1,990 28.1 99 2,090 11.1 room 20D216 MX-80 1,970 29.9 100 1,890 11.1 room 20D217 MX-80 1,980 29.2 100 1,900 11.1 room 24D218 MX-80 1,990 28.1 99 2,160 11.3 room 24D219 MX-80 1,940 31.9 100 1,370 12.9 room 27D220 MX-80 1,960 30.4 100 1,720 11.1 room 27
1 compacted at w = 10%.
0
1000
2000
3000
4000
5000
6000
0 5 10 15 20 25
Dev
iato
r str
ess
(kPa
)
Strain (%)
MX-80D211 0% 2010
D212 0% 1940
D213 16% 1980
D214 16% 1960
D215 20% 1990
D216 20% 1970
D217 24% 1980
D218 24% 1990
D219 27% 1940
D220 27% 1960
TR-10-41 19
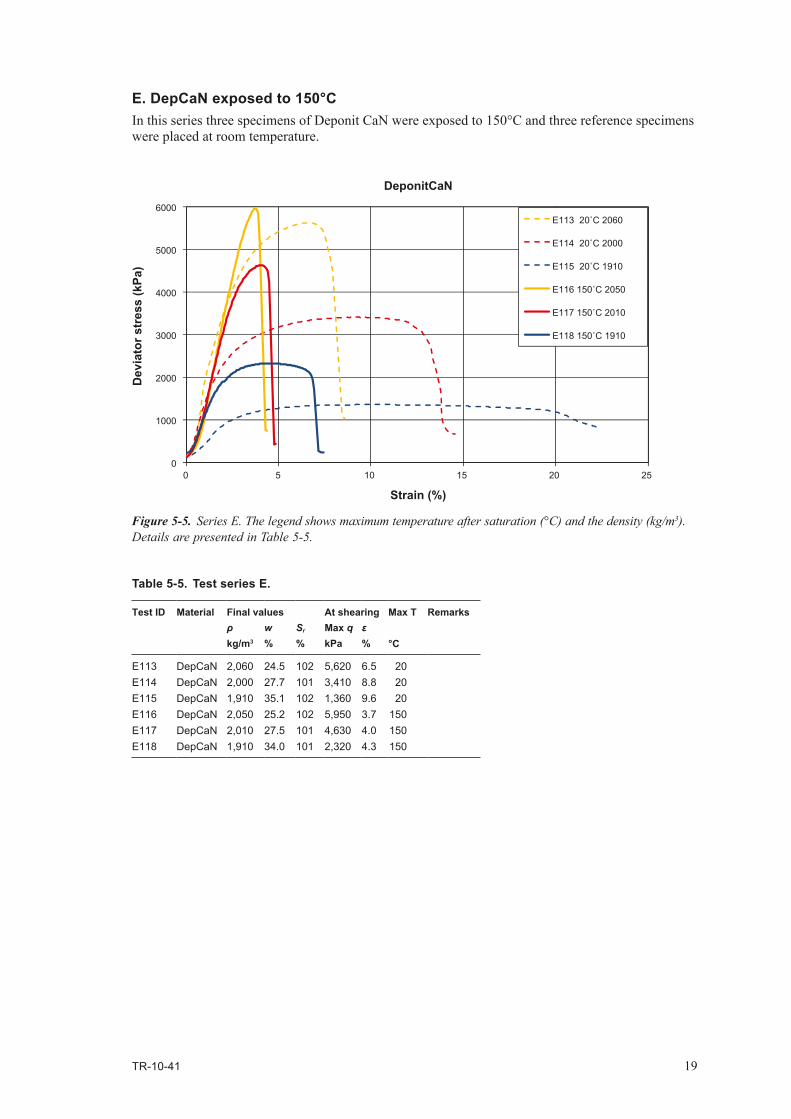
E. DepCaN exposed to 150°CIn this series three specimens of Deponit CaN were exposed to 150°C and three reference specimens were placed at room temperature.
Table 5-5. Test series E.
Test ID Material Final values At shearing Max T
°C
Remarksρkg/m3
w%
Sr
%Max qkPa
ε%
E113 DepCaN 2,060 24.5 102 5,620 6.5 20E114 DepCaN 2,000 27.7 101 3,410 8.8 20E115 DepCaN 1,910 35.1 102 1,360 9.6 20E116 DepCaN 2,050 25.2 102 5,950 3.7 150E117 DepCaN 2,010 27.5 101 4,630 4.0 150E118 DepCaN 1,910 34.0 101 2,320 4.3 150
Figure 5-5. Series E. The legend shows maximum temperature after saturation (°C) and the density (kg/m3). Details are presented in Table 5-5.
0
1000
2000
3000
4000
5000
6000
0 5 10 15 20 25
Dev
iato
r str
ess
(kPa
)
E113 20˚C 2060
E114 20˚C 2000
E115 20˚C 1910
E116 150˚C 2050
E117 150˚C 2010
E118 150˚C 1910
Strain (%)
DeponitCaN
20 TR-10-41
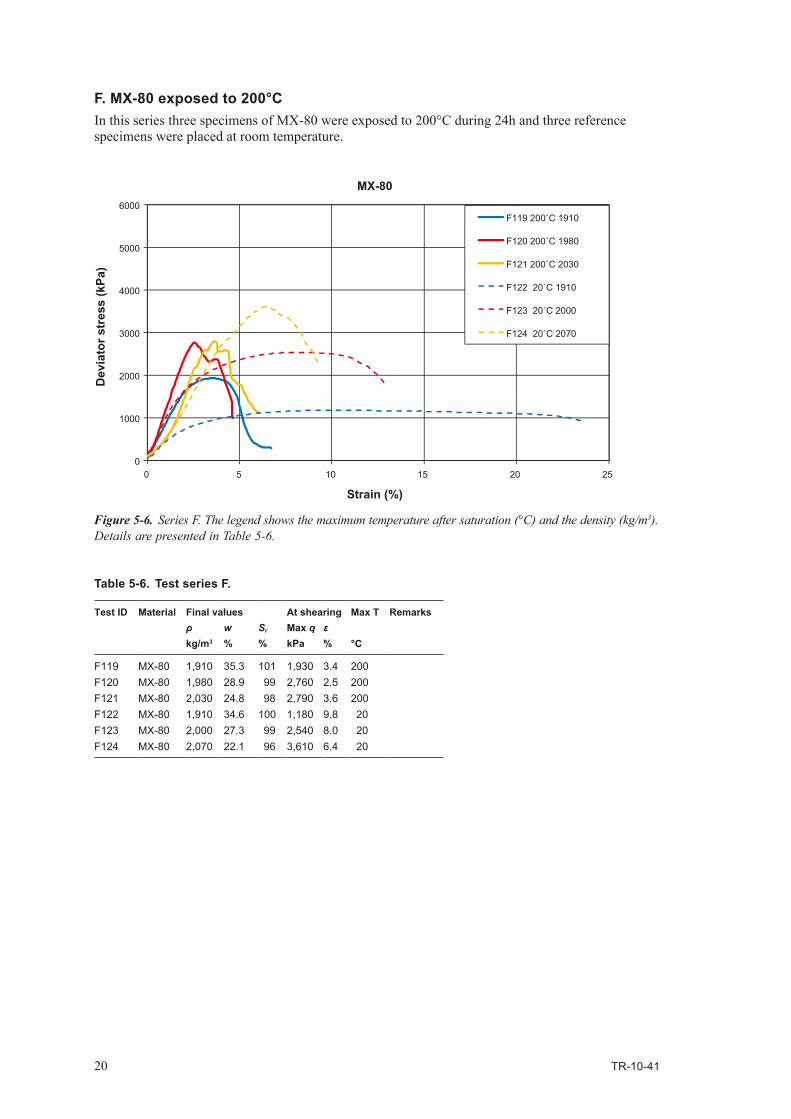
F. MX-80 exposed to 200°CIn this series three specimens of MX-80 were exposed to 200°C during 24h and three reference specimens were placed at room temperature.
Figure 5-6. Series F. The legend shows the maximum temperature after saturation (°C) and the density (kg/m3). Details are presented in Table 5-6.
Table 5-6. Test series F.
Test ID Material Final values At shearing Max T
°C
Remarksρkg/m3
w%
Sr
%Max qkPa
ε%
F119 MX-80 1,910 35.3 101 1,930 3.4 200F120 MX-80 1,980 28.9 99 2,760 2.5 200F121 MX-80 2,030 24.8 98 2,790 3.6 200F122 MX-80 1,910 34.6 100 1,180 9.8 20F123 MX-80 2,000 27.3 99 2,540 8.0 20F124 MX-80 2,070 22.1 96 3,610 6.4 20
0
1000
2000
3000
4000
5000
6000
0 5 10 15 20 25
Dev
iato
r str
ess
(kPa
)
F119 200˚C 1910
F120 200˚C 1980
F121 200˚C 2030
F122 20˚C 1910
F123 20˚C 2000
F124 20˚C 2070
Strain (%)
MX-80
TR-10-41 21
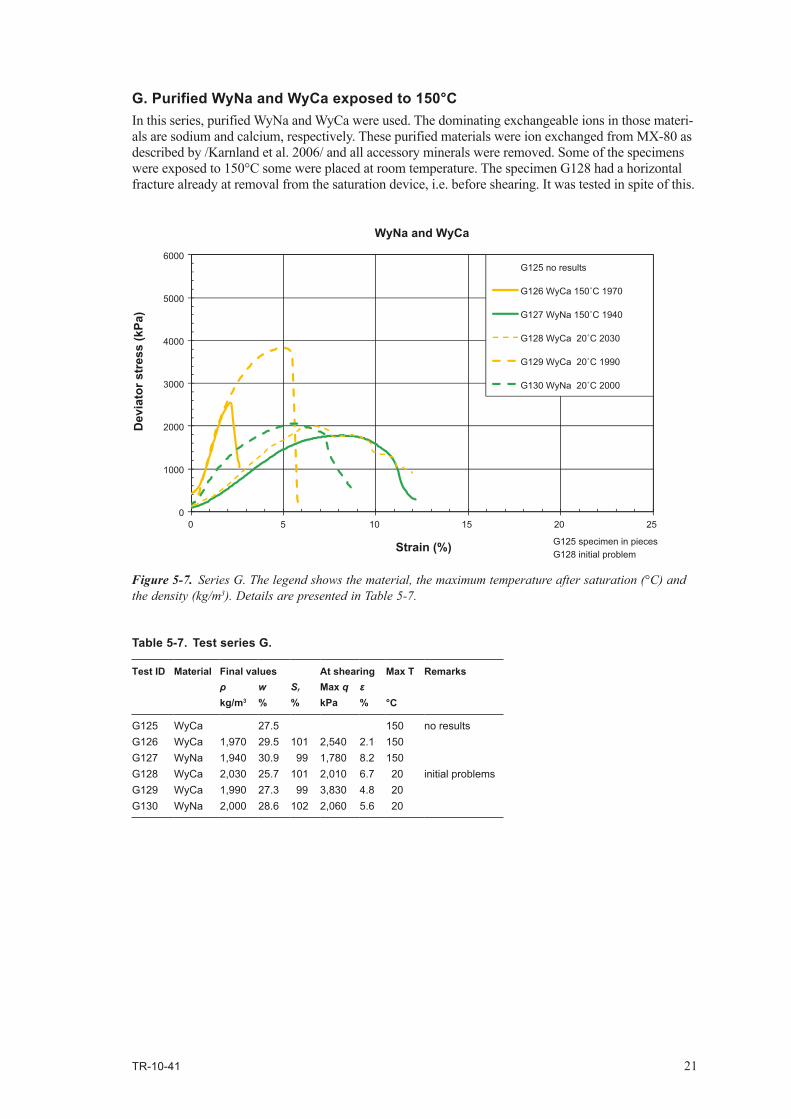
G. Purified WyNa and WyCa exposed to 150°CIn this series, purified WyNa and WyCa were used. The dominating exchangeable ions in those materi-als are sodium and calcium, respectively. These purified materials were ion exchanged from MX-80 as described by /Karnland et al. 2006/ and all accessory minerals were removed. Some of the specimens were exposed to 150°C some were placed at room temperature. The specimen G128 had a horizontal fracture already at removal from the saturation device, i.e. before shearing. It was tested in spite of this.
Figure 5-7. Series G. The legend shows the material, the maximum temperature after saturation (°C) and the density (kg/m3). Details are presented in Table 5-7.
Table 5-7. Test series G.
Test ID Material Final values At shearing Max T
°C
Remarksρkg/m3
w%
Sr
%Max qkPa
ε%
G125 WyCa 27.5 150 no resultsG126 WyCa 1,970 29.5 101 2,540 2.1 150G127 WyNa 1,940 30.9 99 1,780 8.2 150G128 WyCa 2,030 25.7 101 2,010 6.7 20 initial problemsG129 WyCa 1,990 27.3 99 3,830 4.8 20G130 WyNa 2,000 28.6 102 2,060 5.6 20
0
1000
2000
3000
4000
5000
6000
0 5 10 15 20 25
Dev
iato
r str
ess
(kPa
)
G125 no results
G126 WyCa 150˚C 1970
G127 WyNa 150˚C 1940
G128 WyCa 20˚C 2030
G129 WyCa 20˚C 1990
G130 WyNa 20˚C 2000
Strain (%)
WyNa and WyCa
G125 specimen in piecesG128 initial problem
22 TR-10-41
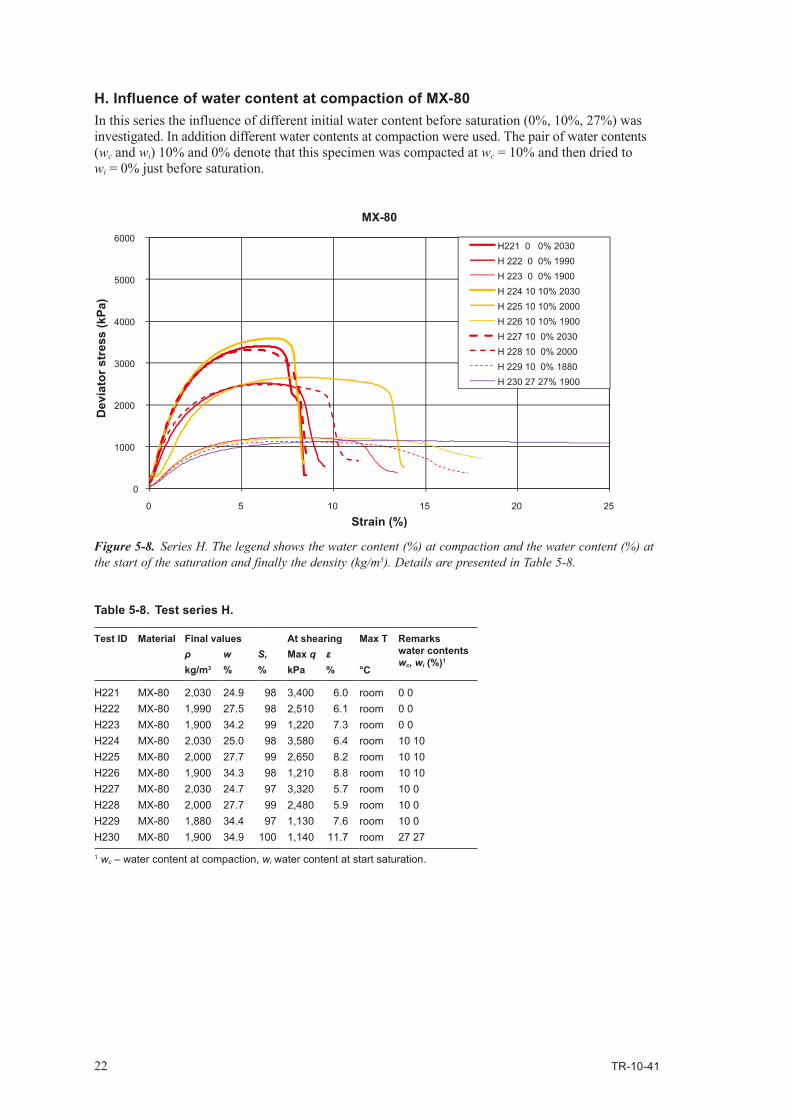
H. Influence of water content at compaction of MX-80In this series the influence of different initial water content before saturation (0%, 10%, 27%) was investigated. In addition different water contents at compaction were used. The pair of water contents (wc and wi) 10% and 0% denote that this specimen was compacted at wc = 10% and then dried to wi = 0% just before saturation.
Figure 5-8. Series H. The legend shows the water content (%) at compaction and the water content (%) at the start of the saturation and finally the density (kg/m3). Details are presented in Table 5-8.
Table 5-8. Test series H.
Test ID Material Final values At shearing Max T
°C
Remarks water contents wc, wi (%)1
ρkg/m3
w%
Sr
%Max qkPa
ε%
H221 MX-80 2,030 24.9 98 3,400 6.0 room 0 0H222 MX-80 1,990 27.5 98 2,510 6.1 room 0 0H223 MX-80 1,900 34.2 99 1,220 7.3 room 0 0H224 MX-80 2,030 25.0 98 3,580 6.4 room 10 10H225 MX-80 2,000 27.7 99 2,650 8.2 room 10 10H226 MX-80 1,900 34.3 98 1,210 8.8 room 10 10H227 MX-80 2,030 24.7 97 3,320 5.7 room 10 0H228 MX-80 2,000 27.7 99 2,480 5.9 room 10 0H229 MX-80 1,880 34.4 97 1,130 7.6 room 10 0H230 MX-80 1,900 34.9 100 1,140 11.7 room 27 27
1 wc – water content at compaction, wi water content at start saturation.
0
1000
2000
3000
4000
5000
6000
0 5 10 15 20 25
Dev
iato
r str
ess
(kPa
)
H221 0 0% 2030H 222 0 0% 1990H 223 0 0% 1900H 224 10 10% 2030H 225 10 10% 2000H 226 10 10% 1900H 227 10 0% 2030H 228 10 0% 2000H 229 10 0% 1880H 230 27 27% 1900
Strain (%)
MX-80
TR-10-41 23
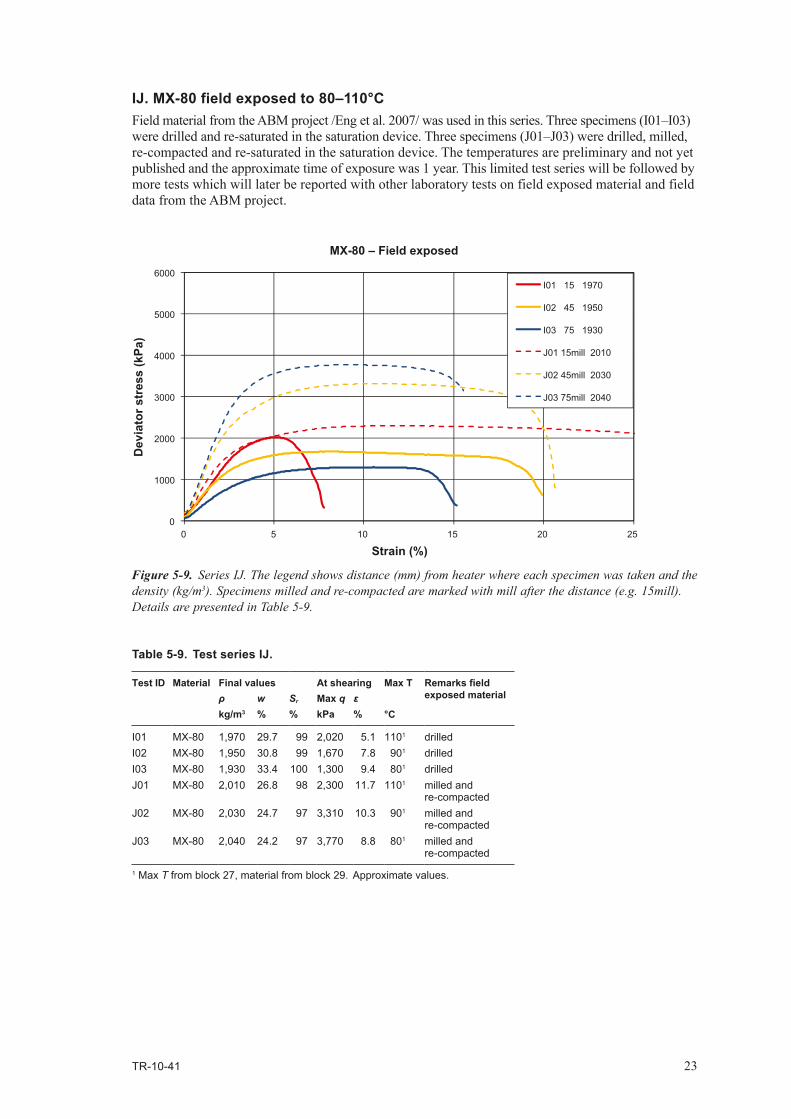
IJ. MX-80 field exposed to 80–110°CField material from the ABM project /Eng et al. 2007/ was used in this series. Three specimens (I01–I03) were drilled and re-saturated in the saturation device. Three specimens (J01–J03) were drilled, milled, re-compacted and re-saturated in the saturation device. The temperatures are preliminary and not yet published and the approximate time of exposure was 1 year. This limited test series will be followed by more tests which will later be reported with other laboratory tests on field exposed material and field data from the ABM project.
Figure 5-9. Series IJ. The legend shows distance (mm) from heater where each specimen was taken and the density (kg/m3). Specimens milled and re-compacted are marked with mill after the distance (e.g. 15mill). Details are presented in Table 5-9.
Table 5-9. Test series IJ.
Test ID Material Final values At shearing Max T
°C
Remarks field exposed materialρ
kg/m3
w%
Sr
%Max qkPa
ε%
I01 MX-80 1,970 29.7 99 2,020 5.1 1101 drilledI02 MX-80 1,950 30.8 99 1,670 7.8 901 drilledI03 MX-80 1,930 33.4 100 1,300 9.4 801 drilledJ01 MX-80 2,010 26.8 98 2,300 11.7 1101 milled and
re-compactedJ02 MX-80 2,030 24.7 97 3,310 10.3 901 milled and
re-compactedJ03 MX-80 2,040 24.2 97 3,770 8.8 801 milled and
re-compacted
1 Max T from block 27, material from block 29. Approximate values.
0
1000
2000
3000
4000
5000
6000
0 5 10 15 20 25
I01 15 1970
I02 45 1950
I03 75 1930
J01 15mill 2010
J02 45mill 2030
J03 75mill 2040
Strain (%)
MX-80 – Field exposed
Dev
iato
r str
ess
(kPa
)
24 TR-10-41
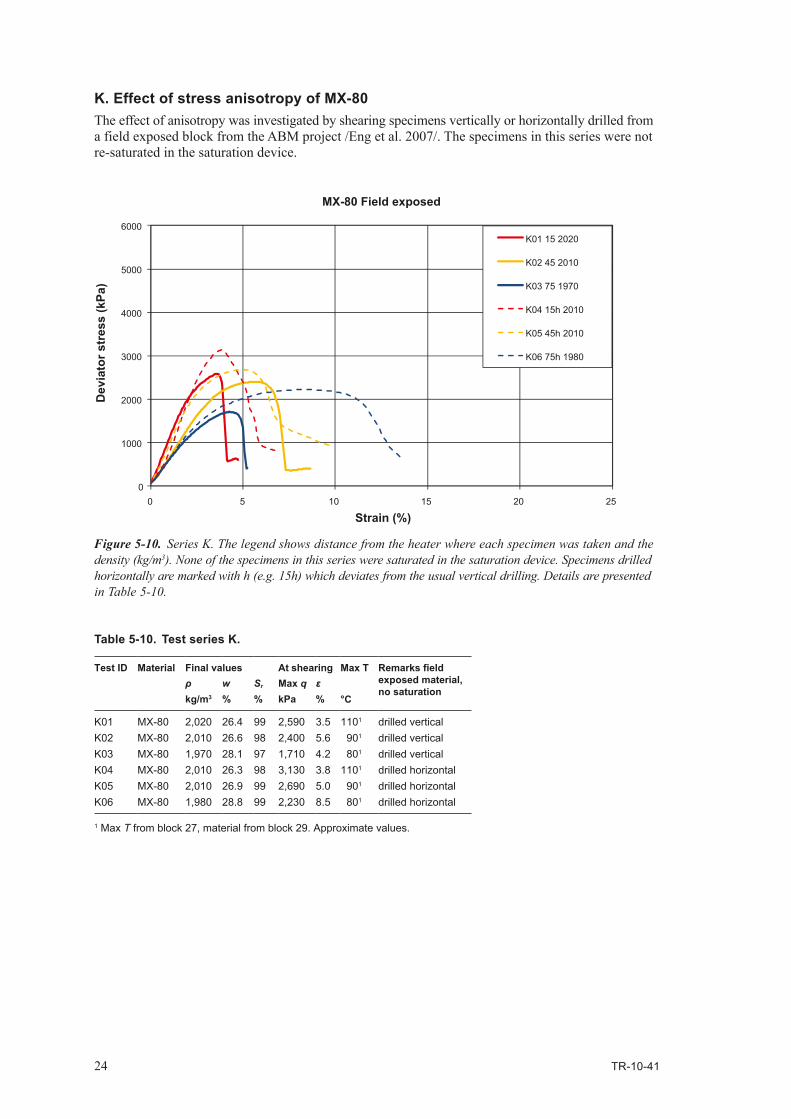
K. Effect of stress anisotropy of MX-80The effect of anisotropy was investigated by shearing specimens vertically or horizontally drilled from a field exposed block from the ABM project /Eng et al. 2007/. The specimens in this series were not re-saturated in the saturation device.
Figure 5-10. Series K. The legend shows distance from the heater where each specimen was taken and the density (kg/m3). None of the specimens in this series were saturated in the saturation device. Specimens drilled horizontally are marked with h (e.g. 15h) which deviates from the usual vertical drilling. Details are presented in Table 5-10.
Table 5-10. Test series K.
Test ID Material Final values At shearing Max T
°C
Remarks field exposed material, no saturation
ρkg/m3
w%
Sr
%Max qkPa
ε%
K01 MX-80 2,020 26.4 99 2,590 3.5 1101 drilled verticalK02 MX-80 2,010 26.6 98 2,400 5.6 901 drilled verticalK03 MX-80 1,970 28.1 97 1,710 4.2 801 drilled verticalK04 MX-80 2,010 26.3 98 3,130 3.8 1101 drilled horizontalK05 MX-80 2,010 26.9 99 2,690 5.0 901 drilled horizontalK06 MX-80 1,980 28.8 99 2,230 8.5 801 drilled horizontal
1 Max T from block 27, material from block 29. Approximate values.
0
1000
2000
3000
4000
5000
6000
0 5 10 15 20 25
Dev
iato
r str
ess
(kPa
)
K01 15 2020
K02 45 2010
K03 75 1970
K04 15h 2010
K05 45h 2010
K06 75h 1980
Strain (%)
MX-80 Field exposed
TR-10-41 25
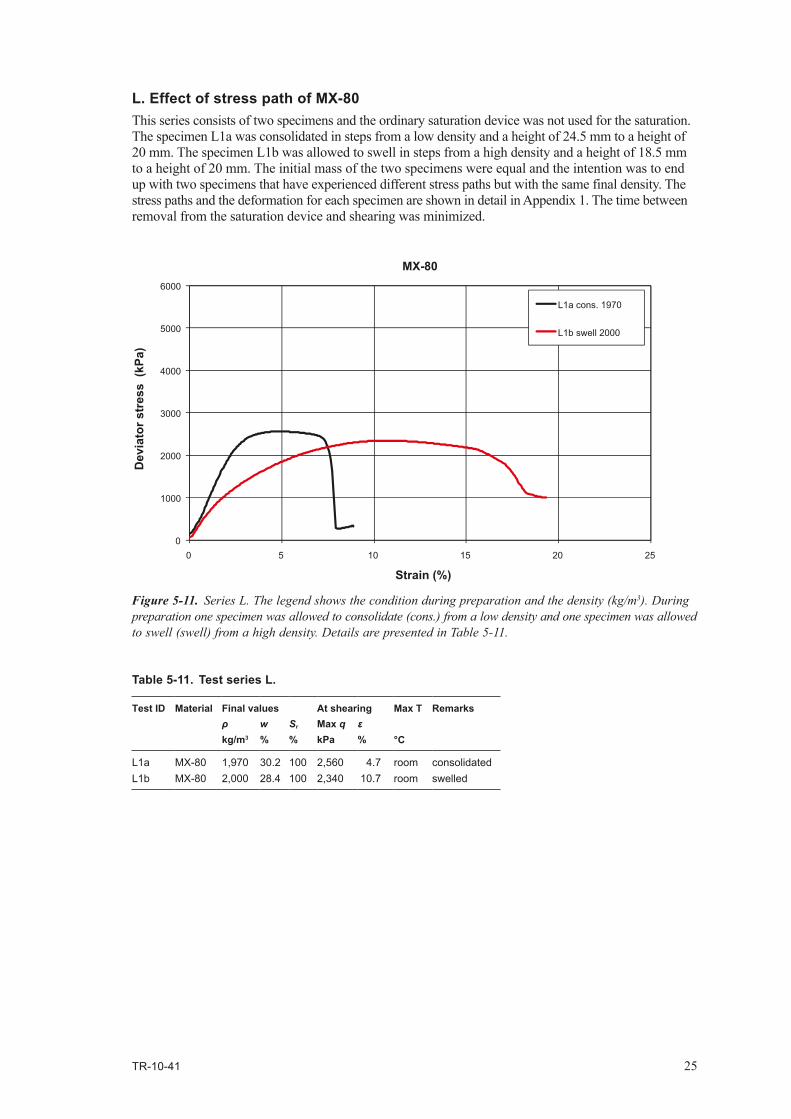
L. Effect of stress path of MX-80This series consists of two specimens and the ordinary saturation device was not used for the saturation. The specimen L1a was consolidated in steps from a low density and a height of 24.5 mm to a height of 20 mm. The specimen L1b was allowed to swell in steps from a high density and a height of 18.5 mm to a height of 20 mm. The initial mass of the two specimens were equal and the intention was to end up with two specimens that have experienced different stress paths but with the same final density. The stress paths and the deformation for each specimen are shown in detail in Appendix 1. The time between removal from the saturation device and shearing was minimized.
Figure 5-11. Series L. The legend shows the condition during preparation and the density (kg/m3). During preparation one specimen was allowed to consolidate (cons.) from a low density and one specimen was allowed to swell (swell) from a high density. Details are presented in Table 5-11.
Table 5-11. Test series L.
Test ID Material Final values At shearing Max T
°C
Remarksρkg/m3
w%
Sr
%Max qkPa
ε%
L1a MX-80 1,970 30.2 100 2,560 4.7 room consolidatedL1b MX-80 2,000 28.4 100 2,340 10.7 room swelled
0
1000
2000
3000
4000
5000
6000
0 5 10 15 20 25
L1a cons. 1970
L1b swell 2000
Strain (%)
MX-80
Dev
iato
r str
ess
(kPa
)
26 TR-10-41
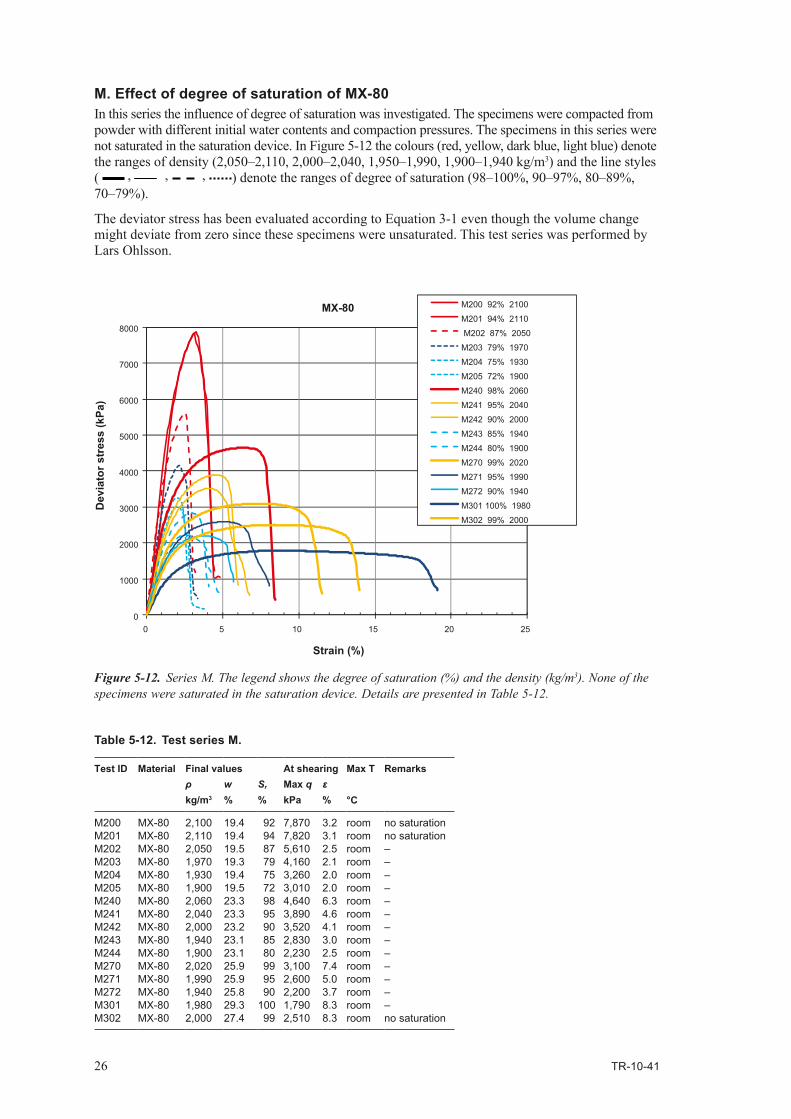
M. Effect of degree of saturation of MX-80In this series the influence of degree of saturation was investigated. The specimens were compacted from powder with different initial water contents and compaction pressures. The specimens in this series were not saturated in the saturation device. In Figure 5-12 the colours (red, yellow, dark blue, light blue) denote the ranges of density (2,050–2,110, 2,000–2,040, 1,950–1,990, 1,900–1,940 kg/m3) and the line styles ( , , , ) denote the ranges of degree of saturation (98–100%, 90–97%, 80–89%, 70–79%).
The deviator stress has been evaluated according to Equation 3-1 even though the volume change might deviate from zero since these specimens were unsaturated. This test series was performed by Lars Ohlsson.
Figure 5-12. Series M. The legend shows the degree of saturation (%) and the density (kg/m3). None of the specimens were saturated in the saturation device. Details are presented in Table 5-12.
Table 5-12. Test series M.
Test ID Material Final values At shearing Max T
°C
Remarksρkg/m3
w%
Sr
%Max qkPa
ε%
M200 MX-80 2,100 19.4 92 7,870 3.2 room no saturationM201 MX-80 2,110 19.4 94 7,820 3.1 room no saturationM202 MX-80 2,050 19.5 87 5,610 2.5 room –M203 MX-80 1,970 19.3 79 4,160 2.1 room –M204 MX-80 1,930 19.4 75 3,260 2.0 room –M205 MX-80 1,900 19.5 72 3,010 2.0 room –M240 MX-80 2,060 23.3 98 4,640 6.3 room –M241 MX-80 2,040 23.3 95 3,890 4.6 room –M242 MX-80 2,000 23.2 90 3,520 4.1 room –M243 MX-80 1,940 23.1 85 2,830 3.0 room –M244 MX-80 1,900 23.1 80 2,230 2.5 room –M270 MX-80 2,020 25.9 99 3,100 7.4 room –M271 MX-80 1,990 25.9 95 2,600 5.0 room –M272 MX-80 1,940 25.8 90 2,200 3.7 room –M301 MX-80 1,980 29.3 100 1,790 8.3 room –M302 MX-80 2,000 27.4 99 2,510 8.3 room no saturation
0
1000
2000
3000
4000
5000
6000
7000
8000
0 5 10 15 20 25
M200 92% 2100
M201 94% 2110
M202 87% 2050
M203 79% 1970
M204 75% 1930
M205 72% 1900
M240 98% 2060
M241 95% 2040
M242 90% 2000
M243 85% 1940
M244 80% 1900
M270 99% 2020
M271 95% 1990
M272 90% 1940
M301 100% 1980
M302 99% 2000
Dev
iato
r str
ess
(kPa
)
Strain (%)
MX-80
TR-10-41 27
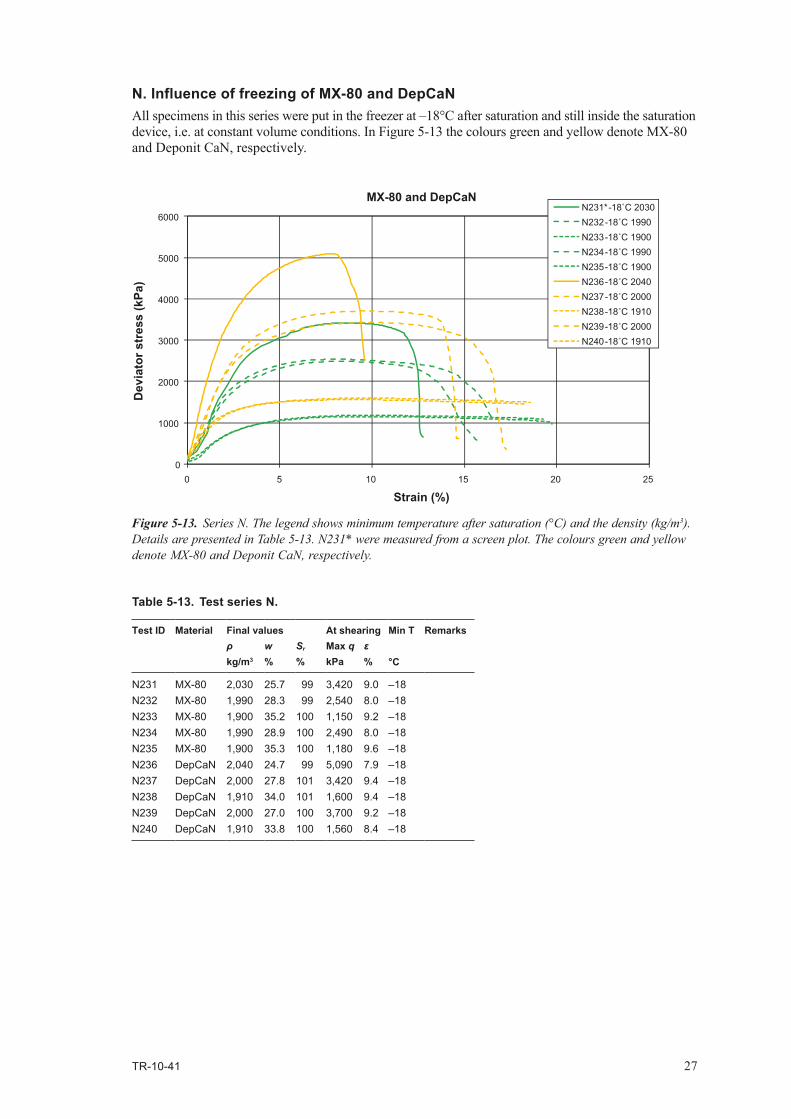
N. Influence of freezing of MX-80 and DepCaNAll specimens in this series were put in the freezer at –18°C after saturation and still inside the saturation device, i.e. at constant volume conditions. In Figure 5-13 the colours green and yellow denote MX-80 and Deponit CaN, respectively.
Figure 5-13. Series N. The legend shows minimum temperature after saturation (°C) and the density (kg/m3). Details are presented in Table 5-13. N231* were measured from a screen plot. The colours green and yellow denote MX-80 and Deponit CaN, respectively.
Table 5-13. Test series N.
Test ID Material Final values At shearing Min T
°C
Remarksρkg/m3
w%
Sr
%Max qkPa
ε%
N231 MX-80 2,030 25.7 99 3,420 9.0 –18N232 MX-80 1,990 28.3 99 2,540 8.0 –18N233 MX-80 1,900 35.2 100 1,150 9.2 –18N234 MX-80 1,990 28.9 100 2,490 8.0 –18N235 MX-80 1,900 35.3 100 1,180 9.6 –18N236 DepCaN 2,040 24.7 99 5,090 7.9 –18N237 DepCaN 2,000 27.8 101 3,420 9.4 –18N238 DepCaN 1,910 34.0 101 1,600 9.4 –18N239 DepCaN 2,000 27.0 100 3,700 9.2 –18N240 DepCaN 1,910 33.8 100 1,560 8.4 –18
0
1000
2000
3000
4000
5000
6000
0 5 10 15 20 25
Dev
iato
r str
ess
(kPa
)
N231* -18˚C 2030N232 -18˚C 1990N233 -18˚C 1900N234 -18˚C 1990N235 -18˚C 1900N236 -18˚C 2040N237 -18˚C 2000N238 -18˚C 1910N239 -18˚C 2000N240 -18˚C 1910
Strain (%)
MX-80 and DepCaN
28 TR-10-41
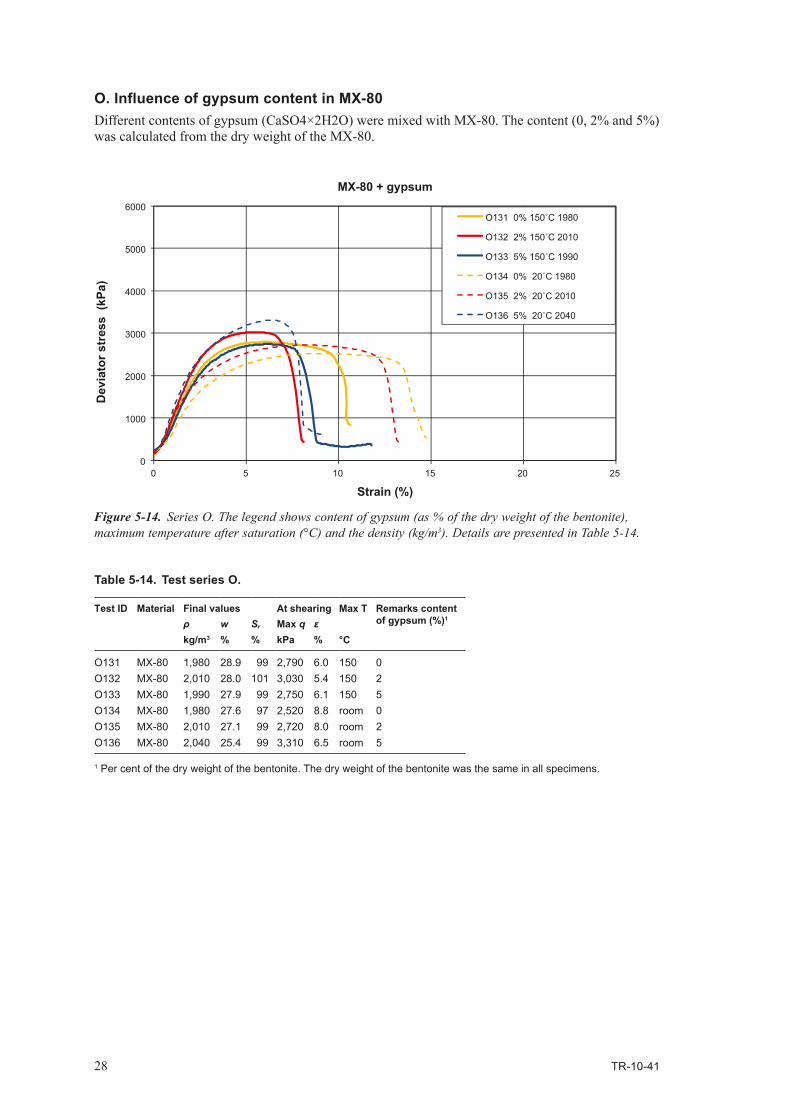
O. Influence of gypsum content in MX-80Different contents of gypsum (CaSO4×2H2O) were mixed with MX-80. The content (0, 2% and 5%) was calculated from the dry weight of the MX-80.
Figure 5-14. Series O. The legend shows content of gypsum (as % of the dry weight of the bentonite), maximum temperature after saturation (°C) and the density (kg/m3). Details are presented in Table 5-14.
Table 5-14. Test series O.
Test ID Material Final values At shearing Max T
°C
Remarks content of gypsum (%)1
ρkg/m3
w%
Sr
%Max qkPa
ε%
O131 MX-80 1,980 28.9 99 2,790 6.0 150 0O132 MX-80 2,010 28.0 101 3,030 5.4 150 2O133 MX-80 1,990 27.9 99 2,750 6.1 150 5O134 MX-80 1,980 27.6 97 2,520 8.8 room 0O135 MX-80 2,010 27.1 99 2,720 8.0 room 2O136 MX-80 2,040 25.4 99 3,310 6.5 room 5
1 Per cent of the dry weight of the bentonite. The dry weight of the bentonite was the same in all specimens.
0
1000
2000
3000
4000
5000
6000
0 5 10 15 20 25
O131 0% 150˚C 1980
O132 2% 150˚C 2010
O133 5% 150˚C 1990
O134 0% 20˚C 1980
O135 2% 20˚C 2010
O136 5% 20˚C 2040
Strain (%)
MX-80 + gypsum
Dev
iato
r str
ess
(kPa
)
TR-10-41 29
6 Analysis
6.1 GeneralThe results from the test series are compared to each other and to results from other projects. The following issues are focused on:
1. Impact of preparation – stress path (series A and L).
2. Impact of preparation – initial water content (series D and H).
3. Impact of test technique (series B).
4. Impact of temperature (series C, E, F, N, /Karnland et al. 2009/).
5. Impact of dominating exchangeable ions (series E, F, G, and /Dueck et al. 2010/).
6. Impact of gypsum content (series O).
7. Impact of degree of saturation (series M).
8. Impact of stress anisotropy (series K).
9. Impact of field condition (series I).
10. Impact of milling and re-compaction (series J, /Karnland et al. 2009/).
11. Impact of shear rate (/Dueck et al. 2010/).
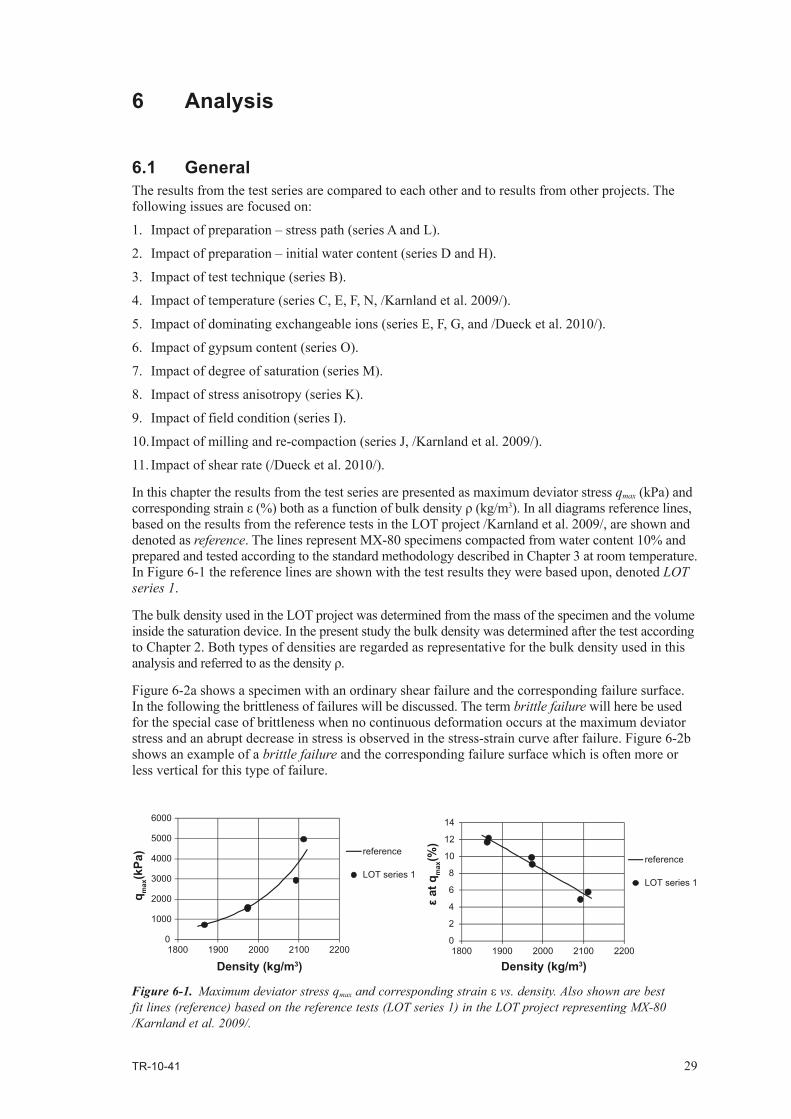
In this chapter the results from the test series are presented as maximum deviator stress qmax (kPa) and corresponding strain ε (%) both as a function of bulk density ρ (kg/m3). In all diagrams reference lines, based on the results from the reference tests in the LOT project /Karnland et al. 2009/, are shown and denoted as reference. The lines represent MX-80 specimens compacted from water content 10% and prepared and tested according to the standard methodology described in Chapter 3 at room temperature. In Figure 6-1 the reference lines are shown with the test results they were based upon, denoted LOT series 1.
The bulk density used in the LOT project was determined from the mass of the specimen and the volume inside the saturation device. In the present study the bulk density was determined after the test according to Chapter 2. Both types of densities are regarded as representative for the bulk density used in this analysis and referred to as the density ρ.
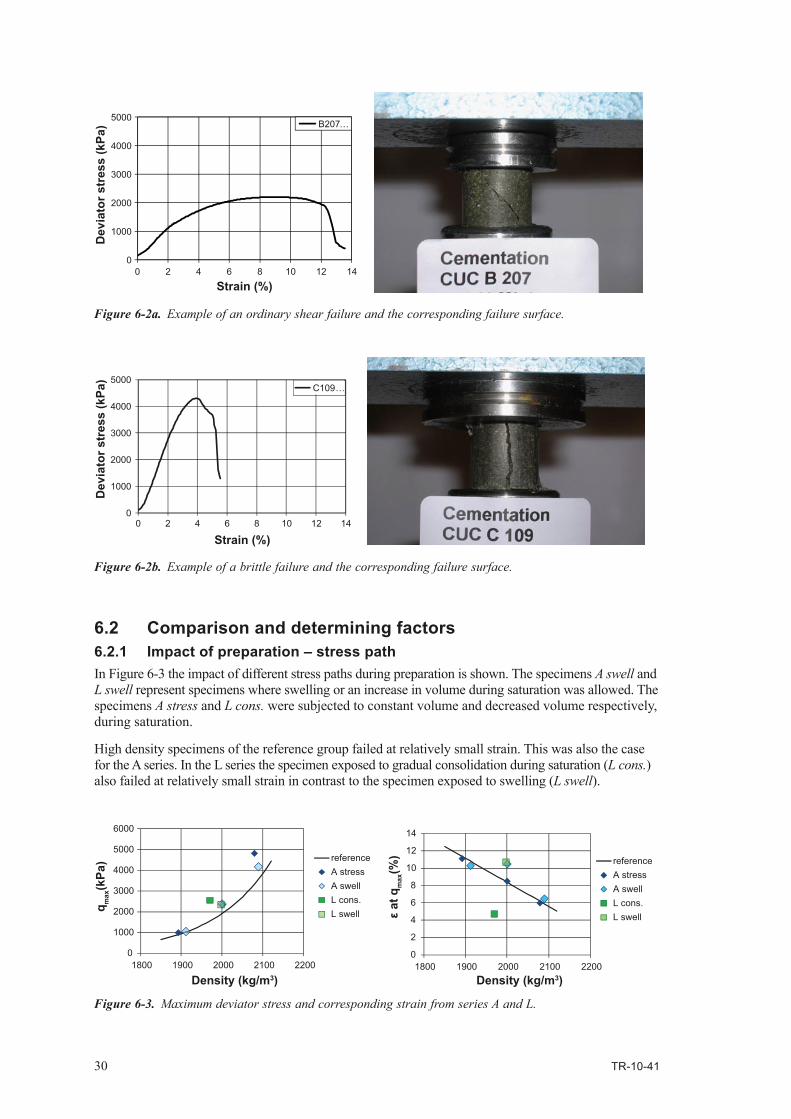
Figure 6-2a shows a specimen with an ordinary shear failure and the corresponding failure surface. In the following the brittleness of failures will be discussed. The term brittle failure will here be used for the special case of brittleness when no continuous deformation occurs at the maximum deviator stress and an abrupt decrease in stress is observed in the stress-strain curve after failure. Figure 6-2b shows an example of a brittle failure and the corresponding failure surface which is often more or less vertical for this type of failure.
Figure 6-1. Maximum deviator stress qmax and corresponding strain ε vs. density. Also shown are best fit lines (reference) based on the reference tests (LOT series 1) in the LOT project representing MX-80 /Karnland et al. 2009/.
0
1000
2000
3000
4000
5000
6000
1800 1900 2000 2100 2200
q max
(kPa
)
Density (kg/m3)
reference
LOT series 1
0
2
4
6
8
10
12
14
1800 1900 2000 2100 2200
ε at
qm
ax(%
)
Density (kg/m3)
reference
LOT series 1
30 TR-10-41
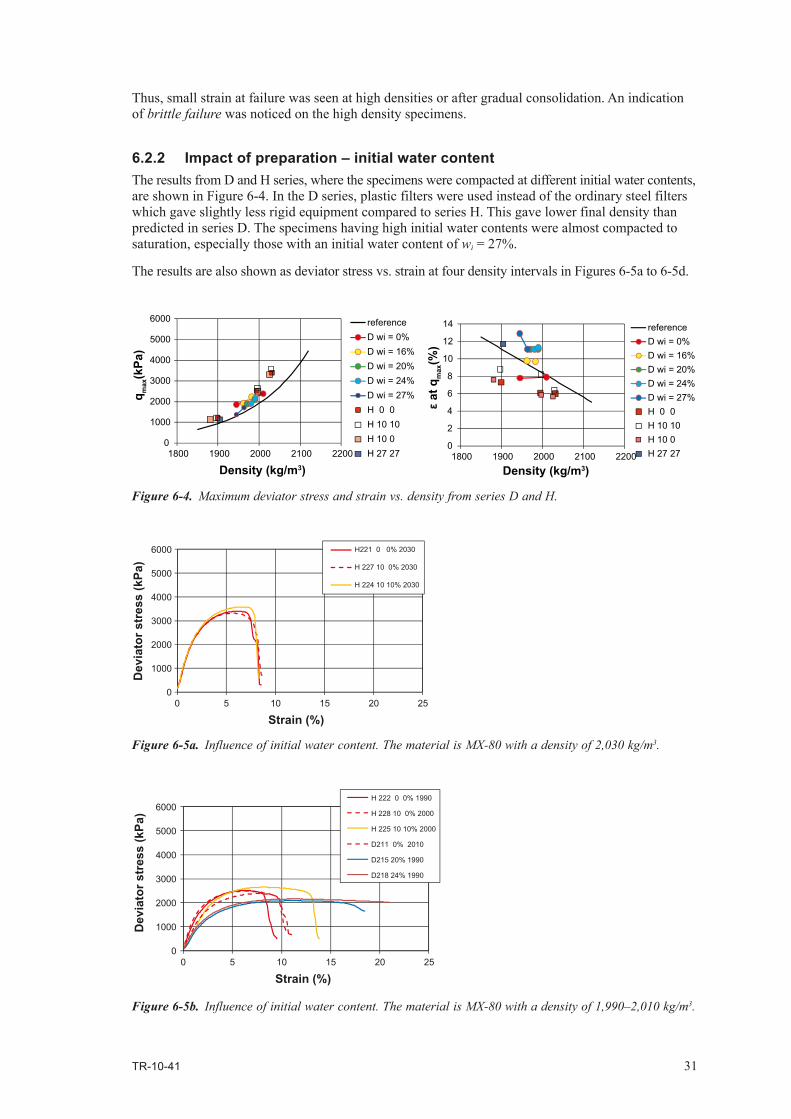
6.2 Comparison and determining factors6.2.1 Impact of preparation – stress pathIn Figure 6-3 the impact of different stress paths during preparation is shown. The specimens A swell and L swell represent specimens where swelling or an increase in volume during saturation was allowed. The specimens A stress and L cons. were subjected to constant volume and decreased volume respectively, during saturation.
High density specimens of the reference group failed at relatively small strain. This was also the case for the A series. In the L series the specimen exposed to gradual consolidation during saturation (L cons.) also failed at relatively small strain in contrast to the specimen exposed to swelling (L swell).
Figure 6-2a. Example of an ordinary shear failure and the corresponding failure surface.
Figure 6-2b. Example of a brittle failure and the corresponding failure surface.
Figure 6-3. Maximum deviator stress and corresponding strain from series A and L.
0
1000
2000
3000
4000
5000
0 2 4 6 8 10 12 14
Dev
iato
r str
ess
(kPa
)
Strain (%)
B207 …
0
1000
2000
3000
4000
5000
0 2 4 6 8 10 12 14
Dev
iato
r str
ess
(kPa
)
Strain (%)
C109 …
0
1000
2000
3000
4000
5000
6000
1800 1900 2000 2100 2200
q max
(kPa
)
Density (kg/m3)
referenceA stressA swell L cons.L swell
0
2
4
6
8
10
12
14
1800 1900 2000 2100 2200
ε at
qm
ax(%
)
Density (kg/m3)
referenceA stressA swell L cons.L swell
TR-10-41 31
Thus, small strain at failure was seen at high densities or after gradual consolidation. An indication of brittle failure was noticed on the high density specimens.
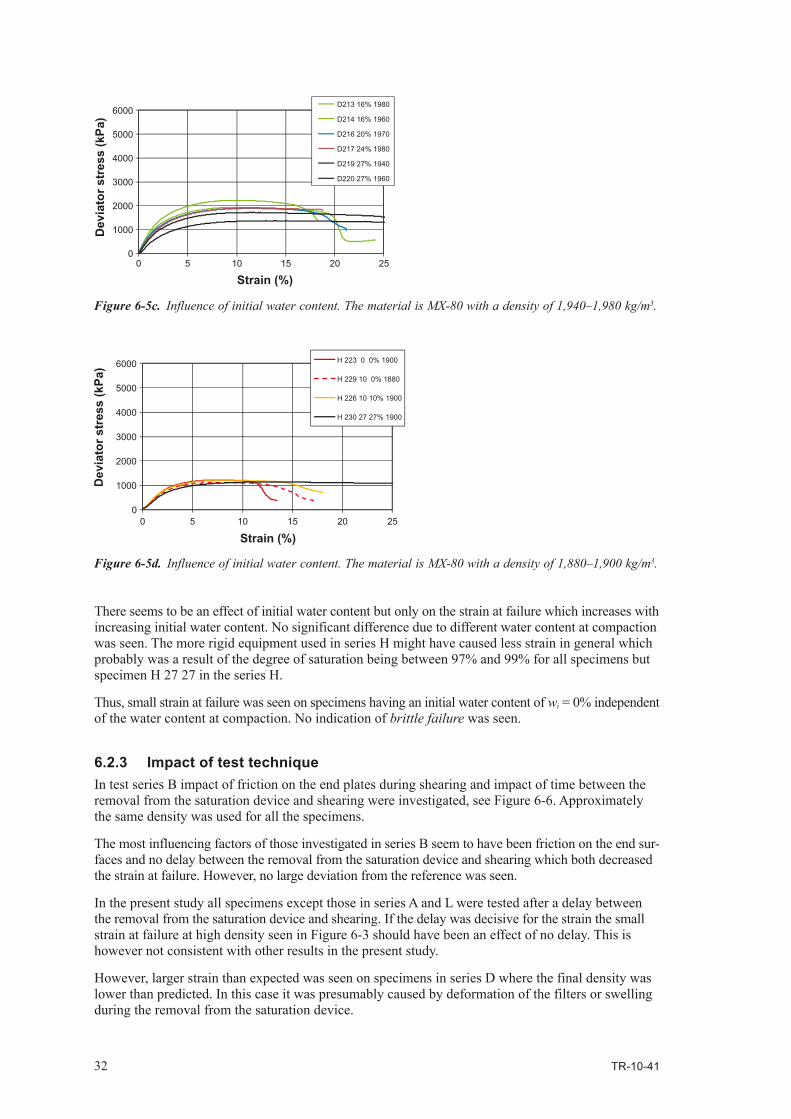
6.2.2 Impact of preparation – initial water contentThe results from D and H series, where the specimens were compacted at different initial water contents, are shown in Figure 6-4. In the D series, plastic filters were used instead of the ordinary steel filters which gave slightly less rigid equipment compared to series H. This gave lower final density than predicted in series D. The specimens having high initial water contents were almost compacted to saturation, especially those with an initial water content of wi = 27%.
The results are also shown as deviator stress vs. strain at four density intervals in Figures 6-5a to 6-5d.
Figure 6-4. Maximum deviator stress and strain vs. density from series D and H.
Figure 6-5a. Influence of initial water content. The material is MX-80 with a density of 2,030 kg/m3.
Figure 6-5b. Influence of initial water content. The material is MX-80 with a density of 1,990–2,010 kg/m3.
0
1000
2000
3000
4000
5000
6000
1800 1900 2000 2100 2200
q max
(kPa
)
Density (kg/m3)
referenceD wi = 0%D wi = 16%D wi = 20%D wi = 24%D wi = 27%H 0 0H 10 10H 10 0H 27 27
0
2
4
6
8
10
12
14
1800 1900 2000 2100 2200
ε at
qm
ax(%
)
Density (kg/m3)
referenceD wi = 0%D wi = 16%D wi = 20%D wi = 24%D wi = 27%H 0 0H 10 10H 10 0H 27 27
0
1000
2000
3000
4000
5000
6000
0 5 10 15 20 25
H221 0 0% 2030
H 227 10 0% 2030
H 224 10 10% 2030
Strain (%)
Dev
iato
r str
ess
(kPa
)
0
1000
2000
3000
4000
5000
6000
0 5 10 15 20 25
H 222 0 0% 1990
H 228 10 0% 2000
H 225 10 10% 2000
D211 0% 2010
D215 20% 1990
D218 24% 1990
Dev
iato
r str
ess
(kPa
)
Strain (%)
32 TR-10-41
There seems to be an effect of initial water content but only on the strain at failure which increases with increasing initial water content. No significant difference due to different water content at compaction was seen. The more rigid equipment used in series H might have caused less strain in general which probably was a result of the degree of saturation being between 97% and 99% for all specimens but specimen H 27 27 in the series H.
Thus, small strain at failure was seen on specimens having an initial water content of wi = 0% independent of the water content at compaction. No indication of brittle failure was seen.
6.2.3 Impact of test techniqueIn test series B impact of friction on the end plates during shearing and impact of time between the removal from the saturation device and shearing were investigated, see Figure 6-6. Approximately the same density was used for all the specimens.
The most influencing factors of those investigated in series B seem to have been friction on the end sur-faces and no delay between the removal from the saturation device and shearing which both decreased the strain at failure. However, no large deviation from the reference was seen.
In the present study all specimens except those in series A and L were tested after a delay between the removal from the saturation device and shearing. If the delay was decisive for the strain the small strain at failure at high density seen in Figure 6-3 should have been an effect of no delay. This is however not consistent with other results in the present study.
However, larger strain than expected was seen on specimens in series D where the final density was lower than predicted. In this case it was presumably caused by deformation of the filters or swelling during the removal from the saturation device.
Figure 6-5c. Influence of initial water content. The material is MX-80 with a density of 1,940–1,980 kg/m3.
Figure 6-5d. Influence of initial water content. The material is MX-80 with a density of 1,880–1,900 kg/m3.
0
1000
2000
3000
4000
5000
6000
0 5 10 15 20 25
D213 16% 1980
D214 16% 1960
D216 20% 1970
D217 24% 1980
D219 27% 1940
D220 27% 1960
Dev
iato
r str
ess
(kPa
)
Strain (%)
0
1000
2000
3000
4000
5000
6000
0 5 10 15 20 25
H 223 0 0% 1900
H 229 10 0% 1880
H 226 10 10% 1900
H 230 27 27% 1900
Dev
iato
r str
ess
(kPa
)
Strain (%)
TR-10-41 33
Thus, the strain at failure was reduced by friction between the specimens and the load frame. In addition, there was an indication that large strain at failure might result from swelling during saturation. No indication of brittle failure was seen.
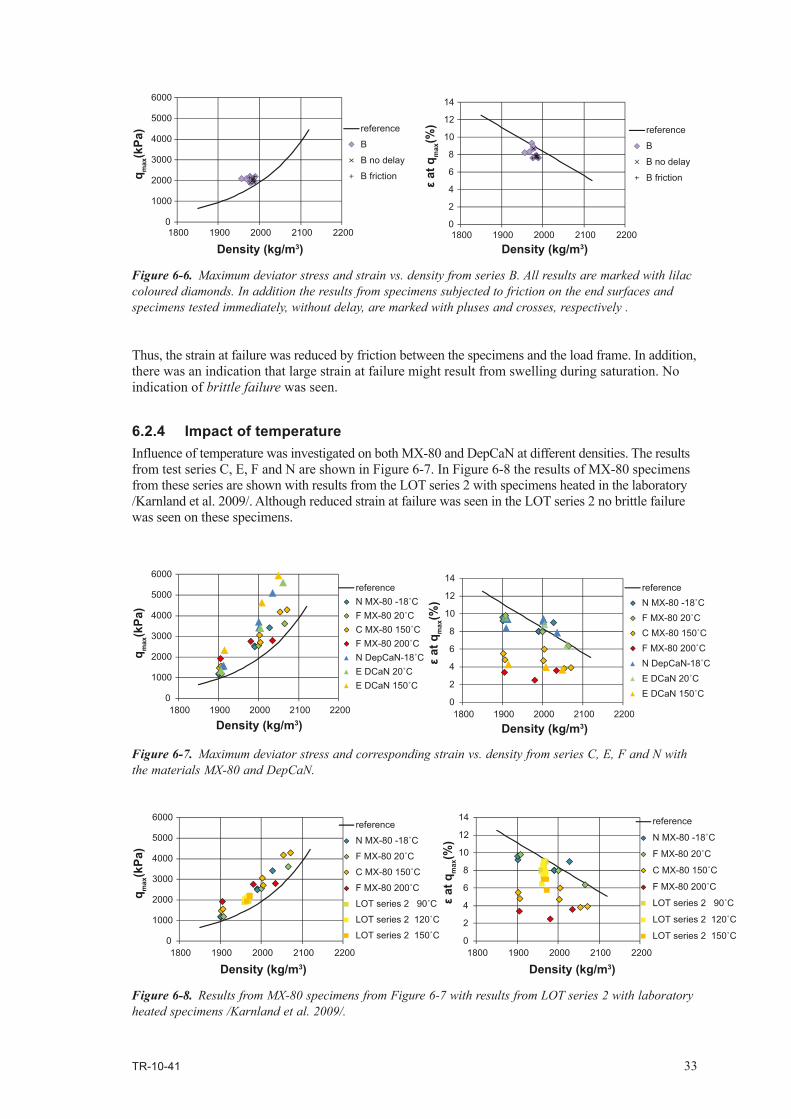
6.2.4 Impact of temperatureInfluence of temperature was investigated on both MX-80 and DepCaN at different densities. The results from test series C, E, F and N are shown in Figure 6-7. In Figure 6-8 the results of MX-80 specimens from these series are shown with results from the LOT series 2 with specimens heated in the laboratory /Karnland et al. 2009/. Although reduced strain at failure was seen in the LOT series 2 no brittle failure was seen on these specimens.
Figure 6-6. Maximum deviator stress and strain vs. density from series B. All results are marked with lilac coloured diamonds. In addition the results from specimens subjected to friction on the end surfaces and specimens tested immediately, without delay, are marked with pluses and crosses, respectively .
Figure 6-7. Maximum deviator stress and corresponding strain vs. density from series C, E, F and N with the materials MX-80 and DepCaN.
Figure 6-8. Results from MX-80 specimens from Figure 6-7 with results from LOT series 2 with laboratory heated specimens /Karnland et al. 2009/.
0
1000
2000
3000
4000
5000
6000
1800 1900 2000 2100 2200
q max
(kPa
)
Density (kg/m3)
reference
B
B no delay
B friction
0
2
4
6
8
10
12
14
1800 1900 2000 2100 2200
ε at
qm
ax(%
)
Density (kg/m3)
reference
B
B no delay
B friction
0
1000
2000
3000
4000
5000
6000
1800 1900 2000 2100 2200
q max
(kPa
)
Density (kg/m3)
referenceN MX-80 -18˚CF MX-80 20˚CC MX-80 150˚CF MX-80 200˚CN DepCaN-18˚C E DCaN 20˚CE DCaN 150˚C
0
2
4
6
8
10
12
14
1800 1900 2000 2100 2200
ε at
qm
ax(%
)
Density (kg/m3)
referenceN MX-80 -18˚CF MX-80 20˚CC MX-80 150˚CF MX-80 200˚CN DepCaN-18˚C E DCaN 20˚CE DCaN 150˚C
0
2
4
6
8
10
12
14
1800 1900 2000 2100 2200
ε at
qm
ax(%
)
Density (kg/m3)
reference
N MX-80 -18˚C
F MX-80 20˚C
C MX-80 150˚C
F MX-80 200˚C
LOT series 2 90˚C
LOT series 2 120˚C
LOT series 2 150˚C0
1000
2000
3000
4000
5000
6000
1800 1900 2000 2100 2200
q max
(kPa
)
Density (kg/m3)
reference
N MX-80 -18˚C
F MX-80 20˚C
C MX-80 150˚C
F MX-80 200˚C
LOT series 2 90˚C
LOT series 2 120˚C
LOT series 2 150˚C
34 TR-10-41
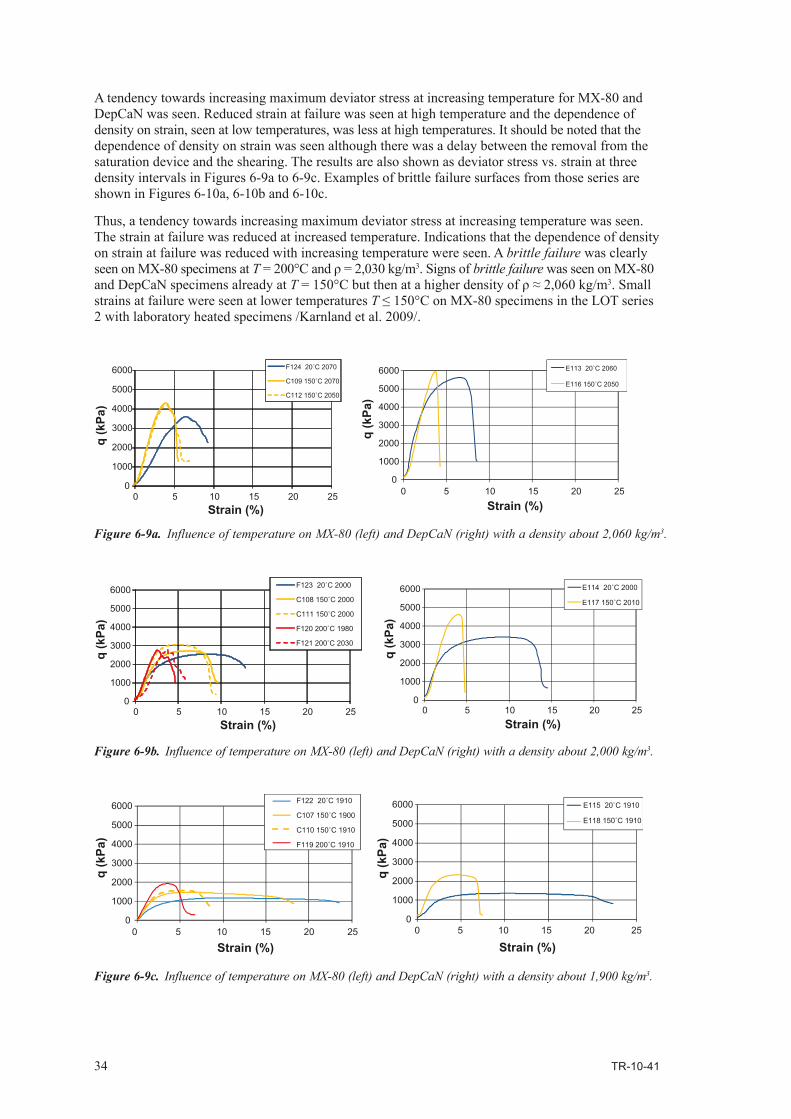
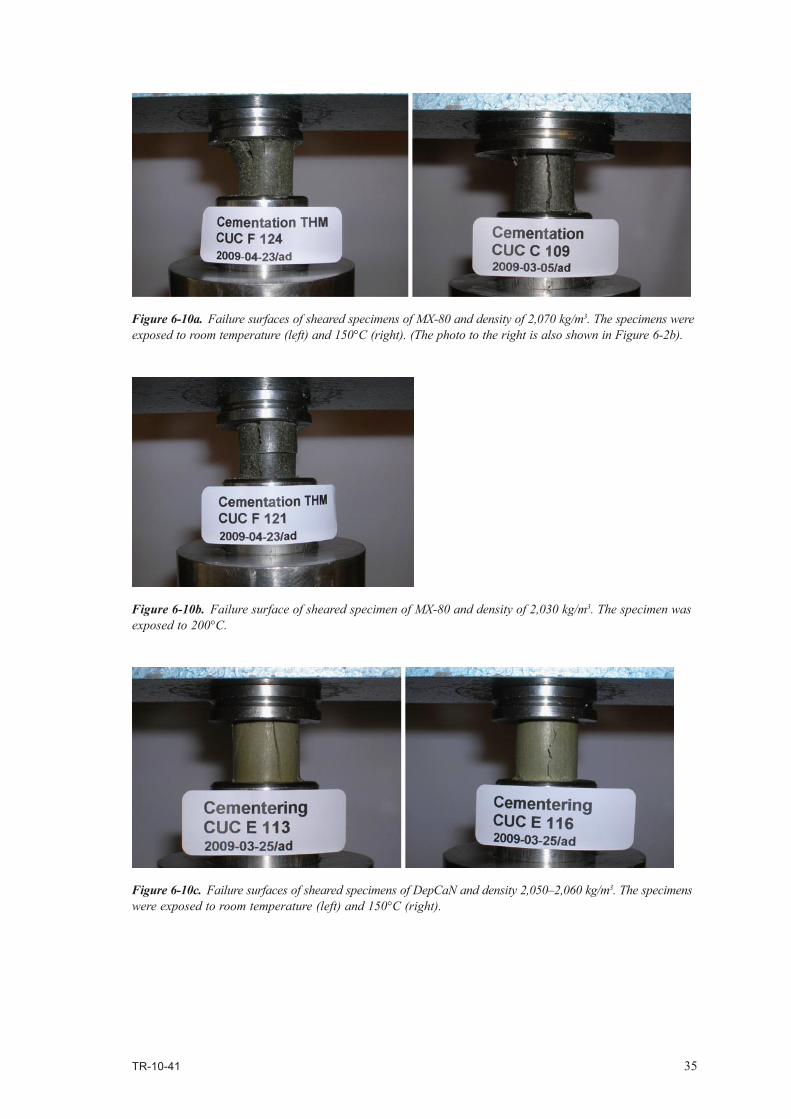
A tendency towards increasing maximum deviator stress at increasing temperature for MX-80 and DepCaN was seen. Reduced strain at failure was seen at high temperature and the dependence of density on strain, seen at low temperatures, was less at high temperatures. It should be noted that the dependence of density on strain was seen although there was a delay between the removal from the saturation device and the shearing. The results are also shown as deviator stress vs. strain at three density intervals in Figures 6-9a to 6-9c. Examples of brittle failure surfaces from those series are shown in Figures 6-10a, 6-10b and 6-10c.
Thus, a tendency towards increasing maximum deviator stress at increasing temperature was seen. The strain at failure was reduced at increased temperature. Indications that the dependence of density on strain at failure was reduced with increasing temperature were seen. A brittle failure was clearly seen on MX-80 specimens at T = 200°C and ρ = 2,030 kg/m3. Signs of brittle failure was seen on MX-80 and DepCaN specimens already at T = 150°C but then at a higher density of ρ ≈ 2,060 kg/m3. Small strains at failure were seen at lower temperatures T ≤ 150°C on MX-80 specimens in the LOT series 2 with laboratory heated specimens /Karnland et al. 2009/.
Figure 6-9a. Influence of temperature on MX-80 (left) and DepCaN (right) with a density about 2,060 kg/m3.
Figure 6-9b. Influence of temperature on MX-80 (left) and DepCaN (right) with a density about 2,000 kg/m3.
Figure 6-9c. Influence of temperature on MX-80 (left) and DepCaN (right) with a density about 1,900 kg/m3.
0
1000
2000
3000
4000
5000
6000
0 5 10 15 20 25
F124 20˚C 2070
C109 150˚C 2070
C112 150˚C 2050
0
1000
2000
3000
4000
5000
6000
0 5 10 15 20 25
E113 20˚C 2060
E116 150˚C 2050
q (k
Pa)
Strain (%)
q (k
Pa)
Strain (%)
0
1000
2000
3000
4000
5000
6000
0 5 10 15 20 25
F123 20˚C 2000
C108 150˚C 2000
C111 150˚C 2000
F120 200˚C 1980
F121 200˚C 2030
0
1000
2000
3000
4000
5000
6000
0 5 10 15 20 25
E114 20˚C 2000
E117 150˚C 2010
q (k
Pa)
Strain (%)
q (k
Pa)
Strain (%)
0
1000
2000
3000
4000
5000
6000
q (k
Pa)
Strain (%)
0
1000
2000
3000
4000
5000
6000
q (k
Pa)
Strain (%)
F122 20˚C 1910
C107 150˚C 1900
C110 150˚C 1910
F119 200˚C 1910
E115 20˚C 1910
E118 150˚C 1910
0 5 10 15 20 25 0 5 10 15 20 25
TR-10-41 35
Figure 6-10a. Failure surfaces of sheared specimens of MX-80 and density of 2,070 kg/m3. The specimens were exposed to room temperature (left) and 150°C (right). (The photo to the right is also shown in Figure 6-2b).
Figure 6-10b. Failure surface of sheared specimen of MX-80 and density of 2,030 kg/m3. The specimen was exposed to 200°C.
Figure 6-10c. Failure surfaces of sheared specimens of DepCaN and density 2,050–2,060 kg/m3. The specimens were exposed to room temperature (left) and 150°C (right).
36 TR-10-41
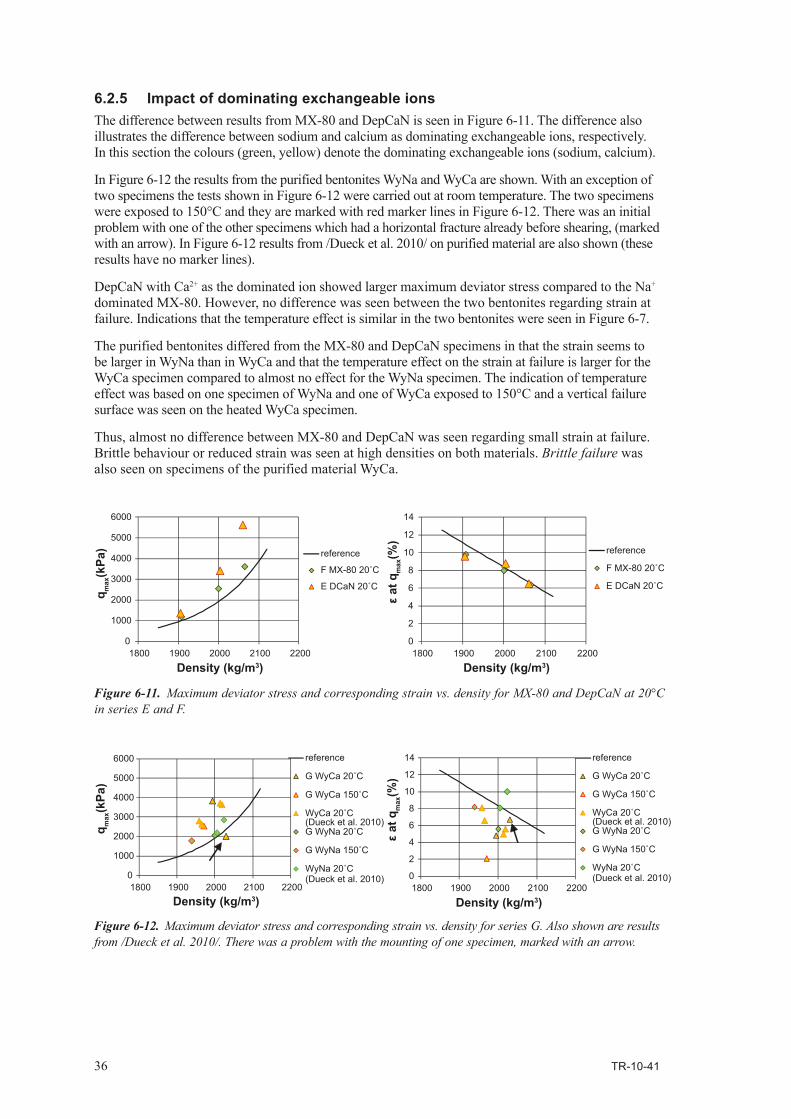
6.2.5 Impact of dominating exchangeable ionsThe difference between results from MX-80 and DepCaN is seen in Figure 6-11. The difference also illustrates the difference between sodium and calcium as dominating exchangeable ions, respectively. In this section the colours (green, yellow) denote the dominating exchangeable ions (sodium, calcium).
In Figure 6-12 the results from the purified bentonites WyNa and WyCa are shown. With an exception of two specimens the tests shown in Figure 6-12 were carried out at room temperature. The two specimens were exposed to 150°C and they are marked with red marker lines in Figure 6-12. There was an initial problem with one of the other specimens which had a horizontal fracture already before shearing, (marked with an arrow). In Figure 6-12 results from /Dueck et al. 2010/ on purified material are also shown (these results have no marker lines).
DepCaN with Ca2+ as the dominated ion showed larger maximum deviator stress compared to the Na+ dominated MX-80. However, no difference was seen between the two bentonites regarding strain at failure. Indications that the temperature effect is similar in the two bentonites were seen in Figure 6-7.
The purified bentonites differed from the MX-80 and DepCaN specimens in that the strain seems to be larger in WyNa than in WyCa and that the temperature effect on the strain at failure is larger for the WyCa specimen compared to almost no effect for the WyNa specimen. The indication of temperature effect was based on one specimen of WyNa and one of WyCa exposed to 150°C and a vertical failure surface was seen on the heated WyCa specimen.
Thus, almost no difference between MX-80 and DepCaN was seen regarding small strain at failure. Brittle behaviour or reduced strain was seen at high densities on both materials. Brittle failure was also seen on specimens of the purified material WyCa.
Figure 6-11. Maximum deviator stress and corresponding strain vs. density for MX-80 and DepCaN at 20°C in series E and F.
Figure 6-12. Maximum deviator stress and corresponding strain vs. density for series G. Also shown are results from /Dueck et al. 2010/. There was a problem with the mounting of one specimen, marked with an arrow.
0
1000
2000
3000
4000
5000
6000
1800 1900 2000 2100 2200
q max
(kPa
)
Density (kg/m3)
reference
F MX-80 20˚C
E DCaN 20˚C
0
2
4
6
8
10
12
14
1800 1900 2000 2100 2200
ε at
qm
ax(%
)
Density (kg/m3)
reference
F MX-80 20˚C
E DCaN 20˚C
0
1000
2000
3000
4000
5000
6000
1800 1900 2000 2100 2200
q max
(kPa
)
Density (kg/m3)
reference
G WyCa 20˚C
G WyCa 150˚C
WyCa 20˚C (Dueck et al. 2010)G WyNa 20˚C
G WyNa 150˚C
WyNa 20˚C (Dueck et al. 2010) 0
2
4
6
8
10
12
14
1800 1900 2000 2100 2200
ε at
qm
ax(%
)
Density (kg/m3)
reference
G WyCa 20˚C
G WyCa 150˚C
WyCa 20˚C (Dueck et al. 2010)G WyNa 20˚C
G WyNa 150˚C
WyNa 20˚C (Dueck et al. 2010)
TR-10-41 37
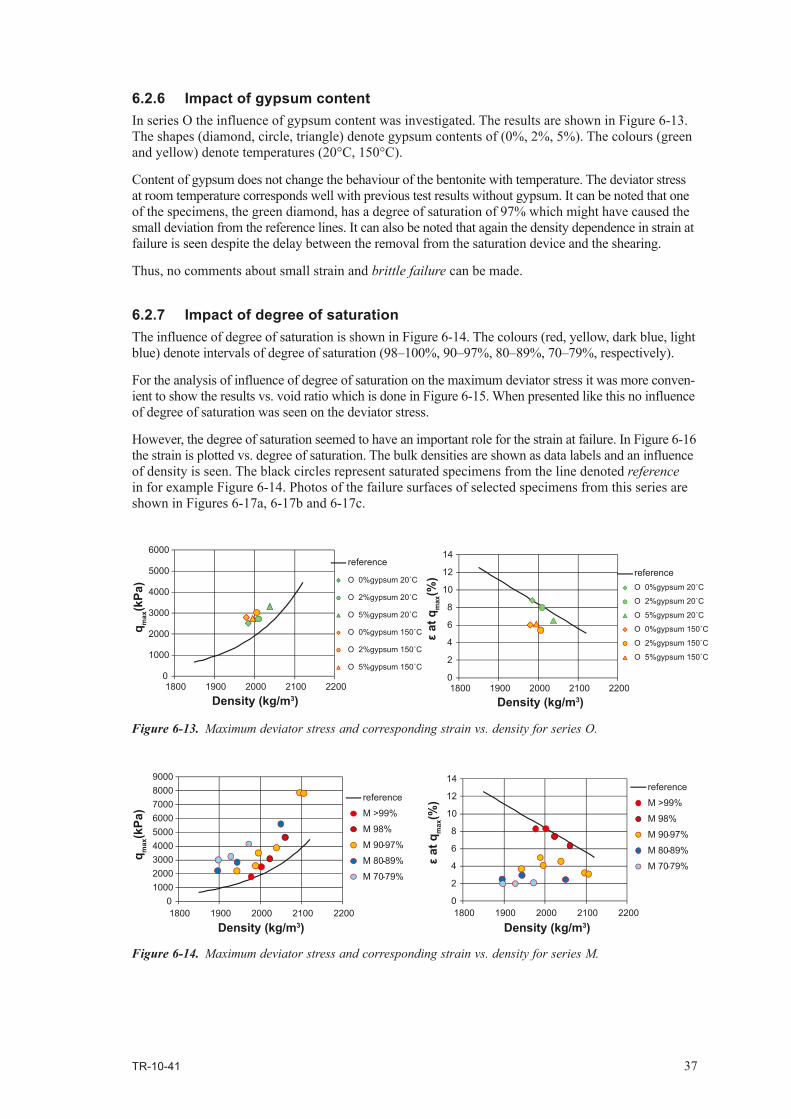
6.2.6 Impact of gypsum contentIn series O the influence of gypsum content was investigated. The results are shown in Figure 6-13. The shapes (diamond, circle, triangle) denote gypsum contents of (0%, 2%, 5%). The colours (green and yellow) denote temperatures (20°C, 150°C).
Content of gypsum does not change the behaviour of the bentonite with temperature. The deviator stress at room temperature corresponds well with previous test results without gypsum. It can be noted that one of the specimens, the green diamond, has a degree of saturation of 97% which might have caused the small deviation from the reference lines. It can also be noted that again the density dependence in strain at failure is seen despite the delay between the removal from the saturation device and the shearing.
Thus, no comments about small strain and brittle failure can be made.
6.2.7 Impact of degree of saturationThe influence of degree of saturation is shown in Figure 6-14. The colours (red, yellow, dark blue, light blue) denote intervals of degree of saturation (98–100%, 90–97%, 80–89%, 70–79%, respectively).
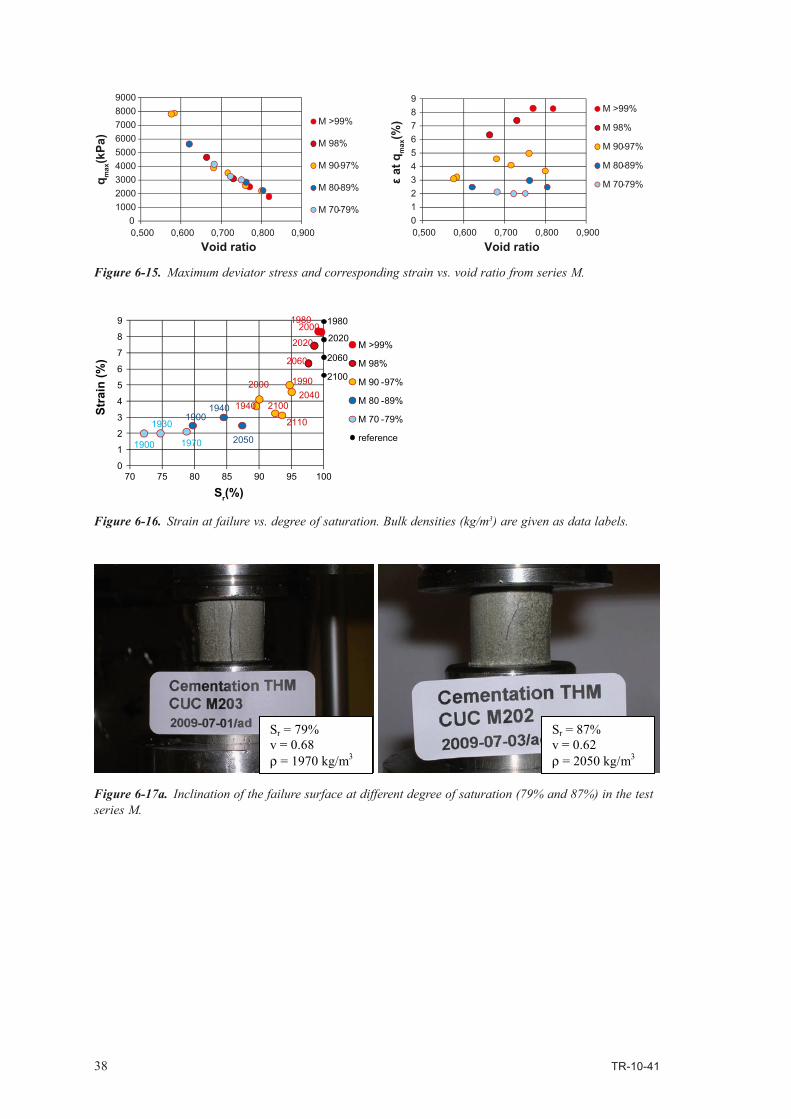
For the analysis of influence of degree of saturation on the maximum deviator stress it was more conven-ient to show the results vs. void ratio which is done in Figure 6-15. When presented like this no influence of degree of saturation was seen on the deviator stress.
However, the degree of saturation seemed to have an important role for the strain at failure. In Figure 6-16 the strain is plotted vs. degree of saturation. The bulk densities are shown as data labels and an influence of density is seen. The black circles represent saturated specimens from the line denoted reference in for example Figure 6-14. Photos of the failure surfaces of selected specimens from this series are shown in Figures 6-17a, 6-17b and 6-17c.
Figure 6-13. Maximum deviator stress and corresponding strain vs. density for series O.
0
1000
2000
3000
4000
5000
6000
1800 1900 2000 2100 2200
q max
(kPa
)
Density (kg/m3)
reference
O 0%gypsum 20˚C
O 2%gypsum 20˚C
O 5%gypsum 20˚C
O 0%gypsum 150˚C
O 2%gypsum 150˚C
O 5%gypsum 150˚C0
2
4
6
8
10
12
14
1800 1900 2000 2100 2200
ε at
qm
ax(%
)
Density (kg/m3)
referenceO 0%gypsum 20˚C
O 2%gypsum 20˚C
O 5%gypsum 20˚C
O 0%gypsum 150˚C
O 2%gypsum 150˚C
O 5%gypsum 150˚C
0100020003000400050006000700080009000
1800 1900 2000 2100 2200
q max
(kPa
)
Density (kg/m3)
reference
M >99%
M 98%
M 90-97%
M 80-89%
M 70-79%
0
2
4
6
8
10
12
14
1800 1900 2000 2100 2200
ε at
qm
ax(%
)
Density (kg/m3)
reference
M >99%
M 98%
M 90-97%
M 80-89%
M 70-79%
Figure 6-14. Maximum deviator stress and corresponding strain vs. density for series M.
38 TR-10-41
Figure 6-15. Maximum deviator stress and corresponding strain vs. void ratio from series M.
Figure 6-16. Strain at failure vs. degree of saturation. Bulk densities (kg/m3) are given as data labels.
Figure 6-17a. Inclination of the failure surface at different degree of saturation (79% and 87%) in the test series M.
0100020003000400050006000700080009000
0,500 0,600 0,700 0,800 0,900
q max
(kPa
)
Void ratio
M >99%
M 98%
M 90-97%
M 80-89%
M 70-79%0123456789
0,500 0,600 0,700 0,800 0,900
ε at
qm
ax(%
)
Void ratio
M >99%
M 98%
M 90-97%
M 80-89%
M 70-79%
2000
2060
2020
2100
2110
20402000 1990
1940
2050
19401900
1970
1930
1900
1980
2020
2060
2100
0
1
2
3
4
5
6
7
8
9
70 75 80 85 90 95 100
Stra
in (%
)
Sr(%)
M >99%
M 98%
M 90 -97%
M 80 -89%
M 70 -79%
reference
1980
Sr = 79% v = 0.68 ρ = 1970 kg/m3
Sr = 87% v = 0.62 ρ = 2050 kg/m3
TR-10-41 39
The influence of degree of saturation on strain is large. This is important since the degree of saturation was not always 100% although the specimens were saturated in the saturation device and often also regarded as saturated. In some tests the degree of saturation was as low as 97% after removal from the saturation device. Reduced strain at failure was seen at degree of saturation less than approxi-mately Sr ≤ 97% according to Figure 6-16.
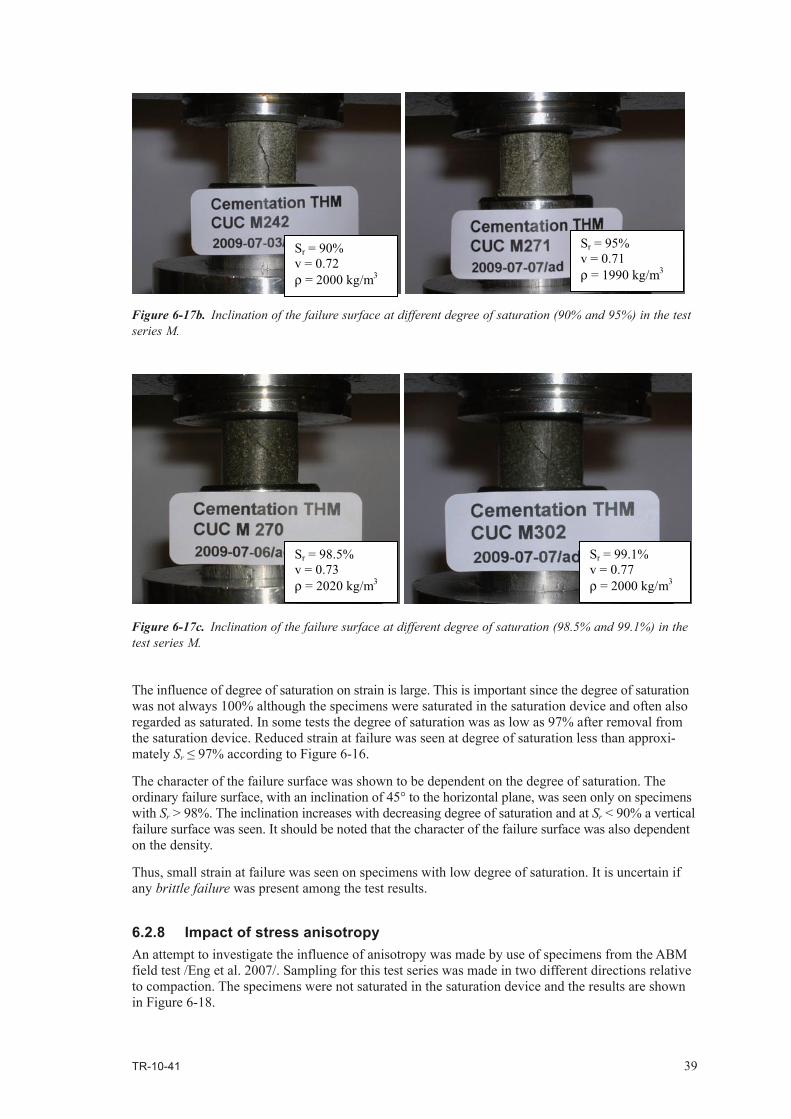
The character of the failure surface was shown to be dependent on the degree of saturation. The ordinary failure surface, with an inclination of 45° to the horizontal plane, was seen only on specimens with Sr > 98%. The inclination increases with decreasing degree of saturation and at Sr < 90% a vertical failure surface was seen. It should be noted that the character of the failure surface was also dependent on the density.
Thus, small strain at failure was seen on specimens with low degree of saturation. It is uncertain if any brittle failure was present among the test results.
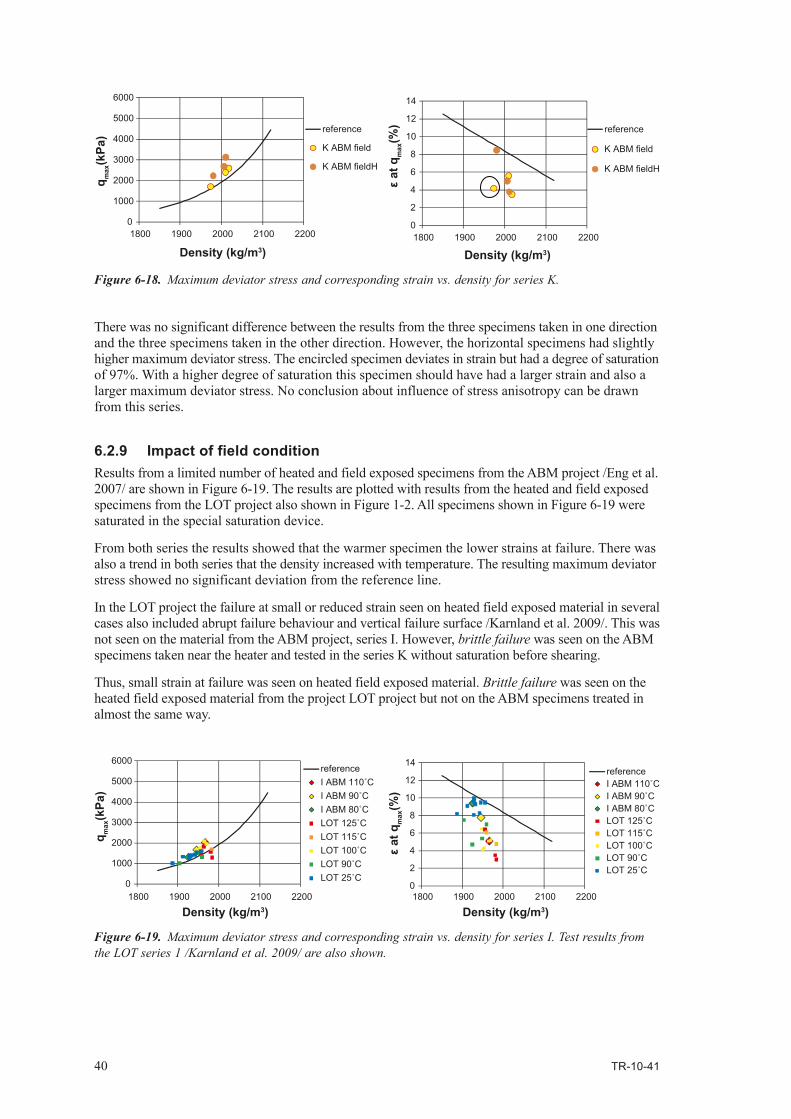
6.2.8 Impact of stress anisotropyAn attempt to investigate the influence of anisotropy was made by use of specimens from the ABM field test /Eng et al. 2007/. Sampling for this test series was made in two different directions relative to compaction. The specimens were not saturated in the saturation device and the results are shown in Figure 6-18.
Figure 6-17b. Inclination of the failure surface at different degree of saturation (90% and 95%) in the test series M.
Figure 6-17c. Inclination of the failure surface at different degree of saturation (98.5% and 99.1%) in the test series M.
Sr = 90% v = 0.72 ρ = 2000 kg/m3
Sr = 95% v = 0.71 ρ = 1990 kg/m3
Sr = 98.5% v = 0.73 ρ = 2020 kg/m3
Sr = 99.1% v = 0.77 ρ = 2000 kg/m3
40 TR-10-41
There was no significant difference between the results from the three specimens taken in one direction and the three specimens taken in the other direction. However, the horizontal specimens had slightly higher maximum deviator stress. The encircled specimen deviates in strain but had a degree of saturation of 97%. With a higher degree of saturation this specimen should have had a larger strain and also a larger maximum deviator stress. No conclusion about influence of stress anisotropy can be drawn from this series.
6.2.9 Impact of field conditionResults from a limited number of heated and field exposed specimens from the ABM project /Eng et al. 2007/ are shown in Figure 6-19. The results are plotted with results from the heated and field exposed specimens from the LOT project also shown in Figure 1-2. All specimens shown in Figure 6-19 were saturated in the special saturation device.
From both series the results showed that the warmer specimen the lower strains at failure. There was also a trend in both series that the density increased with temperature. The resulting maximum deviator stress showed no significant deviation from the reference line.
In the LOT project the failure at small or reduced strain seen on heated field exposed material in several cases also included abrupt failure behaviour and vertical failure surface /Karnland et al. 2009/. This was not seen on the material from the ABM project, series I. However, brittle failure was seen on the ABM specimens taken near the heater and tested in the series K without saturation before shearing.
Thus, small strain at failure was seen on heated field exposed material. Brittle failure was seen on the heated field exposed material from the project LOT project but not on the ABM specimens treated in almost the same way.
Figure 6-18. Maximum deviator stress and corresponding strain vs. density for series K.
Figure 6-19. Maximum deviator stress and corresponding strain vs. density for series I. Test results from the LOT series 1 /Karnland et al. 2009/ are also shown.
0
1000
2000
3000
4000
5000
6000
1800 1900 2000 2100 2200
q max
(kPa
)
Density (kg/m3)
reference
K ABM field
K ABM fieldH
0
2
4
6
8
10
12
14
1800 1900 2000 2100 2200
ε at
qm
ax(%
)
Density (kg/m3)
reference
K ABM field
K ABM fieldH
0
1000
2000
3000
4000
5000
6000
1800 1900 2000 2100 2200
q max
(kPa
)
Density (kg/m3)
referenceI ABM 110˚CI ABM 90˚CI ABM 80˚CLOT 125˚CLOT 115˚CLOT 100˚CLOT 90˚CLOT 25˚C
0
2
4
6
8
10
12
14
1800 1900 2000 2100 2200
ε at
qm
ax(%
)
Density (kg/m3)
referenceI ABM 110˚CI ABM 90˚CI ABM 80˚CLOT 125˚CLOT 115˚CLOT 100˚CLOT 90˚CLOT 25˚C
TR-10-41 41
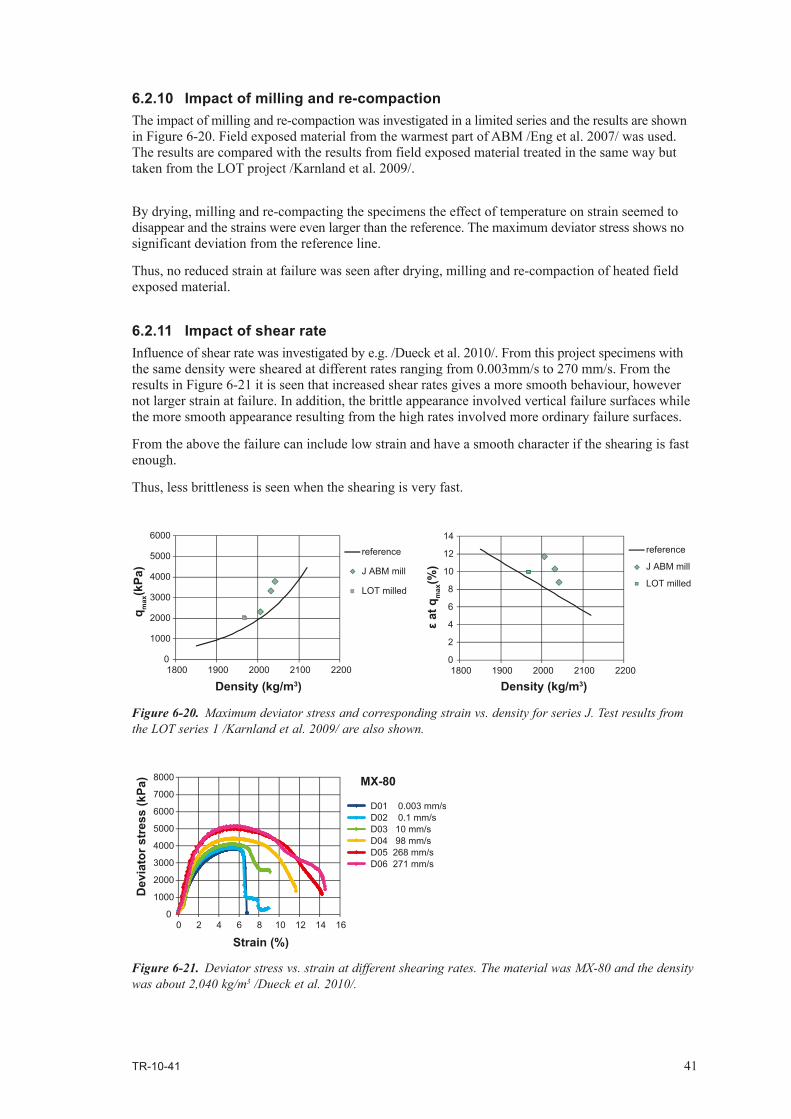
6.2.10 Impact of milling and re-compactionThe impact of milling and re-compaction was investigated in a limited series and the results are shown in Figure 6-20. Field exposed material from the warmest part of ABM /Eng et al. 2007/ was used. The results are compared with the results from field exposed material treated in the same way but taken from the LOT project /Karnland et al. 2009/.
By drying, milling and re-compacting the specimens the effect of temperature on strain seemed to disappear and the strains were even larger than the reference. The maximum deviator stress shows no significant deviation from the reference line.
Thus, no reduced strain at failure was seen after drying, milling and re-compaction of heated field exposed material.
6.2.11 Impact of shear rateInfluence of shear rate was investigated by e.g. /Dueck et al. 2010/. From this project specimens with the same density were sheared at different rates ranging from 0.003mm/s to 270 mm/s. From the results in Figure 6-21 it is seen that increased shear rates gives a more smooth behaviour, however not larger strain at failure. In addition, the brittle appearance involved vertical failure surfaces while the more smooth appearance resulting from the high rates involved more ordinary failure surfaces.
From the above the failure can include low strain and have a smooth character if the shearing is fast enough.
Thus, less brittleness is seen when the shearing is very fast.
Figure 6-20. Maximum deviator stress and corresponding strain vs. density for series J. Test results from the LOT series 1 /Karnland et al. 2009/ are also shown.
Figure 6-21. Deviator stress vs. strain at different shearing rates. The material was MX-80 and the density was about 2,040 kg/m3 /Dueck et al. 2010/.
0
1000
2000
3000
4000
5000
6000
1800 1900 2000 2100 2200
q max
(kPa
)
Density (kg/m3)
reference
J ABM mill
LOT milled
0
2
4
6
8
10
12
14
1800 1900 2000 2100 2200
ε at
qm
ax(%
)
Density (kg/m3)
reference
J ABM mill
LOT milled
0
1000
2000
3000
4000
5000
6000
7000
8000
0 2 4 6 8 10 12 14 16
Dev
iato
r str
ess
(kPa
)
Strain (%)
MX-80
D01 0.003 mm/sD02 0.1 mm/sD03 10 mm/sD04 98 mm/sD05 268 mm/sD06 271 mm/s
42 TR-10-41
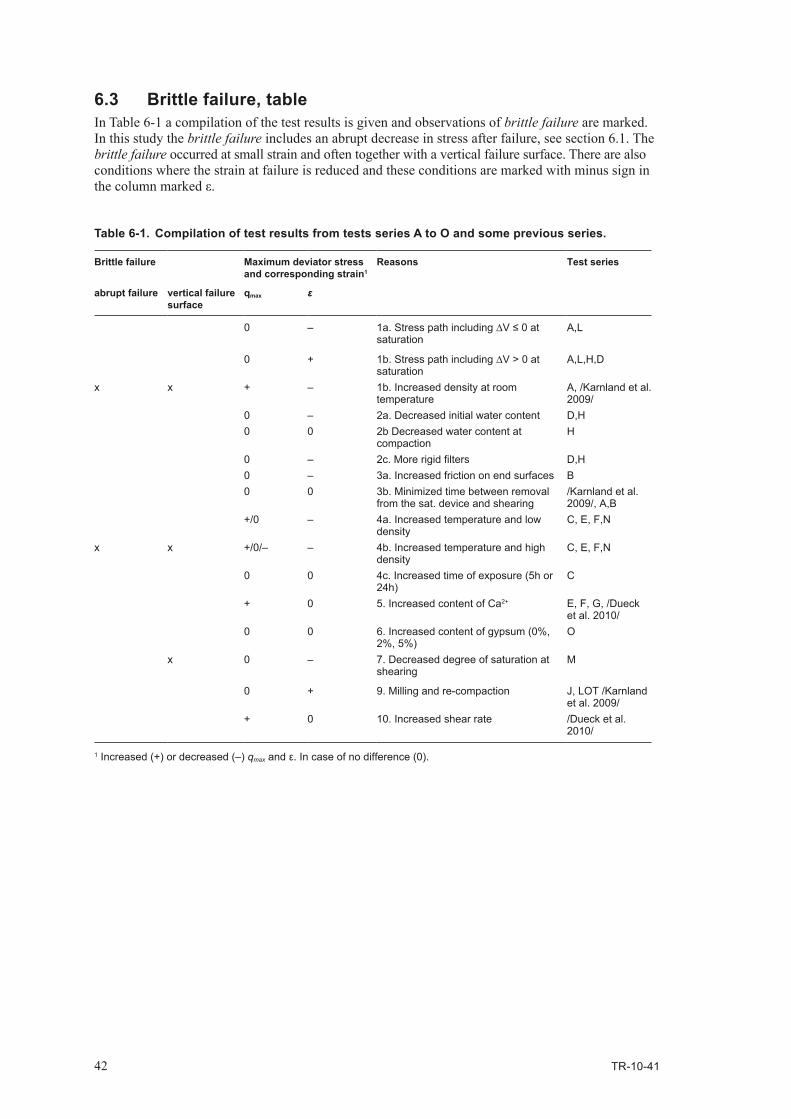
6.3 Brittle failure, tableIn Table 6-1 a compilation of the test results is given and observations of brittle failure are marked. In this study the brittle failure includes an abrupt decrease in stress after failure, see section 6.1. The brittle failure occurred at small strain and often together with a vertical failure surface. There are also conditions where the strain at failure is reduced and these conditions are marked with minus sign in the column marked ε.
Table 6-1. Compilation of test results from tests series A to O and some previous series.
Brittle failure Maximum deviator stress and corresponding strain1
Reasons Test series
abrupt failure vertical failure surface
qmax ε
0 – 1a. Stress path including ∆V ≤ 0 at saturation
A,L
0 + 1b. Stress path including ∆V > 0 at saturation
A,L,H,D
x x + – 1b. Increased density at room temperature
A, /Karnland et al. 2009/
0 – 2a. Decreased initial water content D,H0 0 2b Decreased water content at
compactionH
0 – 2c. More rigid filters D,H0 – 3a. Increased friction on end surfaces B0 0 3b. Minimized time between removal
from the sat. device and shearing/Karnland et al. 2009/, A,B
+/0 – 4a. Increased temperature and low density
C, E, F,N
x x +/0/– – 4b. Increased temperature and high density
C, E, F,N
0 0 4c. Increased time of exposure (5h or 24h)
C
+ 0 5. Increased content of Ca2+ E, F, G, /Dueck et al. 2010/
0 0 6. Increased content of gypsum (0%, 2%, 5%)
O
x 0 – 7. Decreased degree of saturation at shearing
M
0 + 9. Milling and re-compaction J, LOT /Karnland et al. 2009/
+ 0 10. Increased shear rate /Dueck et al. 2010/
1 Increased (+) or decreased (–) qmax and ε. In case of no difference (0).
TR-10-41 43
7 Discussion and conclusions
7.1 Deviator stress at failureThe following points are important findings from this investigation regarding deviator stress at failure, i.e. maximum deviator stress:
• Higher density gives larger deviator stress at failure.
• A tendency towards increasing deviator stress at failure with increasing temperature is seen on MX-80 and DepCaN. However, the influence of temperature is in the same range as the difference between the two bentonites.
• The initial water content has no influence on the deviator stress at failure.
• The degree of saturation has no influence on the deviator stress at failure for a given void ratio.
7.2 Strain at failureThe following points are important findings from this investigation regarding strain at failure:
• Higher density specimens experienced smaller strain before failure.
• Strain at failure is generally reduced when the specimens have been exposed to increased temperature.
• There is an increase in strain at failure with increasing water content before water saturation.
• The strain at failure is approximately the same for MX-80 and DepCaN at the same density.
• The strain at failure decreases with decreasing degree of saturation.
• There are indications that consolidation decreases the strain at failure while swelling increases the strain at failure, for specimens with the same final density.
• Drying at room temperature, milling and re-saturation restores and even results in larger strain than the reference.
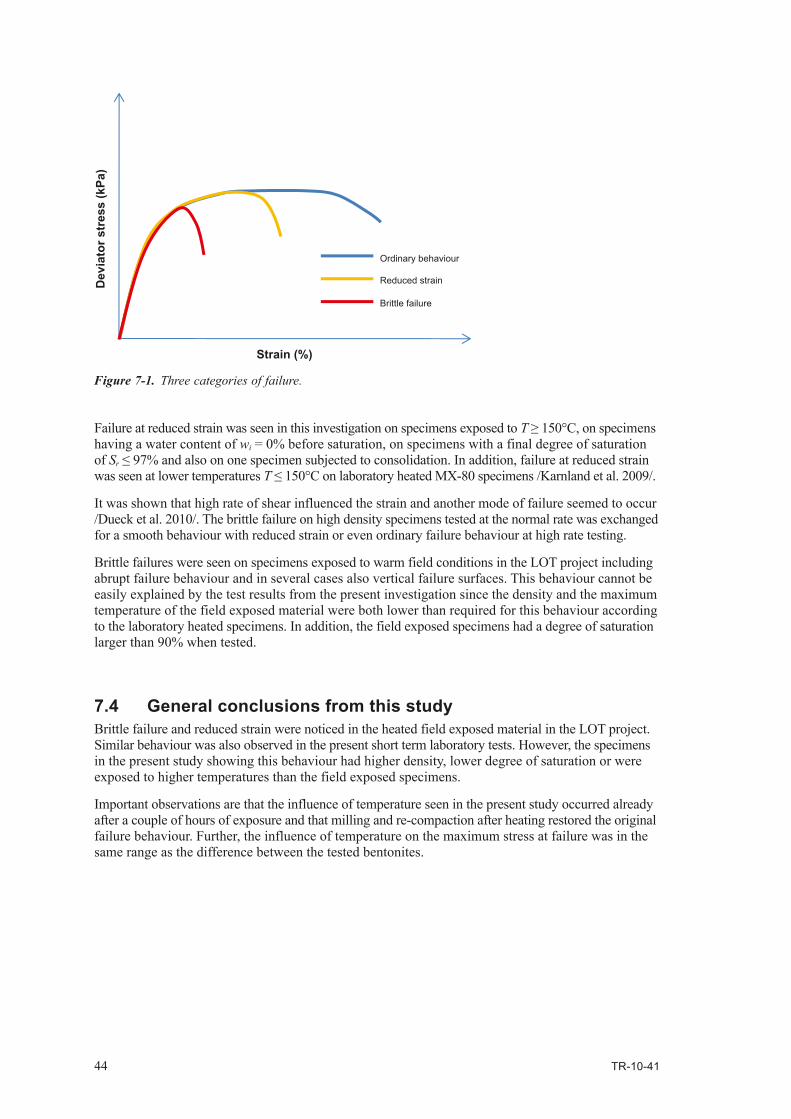
7.3 Brittle failure behaviourThe shear failure is characterized by the maximum deviator stress and the corresponding strain. However, to use strain at failure might be misleading due to its sensitivity to the handling of the specimens before the shearing, e.g. swelling during removal from the saturation device. An alternative to use the value of strain at failure is to classify the failure behaviour. Three categories are shown in Figure 7-1 and are described below:
• Ordinary failure behaviour – large deformation to failure with no or small decrease in stress at failure.
• Failure at reduced strain – smooth failure with obvious maximum at lower strain.
• Brittle failure – abrupt decrease in stress after failure, occurrence of vertical failure surface.
Brittle failure was in this investigation mainly seen on specimens having a density of ρ ≥ 2,060 kg/m3 or on specimens exposed to high temperature T ≥ 150°C in the laboratory. The abrupt behaviour seen on unsaturated specimens with densities less than ρ < 2,060 kg/m3 occurred on specimens with a degree of saturation less than Sr < 90%. Vertical failure surfaces were seen on these specimens. Brittle failure was also seen in the limited series with purified bentonites. The abrupt behaviour of the failure curve was seen on the purified bentonite WyCa at a density of about 2,000 kg/m3 but including a vertical failure surface only after heating to 150°C.
44 TR-10-41
Failure at reduced strain was seen in this investigation on specimens exposed to T ≥ 150°C, on spec imens having a water content of wi = 0% before saturation, on specimens with a final degree of saturation of Sr ≤ 97% and also on one specimen subjected to consolidation. In addition, failure at reduced strain was seen at lower temperatures T ≤ 150°C on laboratory heated MX-80 specimens /Karnland et al. 2009/.
It was shown that high rate of shear influenced the strain and another mode of failure seemed to occur /Dueck et al. 2010/. The brittle failure on high density specimens tested at the normal rate was exchanged for a smooth behaviour with reduced strain or even ordinary failure behaviour at high rate testing.
Brittle failures were seen on specimens exposed to warm field conditions in the LOT project including abrupt failure behaviour and in several cases also vertical failure surfaces. This behaviour cannot be easily explained by the test results from the present investigation since the density and the maximum temperature of the field exposed material were both lower than required for this behaviour according to the laboratory heated specimens. In addition, the field exposed specimens had a degree of saturation larger than 90% when tested.
7.4 General conclusions from this studyBrittle failure and reduced strain were noticed in the heated field exposed material in the LOT project. Similar behaviour was also observed in the present short term laboratory tests. However, the specimens in the present study showing this behaviour had higher density, lower degree of saturation or were exposed to higher temperatures than the field exposed specimens.
Important observations are that the influence of temperature seen in the present study occurred already after a couple of hours of exposure and that milling and re-compaction after heating restored the original failure behaviour. Further, the influence of temperature on the maximum stress at failure was in the same range as the difference between the tested bentonites.
Strain (%)
Dev
iato
r str
ess
(kPa
)
Ordinary behaviour
Reduced strain
Brittle failure
Figure 7-1. Three categories of failure.
TR-10-41 45
References
Börgesson L, Johannesson L-E, Sandén T, Hernelind J, 1995. Modelling of the physical behaviour of water saturated clay barriers. Laboratory tests, material models and finite element application. SKB TR-95-20, Svensk Kärnbränslehantering AB.
Börgesson L, Johannesson L-E, Hernelind J, 2004. Earthquake induced rock shear through a deposition hole. Effect on the canister and the buffer. SKB TR-04-02, Svensk Kärnbränslehantering AB.
Dueck A, Börgesson L, Johannesson L-E, 2010. Stress strain relation of bentonite at undrained shear. Laboratory tests to investigate the influence of material composition and test technique. SKB TR-10-32, Svensk Kärnbränslehantering AB.
Eng A, Nilsson U, Svensson D, 2007. Äspö Hard Rock Laboratory; Alternative Buffer Materials, Installation report. SKB IPR-07-15, Svensk Kärnbränslehantering AB.
Karnland O, Olsson S, Nilsson U, 2006. Mineralogy and sealing properties of various bentonites and smectite-rich clay mateials. SKB TR-06-30, Svensk Kärnbränslehantering AB.
Karnland O, Olsson S, Dueck A, Birgersson M, Nilsson U, Hernan-Håkansson T, Pedersen K, Nilsson S, Eriksen T, Rosborg B, 2009. Long term test of buffer material at the Äspö Hard Rock Laboratory, LOT project. Final report on the A2 test parcel. SKB TR-09-29, Svensk Kärnbränsle-hantering AB.
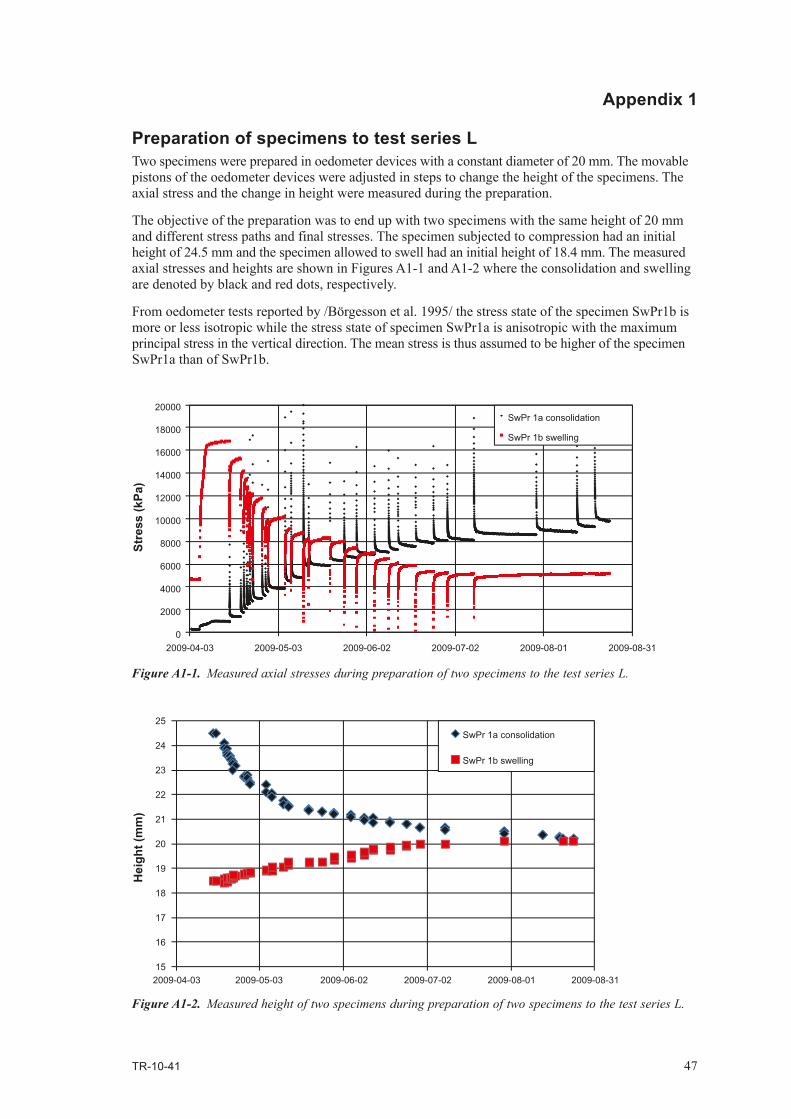
TR-10-41 47
Appendix 1
Preparation of specimens to test series LTwo specimens were prepared in oedometer devices with a constant diameter of 20 mm. The movable pistons of the oedometer devices were adjusted in steps to change the height of the specimens. The axial stress and the change in height were measured during the preparation.
The objective of the preparation was to end up with two specimens with the same height of 20 mm and different stress paths and final stresses. The specimen subjected to compression had an initial height of 24.5 mm and the specimen allowed to swell had an initial height of 18.4 mm. The measured axial stresses and heights are shown in Figures A1-1 and A1-2 where the consolidation and swelling are denoted by black and red dots, respectively.
From oedometer tests reported by /Börgesson et al. 1995/ the stress state of the specimen SwPr1b is more or less isotropic while the stress state of specimen SwPr1a is anisotropic with the maximum principal stress in the vertical direction. The mean stress is thus assumed to be higher of the specimen SwPr1a than of SwPr1b.
Figure A1-1. Measured axial stresses during preparation of two specimens to the test series L.
Figure A1-2. Measured height of two specimens during preparation of two specimens to the test series L.
0
2000
4000
6000
8000
10000
12000
14000
16000
18000
20000
2009-04-03 2009-05-03 2009-06-02 2009-07-02 2009-08-01 2009-08-31
Stre
ss (k
Pa)
SwPr 1a consolidation
SwPr 1b swelling
15
16
17
18
19
20
21
22
23
24
25
2009-04-03 2009-05-03 2009-06-02 2009-07-02 2009-08-01 2009-08-31
Hei
ght (
mm
)
SwPr 1a consolidation
SwPr 1b swelling