
Thermo-mechanical behavior of low-dimensional systems: The local ...
129
Thermo-mechanical behavior of low-dimensional systems: The local bond average approach Chang Q. Sun * School of Electrical and Electronic Engineering, Nanyang Technological University, Singapore 639798, Singapore Key Laboratory of Low-Dimensional Materials and Application Technologies (Ministry of Education), Xiangtan University, Hunan 411105, China Tianjin Key Laboratory of Low-Dimensional Materials Physics and Preparing Technology, Tianjin University, Tianjin 300072, China article info Article history: Received 20 July 2008 Accepted 1 August 2008 abstract With the miniaturization of a solid, effects of surface strain and quantum trapping become increasingly important in determining its properties. As a result, low-dimensional materials manifest unu- sual features, especially in their energetic and mechanical behavior. The establishment of a consistent understanding on an atomic-level of the mechanism behind the fascinating behaviors of low-dimen- sional systems, which include monatomic chains, hollow tubes, liquid and solid surface skins, nanocavities, nanowires, and nano- grains, as well as interfaces, has long been a great challenge. In this report, a literature survey is presented, followed by a theoretical analysis culminating in the development of a local bond average (LBA) approach that may complement existing approximations in terms of continuum medium and quantum computations. The LBA approach correlates the measurable quantities of a specimen to the identities of its representative bonds, and the energetic responses of these bonds (bond nature, order, length and strength) to external stimuli, such as changes in temperatures and coordination environ- ments. It is shown that the shortened and strengthened bonds between under-coordinated atoms and the consequent local strain and quantum trapping dictate, intrinsically, the mechanical behav- ior of systems with a high proportion of such atoms. The thermally driven softening of a substance arises from bond expansion and lat- tice vibrations that weaken the bonds. The competition between the energy density gain and the residual atomic cohesive energy in the 0079-6425/$ - see front matter Ó 2008 Elsevier Ltd. All rights reserved. doi:10.1016/j.pmatsci.2008.08.001 * Address: School of Electrical and Electronic Engineering, Nanyang Technological University, Singapore 639798, Singapore. Associate affiliations at Xiangtan and Tianjin are with honorary/adjunct appointments. E-mail address: [email protected] URL: http://www3.ntu.edu.sg/home/ecqsun/ Progress in Materials Science 54 (2009) 179–307 Contents lists available at ScienceDirect Progress in Materials Science journal homepage: www.elsevier.com/locate/pmatsci
Transcript of Thermo-mechanical behavior of low-dimensional systems: The local ...

Progress in Materials Science 54 (2009) 179–307
Contents lists available at ScienceDirect
Progress in Materials Science
journal homepage: www.e lsev ie r . com/ loca te /pmatsc i
Thermo-mechanical behavior of low-dimensional systems:The local bond average approach
Chang Q. Sun*
School of Electrical and Electronic Engineering, Nanyang Technological University, Singapore 639798, SingaporeKey Laboratory of Low-Dimensional Materials and Application Technologies (Ministry of Education), Xiangtan University,Hunan 411105, ChinaTianjin Key Laboratory of Low-Dimensional Materials Physics and Preparing Technology, Tianjin University,Tianjin 300072, China
a r t i c l e i n f o a b s t r a c t
Article history:Received 20 July 2008Accepted 1 August 2008
0079-6425/$ - see front matter � 2008 Elsevier Ltdoi:10.1016/j.pmatsci.2008.08.001
* Address: School of Electrical and Electronic EnAssociate affiliations at Xiangtan and Tianjin are w
E-mail address: [email protected]: http://www3.ntu.edu.sg/home/ecqsun/
With the miniaturization of a solid, effects of surface strain andquantum trapping become increasingly important in determiningits properties. As a result, low-dimensional materials manifest unu-sual features, especially in their energetic and mechanical behavior.The establishment of a consistent understanding on an atomic-levelof the mechanism behind the fascinating behaviors of low-dimen-sional systems, which include monatomic chains, hollow tubes,liquid and solid surface skins, nanocavities, nanowires, and nano-grains, as well as interfaces, has long been a great challenge. In thisreport, a literature survey is presented, followed by a theoreticalanalysis culminating in the development of a local bond average(LBA) approach that may complement existing approximations interms of continuum medium and quantum computations. The LBAapproach correlates the measurable quantities of a specimen to theidentities of its representative bonds, and the energetic responsesof these bonds (bond nature, order, length and strength) to externalstimuli, such as changes in temperatures and coordination environ-ments. It is shown that the shortened and strengthened bondsbetween under-coordinated atoms and the consequent local strainand quantum trapping dictate, intrinsically, the mechanical behav-ior of systems with a high proportion of such atoms. The thermallydriven softening of a substance arises from bond expansion and lat-tice vibrations that weaken the bonds. The competition between theenergy density gain and the residual atomic cohesive energy in the
d. All rights reserved.
gineering, Nanyang Technological University, Singapore 639798, Singapore.ith honorary/adjunct appointments.

180 C.Q. Sun / Progress in Materials Science 54 (2009) 179–307
relaxed surface of skin depth determines, intrinsically, the mechani-cal performance of a mesoscopic specimen; the competitionbetween the activation and inhibition of the motion of atomic dislo-cations dominates, extrinsically, the yield strength of the specimenduring plastic deformation. Therefore, the mechanical behavior ofa specimen depends on its shape, size, the nature of the bondsinvolved, surface and interface conditions, and the temperature atwhich the physical properties of the specimen is measured. Excellentagreement with existent measurements of temperature dependenceof surface tension, size and temperature dependence of elasticityand extensibility, and the inverse Hall–Petch relationship in nano-grains have been established. Furthermore, these agreements haveled to quantitative information regarding the bond identities inmonatomic chains and carbon nanotubes, as well as the factors dom-inating the sizes at which a grain is strongest. In addition, the inter-face electric repulsion between nanocontacts due to the skintrapping and the associated local charge densification may providefeasible mechanism for the superfluidity, superlubricity and super-hydrophobicity as widely observed. The progress made insofar evi-dences the essentiality of the LBA approach from the perspective ofbond formation, dissociation, relaxation and vibration and the asso-ciated energetics for the exposition of thermo-mechanical behaviorof low-dimensional materials. Extending the application of theapproach to junction interfaces, liquid surfaces, defects and impuri-ties, chemically adsorbed systems, amorphous states, and sub-stances under other applied stimuli such as pressure and electricfield would contribute to better knowledge of such systems andcould lead to the development of even more fascinating and profit-able materials.
� 2008 Elsevier Ltd. All rights reserved.
Contents
1. Introduction . . . . . . . . . . . . . . . . . . . . . . . . . . . . . . . . . . . . . . . . . . . . . . . . . . . . . . . . . . . . . . . . . . . . . . 184
1.1. Scope . . . . . . . . . . . . . . . . . . . . . . . . . . . . . . . . . . . . . . . . . . . . . . . . . . . . . . . . . . . . . . . . . . . . . . . 1841.2. Overview . . . . . . . . . . . . . . . . . . . . . . . . . . . . . . . . . . . . . . . . . . . . . . . . . . . . . . . . . . . . . . . . . . . . 1851.2.1. Fundamentals . . . . . . . . . . . . . . . . . . . . . . . . . . . . . . . . . . . . . . . . . . . . . . . . . . . . . . . . . 1851.2.2. Challenges . . . . . . . . . . . . . . . . . . . . . . . . . . . . . . . . . . . . . . . . . . . . . . . . . . . . . . . . . . . . 187
1.3. Objectives . . . . . . . . . . . . . . . . . . . . . . . . . . . . . . . . . . . . . . . . . . . . . . . . . . . . . . . . . . . . . . . . . . . 191
2. Principles . . . . . . . . . . . . . . . . . . . . . . . . . . . . . . . . . . . . . . . . . . . . . . . . . . . . . . . . . . . . . . . . . . . . . . . . 1922.1. Local bond average (LBA) . . . . . . . . . . . . . . . . . . . . . . . . . . . . . . . . . . . . . . . . . . . . . . . . . . . . . . . 1922.2. The BOLS correlation . . . . . . . . . . . . . . . . . . . . . . . . . . . . . . . . . . . . . . . . . . . . . . . . . . . . . . . . . . . 1932.3. Temperature dependent BOLS . . . . . . . . . . . . . . . . . . . . . . . . . . . . . . . . . . . . . . . . . . . . . . . . . . . 197
2.3.1. Low temperature approximation . . . . . . . . . . . . . . . . . . . . . . . . . . . . . . . . . . . . . . . . . . 1972.3.2. High temperature and low-stress approximation. . . . . . . . . . . . . . . . . . . . . . . . . . . . . 1992.3.3. Factors dominating mechanical strength . . . . . . . . . . . . . . . . . . . . . . . . . . . . . . . . . . . . 200
2.4. Scaling relations . . . . . . . . . . . . . . . . . . . . . . . . . . . . . . . . . . . . . . . . . . . . . . . . . . . . . . . . . . . . . . . 200
2.4.1. LBA scaling relation . . . . . . . . . . . . . . . . . . . . . . . . . . . . . . . . . . . . . . . . . . . . . . . . . . . . . 2002.4.2. Surface-to-volume ratio for solid and hollow systems. . . . . . . . . . . . . . . . . . . . . . . . . 2012.5. Summary . . . . . . . . . . . . . . . . . . . . . . . . . . . . . . . . . . . . . . . . . . . . . . . . . . . . . . . . . . . . . . . . . . . . . 202
3. Liquid and solid surfaces . . . . . . . . . . . . . . . . . . . . . . . . . . . . . . . . . . . . . . . . . . . . . . . . . . . . . . . . . . . . 2023.1. Observations . . . . . . . . . . . . . . . . . . . . . . . . . . . . . . . . . . . . . . . . . . . . . . . . . . . . . . . . . . . . . . . . . . 203
3.1.1. Surface energetics: classical concepts . . . . . . . . . . . . . . . . . . . . . . . . . . . . . . . . . . . . . . 2033.1.2. Solid surface: skin hardening or softening . . . . . . . . . . . . . . . . . . . . . . . . . . . . . . . . . . 2063.1.3. Liquid surface elasticity: adsorption and heating . . . . . . . . . . . . . . . . . . . . . . . . . . . . . 2083.2. Atomistic origin of surface energetics . . . . . . . . . . . . . . . . . . . . . . . . . . . . . . . . . . . . . . . . . . . . . . 209
3.2.1. Motivation. . . . . . . . . . . . . . . . . . . . . . . . . . . . . . . . . . . . . . . . . . . . . . . . . . . . . . . . . . . . 209
C.Q. Sun / Progress in Materials Science 54 (2009) 179–307 181
3.2.2. Atomistic definition . . . . . . . . . . . . . . . . . . . . . . . . . . . . . . . . . . . . . . . . . . . . . . . . . . . . 211
3.3. Analytical expressions. . . . . . . . . . . . . . . . . . . . . . . . . . . . . . . . . . . . . . . . . . . . . . . . . . . . . . . . . . 2113.3.1. Surface energetics . . . . . . . . . . . . . . . . . . . . . . . . . . . . . . . . . . . . . . . . . . . . . . . . . . . . . . 2113.3.2. Elasticity and strength . . . . . . . . . . . . . . . . . . . . . . . . . . . . . . . . . . . . . . . . . . . . . . . . . . 212
3.4. Strain-induced surface elasticity and stress: supersolidity?. . . . . . . . . . . . . . . . . . . . . . . . . . . . 212
3.4.1. Bond nature and curvature dependence . . . . . . . . . . . . . . . . . . . . . . . . . . . . . . . . . . . . 2123.4.2. T-dependent liquid surface tension: bond energy determination . . . . . . . . . . . . . . . . 2143.4.3. Strain-induced elasticity and strength of a solid surface . . . . . . . . . . . . . . . . . . . . . . . 2153.5. Adsorbate-induced surface stress – bonding effect. . . . . . . . . . . . . . . . . . . . . . . . . . . . . . . . . . . 216
3.5.1. Observations . . . . . . . . . . . . . . . . . . . . . . . . . . . . . . . . . . . . . . . . . . . . . . . . . . . . . . . . . . 2163.5.2. Electronic origin: charge repopulation and polarization . . . . . . . . . . . . . . . . . . . . . . . 2183.6. Electric repulsive interface: superfluidity, superlubricity, and superhydrophobicity . . . . . . . . 221
3.6.1. Observations . . . . . . . . . . . . . . . . . . . . . . . . . . . . . . . . . . . . . . . . . . . . . . . . . . . . . . . . . . 2213.6.2. Mechanism: interface electric repulsion . . . . . . . . . . . . . . . . . . . . . . . . . . . . . . . . . . . . 2243.7. Nitrogen enhanced elasticity and hardness . . . . . . . . . . . . . . . . . . . . . . . . . . . . . . . . . . . . . . . . . 225
3.7.1. Observations . . . . . . . . . . . . . . . . . . . . . . . . . . . . . . . . . . . . . . . . . . . . . . . . . . . . . . . . . . 2253.7.2. Atomistic understanding . . . . . . . . . . . . . . . . . . . . . . . . . . . . . . . . . . . . . . . . . . . . . . . . 2263.8. Summary . . . . . . . . . . . . . . . . . . . . . . . . . . . . . . . . . . . . . . . . . . . . . . . . . . . . . . . . . . . . . . . . . . . . 227
4. Monatomic chains: bond length, strength and maximal strain. . . . . . . . . . . . . . . . . . . . . . . . . . . . . . 2284.1. Observations . . . . . . . . . . . . . . . . . . . . . . . . . . . . . . . . . . . . . . . . . . . . . . . . . . . . . . . . . . . . . . . . . 228
4.1.1. Temperature dependence of maximal strain . . . . . . . . . . . . . . . . . . . . . . . . . . . . . . . . 2284.1.2. Theoretical approaches. . . . . . . . . . . . . . . . . . . . . . . . . . . . . . . . . . . . . . . . . . . . . . . . . . 2294.2. T-BOLS derivatives. . . . . . . . . . . . . . . . . . . . . . . . . . . . . . . . . . . . . . . . . . . . . . . . . . . . . . . . . . . . . . 230
4.2.1. Chain melting energetics . . . . . . . . . . . . . . . . . . . . . . . . . . . . . . . . . . . . . . . . . . . . . . . . 2304.2.2. Elasticity and extensibility . . . . . . . . . . . . . . . . . . . . . . . . . . . . . . . . . . . . . . . . . . . . . . . 2304.2.3. Maximum strain . . . . . . . . . . . . . . . . . . . . . . . . . . . . . . . . . . . . . . . . . . . . . . . . . . . . . . . 2314.3. Bonding identities quantification . . . . . . . . . . . . . . . . . . . . . . . . . . . . . . . . . . . . . . . . . . . . . . . . . 232
4.3.1. Atomic equilibrium distance . . . . . . . . . . . . . . . . . . . . . . . . . . . . . . . . . . . . . . . . . . . . . 2324.3.2. Binding energy and thermal stability . . . . . . . . . . . . . . . . . . . . . . . . . . . . . . . . . . . . . . 2324.3.3. The breaking limit and the specific heat . . . . . . . . . . . . . . . . . . . . . . . . . . . . . . . . . . . . 2334.3.4. Criteria for MC formation. . . . . . . . . . . . . . . . . . . . . . . . . . . . . . . . . . . . . . . . . . . . . . . . 2344.4. Summary . . . . . . . . . . . . . . . . . . . . . . . . . . . . . . . . . . . . . . . . . . . . . . . . . . . . . . . . . . . . . . . . . . . . 235
5. Nanotubes and nanowires . . . . . . . . . . . . . . . . . . . . . . . . . . . . . . . . . . . . . . . . . . . . . . . . . . . . . . . . . . . 2355.1. C–C bond in single-walled carbon nanotubes . . . . . . . . . . . . . . . . . . . . . . . . . . . . . . . . . . . . . . . 236
5.1.1. Modulus measurement. . . . . . . . . . . . . . . . . . . . . . . . . . . . . . . . . . . . . . . . . . . . . . . . . . 2365.1.2. Thermal stability. . . . . . . . . . . . . . . . . . . . . . . . . . . . . . . . . . . . . . . . . . . . . . . . . . . . . . . 2375.2. T-BOLS derivatives. . . . . . . . . . . . . . . . . . . . . . . . . . . . . . . . . . . . . . . . . . . . . . . . . . . . . . . . . . . . . 237
5.2.1. C–C bond identities . . . . . . . . . . . . . . . . . . . . . . . . . . . . . . . . . . . . . . . . . . . . . . . . . . . . 2375.2.2. Superplasticity of CNT . . . . . . . . . . . . . . . . . . . . . . . . . . . . . . . . . . . . . . . . . . . . . . . . . . 2385.3. Multi-walled CNT . . . . . . . . . . . . . . . . . . . . . . . . . . . . . . . . . . . . . . . . . . . . . . . . . . . . . . . . . . . . . 2395.4. Nanowires . . . . . . . . . . . . . . . . . . . . . . . . . . . . . . . . . . . . . . . . . . . . . . . . . . . . . . . . . . . . . . . . . . . . 240
5.4.1. Elasticity and strength . . . . . . . . . . . . . . . . . . . . . . . . . . . . . . . . . . . . . . . . . . . . . . . . . . 2405.4.2. Nanowire superplasticity: bond unfolding . . . . . . . . . . . . . . . . . . . . . . . . . . . . . . . . . . 2405.4.3. Breaking modes of nanowires . . . . . . . . . . . . . . . . . . . . . . . . . . . . . . . . . . . . . . . . . . . . 242
5.5. Summary . . . . . . . . . . . . . . . . . . . . . . . . . . . . . . . . . . . . . . . . . . . . . . . . . . . . . . . . . . . . . . . . . . . . 243
6. Nanograins: I. Elasticity and extensibility . . . . . . . . . . . . . . . . . . . . . . . . . . . . . . . . . . . . . . . . . . . . . . 2446.1. Existing approaches. . . . . . . . . . . . . . . . . . . . . . . . . . . . . . . . . . . . . . . . . . . . . . . . . . . . . . . . . . . . 244
6.1.1. Size dependence . . . . . . . . . . . . . . . . . . . . . . . . . . . . . . . . . . . . . . . . . . . . . . . . . . . . . . . 2446.1.2. Temperature dependence. . . . . . . . . . . . . . . . . . . . . . . . . . . . . . . . . . . . . . . . . . . . . . . . 2446.2. T-BOLS considerations. . . . . . . . . . . . . . . . . . . . . . . . . . . . . . . . . . . . . . . . . . . . . . . . . . . . . . . . . . 245
6.2.1. Elasticity and extensibility . . . . . . . . . . . . . . . . . . . . . . . . . . . . . . . . . . . . . . . . . . . . . . . 2456.2.2. Debye temperature . . . . . . . . . . . . . . . . . . . . . . . . . . . . . . . . . . . . . . . . . . . . . . . . . . . . . 2466.2.3. Specific heat capacity . . . . . . . . . . . . . . . . . . . . . . . . . . . . . . . . . . . . . . . . . . . . . . . . . . . 2476.3. Predictions and applications. . . . . . . . . . . . . . . . . . . . . . . . . . . . . . . . . . . . . . . . . . . . . . . . . . . . . 248
6.3.1. Elasticity and extensibility . . . . . . . . . . . . . . . . . . . . . . . . . . . . . . . . . . . . . . . . . . . . . . . 2486.3.2. Size and temperature dependence. . . . . . . . . . . . . . . . . . . . . . . . . . . . . . . . . . . . . . . . . 2496.3.3. Debye temperature and specific heat . . . . . . . . . . . . . . . . . . . . . . . . . . . . . . . . . . . . . . 2516.4. Summary . . . . . . . . . . . . . . . . . . . . . . . . . . . . . . . . . . . . . . . . . . . . . . . . . . . . . . . . . . . . . . . . . . . . 254
7. Nanograins: II. Plastic deformation and yield strength . . . . . . . . . . . . . . . . . . . . . . . . . . . . . . . . . . . . 254
182 C.Q. Sun / Progress in Materials Science 54 (2009) 179–307
7.1. Observations – Hall–Petch relationship . . . . . . . . . . . . . . . . . . . . . . . . . . . . . . . . . . . . . . . . . . . . 2547.2. Understanding at the mesoscopic level . . . . . . . . . . . . . . . . . . . . . . . . . . . . . . . . . . . . . . . . . . . . 256
7.2.1. HPR–I – linear hardening . . . . . . . . . . . . . . . . . . . . . . . . . . . . . . . . . . . . . . . . . . . . . . . . 2577.2.2. IHPR–II – HPR deviation. . . . . . . . . . . . . . . . . . . . . . . . . . . . . . . . . . . . . . . . . . . . . . . . . 2577.2.3. IHPR–III – softening . . . . . . . . . . . . . . . . . . . . . . . . . . . . . . . . . . . . . . . . . . . . . . . . . . . . 2577.2.4. HPR–IHPR transition. . . . . . . . . . . . . . . . . . . . . . . . . . . . . . . . . . . . . . . . . . . . . . . . . . . . 2587.2.5. Strongest grain size estimation . . . . . . . . . . . . . . . . . . . . . . . . . . . . . . . . . . . . . . . . . . . 2597.2.6. Tm(Kj) dependent IHPR . . . . . . . . . . . . . . . . . . . . . . . . . . . . . . . . . . . . . . . . . . . . . . . . . . 259
7.3. LBA and T-BOLS approach: dual competition . . . . . . . . . . . . . . . . . . . . . . . . . . . . . . . . . . . . . . . 2597.4. Applications . . . . . . . . . . . . . . . . . . . . . . . . . . . . . . . . . . . . . . . . . . . . . . . . . . . . . . . . . . . . . . . . . . 261
7.4.1. Strongest sizes in the IHPR . . . . . . . . . . . . . . . . . . . . . . . . . . . . . . . . . . . . . . . . . . . . . . 2617.4.2. TC for phase transition . . . . . . . . . . . . . . . . . . . . . . . . . . . . . . . . . . . . . . . . . . . . . . . . . . 2617.4.3. Strongest grain sizes estimation . . . . . . . . . . . . . . . . . . . . . . . . . . . . . . . . . . . . . . . . . . 2627.4.4. Factors dominating the strongest size. . . . . . . . . . . . . . . . . . . . . . . . . . . . . . . . . . . . . . 2647.4.5. Size effect on TC(x) and Tm(x). . . . . . . . . . . . . . . . . . . . . . . . . . . . . . . . . . . . . . . . . . . . . 2647.4.6. Quasimolten state and superplasticity . . . . . . . . . . . . . . . . . . . . . . . . . . . . . . . . . . . . . 266
7.5. Correlation between elasticity and hardness. . . . . . . . . . . . . . . . . . . . . . . . . . . . . . . . . . . . . . . . 2667.6. Summary . . . . . . . . . . . . . . . . . . . . . . . . . . . . . . . . . . . . . . . . . . . . . . . . . . . . . . . . . . . . . . . . . . . . 268
8. Atomic vacancy, nanocavity, and metallic foams . . . . . . . . . . . . . . . . . . . . . . . . . . . . . . . . . . . . . . . . . 268
8.1. Observations . . . . . . . . . . . . . . . . . . . . . . . . . . . . . . . . . . . . . . . . . . . . . . . . . . . . . . . . . . . . . . . . . 2688.1.1. Atomic vacancies and point defects. . . . . . . . . . . . . . . . . . . . . . . . . . . . . . . . . . . . . . . . 2688.1.2. Nanocavity . . . . . . . . . . . . . . . . . . . . . . . . . . . . . . . . . . . . . . . . . . . . . . . . . . . . . . . . . . . 2698.1.3. Nanoporous foams . . . . . . . . . . . . . . . . . . . . . . . . . . . . . . . . . . . . . . . . . . . . . . . . . . . . . 2718.1.4. Theoretical approaches. . . . . . . . . . . . . . . . . . . . . . . . . . . . . . . . . . . . . . . . . . . . . . . . . . 273
8.2. BOLS consideration: defects induced strain and trapping . . . . . . . . . . . . . . . . . . . . . . . . . . . . . 275
8.2.1. Critical hollow-sphere size: total energy storage . . . . . . . . . . . . . . . . . . . . . . . . . . . . . 2758.2.2. Elasticity and thermal stability . . . . . . . . . . . . . . . . . . . . . . . . . . . . . . . . . . . . . . . . . . . 2768.2.3. Plasticity and IHPR . . . . . . . . . . . . . . . . . . . . . . . . . . . . . . . . . . . . . . . . . . . . . . . . . . . . . 2778.3. Summary . . . . . . . . . . . . . . . . . . . . . . . . . . . . . . . . . . . . . . . . . . . . . . . . . . . . . . . . . . . . . . . . . . . . 278
9. Compounds and nanocomposites . . . . . . . . . . . . . . . . . . . . . . . . . . . . . . . . . . . . . . . . . . . . . . . . . . . . . 2789.1. Observations . . . . . . . . . . . . . . . . . . . . . . . . . . . . . . . . . . . . . . . . . . . . . . . . . . . . . . . . . . . . . . . . . 278
9.1.1. Multilayers and nanocomposites . . . . . . . . . . . . . . . . . . . . . . . . . . . . . . . . . . . . . . . . . . 2789.1.2. Compounds and alloys . . . . . . . . . . . . . . . . . . . . . . . . . . . . . . . . . . . . . . . . . . . . . . . . . . 2809.2. BOLS considerations: interface effects . . . . . . . . . . . . . . . . . . . . . . . . . . . . . . . . . . . . . . . . . . . . . 281
9.2.1. Interface trapping, charge and energy densification. . . . . . . . . . . . . . . . . . . . . . . . . . . 2819.2.2. Evidence for interface bond contraction . . . . . . . . . . . . . . . . . . . . . . . . . . . . . . . . . . . . 2829.2.3. Bond nature alteration . . . . . . . . . . . . . . . . . . . . . . . . . . . . . . . . . . . . . . . . . . . . . . . . . . 2839.3. Summary . . . . . . . . . . . . . . . . . . . . . . . . . . . . . . . . . . . . . . . . . . . . . . . . . . . . . . . . . . . . . . . . . . . . 284
10. Concluding remarks . . . . . . . . . . . . . . . . . . . . . . . . . . . . . . . . . . . . . . . . . . . . . . . . . . . . . . . . . . . . . . . . 28410.1. Attainment. . . . . . . . . . . . . . . . . . . . . . . . . . . . . . . . . . . . . . . . . . . . . . . . . . . . . . . . . . . . . . . . . . 28410.2. Limitations. . . . . . . . . . . . . . . . . . . . . . . . . . . . . . . . . . . . . . . . . . . . . . . . . . . . . . . . . . . . . . . . . . 28710.3. Prospects . . . . . . . . . . . . . . . . . . . . . . . . . . . . . . . . . . . . . . . . . . . . . . . . . . . . . . . . . . . . . . . . . . . 288
Note added in proof – superfluidity and supersolidity of 4He crystal . . . . . . . . . . . . . . . . . . . . . . . . 290Acknowledgements . . . . . . . . . . . . . . . . . . . . . . . . . . . . . . . . . . . . . . . . . . . . . . . . . . . . . . . . . . . . . . . . 290References . . . . . . . . . . . . . . . . . . . . . . . . . . . . . . . . . . . . . . . . . . . . . . . . . . . . . . . . . . . . . . . . . . . . . . . 290
Nomenclature
x the angular frequencyl atomic magnetic momentumb compressibility/extensibilityg1 specific heat per coordinateg2 thermal energy per coordinate for evaporating a molten atomhD Debye temperaturecd energy density gaincf atomic residual cohesive energyai(T) temperature dependent thermal expansion coefficient (TEC)cij atomic proportion in the ith atomic shell over the entire solid of size Dj
cqj Grüneisen mode parametercs surface tension or surface energyAFAM atomic force acoustic microscopyAFM atomic force microscopyBBB Bond–band–barrierBOLS Bond order–length–strengthCi(zi) CN dependent bond contraction coefficientCN(z) coordination numbercv(T/hD) Debye specific heatDFT density functional theoryDOS density-of-stateEB atomic cohesive energy/vacancy formation energyEb cohesive energy per bondEF Fermi energyEXAFS extended X-ray absorption fine structure spectroscopyGB grain boundaryGIXR grazing incidence X-ray reflectivityIHPR inverse Hall–Petch relationshipkB Boltzmann constantKj dimensionless form of the radius of a sphere or the thickness of a plateLBA local bond averageMC monatomic chainMD molecular dynamicsMWCNT multi-walled carbon nanotubeNW nanowireP stressQ(Kj) measurable quantity of a nanosolidSAW surface acoustic waveSEM scanning electron microscopySTM/S scanning tunneling microscopy/spectroscopySWCNT single-walled carbon nanotubeT-BOLS temperature dependent bond order–length–strength correlationTC critical/Curie temperatureTEM transition electronic spectroscopyTm melting pointU(T/hD) atomic vibration/internal energyUHV ultra-high-vacuumUPS ultraviolet photoelectron spectroscopyti atomic volume of the specific ith atomVLEED very-low-energy electron diffractionXANES X-ray absorption near edge spectroscopyXPD/S X-ray photoelectron diffraction/spectroscopyY Young’s modulus
C.Q. Sun / Progress in Materials Science 54 (2009) 179–307 183

184 C.Q. Sun / Progress in Materials Science 54 (2009) 179–307
1. Introduction
� Monatomic chains, nanotubes, nanowires, solid and liquid surface skins, nanocavities, and grains innanometer and micrometer regimes share considerable similarities in the mechanical behavior and tem-perature dependence, which are indeed fascinating.� Questions and emerging problems due to the change of solid size and operation temperature form a great
challenge to existing continuum and quantum approximations.� The impact of bond order deficiency is significant to nanostructures.� A new approach combining theory and experiment from the perspective of bond formation, dissociation,
relaxation and vibration is highly desirable.
1.1. Scope
The report starts in Section 1 with a brief overview on the unusual mechanical behavior of the mes-oscopic systems including monatomic chains (MCs), nanotubes (NTs), nanowires (NWs), solid and li-quid surface skins, nanocavities, and solids in nanometer and micrometer regimes. A brief summarywill be given outlining existing questions and emerging problems that pose a challenge to a consistentunderstanding that can be expressed quantitatively and analytically. Section 2 presents theoreticalconsiderations of the local bond average (LBA) and the often-overlooked effect of broken bonds onthe behavior of the remaining bonds of the under-coordinated atoms that follows the recently devel-oped bond order–length–strength (BOLS) correlation mechanism [1]. In order to deal with the size andtemperature dependence of the mechanical properties of the mesoscopic systems, the BOLS correla-tion has been extended to include temperature, as the thermal stimulus directly affects the lengthand strength of the bond through thermal expansion and thermal vibration. Sections 3–9 extendthe analytical solutions to the functional dependence of mechanical properties in various situationson the bonding identities and temperature dependence. Solutions have been applied to typical situa-tions in which the size and temperature dependence of the intrinsic behaviors, such as elasticity andextensibility, and the plasticity in which extrinsic factors may dominate. Wherever possible, existingmodeling considerations and understandings from various perspectives are discussed comparatively.The survey and the LBA analysis showed consistently that the shortened and strengthened bonds ofthe under-coordinated atoms dictate the behavior of a mesoscopic substance, which is quite differentfrom that of its isolated constituent atoms or its bulky counterpart. Agreement between predictionsand experimental observations on the mechanical properties of monatomic chains, solid and liquidsurface skins, nanotubes, nanowires, nanocavities, and the inverse Hall–Petch relationship (IHPR)has been realized with improved understanding of the commonly intrinsic origin behind the observa-tions from the perspective of LBA in the cases where the broken bonds become dominant. Chemisorp-tion-induced surface stress and its effect on the surface tension of metallic liquids are also discussedfrom the perspective of charge repopulation and polarization upon adsorbate bond making. The LBAtreatment in terms of bonding energetics has led to quantitative information about bonding identitiesand an improved understanding of the factors governing the intrinsically mechanical performance ofmesoscopic systems. Artifacts are shown to be very important in the indentation test of plastic defor-mation and hence the observed IHPR is suggested to arise from the competition between the intrinsicand the extrinsic contributions. The inner surface of nanocavities is intrinsically the same as the outersurface of a nanosolid or the flat surface of a bulk solid in determining the mechanical properties andthermal stabilities of the porous structures. Atomic vacancies of nanocavities play dual roles in deter-mining the mechanical properties. The broken-bond-induced strain and trapping surrounding the de-fects serve as centers inhibiting motion of atomic dislocations, but the pores provide sites thatinitialize structure failure in plastic deformation. The interface bond strain and the associated pinningor trapping and the bond nature alteration upon alloy or compound formation should be responsiblefor the mechanical strengthening of the twin grains and interface mixing. Section 10 presents a dis-cussion on the attainments and limitations of the present approaches. The prospects of further exten-sion of the developed approaches to atomic defects, impurities, adsorbed surfaces, liquid surfaces,junction interfaces, and systems under other stimuli such as pressure, electronic and magnetic fields

C.Q. Sun / Progress in Materials Science 54 (2009) 179–307 185
are briefly addressed. Some open problems and continuing challenges, regarding plastic deformationin particular, are also highlighted in the last section. For the readers’ convenience, a summary of thekey ideas is listed at the beginning of each section.
1.2. Overview
1.2.1. FundamentalsAs the bridge between the atomistic and macroscopic scales, the mesoscopic systems have at-
tracted tremendous interest in recent years because of their intriguing properties from a basic scien-tific viewpoint, as well as from their great potential in upcoming technological applications such asnanomechanoelectronic devices [2]. The significance of a mesoscopic specimen is the tunability inphysical properties compared with the corresponding more bulky samples of which the proportionof the under-coordinated surface atoms is negligible. The coordination deficiency makes the meso-scopic systems differ substantially from the isolated atoms of their constituent elements or the corre-sponding bulk counterparts in performance. Because of the reduction of mean atomic coordinationnumbers (CNs), mesoscopic systems display novel mechanical, thermal, acoustic, optical, electronic,dielectric, and magnetic properties [1,3–5]. Unfortunately, the unusual behavior of a nanostructuregoes beyond the expectation and description of the classical theories in terms of the continuum med-ium mechanics and the statistic thermodynamics. The quantities such as the Young’s modulus and theextensibility of a solid remain no longer constant but change with the solid size. In general, themechanical properties of a solid vary with the temperature and pressure of operation. Thermal soft-ening and pressure hardening are very common. It is fascinating that the new degree of the freedomof size and its combination with temperature or pressure not only offer us opportunities to tune thephysical properties of a nanosolid but also allow us to gain information that may be beyond the scopeof conventional approaches.
In dealing with the mechanical behavior of the mesoscopic systems, the following concepts couldbe of importance:
� Surface energetics can be categorized as follows: (i) excessive energy stored per unit area of the sur-face skin of a certain thickness, (ii) residual cohesive energy per discrete atom at the surface uponbond breaking and, (iii) the conventional definition of surface energy that refers to energy con-sumed (loss) for making a unit area of surface.
� Surface stress (P) is the change of surface energy with respect to surface strain, corresponding to thefirst order differential of the binding energy with respect to volume. Surface stress, being the samein dimension (in unit of J/m3 or N/m2) to surface energy and hardness (H), reflects intrinsically theinternal energy response to volume change at a given temperature. Hardness is the ability of onematerial to resist being scratched or dented by another in plastic deformation. The stress oftenapplies to elastic regime while the hardness or flow stress applies to plastic deformation wherecreeps, grain glide, dislocation movements, and strain gradient work hardening are competitivelyinvolved [6,7].
� Elastic bulk modulus (B) is the second order differential of the binding energy with respect to vol-ume strain and is proportional to the sum of binding energy per unit volume from the perspectivesof both dimensionality and rigorous solutions. Differing from the definition of bulk modulus,Young’s modulus (Y) gives the elastic response of a material to an applied uni-axial stress and istherefore directionally dependent on the orientation of the defect structure and/or crystal. Young’smodulus represents the stiffness of the material, which correlates with the atomic structure. The Yvalue also relates to other quantities such as Debye temperature, sound velocity, specific heat atconstant volume, and the thermal conductivity of a substance.
� Compressibility (b, also called extensibility) is theoretically proportional to the inverse of modulus.The stiffness of a specimen refers to its elastic strength that is the product of Young’s modulus andthe thickness of the specimen; the toughness of a specimen refers to its plastic strength thatinvolves activation and inhibition of atomic dislocations motion, bond unfolding, grain gliding

186 C.Q. Sun / Progress in Materials Science 54 (2009) 179–307
and work hardening during deformation. A specimen that is stiffer may not be tougher, and viceversa, although both the elastic and the plastic strength are in principle proportional to the bindingenergy density.
� Surface tension (s) referring to the surface energy of a liquid phase is one of the important physicalquantities that control the growth of a material on a substrate as well as different phenomena at aliquid surface, such as coalescence, melting, evaporation, phase transition, crystal growth, and soon. Temperature dependence of the surface tension gives profound information in particular forthe surfaces with adsorbed molecules or with multi components for alloying or compound forming.
� Critical temperatures (TC) represent the thermal stability of a specimen such as solid–liquid, liquid–vapor, or ferromagnetic, ferroelectric, and superconductive phase transitions, or glass transition inamorphous states.
From an experimental point of view, the values of the bulk modulus B and pressure P can be mea-sured by equilibrating the external mechanical stimulus to the responses of the interatomic bondingof the solid
P ¼ FA¼ E
V/ � ouðrÞ
oV; B ¼ P
DV=V¼ V
oPoV
����r¼d
/ Vo2uðrÞoV2
�����r¼d
; b ¼ oVVoP
¼ B�1
where the parameters P, F, V, and A correspond to stress, force, volume, and the area on which the F isacting, respectively. The function u(r) is a pairing potential for two atoms and r is the atomic distance.At equilibrium atomic distance d, P is zero if the external stress by the ambient pressure is neglected.
It is readily proved that the P, B and Y are proportional to the binding energy per unit volume
½P� / ½B� / ½Y� / Eb
d3 ð1Þ
Eb is the cohesive energy per bond at equilibrium atomic distance d. We used the proportional relationherewith because we will pursue the relative change of P and B with respect to the given bulk values.According to the LBA (more details in Section 2.1) approach, [8] the elasticity and stress of a specimencan be related to the bond length (volume) and the bond energy of the representative bonds, as thenature and the total number of bonds in the given specimen do not change during measurement un-less phase transition occurs.
From an atomistic and dimensional point of view, the terms of B, Y, and P as well as the surface ten-sion and surface energy are the same in dimension (Jm�3) because they are all intrinsically proportionalto the sum of bond energy per unit volume. The numerical expressions in Eq. (1) apply in principle to anysubstance in any phase and processes including elastic, plastic, recoverable, or non-recoverable defor-mation without contribution from extrinsic artifacts. The fact that the hardness for various carbonmaterials, silicon, and SiC [9] varies linearly with elastic modulus may provide evidence for this relation.Nanoindentation revealed that the hardness and modulus of Ni films are linearly dependent [10]. How-ever, counter examples may be observed such as polycrystalline metals whose Young’s modulus isessentially independent of grain size, but whose hardness varies following the inverse Hall–Petch rela-tionship (IHPR) [11] because the involvement of artifacts as extrinsic factors becomes dominant in thecontact measurement for the latter. Artifacts such as purity, strain rate and hence creep rate, load scaleand direction, will come into play as an addition. The artifacts are unavoidable in some measurementmethods such as nanoindentation or the Vickers microhardness test. It will be shown in Section 7 thatcontributions of such artifacts are more significant to nanograins than to the surfaces of thin films.Therefore, the measured results are a collection of intrinsic and extrinsic changes of the mechanical per-formance, which make it difficult to discriminate intrinsic information from extrinsic contributions tothe mechanical behavior of the mesoscopic systems.
Many techniques have been developed to measure the Young’s modulus and the stress of the mes-oscopic systems [12,13]. Besides the traditional Vickers microhardness test, techniques mostly usedfor nanostructures are tensile test using an atomic force microscope (AFM) cantilever, a nanotensiletester, a transmission electron microscopy (TEM) based tensile tester, an AFM nanoindenter, anAFM three-point bending tester, an AFM wire free-end displacement tester, an AFM elastic–plastic

C.Q. Sun / Progress in Materials Science 54 (2009) 179–307 187
indentation tester, and a nanoindentation tester. Surface acoustic waves (SAWs), ultrasonic waves,atomic force acoustic microscopy (AFAM), and electric field induced oscillations in AFM and in TEM,are also used. Comparatively, the methods of SAWs, ultrasonic waves, field induced oscillations, andAFAM could minimize the artifacts because of their nondestructive nature though these techniquescollect statistic information from responses of all the chemical bonds involved. Han et al. [14] havegiven a comprehensive review on the in situ microscopic measurement of the elastic modulus of nano-wires and nanotubes.
1.2.2. ChallengesA huge experimental database has been generated in mesoscopic mechanics in past decades. As the
mesoscopic mechanics is an emerging field of study, fundamental progress is lagging far behind theexperimental exploitations. Many questions and challenges are still open for discussion. A few typicalsamples regarding the mechanical puzzles of the mesoscopic systems are summarized in thefollowing.
(i) Size dependence of elasticity and strength
Measurements have revealed that the elasticity and the strength of a nanosolid changes with so-lid size exhibiting three seemingly conflicting trends, as summarized in Table 1. Sophisticated the-oretical models have been developed from various perspectives to explain the intriguing mechanicalperformance of the mesoscopic systems. For instances, the elastic response and mechanical strengthof nanostructures have been attributed to the nonlinear effects [15], surface reconstruction [16] andrelaxation [17,18], surface stress or surface tension [19–23], excessive surface and edge stress [24],surface shell high compressibility [25], dislocation starvation [26,27], the stochastic of dislocationsource lengths [28], mismatch stress [29], grain volume relaxation [30], competition betweenbond loss and bond saturation [31], and stronger bonds of the under-coordinated atoms [32–34].
Table 1A summary of the experimentally observed changes in elastic modulus or mechanical strength at a surface or for a nanosolid uponsize reduction with respect to the bulk values
Observed trends Specimens and references Methods used
Hardening TiCrN [40], AlGaN [41], a-C, and a- C:N surface[42,43] NanoindentationNi [44,45], Ag, Ni, Cu, Al a2-TiAl and c-TiAl surfaces [46]Au and Ag films [47]TiC, ZrC, and HfC surfaces [48]Nanograined steel [49] AFMZnO nanobelts [50–52] wires [53], and surface [54,55]Ag wires [56] SAWPoly(L-lactic acid) (PLLA) fibers [57] DFTSiTiN fibers [58] AFMAu–Au bond [59]SWCNT, MWCNT, and SiC wire [60]CNT spun fibers [61] NanoindentationAg and Pd wires [62]GaN wires [63]
Softening Ni surface [61] and nanocrystals [25] AFAMPolymer surface [64] AFMPolystyrene surface [65]ZnO nanobelts/wires [66–69] AFM three-point bendingCr [70] and Si [71] nanocantilevers AFMZnS nanofilaments [72] Force deflection spectroscopy
Retention or irregularity ZnS nanobelts hardness increase yet elasticity decreases [73] AFMAu wires [74]SiO2 wires [75]Silver nanowires [76] Nanoindenter20–80 nm Ge wires [77]

188 C.Q. Sun / Progress in Materials Science 54 (2009) 179–307
Large-scale atomistic simulations [35,36] of the plastic deformation of nanocrystalline materials sug-gest that both the inter- and intra-granular deformation processes under uni-axial tensile and nano-indentation are leading conditions. In the scoping studies, [37,38] various parametric effects on thestress state and kinematics have been quantified. The considered parameters include crystal orien-tation (single slip, double slip, quadruple slip, and octal slip), temperature, applied strain rate, spec-imen size, specimen aspect ratio size, deformation path (compression, tension, shear, and torsion),and material (Ni, Al, and Cu). Although the thermodynamic force (stress) varies at different sizescales, the kinematics of deformation is found to be very similar based on atomistic simulations,finite element simulations, and physical experiments. Atomistic simulations, that inherently includeextreme strain rates and size scales, give results that agree with the phenomenological attributes ofplasticity observed in macro scale experiments. These include strain rate dependence of the flowstress into a rate independent regime, approximate Schmidt type behavior; size scale dependenceon the flow stress, and kinematic behavior of large deformation plasticity. However, an atomisticunderstanding and analytical expressions in terms of the intrinsically key factors for the size andtemperature dependence of the strength and extensibility of nanostructures are yet lacking thougha recent molecular dynamics (MD) simulation [39] suggests that surface atoms play an important,yet unclear, role in mesomechanics.
(ii) Surface energetics, strength, and thermal stability
Normally, the surface skin of an inorganic solid is harder at temperatures far below the meltingpoint (Tm) but the hard skin melts more easily in a shell-resolved manner [78,79]. For Si(111) surface(Tm = 1687 K), surface pre-melting is initiated in the temperature range 1473–1493 K at surface stepbunches and boundaries of step-free regions [80]. However, surface hardening does not occur so oftenfor specimens with lower Tm values. In comparison, the surface of a liquid solidifies first associatedwith lattice contraction and crystallization in the outermost atomic layers [81]. Although a critical-depth mechanism [82,83] has been developed to ascribe the surface hardening as a surface effect,strain gradient work hardening, and non-dislocation mechanisms of deformation [84], these phenom-ena appear beyond the scope of classical theory considerations in terms of entropy, enthalpy, or freeenergy. An atomic scale understanding of the origin of surface tension and its temperature and adsor-bate dependence is highly desirable [85,86]. Furthermore, conventional definition of surface energet-ics with involvement of classical statistic thermodynamics and continuum medium considerations forlarger scales may need revision because the discrete quantized nature in mesoscopic scales becomesdominant.
(iii) Thermally induced softening
Thermally induced softening of a substance has been widely seen for substances disregarding itsshape and size. Generally, when the testing temperature is raised, the compressibility/extensibility ofthe solid increases rendering the mechanical strength as observed in the cases of nanograined Al [87]and diamond films [88]. At higher temperatures, the bending stiffness and the apparent Young’s modu-lus of diamond beams (wires) are drastically reduced to one third of the initial value before fracture. Theflexural strength and the modulus of the hydrosilylated and condensated curable silicone resins also de-crease when the testing temperature is raised [89]. The yield strength of Mg nanosolid [90] of a given sizedrops when the temperature is increased. An atomic-scale simulation [91] suggests that the material be-comes softer in both the elastic and the plastic regimes as the operating temperature is raised. Whenmeasured at 200 �C, the strength of the 300-nm-sized Cu nanograins is lowered by 15% and the ductilityincreases substantially [92]. The biaxial Young’s modulus of Si(111) and Si(100) was measured to droplinearly when the temperature (T) is increased [93,94]. The Young’s modulus of the TiN/MoxC multilayerfilms drops when the temperature is raised from 100 �C to 400 �C though the modulus increases with thedecrease of the modulation period of the multilayers [95]. An MD investigation suggested that the lon-gitudinal Young’s modulus and the shear modulus for both the armchair and the zigzag nanotubeschange in different trends over the temperature range of 300–1200 K. The Y value drops while the shearmodulus increases as the temperature is increased [96].

C.Q. Sun / Progress in Materials Science 54 (2009) 179–307 189
Detailed examinations have shown that the measured Y values drop nonlinearly at very low tem-peratures and then follow a linear relation at higher temperatures [8,97]. When the operation temper-ature is increased from room temperature to 400 �C, the ductility of the ultrafine-grained FeCo2Vsamples of 100–290 nm size increases from 3% to 13% or even to 22% associated with strength reduc-tion [98]. Superplasticity of individual single-walled CNTs has been observed at elevated temperaturesof �2000 K [99]. The ductility of a nanosolid increases exponentially with temperature up to almostinfinity at Tm. An analytical expression for the thermally driven softening and the thermally enhancedductility is also yet lacking.
(iv) Monatomic chain forming and breaking
A monatomic chain (MC) is an ideal prototype for mechanical testing as no processes of bondunfolding or atomic glide dislocating are involved in the deformation. It is intriguing that at 4.2 Kand under UHV conditions, the breaking length of an Au–Au bond in the Au–MC is measured to be0.23 nm, being 20% shorter than the equilibrium Au–Au distance of 0.29 nm in the bulk [100]. At roomtemperature, the breaking limits were measured to vary from 0.29 nm to 0.48 nm [101]. However, thecontrollable formation of a MC of other metals is rare. Theoretical reproduction of the scattered data ofmeasurement, in particular, the extreme values of 0.23 and 0.48 nm, have been hardly possiblealthough the mechanisms of fuzzy imaging [102], atomistic impurity mediation [2], and charge medi-ation [103] in the state-of-the-art computational approaches have allowed some progress to be made.
(v) Stiffness and stability of nanotubes and nanowires
Carbon nanotubes and compound such as ZnO and SiC nanowires exhibit extremely high strengthyet relatively lower thermal stability compared to their bulk counterparts. The elastic modulus ofthe single-walled CNT (SWCNT) was measured to have values varying from 0.5 to 5.5 TPa dependingon the presumption of the wall thickness of the CNT. The Young’s modulus of the multi-walled CNTs(MWCNTs) drops with the inverse number of walls (or wall thickness) and it is less sensitive to theoutermost radius of the MWCNTs if the wall thickness remains unchanged [104]. Atoms in the openedge of a SWCNT coalesce at 1593 K and a �280% extensibility of the CNT occurs at �2000 K. Underthe flash of an ordinary camera, the SWCNT burns under the ambient conditions. The mechanismsbehind the Y value enhancement, the Tm suppression, and the high temperature superplasticity ofthe CNTs are still puzzling. The uncertainty in the wall thickness and the Young’s modulus of theC–C bond in the SWCNTs have long been issues of challenge, although the atoms that surround de-fects or are located at the tip ends or at the surface are expected to play some unusual, and yet un-clear, roles in dominating the mechanical and thermal responses of the CNTs [62]. A consistentinsight into the mechanism behind these observations from the perspective of under-coordinationis necessary.
(vi) Inverse Hall–Petch relationship
Under a tensile or compressive stress, the hardness or the plastic flow stress of crystals in the sizerange of 100 nm or higher is subject to the classical temperature independent Hall–Petch relationship(HPR) [11]. The hardness increases linearly with the inverse square root of solid size. With further sizereduction, the mechanical strength of the solid continues increasing but deviates from the initially lin-ear HPR until a critical size of the strongest hardness, of the order of 10 nm. At the critical grain size,the slope of the IHPR curve will change from positive to negative and then the nanosolid turns to besofter. Although there is a growing body of experimental evidence pointing to the unusual IHPR defor-mation in the nanometer regime, the underlying atomistic mechanisms behind are yet unclear [11,62].As pointed out by Kumar et al. [38] and Mayrhofer et al. [105] the physical origin of the IHPR transitionhas been a long-standing puzzle. The factors dominating the critical size at which the HPR transits arefar from clear. The HPR–IHPR transition seems to be a topic of endless discussions because of the com-petition between the intrinsic contributions and the extrinsic artifacts that involve the activation andprohibition of grain boundary sliding due to the difficulty of partial dislocation movement.

190 C.Q. Sun / Progress in Materials Science 54 (2009) 179–307
(vii) Vacancy and nanocavity induced hardening and thermal instability
It is expected that atomic vacancies reduce the number of chemical bonds and hence the strengthof a porous material. However, the hardness of a specimen does not follow this simple picture of coor-dination counting. Vacancies not only act as pinning centers inhibiting dislocation motion and thusenhancing the mechanical strength within a certain concentration but also provide sites initiatingstructure failure. An introduction of a limited amount of atomic vacancies or nanocavities could in-deed enhance the mechanical strength of the porous specimen. Atomic vacancies or discretely distrib-uted nanometer-sized cavities could not only enhance the mechanical strength of the specimen, butalso cause a substantial depression of the temperature of melting. Metallic foams of 40–60% mass den-sity are several times harder yet lighter compared with the standard materials, providing new kinds ofmaterials that are lighter and stronger for energy management. However, excessive amount of cavitiesor large pores are detrimental to the mechanical strength of the specimen. For instance, the Young’smodulus of a defected nanotube is reduced gradually with each atomic defect and the plastic strengthof the nanotubes is catastrophically influenced by the existence of just a few atomic defects [106].Understanding the discrepancy between expectations and observations of cavity-induced hardeningand melting is also a challenge.
(viii) Adsorbate-induced surface stress
The surface tension of a liquid drops linearly when the measuring temperature is raised. However,contamination, or adsorption, may change the slope of the temperature coefficient. Adsorbate bondmaking at a solid surface could alter the surface stress in various ways. For instance, hydrogen addi-tion could embrittle the metals and C addition usually induces compressive stress at the surface. Evenon the same surface, different adsorbents such as C, N, O, S, and CO, result in different kinds of stress.The adsorbate-induced stress may change its sign with the coverage of the specific adsorbate. A spe-cific adsorbate may induce different kinds of stress at different faces of the same material. An under-standing of the adsorbate-induced surface stress and its correlation to the adsorbate-induced slopeinflection of the T-dependent surface tension from the perspective of charge polarization and repop-ulation upon bond making is necessary.
(ix) Interface and nanocomposite
Mechanical strengthening of a material can occur by using multilayer formation of different kindsof compounds or by composite formation with nanostructured fillers such as carbon nanotubes, fibers,or clays inserted into the polymer matrix. The roles of the interface mixing, the dissociated interfaceskins, or the hard infillers are yet unclear in the process of nanocomposite reinforcement.
(x) Limitations of the classical and quantum approximations
The physical properties of a macroscopic system can be well described using classical approachesin terms of the Gibbs free energy or the continuum medium mechanics. For instances, the detectablequantities are related directly to the external stimulus such as the temperature (T) and entropy (S),pressure (P) and volume (V), surface area A and surface energy c, chemical potential lI and composi-tion ni, charge quantity q and electric field, magnetic momentum lB and magnetic field etc., withoutneeding consideration of atomistic origin:
GðT; P;A; ni; E; B; . . .Þ ¼ XðST;VP; cA;lini; qE;lBB; . . .Þ
At the atomic scale, quantum effect becomes dominant and the physical properties of a small objectcan be reliably optimized in computations by solving the Schrödinger equations for the behavior ofelectrons or the Newtonian motion of equations for the atoms with a sum of averaged interatomicpotentials as key factors to the single body systems:

C.Q. Sun / Progress in Materials Science 54 (2009) 179–307 191
Hi ¼ Ti þ miðrÞ þ V crystalðr þ RijÞF ¼ �Grad ½Vcrystalðr þ RijÞ� ¼ Mr00
where H is the Hamiltonian and F is the force. Ti is the kinetic energy, ti the intra-atomic potential andVcrystal is the periodic crystal potential. Rij is the atomic distance. M is the mass of the atom.
However, for a small system at the manometer regime, both the classical and the quantum ap-proaches encountered severe difficulties. For instances, the statistics is conducted over a large numberof atoms, N, with a standard deviation that is proportional to N�1/2. Quantities such as the entropy, thevolume, the surface energy, and the chemical potential of a particular element remain no longer con-stant but change with the solid size [107–110]. Quantum approaches are facing the boundary-condi-tion problems that are the core of nanoscience. The broken-bond-induced local strain and skinquantum trapping and the consequent charge, energy, and mass densification in the surface skin playa role of significance [1]. In fact, the real system is atomic site anisotropic, kinetic, with strongly local-ized nature. Describing the effect of skin trapping using an average of interatomic potentials and underthe periodic or free boundary conditions in quantum mechanical approaches may be too ideal. There-fore, to complement the classical and quantum theories, a set of analytical expressions from the per-spective of LBA for the size, temperature, and bond nature dependence of the intrinsic mechanicalproperties of a specimen is necessary.
1.3. Objectives
The main objectives of this report are as following:
(i) To survey recent progress in experimental and theoretical observations on the size and temper-ature dependences of the elastic and plastic deformation of mesoscopic systems includingatomic chains, nanotubes, liquid and solid surface skins, thin films, multilayers, nanocavities,nanograins, and nanocomposites to provide interested readers with the latest and comprehen-sive information.
(ii) To develop analytical solutions for predicative observation of the size, temperature, and bondnature dependence of the intrinsic mechanical behavior of systems from atomic chain to macrospecimen as mentioned above from the perspective of bond formation, dissociation, relaxation,and vibration by extending the recently-developed BOLS correlation theory [1] to the temper-ature domain. It could be possible to employ the LBA approach to connect the macroscopicproperties of a specimen to the atomistic factors (e.g., bond nature, bond order, bond length,and bond strength) of the representative local bonds. We need to establish the functionaldependence of the detectable quantities on the bonding identities and the response of the bond-ing identities to external stimulus such as coordination environment (BOLS effect), temperature(thermal expansion and vibration), and stress field (deformation and deformation energy). Acombination of the LBA approach and the BOLS correlation theory could complement the clas-sical continuum and quantum approaches.
(iii) To gain atomistic insight into the origin of the size and temperature dependence of the meso-scopic mechanics in a ‘‘bottom up” way. Deeper insight into the consequences of bond makingand breaking and a grasp of the factors controlling bond making and bond breaking are neces-sary to improve works in other fields such as nano and microelectronics, catalytic electronics,and nanobiotechnology.
(iv) To find factors dominating the mechanical performance of the mesoscopic systems and theinterdependence of various quantities from the perspective of bond making and bond breakingto provide guideline for nano mechanical device design. Discriminating the intrinsic contribu-tions from the extrinsic artifacts involved in the indentation test may allow us to understandthe correlation between the elastic and the plastic deformations. Importantly, besides the per-formance and its origin, we need to know the trends and the limitations of the changes andinterdependence of various properties.

192 C.Q. Sun / Progress in Materials Science 54 (2009) 179–307
(v) To elucidate information such as single bond energy, maximum strain, in particular, the length,strength, extensibility, breaking limit, specific heat, and melting point of the single bond inmonatomic chains and CNTs, by matching the theoretical predictions to the experimental obser-vations. The new degree-of-freedom of size not only allows one to tune the physical propertiesof a specimen but also provides us with opportunities to gain information such as the energylevels of an isolated atom [111,112] and the vibration frequency of an isolated dimer[113,114]. A combination of the degrees of freedom of size and temperature may allow us togain more information such the cohesive energy per bond in various systems. All these quanti-ties are of elemental importance to surface and materials sciences.
2. Principles
� If one bond breaks, the nearby ones become shorter and stronger. Consequently, local strain and quantumtrapping surrounding the defect are generated with an association of densification of charge, energy andmass nearby the defect.� Bond contraction happens not only to solid and liquid surfaces but also gaseous molecules disregarding
the chemical composition.� Localized densification of charge and energy in the relaxed region contributes to the Hamiltonian and the
bond order loss modifies the atomic cohesive energy, both of which dominate the detectable quantities ofa substance.� Atoms in the surface skins originate the unusual behavior of nanostructures yet atoms in the core interior
remain as they are in the bulk.� The thermally-driven softening arises from bond expansion and bond weakening that follows the temper-
ature integration of the specific heat.� The entire specimen can be viewed as one bond averaged over all the bonds involved.� A detectable quantity can be connected to the averaged bond and its geometrical and energetic response to
the externally applied stimulus such as coordination environment, temperature, pressure, etc.
2.1. Local bond average (LBA)
For a given specimen whether it is crystal, non-crystal, or with defects or impurities being involved,the nature and the total number of bonds do not change under the external stimulus before phasetransition. However, the length and strength of all the involved bonds will response to the externallyapplied stimulus. If the functional dependence of a detectable quantity on the bonding identities isestablished, one would readily be able to know the performance of the entire specimen under externalstimulus by focusing on the response of the length and strength of the representative bonds at differ-ent sites or their average. These considerations form the base of the LBA approach.
The LBA approach is substantially the same to the volume partitioning approximation imple-mented by Delph et al. [115,116] who have opened a way in improving the calculation of local quan-tities through volume partitioning of the problem. The volume averaging provides a reasonable andcorrect way to obtain physically meaningful stress and elastic properties of complex microstructures.They examined the problem of deriving the absolute values of local stress and the corresponding elas-tic constants for a region containing a fixed number of atoms that is part of a large body. By means ofan expansion of the local interatomic potential energy, they derived expressions for the local secondPiola–Kirchoff stress. Using this approach, they have obtained good agreement with the suitably aver-aged continuum solutions in the far-field regime.
Unlike the volume partition approximation, the LBA approach seeks for the relative change of aquantity with respect to the known bulk value under the applied stimulus. The LBA approach focusesmerely on the performance of the local representative bonds disregarding the exact number of bondsthat will not change in the given specimen. The presence of broken bonds, defects, impurities, or thenon-crystallinity will affect the reference values of concern rather than the nature of observations.Contribution from long-order interaction or the high-order coordinates can be simplified by foldingthem into the bonds of the specific atom to the nearest neighbors. The LBA approach may represent

C.Q. Sun / Progress in Materials Science 54 (2009) 179–307 193
the true situations of measurements and theoretical computations that collect statistic informationfrom large number of atoms or bonds. Furthermore, compared with the measurement and computa-tion, the LBA could discriminate the behavior of local bonds at different sites. Furnished with the LBAapproximation, the difficulties encountered by the classical and quantum approaches in particular forthe small object could be readily solved [8].
2.2. The BOLS correlation
The involvement of interatomic bonding distinguishes a bulk specimen in performance from theisolated constituent atoms. Compared to the bulk solid, a nanostructure contains large proportionof under-coordinated atoms. Therefore, interaction between the under-coordinated atoms takes theresponsibility for the unusual behavior of nanostructures. One needs to focus on the bonding betweenthe under-coordinated atoms, as a consequence of bond breaking.
The core idea of the BOLS correlation mechanism [1] is that if one bond breaks, the neighboringones become shorter and stiffer. Consequently, local strain and quantum trapping are formed imme-diately nearby the potential barrier at sites surrounding the broken bonds. The driving force for thebroken-bond-induced bond contraction has been attributed to the smoothing of surface electron den-sity and a resulting electrostatic force that pulls the surface ions towards the bulk [117,118] or to achange in chemical bonding. The local strain and quantum trapping causes a localization and densifi-cation of charge and energy, which modifies the elemental quantities, such as atomic cohesive energy,electro-affinity, Hamiltonian, Young’s modulus, and work function. These quantities dictate thedetectable quantities of a specimen in thermal stability, lattice dynamics, photonic performance, elec-tronic structures, magnetism, dielectrics, and chemical reactivity because of the dominance of inter-action between the under-coordinated atoms. The trapping of charges by the depressed potentialwell also contributes to the transport dynamics of phonons, electrons, and photons because of theadditional trapping sites near the edges [119–121].
The analytical form of the BOLS correlation is given as follows [1]:
CiðziÞ ¼ di=d ¼ 2f1þ exp½ð12� ziÞ=ð8ziÞ�g�1 ðbond-contraction-coefficientÞ
C�mi ¼ Ei=Eb
bond-strengthening-coefficientquantum-trapping-coefficient
� �EI ¼ ziEi ðAtomic cohesive energyÞ
8>>><>>>:
ð2Þ
Subscript i and b denote an atom in the ith atomic layer and an atom in the bulk, respectively. The iis counted from the outermost atomic layer to the centre of the solid up to three, as no bond order lossoccurs for i > 3. The Ci, being the bond contraction coefficient, varies with the effective atomic CN(zi).The di is referred to the bond without specification of direction. The off-plane bond contraction is obvi-ous, yet the in-plane bond contraction will cause surface reconstruction with even cases of atom miss-ing. The index m, however, is an indicator for bond nature of a specific material, which is not freelyadjustable. Previous studies have revealed that, for elemental metals, m = 1; for alloys or compounds,m � 4; and for carbon and silicon, the m has been optimized to be 2.56 [122] and 4.88 [123], respec-tively. For compounds, the m value should change in a continuous way that is to be determined byfitting a quantity varying with the change of both sample size and composition. The m value has beenfound to increase when the zi is smaller than three for the IIIa and IVa elements [124]. The term,zibC�m
i ¼ EC;i=EC;b ¼ zi=zb � Ei=Eb ¼ 1þ Di, is the dimensionless form of atomic cohesive energy beingnormalized by the bulk value with Di being the perturbation to atomic cohesive energy. The zi varieswith the curvature of a solid surface (Kj > 0) or a nanovoid surface (Kj < 0)
Z1 ¼4ð1� 0:75=KjÞ curved-surface4 flat-surface
�Z2 ¼ z1 þ 2Z3 ¼ 12 ð3Þ
The term Kj = Rj/d is the dimensionless form of size, which corresponds to the number of Kj atoms, withmean diameter or bond length d, lined up along the radius Rj of a spherical-like nanosolid or cross the

194 C.Q. Sun / Progress in Materials Science 54 (2009) 179–307
thickness of a thin film. For a spherical dot, the curvature is positive; for a spherical hollow, the cur-vature takes negative values, and z1 = 4 � (1 + 0.75/Kj) with Kj here being the radius of the hollowsphere.
Fig. 1 illustrates the BOLS correlation mechanism using a typical pair potential function. The short-ened atomic distance at equilibrium and the deepened potential well represent the length andstrength of a bond between the under-coordinated atoms. The BOLS extends the ‘‘atomic CN – atomicsize” correlation mechanism of Pauling [125], Goldschmidt [126], and Feibelman [127] to energy do-main. The ‘‘atomic CN – atomic size” correlation holds disregarding the nature of the specific chemicalbond, sample dimension, or the structural phase of the substance [128]. The depressed potential wellshould serve as a trap for the under-coordinated atoms exhibiting the pinning effect [129], whichinhibits atomic glide dislocations and hence enhances the mechanical strength locally.
Excitingly, recent findings [130,131] using a combination of the MD calculations, Pauling’s correla-tion, and the coherent electron diffraction revealed that the Au individual nanocrystals of 3–5 nm indiameter demonstrate inhomogeneous relaxations occurring at the outermost two atomic layers
12 10 8 6 4 20.0
0.4
0.8
1.2
1.6
2.0
Rat
io
Atomic CN (z)
Ci(zi) Ei (m = 1)
Ei (m = 3) Ei (m = 5)
Goldschmidt (1927)
EI (m = 1)
EI (m = 3) EI (m = 5) Feibelman (1996)
a
c
0.6 0.8 1.0 1.2-1.5
-1.0
-0.5
0.0
0.5
η1ι(T
m-T)
C-m
i
η2ι
Ei(0)Ei(T)
Ei(T
m,i)
U(r
)/E
b
ci (di/d)
U(T)/R
b
d
Fig. 1. Illustration of the BOLS correlation. (a) CN dependence of the normalized bond length di/d = Ci(zi), and the CN and bondnature dependence of bond energy Ei=Eb ¼ C�m
i and the atomic cohesive energy EI=EB ¼ zibC�mi . The scattered data are from
Goldschmidt [126] and Feibelman [127]. The Ci(zi) curve also matches the measurement from Au clusters (insert in (d)) [130].(b) Atomic CN-imperfection causes the remaining bonds of the under-coordinated atom to contract from one unit (in d) to Ci
and to increase the cohesive energy per coordinate from one unit (in Eb) to C�mi . Separation between the Ei(T) and the Ei(0) is the
thermal vibration or internal energy, The separation between Ei(T) and Ei = 0 (at evaporation) corresponds to energy for thermalor mechanical rupture of the pairing bond and the elastic modulus. Tmi is the melting point, which is proportional to atomiccohesive energy, ECi. g1i is the specific heat per bond and g2i is 1/zi fold energy required for evaporating an atom in the moltenstate [1]. (c) The BOLS derived nanosolid potential with multi-trap centers and the broken-bond-induced surface traps. (d) Thestrain extends to only the outermost two atomic layers for gold nanoclusters according to measurement and moleculardynamics calculations [130].

C.Q. Sun / Progress in Materials Science 54 (2009) 179–307 195
(Fig. 1d). The broken-bond-induced contraction involves large out-of-plane bond length contractionsfor the edge atoms (�0.02 nm,�7%); a significant contraction (�0.013 nm,4.5%) for {100} surfaceatoms; and a much smaller contraction (�0.005 nm,2%) for atoms in the middle of the {111} facets.EXAFS measurement [132] revealed the same results of coordination dependence of Au–Au bondlength that is independent of the substrate support type. The coordination dependence of Au–Au bondlength determined in Refs. [130,132] coincide exceedingly well to the BOLS curve in Fig. 1a, evidencingthe quantitative accuracy of the BOLS formulation.
Bond contraction between the under-coordinated atoms is not limited to solid or liquid phase. Italso happens to gaseous states. Tsai et al. [133] have succeeded in pushing the Cr centers a little closertogether, creating a Cr2 anion protected by three bidentate amidinate ligands that X-ray crystallogra-phy revealed to have a central bond length of just under 0.174 nm. Meanwhile, Noor et al. [134] pre-pared a neutral Cr2 complex, similarly flanked by bidentate nitrogen ligands (in this case, twoamidopyridines), with a bond length of just below 0.175 nm. For comparison, the solid-phase Cr–Crdistance is 0.255 nm.
These observations and the correlation between the coordination and bond length agree surpris-ingly well with the current BOLS correlation mechanism – bonds between the under-coordinatedatoms are shorter and stronger. However, the observed Au–Au bond length expansion of an Au102 clus-ter coated with thiolated organic ligands [135], should arise from the diffusion of S atoms into the out-ermost atomic layer for Au–S bonding, being the same to oxygen chemisorption.
As a consequence of the surface and edge trapping, transition from conductor to semiconductorcould happen to small clusters, as observed from �3 nm sized Al nano-islands deposited on Si sub-strate [138]. The broken-bond-induced densification and localization of electrons with lowered bind-ing energy in the traps have been observed as defect states [139], chain end states [140,141], terraceedge states [142–144], and surface states [145–147]. Strong localization of excess electrons at the sur-face of ice has also been identified [148].
Upon the sp2 orbital hybridization, three sp2 electrons of each carbon atom form r bonds to theneighboring atoms in a C3v symmetry and the nonbonding unpaired electron of the carbon developsinto the p and p* states at the corner of the Brillouin zone. These electrons are usually delocalizedand dominate the electrical conductivity and the low-temperature thermal conductivity. However,near the edge of surface, these electrons are strongly localized and polarized by the deeply-trappedbonding electrons, see Fig. 2a [149]. The unrolled single-walled carbon nanotubes (SWCNTs) or calledgraphene nanoribbons (GNRs) [150] with open edges have demonstrated intriguing properties thatcannot be seen from the original SWCNTs or the infinitely-large graphene sheets, which has arousedever-increased interest. There are typically two types of GNRs classified by the shapes of edges. One isthe armchair-edged AGNR with larger band gap and semiconductive nature and the other is the zig-zag-edged ZGNR possessing the strongly-localized edge states with energy being at the Fermi level orabove with more metallic feature. The EG is found roughly proportional to the inverse width of theGNRs. The edge states give rise to many unusual phenomena such as the unconventional magnetismthat enables the carbon-only ferromagnetism, spin glass state, half-integer quantum Hall effect, ultra-high electric mobility, and ultrahigh thermal conductivity, nearly zero mass and group velocity of1/300 that of light in vacuum. Recently, Lee et al. [151] measured the elastic properties and intrinsicbreaking strength of freestanding monolayer graphene membranes by nanoindentation in an atomicforce microscope. The intrinsic breaking strength of a defect-free sheet is 42 N m�1, corresponding to aYoung’s modulus of Y = 1.0 TPa, third-order elastic stiffness of D = �2.0 TPa, assuming an effectivegraphene thickness of 0.335 nm. These experiments establish graphene as the strongest material evermeasured.
Fig. 2b shows the low-temperature STS/M probing over Co nanoislands on Cu(111) surface re-vealed that the surface occupied states exhibit a sizable downward energy shift as the island size de-creases associated with bond contraction, providing direct evidence for the edge trapping. It has alsobeen found (insert a) that the lattice constant of the Co islands contracts by 6% from the bulk value of0.251–0.236 nm [152]. Atomic-scale simulations and ab initio calculations demonstrate that the driv-ing force for the observed shift arises from the size-dependent lattice contraction of the islands, beingconsistent with the BOLS prediction. Most strikingly, without igniting electron–phonon interaction orelectron–hole production, STM/S measurement at 4 K revealed that [153] the EG of Si nanorods

Fig. 2. STM/S measurements of (a) the high charge density in the vicinity of Fermi energy at the zigzag-edge of graphenenanoribbon [136]; (b) the site dependence of Co–Co bond length and Co-island size dependence of skin trapping of the valencestates of the Co islands [137].
196 C.Q. Sun / Progress in Materials Science 54 (2009) 179–307
increases from 1.1 eV to 3.5 eV with decreasing the diameter from 7.0 nm to 1.3 nm and that the sur-face Si–Si bond contracts by �12% from the bulk value (0.263 nm) to � 0.23 nm. This finding concursexcitingly with our BOLS premise: CN-imperfection induces the remaining bonds of the lower-coordi-nated atoms to contract spontaneously associated with EG expansion. An STS collects localized EG infor-mation without needing any energetic stimulus. The tip-surface bias (2 eV) is not sufficient to breakthe bond. What happens upon being biased is that the tip introduces holes or electrons into the solidrather than creates electron–hole pairs inside. As such, neither electron excitation nor electron–holepair production or carrier recombination occurs during STS measurement. What contribute to theSTS-EG are states occupied by the covalent bonding electrons and empty states that are strongly local-ized at the probed site. Events such as electron–hole interaction or kinetic energies of the mobile car-riers do not come into play. Without triggering the dictating quantum-confinement factors, STS-EG
continues expanding upon the size being reduced. EG expansion detected using STS may serve as evi-dence for the broken-bond-induced quantum trapping and the associated polarization of the anti-bonding states by the trapped bonding electrons. All these findings may evidence the significanceof the local strain and quantum trapping caused by the broken bond. Therefore, as a rule, the brokenbond, or the dangling bond, may not itself contribute directly to the performance of a substance but itseffect on the remaining ones of the under-coordinated atoms is indeed profoundly significant.
Recent development shows that bond contraction occurs also at an interface, liquid surface, andsites surrounding impurities. For instance, a 10% contraction of spacing between the first and second

C.Q. Sun / Progress in Materials Science 54 (2009) 179–307 197
atomic surface layers has been detected in the liquid phase of Sn [81]. For the three alkalis, Li, Na, andK, first principle calculations suggested that there is a 7% contraction of the first interlayer spacing[154]. Liquid surface layering is quite often for metals [155,156]. For example, X-ray reflectivity mea-surement in the surface normal structure of the Hg liquid–vapor interface reveals that the layeringamplitude decays into the bulk with a characteristic length of 0.3–0.35 nm. The layering for Ga is asthick as 0.6 nm, being attributed to the formation of directional bonds that prevent the close packingachieved by the nearly free electron metals [157]. An X-ray reflectivity study of a molecular liquid, tet-rakis(2-ethylhexoxy) silane revealed that when cooled to T/Tc �0.25 (well above the freezing point forthis liquid), a surface-layered state will appear even in dielectric liquids at sufficiently low tempera-tures, if not preempted by freezing [156]. A three-wave Bragg-surface X-ray diffraction [158] revealedthat the Au/GaAs(001) interface bonds change by �49% along the surface normal [001] direction, anda �27% and a 2% change in the ½�1 �10� and the ½1 �10� in-plane directions, respectively.
Therefore, it is necessary and practical to extend the BOLS correlation mechanism to systems suchas point defects, liquid surfaces, and junction interfaces as well as amorphous glass in which the bondorder loss may take place randomly. A detailed description of the BOLS correlation and its applicationsto the size dependence of nanostructures has been presented in Ref. [1].
2.3. Temperature dependent BOLS
2.3.1. Low temperature approximationWhen the testing temperature is raised or a mechanical stimulus such as a tensile stress field is
applied, the length and the strength of the representative bonds will change. If the effects of atomicCN deficiency, temperature, and stress come into play simultaneously, the length, d(zi,T,P), and thenet energy, Ei(zi,T,P), of the representative bond will change accordingly. Therefore, based on theLBA approach, we can extend the BOLS correlation to temperature and pressure domains, leading tothe T-BOLS correlation
diðzi; T; PÞ ¼ dbðz;0;0Þ � Ci � 1þZ T
0aiðtÞdt
� �� 1þ
Z P
0biðpÞdp
� �
Eiðzi; T; PÞ ¼ Ebðz;0;0Þ � C�mi �
Z T
0g1iðtÞdt þ
Z P
0viðzi; t;pÞdp� vip
� � ð4Þ
where ai(t) is the temperature dependent thermal expansion coefficient (TEC). bi = �ov/(top) is thecompressibility (p < 0, compressive stress) or extensibility (p > 0 tensile stress) that is proportionalto the inverse of elastic bulk modulus. g1i(t) is the T-dependent specific heat per bond that is assumedto follow Debye approximation, cv(T/hD), for a zi-coordinated atom. Generally, the thermal measure-ment is conducted under constant pressure and the g1i(t) should be related to the Cp. However, thereis only a few percent difference between the Cp and Cv [159].
Fig. 3a illustrates the temperature and Debye temperature dependence of the inner bondenergy. In the V–P profile, as illustrated in Fig. 3b, only the gridded part
R p0 viðzi; t; pÞdp
��viP�=v0 ffi ð1� vi=v0ÞP � bP2=2 contributes to the energy density of the entire body if the compress-ibility were assumed as constant [160]. For the single bond, the atomic volume, ti(zi, t,p), is replaced bythe bond length, di(zi, t,p), and the p is replaced by the force, f. Evidence [161] shows that the bi(p) re-mains constant at constant temperature within the regime of elastic deformation and then the inte-gration
R P0 biðpÞdp ¼ biP can be simplified, unless phase transition occurs [162,163]. If the
compressibility varies with pressure, the third-order Birch–Murnaghan isothermal equation of stateis applied [164]
PðVÞ ¼ 3B0
2ðf�7=3 � f�5=3Þ 1þ 3
4ðB00 � 4Þðf�2=3 � 1Þ
�
where B0 is the static bulk modulus and B00 the first-order pressure derivative of the B0; the f = v/t0 isthe ratio of volume of unit cell addressed after and before being compressed.
The ai(t) depends non-linearly on temperature in the low temperature range and the ai(t) decreaseswith the feature sizes of nanostructures [166,167]. EXAFS investigations [168] revealed that in small gold

0.00 0.25 0.50 0.75 1.00 1.25 1.500.0
0.2
0.4
0.6
0.8
1.0 θD= 800K; E
b(0) = 1200K
θD = 400K; E
b(0) = 1200K
Eb(T
)/E
b(0)
T/θD
5 10 15 20 250.9
1.0
i
ba
V/V
0
Pressure (GPa)
Fig. 3. (a) Temperature dependence of bond energy Eb(T)/Eb(0) = 1 � U(T/hD)/Eb(0) with U(T/hD) being the thermal or internalvibration energy per coordinate in the bulk of Debye approximation. Eb(T)/Eb(0) depends linearly on temperature at T > hD/3 andthe slope changes with the Eb(0) values. (b) Typical V–P profile and the pressure induced energy density gain of the entire body,represented by the gridded area in the V–P profile [165].
198 C.Q. Sun / Progress in Materials Science 54 (2009) 179–307
particles, the temperature dependence of the first neighbor distance results is different from that of themacrocrystalline counterpart. In the largest size samples, a reduction of the thermal expansion wasfound, whereas in the smallest ones, the presence of a crossover from an initial thermal expansion to athermal contraction was observed. Calculations [168] suggested that the localization effects that in-crease as the nanoparticle size decreases might be responsible for the thermal effects of nanoparticles.
From the perspective of LBA, the ai(t) for the representative bond can be derived from the differ-ential of the thermal expansion relation [169]
L ¼ L0 1þZ T
0aiðtÞdt
� �and aiðtÞ ffi
dLL0dt
¼ 1L0
oLou
� �dudt/ � gliðtÞ
L0FðrÞ ¼ AðrÞgliðtÞ ð5Þ
with oL/ou = �F�1 is the inverse of interatomic force in dimension at a non-equilibrium atomic dis-tance. The value A(r) = (�L0F(r))�1 can be obtained by matching theory to measurement. The smallerexpansion coefficient for small particles [166–168,170,171] indicates an increased value of the gradi-ent of the interatomic potential, which is consistent with the narrowed shape of the BOLS-relatedinteratomic potential, as given in Fig. 1b. The derived thermal expansion coefficient follows approxi-mately the trend of Debye specific heat, being consistent with experimental observations.
According to a sophisticated modeling [172], the lattice thermal expansion of a cubic crystal couldbe expressed in terms of the Grüneisen mode parameter, cqj, and lattice vibration in the frequency ofxqj
Ddd0¼ aT ¼ �h
3BV
Xqj
cqjxqj nBðxqjÞ þ12
� �/
2KTBVchcqji ðT > hDÞRxD
0 < cqj > f½expð�hx=kTÞ � 1��1 þ 1=2gdx ðelseÞ
(
cqj ¼ �oLnðxqj
oLnðvÞð6Þ
where B is the bulk modulus and V the volume. VC is the volume of the primary unit cell and hcqji theaverage of cqj over all branches of the Brillouin zone. The nB(xqj) is the Bose–Einstein populationfunction.
In fact, Eqs. (5) and (6) are substantially the same following the Debye or Einstein population. Nor-mally, the ai(t > hD) is in the order of 10�(6–7) K�1. A reproduction of the measured thermal expansionof Si and some nitrides according to Eq. (5) is given in Fig. 4. It is clear that the present form is muchsimpler and straightforward without the parameters of B, V, or cqj being involved.
The g1i(t) and the integration of g1i(t) with respect to T, or the conventionally termed internal orvibration energy, U(T/hD), follow the relation

0 400 800 1200 1600
0.0
1.5
3.0
4.5
6.0
7.5α
(10-6
K-1)
T (K)
a
AlN AlN GaN-c
GaN-a Si
3N
4
0 300 600 900 1200 1500
0
1
2
3
4
5
6
( Δa/
a 0)x1
03
T (K)
T-BOLS Si
b
Fig. 4. LBA reproduction (solid lines, Ref. [169]) of the temperature dependence of (a) the TECs of (a) AlN, (Ref. [173]) Si3N4 (Ref.[173]), and GaN (Ref. [171,174]) and (b) thermal expansion of Si, which also agree with the model of Eq. (6) [172].
C.Q. Sun / Progress in Materials Science 54 (2009) 179–307 199
g1iðt=hDÞ ¼cvðT=hDÞ
ziR¼ j2
zi
ThD
� �j Z hD=T
0
xjþ1 expðxÞðex � 1Þ2
dx
UiðT=hDÞ ¼¼R T
0 gliðtÞdt ¼ j ThD
�jþ1 R hD=T0
xjdxex�1
ffiPn>l
ln!
onuðxÞoxn
���x¼0
xn � x2x2=2þ u000ðrÞx3=6þ ðxn>4Þ
8>><>>:
ð7Þ
with x = �hx/kBT and j the dynamic dimensionality considered in transport dynamics (for a sphericaldot, j = 0; for atomic chains and thin wires, j = 1; for thin surface slabs, j = 2; for large bulk, j = 3).The Ui(T/hD) corresponds to the internal bond energy including all acoustic and optical modes of har-monic and inharmonic vibrations. The Ui(T/hD) is the amount of energy for bond weakening.
2.3.2. High temperature and low-stress approximationAt temperature higher than the Debye temperature, the g1(T > hD) equals unity. Also, at sufficient
lower stress, the compressibility approaches constant. Therefore, the absolute value of Ei(zi,T,P) canbe simplified as
Eiðzi; T; PÞ ¼ Eiðzi; 0;0Þ � gliT þ diðzi; T;0Þ½1þ bP=2�P ffiT>hD
g2i þ g1iðTmi � TÞ þ diðzi; t;0Þ½1þ bP=2�P ð8Þ
g2i is the latent heat per coordinate of atomization for an atom in the molten state. At T > hD, the inte-gral will degenerate into the linear relation as given by Nanda [175], Eb(0) = g2 + g1Tm.
Therefore, the magnitude of the net binding energy in Eq. (8) contains three parts: (i) the bindingenergy per bond at 0 K, Ei(zi,0,0); (ii) the internal or thermal energy, Ui(T/hD) = g1iT, and the deforma-tion energy due to the field of stress, di(zi,T,0)[1 + bP/2]P. For an atom, the last two terms have to berevised to zig1iT and di(zi,T,0)[1 + 3bP/2]P because of the three-dimensional nature. It can be estimatedthat the deformation energy is rather small (at 10�1–10�2 eV levels) and it can be neglected in com-parison to the bond energy in the order of 100 eV. Fig. 3a illustrates the temperature dependence of thereduced bond energy for an atom in the bulk. Considering the single bond, one has to divide the valuesby the atomic CN. The Eb(0) and the hD are so important that they determine the slope of the Eb(T)/Eb � T curve and the transition point (about hD/3) at which the Eb(T)/Eb approaches to a linear temper-ature dependence.
It is emphasized that for the bond of an under-coordinated atom, we have a similar form to thestandard case, Ei = g2i + g1iTmi. Because of the relations, Tm / zbEb, Tmi / ziEi, and Ei ¼ c�m
i Eb, we havethe relations of g2i þ g1iTmi ¼ c�m
i ðg2 þ g1TmÞ and
Tmi
Tm¼ zibc�m
i ¼ 1þ Di; c�mi ;
g1i
g1¼ zb
zi¼ zbi ð9Þ

200 C.Q. Sun / Progress in Materials Science 54 (2009) 179–307
for the quantities between the localized and the bulk standard. The Di is the perturbation to atomiccohesion energy. This correlation will be used often in later discussions.
2.3.3. Factors dominating mechanical strengthAs indicated in Eq. (1), the stress and modulus have the same dimension being proportional to the
sum of binding energy per unit volume. According to the expression, mechanical elasticity strengtheningonly takes place once the bond energy increases and/or the bond length contracts. No other factors con-tribute intrinsically. Therefore, a superhard covalent crystal should be reached with the factors of higherbond density or electronic density, shorter bond length, and greater degree of bond covalency [176].
According to Born’s criterion [177], the shear modulus disappears when a solid is in molten state. IfBorn’s criterion holds, the latent heat of atomization, g2, does not contribute to the elasticity. However,an elastic modulus should be present in the liquid and even in the gaseous phases because of the non-zero sound velocity in these phases. The sound velocity depends functionally on the elastic constantand the mass density [178] of the specimen in the form of (Y/q)1/2. As we have demonstrated, the g2
contributes indeed to the extensibility of atomic wires [179]. Measurements [180,181] revealed thatthe tensile strength of alloys drops from the bulk values to approximately zero when the temperatureis approaching Tm. Therefore, Born’s criterion may be more suitable to cover the extensibility and plas-tic yield strength.
Instead of the classical Gibbs free energy ½GðT; P;ni;AÞ ¼ U � TSþ PV þP
lini þ rA�, Helmholtz freeenergies ½FðT;V ;ni;AÞ ¼ U � TSþ PV þ
Plini þ rA�, internal energy UðS;VÞ, or enthalpy
½HðS; PÞ ¼ U þ PV �, or the continuum solid mechanics, we proposed the LBA approach in terms of bondlength and bond energy and their response to atomic CN, temperature, and stress. We also use the re-duced specific heat per bond, Cv(T/hD), without taking into account the classical statistic thermody-namic quantities such as entropy S that is suitable for a body with infinitely large number ofatoms. Neither the chemical potential li for the component ni nor the tension r of a given surfaceare needed in the current approach. Reproduction of the measured temperature dependence of: (i)the redshift of the Raman optical modes [8,114,182], (ii) surface tension [183], (iii) elastic modulus[8], and (iv) lattice expansion [169] may evidence the validity of the current approach of LBA forthe thermally induced mechanical behavior of materials.
2.4. Scaling relations
2.4.1. LBA scaling relationGenerally, the experimentally observed size-and-shape dependence of a detectable quantity, Q, of a
nanosolid follows a scaling relation based on the LBA consideration. The size-induced propertychanges with the inverse of the solid size, Kj [1]:
QðKj; T0Þ � Qð1; T0ÞQð1; T0Þ
¼ bK�1j ðmeasurementÞ
Daj ðtheoryÞ
(
Daj ¼Xi63
cijðDqi=qÞ
cij ¼Ni
Nj¼ Vi
Vj¼ sci
Kj6 1
ð10Þ
For the joint effect of temperature and size, the scaling relation becomes
QðKj; TÞQð1; T0Þ
¼ QðKj; TÞQð1; TÞ �
Qð1; TÞQð1; T0Þ
¼ ð1þ DajÞ �Qð1; TÞQð1; T0Þ
ð11Þ
with Kj being the dimensionless form of size, which is the number of atoms lined along the radius ofthe jth sphere or cross the thickness of the jth thin plate. Ni is the number of atoms and Vi the parti-tioned volume of the ith atomic layer, respectively. Q(Kj) and Q(1) represent any measurable quantityfor the same solid with and without consideration of the effect of broken surface bond. The q and qi
correspond to the local density of Q inside the bulk and at the ith atomic site, respectively. Theq(z,di,Ei) depends functionally on the bonding identities such as bond order, length, type, and strength,

C.Q. Sun / Progress in Materials Science 54 (2009) 179–307 201
and their coordination and temperature dependence. T0 is the reference temperature. The quantitygenerates the property change at the referred local site. The layer-counting premise in Fig. 5a repre-sents that atoms in the surface skins dictate the size-induced property change, yet atoms in the coreinterior remain as they are in the bulk because of the broken-bond-induced local strain and quantumtrapping. The weighting factor, cij, or the proportion of the under-coordinated atoms of the whole so-lid, represents the geometrical contributions from the dimension (Kj) and the static dimensionality (s)of the solid, which determines the speed of change with the shrinkage of the solid size. The staticdimensionality s represents the factor of shape such as a thin plate (s = 1, and monatomic chain aswell), a rod (s = 2), and a spherical dot (s = 3) of any size, which is different from the dynamic dimen-sionality defined in transport considerations. No zero dimensionality is necessary. The overall surface-to-volume ratio, drops in a K�1
j fashion from unity to infinitely small when the solid dimension growsfrom the atomic-level to infinitely large. At Kj < 3, the performance of the surface atoms will dominatebecause at the smallest size the c1 approaches unity. At Kj 6 0.75, the solid will degenerate into an iso-lated atom. For a spherical dot at the lower end of the size limit, Kj = 1.5 (Kjd = 0.43 nm for an Au spher-ical dot example, or an fcc unit cell), c1j = 1, c2j = c3j = 0, and z1 = 2. Atoms in the atomic chain areidentical in situation to an atom in a monatomic chain despite the geometrical orientation of thetwo interatomic bonds in the atomic chain. Actually, bond orientation is not involved in the currentmodeling consideration. Therefore, the performance of an atom in the fcc unit cell is identical tothe same atom in a monatomic chain from the perspective of bond order loss. At the lower end ofthe size limit, the property change of a nanosolid relates directly to the behavior of the single bond,which forms the starting point of the current ‘‘bottom up” approach. Most importantly, this expressioncovers the whole range of solid sizes, from monatomic chain to the infinite large bulk. The variable, T,is separated from the size effect, as all the bonds in the substance response to the temperature change.
2.4.2. Surface-to-volume ratio for solid and hollow systemsThe difference between a positively curved surface and a negatively curved surface is nothing more
than the surface-to-volume ratio, cij, and the slight difference in the coordinating environment of theunder-coordinated atoms. Considering a sphere of Kj radius with (n + 1/2) spherical cavities of Lj radiuslined along the Kj radius, as illustrated in Fig. 5b, the total number of voids is inside the Kj sphere. Forthe hollow sphere (n = 0) with only one void in the center, this expression needs slight revision. We canestimate the volume V0 occupied by atoms as the entire volume of the sphere less the voids. The sum ofthe volume of skins of the voids and the sphere surface is Vi. The V0 and the Vi are calculated as follows:
Fig. 5.structuinterior
V0 ¼4p3
K3j �
4p3
nþ 12
� �3
L3j
" #
Vi ¼ 4p K2j Cio þ
4p3
nþ 12
� �3
L2j Cii
" #
Kj
L
Schematic illustration of the surface-to-volume ratio of (a) a sphere with 4p(n + 1/2)3/3 cavities and (b) the core-shellre of a cylindrical nanorods. Only atoms in the skin of Da thick contribute to the property change yet atoms in the core
remain their bulk nature.

202 C.Q. Sun / Progress in Materials Science 54 (2009) 179–307
Cii and Cio represent the bond contraction coefficient for atoms in the inner negatively curved skins ofthe cavities and atoms at the outer positively curved surface of the sphere, respectively. The ratio be-tween the volume sum of the skins and the volume occupied by atoms can be derived as
rijðn; Lj;KjÞ ¼Vi
V0¼ 3
Kj3
3Cio þ 4pðnþ 1=2Þ3ðLj=KjÞ2Cii
1� 4pðnþ 1=2Þ3ðLj=KjÞ3
¼ 3Kj
3Kj
3 3Cioþ4pðnþ1=2Þ3ðLj=KjÞ2Cii
3�4pðnþ1=2Þ3ðLj=KjÞ3ðPorous-sphereÞ
Cio ðSolid-sphereÞ3Cioþ4pðLj=KjÞ2Cii
3�4pðLj=KjÞ3ðHollow-sphereÞ
8>>>><>>>>:
ð12Þ
The parameters of n, Lj and Kj are constrained by the relation: 2ðLj þ 1Þðnþ 1=2Þ 6 Kj � 2 because ofthe allowed maximum number of cavities aligned along the radius Kj. 2ðLj þ 1Þ represents the diam-eter of the void including the one layer of surface skin and Kj�2 the radius of the sphere excludingthe surface skin. This expression covers situations of a solid sphere, a hollow sphere, and a sphere withuniformly distributed cavities of the same size. This relation can be extended to a solid rod, a hollowtube, and a porous nanowire as well.
With the derived rijðn; Lj;KjÞ relation and the given expressions for the q(zi,di(t),Ei(t)), one can read-ily predict the size, cavity density, and temperature dependence of the Q of a system with large frac-tion of under-coordinated atoms without involving hypothetic parameters.
2.5. Summary
In this section, theory consideration of the LBA and an extension of the BOLS correlation theory totemperature and pressure domains are presented. It is highlighted that the often overlooked effect ofbond broken on the behavior of the remaining bonds of the under-coordinated atoms dictates thebehavior of low-dimensional systems. All the detectable quantities can be connected to the represen-tative bonds and their response to the external stimulus. The coordination environment affects bondsonly the outermost two atomic layers yet temperature and pressure will affect all the bonds in thespecimen. Given the known functional dependence of the detectable quantities on the bond lengthand bond energy and the shape and size, one would be able to predict the trends of the performanceof nanostructures and to gain physical insight into the unusual behavior of small objects withoutneeding hypothetic parameters.
3. Liquid and solid surfaces
� It is essential to clarify the long confusion about surface energetics by introducing the original conceptsof: (i) energy density gain per unit volume and (ii) residual cohesive energy per discrete surface atom inthe surface skin to replace the (iii) conventional concept of energy loss per unit area or per atom in break-ing one body into two halves.� The excessive surface energy, stress and tension originate from the broken-bond-induced bond contraction
and the associated bond strength gain; the lowered atomic cohesive energy arises from bond order loss.� A solid surface melts first and a liquid surface solidifies easier than the liquid core; a solid skin is generally
harder than the core interior.� A strained, solid-like, and well-ordered liquid skin serves as an elastic covering sheet for a liquid drop or a gas
bubble formation; the skin is covered with locked monopoles due to charge polarization by the trapped elec-trons.� With the addition of elastic strengthening and electron polarizing in the surface skins, Young’s force equa-
tion and the air pockets formation mechanism would be complete for the surface wetting.� The superfluidity, superlubricity, and superhydrophobicity at nanocontacts share the similarity of friction-
less in motion, which is dictated by the repulsion between the ‘‘nonsticking elastic skins with locked mono-poles” – beng similar to the ‘‘magnetic levitation train”.

C.Q. Sun / Progress in Materials Science 54 (2009) 179–307 203
� Measurement of the temperature dependence of surface tension can reveal the atomic cohesive energy atthe surface; the temperature dependence of elastic modulus gives the mean atomic cohesive energy ofthe specimen.� Charge repopulation and polarization dominates the adsorbate-induced stress change.� The nonbonding states of nitrogen and oxygen play an important role in determining the stress of a chem-
isorbed surface.
3.1. Observations
3.1.1. Surface energetics: classical concepts3.1.1.1. Surface free energy. Surface energetics including the terms of surface energy, surface free en-ergy, surface tension, surface stress, and their correlations, plays the key and central role in surfaceand nanosolid sciences. Despite some confusion about these terms, the surface energetics is of greatimportance to a qualitative and sometimes even quantitative understanding of the microscopic andmesoscopic processes at a surface of liquid or solid. The surface energetics links the atomistic bondingconfiguration at the interfacial region with its macroscopic properties, such as strength, elasticity,wettability, reactivity, diffusivity, adhesion, and so on [184,185]. As shown in Fig. 6, without the sur-face or surface energetics, neither a liquid drop or gas bubbles could form.
During the last few decades, tremendous attention has been paid to the energetically induced sur-face processes such as reconstruction, relaxation, interfacial mixing, segregation, self-organization,adsorption, and melting at the solid surfaces. Increased knowledge about the surface stress or surfaceenergy of clean and adsorbate-covered metals has been established by the development of experimen-tal and theoretical methods such as Raman shift, X-ray glancing diffractions, and the micro cantileversensors that allows the detection of extremely small amounts of substances in gases or liquids [186].However, detailed knowledge about the dynamics of surface energetic identities is yet lacking[184,185,187], in particular, the atomistic and electronic origin, temperature and adsorbate depen-dence, and the analytical description of the interdependence between surface energetic identitiesand the energetically driven phenomena and processes.
Traditionally, surface energy (cs), or surface free energy for a solid, is defined as the energy neededto cut a given crystal into two halves, or energy consumed (loss) in making a unit area of surface. Thesurface energy or stress is involved in the Helmholtz or Gibbs free energy in the classical statistic ther-modynamics [188]
Fig. 6.great im
dF ¼ �SdT � P dV þX
li dni þ rdA ðHelmholtzÞdG ¼ �SdT þ V dP þ
Xli dni þ rdA ðGibbsÞ
with parameters of entropy (S), chemical potential (li) of the ith component (ni), surface tension (r),and the surface area A being involved.
How are gas bubbles and liquid drops formed? – surface and surface energetics with yet unclear atomistic origin are ofportance.

204 C.Q. Sun / Progress in Materials Science 54 (2009) 179–307
Usually, un-relaxed structures at zero temperature are considered in the discussion of surface ener-gies. The values obtained are then corrected for relaxations of the surface atoms, without mentioningreconstructions of the surface. In some cases, these corrections are thought very small, so a simplifiedmodel can be made without including relaxations. The temperature dependence involves the phononsand their modification on the surface; the vibrational effects sometimes have to be taken into accountwhen the temperature dependence is studied.
The atomistic origin of the surface energy is usually explained as follows. A surface atom has fewerneighboring atoms and experiences fewer attractive interaction forces from its surroundings than afully coordinated atom in the bulk interior. Consequently, the atoms at the surface experience a netforce pointing into the bulk, or in other words, the potential energy of a surface atom is higher thanthat of a bulk atom because of the lowered atomic coordination. If one wants to create two new sur-faces with a total area of A by cutting a solid at constant elastic strain (eij) and constant temperature,one requires the surface energy
cs ¼ ðFS � F0Þ�ij ;T=A
where FS and F0 are, respectively, the system free energy after and before the cut.The simplest approach to get a rough estimate of the surface energy is to determine the number of
bonds that have to be broken in order to create a unit area of surface. One can cut a crystal along a cer-tain crystallographic plane and multiply this number of broken bonds with the energy per bond with-out considering the bond energy change caused by the reduction of atomic coordination. The typicalapproaches for the defined surface energy are comparatively summarized as follows [185,189–191]:
cs ¼
WS�WB20 ndðnd � 10Þ ðGalanakisÞð1� zs=zbÞEB ðHaissÞð1�
ffiffiffiffiffiffiffiffiffiffiffizs=zb
pÞEB ðDesjonqueresÞ
½2�zs=zb�ðzs=zbÞ1=2 �þk½2�z0s=z0b�ðz0s=z0
b�
2þ2k EB ðJiangÞ
8>>>><>>>>:
ð13Þ
� Galanakis et al. correlated the surface energy of some d-metals to the broken bond in the tight-bind-ing approximation. The nd is the number of d-electrons. WS and WB are the bandwidths for the sur-face and the bulk density of states, which are assumed in rectangular forms.
� Haiss et al. related the surface energy directly to the multiplication of the number of broken bondsand the cohesive energy per bond Eb = EB/zb at 0 K. The cs values are estimated by determining thebroken bond number zhkl = zb � zs for creating a unit surface area by cutting a crystal along a certaincrystallographic plane with a Miller index (hkl) where zs is the CN of a surface atom and zb the cor-responding bulk atomic CN.
� A second-moment tight-binding approximation conducted by Desjonquères et al. suggested thatthe surface energy gain is proportional to
ffiffiffiffiffizSp
, instead of zs, because of the lowering of the occupiedsurface energy states or the surface-induced positive core-level shift as observed using XPS. Accord-ing to this approximation, the rearrangement of the electronic charge does not practically changethe nature of the remaining bonds if one bond breaks. Thus, the energy needed to break a bondis independent of the surface orientation, so that the cs value is proportional to the square rootof the number of the nearest-neighboring bonds.
� In order to obtain a more general expression, Jiang et al. suggested that an average of the approxi-mations of Haiss and Desjonquères and an extension to counting the contribution from the nextnearest neighbors could be more comprehensive. The prime in the expression denotes the next-nearest neighbors of the surface atoms and k is the total bond strength ratio between the next-near-est neighbor and the nearest one.
� In addition, Xie et al. [192] derived an expression for the size dependence of surface energy of nano-structures: cs = EB/pd2 with d being the mean atomic radius and EB the atomic vacancy formationenergy [193].

C.Q. Sun / Progress in Materials Science 54 (2009) 179–307 205
Besides the thermodynamic considerations, the kinetic processes of lattice vibration play signifi-cant roles in the anisotropy of surface properties [194]. The amplitudes and frequencies of atomicvibrations, as well as the bond lengths and strengths at a surface are different from their correspond-ing bulk values because of the effect of bond broken. During film growth, the adatoms and atomicvacancies also contribute to the surface energy. With these contributing factors, the surface energeticsbecomes even more complicated.
3.1.1.2. Surface stress. In contrast to the surface energy, which is related to energy change during theplastic deformation of a unit area of surface, the surface stress (Pij) is related to energy changes duringthe elastic stretching of a pre-existing surface. Since the surface stress in general may be dependent onthe direction of the stretching, the term Pij is a second-rank tensor and the stretching has to be ex-pressed by the elastic strain tensor eij
Fig. 7.stoichio
Pij ¼ocs
o�ij
where the cs is the free energy at any strain. If cs is lowered for negative strain values, the surfacetends to shrink and the surface stress has a positive sign. In this situation, the stress is ‘tensile’. Ifthe surface tends to expand, the corresponding stress is ‘compressive’ with a negative sign.
According to Haiss [185], the surface stress originates physically from the atomic CN reduction ofsurface atoms and the corresponding charge redistribution. The charge redistribution alters the natureof the chemical bonding and the equilibrium interatomic distances. Hence, the surface atoms attemptto assume their equilibrium interatomic distances and exert forces on the bulk, as long as the potentialcorrugation of the underlying atomic layer holds the topmost atoms in registry with the bulk lattice.The surface stress can be quantified as the sum of such forces.
It has been found [195] recently that the stress in CrN films varies with film thickness; see Fig. 7,which is attributed to the sum of the tensile stress generated at the grain boundaries, compressivestress due to ion peening in deposition, and thermal stress due to the difference in thermal expansionbetween the coating and the substrate. The tensile part due to grain boundaries is thickness depen-dent. The other two contributions are thickness independent. Summation of the three componentsleads to a stress gradient in the coating.
3.1.1.3. Surface tension. Surface tension is expressed either as a force per unit length or as an energyper unit area of the interface between air and liquid, which results from the force of cohesion betweenliquid molecules or from the attraction of molecules to one another on a liquid surface. Thus, a poten-tial barrier is created between the air and the liquid. The elastic-like force between surface moleculestends to minimize or constrict the area of the surface. In physics, surface tension is an effect within thesurface layer of a liquid that causes the layer to behave as an elastic sheet with higher strength and
1E-8 1E-7 1E-6 1E-5-2000
-1500
-1000
-500
0
500
1000 guideline Stoichiometry under-stoichiometry guideline
Str
ess
(Mp
a)
Thickness CrN (m)
Thickness dependence of CrN film stress [195] showing dominance of the surface and the influence of chemicalmetry.

206 C.Q. Sun / Progress in Materials Science 54 (2009) 179–307
higher elasticity of the liquid. However, it is unclear yet why the liquid skin is more elastic and stron-ger than the liquid core interior although the surface tension of an organic specimen was suggested[196] to be proportional to the product of molecular weight and the topological wiener index to apower of 3/2, MW3/2. The topological winner index is the sum of all the shortest distance in the molec-ular crystallography and the MW3/2 is treated as characterizing the moment of inertia of the rotationalmotion of the molecules.
3.1.2. Solid surface: skin hardening or softeningThe surface elasticity and hardiness of a surface depend on several factors [197]: (i) the surface cur-
vature, (ii) the nature of the bond involved and, (iii) the ratio between the operating temperature andthe melting point. Experimental methods have an influence on the measured results. Normally, thesurface of a solid is harder than the bulk interior at temperature far below the melting point butthe hard surface melts more easily. For instances, as shown in Fig. 8a, the hardness measurementsof Si surfaces, with penetration depths as small as 1 nm yield H � 25 GPa, showing a drastic increaseto 75 GPa with penetration depths to 5 nm compared with the bulk value of 12 GPa [198]. Fig. 8b is therelation between the hardness and elastic modulus of and silica-based low-dielectric films [199]. Sim-ilarly, the maximum hardness for nano- and micro-crystalline pure nickel films is also peaked at apenetration depth of �5 nm [44,45]. The hardness of Ni films varies in a range from 6 GPa to20 GPa depending not only on the geometrical shapes (conical, Berkovich, and cube-corner) of the in-denter tips but also on the strain rate in measurement. The peak position (5 nm in depth) changeswith neither the shapes of the indenter tips nor the strain rates, or the particular specimen, indicating
Fig. 8. (a) Skin hardening of the Si(001), Si(111) and SiO2 surfaces [198]. (b) Silica based low-dielectric films [199]. (c) themodulus-depth profile of a CNT turf showing one order higher in magnitude at the skins. Indentations are taken at differentdistances from the edge of the turf. The more compliant cases correspond to indentations closer to the edge [201]. (d) Skinsoftening of polymer surface [65], measured by AFM indentation. Outlined and filled symbols correspond to the valuesestimated using the pyramidal diamond and spherical indenters, respectively for thick (squares) and thin (triangles) polymerfilms.

C.Q. Sun / Progress in Materials Science 54 (2009) 179–307 207
the intrinsic nature of surface hardening. The values of both the Y and the P for nitrogen-doped amor-phous carbon (a-C) films [42] at the ambient temperature also show maximum hardness near the sur-face. The maximum hardness is 3–4 times higher than the bulk values whereas the peak positions inthe hardness-depth profiles remain unchanged when the nitrogen content or film thickness changes.The hardness of TiCrN films at 5–10 nm depth reaches a maximum of 50 GPa, being twice the bulkvalue. The same trend holds for a-C [43] and AlGaN [41] films with peaks positioned at several nano-meters in depth that corresponds to the surface roughness.
Surfaces of Ag, Ni, Cu, and Al thin films are 4 ± 0.5 times harder than the bulk interior and the hard-ness of a2-TiAl and c-TiAl surfaces is �2 times the corresponding bulk values [46]. The hardness of Ti,Zr, and Hf carbide films on silicon substrate increases from the bulk value of 18 GPa to 45 GPa whenthe film thickness is decreased from 9000 nm to 300 nm [48]. The Young’s modulus of nanograinedsteel was determined to increase from 218 GPa to 270 GPa associated with a mean lattice contractionfrom 0.2872 nm to 0.2864 nm when the grain size is reduced from 700 nm to 100 nm [49]. Theseobservations evidence the skin hardening effect arising from the shortened and strengthened bondsbetween the under-coordinated atoms. Furthermore, surface passivation with electronegative ele-ments could alter the bond nature in the surface skins and hence the surface stress. A combinationof the DFT and MD calculations [200] suggested that a surface could be softer or stiffer dependingon the competition between electron redistribution and the atomic coordination on surfaces. Resultsshow that the Young’s modulus along the h110i direction on (100) surface is higher than its bulkcounterpart; meanwhile, it is smaller along the h100i direction on (100) surface.
As shown in Fig. 8c, the tangent modulus of a CNT turf (a complex structure of intertwined nano-tubes cross-linked by adhesive contact) was measured to be one order higher near the surface and themodulus drops with the penetration depth [201]. The modulus near the terrace edge is even higherthan the flat surface.
In contrast, skin softening occurs to some polymers or materials of lower melting points. An AFMroom temperature indentation measurement has shown that the local Young’s modulus of the organicthin films that can evaporate at �150 �C decreases with particle size. The elastic modulus of polysty-rene films increases with the penetration depth. When the penetration depth is less than 5 nm, theelastic modulus of the films is smaller than that of the bulk and then approaches the bulk value whenthe depth is more than 10 nm, as shown in Fig. 8d. These observations suggest the significance of thedifference between the temperature of melting and the temperature of testing to the measured values.
Ideally, an enhancement of the elasticity and hardness are readily observed from the skins of com-pounds, alloys, or specimens with high melting points whereas the enhancement is not seen so oftenusing indentation method for specimens with lower melting points such as Sn, Zn, Al and organicspecimens unless they are chemically passivated [202]. The measured skin hardening or softening alsovaries with methods of detection. For instance, the modulus of nanocrystalline of 50–800 nm thick Nifilms, measured using acoustic AFM [203] is lower than that of the bulk, as no artifacts such as accu-mulation of dislocations and possibly no passivation are involved in the non-contact acoustic AFMmethod. SiTiN films are measured approximately 10–20% harder using nanoindentation than the val-ues obtained using SAWs methods [58]. The additional pressure will cause deviation of the intrinsicvalues. It is expected that the hard materials may be measured even harder and the soft one maybe even softer using the indentation methods.
Normally, deformation resistance from the effect of the pile up of dislocations, strain gradient workhardening, and the artifacts due to indentation tip shapes, strain rates, loading scales and directions,etc, involved in the contact mode of indentation would play a role of significance [204]. The surfacesmoothness has less influence on the measurement [205]. Fig. 9 shows the measured hardness depen-dence of Cr, 6H–SiC and Ni films on the load scales in the indentation methods. The hardness of thesingle crystal moissanite (6H–SiC) obtained by 10-second loading parallel to the crystallographic c-axis varies with the loading magnitude. If the load is 0.5 N, the derived hardness is 26 GPa whereas,loading at 29 N and 50 N, the corresponding hardness values are 22.5 GPa and 22 GPa, respectively[204]. Therefore, it is difficult to be certain of the hardness of a material because of the joint contribu-tion from the intrinsic and extrinsic processes. However, a careful calibration of the area function overthe contact depth range prior to nanoindentation tests may improve the accuracy of the derived infor-mation [206].

0 50 100 150 200 250 30020
22
24
26
28
0 5 10 15 201.75
2.00
2.25
2.50
Load [gf]
Cr singel crystal
Har
dn
ess
(GP
a)
Load (N)
6H-SiC
Fig. 9. Load dependence of (a) the microhardness of Cr crystal (insert) [84] and 6H–SiC [204] and (b) the nanohardness of Nifilms of�3 micrometers thickness under zero and 10% tensile strain [10], showing the general trend of the uncertain accuracy ofhardness in indentation methods.
208 C.Q. Sun / Progress in Materials Science 54 (2009) 179–307
Hence, one could not simply tell that a specimen is harder or softer compared with the bulk stan-dards without indicating the conditions of surface passivation, temperature of operation, and the test-ing methods used. Artifacts are hardly excluded in practice. What one is concerned about is theintrinsic change of the mechanical properties with temperature, solid size, and the nature of the bondinvolved. Therefore, we have to minimize contributions from artifacts in modeling considerations.
There have been several models on the mechanism for the observed surface skin hardening orsoftening. In order to understand the unusual surface mechanics, Zhang and Xu [82,83] proposed acritical-depth mechanism stating that the apparent surface stress plays an important role in thedepth-dependent hardness for various types of materials, such as metals, ceramics, and polymersand there exists a critical indentation depth. The bulk deformation predominates when the indenta-tion depth is deeper than the critical depth; otherwise, surface deformation predominates. However,the origin of this critical depth is unknown. The trend of hardness versus indentation depth after thepeak is described using the mechanism of strain gradient [207] or attributed to the contributions fromsurface energy and the increase of dislocation density with the depth [208]. The surface hardening hasalso been attributed to the surface effect, strain gradient work hardening, and non-dislocation mech-anisms of deformation, besides the currently proposed T-BOLS correlation [209]. The T-BOLS correla-tion mechanism attributes the surface hardening to the broken-bond-induced shortening andstrengthening of the remaining bonds of the under-coordinated atoms and the surface softening tothe high ratio of T/Tm. Operation temperature closing to the melting point of the specimen will triggerthe situation described by Born’s criterion.
3.1.3. Liquid surface elasticity: adsorption and heatingThe surface tension for a liquid takes on an important part in the liquid drop or gas bubble forma-
tion in a liquid. Compared with the solid skin pre-melting, a liquid surface tends to solidify at temper-atures below the bulk melting point. Normally, the temperature dependence of the surface tension of amolten substance follows a linear relation to the temperature of testing [210–215]:
csðTÞ ¼ csðTmÞ þ atðTm � TÞ ¼ csð0Þ � atT
csð0Þ ¼ csðTmÞ þ atTmðJ=m2Þð14Þ
where cs(Tm) corresponds to the cs value at melting; at is the thermal coefficient or the slope of var-iation. For pure metals or alloys, the surface tension drops linearly with the increase of temperature.However, the surface tension is very sensitive to the chemical environment, or contamination[216,217]. The surface tension of an alloy also varies with composition concentration. Typical samplesin Fig. 10 shows the linear temperature dependence of surface tension of a CoSi alloy [218] and theinflected temperature dependence of the surface tension of a Sn surface under different ambient ofoxygen [219]. With the given composition, the tension drops linearly with the increase in tempera-

C.Q. Sun / Progress in Materials Science 54 (2009) 179–307 209
ture. However, the temperature coefficient inflects from negative to positive at a certain temperatureand then drops following that of the ideal situations. The turning point changes with oxygen dosage.As discussed later, the slope inflection can be envisioned as the contribution from the additionallycompressive or tensile stress-induced by surface adsorption to compensate or enhance the originalsurface tension of the liquid. For a specimen with a melting point much higher than the temperatureof desorption of the specific adsorbate, such slope inflection may not be readily seen because of thethermal desorption of the electronegative additives, which occurs at temperature below 1200 K foroxygen, for instance [220].
A huge database has been established regarding the temperature coefficient of surface tension formetals, alloys, and polymers. Table 2 tabulates the data for some typical samples and includes infor-mation derived in this work and discussed later in Section 3.4.2. The temperature dependence of sur-face tension has provided us with an opportunity to derive information regarding atomic cohesiveenergy in the bulk and with possible mechanism for the adsorbate-induced surface stress. The lattercould be a challenging topic of research on adsorption of various adsorbates to liquid surfaces of rel-atively low-Tm metals.
3.2. Atomistic origin of surface energetics
3.2.1. MotivationBy definition, the dimensions of surface energy, surface stress, and surface tension are expressed in
terms of energy per unit area, eV/nm2; however, according to the coordinate-counting premise, theunit of the surface energy is in eV/atom. The former represents the energy density per unit area,whereas the latter reflects the energy loss per discrete atom upon a surface being made. Observationsshow that the surface energy in terms of eV/nm2 is often higher while the surface energy in terms ofeV/atom is lower in magnitude compared with the bulk values because of the difference in definition.Such inconsistency has caused confusion for some time about the definition of surface energetics. Onthe other hand, the atomistic origin, temperature dependence, and the responsibility of the surface en-ergy in terms of either eV/atom or eV/nm2 are yet far from clear. Most importantly, the effect of a bro-ken bond on the length and strength of the remaining bonds between the under-coordinated atoms inthe surface skin has been overlooked in the available models.
The shortened and strengthened bonds are indeed crucial to surface energetics. For example, a con-siderable percentage contraction occurs to the first and the second layer of the diamond surface,which leads to a substantial reduction in the surface energy according to MD calculations [238].The contraction varies from 11.2% to 56.2% depending on the surface plane and the potential usedin the computation. Furthermore, the classical theories of continuum medium mechanics and the sta-tistic thermodynamics could hardly cover the atomistic origin of the mesoscopic mechanics.
1400 1600 1800 2000 2200 24001.2
1.4
1.6
1.8
Su
rfac
e te
nsi
on
(N
/m)
T (K)
Experiment Linear fitting
Tm=1
607K
a
550 600 650 700 750 800 850 900 950
510
525
540
b
Su
rfac
e te
nsi
on
(m
N/m
)
T(K)
Sn PO
2=1x10⁻⁵ Pa
PO2=6x10⁻⁴ Pa
PO2=4x10⁻³ Pa
PO2=2x10⁻² Pa
Fig. 10. Temperature dependence of surface tension of (a) CoSi liquid [218] and (b) Sn liquid under different oxygen partialpressures [219]. The inflection of the coefficient can be viewed as the results of a competition between the adsorbate inducedcompressive stress and the broken-bond-induced tensile stress according to the present understanding.

Table 2aInformation of the mean atomic cohesive energy EB(0) derived from fitting the measured T-dependent surface tension, as shown indetail later in Section 3.4.2 with the measured surface tension and its temperature coefficient as listed in the first two columns
cs(Tm)(mJ/m2)
at (mJ/(m2K)
aia
(10�6 K�1)hD
(K)Tm
(K)DT (K) EB(0)
(eV)EB (0)Ref. [129]
Hg [213] 493 0.2 60.4 100 234.32 273–523 1.47 0.67Si [221] 783.5 0.65 1350–1900 5.33 4.63Si [222] 735 0.074 2.6 647 1687 1457–1890 2.04Si [214] 763 0.219 1690–1750 1.15Ga-added Si [223] 777 0.243 1680–1760 2.12B-added Si [214] 721 0.098 1690–1750 3.92Al2O3 [214] 640 0.082 1045 2327 2190–2500 4.39Al2O3 [218] 550–700 0.082–0.48Co25Si75 [223] 1604 0.4 1607 1384–2339 2.43Ni [212] 1823 0.46 1.6 375 1728 3.645 4.44Ni [224] 1868 0.22 1300–1625 6.03Ni [225] 1854 0.364 4.02Ni [226] 1846 0.25 5.38Co [227] 1875 0.348 13 385 1768 4.22 4.39Co [228] 1881 0.34 4.31Co [229] 1887 0.33 4.42Co [230] 1930 0.33 1500–2000 4.49Ag [231] 925.4 0.228 18.9 215 1234.78 1250–1500 3.12 2.95Ta [232] 2150 0.21 6.3 225 3269 2970–3400 7.98 8.1W [233] 2478 0.31 4.5 310 3695 3360–3700 6.90 8.9Ga [234] 718.2 0.062 18 240 302.77 823–993 7.01 2.81In [231] 573.5 0.099 32.1 129 429.6 500–1400 3.67 2.52In [234] 546.8 0.082 673–993 4.32Sn [234] 545.66 0.066 22 170 504.93 723–993 5.18 3.14Sn [235,231] 547.17 0.065 500–1300 5.26Bi [234] 378.9 0.070 13.4 120 544.5 773–873 3.51 2.18Pb [234] 445.54 0.089 28.9 88 600.46 757–907 2.95 2.03H2O[236] 75.4 0.162 – 192 273 273–373 0.38
The bond energy Eb(0) is available by dividing the atomic cohesive energy EB(0) with bulk coordination zb (=12) for elementalspecimen. hD and Tm are the Debye temperature and melting point as input in calculations. DT(K) is the temperature range oftesting. Scattered data for a specific substance and the deviation from the reference values show the sensitivity of the LBAderived EB(0) to the extrinsic factors such as surface contamination in comparison to the reference data.
a Coefficient of linear thermal expansion at 25 �C in K�1(Handbook of chemistry and physics).
Table 2b(Continued) for polymers
cs(Tm) (mJ/m2) at (mJ/(m2K) DT (�C) Tm (K) EB(0) (eV)
hexadecane (C16) 29 0.094 298–373 291 0.30PE (C2000) 35.6 0.065 403–493 407 0.41PEO 46.7 0.08 343–463 333 0.40PCAP 44.4 0.068 373–398 333 0.43PEKK 63.8 0.08 571–618 578 0.60PBT, poly (butylene terephthalate) 59.3 0.08 493–523 496 0.54Poly (trimethylene terephthalate) 53.8 0.067 538–562 496 0.56PET 54.2 0.0646 513–593 528 0.59Poly (amide ester) copolymer 60.4 0.08 433–463 433 0.52Nylon 66 64 0.115 543–563 533 0.47Polyamide MPMD-12 54.55 0.081 463–623 463 0.49
Thermal expansion coefficients are not available and therefore not used in the practices on polymers. Experimental data aresourced from Ref. [237].
210 C.Q. Sun / Progress in Materials Science 54 (2009) 179–307
In fact, the performance of a surface is dictated by the energy-gain per unit volume in the surfaceskin or the cohesive energy remnant per bond of the under-coordinated surface atoms instead of theenergy cost for surface formation. It would be necessary to point out that the surface energy density

C.Q. Sun / Progress in Materials Science 54 (2009) 179–307 211
gain arising from surface relaxation or bond contraction causes the reconstruction according to theBOLS consideration. Meanwhile, it is stressed that the surface bond strain causes the surface stressother than the stress induces the strain, as a long perception. Therefore, a complementary formulationto take into account the bond nature and temperature dependence of surface energetics is necessary.
3.2.2. Atomistic definitionIn reality, the performance of a surface is governed by the remaining energies in the surface skin or
by the residual bond energy of the discrete surface atoms instead of the energy loss upon surface for-mation. In order to describe the phenomena and processes at a surface effectively, we may propose thefollowing concepts to complement the conventional term of surface energy consumed for surfaceformation:
(i) The surface is envisioned as a sheet or a skin of a certain thickness (two-to-three atomic layers)rather than an ideal two-dimension sheet without thickness.
(ii) The concept of energy density gain (cds) refers to the energy stored per unit volume (in the unitsof eV/nm3) in the surface skin upon making a surface.
(iii) The concept of residual atomic cohesive energy (cfs) represents for the cohesive energy per dis-crete surface atom (in the units of eV/atom) upon the broken of surface bond, which equals themultiplication of the remaining number of bonds with a bond energy that varies with the num-ber of the bonds broken.
(iv) The conventional definition of surface energy refers to the energy cost (loss) for unit surfacearea formation, which has little to do with surface phenomena or surface process.
From the analytical expression of binding energy per unit area, Ebd�2, and the current T-BOLS cor-relation, the shortened and strengthened bonds of the under-coordinated surface atoms originate thesurface tension, surface stress, and surface energy. Correspondingly, we may also clarify the differencebetween surface stress and surface tension as the energy gradient in the surface normal and in the sur-face plane directions, respectively, as summarized in Table 3. The di(zi,T) and Ei(zi,T) follow the temper-ature and zi(Kj) dependence, as discussed in Section 2. From the atomistic perspective, the surfacetension is a vector with x and y components because oFx/oy = oFy/ox = 0 instead of a second-rank tensor.
3.3. Analytical expressions
3.3.1. Surface energeticsAccording to Eq. (7), the proposed curvature and temperature dependence of surface energy den-
sity, cdi, and the surface atomic cohesive energy, cfi, will follow the relations:
cdiðzi; TÞ /Eiðz; TÞd3
i ðzi; TÞ¼
Eið0Þ �R T
0 g1iðtÞdt
d3i ð1þ aiTÞ3
cf iðzi; TÞ / ziEiðzi; TÞ ¼ zi Eið0Þ �Z T
0g1iðtÞdt
� � ð15Þ
The internal energyR T
0 g1iðtÞdt ffi x2x2=2þ u000ðrÞx3=3þ 0ðxn>3Þ corresponds to the thermal vibration ofvarious modes, harmonic and anharmonic, which weakens the bond strength. The x and x representthe frequency and amplitude of vibration, respectively. The relative values of the surface energetics inthe ith atomic layer to the bulk values of cdb and cfb, measured at T0 = 0 K, can be derived as
cdiðzi;m; TÞcdðzb;m;0Þ
¼ d3
d3i ð1þ aiTÞ3
�Eið0Þ �
R T0 g1iðtÞdt
Ebð0Þ
¼ c�ð3þmÞi
ð1þ aiTÞ31�
R T0 g1ðtÞdt
zibc�mi Ebð0Þ
!
cf iðzi;m; TÞcfðzb;m;0Þ
ffi zibc3i ð1þ aiTÞ3
cdiðzi;m; TÞcdðzb;m;0Þ
ð16Þ

Table 3Proposed terms of curvature Kj(zi) and T dependence of surface energetics arising from the effect of a broken bond represented bythe T-BOLS correlation and their expressions, atomistic origins, and their responsibilities for the surface phenomena and processes[183]
Definitions T-dependent expression Atomistic origin Functionality
Surface energydensity (cds)(eV/nm3)
cds ¼P
i62Eiðzi ;TÞ=d3
i ðzi ;TÞ�diðzi ;TÞPi62
diðzi ;TÞEnergy gain per unit area of(d1 + d2) thick due to the broken-bond-induced strain and bondstrength gain
Surface stress; elasticity; Hamiltonian;surface optics; dielectrics; surfacetrapping states; electron and photontransport dynamics; work function etc.
Surface atomiccoherenceenergy (cfs)(eV/atom)
cfs ¼P
i62zi Eiðzi ;TÞ2 Binding energy remnant per
discrete atom upon surfaceformation
Thermal stability; melting andevaporating ability; wettability;diffusivity; reactivity; acoustics; self-assembly; reconstruction
Energy cost forsurfaceformation(cs) (eV/atom)
cs = zbEb � cfs or equivalentto the forms in Eq. (13)
Traditional definition of energyloss per atom upon surfaceformation
Surface stress(P) (eV/nm2)
oFxox iþ oFy
oyjþ oFz
oz k Force gradient in the surface Surface relaxation, strength, hardness
Surface tension(s) (eV/nm2)
oFxox iþ oFy
oy j Force per unit length in the surfacexy plane
Surface reconstruction, strength,hardness
212 C.Q. Sun / Progress in Materials Science 54 (2009) 179–307
At T = 0 K, the surface energy density is always higher and the surface atomic cohesive energy is al-ways lower than the corresponding bulk values. These definitions clarify discrepancies inobservations.
3.3.2. Elasticity and strengthThe surface stress, or surface tension, and bulk modulus at a specific atomic site share the same
dimension of the surface energy density: �
PiðTÞ ¼ �ouðrÞoV
/ YiðTÞ / BiðTÞ ¼ �Vo2uðrÞoV2
����r¼di
/ EiðTÞd3
i
/ cdiðTÞ ð17Þ
This expression demonstrates the correspondence of surface energy density to the mechanical proper-ties. Precisely, the B and P are the derivatives of interatomic potential. However, there exists uncertaintyin choosing the exact form of u(r). What we are concerned with is the relative change of the B and P to thebulk values. No particular form of the u(r) is involved in the present exercise, as we need only the valuesof Ei and di at equilibrium positions. On the other hand, from dimensional analysis, the P and B are bothproportional to the energy per unit volume. Therefore, it is reasonable to take the above approximationin the analysis. It is unnecessary and impractical to consider the differentiations at a point away from theequilibrium atomic distance. It would be sufficient to consider the equilibrium positions (bond lengthand energy) and the temperature induced energy change. An exact solution may be obtainable in the firstprinciple calculations but the outcome will also be subject to the form of the u(r) chosen.
Eq. (17) indicates that the Yi and Pi enhancement depends uniquely on the shortened and thestrengthened bonds. The relative values for the local Yi, Pi and cdi to those of the bulk measured atT0 = 0 K follow the same relation:9
Yiðm;zi ;TÞYðm;z;0Þ
Piðm;z;TÞPðm;z;0Þcdiðm;zi ;TÞcdðm;z;0Þ
>>>=>>>;¼ C�ð3þmÞ
i
ð1þ aiTÞ3� 1�
R T0 g1ðtÞdt
zibC�mi Ebð0Þ
" #ð18Þ
3.4. Strain-induced surface elasticity and stress: supersolidity?
3.4.1. Bond nature and curvature dependence
� A flat surface

C.Q. Sun / Progress in Materials Science 54 (2009) 179–307 213
Generally, for a flat surface, z1 = 4, z2 = 6, and the effective ziP3 = 12, and correspondingly, the bondcontraction coefficient Ci(zi) = 2/(1 + exp((12 � zi)/(8zi))) leads to c1 = 0.88, c2 = 0.94, and CiP3 = 1. Forthe diamond cubic materials the effective zb is also 12 though they have a first neighbor coordinationof 4 because the complex unit cell in diamond is formed by an interlock of two fcc structures. Aver-aging the sum over the top two atomic layers, we can obtain the mean energy density gain per unitarea of (d1 + d2) thick and the remaining cohesive-energy per discrete atom in the top two atomic lay-ers of a flat surface at very low temperatures:
Table 4Predicteenergy)
m
135
Subscricfbi.
hcdsi ¼ ðRi62cdidiÞ=ðRi¼2diÞ; ðeV=nm3Þhcfsi ¼ ½Ri62cf i�=2; ðeV=atomÞ
moreover, the relative changes of these quantities for a flat surface
Dcds
cdb
�¼ Ri62ðC�ðmþ2Þ
i � 1Þ=ðC1 þ C2Þ
Dcfs
cfb
* +¼ Ri62ðzibC�m
i � 1Þ=2ð19Þ
The estimated ratios of the defined surface energy density, surface atomic cohesive energy, and thetraditionally defined surface energy are compared in Table 4. Results show that hcdsi is always higherand hcfsi is always lower than the bulk values. Therefore, it is not surprising that measurements showinconsistent values because of the definitions.
� A nanosolid: curvature and bond nature dependences
Considering the outermost two atomic layers of a spherical dot, it is possible to derive the T-inde-pendent hcds/cdbi and hcfs/cfbi as a function of the bond nature and the curvature by using,z1 = 4 � (1 � 0.75/Kj) and z2 = z1 + 2. According to the core-shell structure, the size dependent relativechange of a measurable quantity Q follows the scaling relation in Eq. (11) with the followingquantities:
qi ¼cdi ¼ Ei=d3
i / Yi
cf i ¼ ziEi / TCi
(ð20Þ
Based on Eq. (20) we can predict the trend of bond nature and curvature dependence of the surfaceenergetics, as shown in Fig. 11a and b. It is seen that these identities are not simply a linear depen-dence of the curvature or solid size because of the non-linear dependence of the bond contractioncoefficient on atomic CN. The surface energetics changes slightly with the curvature. The volume aver-age of the energy density gain agrees with the observed size dependence of the Young’s modulus ofZnO2 nanowires. The size dependence of residual cohesive-energy is consistent with the measuredtrends of critical temperature for evaporation TC (Tonset) of Ag, Au, and PbS nanostructures [239] asshown in Fig. 11c and d.
Ideally, the TC for Au and Ag nanosolid should follow the m = 1 curve and that of PbS follow thecurve of m = 4. However, contamination during heating should alter the surface bond nature and en-ergy. Therefore, it is no surprising why the measured data for Au and Ag not follow the m = 1 curve,
d bond nature (m) dependence of the ratios of surface energy density, hcdsi, per unit area and surface cohesion (free, hcfi, per atom with respect to the bulk values
cd1/cdb cd2/cdb hDcds/cdbi cf1/cfb cf2/cfb hDcfs/cfbi
1.668 1.281 0.39 0.379 0.532 �0.542.153 1.45 0.73 0.489 0.602 �0.442.981 1.68 1.16 0.632 0.681 �0.33
pts 1 and 2 refers to the top first and the second atomic layers in a flat surface. hcss/csbi is approximately equal to 1 � hcfs/

214 C.Q. Sun / Progress in Materials Science 54 (2009) 179–307
instead. Measurements under ultrahigh vacuum may rectify the deviation. The predicted size depen-dence of the remaining cohesive-energy also agrees with the measured size effect on the binding en-ergy per atom of Ag particles [240], and the structural phase transition temperature for Pb nanoislandson Si substrate [241]. Intensive investigation of the size-induced solid–liquid, magnetic, ferroelectric,and superconductive phase transitions of nanostructures has been reported in Ref. [242].
3.4.2. T-dependent liquid surface tension: bond energy determinationThe zi, m, and T dependence of the mean surface energy density, hcdsi and mean atomic cohesive
energy, hcfsi can be expressed as
a
c
Fig. 11.discretesolid (vvolumethermaof Youn[239]. I
hcdsi ¼Ri62Eiðzi; TÞ=d3
i ðzi; TÞ � diðzi; TÞRi62diðzi; TÞ
ðeV=nm3Þhcfsi ¼Ri62ziEiðzi; TÞ
2ðeV=atomÞ
Under the given conditions of aTm� 1 and T hD, the hcdsi can be reduced as
cdsðTÞcdbð0Þ
�ffi
ThD c�ðmþ2Þ1 þ c�ðmþ2Þ
2
c1 þ c2� zb1c�2
1 þ zb2c�22
c1 þ c2
g1TEbð0Þ
" #1
ð1þ aiTÞ3ffi
aTm�1 c�ðmþ2Þ1 þ c�ðmþ2Þ
2
c1 þ c2
� zb1c�21 þ zb2c�2
2
c1 þ c2
g1TEbð0Þ
ð21Þ
0.0 0.1 0.2 0.3 0. 40
50
100
150
200
250
300
En
erg
y D
ensi
ty G
ain
(%
)
K-1
j
Surface
Volume average
m = 5
m = 3
m = 1
0.0 0.1 0.2 0.3 0.4-100
-80
-60
-40
-20
0
K-1
j
m = 1
m = 3
Ato
mic
Coh
esiv
e E
nerg
y (%
)
Volume average
Surface
m = 5
0.00 0.05 0.10 0.15 0.20
0
20
40
60
80
100
0 50 100 150 200 250
0.0
0.2
0.4
0.6
0.8
Rel
ativ
e ch
ang
e o
f Y
Kj
BOLS predictionZnO nanowire
Rel
ativ
e ch
ang
e o
f Y
(%
)
K-1
j
BOLSZnO nanowire (m=4)
0.00 0.02 0.04 0.06 0.08-30
-20
-10
0
To
nse
t/To
nse
t,b(%
)
K-1
j
BOLS (m=1) Ag Au BOLS (m=4) PbS
b
d
Prediction of curvature-induced (a) energy density gain per unit volume and (b) the remaining cohesive-energy peratom averaged over the surface skins (surface) of two atomic layer thickness and averaged over the entire spherical
olume average or size dependence). The former increases whereas the latter drops with the decrease of solid size. Theaverage of (a) determines the size dependence of strength and elasticity and the volume average of (b) dictates the
l stability of nanostructures. Panels (c) and (d) compare the predictions to the measured size dependent relative changeg’s modulus of ZnO nanowires [53] and the cohesive energy (evaporation temperature) for PbS, Ag and Au nanosolidsnsert in (c) is the same set of data expressed in Y � Kj wise [183].

C.Q. Sun / Progress in Materials Science 54 (2009) 179–307 215
To be in line with the current definition of surface energy density, we need to assume a thickness D(=d1 + d2) to apply to the classical expression for surface tension or stress, cs(T)/D. The introduction ofD does not vary the reduced form of surface tension and thus we have
csðTÞcbð0Þ
¼ csðTmÞcbð0Þ
þ a1Tm
cbð0Þ1� T
Tm
� �¼ csð0Þ
cbð0Þ� atT
cbð0Þð22Þ
Equilibrating Eqs. (21) to (22) leads to an estimation of the single bond energy Eb(0) and the bulkenergy density, cb(0)/D, with the measured temperature dependence of surface tension:
cbð0Þ ¼aiT�1 ðc1þc2Þ�ðcsðTmÞþat TmÞc�ðmþ2Þ
1þc�ðmþ2Þ
2
¼ A1ðmÞ½cSðTmÞ þ atTm� ¼ A1ðmÞcsð0Þ
Ebð0Þ ¼aiT<<1 zb1c�21 þzb2c�2
2c1þc2
� g1cbð0Þat
8><>: ð23Þ
A1(m) is bond nature dependent. The calculated A1 (m = 1) = 0.6694 and A2 = 3.4174. A precise value ofEb(0) can be obtained by a careful fitting to the measured surface tension with the given Debye tem-perature and the known coefficient of thermal expansion for a specimen. Based on this relation we canreproduce the measured temperature dependence of surface energy, surface tension, and Young’smodulus (refer to Section 6.3.2) with derivatives of the Eb(0) that represents the mean bond energyof the entire solid. Involvement of artifacts and impurities will cause deviation of the Eb(0) from thetrue values. Fig. 12 shows the reproduction of the measured temperature dependence of surface ten-sion of (a) liquid Hg and Ni, (b) Co and H2O, (c) Hexadecane and Polyethylene. In calculations, the De-bye temperature and the thermal expansion coefficient for the corresponding specimens are the inputparameters; the Eb(0) is the derived information. No other parameters are involved. Table 2 summa-rizes information of the estimated results for several specimens.
Therefore, the temperature dependence of surface tension has given us an opportunity to deriveinformation regarding the mean atomic cohesive energy in the bulk. The accuracy of the determina-tion is strictly subject to the measurement. The accuracy can be improved by increasing the dropletsize or minimizing the curvature and by improving the sample purity [234,243] because artifacts suchas surface contamination and sample purity may lead to error to the derived Eb(0) value. The high sen-sitivity of the derived EB(0) to the chemical condition of the liquid and solid surfaces could be anadvantage of the approach, which offers a promising way to detect chemical reactions of a specimenby attaching other guest atoms such as biomolecules and cells to the surface of low-Tm specimens.
It is noted that the adatoms or atomic vacancies during growth will affect the surface energy in adynamic way by introducing additional traps nearby because of the bond order deficiency, which iswithin the BOLS expectation. As we focus here on a surface in static states, the dynamic behavior ofadatoms and vacancies is not immediate concern in the present case. However, the dynamic processof adatom growth or defect/impurity formation and its influence on the surface energy would be achallenging topic for further exploitation. The present approach derives information of bond energylimiting only to elemental specimens. For compounds or alloys, we can obtain the mean value ofatomic cohesive energy. The accuracy of estimation is strictly subject to the measurement. Other fac-tors such as materials purity, defect concentration, and testing techniques may lead to the accuracy ofthe derived Eb(0) values. Discriminating the contribution of defect concentration, surface chemicalcontamination, or artifacts due to experimental techniques from the intrinsically true contributionto the derived Eb(0) would be even more interesting. Nevertheless, results given here and progressmade insofar may demonstrate that the current approach could represent the true situation ofobservations.
The O-induced inflection of the temperature coefficient of Sn surface tension [244], as seen inFig. 10, can be attributed to the adsorbate-induced compressive stress that compensates for the sur-face tension, as will be further discussed in the next section.
3.4.3. Strain-induced elasticity and strength of a solid surfaceIncorporating the nanoindentation measurement of the hardness (stress) for TiCrN and Si surfaces,
we have the following relationships,

0 400 800 1200 16001.0
1.1
1.2
1.3
1.4
1.5
0 100 200 300 400 5001.05
1.10
1.15
1.20
1.25
1.30
1.35
T (K)
T-B OLS Hg-Exp
Su
rfac
e te
nsi
on
rs(T
)/r b
T (K)
Ni
0 500 1000 1500 20000.9
1.0
1.1
1.2
1.3
1.4
0 100 200 300 4000.6
0.8
1.0
1.2
1.4
T (K)
T- BOLS Water-Exp
Su
rfac
e te
nsi
on
rs(T
)/r b
T (K)
Co
0 100 200 300 400 500
0.5
1.0
1.5
0 100 200 300 400 500
0.8
1.2
1.6
2.0
T (K)
T-BOLS Polyethylene-Exp
Su
rfac
e te
nsi
on
rs(
T)/
r b
T (K)
Hexadecane
a b
c
Fig. 12. Estimation of Eb(0) by reproducing the measured temperature dependence of surface tension for (a) Hg [213] and Ni[212] liquid, (b) Co [230] and H2O [236] liquid, and (c) Hexadecane and Polyethylene [237]. The input and output aresummarized in Table 2.
216 C.Q. Sun / Progress in Materials Science 54 (2009) 179–307
ðPS � PÞ=P ¼ C�ðmþ3Þi � 1 ¼
ð50�25Þ25 ¼ 1 ðTiCrN; Ci ¼ 0:9; m ¼ 4Þ
ð70�12Þ12 ¼ 4:7 ðSi; Ci ¼ 0:84; m ¼ 4:88Þ
(
With the above relation, we can estimate the m values and the extent of bond contraction using Eq.(18). For the TiCrN surface, the Ci value is estimated to be �0.9 and the associated m = 4. The Ci forSi is estimated at 0.84 with the given m = 4.88. Similarly, for amorphous carbon films [42] the Ci isaround 0.8 ± 0.2 with the given m = 2.56. Predictions also agree with the theoretically calculated thick-ness dependence of Young’s modulus for Ni, Cu, and Ag thin films at T� Tm [245,246].
Incorporating the maximum Y values and the lattice contraction measured by Liu et al. [49] to theBOLS expression (Yi=Yb ¼ C�ðmþ3Þ
i with m = 1) leads to a Ci value of 0.95 for steel. Unfortunately, thehigh Pi/P > 4 values for Ag, Ni, Cu, Al (m = 1) thin films [46] are beyond the BOLS expectation. Theexceedingly high surface hardness may result from artifacts such as surface passivation that altersthe nature of the initially metallic surface bonds to a compound with m value greater than 4.
The Y-suppression of an organic specimen indicates the importance of the (Tm � T) contribution tothe mechanical strength. The Y value drops for polymers with size, according to the empirical relationY = 0.014 � ln(x) + 0.903 ± 0.045, with x being the particle size in nm. The Y-suppression of polymersresults from the low Tm(�450 K) of the specimen. The ambient testing temperature is only 2/3 of the Tm.
3.5. Adsorbate-induced surface stress – bonding effect
3.5.1. ObservationsAtoms at the pure metal surfaces relax inwardly towards the bulk interior and reconstruct in the
surface planes because of the spontaneous bond contraction and the derived tensile stress and tension.
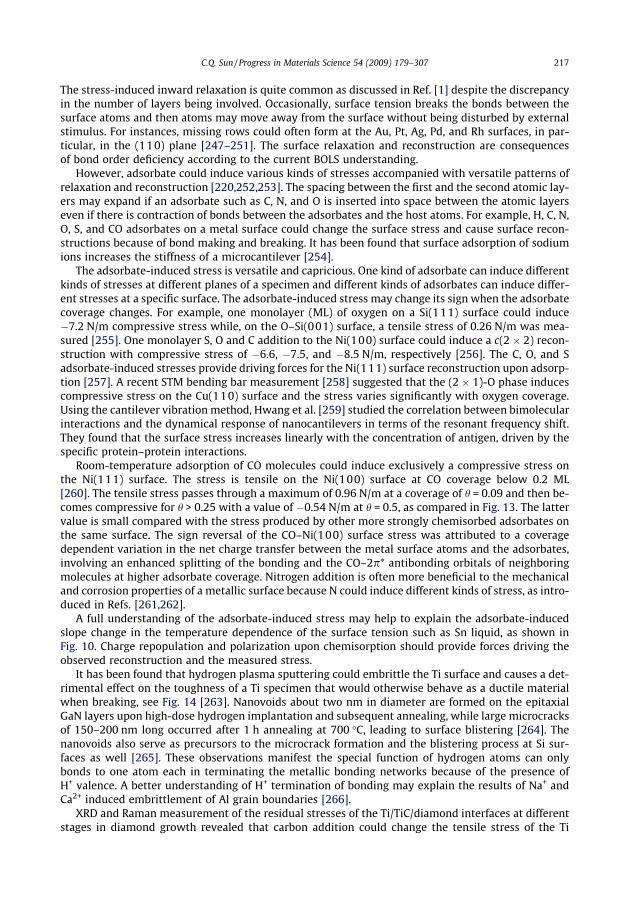
C.Q. Sun / Progress in Materials Science 54 (2009) 179–307 217
The stress-induced inward relaxation is quite common as discussed in Ref. [1] despite the discrepancyin the number of layers being involved. Occasionally, surface tension breaks the bonds between thesurface atoms and then atoms may move away from the surface without being disturbed by externalstimulus. For instances, missing rows could often form at the Au, Pt, Ag, Pd, and Rh surfaces, in par-ticular, in the (110) plane [247–251]. The surface relaxation and reconstruction are consequencesof bond order deficiency according to the current BOLS understanding.
However, adsorbate could induce various kinds of stresses accompanied with versatile patterns ofrelaxation and reconstruction [220,252,253]. The spacing between the first and the second atomic lay-ers may expand if an adsorbate such as C, N, and O is inserted into space between the atomic layerseven if there is contraction of bonds between the adsorbates and the host atoms. For example, H, C, N,O, S, and CO adsorbates on a metal surface could change the surface stress and cause surface recon-structions because of bond making and breaking. It has been found that surface adsorption of sodiumions increases the stiffness of a microcantilever [254].
The adsorbate-induced stress is versatile and capricious. One kind of adsorbate can induce differentkinds of stresses at different planes of a specimen and different kinds of adsorbates can induce differ-ent stresses at a specific surface. The adsorbate-induced stress may change its sign when the adsorbatecoverage changes. For example, one monolayer (ML) of oxygen on a Si(111) surface could induce�7.2 N/m compressive stress while, on the O–Si(001) surface, a tensile stress of 0.26 N/m was mea-sured [255]. One monolayer S, O and C addition to the Ni(100) surface could induce a c(2 � 2) recon-struction with compressive stress of �6.6, �7.5, and �8.5 N/m, respectively [256]. The C, O, and Sadsorbate-induced stresses provide driving forces for the Ni(111) surface reconstruction upon adsorp-tion [257]. A recent STM bending bar measurement [258] suggested that the (2 � 1)-O phase inducescompressive stress on the Cu(110) surface and the stress varies significantly with oxygen coverage.Using the cantilever vibration method, Hwang et al. [259] studied the correlation between bimolecularinteractions and the dynamical response of nanocantilevers in terms of the resonant frequency shift.They found that the surface stress increases linearly with the concentration of antigen, driven by thespecific protein–protein interactions.
Room-temperature adsorption of CO molecules could induce exclusively a compressive stress onthe Ni(111) surface. The stress is tensile on the Ni(100) surface at CO coverage below 0.2 ML[260]. The tensile stress passes through a maximum of 0.96 N/m at a coverage of h = 0.09 and then be-comes compressive for h > 0.25 with a value of �0.54 N/m at h = 0.5, as compared in Fig. 13. The lattervalue is small compared with the stress produced by other more strongly chemisorbed adsorbates onthe same surface. The sign reversal of the CO–Ni(100) surface stress was attributed to a coveragedependent variation in the net charge transfer between the metal surface atoms and the adsorbates,involving an enhanced splitting of the bonding and the CO–2p* antibonding orbitals of neighboringmolecules at higher adsorbate coverage. Nitrogen addition is often more beneficial to the mechanicaland corrosion properties of a metallic surface because N could induce different kinds of stress, as intro-duced in Refs. [261,262].
A full understanding of the adsorbate-induced stress may help to explain the adsorbate-inducedslope change in the temperature dependence of the surface tension such as Sn liquid, as shown inFig. 10. Charge repopulation and polarization upon chemisorption should provide forces driving theobserved reconstruction and the measured stress.
It has been found that hydrogen plasma sputtering could embrittle the Ti surface and causes a det-rimental effect on the toughness of a Ti specimen that would otherwise behave as a ductile materialwhen breaking, see Fig. 14 [263]. Nanovoids about two nm in diameter are formed on the epitaxialGaN layers upon high-dose hydrogen implantation and subsequent annealing, while large microcracksof 150–200 nm long occurred after 1 h annealing at 700 �C, leading to surface blistering [264]. Thenanovoids also serve as precursors to the microcrack formation and the blistering process at Si sur-faces as well [265]. These observations manifest the special function of hydrogen atoms can onlybonds to one atom each in terminating the metallic bonding networks because of the presence ofH+ valence. A better understanding of H+ termination of bonding may explain the results of Na+ andCa2+ induced embrittlement of Al grain boundaries [266].
XRD and Raman measurement of the residual stresses of the Ti/TiC/diamond interfaces at differentstages in diamond growth revealed that carbon addition could change the tensile stress of the Ti

-1.0
-0.8
-0.6
-0.4
-0.2
0.00.0 0.1 0.2 0.3 0.4 0.5 0.6
CO/Ni (111)
Su
rfac
e st
ress
(N
/m)
Coverage (ML)
a-1.0
-0.5
0.0
0.5
1.0
0.0 0.2 0.4 0.6 0.8
Su
rfac
e st
ress
(N
/m)
Coverage (ML)
CO/Ni (100)b
Fig. 13. Coverage dependence of CO induced Ni(001) and Ni(111) surface stress [260]. CO turns the Ni (111) surface to becompressive and CO changes the Ni(100) stress from tensile to compressive with the increase of CO coverage.
218 C.Q. Sun / Progress in Materials Science 54 (2009) 179–307
specimen into compressive [267]. As shown in Table 5, the tensile stress dominates in the pure Ti sur-face and the carbon turns the tensile surface stress of the Ti into compression upon TiC interlayer for-mation. The compressive stress in the TiC interlayer and the tensile stress of the Ti are reducedgradually with the thickness increases of the grown diamond films.
The tensile stress of pure metals can readily be attributed to the effect of the broken-bond-inducedbond contraction and bond strength gain from the perspective of BOLS correlation. However, themechanism for the adsorbate-induced stress, being a long-historical issue, is yet unclear, in particular,how the stress changes its sign upon increasing the dosage of adsorbate and why different adsorbatescause different kinds of stress at a given surface. Apparently, the processes of adsorbate-induced stresscannot be explained in terms of the potential wells of adsorption.
3.5.2. Electronic origin: charge repopulation and polarizationObservations [220,253] suggested that adsorbate-induced charge redistribution and polarization
could be responsible for the adsorbate-induced surface stress and the corresponding reconstruction.In order to understand the atomistic and electronic origin for the adsorbate-induced surface stress,we briefly discuss here the bond making dynamics with focus on its consequences on the evolutionof bond stress during adsorbate bond making with reference to the previous reports[220,252,253,269].
� O1� induced stress at the Cu(001) and the Rh(001) surfaces
Fig. 14. Fracture cross-sectional SEM morphologies of (a) pure Ti and (b) hydrogen plasma sputtered Ti [263] showed thehydrogen induced transformation from ductile to fragile modes of failure.

Table 5Residual stresses (GPa) of Ti, TiC and diamond coatings deposited with CH4/H2 = 196:4 at a plasma power of 1 kW [267]
Diamond film thickness (lm) 3.8 6.4 8.1 9.2
Diamond XRD (311) �3.42 �3.19 �2.85 �2.41Raman (1332 m�1) �3.5 �3.1 �3.2 �2.1
TiC interlayer XRD (420) �0.505 �0.280 �0.344 �0.303Ti substrate XRD (420) 0.267 0.120 0.118 0.105
C.Q. Sun / Progress in Materials Science 54 (2009) 179–307 219
Fig. 15 compares the STM images and the corresponding bond configurations for the c(2 � 2)–2O1�
reconstruction at the Cu(001) and the Rh(001) surfaces. In both cases, O1� adsorbate occupies thefourfold hollow site. Because of the difference in lattice size (dCu = 0.255 nm; dRh = 0.268 nm) andthe electronegativity (nCu = 2.5; nRh = 2.2), O1� prefers one bond forming with a Cu atom (labeled +)on the surface and polarizes the remaining three Cu atoms nearby. A group of four O1� ions and a pairof O1� ions form two domains (depressed patches in dark) with walls consisting of the interlocked di-poles (bright protrusions). Therefore, the Cu(001)–c(2 � 2)–2O1� surface is fully occupied by theinterlocked dipoles and the atoms attract one another. The surface stress tends to be tensile. Very-low-energy electron diffraction (VLEED) calculations suggested that the O1� forms an off-centered(by 0.02 nm) pyramid positioned 0.04 nm above the surface plane. The spacing between the topand the second atomic layers remains the value for clean Cu(001) surface with the usually measuredcontraction of �10%.
However, the O1� forms a bond with an Rh atom immediately underneath (labeled 1) and polarizesthe remaining four atoms (labeled 2) in the surface. The dipoles point to the open end of the surface.The surface dipoles repel one another and, therefore, compressive stress dominates in the Rh(001)–c(2 � 2)–2O1� surface with a ‘‘radial outgoing” pattern of reconstruction. The Rh(001)–c(2 � 2)–2O1� scenario holds for the Ni(001)–c(2 � 2)–2C1� surface as well with compressive stress domi-nance. Therefore, the same O1� adsorbate induces an opposite stress on the fcc(001) surface of Cuand Rh because of the difference in the electro-negativity and the lattice size of the host elements.
� Cu(001)–(2 � 2p
2)R45�–2O2� compressive stress
On further relaxation of the O-adsorbed Cu(001) surface, the O adsorbate varies its valence valuefrom �1 to �2 at the same coverage of oxygen. As illustrated in Fig. 16, O1� evolves into O2� accom-panied with a Cu(001)–(2 � 2
p2)R45�–2O2� ‘‘missing-row” type reconstruction. The sp-orbital
hybridization of oxygen leads to a tetrahedron with involvement of two bonding and two non-bond-ing orbitals. The non-bonding lone pairs polarize the neighboring Cu atoms to be Cudipole. At theCu(001) surface, Cu3O2 pairing tetrahedron is formed with antibonding dipoles that are coupled oppo-sitely, crossing over the missing row atoms. Because of the dipole–dipole repulsion, compressivestress becomes dominant at the Cu(001)–(2 � 2
p2)R45�–2O2� surface. Therefore, the evolution of
the O1� to the O2� turns the Cu(001) surface stress from tensile to compressive because of chargeredistribution and polarization upon adsorbate bond making.
VLEED quantification reveals that the Cu3O2 formation occurs in four discrete stages and the bondlengths (1-O2� and 2-O2�) are 0.163 nm and 0.175 nm, the bond angle is 104�; the non-bond distance(Cudipole: O2�) is 0.194 nm and the angle (Cudipole: O2�: Cudipole) is around 140�. An expansion from0.175 nm to 0.194 nm occurs to the separation between the top two Cu layers due to O2� insertionfor tetrahedron formation. The pairing O�2: Cudipole: O�2 chains are coupled by the ‘‘dump-bell”-shaped quadruples which cross over the missing-row vacancies, where ‘‘:” represents the non-bondinglone pairs. The atoms ‘‘M” are missing because the bonds with its neighboring atoms are broken andthe ‘‘M” suffers from repulsion of the dipoles. Reconstruction and relaxation are consequences of bondformation and stress release. Similarly, Ag3O2 formation in the Ag(001) surface at temperature below180 K proceeds in the same pattern of Cu3O2. When the temperature is raised, O2� reverts to O1�. Theinverse order of reconstructions of the Cu(001) and Ag(001) results from the difference in lattice sizeand electro-negativity between the two specimens. Similarly, O adsorption also caused Ni surface lat-tice expansion as measured using XRD [268].

Fig. 15. STM images and the corresponding models illustrating O1-induced (a) tensile stress at the Cu(001) surface and (b)compressive stress at the Rh(001) surface.
Fig. 16. STM image [269] and the perspective of the Cu3O2 pairing tetrahedron in the Cu(001)-(2p
2 � p2)R45�-2O2� unit cell[270]. O�2 prefers the center of a quasi tetrahedron. Atoms 1 and 2 are Cu2+ and Cu+. Atom 3 is Cudipole and M is the vacancy ofthe missing Cu. This configuration also applies to Ag(001) low-temperature reconstruction.
220 C.Q. Sun / Progress in Materials Science 54 (2009) 179–307
� C4�, N3�, and O2� induced fcc(001) surface stress
C and N adsorption on a Ni(001) surface and O adsorption on an Rh(001) surface could derive thesame pattern of c(2 � 2)p4g–2A (A = O, N, and C) ‘‘clock” reconstruction as identified using STM and acommon rhombi-chain along the h11i direction, see Fig. 17 [253]. However, careful analysis from theperspective of tetrahedron bond making leads to a pattern of (4
p2 � 4
p2)R45�–16An� reconstruction
with clear identification of the atomic valences of the involved atoms, where An� represents the O2�,N3�, and C4� ions. Atoms labeled 1 and 2 are M+ and Mdipole, respectively. Atoms labeled with 1/2 areM+/dipole. M refers to the metal atoms.
We may take the O–Rh(001) surface as an example for detailed discussion of the bond stress. Asthe O2� has already bonded to one Rh host atom underneath, the tetrahedron defines one Rh+ (labeled1) and two lone-pair-induced Rhdipole (labeled 2) atoms at the unit cell surface. As can be seen from the

C.Q. Sun / Progress in Materials Science 54 (2009) 179–307 221
primary unit cell containing the adsorbate, three of the four surface atomic neighbors are labeled with1, 2, and 2, respectively. Because the surface atomic ratio O: Rh = 1: 2, each oxygen atom bonds to an-other at the surface and needs two atoms to be polarized, therefore, half of the overall surface atomsare defined as Rhdipole and the other half as Rh+/dipole with unlike charge compared with Rhdipole. Onecan find that atoms, labeled 1, change their positions in a clockwise fashion if one counts the O-occu-pied hollows along the h11i direction (gray thick lines). The adsorbate dislocates eccentrically in aperiodic way. From this point of view, it would be essential and complete to consider ac(4p
2 � 4p
2)R45�–16O2� complex unit cell in practice due to the periodicity of the off-centeredadsorbate positions. Strikingly, the ‘rhombi’ hollows without adsorbates form chains along the h11idirection with non-uniform forces of attraction between atoms of unlike charges or repulsion betweenthe like ones. The alternative attraction (1–2) and repulsion (1–1 or 2–2) along the rhombi chain leadsto a tensile response of the O–Rh bonds at the surface.
This process of analysis is also applicable to the (N�3,C�4)–Ni(001) surfaces. Sp-orbital hybridiza-tion of N and C gives one and none non-bonding lone pairs to the N and C centered tetrahedron,respectively, because of their different valences. The label ‘‘1” and ‘‘2” at the N–Ni(001) surface rep-resents Ni+ and Ni+/dipole and the ‘‘1” and ‘‘2” represent the Ni+ and Ni2+ at the C–Ni(001) surface. Therepulsion between the like charges and the attraction between the unlike ones causes a tensile re-sponse of the N–Ni(001) surface bonds. The repulsion throughout the rhombus-chain leads to thecompressive response of the bonds at the C–Ni(001) surface [274]. The bond stress response gives riseto the tensile or the compressive stress for the N3� and C4� induced reconstruction systems, as sum-marized in Table 6. The understanding of C and N induced bond stress at Ni(001) surfaces has led to anovel approach of forming a TiCN graded buffer layer to neutralize the diamond-metal interfacialstress and hence strengthen the diamond-metal adhesion substantially [275].
In summary, oxygen could turn the stress of O–Ag(001) and O–Cu(001) from tensile to compres-sive but turn the stress of O–Rh(001) from compressive to tensile when the O1� evolves into O2� inthe specific surfaces. N turns the stress of N–Ni(001) from compressive to tensile when the N1�
evolves to N3� but C retains the stress of the C–Ni(001) to be compressive when the C1� evolves toC4�. Adsorbate induced stress is therefore very complicated and it is hard to learn without appropriateunderstanding of the process of bond making. These findings may provide improved understanding ofthe adsorbate-induced surface stress and the adsorbate-induced slope change of the temperaturedependence of the surface tension of liquid metals.
3.6. Electric repulsive interface: superfluidity, superlubricity, and superhydrophobicity
3.6.1. ObservationsThe transport of fluid in and around nanometer-sized objects with at least one characteristic
dimension below 100 nm enables the occurrence of phenomena that are impossible at bigger lengthscales [276]. Nanofluids have significantly greater thermal and mass conductivity compared to theirbase fluids [277]. The surface-to-volume ratio increases with miniaturization of both the fluid andthe channel. This high ratio in nanochannels results in surface-charge-governed transport, which al-lows ion separation and is described by an electrokinetic theory of electrical double layer (EDL)scheme, as illustrated in Fig. 18 [278]. The EDL channel can be operated as field-effect transistors todetect chemical and biological species label-free, and transport through nanochannels leads to analyteseparation and new phenomena when the EDL thickness becomes comparable to the smallest channelopening.
As illustrated in Fig. 19a, the rate of the pressure-driven water flow through CNTs is orders high inmagnitude, faster than would be predicted from conventional fluid-flow theory [279]. The thinner ofthe channel diameter is, the faster the flow rate of the fluid will be [280]. This high fluid velocity re-sults from an almost frictionless interface between the CNT wall and the fluidic droplets [281]. Morefascinating observations are the ultralow-friction nanoscale linear bearing and the superlubricity atdry nanocontacts [282,283]. It has been observed using TEM that the inner layer(s) of a MWCNTcan slide back and forth with respect to outer layer(s) of the MWCNT, being free from wear for all cy-cles of motion (see Fig. 19b) [284]. Surface energy calculations suggested that the force retracting thecore nanotubes back into the outer tubes was 9 nN, being much less than the Van der Waals forces

F<11>
i i+1
s s
2
2
2
22
2
1
1
1
1
1
2
21
a rhombi-chain
1 2 2 1 1 2
<
<
<
>
2
22
1
2
11
22
12
2
2
2
2
1>
2
2
1
1
<
Θ
<11>
<11> 2 212 2
1
12
2
21
a
1
2
2
1
-2
22
1
1
1
2
2
2
1
1
1
21
2
1
2<
2 12
2
1
1
12-3
1
1 1
2 1
1
1 1 1 2 2 1 2
1
1 2
2 1
<
< >
11
1
1> 1
<
Θ
Rhombi-chain <11>
<11>
2< 2
21
1
1
11- 4
1
1
11 11
1
11
1
1
1
1
1
1111 11
b c dFig. 17. (a) The non-uniform ‘– 2 – 1 – 1 – 2 – 2 –’ rhombi-chain extracted from the STM images and the corresponding bondconfigurations for (b) the Rh(001)-(4
p2 � 4
p2)R45�-16O�2 [271], (c) Ni(001)-(4
p2 � 4
p2)R45�-16N�3 [272] and (d) Ni(001)-
(4p
2 � 4p
2)R45�-16C�4 [273] to estimate atomic dislocation, driving force, and bond stress. Labels 2 and 1 stand for differentvalences (refer to Table 6) for O�2, N�3 and C�4 induced rhombi-chain. Individual atomic valences are indicated [253].
Table 6Summary of the unit cell rotation angle, U, derived from STM imaging, atomic dislocations along the h11i rhombus-chain, bondstrain, driving force, Fi, bond tension, and T, of the (4
p2 � 4
p2)R45�-16A�n or ‘p4g’ clock rotation [253]
(4p
2 � 4p
2)R45�-16A�n O2�/Rh(001) N3�/Ni(0 01) C4�/Ni(001)
Primary cell rotation U (�) 0.0; 9.0 0.0; 12.0 0.0; 20.0Tangent shift h11i (Å) 0.30 0.37 0.64Bond strain Dd/d (%) 1.2 2.2 6.4Electrostatic forces Fi (dyn) 7.99; 11.09 8.21; 14.59 �3.11; �91.17Bond strength Fb (dyn) 0; 35.16 0; 35.95 0; �133.00Strength of interaction along the rhombus
chain2 � 2 1 � 1 > 0 > 2 � 1 1 � 1 2 � 2 > 0 > 1 � 2 2 � 2 > 2 � 1 > 1 � 1 > 0
Surface atomic states 1: dipole 2: +/dipole 1: + 2: +/dipole 1: +2: 2+
222 C.Q. Sun / Progress in Materials Science 54 (2009) 179–307
pulling the core nanotubes back into their sheath. The removal of the outer layers of the MWCNT wasnot attributed to Joule heating, but rather to ‘‘highly localized dissipation at defect scattering sites,

C.Q. Sun / Progress in Materials Science 54 (2009) 179–307 223
located primarily at the ends of the tube”. This demonstration of low friction between MWCNT layers isvaluable confirmation that they will be useful mechanical components in molecular nanotechnology.
A state of ultralow friction is also reached when a sharp tip slides over a flat surface and the appliedpressure is below a certain threshold, depending on the surface potential sensed by the tip and thestiffness of the contacting materials [285,286]. This phenomenon was explained using the classicalPrandtl–Tomlinson model and its extensions, including thermal activation, temporal and spatial vari-ations of the surface energy corrugation, and multiple-contact effects. Being similar to the superhy-drophobicity, superfluidity, the mechanism behind the superlubricity of dry nanocontacts is yet tobe established.
A principle of fluid flow is that the bottom-most molecules of a liquid stick to the surface of thesolid they are sliding past-creating friction that, for instance, slows down water flowing through apipe. Recent research [287] shows that on the pockets of air between the textured surfaces withmicrometre-scale grooves and posts fluids can slip past friction-free for tiny distances. The slip lengthfor water is almost ten times longer than previously achieved. Therefore, engineered surfaces can sig-nificantly reduce drag in fluid systems. Surface wetting behavior is of great importance in determiningthe application of various materials [288,289]. Many physicochemical processes, such as adsorption,lubrication, adhesion, dispersion, friction and so forth are closely related with the wettability of mate-rials. In the last decade, surfaces with ultra hydrophobicity have aroused much research interest ow-ing to their potential applications in self-cleaning coatings, microfluidics and biocompatible materialsand so on. Superhydrophobic materials have surfaces that are extremely difficult to wet, with water
Fig. 18. Electrical double layer (EDL), shaded in gray, at high ionic strength, it is thin, allowing co-ions and counterions to passthrough the nanochannel. At low ionic strength, the EDL thickness increases, resulting in a counterion-selective nanochannels[276].
Fig. 19. (a) Superfluidity of water droplet in CNTs of different diameters [279], (b) ultralow-friction nanoscale linear bearingmade of multi-walled CNT [284].

224 C.Q. Sun / Progress in Materials Science 54 (2009) 179–307
contact angles in excess of 150�, see Fig. 20a. Many of these very hydrophobic materials found in nat-ure rely on Cassie’s law and are biphasic on the submicrometer level with one component air. Thehydrophobic surface can switch reversibly between superhydrophobicity and superhydrophilicity un-der the influence of UV radiation that creates electron–hole pairs [290]. By extended storage in thedark hydrophilicity is once again lost. Examples of hydrophobic molecules include the alkanes, oils,fats, and greasy substances in general.
3.6.2. Mechanism: interface electric repulsionThe surface wetting was well described using Young equation from perspective of force equation,
as illustrated in Fig. 20b:
cos h ¼ cSG � cSL
cLG
where S, L, G represents the Solid, Liquid and Gaseous phase, respectively, and c the surface tensionresulting from energy densification in the surface skin. Questions remain are the vertical force equi-librium and the electric behavior of the interface. The mechanism of air pocket formation underneaththe liquid droplets could hardly explain the UV irradiation effect. Therefore, the air pocket mechanismand Young equation might not be sufficient for the surface superhydrophobicity. Besides the Youngequation and the air pockets mechanism, we need to consider the elastic and electric behavior ofthe contacts.
The currently developed knowledge about localized charge trapping and polarizing in the surface ofskin depth of both the liquid and the solid may provide a feasible mechanism for the intriguing phe-nomena of superfluidity, superlubricity, and superhydrophobicity. According to the BOLS correlation,the small fluidic drop can be viewed as a liquid core covered with a solid-like, densely charged, andelastic sheet. The energy density, charge density, and the trap depth are coordination dependence.
At the surface of skin depth, the curvature (K�1) dependence of the effective coordination (zi), bondlength (di), charge density (ni), elastic modulus (Bi) or energy density, and the potential trap depth (Ei)follow the relations:8
z1 ¼ 4ð1� 0:75 K�1Þ; z2 ¼ z1 þ 2 ðEffective-coordinationÞdi ¼ Cid ¼ 2d½1þ expðð12� ziÞ=ð8ziÞÞ��1 ðGoldschmidt—Bond—contraction-coefficientÞni ¼ nC�3
i ðCharge-densityÞBi ¼ BC�ðmþ3Þ
i ðBulk-modulusÞEi ¼ EbC�m
i ðpotential-trap-depthÞ
>>>>>>><>>>>>>>:
The densely trapped and the consequently polarized surface and dipole electrons with repel thewall of the channel or the patterned nanostructures. In the outermost two atomic layers of a smallerdroplet, the energy density is higher and the energy level is lower, the effect of trapping and pining iseven more apparent. Therefore, a solid-like shell with densely trapped and polarized electrons inter-acts with the environment in a different manner from that of bigger drops. Accordingly, the inner sur-face of the microchannel also got a densified charges because of the broken-bond-induced trapping.Recent work [293] suggested that the surface charge density increases with the inverse of the dropsize. This mechanism also applies to the inner wall of the pipe. Fig. 21a shows the theoretically pre-dicted curvature (K�1) dependence of the skin charge density, elasticity (energy density), and potentialtrap depth of the outermost shell of a spherical dot. The volume average correspond to the size depen-dence of the elastic modulus such as ZnO (Fig. 11) and the core level shift of nanostructures. As illus-trated in Fig. 21b, the drop and the wall surface are likely charged and they repel each other. Thedroplet will lose its viscosity and becomes frictionless. Such a system runs in a way more like a ‘‘mag-netic levitation train”. Therefore, the repelling of the like charges at both the channel and the solid-likedrop surfaces governs the observed superfluidity. Further investigation in this direction is in progress.
The superhydrophobicity phenomenon can be explained from the viewpoints of geometry and en-ergy. If the air pockets beneath a droplet on a sinusoidal substrate are open to the atmosphere, thesuperhydrophobic state can exist only when the substrate is hydrophobic, and that the geometricparameters of the microstructure have a great influence on the wetting behavior. Being similar to

Fig. 20. (a) Substrate patterns and the superhydrophobicity of water droplets [291] and (b) derivative of the Young equation.Different degrees of wetting. On the left there is much wetting and the contact angle is small. On the right little wetting and thecontact angle is large. Young equation is obtained by writing the force equations according to the drawing cSG � cSL ¼ cLG cos h[292].
C.Q. Sun / Progress in Materials Science 54 (2009) 179–307 225
the superfluidity, polarization of the surface or the presence of lone pair electrons happens to both thefluidic drop and the material. The charged surface repels the ambient charged particles, such as watermolecules, to result in superhydrophobicity. The UV radiation removes the polarized charges and thedark storage recovers the surface dipoles, being the same as the surface magnetism of noble metalclusters and the dilute magnetism of oxide nanostructures [294,295]. Therefore, the surface geometricand electronic effects of both the nanostructures and the liquid drops may provide a feasiblemechanism.
The mechanism of interface electric repulsion also applies to the frictionless CNT linear bearing andthe superlubricity of nanocontacts. As will be discussed in Section 5, the bond contraction happens tothe CNT of limited number of walls. Bonds near the open ends contract even further. Densification ofboth the r- and p-electrons takes place to all the walls; the repulsion between the densely packed andlocalized like charges will reduce the friction force substantially, while the electrostatic forces of theadditionally densely charged CNT ends may provide force of retraction motion and oscillation. In thenanocontacts, the saturated potential barrier due to the skin charge trapping of the nanocontacts alsoprovide a repulsion force between the contacts.
3.7. Nitrogen enhanced elasticity and hardness
3.7.1. ObservationsNitrogenation of metals has been a fully developed technology for hardness and elasticity enhance-
ment of a surface [296–302]. Even though the hardness and elasticity of nitrides has been intensivelyinvestigated and widely utilized, neither the local bonding structure, nor the microstructure corre-sponding to the observed mechanical properties, are well established [262,303].

0.0 0.1 0.2 0.3 0.4
0
1
2
3
Rel
ativ
e ch
ang
e
K-1
Skin Charge Density Skin Elasticity Skin Potential trap depth
a b c
Fig. 21. (a) Theoretically predicted curvature (K�1) dependence of the skin charge density, elasticity (energy density), andpotential trap depth of the outermost shell of a spherical dot, (b) the schematic illustration of the ‘‘electric levitation”mechanism, being similar to that of (c) the magnetic levitation train. Dots represent the locked surface monopoles induced bythe local strain and quantum trapping or the lone pair induced dipoles at the open end of surfaces by O, N, F addition.
226 C.Q. Sun / Progress in Materials Science 54 (2009) 179–307
Recently, we found that the joint effect of surface bond contraction, bond nature alteration, and theinvolvement of non-bonding lone-pair is crucial to the hardness and elasticity of the nitride surfaces.Nanoindentation measurements revealed that the elastic recovery of TiCrN and GaAlN surfaces couldreach as high as 100% and the nitride films are harder under a relatively lower indentation load(<1.0 mN) than the amorphous carbon (a-C) films that are slightly softer and less elastic at the sameload scale of indentation. The same trend has been observed by Wang et al. [304]. At a nanoindenta-tion load of 1 mN and below, the hydrogenated CN:H film is harder and more elastic (75% elasticrecovery) compared with that of a-C:H (60% elastic recovery). However, at higher indentation load, ni-tride films are softer than the a-C films or polycrystalline diamond. For C and Ti nitride films, the elas-tic recovery ranges from 65% to 85% at higher indentation load (5 mN). The friction coefficient of thenitride films increases suddenly at critical loads for TiN and CN (5 N) indicating the breaking of thesurface bonds. Similarly, sapphire (a-Al2O3) with lone-pair presence [305] exhibits a pop-in (a suddenshape change of the stress-depth profile shape) critical load at 1.0 mN below which the elastic recov-ery of the specimen is 100% under nanoindentation. The higher pop-in critical load of sapphire mayindicate the breaking the high-density lone pairs in the oxide.
3.7.2. Atomistic understandingWe may consider a typical case in which the N reacts with metal atoms in a surface of C3v symme-
try, such as the fcc(111) and hcp(0001) planes [262,306]. The N3� ion is located in between the toptwo atomic layers with the lone pair being directed into the substrate. The surface is hence networkedwith the smaller M+ and the saturate bonded N3� ionic cores with densely packed electrons. The out-ermost shells of the M+ ions are emptied due to charge transportation upon bond formation. Therefore,the top surface layer should be chemically inert as it is hard for one additional acceptor to catch elec-trons from the deeper energy levels of the M+ ions. Electrons in the saturated bond should be morestable compared with the otherwise unbonded ones in the neutral host atoms.
The high intra-surface strength due to the ionic networking could be responsible for the hardnessof the top atomic layer. On the other hand, the N3�–M+ network at the surface is connected to the sub-strate mainly through the non-bonding lone pairs. The non-bonding interaction is rather weak(�0.05 eV per bond) compared with the initially metallic bonds (�1.0 eV per bond) or the intra-sur-face ionic bond (2–3 eV per bond). The weak interlayer interaction due to lone-pair formation shouldbe highly elastic within a certain range of loads, which makes the two adjacent surface layers moreelastic at an indent load lower than a critical value at which the lone pairs will break. Therefore,the enhanced intralayer strength makes a nitride usually harder, and the weakened interlayer bondingmakes the nitride highly elastic and self-lubricating. Results of indentation at various loads and thesliding friction measurements agree with the anticipated high elasticity and high hardness at lowerindent load and the existence of the critical scratching load.
The surface ionic layer determines the hardness of a nitride coating and the surface bond contrac-tion further enhances the hardness at the surface. The lone pairs are responsible for the high elasticity
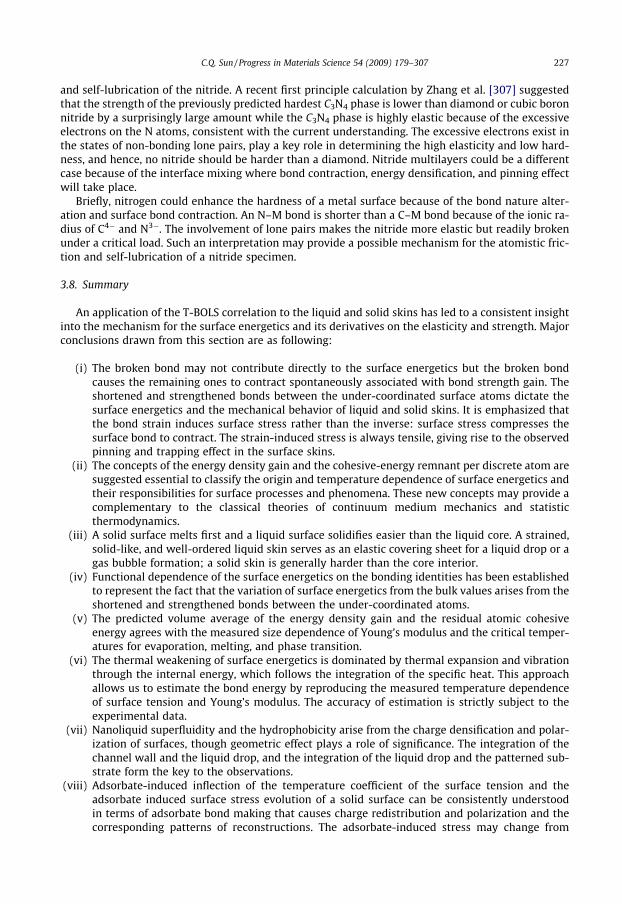
C.Q. Sun / Progress in Materials Science 54 (2009) 179–307 227
and self-lubrication of the nitride. A recent first principle calculation by Zhang et al. [307] suggestedthat the strength of the previously predicted hardest C3N4 phase is lower than diamond or cubic boronnitride by a surprisingly large amount while the C3N4 phase is highly elastic because of the excessiveelectrons on the N atoms, consistent with the current understanding. The excessive electrons exist inthe states of non-bonding lone pairs, play a key role in determining the high elasticity and low hard-ness, and hence, no nitride should be harder than a diamond. Nitride multilayers could be a differentcase because of the interface mixing where bond contraction, energy densification, and pinning effectwill take place.
Briefly, nitrogen could enhance the hardness of a metal surface because of the bond nature alter-ation and surface bond contraction. An N–M bond is shorter than a C–M bond because of the ionic ra-dius of C4� and N3�. The involvement of lone pairs makes the nitride more elastic but readily brokenunder a critical load. Such an interpretation may provide a possible mechanism for the atomistic fric-tion and self-lubrication of a nitride specimen.
3.8. Summary
An application of the T-BOLS correlation to the liquid and solid skins has led to a consistent insightinto the mechanism for the surface energetics and its derivatives on the elasticity and strength. Majorconclusions drawn from this section are as following:
(i) The broken bond may not contribute directly to the surface energetics but the broken bondcauses the remaining ones to contract spontaneously associated with bond strength gain. Theshortened and strengthened bonds between the under-coordinated surface atoms dictate thesurface energetics and the mechanical behavior of liquid and solid skins. It is emphasized thatthe bond strain induces surface stress rather than the inverse: surface stress compresses thesurface bond to contract. The strain-induced stress is always tensile, giving rise to the observedpinning and trapping effect in the surface skins.
(ii) The concepts of the energy density gain and the cohesive-energy remnant per discrete atom aresuggested essential to classify the origin and temperature dependence of surface energetics andtheir responsibilities for surface processes and phenomena. These new concepts may provide acomplementary to the classical theories of continuum medium mechanics and statisticthermodynamics.
(iii) A solid surface melts first and a liquid surface solidifies easier than the liquid core. A strained,solid-like, and well-ordered liquid skin serves as an elastic covering sheet for a liquid drop or agas bubble formation; a solid skin is generally harder than the core interior.
(iv) Functional dependence of the surface energetics on the bonding identities has been establishedto represent the fact that the variation of surface energetics from the bulk values arises from theshortened and strengthened bonds between the under-coordinated atoms.
(v) The predicted volume average of the energy density gain and the residual atomic cohesiveenergy agrees with the measured size dependence of Young’s modulus and the critical temper-atures for evaporation, melting, and phase transition.
(vi) The thermal weakening of surface energetics is dominated by thermal expansion and vibrationthrough the internal energy, which follows the integration of the specific heat. This approachallows us to estimate the bond energy by reproducing the measured temperature dependenceof surface tension and Young’s modulus. The accuracy of estimation is strictly subject to theexperimental data.
(vii) Nanoliquid superfluidity and the hydrophobicity arise from the charge densification and polar-ization of surfaces, though geometric effect plays a role of significance. The integration of thechannel wall and the liquid drop, and the integration of the liquid drop and the patterned sub-strate form the key to the observations.
(viii) Adsorbate-induced inflection of the temperature coefficient of the surface tension and theadsorbate induced surface stress evolution of a solid surface can be consistently understoodin terms of adsorbate bond making that causes charge redistribution and polarization and thecorresponding patterns of reconstructions. The adsorbate-induced stress may change from

228 C.Q. Sun / Progress in Materials Science 54 (2009) 179–307
situation to situation depending on the configuration of surface bonding networks. The involve-ment of non-bonding lone pairs and the bond nature alteration in nitrogenation makes a nitridesurface highly elastic and robust at relatively lower indentation or scratching load.
4. Monatomic chains: bond length, strength and maximal strain
� With involvement of neither atomic gliding dislocation nor bond unfolding, monatomic chain forms anideal prototype of bond stretching investigation.
� A bond in a monatomic chain contracts by 30% at equilibrium and the bond energy increases by 43% com-pared with the bond in the bulk counterpart.� A monatomic chain melts at 0.418Tm; metallic chains could form at 0.4Tm with caution in operation.� The breaking limit of the bond varies exponentially with the inverse separation (Tmi � T) between the
chain melting point and the temperature of operation.
4.1. Observations
4.1.1. Temperature dependence of maximal strainA metallic monatomic chain (MC) is an ideal prototype of a nanowire for extensibility and mechan-
ical strength study as the extension of an MC involves only the process of bond stretching withoutother processes such as bond unfolding or atomic gliding dislocations, as experienced by atoms incoarse-grained metallic chunks under external mechanical stimuli [308]. The intriguing phenomenaappearing in MCs include the quantum conductance, higher chemical reactivity, lower thermal stabil-ity, and the unusually high mechanical strength and ductility. The quantum conductance has beenwell understood as arising from the enlarged sub-level separation, known as the Kubo gap, dk = 4EF/3N, where EF is the Fermi energy of the bulk solid and N is the total number of atoms of the cluster[309,310]. The atomic chains of Au and Ag exhibit semiconductor features with a calculated bandgap of 1.3 eV for Au and 0.8 eV for Ag with reasons yet to be clear [311]. However, knowledge aboutthe equilibrium bond length, strength, extensibility, maximum strain, specific heat, and the thermaland chemical stability of the MC bond is still preliminary and the results are sometimes controversial.
For instance, the stretching limit of the Au–Au distance in the Au–MC has been measured usingTEM at room temperature in the range of 0.29 nm [312], 0.36 nm (±30%) [313], 0.35–0.40 nm [307],and even on a single occasion as 0.48 nm [101]. The interatomic distance in the stress-free Au atomicwires was measured also to vary from 0.24 nm to 0.34 nm with an estimated average of0.26 ± 0.02 nm at room temperature [314]. However, at 4.2 K, the breaking limit of the Au–Au bondis reduced to 0.23 ± 0.04 nm as measured using STM and to 0.26 ± 0.04 nm as measured usingmechanically controllable break junctions [100]. The standard bulk value of the Au–Au distance is0.288 nm. STM measurement [315] also revealed at 4.2 K that the Ir–MC and the Pt–MC breakinglengths are 0.22 ± 0.02 nm and 0.23 ± 0.02 nm, respectively, being substantially shorter than the cor-responding bulk values of 0.271 nm and 0.277 nm. Low temperature measurements of the MCs show acommonly large extent of bond contraction with respect to the bulk values despite the applied tensilestress. Unfortunately, numerical calculations for the impurity-free Au–MC have yielded a maximumAu–Au distance of 0.31 nm under tension [102,316–318], which hardly match the values measuredat the ambient or at the extremely low temperatures in ultra-high vacuum.
An EXRAFS study [319] revealed that the covalent bond in the Tellurium monatomic chain(0.2792 nm) is shorter and stronger than the bonds (0.2835 nm) in the triagonal Te (t-Te) bulk struc-ture. The Debye–Waller factor (square of the mean amplitude of lattice vibration) of the Te chain islarger than that of the bulk but the thermal evolution of the Debye–Waller factor is slower than thatof the bulk also suggesting hardening of the bond, see Fig. 22a. Fig. 22b shows the XRD measurementof the temperature dependences of the interplanar spacing d of the (220) plane for the annealed Ninanowire arrays (45 nm) and the annealed bulk Ni [320]. The results indicate that the bonds betweenatoms for Ni nanowires are stronger than those for bulk Ni. These findings demonstrate evidently theshorter and stronger bonds with greater amplitude of vibration and slower thermal expansion of thebonds between the under-coordinated atoms.
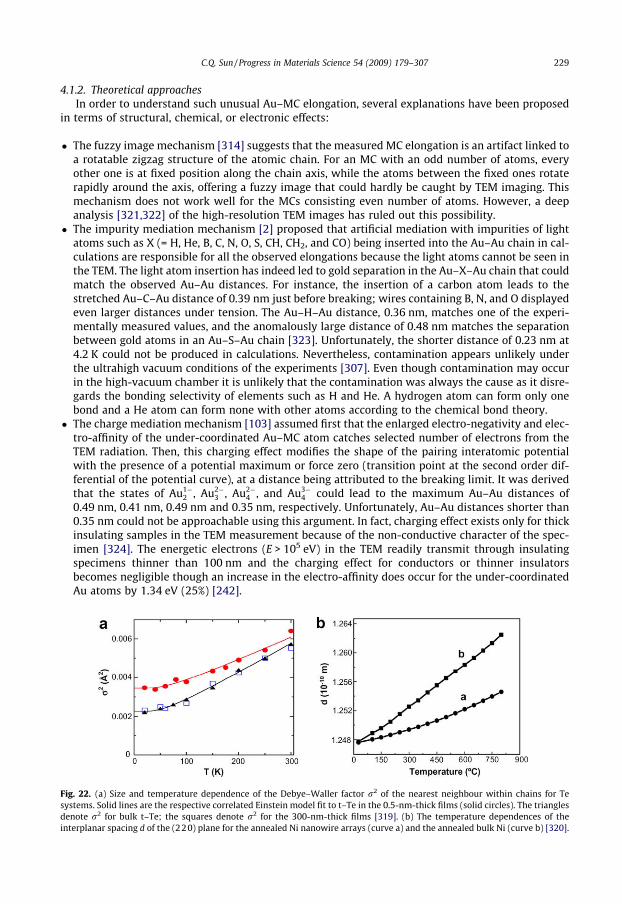
C.Q. Sun / Progress in Materials Science 54 (2009) 179–307 229
4.1.2. Theoretical approachesIn order to understand such unusual Au–MC elongation, several explanations have been proposed
in terms of structural, chemical, or electronic effects:
� The fuzzy image mechanism [314] suggests that the measured MC elongation is an artifact linked toa rotatable zigzag structure of the atomic chain. For an MC with an odd number of atoms, everyother one is at fixed position along the chain axis, while the atoms between the fixed ones rotaterapidly around the axis, offering a fuzzy image that could hardly be caught by TEM imaging. Thismechanism does not work well for the MCs consisting even number of atoms. However, a deepanalysis [321,322] of the high-resolution TEM images has ruled out this possibility.
� The impurity mediation mechanism [2] proposed that artificial mediation with impurities of lightatoms such as X (= H, He, B, C, N, O, S, CH, CH2, and CO) being inserted into the Au–Au chain in cal-culations are responsible for all the observed elongations because the light atoms cannot be seen inthe TEM. The light atom insertion has indeed led to gold separation in the Au–X–Au chain that couldmatch the observed Au–Au distances. For instance, the insertion of a carbon atom leads to thestretched Au–C–Au distance of 0.39 nm just before breaking; wires containing B, N, and O displayedeven larger distances under tension. The Au–H–Au distance, 0.36 nm, matches one of the experi-mentally measured values, and the anomalously large distance of 0.48 nm matches the separationbetween gold atoms in an Au–S–Au chain [323]. Unfortunately, the shorter distance of 0.23 nm at4.2 K could not be produced in calculations. Nevertheless, contamination appears unlikely underthe ultrahigh vacuum conditions of the experiments [307]. Even though contamination may occurin the high-vacuum chamber it is unlikely that the contamination was always the cause as it disre-gards the bonding selectivity of elements such as H and He. A hydrogen atom can form only onebond and a He atom can form none with other atoms according to the chemical bond theory.
� The charge mediation mechanism [103] assumed first that the enlarged electro-negativity and elec-tro-affinity of the under-coordinated Au–MC atom catches selected number of electrons from theTEM radiation. Then, this charging effect modifies the shape of the pairing interatomic potentialwith the presence of a potential maximum or force zero (transition point at the second order dif-ferential of the potential curve), at a distance being attributed to the breaking limit. It was derivedthat the states of Au1�
2 , Au2�3 , Au2�
4 , and Au3�4 could lead to the maximum Au–Au distances of
0.49 nm, 0.41 nm, 0.49 nm and 0.35 nm, respectively. Unfortunately, Au–Au distances shorter than0.35 nm could not be approachable using this argument. In fact, charging effect exists only for thickinsulating samples in the TEM measurement because of the non-conductive character of the spec-imen [324]. The energetic electrons (E > 105 eV) in the TEM readily transmit through insulatingspecimens thinner than 100 nm and the charging effect for conductors or thinner insulatorsbecomes negligible though an increase in the electro-affinity does occur for the under-coordinatedAu atoms by 1.34 eV (25%) [242].
Fig. 22. (a) Size and temperature dependence of the Debye–Waller factor r2 of the nearest neighbour within chains for Tesystems. Solid lines are the respective correlated Einstein model fit to t–Te in the 0.5-nm-thick films (solid circles). The trianglesdenote r2 for bulk t–Te; the squares denote r2 for the 300-nm-thick films [319]. (b) The temperature dependences of theinterplanar spacing d of the (220) plane for the annealed Ni nanowire arrays (curve a) and the annealed bulk Ni (curve b) [320].

230 C.Q. Sun / Progress in Materials Science 54 (2009) 179–307
Nevertheless, these models are facing difficulties in quantifying the low-temperature Au–Au, Pt–Pt,and Ir–Ir distances that are 15–20% shorter than the bulk values. Therefore, mechanism for the MCelongation is still open for debate. Encouragingly, sophisticated DFT calculations [325] suggest thatthe pairing potential is valid and the Au–Au equilibrium distance (without the presence of an externalstimulus) is between 0.232 nm and 0.262 nm and the cohesive energy per bond increases by 200%from �0.51 eV to �1.59 eV. Similar trends are also found for other metallic MC such as Pt, Cu, andAg in theory although experimental observation of such MC formation at room temperature has beenlimited. According to ab initio calculations and STM measurements [59], the mechanical strength ofthe Au–Au bond is about twice that of the bulk value and the metals that form chains exhibit pro-nounced many-atom interactions with strong bonding in the lower-coordinated systems. Results froma combination of high-resolution TEM and MD simulation [326] suggested that different initial crys-tallographic orientations lead to very differentiated linear Au atomic chain formations and suggestedthat the kinetic aspects such as temperatures and elongation rates strongly affect the morphology andchance of MC formation. In addition to the DFT approaches, Jiang et al. [327] correlated the formationtendency of a MC under tensile stress to the ratio between the Peierls stress of a bulk crystal havingdislocations and the theoretical shear breaking stress of the MC. They suggested that the metallic ele-ments having the largest Poisson’s ratio hold the largest MC forming ability since such metals have thesmallest elastic energy storage within the crystals and can thus endure the largest plastic deformation.
4.2. T-BOLS derivatives
4.2.1. Chain melting energeticsIt is known that the temperature of melting of an atom with zi coordinates, Tmi, is proportional to
the atomic cohesive energy, Tmi / ziEi [328,329]. It is understandable that if one wants to melt or ther-mally rupture the bond, one has to provide thermal energy that is a certain proportion of the entirebinding energy. However, breaking a bond mechanically at a temperature T needs energy that equalsto the net bond energy at T:
EbðTÞ ¼Ebð0Þ �
R t0 g1ðtÞdt ðT 6 hDÞ
g2 þ g1ðTm � TÞ ðT > hDÞ
(
EiT ¼ Eið0Þ �Z T
0g1iðtÞdt ¼ g2i þ
Z Tm
Tg1iðtÞdt ¼ C�m
i Ebð0Þ � zbiR T
0 g1ðtÞdt ðT 6 hDÞ C�m
i g2 þ zbig1ðTm � TÞ ðT > hDÞ
( ð24Þ
The constant g2i represents the 1/zi fold energy that is required for evaporating a molten atom in theMC with zi = 2. g1i and g2i can be determined with the known C�m
i and the known bulk values of g1 andg2 that vary with crystal structures [175].
4.2.2. Elasticity and extensibilityConsidering the contribution from heating, the strength and compressibility (under compressive
stress) or extensibility (under tensile stress) at a given temperature can be expressed as
Piðzi; TÞ ¼ �ouðr; TÞ
ov� Biðzi; TÞ ¼
�Vo2uðr; tÞoV2
�����di
/ NiEiðTÞd3
i ðTÞ
biðzi; TÞ ¼ �oV
VoP
����T
/ ½Biðzi; TÞ��1
ð25Þ
Theoretically, b is in an inverse of the bulk modulus in dimension. However, does not contribute tothe extensibility for the molten state as it approaches infinity at Tm. The Ni is the total number of bondsin the d3
i volume. Calibrated with the bulk value at T0, the reduced temperature dependence of the lin-ear extensibility for the MC will be
biðzi; TÞb0ðzi; TÞ
¼ dið1þ aiTÞdð1þ aT0Þ
� g1ðTm � T0Þg1iðTmi � TÞ ð26Þ

C.Q. Sun / Progress in Materials Science 54 (2009) 179–307 231
Note that the bond number density in the relaxed region does not change upon relaxation (Ni ffiNbulk). For instance, bond relaxation never changes the bond number between the neighboring atomsin an MC (s = 1) whether it is suspended or embedded in the bulk, nor does it change the number den-sity between the circumferential atomic layers of a solid.
4.2.3. Maximum strainIntroducing the following effects: (i) atomic CN-imperfection-induced bond contraction, (ii) ther-
mal expansion (with linear coefficient ai), and (iii) the temperature dependence of extensibility (withcoefficient bi), leads to an analytical expression for the distance between two nearest atoms in theinterior of a MC, as a function of atomic CN, mechanical (P), and thermal (T) stimuli:
diðzi; T; PÞ ¼ d� CðziÞð1þ aiTÞ½1þ biðzi; TÞP�
or the maximum strain at constant T
DdiMðzi; T; PÞdiðzi; T; oÞ
¼ bðzi; TÞP ð27Þ
where diðzi; T;0Þ ¼ d� CðziÞð1þ aiTÞ is the bond length at T without mechanical stretching. At the bulkTm, the linear thermal expansion (ai � Tm) is around 3% for most metals, which is negligibly small com-pared with Ci. Considering the energy for mechanical rupture, as given in Eq. (24), we have therelation:
Z diMðzi ;T;PÞdiðzi ;T;0ÞP dx ¼ �P½dMiðzi; T; PÞ � diðzi; T;0Þ� ¼ �PDdiMðzi; T; PÞ ¼ EiðTÞ ¼ g2i þ g1iðTmi � TÞ ð28Þ
The mechanical rupture energy has the same value as the thermal energy required for evaporatingthe same atom by warming it up from the initial T. One can approximate the P to the mean �p, if thedim(zi,T,P) represents the breaking limit, as the integral is a constant. Combining Eqs. (27) and (28),one has
�P ¼ � EiðTÞbðzi; TÞ � diðzi; T;0Þ
� 1=2
ð29Þ
For tensile stress, �p takes a positive value; for compressive stress, �p is negative. The combination ofEqs. (26) and (29) yields the maximum strain of a bond in the MC
DdiMðzi; T; PÞdiðzi; T; 0Þ
¼ biðzi; TÞ�P ¼bðzi; TÞ � EiðTÞ
diðzi; T;0Þ
� 1=2
¼ g1diðzi; T;0Þ � b0ðz; T0Þg1id� diðzi; T;0Þ
� Tm � T0
Tm;i � T
� �� ½g1iðTm;i � TÞ þ g2i�
� �1=2
¼ b0g1ðTm � T0Þd
1þ g2i
g1iðTm;i � TÞ
� �� �1=2
¼ b0g1ðTm � T0Þd
� �1=2
expg2=g1
2½Tm � T=ð1þ DiÞ�
�
¼ B� expA
Tm � T=ð1þ DiÞ
� ð30Þ
where 1þ Di ¼ zibC�mi . For a metallic MC with zi = 2 and m = 1, the melting point is,
Tm;i / zibc�1i Tm ¼ Tm=4:185 ¼ 0:239Tm. If the g2i is taken into consideration in the extensibility expres-
sion of Eq. (26), the strain will remain constant without features of temperature dependence:
DdiMðzi; T; PÞdiðzi; T; 0Þ
¼ zibb0ðz; T0Þd
� EbðT0ÞEiðTÞ
� EiðTÞ� �1=2
¼ const:
This derivative evidences the validity of Born’s criterion applying to the extensibility.

232 C.Q. Sun / Progress in Materials Science 54 (2009) 179–307
The analytical expression of the maximum strain varies inapparently with the extrinsic parameterP or the strain rate, but depends intrinsically on the inverse separation of Tmi � T in an exponentialway. When the temperature approaches Tmi, the strain will approach infinity. The constant A = g2/2g1 is crystal structure dependent. The factor B depends on the nature of the material and varies withthe bulk extensibility (at T0), bond length, and Tm as well as the specific heat per bond in the bulk.
4.3. Bonding identities quantification
4.3.1. Atomic equilibrium distanceFor a spherical dot at the lower end of the size limit, Kj = 1.5 (Rj = Kjd = 0.43 nm for an Au spherical
dot), c1j = 1, c2j = c3j = 0, and z1 = 2, which is identical in situation to an atom in the MC. At Rj = 0.43 nm,the Au–Au distance contracts by �30% from 0.288 nm to �0.201 nm. According to the BOLS correla-tion premise, it is not surprising that the value of 0.23 ± 0.04 nm of Au–Au breaking limit measuredat 4.2 K under tension [100] is simply a �15% strain response to the tensile stress of the original equi-librium bond length, 0.201 nm. Similarly, the values of 0.22 ± 0.02 nm and 0.23 ± 0.02 nm measured at4.2 K for Ir and Pt monatomic chains [313], respectively, are also 16% and 19% strain response to thetensile stress of the equilibrium MC bond length (0.190 nm and 0.194 nm, respectively) that are 30%shorter than the bulk values of 0.271 nm and 0.277 nm.
4.3.2. Binding energy and thermal stabilityThe core level shift measured using X-ray photoelectron spectroscopy (XPS) represents crystal bind-
ing energy and the melting point stands for the thermal stability. According to the BOLS correlation, therelative change of the core level energy and the melting point of a nanosolid are expressed as [1]
DTmðzi;m;KjÞTmðz;m;1Þ
¼Xi63
cijðzibC�mi � 1Þ
Ecðzi;m;KjÞ � Ecðz;m;1ÞEcðz;m;1Þ � Ecð1Þ
¼Xi63
cijðC�mi � 1Þ
ð31Þ
The term Ecðz;m;1Þ� Ecð1Þ is the bulk core-level shift and the Ec(1) reference energy level of anisolated atom of the specimen.
Fig. 23a shows the reproduction of the measured size dependence of the Au-4f core-level shiftDE4f(Kj) for Au nanofilms deposited on octanedithiol [330], TiO2 [331] and Pt [332] substrates, andthiol-capped Au particles [333]. Results indicate that the bond energy of an Au–MC is increased byC�1
i � 1 ¼ 1=0:7� 1 � 43%. Results also imply that the Au-4f core-level drops abruptly from that ofan isolated atom by a maximum of 43% upon the MC (or a fcc unit cell) being formed and then theshift recovers in a K�1
j fashion to the bulk value when the solid grows from atomic scale to macro-scopic size [112]. The core-level shift corresponds to an electro-affinity enlargement that can be esti-mated from the known bulk E-4f shift of 2.87 eV to be 1.34 eV [111], which may provide quantizationof the observed densely-and-deeply trapped ‘‘end states” of the gold chain on a Si substrate [141].
Calibrated with Tm(1) = 1337.33 K and by use of the same m (= 1) value used in calculating theE4f(Kj), we obtained the theoretical Tm-suppression curves for different shapes, which are comparedin Fig. 23b with the measured size-dependent Tm of Au on W [334] and C [335] substrates, and Au par-ticles encapsulated in a Silica matrix [336]. The theoretically predicted melting curves merge at thelower end of the size limit, Kj = 1.5 with a �76% Tm suppression, being identical to the predicted tem-perature of the MC melting (0.239Tm). Therefore, thermal rupture of the Au–Au chain occurs just be-low the temperature for the MC melting of 320 K that is a 0.239 fold of the bulk Tm of 1337.33 K. Atlow temperatures, the shortened bond is twice as strong ðstrength ¼ Ei=di / C�2
i ¼ 0:7�2 2Þ, agree-ing with that predicted in Ref. [59]. This result means that more force is required to stretch or com-press the bond in the MC by the same length compared to the force needed to stretch the samebond in the bulk at the same temperature. This finding also explains why the thermal expansion coef-ficient of the mesoscopic system is smaller than the bulk value [166–170]. Table 7 lists the informationderived from the reproduction of the size dependence of the Au-4f level shift and the melting pointsuppression of Au nanosolids.

C.Q. Sun / Progress in Materials Science 54 (2009) 179–307 233
4.3.3. The breaking limit and the specific heatIn order to examine the validity of the prediction, we employed the known values of thermal
expansion coefficient a = 14.7 � 10�6 K�1, Tm = 1337.33 K, and d = 0.2878 nm to predict the maximumstrain of the Au–MC using Eq. (30). With the measured breaking limits of dim(4.2 K) = 0.23 nm [100],and the mean dim(300 K) = 0.35 nm [307,310,311], Eq. (30) leads to the quantification of the two un-known parameters of b0 = 5.0 TPa�1 and g2i/g1i = 64 K.
Using the relation Ei ¼ c�1i Eb, or, g1iTm;i þ g2i ¼ C�1
i ðg1Tm þ g2Þ and the given g1 = 0.0005542 eV/Kand g2 = �0.24 eV for the fcc structures [175], we obtained g1i = 0.0033325 eV/K and g2i = 0.2128 eV.The correct bulk value of g2 = Cig2i = 0.14897 eV, being compatible with that of diamond structuresof g2 = 0.24 eV. The g2 < 0 in Ref. [175] means that the actual energy for evaporating the molten atomis included in the term of g1Tm, and therefore, the g1 may not represent the true value of the specificheat per coordinate. Accuracy of solutions gained herewith is subject strictly to the given g1 and g2
values and the precision of the measured diM(T – 0) values used for calibration, as no freely adjustableparameters are involved in the iteration of calculations.
A refinement of Eqs. (28) and (30) by taking the pressure-induced deformation energy into consid-eration may lead to a high g2i/g1i ratio without changing the trend of the predicted strain–temperaturerelation.
Fig. 24a compares the calculated maximum strain versus T/Tm with the measured values for theAu–MC at various temperatures. It is exciting to find that the theoretical curve covers all the divergentvalues measured at 4.2 K (0.23 ± 0.04 nm) and at the ambient temperatures (298 ± 6 K, 0.29–0.48 nm).The divergent data are actually centered at some 22 K below the melting point, 320 K, of the Au–MCwith a 6 K fluctuation. The fluctuation may arise from differences in the temperature of testing, or thestrain rate applied during measurement. Therefore, all reported values of Au–Au bond breaking aretruly correct but the measurements might have been conducted in different seasons or differentlocations.
According to Egerton [324], the temperature rise of a TEM specimen in micrometer size caused byelectron beam in the TEM is less than 2 K. The heat energy released from bond stretching may contrib-ute to the actual temperature of the specimen but it is expected to be insignificant and is common toall measurements. Interestingly, the 16–19% elongation limits of Ir–MC and Pt–MC measured using anSTM at 4.2 K are also within the prediction. The result shows clearly that the divergent values of thebreaking limit measured at the ambient temperature is dominated by the extensibility factor that in-creases exponentially with temperature and reaches infinity at Tmi.The thermal and mechanical fluc-tuations in the measurement also play a role of significance. Therefore, the proposed mechanisms of
0 2 4 6 8
0
10
20
30
40
50a m = 1, dot m = 1, plate Au/TiO
2
Au/Octan Au/Pt Au/thiol
Au
4f-
leve
l sh
ift
(%)
Kj
0 10 20 30 40-80
-60
-40
-20
0b
Tm
su
pp
ress
ion
(%
)
Kj
Au/SiO2
Au/C Au/W Dot, m = 1 Plate, m = 1
Fig. 23. Theoretical reproduction of the measured size dependence of (a) [E4f(Kj) � E4f(1)]/[E4f(1) � E4f(1)] of Au (nano-dot) ondifferent substrates with derived information as given in Table 7, and, (b) [Tm(Kj) � Tm(1)]/Tm(1) of Au nanosolids on varioussubstrates, showing strongly interfacial effects and the dimensionality-based transition of the melting point of an Au nanosolid.Melting at the lower end of the size limit (K = 1.5, z = 2) corresponds to the situation of an Au–MC melting at 0.239 Tm.

Table 7The length and energy of the Au–Au bond in the monatomic chain and the core-level energy of an isolated Au atom obtained fromdecoding the size-dependent E4f(Kj) and Tm(Kj) of nanosolid Au
Au/Octan Au/TiO2 Au/Pt Au/Thiol
s (dimensionality) 3 1 3E4f (eV) �81.504 �81.506 �81.504 �81.505DE4f (1)(eV) �2.866 �2.864 �2.866 �2.865dMC/d 0.2001/0.2878 = 0.7EMC/Eb 1.43PMC/P (strength) 2.0Tm,MC/Tm (1) 1/4.185 = 0.239
234 C.Q. Sun / Progress in Materials Science 54 (2009) 179–307
fuzzy imaging, impurity mediation, or charge mediation may need revision by taking the intrinsic ef-fect of bond order deficiency on the strength and thermal stability of the MC bond into consideration.
Fig. 24a also suggests that the dominant factor Tm has slight influences on the breaking mode of aMC. The bond of a low Tm specimen breaks more readily at low temperature than the bond of a high Tm
specimen; the bond of the low Tm specimen is more easily extended as T approaches Tmi than the oneswith higher Tm values.
The above analysis for metallic MC elongation also applies to the elongation of organic molecularchains. A curve shown in Fig. 24b for the monomer persistence length versus temperature of a singlepolymer chain adsorbed on an Au(111) substrate showed a similar trend of temperature dependentextensibility to that for the Au–MC despite the complexity of polymer extension because of theinvolvement of worm-like extension and bond unfolding [337]. The rupture occurs at 315 K and themonomer increases its length from 0.18 nm to 0.38 nm in an exponential way when the temperatureis increased from 300 K to 318 K though the rupture event was a stochastic process and depends onmany factors such as pulling speed, bond strength, and the temperature of operation.
4.3.4. Criteria for MC formationEquation (30) indicates that a metallic MC melts at a temperature of a factor of 1/4.185 (0.239) of
the bulk value Tm. Observations suggest that a metallic MC could be readily made at a temperaturethat is �20 ± 6 K lower than its melting point, Tmi. Therefore, if one wants to make a MC of a certain
0.00 0.05 0.10 0.15 0.20 0.250
30
60
90
120
150
Max
imal
Str
ain
(%
)
T/Tm,bulk
Au - MC Ir - MC Pt - MC T
m= 600 K (Pb)
Tm= 1337 K (Au)
Tm= 2045 K (Pt)
300 305 310 315 3200.15
0.20
0.25
0.30
0.35
0.40
Per
sist
ence
len
gth
(n
m)
T (K)
Polymer-chain L = 0.065*exp(35/(338-T))
a b
Fig. 24. (a) Temperature (x = T/Tm) dependence of an MC breaking limit in comparison with values for an Au–MC measured at4.2 K (0.23 ± 0.04 nm) and at ambient (298 ± 6 K, 0.29–0.48 nm) indicates that the scattered data arise from temperaturedependent extensibility and the thermal and mechanical fluctuations near the melting point of the Au–MC. Varying the Tm
changes slightly the ease of MC bond breaking at different temperatures. The 16–19% elongation of Ir and Pt measured usingSTM at 4.2 K [315] is also within the prediction. (b) Temperature dependence of polymer extension also shows the exponentialdependence of elongation before breaking [337].

C.Q. Sun / Progress in Materials Science 54 (2009) 179–307 235
specimen extendable at the ambient temperature (300 K), one has to work with the material whose Tm
satisfies (300 + 20) � 4.185 = 1343 K or a value closing to this point. However, an extendable MC canhardly form at room temperature or above if the bulk Tm of a specific metal is below300 � 4.185 = 1260 K, such as Sn (505.1 K), Pb (600.6 K), and Zn (692.7 K). An extendable Ti–MC (withTm = 1941 K) may form at �440 K, slightly lower than its Tmi = Tm/4.185 = 462 K. Therefore, it is quitepossible to make a specific MC by operating the MC at a carefully controlled range of temperatures. Itis not surprising that Au is favorable for such MC formation at the ambient temperature whereas thewell-known ductile metals of Ag (Tm = 1235 K), Al (Tm = 933.5 K) and Cu (Tm = 1356 K) are unlikely toform extendable MCs though they could form superplastic NWs at the ambient temperatures.Although the electronic structure may need to be considered in making an MC [313], the operatingtemperature would be most critical. The high extensibility is apparent in the temperature range thatcorresponds to the quasimolten state that is much softer and highly extendable than the bulk. Thisfinding may explain why some metallic extendable MCs can form at the ambient temperature andsome cannot.
4.4. Summary
The T-BOLS correlation mechanism has enabled us to calibrate the length, the strength, the exten-sibility, and the thermal stability of the Au–MC bond under the conditions with and without thermaland mechanical stimuli. Major findings are summarized as follows:
(i) Without external stimuli, the metallic bond in an MC contracts by �30%, associated with �43%magnitude rise of the bond energy compared with the bulk standard situations. A metallic MCmelts at 1/4.2 times the bulk melting point. The electro-affinity (separation between the vac-uum level and the band edge of the 4f conduction band) of the Au–MC is 1.34 eV greater thanthe bulk, which is responsible for the high chemical reactivity of the under-coordinated MC.
(ii) The analytical solution shows that the strain limit of a metallic bond in a MC under tension doesnot apparently vary with mechanical stress or strain rate but apparently with temperature inthe form exp[A/(Tmi � T)], or exp[A/(Tm � 4.2 � T)]. This relation governs the tendency for ametallic MC to form or break, and therefore, an MC of other elements could be made by oper-ating it at properly controlled range of temperatures. However, as extrinsic factors, the stressfield and the strain rate could be important in the experiments relating to MC elongation, whichis beyond the modeling consideration.
(iii) Matching the calculated Au–Au distance to all the insofar-measured values indicates that thedivergency in measurements originates from thermal and mechanical fluctuations and theextremely high extensibility near the melting point and no charge or atomic impurity mediationis necessary.
Findings provide a consistent insight into the coordination-imperfection-enhanced binding inten-sity, mechanical strength, the suppressed thermal stability, and the compressibility/extensibility of aMC, which could be extended to the thermal and mechanical behavior of other metallic nanowires.The developed approach provides an effective way of determining the bulk 0 K extensibility, b0, theeffective specific heat g1i per coordinate, and the energy (g2i) required for evaporating an atom fromthe molten MC. Practical data would be helpful to give information on the MC bonding identities andthe single electron energy level of an isolated atom – one of the challenging tasks for nometrology.
5. Nanotubes and nanowires
� It is found true that the open edge of a SWCNT melts at 1593 K and that the stiffness of a SWCNT is 0.3685(TPa nm); one can actually only measure the stiffness rather than the wall thickness or the young’s mod-ulus independently.� The C–C bond in a SWCNT is 0.116 nm long and 1.42 thick with 68% rise in bond energy; the Young’s
modulus is 2.595 TPa; the C–C bond in the open edge is even shorter and stronger.

236 C.Q. Sun / Progress in Materials Science 54 (2009) 179–307
� The Young’s modulus of a hollow tube increases with the inverse of wall thickness, rather than its radius;a hollow tube is more elastic than a solid rod of the same radius because of the relatively high proportionof surface atoms.
� The process of bond unfolding dominates nanostructures’ superplasticity as the maximal strain in thevicinity of Tm is 150% for metallic atomic chains.
� The breaking mode of nanowires should change from fragile to ductile with operating temperature rise.
5.1. C–C bond in single-walled carbon nanotubes
5.1.1. Modulus measurementThe strong bonds between adjacent carbon atoms make individual nanotubes one of the toughest
materials ever known. A rather stiff CNT gel can be made by physically grinding up SWCNTs with ionicliquids. The stiffness results from a physical cross-linking of the tubes with the ionic liquid. The gelsshowed good thermal and dimensional stability and could be shaped into conductive sheets that alsohad enhanced mechanical properties. Using a coagulation-based CNT spinning technique, Dalton et al.[61] spun surfactant-dispersed SWCNTs from a rotating bath of aqueous polyvinyl alcohol to produceCNT gel fibers that they then converted to solid nanotube composite fibers. The resulting 100 m long fi-bers were 50 lm thick and contained around 60% nanotubes by weight. The composite has a tensilestrength of 1.8 GPa and an energy-to-break value of 570 J/g. The static fatigue strength of SWCNT ropesis at least twice that of graphite fiber within 104 s and is similar to that of graphite fiber at longer times,while the dynamic fatigue strength is twice that of the graphite fiber to up to 107 cycles [338]. The fibers,which are suitable for weaving into electronic cloth, are four times tougher than spider silk and 17 timestougher than the Kevlar fibers used in bulletproof vests. The fibers also have twice the stiffness andstrength and 20 times the toughness of the same weight of a steel wire. As artificial muscles, nanotubefibers are some 100 times the force of natural muscle with the same diameter [339]. The toughness ofspider silk that is dominated by hydrogen bonds [340] is due to chain extension in amorphous regionsbetween relatively rigid crystalline protein blocks.
However, precision determination of the Young’s modulus of the CNTs has been a challenging issuefor a long time [341]. For instance, a TEM nanorobotic manipulator measured the Y values of 0.95[342], 1.23 [343], 1.25 [344], and 3.5 TPa [345], for the SWCNT. It has been reported that the Y valuesvary over a range of 0.5–5.5 TPa being subject to the presumption of the wall thickness. The Y value forthe bulk graphite or diamond is 1.02 TPa. If one assumes the equilibrium interlayer spacing of graphitesheet as t1 = 0.34 nm, to represent the single-wall (bond) thickness, the derived Y1 value is �1.1 TPa[60,346]. If t1 = 0.066 nm, which is close to the radius of a free carbon atom (0.0771–0.0914 nm),the Y1 is derived as 5.5 TPa [347–350]. A recent work [351] suggested that a T1/2-dependent dynamicthickness due to atomic vibration should be added to the effective thickness of the C–C bond in theSWCNTs and hence one should observe the sum of the static and the dynamic values. The dynamicthickness amounts at 0.0115–0.0304 nm depending on chiral index is suggested to be responsiblefor the Raman shift, Young’s modulus and thermal conductivity reduction of the SWCNTs. A reliabledetermination of the C–C bond effective thickness is critical to determination of the mechanicalbehavior of the SWCNT [352].
The uncertainty in bond thickness [353] results in the large variety of the reported Y values [354–356]. For the SWCNTs, under a presumed t1 value, the measured Y1 varies insignificantly with the tubediameter or the tube helicity though the curvature-induced strain may contribute [357]. In practice,one can only measure the product of the Young’s modulus and the wall thickness, or called stiffness,Yt, of the SWCNT, rather than the individual component, Y or t. Although the measured values of t1 andY are widely scattered, the product of Yt (stiffness) surprisingly approaches a constant value of0.3685 ± 0.0055 TPa nm, as documented in the literature. Therefore, the measured Y values are yetto be confirmed and the challenge is how to split the Y value from the product of Yt.
However, for the multi-walled (MW) CNTs, two typical trends of the change in Y values have beenobserved

C.Q. Sun / Progress in Materials Science 54 (2009) 179–307 237
– the Y value remains almost constant for a given number of walls without changing with the tubediameter [60], and
– the Y value increases as the number of walls (k) or wall thickness is reduced [358].
5.1.2. Thermal stabilityOn the other hand, the CNTs are less chemically and thermally stable compared with the bulk
graphite or diamond crystal. Atoms at the open edge of a SWCNT could even melt or coalesce priorto atoms in the tube body at temperature much lower than the melting point of the bulk graphite(Tm = 3800 K). The coalescent temperature of the MWCNT increases as the number of walls increases.Coalescence of the SWCNT happens at 1073 K under energetic (1.25 MeV) electron beam irradiationand the coalescence starts at sites surrounding atomic vacancies via a zipper like mechanism [359],indicating that the under-coordinated atoms melt more easily and the vacancy provides site for ther-mally-induced structure failure.
The STM tip-end that is made of SWCNT starts to melt at 1593 K in ultrahigh vacuum [360]. Theelectron beam irradiation lowers at least the melting point by some 500 K due mainly to the impulseof the energetic electrons, according to Egerton [322]. Annealing at 1670–1770 K under medium–highvacuum, or in flowing Ar and N2 atmospheres, 60% SWCNTs coalesce with their neighbors [361]. Heat-ing under an Ar flow in the temperature range of 1873–2273 K results in a progressive destruction ofthe SWCNT bundle, and this is followed by the coalescence of the entire CNT bundle [362]. Coales-cence starts at the edge of CNT bundles [363]. SWCNTs transform at 2473 K or higher to MWCNTs withexternal diameter of several nanometers. Fe–C impurity bonds can be completely removed from theCNTs at 2523 K [364]. MWCNTs are more thermally stable than the SWCNTs, and the stability ofthe MWCNTs increases with the number of walls [352,365,366], opposing to the change trend of mod-ulus. On the other hand, an ordinary camera flash [367] could burn the SWCNT at the ambient condi-tions, showing the higher chemical reactivity for oxidation of the SWCNT. These observations evidenceconsistently the lowered chemical and thermal stability and at raised temperatures albeit the highermechanical strength of the CNTs at the ambient temperature.
5.2. T-BOLS derivatives
5.2.1. C–C bond identitiesThe striking difference between the bulk carbon and a SWCNT is that the effective atomic CN (or zi,
i = 1 for a SWCNT) of a C atom reduces from a CN of twelve (diamond) to a CN of three upon SWCNT ofgraphene ribbon formation. Fig. 25 illustrates the coordination numbers of carbon allotropies. For anatom surrounding a defect or being located at the open edge of the SWCNT or the graphene ribbon, theatomic CN is two. The effective atomic CN of a C atom in the diamond bulk is always 12 rather than 4as the diamond complex unit cell is an interlock of two fcc primary unit cells. Comparing the covalentbond length of diamond (0.154 nm) with that of graphite (0.142 nm), the effective atomic CN of car-bon in graphite is derived to be 5.5 according to the BOLS correlation (Eq. (2)). Recent first principlecalculations [368] showed that the C–C bond contracts to the values of 0.137 nm and 0.129 nm foratomic CN values of 3 and 2, slightly deviated from BOLS prediction of 0.126 nm and 0.108 nm. Thedeviation from the BOLS may be indicative of the limitation in using the uniform interatomic poten-tials that could hardly discriminate the anisotropic and localized nature of the under-coordinatedatoms.
The known values of (Yt)1 = 0.3685 TPa nm for z = 3, and the known Tm,1 (for z = 2 at the open end)value (=1593 K) for a SWCNT and the known bulk values for carbon (Tm = 3800 K, Yb = 1.02 TPa forz = 12) should satisfy a combination of the following relations [122]:
Tmð2ÞTmð12Þ ¼ z2;12Cið2Þ�m
=6 ðtip-open-edgeÞTmð3ÞTmð2Þ ¼ z3;2
Cið3ÞCið2Þ
�m ¼ 32
Cið3ÞCið2Þ
�m ðwall-tip-relationÞðYtÞ1Ybt1¼ ½Cið3Þ��ð2þmÞ ðCNT-wallÞ
8>>><>>>:
ð32Þ

238 C.Q. Sun / Progress in Materials Science 54 (2009) 179–307
The value of Ci(z) is given in Eq. (2). Solving these simple equations gives immediate solutions ofm = 2.5585, t1 = 0.142 nm and the tube-wall melting point, Tm(3) = 1605 K. Furthermore, the activationenergy for chemical reaction is also a portion of the atomic cohesive energy, zibc�m
i . Therefore, thechemical stability of the under-coordinated atoms is lower than the bulk values, which may explainwhy the CNT could burn using an ordinary camera flash under the ambient conditions.
The accuracy of the numerical solutions is subject to the measured input of Tm(2) and the productof (Yt)1, as a whole. Errors in measurement or structural defects of the CNT may affect the accuracy ofthe solutions; however, they never determine the nature of the phenomena observed. Variation of anyof the input (bold figures in Table 8) leads to no acceptable solutions. For example, replacing thequoted Yt value with Y = 0.8 TPa (disregarding the thickness t1) gives m = �3.2. The corresponding val-ues of E1/Eb = Ci(3)�m = 0.52, and Tm(3) = z1b � Ci(3)�m � Tm(12) = 493 K are unacceptable because theTm(3) value is much lower than any reported values. Assuming the SWCNT tip-end melting point to beTm(2) P 1620 K gives an m value that is larger than 2.605 and Tm(3) 6 1620 K, which is not in linewith observations: the open edge melts first. If a value of m = 4 is taken, Tm(2) = 2674 K andTm(3) = 2153 K, which are much higher than the measured values despite the order of tube edgeand tube body melting. Therefore, the solution with the measured input values of Yt = 0.3685 andTm(2) = 1593 K is unique and, hence, the quoted Yt and Tm(2) values are essentially true for theSWCNT.
Comparing the derivative from the SWCNT to the measured modulus of 1.0 TPa under the assump-tion of 0.335 nm thick of the monolayer graphene [151], it is found that the elastic modulus of thegraphene is 1.0 � 0.335/0.142 = 2.36 TPa, which is substantially the same to that of the SWCNT(2.56 TPa).
5.2.2. Superplasticity of CNTThe theoretical maximum tensile strain, or elongation, of a SWCNT is almost 20% [369,370], but
in practice, only 6% [371] has been achieved at room temperatures. However, at high temperatures
Fig. 25. Crystal structures of (a) graphene (b) CNT (c) graphite, and (d) diamond. The bond order (z) for the open edge in (a) and(b) is two; it is three in the interior of (a) and (b); for (c) the z is 6; (d) for diamond it is 12 instead of 4 because the diamond is aninterlock of two face centered cubic structures.

C.Q. Sun / Progress in Materials Science 54 (2009) 179–307 239
(estimated at 2000 K might be too high with respect to Ref. [358]), individual SWCNTs can undergo asuperplastic deformation, becoming nearly 280% longer and 15 times thinner, from 12 nm to 0.8 nm,before tensile failure [99].
It is significant to note that the temperature in the middle of the SWCNT is more than 2270 K asestimated during deformation at a bias of 2.3 V with a current flow. Despite the apparent discrepancyof this estimate compared with the STM measurements showing that the tube body melts at 1605 K,the nanotube appears to be completely ductile near the melting point, according to the findings forAu–MC (140% elongation near the Tm(2)). Compared to the Au–MC, kinks and point defects in theCNT are involved and fully activated, resulting in possible superplastic deformation of CNT at the ele-vated temperatures. The kink motion is evidence of kink-mediated plasticity at high temperatures.Experimental evidence shows that the processes of kink nucleation and motion and atom diffusionare important during superplastic deformation, helping to heal defects such as vacancies and to pre-vent the formation of large dislocation loops that might initiate cracks and lead to failure of thestrained nanotubes.
Such large plastic strains in nanotubes demonstrate their ductile nature at high temperatures[372–374], which concurs with BOLS predictions that the strain limit is exponentially proportionalto the inverse of separation between the melting point and the temperature of operation. In contrast,tensile-pulling experiments at room temperature without any bias showed that almost all nanotubesfailed at a tensile strain of less than 15%. It is expected that superplasticity of multi-walled CNT may bepossible in vacuum at more elevated temperatures as the melting point of the MWCNT is higher thanthe SWCNT.
5.3. Multi-walled CNT
Fig. 26a shows the AFM three-point-bending measurement of the diameter (wall thickness) depen-dence of the elastic modulus of multi-walled carbon nanotubes. Clearly, the modulus increase with theinverse of wall thickness. Compared with a nano-solid, the surface-to-volume ratio of a hollow tubeincludes both the inner and the outer shells can be expressed as
Table 8Comparthe quo
Yt (TPa
Tip-endTube wMBond thBond leBond eRemark
cij ¼2pðkj þ LjÞCi
pðK2j � L2
j Þ¼ 2Ci
Kj � Lj/ Ci
kjð33Þ
Kj and Lj are the dimensionless form of the outer and the inner hollow radii for a MWCNT. is thewall thickness. The ratio cS ¼
Pi63cij decreases in a k�1
j fashion from unity to infinitely small, whenkj grows from unity to infinity. Therefore, it is not surprising that, for a solid rod or a MWCNT withLj� Kj, the overall quantity change, DQ(kj)/Q, varies with the inverse radius (1/Kj) and the DQ(kj)/Qvalue differs from the corresponding bulk value (DQ(kj)/Q = 0). For a hollow MWCNT with a constantkj, the DQ(kj)/Q should vary with the diameter of the MWCNT insignificantly. These predictions agreewell with the observed mechanical strength of nanobeams. The broad range of the reported Y valuesfor MWCNTs should be due more to the fluctuation in the number of walls of the MWCNTs than to theerror in measurement.
ison of the calculation results with various input parameters (bold figures) proving that the obtained solution is unique andted data represent the true values [122]
nm) or Y (TPa) (Yt)1 = 0.3685 Y = 2.595 Y = 0.8 (Yt)1 = 0.3685
Tm (2) (K) 1593 – 2153 P1620all Tm(3) (K) 1605 493 2674 61620
2.5585 2.5585 4 2.6050ickness t1 (nm) 0.142 – – –ngth d1 (nm) 0.116 – – –
nergy E1/Eb 1.68 0.53 – –s Acceptable Forbidden

240 C.Q. Sun / Progress in Materials Science 54 (2009) 179–307
5.4. Nanowires
5.4.1. Elasticity and strengthThe Young’s modulus enhancement has been widely seen from nanorods of materials such as Ag,
Pd [62], and ZnO nanobelts [51] and nanowires [53]. The Young’s modulus of Ag nanowires [56] of 20–100 nm diameter was measured to increase when the diameter is decreased, which was attributed tothe effects of surface stress, oxidation surface layers, and surface roughness. ZnS nanobelts were mea-sured to be 79% harder but 52% lower in elastic modulus compared to the bulk ZnS [73]. The ZnS nano-belts were also observed to exhibit significant creep under a constant indentation load at roomtemperature.
Using an AFM, Wong et al. [60] measured the radius dependence of the Young’s modulus ofSiC nanorods and MWCNTs and found that the MWCNTs are about twice as stiff as the SiC nano-rods. The modulus of MWCNTs varies insignificantly with the diameter of the CNTs. Thestrengths of the SiC nanorods are substantially greater than the values measured for large SiCstructures (600 GPa). The Young’s modulus is 610 GPa and 660 GPa for SiC rods of 23.0 nm and21.5 nm across, respectively, showing the trend of the Y value increasing with the inverse ofthe rod diameter.
However, an opposite trend has been measured using AFM bending methods in the (0 0 0 1) ori-ented ZnO nanobelts/wires and showed a lower modulus than that of bulk ZnO (measured at140 GPa) varying from 29 ± 8 [66], 52 [67], to 38–100 GPa [68]. The modulus of Cr [70] and Si[71] nanocantilevers is also measured to decrease sharply with decreasing diameter. In contrast,amorphous Si nanowires [378], Au [74] and Ag [379] nanowires show no apparent change withsize despite the scatter within the error bars in the measurement. Therefore, it appears quite con-fusing that, even for the same material such as Ni, Ag, ZnO, and Si, the Y value changes in differentways, depending on the experimental techniques and operation conditions. This is similar to thevariation in the measured skin hardening and softening as discussed in Section 3. For instance,the Y value of ZnO nanobelts of 50–140 nm in thickness and 270–700 nm in width were measuredusing an AFM three-point bending method to be 38.2 ± 1.8 GPa, which is about 20% higher than theYoung’s modulus of 31.1 ± 1.3 GPa obtained using nanoindentation [50]. A modeling study of thesize effect on the elastic behavior of solid and hollow polymer nanofibers under uniaxial tension[380] shows that fiber radius has appreciable effect on the elastic response of polymer nanofibers.At nanometer scale, solid nanofibers show less the effect of surface tension coupling. However,hollow nanofibers show greater axial stiffening effect with increasing axial stretch because ofthe coupling of surface tension depending upon the combination of the fiber exterior and interiorradii and the material properties. The elastic modulus of single polymer nanofibers has been mea-sured to increase exponentially as the diameter of the polymer nanofibers decrease to a few tensof nanometers (Fig. 26b) [381], being opposite to the measured trend of polymers using the inden-tation method. The unusual behavior of nanobeams was attributed to the microstructure and con-finement that play critical roles in engineering the mechanical properties of nanometer-scaledmaterials [377]. The defect-free nanotubes are ideal cases of cylindrical nanocavities with de-fect-free shells that are much stronger than the bulk materials unless excessive defects are pre-sented in the unreconstructed walls [60]. Defects in the walls of nanotubes serve as centersinitiating the failure in particular for the plastic deformation. For instances, the Young’s modulusof a defected nanotube is reduced gradually with each atomic defect and the strength of the nano-tubes is catastrophically influenced by the existence of just a few atomic defects [106]. A theoret-ical calculation [382] of the tensile strength of nanotube mats and fibers predicted that thestiffness and strength of the mats could be increased at least by an order of magnitude throughsmall dose irradiation with energetic particles to break some bonds and generate some new kindsof bonds between the interfaces of the nanotubes [383].
5.4.2. Nanowire superplasticity: bond unfoldingWe may extend the extensibility of MC and CNT to the case of nanowires by replacing the Tmi and the
g2i/g1i for an MC in Eqs. (26) and (30) with the size dependent Tm(Kj) and g2(Kj)/g2(Kj). The T-dependentextensibility or compressibility and the strain limit of a defect-free nanosolid become [384]:
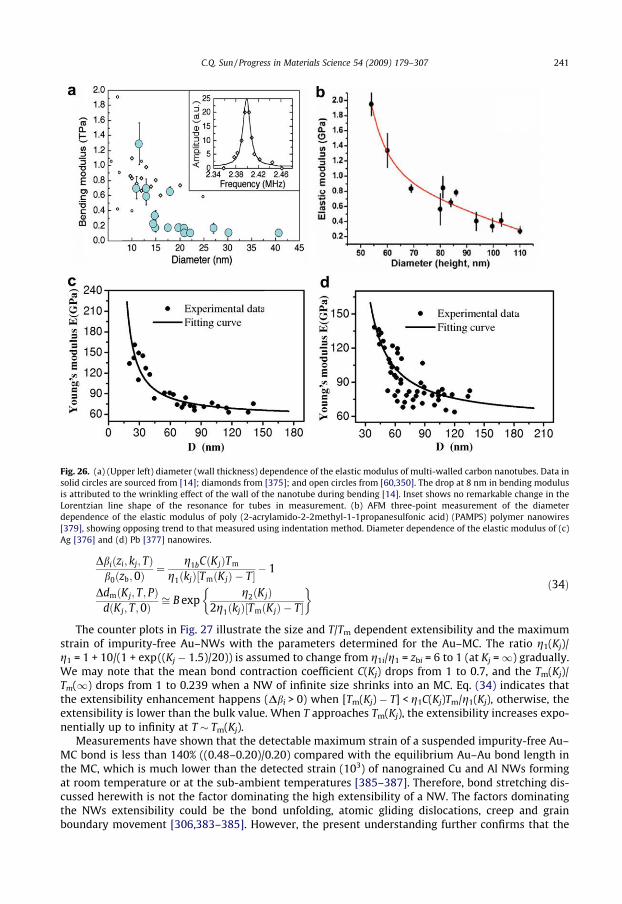
Fig. 26. (a) (Upper left) diameter (wall thickness) dependence of the elastic modulus of multi-walled carbon nanotubes. Data insolid circles are sourced from [14]; diamonds from [375]; and open circles from [60,350]. The drop at 8 nm in bending modulusis attributed to the wrinkling effect of the wall of the nanotube during bending [14]. Inset shows no remarkable change in theLorentzian line shape of the resonance for tubes in measurement. (b) AFM three-point measurement of the diameterdependence of the elastic modulus of poly (2-acrylamido-2-2methyl-1-1propanesulfonic acid) (PAMPS) polymer nanowires[379], showing opposing trend to that measured using indentation method. Diameter dependence of the elastic modulus of (c)Ag [376] and (d) Pb [377] nanowires.
C.Q. Sun / Progress in Materials Science 54 (2009) 179–307 241
Dbiðzi; kj; TÞb0ðzb;0Þ
¼ g1bCðKjÞTm
g1ðkjÞ½TmðKjÞ � T� � 1
DdmðKj; T; PÞdðKj; T;0Þ
ffi B expg2ðKjÞ
2g1ðkjÞ½TmðKjÞ � T�
� ð34Þ
The counter plots in Fig. 27 illustrate the size and T/Tm dependent extensibility and the maximumstrain of impurity-free Au–NWs with the parameters determined for the Au–MC. The ratio g1(Kj)/g1 = 1 + 10/(1 + exp((Kj � 1.5)/20)) is assumed to change from g1i/g1 = zbi = 6 to 1 (at Kj =1) gradually.We may note that the mean bond contraction coefficient C(Kj) drops from 1 to 0.7, and the Tm(Kj)/Tm(1) drops from 1 to 0.239 when a NW of infinite size shrinks into an MC. Eq. (34) indicates thatthe extensibility enhancement happens (Dbi > 0) when [Tm(Kj) � T] < g1C(Kj)Tm/g1(Kj), otherwise, theextensibility is lower than the bulk value. When T approaches Tm(Kj), the extensibility increases expo-nentially up to infinity at T � Tm(Kj).
Measurements have shown that the detectable maximum strain of a suspended impurity-free Au–MC bond is less than 140% ((0.48–0.20)/0.20) compared with the equilibrium Au–Au bond length inthe MC, which is much lower than the detected strain (103) of nanograined Cu and Al NWs formingat room temperature or at the sub-ambient temperatures [385–387]. Therefore, bond stretching dis-cussed herewith is not the factor dominating the high extensibility of a NW. The factors dominatingthe NWs extensibility could be the bond unfolding, atomic gliding dislocations, creep and grainboundary movement [306,383–385]. However, the present understanding further confirms that the

Fig. 27. Illustrative counter plots for the Kj and x (=T/Tm) dependent (a) extensibility and (b) maximum strain of defect-free Au–NWs. The extensibility and the maximum strain increase rapidly when T approaches to Tm(Kj) which, in turn, drops with Kj.
242 C.Q. Sun / Progress in Materials Science 54 (2009) 179–307
barrier or the activation energy for atomic dislocation and diffusion of the under-coordinated atoms atthe grain boundaries is lower than that of the fully coordinated ones in the bulk, as these activities aresubject to the atomic cohesion which, in turn, drops with atomic CN.
Han et al. [388] observed in situ by a novel high-resolution transmission electron microscopy tech-nique the unusually large strain plasticity (125% strain with 450% diameter reduction) of Si (15–70 nmin diameter) and SiC (�80 nm in diameter) [389] nanowires (NWs) at room temperature. They foundthat the dislocation activation energy drops with the diameter of the NWs. The continuous plasticity ofthe SiC–NWs is accompanied by a process of increased dislocation density at an early stage, followedby an obvious lattice distortion, and finally reaches an entire structure amorphization at the moststrained region of the NW. An AFM measurement [390] of the length of gold nanowires structures dur-ing extension and compression cycles revealed that nanowires elongate under force in quantized stepsof up to three integer multiples of 1.76 Å and that they shorten spontaneously in steps of 1.52 Å underslight compression. These findings can be understood in terms of the sliding of crystal planes withinthe gold nanowires creating stacking faults that change the local structure from face-centered cubic tohexagonal close packed. These experiments provide direct evidence for the unfolding mechanismunderlying the plastic deformation of a nanowire.
5.4.3. Breaking modes of nanowiresFig. 28 showing the atomic CN and temperature dependence of maximum bond strain indicates that
the melting of a nanosolid starts from the first atomic shell (z1 = 4) and then the second (z2 = 6) whenthe temperature is elevated, as observed in many cases. For instances, it has been confirmed that a flator a curved surface melts at temperatures of 50 K [391] to 100 K [392] lower than the bulk interior. Aquasimolten skin grows radially inward from the surface into the core center for both clusters andwires. The surface melting is followed by a breakdown of order in the remaining solid core. The meltingof an impurity-free vanadium nanosolid proceeds in a stepwise way, i.e., the surface layer of 2–3 latticeconstant thick region melts first and then the abrupt overall melting of the entire cluster follows [390].An MD computation [393] of the shell-resolved fluctuation of the root-mean-square bond length of a147-atom Leonard–Jones cluster revealed that the process of surface melting starts from the migratingof the vertex atoms on the surface. Although the melting process of LJ147 cluster could be divided intostages of surface melting and general melting, the melting still exhibits a continuous process from thesurface shell to the core interior. Therefore, the surface melting is not distinguished by a sharp layer-by-layer feature in a tiny cluster. This surface pre-melting was in the ‘liquid skin nucleation and growth’mode [394–396], and follow the ‘liquid drop’ [175] and the ‘surface phonon instability’ [397] and thecurrent BOLS models [159], as well as other outstanding models [398].

0.2 0.3 0.4 0.5 0.6
14
16
18
20
z = 8z = 6
z = 4
Max
imal
str
ain
(%
)
T/Tm(0)
Fig. 28. Temperature and CN (z) -dependence of the Au–Au bond maximum strain shows the order of melting at a curvedsurface of a nanowire and infers the breaking mode of a nanowire at different temperature range [403].
C.Q. Sun / Progress in Materials Science 54 (2009) 179–307 243
At temperatures close to the Tm,1 of the surface, the maximum strain and the extensibility of thesurface layer approach infinity whereas the strain limit of the core interior remains at the limited bulkvalues because of the higher bulk melting point. At temperatures near surface melting or above, bondbreaking under tension should start from the NW interior, because the inner bonds firstly reach theirstrain limits that are lower than that of the surface skin bonds at the same temperature. However, attemperatures far below Tm,1, bond breaking may start from the outermost atomic shell and the nano-solid manifests brittle character, as the shortened surface bonds break first. At very low temperatures,the theoretically allowed maximum strains for the entire NW should be constant.
If one deforms the entire nanowire by xd per unit d length, the strain of the bonds in the respectiveshells will be ei = x/Ci. Because C1 < C2 < C3, the actual applied strains are in this order, e3 < e2 < e1, whichindicates that the surface shell bond breaks first at low T. Therefore, the breaking mode of a nanowire atlow T is expected to be opposite to that at higher T. At very low T the surface bond breaks before the bulkones while at T � Tm1 or higher the surface bond breaks after the ones in the core interior.
It has been measured using a ‘‘nano-stretching stage” located within a STM at room temperaturethat the MWCNTs break in the outermost shell [399]. This ‘sword-in-sheath’ failure mode, or innerbonds break first, agrees with the expectation of the current BOLS approach as the operating temper-ature is far below the tube melting temperature at 1600 K [122]. The helical multi-shell gold nano-wires [400] become thinner and thinner without breaking the outer-shell atomic bond undertension at room temperature [401], as the Au–NW breaking starts from the inner shell according tothe current understanding. Tight-binding calculations [402] suggest that 90% atoms composing thelinear atomic chains come from outermost atomic layers of gold specimen in the stretching at�350 K, indicating the relatively high mobility of the under-coordinated atoms.
5.5. Summary
Incorporating the T-BOLS correlation to the known Yt value and the known temperature of tip-endmelting for a SWCNT, and their functional dependence on the bonding identities, the dimension and en-ergy of a single C–C bond in SWCNT can be uniquely quantified, which, in turn, deepens our insight intothe fascinating properties of CNTs. It has been clarified that the C–C bond of the SWCNT contracts by�18.5% with an energy rise by�68%. The effectively static thickness of the C–C bond is�0.142 nm, whichis the diameter of a C atom, rather than the graphite sheet separation (0.34 nm) or the diameter of a freecarbon atom (0.132 nm). The melting point of the tube-wall is slightly (�12 K) higher than that of the tube-end. The unique solution clarifies that the quoted Tm(2) and the Yt values are truly correct for a SWCNT inwhich the Young’s modulus is 2.5 times and the melting point is 0.42 times that of bulk graphite.
Predictions of the wall thickness dependence of the Tm suppression and Y enhancement of thenanobeams agree well with the insofar-observed trends documented. It has been clarified that bondunfolding, atomic gliding dislocations, creep and kink formation dominates the superplasticity of

244 C.Q. Sun / Progress in Materials Science 54 (2009) 179–307
nanograined crystals or the SWCNTS in quasimolten states because the detectable maximum strain ofan ideal bond is limited to 140% at melting. The findings provide a consistent insight into the unusualthermal, chemical, and mechanical behavior of nanobeams, as well as an effective approach towardbonding identities that are beyond the scope of direct measurement.
6. Nanograins: I. Elasticity and extensibility
� Size induced elastic enhancement originates from the broken-bond-induced energy density gain in thesurface of skin depth.� Elasticity of a specimen may rise or drop with size reduction, depending on the separation between the
melting point and the temperature of operation.� Thermally induced elastic softening arises from bond expansion and bond vibration.� The thermal expansion coefficient, Debye temperature, Young’s modulus, and specific heat of a specimen
are strongly correlated and they are all size and temperature dependent.
6.1. Existing approaches
6.1.1. Size dependenceAn X-ray diffraction (XRD) with synchrotron radiation at pressures up to 30 GP revealed that silver
(10 nm) and gold (30 nm) nanoparticles are significantly stiffer than the corresponding bulk materials.The bulk modulus of n-Au increases by 60%, as shown in Fig. 29 [404]. The unexpected high moduluswas attributed to the polysynthetic domain twinning and lamellar defects as the main origin for thestrong decrease in compressibility.
The size dependence of the elastic modulus was also attributed to the total strain energy of a nano-crystalline [408,409] that can be decomposed into the strain energy of the bulk (Ub) and the surface,(Us), i.e., U = Ub + Us. The deformation from the bulk crystal lattice to the self-equilibrium state will beachieved by minimizing the total strain energy of nanocrystals. The strain in a self-equilibrium state innanocrystals can be calculated by oU/V0o eij = 0, in which V0 and eij (i, j = 1,2,3) are the volume and theelastic strain, respectively. The size dependent Y-modulus of spherical nanocrystals based on the sizedependent surface free energy was derived as [409]� �
Y Kj
Y 1ð Þ ¼ 1� Kj� �5 þ 5Ys
3Y 1ð Þ 3Kj � 6K2j þ 4K3
j
�
where Ys denotes the surface Y-modulus and Kj is the dimensionless form of the nanocrystal’s size.Theoretical analysis suggested that the elastic modulus are anisotropic depending on the crystal ori-entation [410].6.1.2. Temperature dependenceThe thermal depression of the Young’s modulus Y was attributed to anharmonic effects of the lat-
tice vibrations [411]. Watchman et al. [412,413] suggested a semi-empirical formula, which is valid forsilicon in the high temperature limit [414]:
DY Tð ÞY0
¼ �AT exp �T0=Tð Þ ð35Þ
where Y0 is the Young’s modulus at 0 K. The constants A and T0 are temperature independent parametersfor data fitting. Watchman et al. expected a correlation between the T0 and the Debye temperature hD andbetween the A and the Grüneisen parameter, c. A complete theory for this problem was not available atthat time. Later, Anderson [415] derived a similar expression for the adiabatic bulk modulus B:
DB Tð ÞB0
¼ �3RcdTB0V0
F T=hDð Þ ð36Þ
where
F T=hDð Þ ¼ 3ThD
� �3 Z hD=T
0
x3 dxex � 1
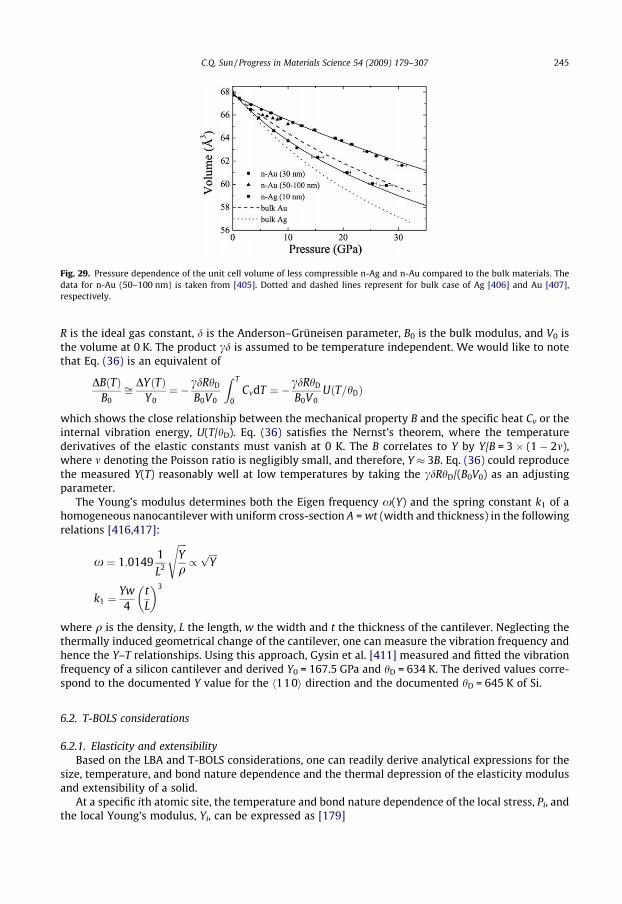
Fig. 29. Pressure dependence of the unit cell volume of less compressible n-Ag and n-Au compared to the bulk materials. Thedata for n-Au (50–100 nm) is taken from [405]. Dotted and dashed lines represent for bulk case of Ag [406] and Au [407],respectively.
C.Q. Sun / Progress in Materials Science 54 (2009) 179–307 245
R is the ideal gas constant, d is the Anderson–Grüneisen parameter, B0 is the bulk modulus, and V0 isthe volume at 0 K. The product cd is assumed to be temperature independent. We would like to notethat Eq. (36) is an equivalent of
DB Tð ÞB0
ffi DY Tð ÞY0
¼ � cdRhD
B0V0
Z T
0CvdT ¼ � cdRhD
B0V0U T=hDð Þ
which shows the close relationship between the mechanical property B and the specific heat Cv or theinternal vibration energy, U(T/hD). Eq. (36) satisfies the Nernst’s theorem, where the temperaturederivatives of the elastic constants must vanish at 0 K. The B correlates to Y by Y/B = 3 � (1 � 2m),where m denoting the Poisson ratio is negligibly small, and therefore, Y 3B. Eq. (36) could reproducethe measured Y(T) reasonably well at low temperatures by taking the cdRhD/(B0V0) as an adjustingparameter.
The Young’s modulus determines both the Eigen frequency x(Y) and the spring constant k1 of ahomogeneous nanocantilever with uniform cross-section A = wt (width and thickness) in the followingrelations [416,417]:
x ¼ 1:01491L2
ffiffiffiffiYq
s/
ffiffiffiffiYp
k1 ¼Yw4
tL
� �3
where q is the density, L the length, w the width and t the thickness of the cantilever. Neglecting thethermally induced geometrical change of the cantilever, one can measure the vibration frequency andhence the Y–T relationships. Using this approach, Gysin et al. [411] measured and fitted the vibrationfrequency of a silicon cantilever and derived Y0 = 167.5 GPa and hD = 634 K. The derived values corre-spond to the documented Y value for the h110i direction and the documented hD = 645 K of Si.
6.2. T-BOLS considerations
6.2.1. Elasticity and extensibilityBased on the LBA and T-BOLS considerations, one can readily derive analytical expressions for the
size, temperature, and bond nature dependence and the thermal depression of the elasticity modulusand extensibility of a solid.
At a specific ith atomic site, the temperature and bond nature dependence of the local stress, Pi, andthe local Young’s modulus, Yi, can be expressed as [179]

246 C.Q. Sun / Progress in Materials Science 54 (2009) 179–307
Piðzi;m; TÞ ¼ �ouðr;m;TÞoV
���di ;T
Yiðzi;m; TÞ ¼ �VoPðzi ;m;TÞoV
���di ;T
9>=>; /
g1iðTmi � TÞ=d3i ; ðBorn’s-criterionÞ
½g1iðTmi � TÞ þ g2i�=d3i ðEnergy densityÞ
(ð37Þ
The Born’s criterion applies only to the shear modulus, extensibility and plastic deformation butnot to the elastic modulus because of the non-zero sound velocity in gaseous and liquid phases.The sound velocity is proportional to the square root of the Young’s modulus over mass density.
For a nanosolid, we may take the core-shell configuration into consideration, then the bond nature(m), solid shape (s), solid size (Kj), and temperature (T) dependence of the relative change of the Y andthe extensibility, b, can be obtained by summing contributions over the outermost three atomic layers.The relative change of the Y and the linear extensibility, b, of a solid to the values at measured T0 = 0 Kcan be expressed as
DYðm;Kj; TÞYðm;1; 0Þ ¼
Xi63
cijdY ðm; zi; TÞ
dY ðm; zi; TÞ ¼C�3
i
ð1þ aiTÞ3Eið0Þ �
R T0 g1iðtÞdt
Eið0Þ
!� 1 ¼ThD ¼ C1ð3þmÞ
i
ð1þ aiTÞ31� g1T
zibC�mi Ebð0Þ
� �� 1
Dbðm;Kj; TÞbðm;1;0Þ ¼
Xi63
cijdbðm; zi; TÞ
dbðm; zi; TÞ ¼ Cð1þmÞi ð1þ aiTÞ
Eið0ÞEið0Þ �
R T0 g1iðtÞdt
( )� 1 ¼T>hD ¼ Cð1þmÞ
i ð1þ aiTÞ 1þ g1iTg2ig1iðTmi � TÞ
� � 1
ð38Þ
where the relations of Ei ¼ C�mi Eb ¼ g1iTmi þ g2i ¼ C�m
i ðg1Tm þ g2Þ, and Tmi ¼ zibC�mi Tm ¼ ð1þ DiÞTm,
g1i = zbig1 and g2i ¼ C�mi g2 are applied. The layer counting in Eq. (38) indicates that the under-coordi-
nated atoms in the surface skin dictate the relative change of the elasticity and extensibility of the en-tire nanosolid whereas atoms in the core interior retain their bulk features. The Y value dropsnonlinearly with T at T� hD because of the involvement of the non-linear specific heat in Debyeapproximation (see Fig. 2b). At T > hD, Y drops linearly with T in spite of the contribution from thermalexpansion. Taking the approximation of 1 + x exp(x), Eq. (38) also agrees with (35) but here we haveincluded the effect of size, temperature, and bond nature.
For a bulk solid (Ci = 1 and Di = 0), the thermally driven softening exhibits the bulk feature and nosummation over the surface layers is necessary. The T-suppressed Young’s modulus can be simply ex-pressed as !
Yðm; TÞYðm;0Þ ¼
1
ð1þ aiTÞ31�
R t0 g1ðtÞdtEbð0Þ
¼ 1
ð1þ aiTÞ31� UðT=hDÞ
Ebð0Þ
� �¼ThD 1
ð1þ aiTÞ31� g1T
Ebð0Þ
� �ð39Þ
Apart from the effect of thermal expansion, the present form agrees with Anderson’s model of T-dependent Y with further identification of cdRhD/(B0V0) = 1/Eb(0) and the internal vibration energy3RT � F(T/hD) = U(T/hD).
6.2.2. Debye temperatureThe Debye temperature, defined as hD = �hxD/kB in Debye approximation, is a key parameter that
determines the specific heat capacity and thermal transport dynamics. The hD is actually not a con-stant but changes with the object size [418–422] and the temperature of testing [423–425], as thehD depends functionally on Y. Earlier contributions[418] suggested that the size dependent hD resultfrom the finite cut-off of frequency and the surface stress, especially, if the size is smaller than20 nm. Using X-ray-absorption spectra measurement and extended X-ray absorption fine structurespectroscopy, Balerna and Mobilio [419] confirmed the predicted size dependence of hD. Calculationsof the temperature dependent hD of some fcc and bcc metals [423] revealed that hD drops when themeasuring temperature is increased because of the temperature dependence of elastic constantsand the sound velocity of the solid. However, discrepancy remains regarding the Tm dependence of

C.Q. Sun / Progress in Materials Science 54 (2009) 179–307 247
the hD. One opinion is that hD varies linearly with Tm [423] and the other suggests a square root depen-dence of hD on Tm according to Lindermann’s [426] criterion of melting.
The hD can be derived from the mathematical expression for the normalization of phonon densitystates:
RxD0 gðxÞ ¼ jNA, with NA being the total number of vibration modes, giving rise to the relation,
xD / msðnÞ1=K / msðd�KÞ1=K ¼ ms=d. The term ms ¼ffiffiffiffiffiffiffiffiffiY=q
p�
ffiffiffiffiffiffiffiffiYd3
p�
ffiffiffiffiEip
is the sound velocity in themedium. The j is the fractal and dynamic dimensions (j = 1 for nanowire, j = 2 for thin plate andj = 3 for bulk material), which is different from the static dimensionality used for the surface-to-vol-ume ratios. Because the Debye temperature is defined as hD = �hxD/KB, the normalized expression for hD
has the following form:
hDðzi;m; TÞhDðzb;m;0Þ
¼ xDðzi;m; TÞxDðzb;m;0Þ
¼ mSðzi;m; TÞmSðzb;m;0Þ �
ddi¼ ci
Yðzi;m; TÞYðzb;m;0Þ
� �1=2
¼ Eiðzi;m; TÞEbðzb;m;0Þ
� �1=2
ð40Þ
Combining Eqs. (37) and (40), leads to the immediate relation
DhDðKj;m; TÞhDð1;m; TÞ
¼Xi63
sCi
Kj
c�ð1þm=2Þi
ð1þ aTÞ3=2 1�R T
0 g1ðtÞdtzibC�m
i Ebð0Þ
" #1=2
� 1
8<:
9=;
� ffiThD X
i63
sCi
Kj
C�1i
ð1þ aTÞ3=2
g2i þ g1iðTmi � TÞg2 þ g1Tm
� �1=2
� 1
( )
� ffiThD X
i63
sCi
Kj
c�ð1þm=2Þi
ð1þ aTÞ3=2 1� g1T2zibC�m
i Ebð0Þ
� �� 1
( )ð41Þ
Therefore, the current form of the hDðTÞ /ffiffiffiffiffiffiYdp
¼ffiffiffiffiffiffiffiffiffiffiffiffiEbðTÞ
p=d agrees with the square root depen-
dence of the T-independent hD on Tm : hD / T1=2m =d [426]. A replacement of Eb(T) with
EbðTÞ g2 þ g1ðTm � TÞ leads to the (Tm � T) dependent hD ¼ffiffiffiffiffiffiffiffiffiffiffiffiffiffiffiffiffiffiffiffiffiffiffiffiffiffiffiffiffiffiffiffiffiffiffig2 þ g1ðTm � TÞ
p=d / ðTm � TÞ1=2=d.
For nanostructures, the hD drops with size because the Tm depression.
6.2.3. Specific heat capacityThe specific heat capacity is a measurable physical quantity that characterizes the ability of a body
to store the heat when the sample is being heated. Depending critically on the hD and hence the Y, thespecific heat varies with both object size and the temperature of measurement. The effect of body sizeon the specific heat capacity has recently attracted considerable attention [427–430]. For instance,Novotny et al. [427] measured the low temperature heat capacity of 2.2 nm and 3.7 nm sized lead par-ticles and observed the enhancement of heat capacity below 5 K. Lu [431] demonstrated that the spe-cific heat of metallic or alloying nanosolids increases with the inverse of solid size. However, an acmicro-calorimeter measurement [428] showed the opposite trend for Al films where the specific heatdrops with the thickness of the Al film from 370 nm to 13.5 nm. The decrease of specific heat was ex-plained as the rise of the absorption and the loss of thermal waves with specific wave vectors in thesmall volumes. However, Lu et al. [429] calculated the size effects on the specific heat of Al thin filmsby employing the Prasher’s approach [432] and derived that the reduction of phonon states was not themain reason causing the size effect on specific heat; but a thin layer of Al oxide was responsible for it.Yu et al. [430] measured that the heat capacity decreased with the film thickness; however, the specificheat (heat capacity per unit volume) increased as the film become thinner, in conflicting with the mea-sured results of Song et al. [428] Therefore, discrepancies on the size and temperature dependence ofthe heat capacity and Debye temperature for metallic nanostructures remain unsolved theoretically.
The heat capacity per unit volume is defined as the ratio of an infinitely small amount of heat dEadded to the body to the corresponding small increase in its temperature dT when the volume is keptunchanged. In the extended Debye model, the expression is given by
Cv ¼oEoT
� �V¼ j2R
ThD
� �j Z hD=T
0
xjþ1 expðxÞðexpðxÞ � 1Þ2
dx ð42Þ
where x = �hx/kBT. It can be shown that, when j = 3, Eq. (42) is reduced to the three-dimensional stan-dard form of Debye model. For T hD, the integration in Eq. (42) gives (1/j)(hD/T)j. The heat capacity

248 C.Q. Sun / Progress in Materials Science 54 (2009) 179–307
Cv is simplified as jR, in agreement with the Dulong–Petit law in the case of j = 3. At higher temper-atures, the Cv approaches a constant.
At T� hD, the upper limit of the integral of Eq. (42) approaches infinity and the integration givesR10 xkþ1ex=ðex � 1Þ2dx 3:290, 7.212 and 25.976, for j = 1, 2 and 3, respectively. Therefore, the heat
capacity in the low temperature limit becomes:� �
Cv ¼ Aj2 ThD
j
/ j2h�jD ð43Þ
where A is a fixed value. From Eqs. (42) and (43), we can see that hD has a strong effect on the heatcapacity. Using the same core-shell structure for a nanosolid, we can obtain the expression for the spe-cific heat dependence on the size, shape, and bond nature at very low temperatures (T � 0):
DCvðm; T;KjÞCvðm:T0;1Þ
¼Xi63
sci
Kjcð1þm=2Þj
i
1� T=Tmð1þ DiÞ1� T0=Tm
� ��j=2
� 1
" #
ffiXi63
sci
Kjcð1þm=2Þj
i ð1� T0=TmÞj=2 � 1h i
< 0 ðT � 0Þ ð44Þ
Since the coefficient of bond contraction Ci is always smaller than unity, the heat capacity is alwayslower than the bulk value at lower temperatures. The heat capacity decreases with the inverse size(Kj). At temperatures close to hD, the heat capacity should be evaluated using Eq. (42), where the hD
is size, temperature, and bond nature dependent according to Eq. (41).
6.3. Predictions and applications
6.3.1. Elasticity and extensibilityUsing Eq. (38), we are able to predict the bond nature, the shape and size, and the T/Tm dependence
of the Young’s modulus and extensibility of a solid. For illustration purpose, we selected m = 1 (formetals), 3 (carbon, 2.56), and 5 (Si, 4.88), xm (T/Tm) = 0.25, 0.5, and 0.75 and the dimensionalitys = 3 (for a sphere) in calculations. The T0 was set at 0 K and T, respectively. For temperature depen-dence, we used Kj = 10 and 50 sizes by fixing other parameters. g21 was taken as zero for illustrationpurpose, otherwise a small offset would be achieved which could hardly be identified in the predictedtrends of the relative changes.
Fig. 30a shows that either elevation or depression of the Young’s modulus with decreasing sizesmay occur depending on the combination of the (xm,m) values. For example, Y elevation occurs inthe situations of (xm,m) = (<0.25,>3). Y retention may happen at critical (xm,m) combinations suchas (xm,m) = (�0.25,�3). The critical combination of (xm,m) can be obtained by allowing Eq. (38) to ap-proach zero. If we select T = T0, Y elevation also occurs in the situations of (xm,m) = (<0.5,>5). Y valuemay also remain constant at (T/Tm,m) = (0.25,�2) and (0.5,�4). It is therefore not surprising that themodulus may rise, drop, or remain constant when the solid size is reduced, depending on the bondnature indicator m, the temperature ratio xm, and the testing techniques as well. The predictedlow-temperature stiffening agrees with the findings that the impact toughness of nanostructured Tiis enhanced at low temperatures of 200 K and 77 K, a unique phenomenon that contradicts the obser-vations in coarse-grained materials [433]. The size-induced compressibility modulation of Au and Agnanostructures given in Fig. 29 is also understandable based on the theory consideration.
According to the prediction, the Y values for pure metallic (m = 1) nanoparticle always drop withsize at T > 0.25 Tm. This prediction seems not to be in line with observations from pure metals suchas Ag, Au, and Ni, as listed in Table 1. However, the surface chemical passivation, defects, and the arti-facts in measurement could contribute to the measured data. For instance, surface adsorption altersthe surface metallic bonds (m = 1) to new kinds of bonds with m > 1. Surface compound formationor surface alloying alters the m value from 1 to a value around 4. Fig. 31 shows the predicted temper-ature-induced relative change of (a) Y values and (b) the extensibility for Kj = 10 and m = 1, 3, and 5samples. If T0 = T, Y drops non-linearly with T until Tm is reached. The insertion shows the case ofT0 = 0 in which the Y drops linearly with T. Detailed calculation with consideration of the thermal coef-ficient of expansion and the non-linear T dependence of the specific heat will give the nonlinear form

10 20 30 40 50 60
-0.8
-0.4
0.0
0.4
0.8
Rel
ativ
e ch
ang
e o
f Y
Kj
xm=0.25 m=1
m=3 m=5
xm=0.50 m=1
m=3 m=5
xm=0.75 m=1
m=3 m=5
a bT0 = 0
10 20 30 40 50 60
-0.8
-0 .4
0.0
0.4
0.8
Rel
ave
chan
ge
of
Y
K j
xm = 0.25 m = 1
m = 3 m = 5
xm = 0.50 m = 1
m = 3 m = 5
xm = 0.75 m = 1
m = 3 m = 5
T0 = T
Fig. 30. Prediction of size Kj dependence of Young’s modulus with (a) T0 = 0 and (b) T0 = T of different bond nature and xm (T/Tm)values. Young’s modulus enhancement occurs at the combinations of (xm,m) = (<0.25,>3) for T0 = 0 and (xm,m) = (<0.5,>3) forT0 = T. The Y retention may happen at critical (T/Tm,m) combinations.
C.Q. Sun / Progress in Materials Science 54 (2009) 179–307 249
at very low temperatures, as detailed in next section. The extensibility approaches infinity at the cor-responding Tm(Kj). The insert in (b) shows singularities because of the shell-by-shell configuration. Ifwe treat the outermost two atomic layers as the skin with a mean zi = (4 + 6)/2 the singularity occursat the melting point which drops in value with the characteristic size. On the other hand, a smallernanosolid with lower m value is more easily extensible at elevated temperatures.
6.3.2. Size and temperature dependenceFig. 32 compares the prediction with observations of the size dependence of the Y values for (a) ZnO
[53] and (b) polymers measured at room temperature [64], T0 = 300 K. The prediction agrees exceed-ingly well with the measured data for ZnO nanowires (m = 4, s = 2). For the polymer, the predictionagrees with the general trend of measurement (m = 4, s = 1 (film)) with accuracy being subject tothe precision of size determination.
The predicted m, Kj, and T/Tm dependence of modulus and extensibility covers all the possibletrends as observed. For example, the predicted Y-depression in Fig. 30 agrees well with the measured
0.0 0.2 0.4 0.6 0.8 1.0
-0.8
-0.4
0.0
0.4
0.8
0.0 0.2 0.4 0.6 0.8 1.0-0.8
-0.4
0.0
0.4
0.8
T0 = T
Rel
ativ
e ch
ang
e o
f Y
x m
m=1 m=3 m=5,K
j=10
m=1 m=3 m=5,K
j=50
Rel
ativ
e ch
ang
e o
f Y
xm
T0 = 0
0.0 0.2 0.4 0.6 0.8 1.00
20
40
60
80
0.0 0.3 0.6 0.90
15
30
45
Rel
ativ
e ch
ang
e o
f β
xm
m=1 m=3 m=5
Rel
ativ
e ch
ang
e o
f β
Xm
a b
Fig. 31. Prediction of T/Tm dependence of (a) Young’s modulus and (b) extensibility of a spherical nanosolid with different mand T/Tm (xm) ratios. For illustration purposes, we only present here the linear T dependence for the high temperatureapproximation. The insertion shows the cases of T0 = 0. The Y values of a nanosolid of lower m values and smaller sizes dropfaster when the test temperature is raised. The extensibility approaches infinity at the Tm. The singularities in the insert exhibitthe shell-by-shell melting features.

0 50 100 150 200 250
0.0
0.2
0.4
0.6
0.8
Rel
ativ
e ch
ang
e o
f Y
K j
BOLS predictionZnO nanowire
a
20 40 60 80 100-0.5
-0.4
-0.3
-0.2
-0.1
0.0
Rel
ativ
e ch
ang
e o
f Y
K j
Polymer BOLS prediction
a b
Fig. 32. Matching predictions to the measurement of Y value (a) enhancement for ZnO nanowires [53] and (b) suppression for apolymer [64].
250 C.Q. Sun / Progress in Materials Science 54 (2009) 179–307
trends of Al (m = 1, T/Tm = 300/650�0.5) [87], and polymers (Tg = 300/450�2/3) [89]. Predictions agreewell with the measured size dependence of compressibility, or the inverse of Young’s modulus, fornanostructures. For instance, nanocrystalline a-Al2O3 with particle sizes of 67 nm, 37 nm, 20 nm,and 6 nm under pressure up to 60 GPa shows a systematic decrease in the compressibility and tran-sition pressure with an increase in particle size. In addition, a high-pressure phase appeared at pres-sure values of 51 GPa and 56 GPa for 67 nm and 37 nm sized a-Al2O3 [163]. The compressibility ofboth Ni and Mo also decreases with particle sizes [434]. Predictions also agree with the observedtrends of temperature dependence of Young’s modulus of CVD nanodiamond films [88], the siliconeresins [89], and the yield stress (linearly proportional to modulus) of Mg nanosolid [90] of a given size.A compensation of the pressure-induced TC elevation to the size-induced TC depression has been ver-ified to be the physical origin for the observed size and pressure effect on the solid–solid phase tran-sition at room temperature of a number of nanostructured specimens [165].
The ductility increases exponentially with temperature until infinity at the Tm value that dropswith solid size. The extensibility of nanometer-scaled Al–Cu alloys in the quasimolten state [180],nanometer-scaled Al2O3 [163] and PbS [435] at room temperature increases generally with grainrefinement. The m values for compounds or alloys are around 4 or higher and their T/Tm ratios are rel-atively lower. The increase of compressibility/extensibility of Al2O3 and PbS nanosolids is associatedwith a decrease of Young’s modulus as temperature rises. The superplasticity of materials such asCu wires (m = 1, T/Tm � 1/2) [385] with grain size less than tens of nanometers in the temperaturerange 0.5–0.6 Tm [436] also agrees with the predictions. The Y-elevation of Si nanosphere (m = 4.88,T/Tm � 1/6) [437] is also within the prediction because of their high m values and low T/Tm ratios.
However, the discrepancy for ZnO wires [53] and Si spheres [437] and Si belts [71] in the sizedependence of elastic modulus may arise from different T/Tm of operation or different experimentalconditions or methods. It is anticipated that modulus enhancement, as observed from TiCrN andGaAlN surfaces [40], may not be observable at room temperature for the low-Tm metals such as Sn,Pb, Al, Zn, Mg, and In. Fig. 33 shows the match between predictions and the measured T-dependentYoung’s modulus for Au, Ag, AlN, Al2O3, MgSO4, MgO, KCl, Si, Ge, and diamond with Tm and hD as inputand EB as derivative of atomic cohesive energy in the bulk at 0 K. The accuracy of the derive EB(0) issubject to many factors such as surface finishing and measurement techniques. It is interesting to notethat the EB(0) derived from the Ge(100) surface is different from that derived from Ge(111) surface.The anisotropy of binding energy may arise from the bond number density in different directions. Fur-ther examination of the anisotropy with more data would be interesting.
Numerical agreement of the temperature dependence of the Y at higher temperatures could be ob-tained for all the models, such as Eqs. (35) and (36), as discussed above despite the different physicalmechanisms. However, we found that the constant B in Anderson’s model is an equivalent of[Eb(0) � (1 + aT)3]�1 in the LBA approach and that the T0 in Watchman’s model corresponds to the

50 100 150 200 250 300 3500.4
0.5
0.6
0.7
0.8
0.9
1.0Y
(T)/
Y(0
)
T (K)
AlN
0 400 800 1200 1600 2000
0.7
0.8
0.9
1.0 Mg
2SO
4
Al2O
3
MgO
Y(T
)/Y(0
)
T(K)
0 50 100 150 200 250 300
0.990
0.992
0.994
0.996
0.998
1.000
Y(T
)/Y
0
T(K)
Si
0 200 400 600 800 10000.94
0.95
0.96
0.97
0.98
0.99
1.00
Y(T
)/Y
(0)
T(K)
Diamond Ge(111) Ge(100)
0 50 100 150 200 250 300 350
0.94
0.96
0.98
1.00
Y(T
)/Y
(0)
T(K)
Ag Au
0 200 400 600 800
0.6
0.7
0.8
0.9
1.0
KCl
Y(T
)/Y
(0)
T(K)
a b
dc
e f
Fig. 33. LBA reproduction (solid lines) of the measured (scattered data) T-dependent Young’s modulus of (a–f) variousspecimens with derived information of mean atomic cohesive energy as listed in Table 9.
C.Q. Sun / Progress in Materials Science 54 (2009) 179–307 251
turning point T0 at which the T–Y curve transits from nonlinear to linear, which is governed by theDebye temperature. In addition, the present approach covers the contribution from thermal expansionand size induced bond contraction without the hypothetic parameters are involved.
6.3.3. Debye temperature and specific heatUsing Eq. (41), one is able to predict the bond nature, size, and temperature dependence of
hD(m,Kj,T). Fig. 34 shows the relative change of hD for nanowires (s = 2, j = 1) with m = 1, 3, 5 andxm (T/Tm) = 0, 0.25 and 0.50. When the measuring temperature is much lower than the melting point(T/Tm� 1), hD is increased when the Kj is decreased; while hD increases faster at larger m values. Onthe other hand, hD is decreased when the operating temperature is raised and the relative change of hD
is greater for smaller m values. A close examination of Fig. 34a and Eq. (41) could lead to a conclusion

10 20 30 40 50 60-0.8
-0.6
-0.4
-0.2
0.0
0.2
Rel
ativ
e ch
ang
e o
f θ D
Kj
x m =0 m=1, m=3, m=5
x m =0.25 m=1, m=3, m=5
x m =0.50 m=1, m=3, m=5
a
0.0 0.2 0.4 0.6 0.8 1.0-0.4
-0.2
0.0
0.2
Rel
ativ
e ch
ang
e o
f θ D
x(T/Tm)
m=1 m=3 m=5, K
j=10
m=1 m=3 m=5,K
j=50
b
Fig. 34. Prediction of (a) size (Kj) and (b) temperature x(T/Tm) dependence of hD for different bond nature (m). The hD increaseswith the decreasing of size at very low T and the hD decreases with decreasing the size for high temperature. The hD ofnanowires with higher m values and smaller size drops faster when the temperature is elevated. The transition pointscorrespond to local melting temperature of the outermost two atomic layers.
Table 9Summary of information derived from reproduction of temperature dependence of Young’s modulus
Sample Tm (K) hD (K) EB(0) (eV)
AlN [439] 3273 1150 5.19MgSO4 1397 711 2.80Al2O3 [412] 2303 986 3.90MgO [440] 3100 885 1.29Ge [441] 1210 360 2.57 (100); 3.47 (111)Diamond [442] 3820 1860 4.92Si [411] 1687 647 4.80Ag [440] 1235 160 1.24Au [440] 1337 170 1.64KCl [440] 1044 214 0.57
The Tm and hD for bulk are input and the atomic cohesive energy Eb(0) are derived from the fitting [8,438].
252 C.Q. Sun / Progress in Materials Science 54 (2009) 179–307
that, for a certain (T/Tm,m) combination, hD may vary insignificantly with particle size, as for the insig-nificant change in Young’s modulus. Fig. 34b shows the temperature-induced relative change of hD fornanowires (s = 2, j = 1) of size Kj = 10 and 50. If we set T0 = T, hD decreases non-linearly with T until theT approaches Tmi (local melting temperature of the ith atomic site). The two transition points for eachof (m,Kj) combinations arise from the loss of bonds, which happens only to the outermost two discreteatomic layers. Moreover, the variation of hD with the temperature and size is more pronounced for lar-ger m and smaller Kj values.
Fig. 35 compares the predictions with various theoretical or experimental data (a) for Au particlesand (b) hD from Debye–Waller parameter measurement for Se nanoclusters. Couchman and Karasz’sapproach [418] shows that the change of hD involves the particle size Kj and cutoff acoustic wavevec-tors K0: DhD/h0 �3p/(8KjK0), without temperature being involved. By applying Eq. (41), withT0 = 0.245Tm and T = 0.16Tm, agreement between the T-BOLS prediction and Couchman and Karasz’sestimation has been reached. If we set T0 = 0.224Tm and T = 0.204Tm, The T-BOLS premise agrees wellwith the measured data of Balerna and Mobilio, as shown in Fig. 35a. In Fig. 35b, the prediction showsthe general trend of hD with respect to size though the precise agreement is not satisfied. However,since the measurement was conducted at T = 293 K which is higher than the local melting temperature

10 20 30 40-0.16
-0.12
-0.08
-0.04
0.00
Rel
ativ
e ch
ang
e o
f θ D
Kj
BOLS consideration Couchman and Karasz Balerna and Mobilio
a
0 20 40 60 80 100-0.5
-0.4
-0.3
-0.2
-0.1
0.0
Rel
ativ
e ch
ang
e o
f θ D
Kj
BOLS consideration Zhao and Lu
b
Fig. 35. Comparison of the T-BOLS predictions with the observations based on (a) Couchman and Karasz’s model (withT0 = 0.245 Tm, T = 0.16 Tm, Tm = 1337 K) [418] and Balerna and Mobile’s measurement (with T0 = 0.224 Tm, T = 0.204 Tm) [419] forAu particles and, (b) Zhao and Lu’s measurement of Se particles (with T0 = T = 0.6 Tm, Tm = 494 K) [420].
C.Q. Sun / Progress in Materials Science 54 (2009) 179–307 253
of the outermost two atomic layers, about 0.6Tm (for Se Tm = 494 K), the features measured are dom-inated by the core interior with an insignificant contribution from the temperature dependence.
As indicated in Eq. (42), the specific heat capacity depends unambiguously on hD and hence on thesize, temperature, and the bond nature involved. Fig. 36a shows the reduced Cv (in units of R, where R isthe gas constant) versus temperature (T/hD0) for Si nanowires (m = 4.88) and Al nanowires (m = 1) ofdifferent diameters (Kj = 5, 10 and 20). The shape of the Cv curve is similar to that of the bulk but thesize induces a depression over the whole temperature range. For the same Kj at a given T/hD0, the reduc-tion of heat capacity is larger for greater m values. Fig. 36b plots Cv/Cv0 (where Cv0 is the bulk heatcapacity at a given temperature) versus Kj at T = 100 K and 300 K for Al and Si nanowires. The heatcapacity decreases with the size at fixed temperature (except for Al nanowires measured at room tem-perature, where the heat capacity is very close to the bulk Cv value obtained when Kj > 15 and increasesslightly with decreasing size). For a given size, the reduction of the heat capacity is more significant at
0.0 0.3 0.6 0.9 1.20.0
0.2
0.4
0.6
0.8
1.0m reduction
Kj reduction
Sp
ecif
ic h
eat
CV/R
T/θD0
Si Kj=5 (m=4.88) Kj=10
Kj=20
a
Al Kj=5(m=1) Kj=10
Kj=20
20 40 60 80 1000.75
0.80
0.85
0.90
0.95
1.00
1.05
m increase
Cv/C
v0
Kj
T=100K Al (m=1) Si (m=4.88)
T=300K Al (m=1) Si (m=4.88)
b
Temperature decrease
Fig. 36. (a) Prediction of the temperature (T/hD0) and size dependence of heat capacity (in units of R) for Si nanowires(m = 4.88) and Al nanowires (m = 1) with Kj = 5, 10 and 20 and at T = 100 K and 300 K, in panels (a) and (b). The heat capacityapproaches R at very high temperature, and decreases with solid size. The reduction of heat capacity is more pronounced forlarger m values at a given T/hD0. The heat capacity generally reduces with solid size and reduces faster at lower temperatureand larger m values.

254 C.Q. Sun / Progress in Materials Science 54 (2009) 179–307
lower temperatures or larger m values. In this analysis, we set T0 = T. If T0 is assumed 0 K, the generaltrend of heat capacity is preserved, but the reduction of heat capacity is more pronounced.
6.4. Summary
A set of analytical expressions for the size, temperature, and bond nature dependence of elasticmodulus and its derivatives on the extensibility, Debye temperature, and specific heat of nanostruc-tures has been established, which covers the essential parameters and their interdependence. It hasbeen clarified why the Y values for some materials are elevated and why those of others are not in-creased upon size reduction. Conclusions can be drawn as follows:
(i) The Young’s modulus of a nanosolid may drop, rise, or remain unchanged with size reduction,depending on the temperature of operation, the nature of the bond involved, and experimentaltechniques and conditions. It is therefore not surprising to observe the elastic modulus changein different trends for different materials measured under different conditions.
(ii) The thermal softening arises from thermal expansion and vibration that weakens the bondthrough the increase of internal energy that follows Debye approximation.
(iii) One could not consider a single parameter on its own without addressing the rest when discuss-ing the mechanical and thermal properties of a material, especially for a small object. Oneshould not separate the mechanical performance from the thermal response in dealing withsmall objects, as they are interdependent.
(iv) The Debye temperature hD has a square root dependence on (Tm � T)1/2/d, rather than a linear orsquare root dependence on Tm. The currently derived solution may provide complementarymethod to the T-independent form of hD given by Lindermann.
(v) The specific heat capacity generally decreases when the solid size is reduced. The reduction ofthe specific heat capacity is more pronounced for larger m values at lower temperatures.
7. Nanograins: II. Plastic deformation and yield strength
� The IHPR can be formulated from the perspective of surface strain and hardening with the involvement oftemperature dependence.� The competition between the energy density gain and the cohesive energy loss in surface skin originates
the IHPR.� The competition between the activation and the inhibition of dislocation motion activates the IHPR.� The strongest size in the IHPR is determined by (i) the nature of the bonds involved; (ii) the temperature
of operation, and (iii) the artifacts in the measurement.� A quasi-molten phase presents in which the superplasticity takes place.
7.1. Observations – Hall–Petch relationship
In plastic deformation tests, the measured flow stress, or hardness, of nanograins changes withits grain size in a trend quite different from the predicted monotonic features of the elastic responsebecause of the involvement of extrinsic factors including artifacts in the contact mode of measure-ment. The flow stress of the solid grains increases under the mechanical stimulus when the grainsize is reduced. For brittle materials, such as intermetallic compounds and ceramics, the ductilityincreases by grain refinement because of the increased grain boundary (GB) volume fraction and,hence, GB sliding and GB dislocation accumulation [443]. As suggested by Zhang and Zarudi [444]the plastic deformation is the coupled result of mechanical deformation controlled by the stress fieldapplied, chemical reaction determined by the external loading environment, and mechanical–chem-ical interaction governed by both loading type and environment. Temperature rise accelerates thepenetration of oxygen into the grain interior and reduces the critical stress for plastic yielding.When the chemical effect is avoided, the initiation of plasticity is enabled by octahedral shear stressbut the further development of plastic deformation is influenced by hydrostatic stress. Plasticity of

0.0 0.1 0.2 0.30.0
0.2
0.4
0.6
0.8
1.0
1.2
IIIIII
IHPR
HPR
P(x
)/P
(0)
x (Kj
-1/2)
Fig. 37. (a) Illustration of the three regions of hardness transition from the classical HPR to the IHPR and (b) the typical best fitof the IHPR for Cu nanograins by Zhao et al. [457].
C.Q. Sun / Progress in Materials Science 54 (2009) 179–307 255
silicon in the form of phase transitions, e.g., from the diamond to amorphous or from the amorphousto bcc structures, is determined by loading history. It has been found recently that the elastic defor-mation of the two-phase alloy obeys the rule of mixtures for a composite; the plastic deformation isgoverned by the softer matrix but enhanced, in part, by the deflection of shear bands by the globularharder phase [445].
The size-induced mechanical hardening of nanograins is divided into three size regions, as illus-trated in Fig. 37a. Region I corresponds to the classical Hall–Petch relationship (HPR) [446–448].Regions II and III are known as the inverse Hall–Petch relationship (IHPR) [449–454]. Postulatedexplanations for the HPR–IHPR behavior include dislocation-based models, diffusion-based models,grain-boundary-shearing models, two-phase-based models and dislocation absorption based mod-els [455]. The observations are also explained by considering two alternative and complementaryrate mechanisms of plasticity, grain boundary shear and dislocation plasticity, each contributing tothe overall strain rate in proportion to the volume fraction of the material in which they operate[456].
The mechanical strengthening with grain refinement in the size range of 100 nm or larger (region I)has traditionally been rationalized with the so-called T-independent HPR that can be simplified in adimensionless form being normalized by the bulk strength, P(1), measured at the same temperatureand under the same conditions:
PðKjÞ=Pð1Þ ¼ 1þ AK�0:5j ¼ 1þ A0lðb=KjÞ0:5 ð45Þ
The slope A or A0 is an adjustable parameter for experimental data fitting, which represents boththe intrinsic properties and the extrinsic artifacts such as defects, the pile-up of dislocations, shapesof indentation tips, strain rates, load scales and directions in the test. The l and b correspond,respectively, to the shear modulus and the Burger’s vector modulus reduced by atomic size, d.The bulk modulus B is related to the shear modulus l and the Poisson ratio m by l = B/[2(1 + m)].Using the dimensionless form of the normalized strength is aimed to minimize the contributionfrom artifacts due to processing conditions, crystal orientations, and the purity of the specimensif the measurement is conducted under the identical conditions throughout the course of the exper-iment. For convenience, we use both xj ¼ K�0:5
j and Kj as indicators of the dimensionless form ofsizes.
As the crystal is refined from the micrometer regime into the nanometer regime (region II), theclassical HPR process invariably breaks down and the yield strength versus grain size relationshipdeparts markedly from that seen at larger grain sizes (region I). With further grain refinement, theyield stress peaks in many cases at a mean grain size in the order of 10 nm or so. A further decrease

256 C.Q. Sun / Progress in Materials Science 54 (2009) 179–307
in grain size (region III) can cause softening of the solid, instead, and then the HPR slope turns frompositive to negative at a critical size, or so-called the strongest grain size [458].
There has been a huge database established on the HPR and IHPR effects. For example, by squeez-ing Si nanospheres of different sizes between a diamond-tipped probe and the sapphire surface,Gerberich et al. [437] determined at room temperature that a defect-free silicon nanoparticle witha diameter of 40 nm is �3 times (50 GPa) harder than bulk silicon (12 GPa) while it was around20 GPa with a diameter of 100 nm. The smaller the sphere, the harder it was. Tensile tests of theelectrodeposited nanocrystalline Ni-W alloys with grain sizes of 20 nm, 12 nm, 8 nm and 5 nm re-vealed that the strongest grain size is at 8–10 nm that is an essential characteristics of the nanocrys-talline Ni–W alloys [459–461]. The softening of nanograins is also attributed to the increase ofintercrystalline volume fraction, especially the fraction associated with the triple junction [462].The IHPR effect has also been experimentally observed in SiC [463], Ni–P [464], melt-spun AlMnCeand AlCrCeCo alloys [465]. More examples are given in Table 10.
There has been a concerted global effort underway using a combination of novel processing routes,the state-of-the-art experimental measurements, and large-scale computations to develop deeper in-sight into the IHPR phenomena. Progress in fabrication, characterization, and the understanding of theHPR–IHPR relations of nanocrystalline materials have been reviewed by many specialists in the field[466–476].
7.2. Understanding at the mesoscopic level
Numerous models have been developed for the HPR and IHPR effects. The possible mechanismsfor the plastic deformation of nanograins include the pile-up breakdown, GB sliding, core and man-tle structures, GB rotation, grain coalescence, shear-band formation, gradient and twinning effects.
Table 10Comparison of the measured and predicted strongest critical grain sizes for IHPR transition with f = 0.5, 0.668 and m = 1 otherwiseas indicated
Element d/nm Tm/K PM Measured DC/nm Predicted DC/nm (f = 0.5; 0.663)
Mg 0.32 923 – 18.2; 17.3Ca 0.394 1115 – 22.41; 22.41Ba 0.443 1000 – 25.2; 23.9Ti 0.293 1941 – 23.6; 23.6Zr 0.319 2182 – 29.3; 29.3V 0.2676 2183 – 24.6;24.6Ta 0.2914 2190 – 26.8;26.8Fe 0.252 1811 9765 18.2 19.1Co 0.2552 1728 – 19.3Ni 0.2488 1728 7042 17.5;13 [499] 18.8Cu 0.2555 1358 890 14 [11]; 14.9; 25–30 [512] 16.1Zn 0.2758 693 1034 17.2; 10; [513] 11 [451] 18.5; 16.5Pd 0.2746 1825 3750 19.9 20.8Ag 0.2884 1235 – 17.3Pt 0.277 1828 – 21.0Au 0.288 1337 – 17.3Al 0.286 993 – 18 [11] 16.3;15.4C 0.154 3800 – 20.5 (m = 2.56)Si 0.2632 1683 4 9.1 10.6 (m = 4.88, f = 0.1)Ge 0.2732 1211 – 11.5 (m = 4.88, f = 0.1)Sn 0.384 505.1 – 47.2; 40.6Pb 0.3492 600.6 – 28.0; 24.9Bi 0.34 544.4 – 36.0; 29.2Ni80P20 0.2429 1184 7063 7.9 (m = 4) 8.9NiZr2 0.4681 1393 7093 17.0 (m = 4) 19.8TiO2 0.3860 2098 7432 22.5 (m = 4) 23.1(f = 0.01)
The predicted critical sizes agree with measurement as derived from Fig. 39 unless with given references. Changing the f valueonly affects the DC (= 2KCd) of a material with Tm below 1000 K [209].
C.Q. Sun / Progress in Materials Science 54 (2009) 179–307 257
The IHPR appears because of the increased porosity at small grain sizes, suppression of dislocationpile-ups, and dislocation motion through multiple grains, enhanced grain boundary diffusion, or ab-sence of dislocations in the small grains without the mirror forces in the next grain being involved.It appears that the mechanism for the HPR and the IHPR is a topic of endless debate because of thenumerous complicated factors. Typical mechanisms for the HPR, IHPR, and the transition from HPRto IHPR and the critical grain size are discussed as follows.
7.2.1. HPR–I – linear hardening
� GB barriers limited dislocations. For large grain sizes, most of the models using a mechanism basedon dislocation pile-up account for the grain size dependence of the macroscopic plastic flowstress [477,478]. In deriving the HPR, the role of GBs as a barrier to dislocation motion is con-sidered in various models. One type of models [479] regards the GBs as barriers to the pile-up ofdislocations. The GB stress of one grain concentrates the dislocations, which activates the dislo-cation sources in the neighboring grains, thus initiating slip from grain to grain. The other typeof models [480] regards the GBs as dislocations barriers limiting the mean free path of the dis-locations, thereby increasing strain hardening, resulting in the HPR [481]. The conventional dis-location theory for the HPR gives a linear dependence of P on K�1=2
j only when there are a largenumber of dislocations in a pile-up, which is equivalent to assuming that the grain sizes in thepolycrystalline material under consideration is large. Deformation mechanism at larger scales isbelieved to occur through the production and motion of dislocations within the individualgrains [482].
7.2.2. IHPR–II – HPR deviation
� Transition of GB sourced dislocations. The first theoretical attempt relied on dimensional arguments.It was proposed that dislocations in nanograins are nucleated at GBs, travel across the grain, andannihilate on the opposite GBs, and therefore, intragranular transition dominants the HPR deviation[483].
� GB stacking fault drained dislocations. As the grain size is decreased, dislocations are expected to pileup at the GBs and become less mobile because of the role of the stacking-fault energy, essentially amisfit energy caused by atomic planes stacked out of sequence, thus leading to increased strength[482]. Therefore, the IHPR is attributed to the GBs that serve as a dislocation drains rather than asdislocation sources [484]. In the nanometer regime, GBs are occupying a significant fraction of thematerial’s volume, deformation proceeds by a mechanism that is intergranular rather than intra-granular, instead, as argued above.
7.2.3. IHPR–III – softening
� GB migration and diffusion mechanism suggests that the GB migration and diffusion dominate thesize-induced softening. When the grain size is below the critical values of 10–20 nm, more than50% of atoms are associated with GBs or interfacial boundaries. Therefore, GB atoms play the dom-inating roles in the softening of nanocrystalline materials. Nanocrystalline materials exhibit creepand superplasticity at lower temperatures than do conventional micro-grained counterparts. Sim-ilarly, plastic deformation of nanocrystalline coatings is considered to be associated with GB slidingassisted by GB diffusion or rotation. MD calculation using the embedded atom method [485] andthe effective medium theory [486] suggested that GB migration and sliding are predominantinstead of the mechanism of diffusion switching [487]. An intricate interplay between GB slidingand GB diffusion may occur, and therefore, the IHPR effect arises from sliding-accommodated GBdiffusion creep [466,488].

258 C.Q. Sun / Progress in Materials Science 54 (2009) 179–307
� Soft GBs embedded hard cores. This composite core-shell structure model suggests that the IHPRdeformed bulk metallic glass can be treated as a composite of hard amorphous grains surroundedby a shell of soft GBs [489,490]. The grain interior deforms elastically under external stresses, whilethe plastic deformation of the GB layer is governed by a Maxwell’s equation. In such a microstruc-ture, the deformation of the GB shell contributes significantly to the overall deformation. Nieh andWang [491] indicated that the apparent IHPR in the BeN alloy is actually an artifact as it is caused bythe presence of relatively soft amorphous Be–B phases when the grain size of Be is significantlyrefined by B alloying. When the grain size was less than 10 nm, the GBs were thicker than thoseof coarser-grained materials. The interface region of the nanocrystallites, having a structure ofnon-periodic atomic array, expanded into the centre region. Factors such as residual porosity, impu-rities, residual stresses, minor surface flaws, and/or narrow shear bands are suggested to lower andscatter the tensile strength values [492]. Similarly, a phase mixture model [462,493] treats a poly-crystalline material as a mixture of two phases: the grain interior material whose plastic deforma-tion is governed by dislocation and diffusion mechanisms and the GB ’phase’ whose plastic flow iscontrolled by a GB diffusion mechanism [494,495]. The size effect in this grain size range is gov-erned by the reduction in dislocation mean-free path through GBs diffusion rather than dislocationnucleation [496]. The softening in plastic deformation was also ascribed as a large number of small’sliding’ events of atomic planes at the GBs, with only a minor part being caused by dislocationactivity in the grains; the softening at small grain sizes is therefore due to the larger fraction ofatoms at the GBs [458]. A recent acoustic emission spectroscopic study [497] suggested that a pecu-liar deformation behavior, due to the competition between different deformation mechanisms suchas dislocation pileups in nanocrystalline grains and grain sliding-grain rotation within amorphousboundaries, plays a vital role in the deformation of superhard nanostructures.
7.2.4. HPR–IHPR transition
� Grain size triggers collective motion of dislocations. This mechanism [498] suggests that the classicalHPR arises from the collective motion of interacting dislocations yet the breakdown for nanometricgrains stems from the loss of such a collective behavior as the grains start deforming by successivemotion of individual dislocations. Mohamed [499] interpreted the nanometer-scaled softening interms of dislocation-accommodated boundary sliding. The HPR breakdown may lead to three pos-sible behaviors according to the patterns of dislocations: (i) If dislocations are nucleated at vertices,the IHPR will bend down showing softening characteristics. (ii) If dislocations are at the GB triplejunctions, the IHPR curve will turn to be flat without softening or hardening taking place. (iii) If dis-locations occur at the GBs, the IHPR will remain the classical HPR trend and there will be no IHPR.
� Dislocation absorption. Carlton and Ferreira [455] revised the HPR with a statistical probability ofdislocation absorption by grain boundaries, showing that the yield strength is dependent on strainrate and temperature and deviates from the HPR below a critical grain size. The HPR becomes IHPRin the following form
PðKjÞ=Pð1Þ ¼ 1þ Aðð1� PdisÞ=kjÞ0:5;
where Pdis is the probability of a dislocation being absorbed by the grain boundary.� Core-shell role exchange. The IHPR slope transition is also suggested to arise from the role-exchange
of the grain interior and the GBs [500]. The thermally activated GB shear [451] and the excessivevolume of the under-coordinated GB atoms [501] are suggested to be responsible for the IHPR soft-ening [502,503]. A switch in the microscopic deformation mechanism from dislocation-mediatedplasticity in the coarse-grain interior to the GB sliding in the nanocrystalline regime is suggestedto be responsible for the maximum strength [504]. In the HPR regime, crystallographic slips inthe grain interiors govern the plastic behavior of the polycrystallite; while in the IHPR regime,GBs dominate the plastic behavior. During the transition, both the grain interiors and the GBs con-tribute competitively. The slope in the HPR is suggested to be proportional to the work required to

C.Q. Sun / Progress in Materials Science 54 (2009) 179–307 259
eject dislocations from GBs and the GB strain energy has to be taken into consideration [505]. Thetransition with decreasing grain size from a GB dislocation to a GB-based deformation mechanismin the nanocrystalline fcc metals provides also a possible mechanism [506].
7.2.5. Strongest grain size estimationThe strongest grain size could be estimated by the following approaches. One approach is to as-
sume that the plastic deformation of a nanocrystal switches abruptly from the pile-up of dislocationsto the GB-relaxation mechanism at a grain size, d = dc [493]
PðKcÞ=Pð1Þ ¼ 1þ AK�0:5c ¼ 1þ g
dc
w� 1
� �
where g is an adjustable parameter depending on grain morphology and w the GB width that isapproximately three times the Burgers vector, b, i.e., w ffi 3b. According to this model, the strengthof the IHPR material decreases linearly with its grain size below a certain threshold. The dc was esti-mated to be 25 nm for Cu, in comparison to the reported values of 14 nm [507], 18 nm [508], and50 nm [509].
Another approach for the flow stress of an A–B alloy suggests that the strongest grain size repre-sents the emergence of GB diffusion that causes the HPR breakdown. For the A–B alloy, the criticalgrain size is given by [459]
diAB ¼
DB
DAð1� cÞ þ c
� �2=7
diA
where diA is the critical grain size for pure A, DB and DA are the diffusivity of atom B in A and the self-
diffusivity of A, respectively. The c is the atomic ratio of B to A. A prediction of the strongest grain sizefor the W/Ni alloys (with 13–19.6 at% W and a presumption of di
Ni ¼ 12 nm) shows acceptable agree-ment to the measured critical size of around 8–10 nm [459].
7.2.6. Tm(Kj) dependent IHPRUnfortunately, an atomistic analytical expression for reproducing the yield strength over the whole
HPR and IHPR size range was lacking until recently when Zhao et al. [457] modified the T-independentHPR by introducing the activation energy for atomic dislocation to the HPR slope. The activation en-ergy was related directly to the melting point suppression, Tm(Kj) / EA(Kj) [328]. The suggested IHPR isin the following form
PðKjÞ ¼ P0 þ A1 þ A2K�1=2j
�exp
TmðKjÞ2T0
� �
where P0, A1 and A2 are adjustable parameters for data fitting. T0 is the reference temperature of mea-surement and Tm(Kj) is the Kj dependent melting point. The Tm(Kj) drops with the inverse size of thenanoparticle, Kj. This approach with inclusion of the essential fact of the size-induced Tm depressioncould reproduce the IHPR observations quite reasonably for a number of specimens, as shown for asample of such cases in Fig. 37b.
7.3. LBA and T-BOLS approach: dual competition
The measured size and temperature dependence of the yield strength and compressibility of ananosolid can be obtained by substituting the size and bond nature dependent g1(Kj), d(Kj), andTm(Kj,m) for the g1i, di, and Tmi in Eq. (25) that was initially derived for an atomic bond and a flat sur-face. The solution is expressed as
PðKj; TÞPð1; T0Þ
¼g1ðKjÞg1ð1Þ
� ddðKj ;TÞ
�3� TmðKj ;mÞ�T
Tm�T0¼ PðKjÞ
Pð1ÞuðKj;m; TÞ ðBorn-criterionÞ
ddðKj ;TÞ
�3� g2ðKjÞþg1ðKjÞ½TmðKj ;mÞ�T�
g2ð1Þþg1ð1ÞðTm�T0ÞðFull energyÞ
8><>: ð46Þ

260 C.Q. Sun / Progress in Materials Science 54 (2009) 179–307
In Born’s criterion, the additional term u(Kj,m,T) includes contributions from bond nature, bondlength, and the separation of [Tm(m,Kj) � T] to the yield strength of a solid in the T-independentHPR treatment. The term [Tm(m,Kj) � T] in the Born’s criterion is replaced by the net energy differencein the full-energy approximation. Numerically, these approximations are substantially the same be-cause the addition of g2 leads to only an insignificant offset of the relative P values. However, accord-ing to the fact that the mechanical strength approaches zero at melting, the term of g2 can be ruled outand the Born’s criterion is applied. Therefore, the full-energy consideration can be ignored in the caseof plastic deformation for the first order approximation.
By comparing the currently derived form of Eq. (46) with the traditional HPR of Eq. (45), one canreadily find that the ratio of the size dependent specific heat per bond follows the traditional nonT-dependent HPR, g1ðKjÞ=g1ð1Þ ¼ PðKjÞ=Pð1Þ ¼ 1þ AK�0:5
J . Incorporating the activation energy,EA(Kj) / Tm(Kj) [328,457,510], for atomic dislocation into the pre-factor A, leads to an analyticalexpression for the size and temperature-dependent HPR:
PðKj;TÞPð1; TÞ ¼
g1ðKjÞg1ð1Þ
ddðKjÞ
� �3
� TmðKj;mÞ � TTm � T0
( )
¼ ½1þ AK�0:5j � ½1þ DdðKjÞ��3 � TmðKj;mÞ � T
Tm � T0
� ¼ /ðAðT; TmðKj;mÞÞ;KjÞ �uðKj; T; TmðKj;mÞÞ ð47aÞ
where
A ¼ AðT; TmðKj;mÞÞ ¼ f 0 � expTmðKj;mÞ
T� 1
� �¼ f � exp
TmðKj;mÞT
� �DdðKjÞ ¼
Xi63
cijðci � 1Þð47bÞ
The activation energy for dislocation motion is proportional to the size and bond naturedependence of the atomic cohesive energy, or the temperature difference between melting andoperation
EAðKj;m; TÞ / TmðKj;mÞ � T ¼ Tmð1;mÞb1þ DCðKjÞc � T
DCðKj;mÞ ¼Xi63
cijðzibC�mi � 1Þ ð47cÞ
The pre-factor f is an adjustable parameter, which should cover both intrinsic and extrinsic contri-butions. The Dd(Kj) is the contraction of the mean bond length and DC(Kj,m) the perturbation to themean cohesive energy of a nanograin.
The difference of Tm(Kj,m) � T or the ratio of Tm(Kj,m)/T is critical as it appears in both parts of uand /. The derived form in Eq. (47) represents two types of competition in the IHPR:
(i) One is the intrinsic competition between the remaining atomic cohesive energy and the energydensity gain in the GBs and their temperature dependence, in terms of the separation ofTm(m,Kj) � T. If T remains unchanged during the measurement, a size reduction will decreasethe Tm(m,Kj) and hence the value of Tm(m,Kj) � T. Thus, the strength of the solid will drop withsolid size. The energy density gain is represented by the term of g1(Kj)/g1(1) = z/z(Kj), beinginversely proportional to the average coordination, as discussed in the section dealing withMC elongation. In nanograins, the deviations of both the energy density and atomic cohesive-energy arise from GB atoms as atoms in the grain interior retain their bulk nature.
(ii) The other is the competition between the activation and inhibition of dislocations motion. Theexponential form of Tm(m,Kj)/T represents the easiness of activating dislocations. Because theTm(m,Kj) drops with solid size, the dislocation motion becomes easier to form at smaller sizesbecause of the under-coordinated GB atoms, agreeing with observations of Han et al. [388]The counterpart of competition comes from dislocation accumulation and strain gradient workhardening that inhibit further sliding dislocations, which complies with the traditional

C.Q. Sun / Progress in Materials Science 54 (2009) 179–307 261
establishment in the T-independent HPR of AK�0:5j . The factors such as impurities or defects,
shapes of indenter tips, strain rates and directions, and loading directions and scales also con-tribute to the yield strength measured [204].
Therefore, the intrinsic competition between the remaining atomic cohesive-energy and the bind-ing energy density gain in the GBs and the extrinsic competition between the activation and the resis-tance of dislocations determine the entire process of HPR and IHPR, which depends on temperature ofoperation because of the thermally driven bond expansion and bond weakening. The analytical formalso represents that the under-coordinated atoms in the surface skin dictate the IHPR whereas atomsin the core interior retain their bulk features and that both the bond length and bond strength are tem-perature dependent.
According to this solution, the grain boundary is harder at temperatures far below Tm(Kj,m) be-cause of the dominance of bond strength gain, whereas at temperatures close to the surface Tm, theGB is softer than the grain interior because of the dominance of bond order loss that lowers the barrierfor atomic dislocation motion, concurring with the mechanism of core-shell role exchange. Whenoperating at a given temperature, solid size reduction lowers the Tm(Kj,m). When Kj is sufficientlylarge, the analytical form degenerates into the traditional HPR, of which the slope is now clearly seento be dominated by the term f � exp(Tm(m,1)/T) that relates to the specific heat or activation energyfor atomic dislocation.
The derived from supports the known mechanism of core-shell role exchange [489–505] and thecomposite or the mixed phase structure model [489,496] for the IHPR. The T-BOLS approximation fur-ther clarifies that the competition between the remaining atomic cohesive-energy (Tm suppression)and energy density gain in the GB region dictates intrinsically the mechanical behavior at GBs, whichis sensitive to the temperature of operation. As the solid size is decreased, transition from the domi-nance of energy density gain to the dominance of remaining atomic cohesive-energy occurs at the crit-ical size at which both mechanisms contribute competitively. It is emphasized that all the modelsdiscussed above give reasonable explanations of the HPR/IHPR transition but, with the currently pro-posed temperature dependence of the T-BOLS consideration as the atomistic and intrinsic origin, allthe approaches would be correct and complete.
7.4. Applications
7.4.1. Strongest sizes in the IHPRBy equilibrating the differential of the natural logarithm of Eq. (47a) to zero and d(Ln(P/P0))/dxj = 0,
we can readily find the critical size KC(f,Tm(xj)T,m) with the slope of HPR transiting from positive tonegative, which will then distinguish factors dominating the KC value. For calculation convenience,we define xj ¼ K�0:5
j , h(xj) = T/Tm(xj), and h(0) = T/Tm(1). P and P0 represent P(xj,T) and P(0,T0), respec-tively. The numerical processing leads to the following relation:
dðLnðP=PoÞÞdLnðxjÞ
¼ Aðxj; hðxjÞ;mÞ �hð0Þ þ 2Dcðxj;mÞ
hð0Þð1þ Aðxj; hðxjÞ;mÞÞ� 6DdðxjÞ
1þ DdðxjÞþ 2Dcðxj;mÞ
1þ Dcðxj;mÞ � hð0Þ ¼ 0
ð48Þ
This solution indicates that the critical size depends on the bond nature indicator m, T/Tm(xj), andthe pre-factor f in A. Solving this equation numerically gives rise to the critical sizes xC of differentmaterials, agreeing with measurements, as listed in Table 10.
7.4.2. TC for phase transitionWe may define the critical temperatures, TC, and the corresponding critical size, KC, for the tran-
sition from solid to quasimolten and Tm for transition from quasimolten to liquid using therelations:
PðKj; TCÞPð1; TCÞ
¼ 1þ AðKj; hðKjÞ;mÞ½1þ DdðKjÞ�3
� TmðKj;mÞ � TC
Tm � TC
6 1 ðQuasi-moltenÞ¼ 0 ðLiquidÞ
�ð49Þ

Fig. 38. Theoretical phase diagram for small gold clusters shows the size-depressed critical temperatures for melting and quasi-melting [511] though the phase boundaries are subject to verification.
262 C.Q. Sun / Progress in Materials Science 54 (2009) 179–307
The quasimolten state is such defined as that at a temperature higher than TC(Kj, f,m), the solid ofcritical size KC is softer and easily compressible compared with the bulk counterpart at T = TC(Kj, f,m).At the melting point, Tm(xj,m), the quasimolten state becomes a liquid associated with zero hardnessand infinite compressibility. TC is lower than the Tm for the same size. This definition is much the sameas in Born’s criterion indicating the absence of modulus at melting, and that defined by Marks [511], asillustrated in Fig. 38.
7.4.3. Strongest grain sizes estimationBy incorporating the value of g1(xj)/g1(0) = 0.00187/0.0005542 = 3.3742 for an impurity-free gold
MC into Eq. (47a), we may estimate the value of f for the gold MC with the parameters of zi = 2,Kj = 1.5, xj = 1/
pKj = 1.223, m = 1, T = 298 K, and Tm(xj) = 1337.33/4.1837 = 318 K:
f ¼ g1ðxjÞg1ð0Þ
� 1� ��
xj � expTmðxjÞ
T
� ��¼ 2:3742
� �1:223� exp
318298
� �� ¼ 0:668 ð50Þ
The f value is intrinsic for the elongation test of the impurity-free Au–MC. However, in the plasticdeformation test of nanograins, artefacts such as the external stress or strain rate or structural defectswill contribute to the yield strength and hence the pre-factor f value. The f term is an adjustableparameter that may change value when the nature of the bond is altered, such as in the cases of Siand TiO2 that will be shown shortly.
Further calculations using Eq. (47) were performed on some nanosolids with the known d and Tm
values as the input and the xC as the output as listed in Table 10. All the nanograins were taken asbeing in spherical shape. The prefactor f is adjusted under the constraint that the HPR slope shouldmatch the observations and intercept at the positive side of the vertical axis. A negative interceptin measurement is physically unreasonable because of the positive hardness for the bulk. The theoret-ical curves were normalized with the calculated peak values at the transition point, xC, and the exper-imental data measured at room temperature were normalized with the measured maximum PM.
The T-BOLS predictions match reasonably well to all measurements. The perfect match of the IHPRfor NiP alloy and TiO2 compound may adequately evidence that the current T-BOLS and LBA ap-proaches are close to the true situations of IHPR involving both intrinsic and extrinsic contributions.As can be seen from Table 10, changing the f values from 0.5 to 0.668 has no effect on the critical size

0.0 0.1 0.2 0.30.0
0.2
0.4
0.6
0.8
1.0
1.2aP
(x)/
P(0
)
x
Cu-01
Cu-02
Cu-03
0.0 0.1 0.2 0.30.0
0.2
0.4
0.6
0.8
1.0
1.2b
P(x
)/P
(0)
x
Fe-01
Fe-02
Fe-03
0.0 0.1 0.20.0
0.2
0.4
0.6
0.8
1.0
1.2c
P(x
)/P
(0)
x
Ni-01
Ni-02
Ni-03
0.0 0.1 0.2 0.3 0.40.0
0.2
0.4
0.6
0.8
1.0
1.2
1.4
1.6d
P(x
)/P
(0)
x
NiP
NiZr2
m = 4
0.0 0.1 0.2 0.30.4
0.6
0.8
1.0
1.2e
m = 4, f = 0.01
P(x
)/P
(0)
x
TiO2
0.0 0.1 0.2 0.30.0
0.2
0.4
0.6
0.8
1.0
1.2f
m = 4.88, f = 0.1
P(x
)/P
(0)
x
Si
Fig. 39. Theoretical reproduction (solid line) of the measured IHPR (scattered data) of (a) Cu [514–516], (b) Fe [514], (c) Ni[452,517], (d) NiP [518] and NiZr [431], (e) TiO2 [519] and (f) Si [437]. The solid curves represent the complete T-BOLS form,b1þ f � xj � expðTmðxjÞ=Tcuðd;m; TÞ. The straight lines are traditional HPR representing 1þ f � xj � expðTmð0Þ=TÞ and itsintercept at the y-axis corresponds to the normalized hardness of the bulk counterparts. The dashed curves are the modifiedHPR, b1þ f � xj � expðTmðxjÞ=TÞc. The slope f = 0.5 was optimized unless otherwise indicated for all the samples.
C.Q. Sun / Progress in Materials Science 54 (2009) 179–307 263
for materials with Tm(0) > 1000 K, or T/Tm(0) < 1/3, and therefore, for the examined samples, usingf = 0.5 or 0.663 makes no difference. The small f values for TiO2(0.01) and Si (0.1) may be dominatedby the bond nature alteration that lowers the Tm(xj,m) insignificantly.
Strikingly, one datum point of measurement is sufficient to calibrate the IHPR of a specimen. Forexample, applying the measured relative hardness of the defect-free 40 nm silicon nanosphere tothe IHPR equation results in the maximum hardness of Si nanosolid at room temperature being 5

0.0 0.1 0.2 0.3 0.4 0.5 0.60.0
0.5
1.0
1.5
2.0
a Pb
P(x
)/P(0
); β (
x)/β
(0)
x(k-0.5)
HPR IHPR-1 IHPR-2β(x)/β(0)
0.0 0.2 0.4 0.6 0.8 1.00
2
4
6
8
b Au
MC
P(x
)/P(0
); β
(x)/ β
(0)
x (K-0.5)
HPR IHPR-1 IHPR-2β(x)/β(0)
Fig. 40. Comparison of the IHPR-2 (solid line) transition and critical sizes for solid-to-quasimolten and quasimolten-to-liquidtransition at 300 K for (a) Pb (m = 1, Tm = 600.6 K, f = 0.668) and (b) Au (m = 1, Tm = 1337.33 K, f = 0.668). P/P0 = 1 corresponds toquasimolten state with critical temperature TC(x); P/P0 = 0 corresponds to quasimolten-to-liquid transition Tm(x). Broken linesrepresent the reduced compressibility that drops first and then bends up until the bulk value at TC(x) and then goes up toinfinity at Tm(x). The Au–MC is in quasimolten state at 300 K, which clarifies further the high extensibility of Au–MC at theambient temperature. The curve of IHPR-1 could not reach the quasimolten or the liquid states.
264 C.Q. Sun / Progress in Materials Science 54 (2009) 179–307
times the bulk value and the IHPR critical size being at 9–10 nm. The calibration using one datumpoint and the known bulk value should be one of the advantages of the current approach in predictingand calibrating the IHPR of a solid. Applying m = 4.88 for Si to Eq. (47a) gives immediatelyc1 = (85 ± 1)% and the corresponding z1 3.60 ± 0.25. The z1 for the spherical Si is slightly lower thanz1 = 4 for the flat surface and the c1 is slightly lower than a flat surface (88%) because of the positivecurvature of the sphere.
7.4.4. Factors dominating the strongest sizeFig. 40 shows that, as for the inverse of yield strength, the normalized compressibility drops first
and then bends up at the IHPR critical point until it reaches the bulk value at TC(x) and then goesup to infinity at Tm(x). This trend agrees with the breaking limits of metallic MC and polymer chainsapproaching Tm.
Results show that the Pb nanosolid of x = 0.34 (D = 6 nm) size becomes quasimolten and of x = 0.52(2.6 nm) becomes liquid at 300 K because of the lower bulk melting point (600 K). In contrast, the Aunanosolid of x = 0.68 (D = 1.25 nm) becomes quasimolten and x = 0.95 (D = 0.64 nm being smaller thanone fcc unit cell) becomes liquid at 300 K. Therefore, the gold MC (or an fcc unit cell) is in the quasimoltenstate at 300 K, which clarifies further why the Au–MC is highly extendable at the ambient temperature.However, the curve of IHPR-1 with u(x,m,T) = 1 could hardly reach the quasimolten or the liquid states inboth cases. Therefore, the intrinsic competition is important though it appears less significant.
Fig. 41 demonstrates the f, m, and T/Tm(0) dependence of the xC values. The critical size varies sig-nificantly with the temperature of operation (T/Tm(0)) and the bond nature indicator (m). In the rangeof f = 0.1 and 1.0, xC depends less on the f values if the T/Tm(0) ratio is smaller than 0.15. It is interestingto note that there exist two operating temperatures for one xC value in both panels (a) and (b). For thexC = 0.15 example, the temperature reads as T = 0.17 Tm and 0.65 Tm for the f = 1 curve in panel (a); andthe T reads 0.1 and 0.7 Tm for m = 5 in panel (b). This result means that the same critical size can beobtained by measuring the specimen at two different temperatures but the corresponding values ofhardness are completely different; the strength at low T is much higher than the strength at the higherT, as demonstrated in Fig. 42a.
7.4.5. Size effect on TC(x) and Tm(x)From the T/Tm and size dependence of strength and ductility in Fig. 42a, we may note the following
trends in general:

a b
0.0 0.2 0.4 0.6 0.8
0.05
0.10
0.15
0.20
x C
T/Tm(0)
f value 1.0 0.6 0.4 0.1 0.01
0.0 0.2 0.4 0.6 0.80.05
0.10
0.15
0.20
0.25
x C
T/Tm(0)
m value 5 4 3 1
Fig. 41. Dependence of xC(m, f,T/Tm(0)) on (a) the extrinsic factor f and (b) the intrinsic bond nature indicator m. At T/Tm(0) < 0.15, xC is independent of the f values but the bond nature has an influence over the whole range of temperature. Onecritical size xc can be obtained at two temperatures with different hardness.
C.Q. Sun / Progress in Materials Science 54 (2009) 179–307 265
(i) For a given material of a given size, the normalized mechanical strength drops from infinity tozero when T increases from zero to Tm(x,m), associated with an increase of ductility until a sin-gularity is reached at Tm(x). Meanwhile, the Tm(x) drops with size by 5% and 15%, respectively,for the xC = 0.15 and 0.21 examples.
(ii) Both P and b reach their bulk values (or transits into quasimolten state) at TC = 0.75 Tm and 0.65Tm for xC = 0.15 and 0.21, respectively. When T > TC, P drops and b rises in an exponential way.
A comparison of the size dependence of the normalized atomic distance d(xj)/d(0), melting point,Tm(xj,m = 1)/Tm(0), and the ratio of TC(xj, f,m = 1)/Tm(0) for solid-to-quasimolten transitions shown inFig. 42b indicates that the TC(xj, f) drops more rapidly with size than Tm(xj,m). The bulk TC value isabout 20% lower than that of the bulk Tm. This trend agrees with the findings of Marks as shown inFig. 38, with a clarification of the distinguishable separation between the Tm and TC in the whole rangeof solid size.
It is interesting to note that the currently defined Tm(xj)/Tm(0)-BOLS curve overlaps the curvederived from Born’s criterion, Tm(xj)/Tm(0)-Born, which indicates the consistency in the respective
0.2 0.4 0.6 0.80
1
2
3
4a
P/P
0 ; β
/β0
T/Tm
f = 0.5; m = 1x
C = 0.15 P/P
0
β/β0
xC = 0.21 P/P
0
β/β0
0 20 40 60 80 1000.0
0.2
0.4
0.6
0.8
1.0b
Rat
io
Kj(x
j
-2)
d(x)/d(0)
Tm(x)/Tm(0)-Born
Tm(x)/Tm(0)-BOLS
TC (x)/Tm (0)
Quasimolten
Solid
Liquid
Fig. 42. (a) T/Tm dependence of the mechanical strength and ductility of nanocrystals of size xC = 0.15 and 0.21, and (b)comparison of the size dependence of phase diagram showing the critical temperatures for solid-quasimolten transition, TC(x)/Tm(0), and quasimolten–liquid transition of metallic nanosolid (m = 1) and the size dependence of bond length contraction, d(x)/d(0). Tm(x)/Tm(0)-BOLS curve overlaps the Tm(x)/Tm(0)-Born.

266 C.Q. Sun / Progress in Materials Science 54 (2009) 179–307
physical mechanisms of melting. The BOLS model suggests that the melting is governed by the atomiccohesive energy (Tm / ziEi) depression and the Born’s criterion Eq. (49) requires that the modulus ormechanical strength approaches zero at Tm [177]. The trend of the Tm(xj)/Tm(0) curves also agree withthe models of Shi [329] and Jiang et al. [520,521] derived from Lindermann’s criterion of atomic vibra-tion, the model of surface lattice/phonon instability of Vallee et al. [522,523] the models of liquid drop[143] and the model of surface area difference determined cohesive energy [524]. Therefore, all themodels are correct despite different perspectives.
7.4.6. Quasimolten state and superplasticityThe concept of quasimolten may improve our understanding of the superplasticity of the nano-
grained solid. Superplasticity, an excessive strain of 103 without any substantial necking region whenloaded in tension, is generally observed in materials with grain size less than 10 mm in the temper-ature range of 0.5–0.6 Tm [434]. For Si and SiC nanowires of several 10 s nm in diameter, such plasticitywith 150% elongation has also been observed [386,387]. Because of the large GB volume fraction andthe high self-diffusivity, superplasticity is achievable at lower temperatures and/or higher strain ratesfor some nanocrystalline materials. For a Cu nanosolid example with Kj = 10 (5 nm in diameter) size,the bond length contracts by a mean value of 5%, associated with a 25% drop of Tm and a 50% drop of TC
with respect to the bulk Tm(0) value of 1358 K. The 5 nm-sized Cu solid is in a quasimolten state at680 K according to Fig. 42b. The self-heating in operation because of the energy released from the pro-cess of bond breaking and unfolding should raise the actual temperature of the specimen. Hence, thejoint effect of size-induced TC suppression and the bond breaking/unfolding induced self-heating mayprovide an additional mechanism for the high ductility of Cu nanowires [383] at the ambient temper-atures, which is dominated by bond unfolding and atomic gliding dislocations through creep and kinkformation, instead of bond stretching, as discussed previously.
The predicted m, f, and T/Tm(0) dependence of xC and TC(x) and the trends of mechanical strengthand compressibility/extensibility coincide exceedingly well with the cases as reported by Eskin et al.[180] on the grain size dependence of the tensile elongation (extensibility) of Al–Cu alloys in thequasimolten state [181]. The ductility increases exponentially to infinity with temperature up to Tm
that drops with solid size. On the other hand, the ductility increases generally with grain refinement.This is also frequently observed in cases such as alumina [163] and PbS [433] in the nanometer rangeat room temperature [525,526]. The compressibility of alumina and PbS solid increases, whereas theYoung’s modulus decreases as the solid size is decreased. The predicted trends also agree with exper-imental observations [90] of the temperature dependence of the yield stress of Mg nanosolids of a gi-ven size showing that the yield strength drops as the operating temperature is elevated [90].Temperature dependence of the tensile properties of ultrafine-grained ordered FeCo2V samples withgrain sizes of 100 nm, 150 nm, and 290 nm revealed extremely high yield strengths (up to 2.1 GPa)present at room temperature with appreciable ductility of 3–13%. The measured strengths declinedgradually as the testing temperature was increased to 400 �C, while ductility was generally enhanced,up to 22% [98]. At T > 0.7Tm, the mechanical strength decreases rapidly with increasing temperatureand with decreasing strain rate [2].
7.5. Correlation between elasticity and hardness
Theoretically, the analytical expressions for elasticity, stress and hardness, as described for exam-ple in Eqs. (38) and (47), should be identical in nature. The former represents the intrinsic propertychange without experimental artefacts being involved. However, the softening and slope transitionin the IHPR plastic deformation arises from the extrinsic competition between activation of and resis-tance to glide dislocations, which is absent in the elastic deformation in particular using the non-con-tact measurement such as SWA techniques.
Recent measurement of the size dependence of the hardness, shear stress and elastic modulus ofcopper nanoparticles, as show in Fig. 43a, confirmed this expectation. The shear stress and elasticmodulus of Cu reduce monotonically with the solid size but the hardness shows the strong IHPR.Therefore, the extrinsic factors become dominant in the plastic deformation of nanocrystals, whichtriggers the HPR and IHPR being actually a response to the detection. However, as compared in

1 2 3 4 50.5
1.0
1.5
2.0
2.5G
Pa
Log (D)
Stress/100
Hardness
Modulus
Gudiline
Guideline
Cu Grainsa
50 100 150 200 250 300 350 400 450
6
8
10
12
Depth / nm
Har
dnes
s / G
Pa
ε = 0%ε = 10%
b
5 6 7 8 9 10 11 12 13
160
170
180
190
200
210
220
230
Har
dn
ess/
GP
a
Elastic Modulus/GPa
cNi films
Fig. 43. (a) Comparison of the measured size dependence of elasticity, shear stress and hardness of Cu nanostructures [512],and the nanoindentation depth dependence of (b) hardness and the correlation between the hardness and elastic modulus of Nifilms [10], indicating the significance of extrinsic factors on the hardness measurement of nanocrystals but contribute little tofilms.
C.Q. Sun / Progress in Materials Science 54 (2009) 179–307 267
Fig. 43b and c, the hardness and Young’s modulus of Ni films are linearly interdependent. This obser-vation indicates that extrinsic factors dominating the IHPR of nanograins contribute little to the nan-oindentation test of film materials.
One may note that the Young’s modulus is defined for elastic deformation, while its inverse, or theextensibility/compressibility, covers both elastic and plastic types of deformation. However, either theelastic or the plastic process is related to the process of bond distortion, including bond unfolding,stretching, or breaking, that consumes energy (obtained by integrating the stress with respect tostrain) each process being a certain portion of the entire binding energy. No matter how complicatedthe actual process of bond deformation (with linear or nonlinear response) or recovery (reversible orirreversible) is, a specific process consumes a fixed portion of bond energy, and the exact portion forthe specific process does not come into play in the numerical expressions for the relative change.Therefore, the relation of Eq. (38) is valid for describing the intrinsic properties for any substance ofany scale of size and in any phase. However, for plastic deformation, the competition between dislo-cation activation and dislocation resistance becomes dominant, which presents a difference in theplastic deformation from the elastic response in terms of the IHPR features. It is important to note that,in a nanoindentation test, errors may arise because of the shapes and sizes of the tips. The stress–strain profiles of a nanosolid are not symmetrical when comparing the situation under tension to thatunder compression [527]. The flow stress is dependent of strain rate, loading mode and duration, andmaterial compactness, as well as size distribution. These factors may influence measured data that areseen to be quite scattered and vary from source to source. As the Young’s modulus and mechanicalstrength are quantities of intensity, they are volume less. Therefore, it might not be appropriate to
268 C.Q. Sun / Progress in Materials Science 54 (2009) 179–307
think about the stress or elasticity of a certain atom, but, instead, the stress and elasticity at a specificatomic site.
7.6. Summary
An analytical expression has been derived for the extensibility and plastic yield strength of a solidover the whole range of sizes based on the T-BOLS correlation and LBA mechanism, which has enabledus to reproduce the observed HPR and IHPR effect and identify the factors dominating the strongestsizes. Matching predictions to observations reveals the following:
(i) The IHPR originates from the intrinsic competition between the energy density gain in the sur-face skin and the cohesive-energy remnant of the under-coordinated surface atoms and theextrinsic competition between activation and prohibition of atomic dislocations. The activationenergy is proportional to the atomic cohesive energy that drops with solid size whereas the pro-hibition of atomic dislocation arises from dislocation accumulation and strain gradient workhardening which increases with the indentation depth. As the solid size decreases, a transitionfrom dominance of energy density gain to dominance of remaining cohesive-energy occurs atthe IHPR critical size because of the increased proportion of the under-coordinated atoms. Dur-ing the transition, contributions from both processes are competitive.
(ii) The IHPR critical size is universally predictable, which can be calibrated with a few measureddatum points for a specific system. The critical size is dominated intrinsically by the bond nat-ure, the T/Tm ratio, and extrinsically by experimental conditions or other factors such as size dis-tribution and impurities that are represented by the factor f.
(iii) The IHPR at larger solid size converges to the normal HPR that holds its conventional meaning ofthe accumulation of atomic dislocations that resist further atomic displacements in plasticdeformation. The slope in the traditional HPR is proportional to exp(Tm/T), which addressesthe relationship between the hardness and the activation energy for atomic dislocations. TheK�0:5
j in the conventional HPR should represent the accumulation of atomic dislocations thatresists further dislocations.
(iv) This understanding of the process provides an additional explanation for the high ductility of ametallic nanosolid as the critical temperature for the solid-to-quasimolten transition is muchlower than the bulk melting point and the self-heating during detection should raise the actualtemperature of the small specimen.
8. Atomic vacancy, nanocavity, and metallic foams
� Atomic vacancies, point defects, and nanometer sized pores cause the unusual properties of the speci-mens – they are of light weight, high strength yet thermally or chemically less stable.
� A broken bond not only serves as a center initiating mechanical failure but also provides a site pinningdislocations.� Bonds between the under-coordinated atoms in the inner surfaces of nanopores perform the same as
those in a bulk surface or the outer surface of a nanosolid.
8.1. Observations
8.1.1. Atomic vacancies and point defectsIt is expected that atomic vacancies or point defects reduce the number of chemical bonds of
nearby atoms and hence the strength of the entire body of a material. However, the hardness oftransition metal carbides and nitrides does not follow this simple picture of coordination counting.Vacancies or point defects not only provide sites initiating structure failure [528] but also act as pin-ning centers inhibiting the motion of dislocations and hence enhancing the mechanical strength ofthe material [129]. It has been found that the hardness of iron aluminides (FeAlN) is proportional tothe square root of vacancy concentration [529]. About 4% nitrogen atomic vacancies are found to

0 10 20 30 40 501400
1600
1800
2000
2200
2400
2600
8.8
8.9
9.0
9.1
9.2
9.3
9.4
Den
sity
/g c
m-3
Har
dn
ess
/MP
a
C vacancy concentration (%)
a
0 5 10 15 20 25
5
10
15
Str
eng
h (
Gp
a)
Number of missing atoms
Experimet
Theory (QFM)
b
Fig. 44. Mechanical hardening by (a) carbon vacancy density in (W0.5Al0.5)xC1�x compound [531] and (b) point defect in WS2
nanotubes [532]. The squares represent the analysis of the experimental results, and the circles represent the calculatedstrength according to the QFM model.
C.Q. Sun / Progress in Materials Science 54 (2009) 179–307 269
stabilize the rocksalt structure of MnN substantially [530]. Measurement has revealed that with theincrease of C vacancies in the WAlC compounds, the mass density decreases whereas the hardnessincreases monotonically up to a maximum at 35% of C vacancies, as shown in Fig. 44a [531]. Frac-ture measurement and modeling analysis indicated that a small number of atomic defects modulatethe strength of the WS2 nanotubes [532]. A study [106] using atomistic simulations and analyticalcontinuum theory to describe the influence of the vacancy concentration related defects on theYoung’s modulus and tensile strength revealed the enormous influence of an atomic defect on thestrength of the nanotubes. The excessive voids presented in the wall of the unreconstructed nano-tubes serve as centers initiating structure failure in plastic deformation. Fig. 44b shows the strengthversus the number of missing atoms in the critical defect according to the quantized fracturemechanics (QFM) approximation [533].
An ab initio calculation of shear elastic stiffness and electronic structures suggested that the va-cancy produces entirely different effects on the mechanical strength of group IVb nitrides and groupVb carbides. It is suggested that the occupation of shear-unstable metallic d–d bonding states changesessentially in an opposite way for the carbides and nitrides in the presence of vacancies, resulting indifferent responses to shear stress [534]. Experimentally, the hardness and the elastic modulus ofgroup IVb nitrides such as TiNx, ZrNx, and HfNx decrease as the concentration of the non-metal vacancyincreases [535,536]. In contrast, the hardness of the Vb carbides such as NbCx and TaCx increases con-sistently and reproducibly as the vacancy concentration increases up to a modest value and reaches amaximum at a vacancy concentration of about 12% [537]. It has long been puzzling how atomic vacan-cies affect the hardness of these two classes of compounds in such distinctive ways despite similarchemical bonding of these compounds at stoichiometry.
DFT calculations [538] also suggested that the boron doping of ScRh3Bx could enhance the cohesiveenergy monotonically due to the strong covalent bonding between B-2p and Rh-4d states. However, atx = 0.5, a configuration is achieved in which each boron is surrounded by vacancies at the cube centers.This configuration reduces the strain in the structure and shortens the Rh–B bonds, leading to a max-imum in the bulk modulus. The density of states at the Fermi energy is also minimum for x = 0.5 whichadds further stability to the structure.
8.1.2. NanocavityFormation of nanometer-sized cavities could also enhance the mechanical properties of solid mate-
rials to a certain extent [538–540]. Si atomic vacancy could trap oxygen atom to reduce its diffusion[541]. Experimental works [542] revealed that the He implantation induces �1 nm sized bubbles thatenhance the hardness of Ni layers by approximately seven times that of untreated Ni, up to8.3 ± 0.6 GPa, indicating that the bubbles provide centers for pinning dislocation motion strongly.Amorphous carbon (a-C) films have an uniquely intrinsic stress (�12 GPa) which is almost one order

270 C.Q. Sun / Progress in Materials Science 54 (2009) 179–307
in magnitude higher than those found in other amorphous materials such as a-Si, a-Ge, or metals(<1 GPa) [543]. The internal stress of the a-C films can be modulated by changing the sizes of nanop-ores that are produced by the bombardment of noble gases (Ar, Kr, and Xe) during formation[544,545].
Using extended near-edge XAFS and XPS, Lacerda et al. [544] investigated the effect of the trappingof noble gases in the a-C matrix on the internal stress of the a-C films and the energy states of thetrapped gases. They found that the internal stress could be raised from 1 GPa to 11 GPa by controllingthe sizes of the pores within which noble gases are trapped. Meanwhile, they found an approximate�1 eV lowering (smaller in magnitude) of the core level (Kr-3p, 3d, Ne-1s and Ar-2p), binding energyof the entrapped gases (Fig. 45) associated with 0.03–0.05 nm expansion of the atomic distance of thenoble gases trapped. The measured core-level shift is of the same order as those measured for noblegases implanted in Ge [546], Al [547], and Cu, Ag, and Au [548,549] and Xe implanted in Pd hosts[550]. The interatomic separation of Ar (Xe) increases from 0.24 (0.29) nm to 0.29 (0.32) nm whenthe stress of the host a-C is increased from 1 GPa to 11 GPa [551]. Examination [542] of the depen-dence of yield strength on He concentration, bubble size, and bubble density suggests that the bubblespin dislocation motion as strongly as the hard second-phase precipitates do.
The bubble induced internal stress has the similar effect of applying mechanical stress to the spec-imen. Compressing the organic layers in organic light emitting diode (OLED) has been found to be aneffective process for improving the performance of organic electroluminescent devices [552]. This pro-cess involves applying physical pressure to the organic layers of the device. The OLED fabricated usingthis method shows a notable increase in luminance intensity and current efficiency when comparedwith compression-free device and the current efficiency has been almost doubled. Comparatively,an external hydrostatic pressure around 11 GPa could suppress the interplanar distance of microcrys-talline graphite by �15% [553], gathering the core/valence electrons of carbon atoms closer together.The resistivity of a-C films decreases when the external hydrostatic pressure is increased [554]. Theseresults are in agreement with the recent work of Umemoto et al. [555] who proposed a dense, metallic,and rigid form of graphitic carbon with similar characteristics. The effect of hydrostatic pressure isvery much the same as the pore-induced internal stress using noble gas sputtering and implanting.
Fig. 45. Implanted noble-gas binding energy shifts relative to the Fermi level as a function of the compressive stress of a-C films[557], evidencing the weakening atomic interaction of the entrapped gases.

C.Q. Sun / Progress in Materials Science 54 (2009) 179–307 271
The binding energy weakening and atomic distance expansion of the entrapped gases indicateclearly that the gas-entrapped pores expand in size and the interfacial C–C bonds contract becauseof the bond order loss of the interfacial C atoms, which contribute to the extraordinary mechanicalstrength of the entire a-C films. The pore-induced excessive stress is expected to play the same roleas the external hydrostatic pressure causing densification, metallization, and strengthening of thegraphite by lattice compression. It has been found that the surface interstitial nanovoids of 2–3 nmsize induced by He ion implantation in crystalline Si could remarkably reduce diffusion of B atoms,whereas these nanovoids do not hinder the B electrical activation [556]. This finding may evidencethe raised activation energy, or barrier, for atomic diffusion and the densified charge for the higherconductivity due to the local strain in the negatively curved skins of the voids.
Ouyang et al. [558] have given an alternative explanation of the nanocavity hardening from theperspective of surface energy. They suggested that the dangling bonds at the negatively curved surfacecould provide a large driving force for pore instabilities such as pore size shrinkage instead of expan-sion. The surface free energy in the inner skin of nanocavities is suggested to be composed of twoparts: one is chemical and the other is structural, i.e., c ¼ cchem þ cstru being similar to the core-shellnanostructures [559]. The chemical part of the surface energy originates from the dangling bond whilethe structural part is from elastic strain in the inner skin of one atomic layer thick of the nanocavity.Results showed that the surface free energy increases when the pore size is decreased. Importantly,the larger lattice deformation in the inner skin of nanocavity during shrinkage could raise the intrinsicmodulus.
8.1.3. Nanoporous foamsMetal foams with excessive amount of discretely distributed nanocavities have formed a relatively
new class of materials, which offer a variety of applications in fields such as lightweight constructionor crash energy management, as well as sensing, catalysis, and other applications which benefit fromtheir characteristic high surface area per unit volume [560,561]. Despite the versatility of geometricalforms of the pores [562–564], the significance of the nanoporous foams is the large proportion of un-der-coordinated atoms. Several methods have been developed for processing metal foams. The foamscan be fabricated by dissolution in acid, anode oxidation in liquid or simple using powder-metallurgysintering with or without place-holder or scaffolds [561–563]. For example, nanoporous gold is madeby the dissolution in acid of silver atoms from an Au/Ag alloy; during dissolution, gold atoms in thelattice of the parent phase dynamically rearrange to form a three-dimensional crystalline random por-ous structure with uniform ligament size [565]. Application of anodic potential to the alloy in thisdealloying process enhances the silver dissolution rate relative to the gold diffusion rate, leading tosmaller ligament sizes. The foams can be envisioned as a three-dimensional network of ultrahigh-strength nanowires or spherical holes in a matrix, thus bringing together two seemingly conflictingproperties: high strength and high porosity yet lighter. The foamed materials are expected to be stifferat low temperatures and tougher at raised temperatures compared with bulk crystals.
Fig. 46 shows the typical open cell structure and the ligament size of Au nanofoams and the sizeand surface effect on the stiffness of Au foams of �30% relative density samples [566]. Measurementsrevealed that foams of the smaller ligament sizes are stronger and that the surface is even stronger,agreeing with previously discussed surface mechanics and indentation-depth features of the contin-uum thin films. A dramatic rise in the effective Young’s modulus of nanoporous Au has also been de-tected with decreasing ligament size, especially below 10 nm [567].
Characterization [568] of the size-dependent mechanical properties of nanoporous Au using a com-bination of nanoindentation, column pillar micro-compression, and MD simulations suggested thatnanoporous gold could be as strong as bulk Au, and that the ligaments in nanoporous gold approachthe theoretical yield strength of bulk gold, or even harder [566]. At a relative density of 42%, porous Aumanifests a sponge like morphology of interconnecting ligaments on a length scale of similar to100 nm. The material is polycrystalline with grain sizes of 10–60 nm. Microstructural characterizationof the residual indentation reveals a localized densification via ductile (plastic) deformation undercompressive stress. A mean hardness of 145 MPa and a Young’s modulus of 11.1 GPa has been derivedfrom the analysis of the load-displacement curves. The hardness of the investigated nanoporous Auhas a value some 10 times higher than the hardness predicted by scaling laws of open-cell foams

Fig. 46. (a) The open cell structure of Au nanofoams and (b) the size and surface effect on the hardness in the nanoindentationload-depth profiles for 30% relative density samples, given distinct ligament sizes in panel (b): (a) 60 nm; (b) 160 nm; and (c)480 nm [566].
272 C.Q. Sun / Progress in Materials Science 54 (2009) 179–307
[569]. The compacted nanocrystalline Au ligaments exhibit an average grain size of <50 nm and hard-ness values ranging from 1.4 GPa to 2.0 GPa, which were up to 4.5 times higher than the hardness val-ues obtained from polycrystalline Au [570]. A decrease in ligament size resulted in an increase in theyield stress, and the yield stress of the nanometer-sized Au ligament was much higher than that ofbulk polycrystalline gold. It is suggested that the size and surface effects, such as a reduction in thenumber of defects in grains, are important to the strengthening of nanoporous Au [571]. Using scalinglaws for foams, the yield strength of the 15 nm diameter ligaments is estimated to be 1.5 GPa, close tothe theoretical strength of Au. This value agrees well with extrapolations of the HPR yield strength atsubmicron scales [572].
Similarly, the strength of Al foams can be increased by 60–75% upon thermal treatment and agehardening after foaming [573]. It was also found that the hardness of the Al foam is twice as highas pure Al, and the hardness decreases with increasing temperature [574]. Fig. 47a shows the porositydependence of the stress–strain curves of the aluminum foams with a relative density of 14.6–48.5%,where the pore size is between 1.6 mm and 2.0 mm. If the foam density was high, then the constant-stress plateau was short. On the other hand, foam of lower density exhibited a longer, flatter plateaubecause the structure affords more opportunity for cell walls to collapse and deform [575]. Foamswith smaller pore sizes should follow the same trend of hardness change of smaller ligands.
30 40 50 60 70 800
50
100
150
200
250
-20
-15
-10
-5
0
5
10
15
20
Modulus before annealing Modulus after annealing
Ind
enta
tion
mo
du
lus
(GP
a)
Pore size (nm)Strain
Com
pres
sive
Str
ess
[MP
a]
Har
dn
ess/
Str
ess
(GP
a)
Hardness before annealing Hardness after annealing Residual Stress
1
123456789101112 14.6%
15.8%24.4%
28.0%31.9%32.2%37.9%12.6%44.5%46.6%46.7%48.5%
23
4
5 68
7
109
1211
100
90
80
70
60
50
40
30
20
10
00.0 0.1 0.2 0.3 0.4 0.5 0.6 0.7 0.8
ba
Fig. 47. (a) Compressive stress–strain curves of the aluminum foams with different relative density (pore size: 1.60–2.00 mm)and (b) pore size dependence of anodic aluminum oxide foam modulus, hardness, and residual stress that follow the same trendof change [576], indicating the common origin of these seemingly different quantities from the perspective of energy density,according to the BOLS premise.

C.Q. Sun / Progress in Materials Science 54 (2009) 179–307 273
However, nano-indentation measurement [576] revealed that the mechanical properties, suchas the modulus, hardness, of anodic aluminum oxide structures decrease monotonically as the sizeof the hole is increased from 30 nm to 80 nm, see Fig. 47b. Although the elastic modulus, hardness,and viscosity are different mechanical properties, it is noteworthy that a similar behavior was ob-served for all these properties, as observed from polymers [577]. The same trend of change of theseemingly different quantities indicates clearly their common origin and interdependence from theperspective of energy density, according to the current BOLS correlation premise.
On the other hand, the porous structure is thermally less stable. MD simulation [578] of thesize effect on melting in solids containing nanovoids revealed four typical stages in void meltingthat are different from the melting of bulk materials and nanoparticles. Melting in each of thestages is governed by the interplay among different thermodynamic mechanisms arising fromthe changes in the interfacial free energies, the curvature of the interface, and the elastic energyinduced by the density change at melting. As a result, the local melting temperatures show astrong dependence on the void size, which is the cause of the observed complex hierarchical melt-ing sequence. Despite these exciting prospects, the understanding of the mechanical and thermalbehavior of metal foams at the nanometer-scaled is still very much in its infancy [567,579].
8.1.4. Theoretical approachesThere have been several models regarding the cavity hardening of nanovoided systems. Quan-
tize fracture mechanics (QFM) in terms of the classical continuum medium mechanics and theGibbs free energy considers that a discrete number of defects arising from a few missing atomsin a nanostructure could contribute to the mechanical strength. Another theoretical approach con-siders the electronic structure around the Fermi energy [580]. Theoretical calculations suggestedthat the presence of two unsaturated electronic bands near the Fermi level responding oppositelyto shear stress enhances the hardness of the voided systems behaving in an unusual way as thenumber of electrons in a unit cell changes. This finding agrees with the BOLS premise indicatingthat the density of states will shift to energy lower away from the EF because of the broken-bond-induced quantum trapping nearby. The deepened potential well of trapping provides alsoan atomistic understanding of the effect of defect pinning that inhibits atomic dislocation motion.
It has been suggested that the macroscopic stresses are composed of two parts [581], represent-ing dynamic and quasi-static components. The dynamic part controls the movement of the dynamicyield surface in stress space, while the quasi-static part determines the shape of the dynamic yieldsurface. The matrix material is idealized as a rigid-perfect plastic. Two major effects of point defectsare proposed to lead to significant anomalies in mechanical properties: spontaneous stress and stiff-ness. Amongst the two, one is the direct effects caused by non-interacting point defects, and theother is the collective effects induced by interacting point defects [582]. The first group includes:(i) changes in the linear dimensions of a solid in response to a change in defect concentrationand, (ii) stress induced by an inhomogeneous distribution of point defects, a so-called chemicalstress. The second group includes: (i) defect order–disorder transitions accompanied by self-strainand, (ii) deviations from linear elastic behavior because of the dissociation/association of point de-fects. All of the above effects become important if the concentration of point defects is high (above1021 cm�3).
For metallic foams, there are also a number of models. According to the standard empirical modelof foam plasticity originated by Gibson and Ashby [583], the relationship between the yield strength(r) and the relative density (qf/qb) of a foam material follows the scaling laws
rf ¼ rb �ðqf=qbÞ
3=2 ðGibson & AshbyÞCbðqf=qbÞ
3=2 ðHodge etal:Þ
(ð51Þ
where the subscripts f and b denote foam and bulk properties, respectively. The qf = (Vtotal � Vvoid)/Vtotal. Substituting the in the HPR for the in the modified scaling relation with a given porosity, Hodgeet al. [570] derived information of size dependence of ligament strength in Au foams, which follow theHPR relation with Cb = 0.3 as a factor of correction as shown in Fig. 51b.

274 C.Q. Sun / Progress in Materials Science 54 (2009) 179–307
The porosity-depressed Young’s modulus of Pd and Cu specimens [514] was ever expressed inmany mechanical simulations [584–586]:
Y ¼ Y0 �1� 1:9pþ 0:9p2 ðWachtman & MackenzieÞð1� p=p0Þ
n ðRiceÞ
(ð52Þ
with p the porosity being defined as p = Vvoid/Vtotal. The density relates to the porosity as qp = 1�p. Thedecrease in Young’s modulus and flow stress with density at larger pore sizes is attributed to the exist-ing pores that provide sites for initiating failures. Rice [586] proposed a normalized porosity depen-dence of the Young’s modulus in the form, where p0 is the value of p for which the porositydependent properties go to zero. The index n and p0 are adjustable parameters. A linear fit withn = 1 to the measured data of various pores has been realized using this model. Fig. 48 comparesthe model predictions of density dependence of mechanical strength of metallic foams.
The theory of linear elasticity has been successfully used to describe the deformation behavior ofmultiphase materials of larger pore sizes. It has been demonstrated that the strength of foam mate-rials always decreases with increasing porosity. The mechanical properties of foams are related tothe porosity or the relative density of the material as the dominating parameter and neither the ef-fect of sizes of pores nor the effect of bond nature of the matrix are involved. In fact, nano-mechan-ical measurements of nanoporous foams on a submicron scale [74,587] revealed close resemblanceof the nanosized ligaments in foams showing a dramatic increase in strength with decreasing sam-ple size [569,572]. Therefore, the effects of pore size, bond nature, and temperature must be consid-ered in practice because the high proportion of the under-coordinated atoms become predominantin controlling the physical behavior of nanoporous foams.
Because the mechanical behavior of the surface is different from the bulk interior of the material, itwould be an effective approach to consider the effective elastic constants of nanocomposites in termsof a three-phase structure, i.e., the bulk matrix, the voids, and the interfacial skins [588]. The effect ofsurface energy and surface stress has been considered in analyzing the deformation of microscalestructures by many researchers. For examples, Sader [589] analyzed the effects of homogeneous sur-face stress on the deflection of cantilever plates used in AFM. Cammarata and Sieradzki [590] evalu-ated the effect of surface stress on the elastic modulus of thin films and superlattices. Yang and Li[591] discussed the effect of chemical stress on the bending of a single-layer and bilayer microme-chanical beam. Sharma et al. [592] investigated the effect of surface energy and stress on the size-dependent elastic state of embedded inhomogeneities and found that surface elasticity can signifi-cantly alter the stress state of materials at the length scale of nanometers. They suggested that thedependence of the stress state on the size of the embedded inhomogeneities could be significant indetermining the effective elastic modulus of composites. Yang [593] investigated the effect of surfaceenergy on the effective elastic properties for elastic composite materials containing spherical nanocav-ities at dilute concentration and proposed solutions of the effective shear modulus and bulk modulus,which turned out to be a function of the surface energy and the size of the nanocavity. It is found that
0.0 0.2 0.4 0.6 0.8 1.0
0.0
0.2
0.4
0.6
0.8
1.0
Rel
ativ
e st
reng
th
Rice, 2005 Wachtman and MacKenzie, 1963 Gibson and Ashby, 1997Hodge et al, 2005 (HPR)
Relative Porosity
Fig. 48. Model comparison of the density dependence of mechanical strength of metallic foams.

C.Q. Sun / Progress in Materials Science 54 (2009) 179–307 275
the dependence of the elastic response on size of the nanocavity in composite materials differs fromthe classic results obtained in the linear elasticity theory, suggesting the importance of the surface en-ergy of the nanocavity in the deformation of nanometer-scaled structures. In order to apply the scalingrelation to nanoporous metal foams, the yield strength should be considered as a variable of the lig-ament or void size. An atomistic analysis of the effective elastic modulus of the porous systems fromthe perspective of bond breaking and the associated nearby strain and trapping is necessary.
8.2. BOLS consideration: defects induced strain and trapping
Strikingly, atomic vacancies, point defects, nanocavities, and nanoporous foams perform very muchthe same to nanostructures in the enhancement of stiffness (elastic strength) and toughness (plasticstrength) and in the depression of thermal stability because of the large proportion of the under-coor-dinated atoms. Nanovoids increase the proportion of under-coordinated atoms at the negativelycurved pore surfaces whereas the nanodots or rods provide such under-coordinated atoms in the pos-itively curved particle surfaces. These two kinds of nanostructures differ one from another mainly inthe exact proportion of the lower-coordinated atoms and the slight difference in the coordinationenvironment, given the same surface chemical finishing conditions.
Naturally, the T-BOLS correlation applies directly to the porous structures and allows us to predictthe elasticity, thermal stability, and the yield strength in plastic deformation by repeating the practicein previous sections with the derived surface-to-volume ratio, rij(n,Lj,Kj), which is represented by Eq.(12) in Section 2.3.2, and with the constraint of
Table 1Functioof testi
Q ½DQðK
MeltingYoung’ExtensiYield st
2ðLj þ 1Þðnþ 1=2Þ 6 Kj � 2 ð53Þ
with n being the number of spherical voids of Lj radius aligned along the radius of a spherical dot of Kj
size, for instance. With the known expressions for the size, bond nature, and temperature dependenceof the melting point, elasticity, extensibility, and the yield strength in the IHPR premise, as given inTable 11, we are ready to predict the performance of a porous system.
8.2.1. Critical hollow-sphere size: total energy storageAssuming a hollow sphere of K exterior radius with a shell of C1L + C1K thick, or three contracted
atomic layers, we have the total energy stored in this shell at 0 K in comparison to that stored in anideal solid sphere of the same size without surface effect being considered
DEshell
Esphere¼
C�ðmþ3Þ1L
R K�C1KK�ðC1LþC1K Þ
4pR2dRþ C�ðmþ3Þ1K
R KK�C1K
4pR2dRR K0 4pR2dR
� 1
¼ C�ðmþ3Þ1L ½ð1� C1K=KÞ3 � ð1� ðC1L þ C1KÞ=KÞ3� þ C�ðmþ3Þ
1K ½1� ð1� C1K=KÞ3� � 1 ð54Þ
Calculations were conducted based on the given Ci and the curvature dependent zi values, in Sec-tion 2. From the results shown in Fig. 49, we can find the critical size below which the energy stored inthe shell of the hollow sphere is greater than that stored in the ideal bulk of the same volume withoutconsidering the surface and temperature effects. The estimation indicates that the critical size is bondnature dependent. The critical size is K = 12, 16, and 20 for m = 1, 3, and 5, respectively. Similarly, forhollow tubes, the corresponding critical K values are estimated to be 7, 10, and 14. For the singlewalled hollow structure, the integration crosses only the diameter of the wall atom.
1nal dependence of mechanical and thermal properties of porous structures on the atomic CN, bond nature, and temperatureng
jÞ=Qð1Þ ¼ Dqj ¼P
i63ðDqi=qÞ� qi(z, m, d(T), Eb(T)) Ref
point (Tmi) / zi � Ei(0) Section 4.3.2s modulus (Yi) /Ei(T) � [di(T)]�3 Section 6.2.1bility (bi) /di(T) � [gi(Tmi � T)]�1 Section 6.2.1rength (Pi, IHPR) / f1þ f � K�0:5
j � exp½TmðKjÞ=TÞ�g � ½diðTÞ��3 � ðTmi � TÞ Section 7.3

0 4 8 12 16 20 24 28-1
0
1
2
3
4
5
m = 3
m = 5
m = 1
Rel
ativ
e en
erg
y st
ora
ge
Kj
Fig. 49. Bond nature dependence of the critical size below which the total energy stored in the shell of the hollow sphere ofthree atomic layers is greater than the energy stored in an ideal bulk of the same size.
276 C.Q. Sun / Progress in Materials Science 54 (2009) 179–307
It is stressed that the elasticity of the shell is always higher than the bulk interior because the elas-ticity is proportional to the energy density though the total energy stored in the shell may be lowerthan the entire sphere beyond the critical size. For plastic deformation, the hollow sphere could betougher than the ideal bulk because of the long distance effect in the indentation measurement. Onthe other hand, the thermal stability of the hollow sphere is always lower than the solid sphere.
8.2.2. Elasticity and thermal stabilityWith the derived rij(n,Lj,Kj) relation and the given expressions for the q(zi, di(t), Ei(t)), one can read-
ily predict the size, cavity density, and temperature dependence of the melting point, elasticity, andthe flow stress of a system with large proportion of under-coordinated atoms without involving hyp-othetic parameters.
Calculations of the elasticity and melting point were conducted by using a fixed value of sphere ra-dius Kj = 600 with different pore sizes and pore numbers. Correlation between the pore size and thepore number follows the constraint given by Eq. (53) with a certain Kj value. Fig. 50 shows the pre-dicted porosity dependence of Tm and Young’s modulus of Au foams (m = 1) with different pore sizes.It can be observed that
(i) The Tm drops when the porosity is increased; at the same porosity, the specimen with smallerpore size is less stable than the ones with larger pores.
(ii) The Young’s modulus increases with the porosity and the Young’s modulus of the specimenwith smaller pores increases faster.
0.00 0.05 0.10 0.15 0.20 0.25 0.30
-0.12
-0.09
-0.06
-0.03
0.00
Tm
dro
p
Porosity
Lj = 2
Lj = 6
Lj = 10
Kj = 600
a
0.00 0.05 0.10 0.15 0.20 0.25 0.300.00
0.02
0.04
0.06
0.08
0.10
Y e
nh
ance
men
t
Porosity
Lj = 2
Lj = 6
Lj = 10
Kj = 600
b
Fig. 50. Prediction of the porosity dependence of (a) Tm and Y of porous Au foams with different pore sizes of a Kj = 600specimen.

C.Q. Sun / Progress in Materials Science 54 (2009) 179–307 277
The predicted trends of thermal stability and strength agree well with the experiment observationsfor the size-dependent mechanical properties of nanoporous Au characterized by nanoindentation andcolumn microcompression [570]. It is important to note that there exists porosity limit for the specimenswith small pore sizes. This discussion applies to the small pores but the conclusion may be subject to fur-ther verification for specimen of larger pores that are expected to drop in strength with pore size depend-ing on the surface-to-volume ratio. For Tm consideration, the surface-to-volume ratio should not includethe volume of pores as given in Eq. (12); for Y consideration, the pore volume contributes to Eq. (12).Unfortunately, experimental data on pore size and density dependence Tm and Y are to be collected.
8.2.3. Plasticity and IHPRIn dealing with the plastic deformation using IHPR, we may use the following relation to find the
effective volume by excluding the pore volume in the specimen:
Fig. 51(b) Comligamen
4p3
K 03j ¼4p3
K3j �
4p3ðnþ 1=2Þ3L3
j
� �X ¼ K 0�0:5
j
ð55Þ
Fig. 51a shows the predicted IHPR as a function of Lj for 10 < Kj < 600 specimens. Compared with thesituation of single nanoparticle, the strongest size is significantly reduced for the foams. Fig. 51b com-pares the predicted IHPR of Au with experimental results. The ligament size xðK�1=2
j ) is derived fromAu foams with the modified scaling relation of Eq. (51). IHPR 2 and IHPR 1 are the IHPR with and withoutinvolving the intrinsic competition of energy density and atomic cohesive energy as discussed for thenanoparticles. The extremely high strength of ligaments smaller than 5 nm deviates from the expectedIHPR is beyond the expectation of IHPR. One possibility for the extremely high strength of 5 nm ligands isthe surface chemical conditions of the ligands because the higher chemical reactivity of small particles. Acombination of the present IHPR with the scaling relation of Eq. (51) may describe the observed trends atlarger porosities, and further investigation is in progress.
According to the currently developed understanding, the magnitude of Tm � T, or the ratio T/Tm,plays a key role in determining the relative strength. The Tm of Al (933.5 K) is lower than that of Au(1337 K), which explains why the relative strength of Al foam to Al bulk is lower than that of Au.
Unfortunately, no immediate mechanism is apparent to explain the difference in vacancy-inducedhardening between the IVb-nitride and the Vb-carbide compound. The excessive electron lone pair of anitrogen atom and the shorter ionic radius of nitrogen (0.17 nm) compared to that of carbon (0.26 nm)[1] could be possible reasons for this difference. Increasing the number of N vacancies or reducing the num-ber of the shorter ionic bonds of nitrides may lower the strength; this is open to further investigation.
0.0 0.1 0.2 0.30
1
2
3
4
5
Lj = 2, n = 5
Lj = 6, n = 5
Lj = 10, n = 5
P(x
)/P
(0)
x (K' -1/2
j) x (K -1/2
j)
Lj = 2, n = 0
Lj = 6
Lj = 10
10 < Kj< 600a
0.0 0.1 0.2 0.3 0.40
5
10
15
20
Data 1 Data 2 HPR IHPR-2 IHPR 1 Data 3 Data 4
P(x
)/P
(0)
b
. Prediction of (a) the IHPR for nanoporous Au sphere with 10 < Kj < 600 and different pore sizes Lj and pore numbers.parison of the predicted IHPR of Au with measurement, Data 1 [568], Data 2 [566], Data 3 [569], and Data 4 [572]. Thet size xðK�1=2
j ) is derived from Au foams with the modified scaling relation of Ashby.

278 C.Q. Sun / Progress in Materials Science 54 (2009) 179–307
8.3. Summary
The under-coordinated atoms in the negatively curved surfaces of atomic vacancies, point defects,nanocavities, and the synctatic foams are responsible for the strain hardening and thermal stabilitydepression of the negatively curved systems, being the same by nature to those atoms at the positivelycurved systems such as nanorods, nanograins and flat surfaces. Numerically, the negatively curvedsystems differ from the zero or the positively curved systems only by the fraction of the under-coor-dinated atoms and the coordination environment that determines the extent of the BOLS inducedproperty change. Therefore, all derivatives and conclusions for the flat surface and the positivelycurved surface apply to the negatively curved ones without needing any modifications. It is empha-sized that the nanopores play dual roles in mechanical strength. The shorter and stronger bonds nearthe pores act as pinning centers inhibiting motion of atomic dislocations because of the strain and thetrapping; the pores provide sites for initiating structure failure under plastic deformation.
9. Compounds and nanocomposites
� The reinforcement of a compacted interface in multilayers originates from the excessive energy due tobond contraction and bond nature alteration.� A dissociated interface is identical to a free surface with a potential barrier followed by a potential trap in
the skin.� Mechanical reinforcement of a nanocomposite may come from the filler, interface, or the nearly-free sur-
face surrounding the filler, depending on the intermixing conditions and the strength of the filler.
9.1. Observations
9.1.1. Multilayers and nanocompositesThe significance of an interface between two compositional specimens is the interface mixing, as
shown in Fig. 52. At the boundaries between different chemical compositions, there diffused one toanother. The interface mixing sometimes cause detrimental effect to the MOS device with dielectric
Fig. 52. (a) High resolution TEM image of the stack showing the (1) Si, (2) SiO2, (3) HfO2, (4) TiN, and (5) poly-Si and (b) thecorresponding EELS elemental profiles across the stack normalized to the same maximum height interface mixing [610].

C.Q. Sun / Progress in Materials Science 54 (2009) 179–307 279
failure [594,595] as discussed later in this section that the excessive energy in the diffused interfacewill enlarge the band gap and hence reduce the dielectric constant locally. The dielectric constant var-ies with the square inverse of band gap width [596].
The multilayered structures such as nc-TiN/a-Si3N4, nc-TiN/a-Si3N4/ and nc-TiSi2, nc-(Ti1�xAlx)N/a-Si3N4, nc-TiN/TiB2, nc-TiN/BN [597,598], TiN/CrN [599], CrN/AlN, TiN/AlN [600], Cu/Au [601], and Nilayered structures [602] manifest enhanced mechanical strength and thermal stability, because ofthe interfacial bond strengthening. The nanocrystalline or amorphous composites show hardnessapproaching that of diamond [598], yet oxygen interface impurities cause a significant reduction ofthe interface strength [603]. Similarly, high density twins in pure Cu [604–606], Au [607], and Al[608], for example, leads to enhanced mechanical properties because of the pinning effect that pre-vents atoms from gliding dislocations. The presence of the grown-in twins in nanocrystalline-Al isfound to enhance plastic deformation via twin-migration in which partial dislocations, emitted atthe intersection of the twin boundary and the GB, travel through the entire grain. It has been foundthat generally the microhardness of multilayer nitride films increased with the number of layers, un-less the two layers are mutually dissolved. A microhardness of 78 GPa was achieved in a 180-layerTiN/NbN film [609].
Fig. 53 shows the microhardness of TiN/ZrN, TiN/NbN, and TiN/CrN multilayer films as a function ofthe layer number for films with a similar total thickness of nearly 2 nm. For TiN/NbN and TiN/ZrNfilms with �180 layers (with monolayer thickness of �10 nm) the hardness is about 70–80 GPa, i.e.approximately that of diamond. The different behavior of TiN/CrN is connected with (Ti, Cr)N solutionformation for more than 100 layers, which has been shown by XRD analysis. This observation indicatesthe significance of interlayer mixing to the mechanical strength that is proportional to the local energydensity, and therefore, the presence of interface strain and trapping.
Polymer nanocomposite foams filled with hard infillers have received increasingly attention inboth scientific and industrial sectors. The combination of functional nanoparticles such as SiC, CNT,clay, glass fibers, rubbers, and supercritical fluid foaming technology has a high potential to generatea new class of materials that are lightweight, high strength, and multifunctional [611–618]. For a 60%clay nanocomposite example, its elastic modulus increases up to 21.4 GPa, which is five times higherthan that of the agarose matrix [619]. A small amount of well-dispersed nanoparticles in the polymerdomain may serve as the nucleation sites to facilitate the bubble nucleation process. It is found thatunder compressive loadings, the continuous nanotube polymer composites with continuous nanotubecomposites can generate more than an order of magnitude improvement in the longitudinal modulus
Fig. 53. The layer number dependence of the microhardness of nitride films [609], indicates the significance of interlayermixing to the mechanical strength that is proportional to the local energy density, and therefore, the presence of interface strainand quantum trapping.

Fig. 54. (a) The stress–strain behavior of the composite and its constituent CNT and PDMS polymer and (b) the SEM image ofthe continuously reinforced carbon nanotubes-PDMS composite [620].
280 C.Q. Sun / Progress in Materials Science 54 (2009) 179–307
(up to 3300%) as well as damping capability (up to 2100%), see Fig. 54. It is also observed that com-posites with a random distribution of nanotubes of same length and similar filler fraction providethree times less effective reinforcement in composites [620]. Moreover, the nano-scaled particlesare suitable for micrometer-scaled reinforcement because of the large surface area for interface chem-ical bonding between the infiller and the matrix, thus achieving the macroscopic mechanicalenhancement.
Haraguchi et al. [621] used gel formation in an aqueous medium to create a composite of hydro-phobic poly (2-methoxyethyl acrylate) and hydrophilic hectorite clay. During the polymerization,the clay platelets are excluded from the polymer particles. Once dried, the clay shells comprised athree-dimensional network. A surprising feature of the composites was the ability to undergo hugeelongations when being subject to a stress. After an initial irreversible necking deformation, subse-quent applied large strains were shown to be reversible, with good shape recovery observed on re-lease. The remarkable mechanical properties of nanocomposite coatings, such as superhardness,high elastic modulus, high elastic recovery, excellent resistance against cracking, low wear rate, andhigh thermal stability, are due to their unique structures and deformation mechanisms at the nano-meter scale.
Theoretical progress in understanding the role of interface in the nanocomposite is still limited.Jiang et al. [622] investigated the cohesive interfaces between the CNT fillers and the polymer epoxythat are not well bonded with the van der Waals force in terms of the tensile cohesive strength and theinterface cohesive energy. The interaction is described by the area density of CNT and the volume den-sity of polymer as well as the parameters in the van der Waals force. For a CNT in an infinite polymer,the shear cohesive stress vanishes, and the tensile cohesive stress dominates depending only on theopening displacement. However, for a CNT in a finite polymer matrix, the tensile cohesive stress re-mains unchanged, but the shear cohesive stress depends on both opening and sliding displacements,i.e., the tension/shear coupling. Analytical expressions of the cohesive behavior have been used tostudy the CNT-reinforced composites to give an improved understanding of the interfacial effect.However, challenges remain regarding the roles of cavity surfaces, interfaces, or the strong infiller par-ticles in the reinforcement of nanocomposites.
A recent review by Lu et al. [623] provides the latest understanding of the origin of superhardnessin nanocomposite coatings with models based on analyses and simulations at different levels fromcontinuum to atomistic scales. Useful and timely overviews on the mechanical hardening of compositecoatings are also available in Refs. [105,624–627].
9.1.2. Compounds and alloysBlending different types of atoms in a solid could enhance the hardness of the solid preferably in an
amorphous state, as so called high entropy materials [628]. A number of models for the mechanical

C.Q. Sun / Progress in Materials Science 54 (2009) 179–307 281
strength have been developed based on the concept of ionicity to predict the hardness of several com-pounds [629–632]. It is anticipated that covalent bonds take the responsibility for increasing the hard-ness. The hardness, or the activation energy required for plastic gliding, was related to the band gap EG
which is proportional to the inverse bond length in a d�n fashion with the power index n varying from2.5 to 5.0. The typical relation proposed by Liu and Cohen [633] is
Fig. 55chargedissocia
B ¼ Nc=4� ð19:71� 2:20f iÞd�3:5 ðMbarÞ
Nc is the nearest atomic neighbors. The parameter fi accounts for the reduction in the bulk modulusB arising from increased charge transfer. The value of fi = 0, 1 and 2 for groups IV, III–V, and II–VI solidsin the periodic table. For a tetrahedral system, Nc = 4, otherwise, the Nc is an average of atomic CN. Fordiamond, fi = 0, d = 1.54 Å, and hence B = 4.35 Mbar, compared with an average experimental value of4.43 Mbar. This relationship was applied to BN and b-Si3N4 with corresponding prediction of B = 3.69and 2.68 Mbar. These predictions stimulated tremendous interest of experimental search for a super-hard carbon–nitride phase worldwide [634–636], as the diameter of an N atom is 0.140–0.148 nmbeing shorter than the C–C bond in a diamond. In spite of the difference in the power index, �2.5,�3.5, �5, and �(m + 3) in the current approach, all the expressions indicate that shorter and denserchemical bonds as well as smaller ionicity should favor hardness.
In addition to the high-entropy superhard materials, intermetallic superalloys, such as NiAl, FeAl,and TiAl systems, form another kind of important materials of tougher than ever the individual con-stituent elemental solid. In these alloys, raising the ductility is an important goal when metals areadded into the alloy [637]. The significant characteristics of the superalloys is the mixture of at leasttwo kinds of elements with different bulk melting points. The mixture as such may make the alloyboth ductile and thermally stable. Mechanism for the superalloy is of importance, and further explo-ration is under consideration.
9.2. BOLS considerations: interface effects
Compared with the surface strengthening of nanosolids and nanocavities, the mechanical strength-ening of twin GBs, multilayers, and blending composites arises from the strain and chemical effect.The coordination environment and the alteration of bond nature of the interatomic bonding uponthe compound or alloy formation should take the responsibility. The bond contracts at the interfacebecause of the bond order (length and angle) distortion that also stores energy locally. Therefore, bondcontraction and bond nature alteration occurs at the interface, generating local strain and energy trap-ping, which is suggested here to be mechanism for the enhanced mechanical strength of these kinds ofmaterials. At a given temperature, the local energy density dictates the mechanical strength in themixed interface region.
9.2.1. Interface trapping, charge and energy densificationThe currently available database allows us to propose models for the interface quantum trapping,
as illustrated in Fig. 55 for the compact and dissociated interface, agreeing with the recent finding ofPopovic and Satpathy [638] in calculating oxide superlattices and microstructures. They found the
-2 -1 0 1 2Z (a.u.)
Potential Charge density Enegy density
-2 -1 0 1 2
Z (a.u.)
a b
. Models for the atomic coordination imperfection induced surface and interface quantum trapping and the associatedand energy density gain in the (a) compacted and the (b) dissociated interfaces. One additional barrier is located at theted interface. Z is the coordination directing into one medium. For defect edge or a free surface, Z > 0 in (b) applies.

282 C.Q. Sun / Progress in Materials Science 54 (2009) 179–307
essentiality to introduce a wedge-shaped potential well for the monolayer structure sandwiched be-tween the SrTiO3 and LaTiO3 superlattices. The potential well of trapping originates from the Coulombpotential of a two-dimensional charged La sheet, which in turn confines the electrons in the Airy-func-tion-localized states. For the compact interface, there is a monotrap at the interface. Localization anddensification of charge and energy occurs to the interface. The energy levels of atoms in the interfaceregion also shit positively unless interface dipoles are formed. For the dissociated interface, double po-tential traps will present associated with one barrier in between. The Z is the coordinate directing intothe bulk. Cutting off at Z = 0, one side of the double well converges to the case of free surface or atomicvacancy defect – A barrier followed by an immediate trap in the surface skin.
9.2.2. Evidence for interface bond contractionEvidence has been shown that bond contraction takes place at sites surrounding impurities and at
the interfaces. For instances, a substitutional As dopant impurity has induced an 8% bond contractionaround the impurity (acceptor dopant As) at the Te sublattice in CdTe, as observed using EXAFS (ex-tended X-ray absorption fine structure) and XANES (X-ray absorption near edge spectroscopy) [639]. Afluorescence X-ray-absorption fine structure and X-ray diffraction has recently revealed that a 3% Ti–Nbond contraction occurs at the TiN/Si3N4 interface [640], being responsible for the hardening of thecrystalline/amorphous TiN/Si3N4 multilayer films. EXAFS investigation [641] has revealed size-depen-dent interatomic distance contraction in thiol-capped gold nanoparticles. A slight nearest-neighbordistance reduction was observed as a function of particle diameter (2–4 nm range) but, for all samples,it was less than 1%. This value is smaller compared with the larger effect expected and found in othersystems, especially for the smallest particles (2 nm).
The Au–Au bond of Au nanocrystals embedded in SiO2 was found to contract by 0.04–0.03 nm[642]. Raman scattering spectroscopy, XRD, EXAFS, and XANES revealed clearly that the Sb–Inbond in the first shell of the SbIn embedded in a SiO2 matrix contracted slightly by about0.002 nm compared with that of the bulk SbIn [643], which partly weakens the phonon confine-ment effect. XANES and EXAFS analysis [644] also revealed that Mn ion implantation on a heatedSi substrate to form clusters with 6–8 atoms located in the first coordination sphere in three sub-shells. The first subshell has one atom at a distance of 2.31 Å, the second subshell has three at2.40 Å, the third subshell has three atoms at 2.54 Å, and finally the fourth subshell contains sixMn atoms at a distance of 2.80 Å. The finding of dopant-induced bond contraction and the inter-face bond contraction could provide an atomic scale understanding of the bond in a junction inter-face that has been a puzzle for decades.
According to the recent review of Veprek and Veprek-Heijman [645] on the a-XN interface mono-layer strengthening of nc-MN/a-XN nanocomposites (M = Ti, W, V, (TiAl), X = Si, B), the enhancedstrength of the one-monolayer interface is a general nature that can be understood in terms of anextension of the BOLS correlation to the effect of monolayer interface mixing. The bond contractionand bond nature evolution upon interface formation do cause local strain and the associated quantumtrapping and pinning, which should be responsible for the monolayer strengthening as observed.
Interestingly, recent theoretical calculations, confirmed by electron microscopy measurement[646], revealed that homo-junction dislocations in aluminum have either compact or dissociated coreinterlayers. The calculated minimum stress (rP) required for moving an edge dislocation is approxi-mately 20 times higher for the compact dislocations than for the equivalent dissociated dislocations.As compared with the theoretical tensile strength in the direction [001] or [111] of an Al single crystal,the Al–GB is still strong due to the interface reconstruction, which indicates the special strength of thereconstructed and under-coordinated GB bonds, as suggested by Lu et al. [32].
Encouragingly, a grazing incidence X-ray reflectivity (GIXR) study revealed that the interface of SiO2/Si has a higher electron density than the Si and SiO2 constituents in separate forms. The higher densitypersists disregarding the thickness of the layered films [647]. The charge density in the Pt/BaTiO3 inter-face dead layer region is about 10% higher than the bulk because of the lattice strain [648]. A dead layer of3 nm thick has also been found in the Ba0.7Sr0.3TiO3/SrRuO3 interface [649]. The dead layer formationcould lower the dielectric permittivity and hence modulate the microcapacitance [650], and magnetoc-apacitance [651]. These observations provide robust evidence for the expectation for compact interfacesto have deeper trapping potential wells and higher bond strength, resulting in localization and

C.Q. Sun / Progress in Materials Science 54 (2009) 179–307 283
densification of charge and energy in the surface/interface skins, which makes the interface region aninsulating dead layer with lower dielectric constant because of the strain and quantum trapping.
9.2.3. Bond nature alterationIt is understandable that an atom performs differently at a free surface compared to an atom at the
interface. Although the coordination ratio at the interfaces undergoes little change (zib � 1), formationof an interfacial compound or alloy alters the nature of the interatomic bond which should be stron-ger. Energy storage due to bond geometry distortion also contributes to the bond energy. Investiga-tions [242] revealed that overheating occurs in substances covered by relatively higher Tm
substances, or stronger binding systems, as the Tm relates directly to the atomic cohesive energy.At the mixed interface, the zi may not change substantially, so we can introduce the interfacial
bond energy as Eint = kEb and the interfacial atomic cohesive energy as EC,int = kzEb, and then all theequations for the surface effect are adoptable to the interface properties. A numerical fit of the sizedependence of overheating for In/Al [652], Ag/Ni [653], and Pb/Al and Pb/Zn [654] core-shell nano-structure has led to a k value of 1.8, indicating that an interfacial bond is 80% stronger than a bondin the bulk of the core material [53]. If we take the bond contraction to be 0.90–0.92 as determinedfrom the As and Bi doped CdTe compound [639] into consideration, it is readily found that the m valueis around 5.5–7.0. The high m value indicates that the bond nature indeed evolves when a compoundis formed. The m value increases from 1 for the initially metallic to 4 or higher for the interfacial com-pound, which indicates the covalent interfacial bond nature. The electro-affinity and the interfacialDOS are expected to shift positively by 80% of the corresponding bulk DEC(1) value. Therefore, thedeformed and shortened interfacial bond is much stronger, meaning that electrons at an interfaceare deeply trapped; giving rise to the observable interfacial local DOS. From this perspective, twinsof nanograins [606] and the interfaces of multilayered structures [655] should be stronger and ther-mally more stable because of the interfacial strain and quantum trapping.
Experiments also show that the interfacial fcc-SiN can strengthen the TiN/SiN heterostructuresonly when its thickness is about 1–2 ML [656]. A recent work [657] on the size-dependent meltingpoints of the silica embedded crystalline germanium nanowires with mean diameters ranging from2.2 nm to 8.5 nm revealed strong interactions at the interface between the nanowire and the matrix.The bond enthalpy between Ge–O and Ge–Ge is significantly larger, i.e. 385 kJ mol�1 compared to188 kJ mol�1, leading to the observed superheating by some 60 K compared to the bulk Ge (1200 K).This finding also evidences that the interface bond is stronger [658].
In order to obtain a compound with large bulk modulus, one must find such a covalent compoundthat has both a shorter bond and smaller ionicity, and high compactness in internal atomic arrange-ment. Thus, the atomic CN-imperfection induced bond contraction should contribute directly to thehardness at the surface or sites surrounding defects. Therefore, a nanometer sized diamond is ex-pected to be 100% (0.88�5.56 � 1) harder than the bulk natural diamond but the hardness should besubject to the inverse Hall–Petch relationship [453]. The hardest diamond was estimated to be20 nm, as discussed in Section 7.
The detrimental effect of oxygen in the interface may arise from the introduction of non-bondinglone pairs and the lone pair induced dipoles, according to the understanding of O-induced stress [220].It is expected that the excessive lone pair of nitrogen should weaken the local non-bond strength andhence the strength of the entire sample. However, the measured strength depends on the sum of bind-ing energy per unit volume. If the energy density of nitride in the interface region is higher than that ofa diamond, the nitride interface will then be stronger. In contrast, oxygen involvement doubles thenumber of lone pairs and lowers the local binding energy density. This understanding may explainwhy the nitride interface is stronger and why oxygen addition could lower the strength.
It is interesting to note that nitriding multilayers show the high strength compatible to diamondwhile the stronger carbide multilayers are seldom reported. The current understanding suggests thatcarbon induced compressive stress may prevent interlayer mixing, as being in the case of diamond/Tipoor adhesion [275]. Neutralizing the interfacial stress by introducing the graded metallic carbon-ni-tride buffer layers such as TiCN could have overcome the difficulty in nitride/carbide multilayerformation.

284 C.Q. Sun / Progress in Materials Science 54 (2009) 179–307
9.3. Summary
The cohesive interface, or the interfacial mixing, can also cause spontaneous bond strain associatedwith excessive energy storage. The stored energy and the consequence of quantum trapping serve ascenters of pinning in the interface region to inhibit motion of atomic dislocations and hence interfacialhardening. On the other hand, alloy or compound formation at the interface alters the originallymetallic bonds of the components to be ionic or covalent and hence the bond nature indicator, m,evolves from the original value for each constituent element to higher values. The bond nature alter-ation provides an additional mechanism of interfacial strengthening. As the mesoscopic mechanics de-pends functionally on atomic CN, bond length, and bond energy, and the temperature of operation, theT-BOLS correlation can readily be extended to the interface by introducing a parameter, k, to correlatethe interfacial bond energy to the bulk standard, Eint(T) = kEb(T), and then the T-BOLS correlationmechanism applies to the cohesive interface, if the atomic CN changes insignificantly and the bondstrain is not reliably determined.
10. Concluding remarks
� The LBA could be an effective way of complementing the continuum and the quantum approaches.� Developed approach has led to quantitative information about the cohesive energy and the bonding iden-
tities in atomic chains or CNT.� The broken bonds and the nonbonding electrons cannot be neglected in practice.� The thermo-mechanics regardingatomicdefects, impurities, adsorbed surfaces, liquid surfaces, junction inter-
faces, and systems under other stimuli such as pressure, electronic and magnetic fields remain challenge.
10.1. Attainment
A set of analytical expressions has been developed from the perspective of local band average forthe elasticity, extensibility, and mechanical strength of low-dimensional systems in terms of bond or-der, bond length, bond strength, and their coordination environment, temperature, and stress fielddependence. The effect of a broken bond on the identities of the remaining bonds between the un-der-coordinated atoms is shown to dominate the mechanical performance and thermal stability ofthe mesoscopic systems. The competition between the residual atomic cohesive-energy of the un-der-coordinated atoms and the energy density gain per local unit volume dictates the effect intrinsi-cally and the competition between the activation and the prohibition of atomic glide dislocationsdetermine extrinsically the plastic deformation and yield strength of the mesoscopic systems. The de-scribed approaches connect the macroscopic properties to the atomistic factors by developing thefunctional dependence of the measurable quantities on the bonding identities and the response ofthe bonding identities to external stimulus, which may provide complementary to the classical theo-ries of continuum medium mechanics and statistic thermodynamics that have demonstrated the lim-itation to mesoscopic systems. The developed approaches also provide fresh horizons of predictiveobservation from the perspective of bond formation, dissociation, relaxation and vibration.
The following facts have been taken into consideration as physical constraints in developing theatomistic solutions:
(i) For a given specimen, the nature and the total number of bonds do not change under externalstimulus unless phase transition occurs, whereas the length and strength of all the bondsinvolved will response to the stimulus. This fact enables one to implementing the LBA approachto focus on the behavior of the representative bonds and their average for the mechanicalbehavior of the entire specimen.
(ii) The mechanical properties of a substance are proportional to the sum of binding energy per unitvolume. The broken bond triggers the BOLS correlation and the temperature rise causes volumeexpansion and atomic vibration that weakens the bond energy through the increase of internal

C.Q. Sun / Progress in Materials Science 54 (2009) 179–307 285
energy in Debye approximation. Therefore, the joint effect of bond breaking and the associatedlocal strain and quantum trapping as well as the bond vibrating under thermal stimulus repre-sented by the T-BOLS correlation is of key importance to the mesoscopic mechanics.
(iii) The molten phase is extremely soft and highly extensible, following Born’s criterion, yet theintrinsic elastic modulus remains non-zero at Tm or above because of the detectable soundvelocity in liquid and gaseous phases.
The major progress made by using the LBA approach and the T-BOLS mechanism can be summa-rized as follows:
(i) Concepts of the energy density gain per unit volume in the surface skin and the residual cohe-sive-energy for the under-coordinated surface atoms are proven essential and more effective todescribe the behavior of atoms and processes occurring at a surface. The deepened potentialwell of quantum trapping at sites of the under-coordinated atoms provides a mechanism forthe pinning effect as observed in mechanical deformation tests because of the locally densifiedand lowered energy states though the broken bonds provide sites initiating structure failure.
(ii) A well-ordered, solid-like, and elastic sheet is found to cover the liquid drop; the elastic repul-sion between the densely charged surfaces could dominate the surperfluidity in nanochanels,the superhydrophobicity of nanostructures and the frictionless linear bearing of CNT.
(iii) Consistent insight has been obtained into the atomistic mechanism of surface tension and sur-face stress and their adsorption and temperature dependence from the perspective of chargeredistribution and polarization upon adsorbate bond making. A solid surface is harder at tem-peratures far below Tm but the surface melts more easily compared to the bulk interior. Theelastic sheet of a liquid surface skin tends to solidify more easily than the liquid interior, whichmay provide a mechanism for liquid drop and bubble formation.
(iv) It has been clarified that the observed HPR–IHPR transition arises from the intrinsic competitionbetween the atomic residual cohesive-energy of the under-coordinated atoms and energy den-sity gain near the grain boundaries and the extrinsic competition between the activation andprohibition of atomic dislocation motion. The under-coordinated atoms in the surface skin dom-inate such transition yet atoms in the grain interior retain their bulk nature. For thin film sam-ples, the hardness shows no IHPR and the hardness and elastic modulus correlate linearly.Therefore, the HPR and IHPR effects in nanograins are activated by the extrinsic competitionbetween dislocation activation and dislocation inhibition in detection.
(v) It is understood that the mechanical strengthening and thermal weakening induced by vacan-cies, cavities, and pores arise from the increased proportion of the under-coordinated atoms atthe negatively curved surfaces, which is naturally the same as those atoms at the flat surfaces orthe positively curved surfaces of nanograins. It is expected that nanoporous foams should bestiffer with smaller pore sizes and lower porosities whereas it would be tougher with higherporosities and larger pores, being similar to the IHPR effect.
(vi) Interfacial bond contraction and the associated bond strengthening, and the bond nature alter-ation upon alloy and compound formation at the junction interfaces are responsible for thehardening and overheating of twin gains, interfaces, and nanocomposites.
(vii) The Debye temperature, hD, has a square root dependence on (Tm � T)1/2/d, rather than the linearor square root dependence on Tm. The currently derived solution may provide a complementaryone to the T-independent form of hD given by Lindermann. The specific heat capacity generallydecreases when the solid size is reduced. The reduction of the specific heat capacity is more pro-nounced for larger m values at lower temperatures.
Reproduction of experimental observations reveals the following:
(i) Surface relaxation and reconstruction of an elemental solid arises from the effect of bond break-ing, which originates the surface energetics. The surface stress results from the surface strainrather than the stress results in the strain, as one often believes. The surface and size induced

286 C.Q. Sun / Progress in Materials Science 54 (2009) 179–307
hardening arises from bond breaking and the associated nearby strain and quantum trappingand the thermally-induced mechanical softening results from bond expanding and vibratingupon being heated.
(ii) The adsorbate induced surface stress arises from charge repopulation and polarization uponadsorbate bond making, which is very complicated and varies from situation to situation. Know-ing the bonding kinetics and dynamics is crucial to understanding the adsorbate induced sur-face stress and the process of reconstruction.
(iii) The equilibrium bond length, strength, thermal stability, and the strain limit of monatomicchains have been quantified without needing involvement of charge or atomic mediation. With-out external stimuli, the metallic bond in a MC contracts by �30%, associated with �43% mag-nitude rise of the bond energy compared with the bulk standard cases. A metallic MC melts at0.24 fold of the bulk Tm. The strain limit of a bond in a metallic MC under tension does not varyapparently with mechanical stress or strain rate, but apparently does with temperature differ-ence Tmi � T. It is anticipated that extendable MCs of other elements could be made at an appro-priate range of temperatures of operation.
(iv) The developed approach has allowed us to determine the actual values of the Young’s modulusand the wall (C–C bond) thickness by solving a set of equations, to advance a consistent under-standing of the mechanical strength and the chemical and thermal stability of CNTs. The C–Cbond in the SWCNT contracts by �18.5% with an energy rise by �68%. The effective thicknessof the C–C bond is �0.142 nm, which is the diameter of an isolated C atom. The melting pointof the tube-wall is slightly (�12 K) higher than that of the open edge of the tube-end. The lit-erature-documented values of the tip-end Tm and the product of Yt essentially represent thetrue situations of a SWCNT in which the Young’s modulus is 2.5 times and the Tm is 0.42 timesthat of bulk graphite. Predictions of the wall thickness dependence agree well with the insofar-observed trends in Tm suppression and Y enhancement of the multi-walled hollow tubes andnanowires. It is anticipated that at temperature far below the surface Tm, a nano-solid shouldbe fragile with lower extensibility, whereas when T approaches the surface Tm or higher, thenanosolid should be ductile.
(v) Together with the unique solutions to the Au–MC maximal strain and the C–C bond thickness ofSWCNT, recent work of Huang et al. [130] evidences the reliability of Goldschmidt–Feibelman’sscheme of the coordination dependence of bond contraction and the BOLS correlation, whichrepresent true situations of observations in particularly in accuracy.
(vi) The Young’s modulus of a nanosolid may be depressed, increased, or remain unchanged whenthe solid size is decreased, depending on the nature of the bond involved, temperature of oper-ation, surface passivation, and experimental techniques. This understanding clarifies why the Yvalues for some materials are elevated and why those of others are not upon size reduction. It istherefore not surprising to observe the elastic modulus change in different trends of differentmaterials measured under different conditions, or even one material measured under differentconditions.
(vii) Reproduction of the temperature dependence of surface tension and Young’s modulus has led toquantitative information regarding the mean bond energy of a specimen in the bulk at 0 Kthough the accuracy is subject to the involvement of artifacts in measurement.
(viii) Mechanism for the superplasticity of nanograins becomes clear. The bond unfolding and atomicsliding dislocations of the under-coordinated atoms at grain boundaries dominate the super-plasticity, as the detectable maximal bond strain at a temperature close to the melting pointis limited to within 140%. On the other hand, the self-heating during bond unfolding and break-ing should raise the actual temperature of the small samples. A metallic nano-solid at T� Tm isin quasimolten state as the critical temperature for the solid-to-quasimolten transition is muchlower than the temperature of melting.
(ix) The under-coordinated atoms in the negatively curved surfaces of atomic vacancies, pointdefects, nanocavities, and the syntactic foams are responsible for the strain hardening and ther-mal instability of the negatively curved systems, being the same by nature to the atoms at thepositively curved and flat surfaces. It is emphasized that the nanopores play dual roles in

C.Q. Sun / Progress in Materials Science 54 (2009) 179–307 287
mechanical strength. The shorter and stronger bonds near the pores act as pinning centersinhibiting motion of atomic dislocations because of the strain and the quantum trapping; thepores provide however sites for initiating structure failure under plastic deformation.
(x) The IHPR originates intrinsically from the competition between the bond order loss and theassociated bond strength gain of atoms in the GBs. The IHPR is activated by the measurementof plastic deformation that causes the activation and a response to prohibition of dislocationmotion. As the solid size shrinks, a transition from dominance of energy density gain to domi-nance of cohesive energy loss occurs at the IHPR critical size because of the increased fraction oflower coordinated atoms. During the transition, both bond order loss and bond strength gaincontribute competitively.
(xi) The IHPR critical size is universally predictable, which can be calibrated with a limited numberof measurements for a specific system. The critical size is dominated intrinsically by bond nat-ure, the T/Tm ratio, and extrinsically by experimental conditions or other factors such as size dis-tribution and impurities. The IHPR at larger solid size converges to the normal HPR thatmaintains its conventional meaning of the accumulation of atomic dislocations that resist fur-ther atomic displacements in plastic deformation. The slope in the traditional HPR is propor-tional to exp(Tm/T), which represents the relationship between the hardness and theactivation energy for atomic dislocations. Understanding these events provides a consistentinsight into the factors dominating the critical size for HPR transition and the critical tempera-ture for solid–quasimolten and quasisolid–liquid transitions at a given temperature.
(xii) Finally, achievement evidence that the proposed LBA approach and the T-BOLS correlation couldprovide complementary to the classical and quantum approaches for the size and temperaturedependence of low-dimensional solid mechanics, with derived information such as the bondenergy and the bonding identities in the atomic chains and hollow tubes.
10.2. Limitations
One may wonder that there is often competition between various factors for a specific phenome-non to occur. However, the broken bond affects almost all the intrinsic aspects of concern, and there-fore, the atomic CN-imperfection should dominate the performance of a nanosolid through thecompetition factors. In the nanoindentation test, errors may arise because of the shapes and sizesof the tips, such as in the cases described in Ref. [44]. In practice, the stress–strain profiles of a nano-solid are not symmetrical when comparing the situation under tension to the situation under com-pression, and the flow stress is dependent of the strain rate, loading mode and time, and materialscompactness, as well as particle size distribution. Fortunately, the effect of tip shape and loading modenever affects the origin and the hardness peaking at the surface in detection. By taking the relativechange of the measured quantity into account, the present approach of seeking for the change relativeto the bulk values can minimize contributions from such artefacts. On the other hand, the extrinsicfactors could be modelled by changing the prefactor in the IHPR modelling procedure. The relativechange of intensity, the peak position, and the trend of change could reflect the intrinsic physicalcharacteristics.
Furthermore, the thermal energy released from bond breaking and bond unfolding should raise theactual temperature of the system. The fluctuation in grain size distribution and surface passivationalso affects the actual melting point of the individual atoms at boundaries of grains of different sizes.These factors make the measurements deviate from the predicted results. Nevertheless, one could notexpect to cover fluctuations due to mechanical (strain rate, stress direction, loading mode, time, etc.),thermal (self-heating during process), crystal structure orientation, impurity density, or grain-size dis-tribution effects in a theoretical model, as these fluctuations are extrinsic, ad-hoc, and hardly control-lable [659,660].
In dealing with the effect of temperature, we used the Debye specific heat for constant volume. Infact, most of the measurements were conducted under constant pressure. The specific heat for con-stant pressure should be preferable. However, for solid state, the ratio of (Cp � Cv)/Cp is 3% or less

288 C.Q. Sun / Progress in Materials Science 54 (2009) 179–307
[128]. Therefore, assuming the specific heat to follow the Debye approximation is reasonablyacceptable.
It is known that the internal stress signature of nano and microstructures plays a critical role indetermining the appropriate rate limiting process. When dislocations mediate the plasticity, the defectstructure (over many length scales) through the internal stress, plays a critical role in determining thefinal macroscopic plasticity. The strength of a material is therefore a function of many temporal andspatial length scales. Plastic deformation is dominantly related to the mechanism of the atomic move-ments of a long scale for strain accumulation, accompanied with the atomic interaction among manyatoms. On the other hand, in non-crystalline regions, the local stress at an atomic site arises from allthe bonds that the atom is involved. However, the average of local bonds over the measured size couldrepresent the measurement collecting statistic information from the given volume. The disorderedstructures or system with large amount of defects will results in the deviation of the derived bond en-ergy from the true value in ideal case. The long-range interaction can be folded into the representativebonds, which has proven effective.
For compounds, different kinds of bonds are involved and each kind of bond is suitably describedusing one kind of interatomic potential, the description using a representative bond herewith seemsinappropriate. However, the average of the local bond is substantially the same as the approach usedin the DFT or MD calculations solving the Schrödinger equation or the Newton motion of equationswith the average interatomic potential as a key factor. The long-range atomic dislocation and the ef-fect of pressure induced strengthening would be the focus for future study. Nevertheless, we shouldfocus more on the nature and trend of the unusual behavior in mechanics, as accurate detection ofthe absolute values remains problematic [204]. As the LBA approach and the T-BOLS correlation dealswith only the joint effects of temperature and bond order imperfection, none of the particularities ofthe elements, crystal or phase structures or the exact form of pair potential is involved. What we needto consider are the nature of the bond and the equilibrium atomic distance with and without externalstimulus, which could be one of the advantages of the reported approach. It is emphasized that it isimpractical for one theory model to cover all the factors simultaneously in particular those extrinsic,kinetic, and random factors that contribute little to the nature.
10.3. Prospects
Further extension of the LBA approach and the T-BOLS premise should open up new ways of think-ing about the mesoscopic systems from the perspective of a broken bond that seems not to contributedirectly to the physical properties of the mesoscopic systems. Consistent understanding and consis-tency in the numerical match are expected to give evidence of the validity of the approaches thatmay represent the true situation of the under-coordinated systems. More attention is going to be paidto the following continuing challenges:
(i) Miniaturization of dimensionality not only allows us to tune the physical properties of a solidbut also provides us with opportunity to elucidate information including the energy levels ofan isolated atom, the vibration frequency of an isolated dimer, and the specific heat per bond,as well as discriminating the contribution of bond order loss from the effect of chemical passiv-ation to the detectable quantities. Further exploitation in these areas may provide profoundinformation that is beyond the scope of conventional approaches.
(ii) Extension of the LBA and T-BOLS correlation to domains such as pressure and external electricfield could lead to new knowledge that would be even more fascinating and useful. For instance,the bending strength of PZT-841 ceramics was measured to decrease by 25% when the temper-ature was increased from 300 K to the Curie point TC (543 K) with a valley at temperaturesaround 498 K. A positive or negative electric field larger than 3 kV/cm reduces the bendingstrength of the specimen significantly [661], indicating a combined effect of Joule heat and elec-tric field. Under an applied electric field, the transverse and axial Young moduli of a nanowireare different from those of a nanowire in the absence of the field [662]. The effect of the electricfield on Young modulus is related to the intensity of the field, the size of the wire, and the

C.Q. Sun / Progress in Materials Science 54 (2009) 179–307 289
direction of the wire. The mesoscopic systems also show unusual performance under an exter-nal stress field in terms of the critical temperature for phase transition, spectroscopic features oflattice vibration and photoluminescence.
(iii) Transport dynamics in thermal and electrical conductivity play an important role in the perfor-mance of nanostructured devices. Introduction of the quantum trapping near the defects wouldbe a topic that leads to new knowledge and phenomenon. In addition to the known mechanismof surface scattering, the surface/interface quantum trapping may play a dominant role in deter-mining the intrinsic transport dynamics of nanometer-sized electronic and photonic devices.Employing the BOLS-induced barrier and trap in the crystal potential for a nanosolid and foran assembly of nanosolids could improve the understanding on the kinetic and dynamic perfor-mance of a nanosolid under external stimuli.
(iv) The effect of bond order loss may correlate the nanostructures and amorphous states in theirphysical behavior. The bond order loss occurs orderly at the skins of nanostructures yet it pre-sents randomly in the bulk amorphous. Exploration of the similarities and differences betweenthe nanostructured and the amorphous state would be interesting.
(v) The new degree of the freedom of size, and its combination with temperature, pressure, chem-ical, and other domains could amplify the parameter space for functional materials design. Forexample, a comparative study of thermo-mechanical properties of nano-polycrystalline nickel(nano-Ni) and micrometer-polycrystalline nickel (micron-Ni) by in situ high pressure–temper-ature (P–T) diffraction experiments [663] revealed that the yield strength of 2.35 GPa for thenano-Ni measured under high-pressure triaxial compression is more than three times that ofthe micron-Ni. Significant work hardening for the nano-Ni in high-pressure plastic deformationstage was observed, whereas the micron-Ni experiences minor high-pressure work-softeningand considerable energy dissipation into heat. The significantly reduced energy dissipationfor the nano-Ni during the loading–unloading cycle indicates that the nanostructured materialscan endure much greater mechanical fatigue in cyclic loadings. The nano-Ni exhibits steadygrain growth during bulk plastic deformation at high-pressure loading, and drastic stress reduc-tion and grain growth occur during the high P–T cycle. The results should be of considerableinterest for further study.
(vi) It is interesting as noted in a recent non-linear constitutive modeling [664] and first principlecalculation [665] that in the indentation test the pressure enhancement of both elastic modulusand yield strength is significant. A comparison with classical linear elasticity, that uses constant,zero-pressure, values of the modulus and constant yield strength, shows that the enhancementof the elastic modulus and of the yield strength due to extreme high pressures that develop inmaterial under the indenter has a significant effect in hard and superhard materials. Thisenhancement has to be accounted for if accurate modeling of the mechanical response of suchmaterials with extreme properties is to be achieved. The pressure effect on the elasticityenhancement could be described by the extension of the BOLS to pressure domain that causesbond deformation associated with storage of the deformation energy.
(vii) Incorporating the concepts of BOLS correlation and temperature dependence to the establishedcomputation methodologies could not only refine the parameters used in practice, but alsoexpand the capability of computation tools to reveal true situation and minimize the gapbetween measurement and calculation.
(viii) Harnessing the localized energy states at sites surrounding edges, defects, impurities and inter-faces and making then of use in designing new functional devices would also be very interest-ing. Integrating the broken bonds and the nonbonding states and the associated approachesdeveloped would amplify the surface and interface sciences tremendously.
These topics would form challenging branches of further study towards profound knowledge andpractical applications. The progresses reported in the current and previous works may evidence thevalidity of the LBA approach and the BOLS correlation, which has enabled us to touch the surface ofthe vast field of low-dimensional physics and chemistry. There is indeed plenty of room for us to ex-plore, which must be even challenging, fascinating and rewarding.

290 C.Q. Sun / Progress in Materials Science 54 (2009) 179–307
Notes added in proof – superfluidity and supersolidity of 4He crystal
While proofing this article, the author became aware of the fascinating phenomenon of the super-fluidity and supersolidity of 4He crystal [666,667]. At temperature below 200 mK [668], the 4He crystalis readily decoupled into fragments in a torsional oscillator to exhibit superfluidic nature – frictionlessmotion without viscosity; meanwhile, the 4He crystal fragments are stiffer than expected [669] andreact elastically to a shear stress; and thus the 4He crystal would be both elastic and superfluidic.The superfluidity of 4He solid is related to the quantum defects such as atomic vacancies of 1 nm sizeor around [670] and the supersolidity is related to structural disorder [671] such as dislocations, grainboundaries, or ill-crystallized regions. According to Pollet et al. [670], inside a dislocation or a grainboundary, the local stress is anisotropic and sufficient to bring the vacancy energy to zero, so thatthe defect is invaded by vacancies that are mobile and superfluidic. Solid 4He could contain a networkof defects and if these defects are connected to each other, mass could flow from one side of the crystalto the other without friction. On the other hand, the disorder-induced stiffening could be the result ofdislocations becoming pinned by isotopic impurities (i.e., 3He atoms even at very smallconcentrations).
Encouragingly, the understanding of superfluidity, superhydrophobicity and superlubricity atnanometer scaled contacts discussed in Section 3.6 could be extended to provide a supplementarymechanism for the superfluidity and supersolidity of 4He crystal. The electric repulsion between the‘‘electric monopoles locked in the stiffened skins” of the small grains could help in solving this puzzle.The broken-bond-induced local strain and quantum trapping leads to a densification of charge and en-ergy in the surface of a skin depth. The densification of energy corresponds to the enhancement ofelasticity, which stiffens the solid skin allowing the 4He segment to react elastically to a shear stress;the repulsion between the surface monopoles of structure disorders due to polarization of electrons bythe densely-and-deeply trapped charges to make the motion frictionless. Therefore, the broken bondsthat serve not only as centers that initiate structure failure but also provide sites for pinning disloca-tions by charge and energy trapping could be responsible for the superfluidity and supersolidity asobserved.
For 4He crystal, the interatomic ‘‘bond” breaks easily, which requires energy at the critical point of4.2 K for liquid-vapor transition in the order of 1/3000 eV, much smaller than a typical van der Waalsbond of 0.1 eV or around. The extremely weak interatomic interaction through charge sharing makesthe 4He atoms or grains are sticking-less-more like hard spheres with closed electronic shell packingtogether. The sticking-less interaction between grains will lower the friction coefficient.
Acknowledgements
The author would like to express his sincere gratitude to Professors S. Veprek, J.S. Colligon, P.J. Jen-nings, C.L. Bai, S.Y. Tong, R.A. Andrievski, F.G. Shi, C. Humphreys, M. Wautelet, M.F. Ashby, B. Cantor, E.Roduner, S. Suzer, A. Zakidov, S.X. Dou, W. Gao, Y.W. Mai, L.D. Zhang, G.T. Fei, H.C. Huang, S.Y. Fu, Y.C.Zhou, J. Zhou, X.H. Wang, W.T. Zheng, Q. Jiang, Y.P. Zhao, T.Y. Zhang, Z. Zhang, G.C. Wang, H. Ishiwara,L.T. Li, X. Yao, E.K. Wang, and E.Y. Jiang for their encouragement and valuable communications. A fas-cinating, encouraging, and memorable discussion in person with the late Dr Alan G. MacDiarmid at UTDallas is gratefully acknowledged. The author also would like to thank J.S. Colligon and Yi Sun for crit-ical reading and valuable input and Z.L. Dong, S. Li, B.K. Tay, K.L. Pey, S.Y. Xu, K. Liao, H.T. Huang, L.K.Pan, Y.Q. Fu, M.X. Gu for their support and input in one way or another. Permission of reprinting dia-grams from Elsevier, IOP, APS, ACS, and AIP is also acknowledged. The project was supported by Min-istry of Education (RG14/06), Singapore, National Science Foundation of China No. 10772157), KCWong Education Foundation, Hong Kong, Hunan Province and the Key Laboratory of Ceramics andRefinery Processing at Tsinghua University, China.
References
[1] Sun CQ. Size dependence of nanostructures: impact of bond order deficiency. Prog Solid State Chem 2007;35:1–159.[2] Agrat N, Yeyati AL, van Ruitenbeek JM. Quantum properties of atomic-sized conductors. Phys Rep 2003;377:81–279.

C.Q. Sun / Progress in Materials Science 54 (2009) 179–307 291
[3] Binns C. Nanoclusters deposited on surfaces. Surf Sci Rep 2001;44:1–49.[4] Cappella B, Dietler G. Force–distance curves by atomic force microscopy. Surf Sci Rep 1999;14:1–104.[5] Rusanov AI. Surface thermodynamics revisited. Surf Sci Rep 2005;58:111–238.[6] Huang Y, Gao H, Nix WD, Hutchinson JW. Mechanism-based strain gradient plasticity – II. Analysis. J Mech Phys Solids
2000;48:99–128.[7] A Fleck N, Hutchinson JW. Strain gradient plasticity. Adv Appl Mech 1997;33:295–361.[8] Gu MX, Zhou YC, Pan LK, Sun Z, Wang SZ, Sun CQ. Temperature dependence of the elastic and vibronic behavior of Si, Ge
and diamond crystals: a local bond average approach. J Appl Phys 2007;102:083524.[9] Gogotsi Y, Welz S, Ersoy DA, McNallan MJ. Conversion of silicon carbide to crystalline diamond-structured carbon at
ambient pressure. Nature (London) 2001;411:283–7.[10] Ma Z, Long S, Pan Y, Zhou Y. Indentation depth dependence of the mechanical strength of Ni films. J Appl Phys
2008;103:043512.[11] Yip S. Nanocrystalline metals – mapping plasticity. Nat Mater 2004;3:11–2.[12] Tan EPS, Lim CT. Mechanical characterization of nanofibers – a review. Compos Sci Technol 2006;66:1102–11.[13] Xia YN, Yang PD, Sun YG, Wu YY, Mayers B, Gates B, et al. One-dimensional nanostructures: synthesis, characterization,
and applications. Adv Mater 2003;15:353–89.[14] Han XD, Zhang Z, Wang ZL. Experimental nanomechanics of one-dimensional nanomaterials by in situ microscopy. Nano
2007;2:249–71.[15] Liang HY, Upmanyu M, Huang HC. Size-dependent elasticity of nanowires: nonlinear effects. Phys Rev B 2005;71:241403.[16] Shim HW, Zhou LG, Huang HC, Cale TS. Nanoplate elasticity under surface reconstruction. Appl Phys Lett 2005;86:151912.[17] Guo JG, Zhao YP. The size dependent elastic properties of nanofilms with surface effects. J Appl Phys 2005;98:074306.[18] Guo JG, Zhao YP. The size-dependent bending elastic properties of nanobeams with surface effects. Nanotechnology
2007;18:295701.[19] Cuenot S, Fretigny C, Demoustier-Champagne S, Nysten B. Surface tension effect on the mechanical properties of
nanomaterials measured by atomic force microscopy. Phys Rev B 2004;69:165410.[20] Shenoy VB. Atomistic calculations of elastic properties of metallic fcc crystal surfaces. Phys Rev B 2005;71:094104.[21] Stan G, Krylyuk S, Davydov AV. Surface effects on the elastic modulus of Te nanowires. Appl Phys Lett 2008;92:241908.[22] Cao GX, Chen X. Size dependence and orientation dependence of elastic properties of ZnO nanofilms. Int J Solids Struct
2008;45:1730–53.[23] He J, Lilley CM. Surface effect on the elastic behavior of static bending nanowires. Nano Lett 2008;8:1798–802.[24] Zhang TY, Luo M, Chan WK. Size-dependent surface stress, surface stiffness, and Young’s modulus of hexagonal prism
(111)-SiC nanowires. J Appl Phys 2008;103:104308.[25] Zhao Y, Shen TD, Zhang J. High P–T nano-mechanics of polycrystalline nickel. Nano Res Lett 2007;2:476–91.[26] Greer JR, Nix WD. Size dependence of mechanical properties of gold at the sub-micron scale. Appl Phys A
2005;80:1625–9.[27] Greer JR, Oliver WC, Nix WD. Size dependence of mechanical properties of gold at the micron scale in the absence of strain
gradients. Acta Mater 2005;53:1821–30.[28] Parthasarathy TA, Rao SI, Dimiduk DM, Uchic MD, Trinkle DR. Contribution to size effect of yield strength from the
stochastics of dislocation source lengths in finite samples. Scripta Mater 2007;56:313–6.[29] Choi Y, Suresh S. Size effects on the mechanical properties of thin polycrystalline metal films on substrates. Acta Mater
2002;50:1881–93.[30] Guisbiers G, Van Overschelde O, Wautelet M. Nanoparticulate origin of intrinsic residual stress in thin films. Acta Mater
2007;55:3541–6.[31] Zhou LG, Huang H. Elastic softening and stiffening of metals surfaces. Int J Multiscale Comput Eng 2006;4:19–28.[32] Lu GH, Deng S, Wang T, Kohyama M, Yamamoto R. Theoretical tensile strength of an Al grain boundary. Phys Rev B
2004;69:134106.[33] Qiao L, Zheng X. Elastic property of fcc metal nanowires via an atomic-scale analysis. Appl Phys Lett 2008;92:231908.[34] Ouyang G, Li XL, Tan X, Yang GW. Size-induced strain and stiffness of nanocrystals. Appl Phys Lett 2006;89:031904.[35] Van Swygenhoven H. Size effects in plasticity: experiments and simulations. Mater Sci Forum 2006;503–504:193–200.[36] Van Swygenhoven H, Derlet PM, Hasnaoui A. Atomistic modeling of strength of nanocrystalline metals. Adv Eng Mater
2003;5:345–50.[37] Horstemeyer MF, Baskes MI, Plimpton SJ. Computational nanoscale plasticity simulations using embedded atom
potentials. Theor Appl Fract Mech 2001;37:49–98.[38] Kumar KS, Van Swygenhoven H, Suresh S. Mechanical behavior of nanocrystalline metals and alloys. Acta Mater
2003;51:5743–74.[39] Wu HA. Molecular dynamics study on mechanics of metal nanowire. Mech Res Commun 2006;33:9–16.[40] Sun CQ, Tay BK, Lau SP, Sun XW, Zeng XT, Li S, et al. Bond contraction and lone pair interaction at nitride surfaces. J Appl
Phys 2001;90:2615–7.[41] Caceres D, Vergara I, Gonzalez R, Monroy E, Calle F, Munoz E, et al. Nanoindentation on AlGaN thin films. J Appl Phys
1999;86:6773–8.[42] Liu E, Shi X, Tan HS, Cheah LK, Sun Z, Tay BK, et al. Molecular dynamics study on mechanics of metal nanowire. Surf Coat
Technol 1999;20–21:601–9.[43] Shi X, Tay BK, Flynn DL, Sun Z. Tribological properties of tetrahedral carbon films deposited by filtered cathodic vacuum
arc technique. Mater Res Symp Proc 1997;436:293–8.[44] Mirshams RA, Parakala P. Nanoindentation of nanocrystalline Ni with geometrically different indenters. Mater Sci Eng A
2004;372:252–60.[45] Gu C, Lian J, Jiang Z, Jiang Q. Enhanced tensile ductility in an electrodeposited nanocrystalline Ni. Script Mater
2006;54:579–84.[46] Zhao M, Slaughter WS, Li M, Mao SX. Material-length-scale-controlled nanoindentation size effects due to strain-gradient
plasticity. Acta Mater 2003;51:4461–9.

292 C.Q. Sun / Progress in Materials Science 54 (2009) 179–307
[47] Cao YF, Allameh S, Nankivil D, Sethiaraj S, Otiti T, Soboyejo W. Nanoindentation measurements of the mechanicalproperties of polycrystalline Au and Ag thin films on silicon substrates: effects of grain size and film thickness. Mater SciEng A 2006;427:232–40.
[48] Ferro D, Teghil R, Barinov SM, D’Alessio L, Demaria G. Thickness-dependent hardness of pulsed laser ablation depositedfilms of refractory carbides. Mater Chem Phys 2004;87:233–6.
[49] Liu M, Shi B, Guo J, Cai X, Song H. Lattice constant dependence of elastic modulus for ultrafine grained mild steel. ScriptaMater 2003;49:167–71.
[50] Ni H, Li X. Young’s modulus of ZnO nanobelts measured using atomic force microscopy and anoindentation techniques.Nanotechnol 2006;17:3591–7.
[51] Kulkarni AJ, Zhou M, Ke FJ. Orientation and size dependence of the elastic properties of zinc oxide nanobelts. Nanotechnol2005;16:2749–56.
[52] Lucas M, Mai WJ, Yang RS, Wang ZL, Riedo E. Size dependence of the mechanical properties of ZnO nanobelts. Phill Mag2007;87:2135–41.
[53] Chen CQ, Shi Y, Zhang YS, Zhu J, Yan YJ. Size dependence of Young’s modulus in ZnO nanowires. Phys Rev Lett2006;96:075505.
[54] Zhang L, Huang H. Young’s moduli of ZnO nanoplates: ab initio determinations. Appl Phys Lett 2006;89:183111.[55] Cao G, Chen X. Energy analysis of size-dependent elastic properties of ZnO nanofilms using atomistic simulations. Phys
Rev B 2007;76:165407.[56] Jing GY, Duan HL, Sun XM, Zhang ZS, Xu J, Li YD, et al. Surface effects on elastic properties of silver nanowires: contact
atomic-force microscopy. Phys Rev B 2006;73:235409.[57] Tan EPS, Lim CT. Nanoindentation study of nanofibers. Appl Phys Lett 2005;87:123106.[58] Vaz F, Carvalho S, Rebouta L, Silva MZ, Paúl A, Schneider D, et al. Young’s modulus of (Ti, Si)N films by surface acoustic
waves and indentation techniques. Thin Solid Films 2002;408:160–8.[59] Rubio-Bollinger G, Bahn SR, Graı̈t NA, Jacobsen KW, Vieira S. Mechanical properties and formation mechanisms of a wire
of single gold atoms. Phys Rev Lett 2001;87:026101.[60] Wong EW, Sheehan PE, Lieber M. Nanobeam mechanics: elasticity, strength and toughness of nanorods and nanotubes.
Science 1997;277:1971–5.[61] Dalton AB, Collins S, Munoz E, Razal JM, Ebron VH, Ferraris JP, et al. Super-tough carbon-nanotube fibres – these
extraordinary composite fibres can be woven into electronic textiles. Nature 2003;423:703.[62] Miller RE, Shenoy VB. Size-dependent elastic properties of nanosized structural elements. Nanotechnol
2000;11:139–47.[63] Feng G, Nix WD, Yoon Y, Lee CJ. A study of the mechanical properties of nanowires using nanoindentation. J Appl Phys
2006;99:074304.[64] Price WJ, Leigh SA, Hsu SM, Patten TE, Liu GY. Measuring the size dependence of Young’s modulus using force modulation
atomic force microscopy. J Phys Chem A 2006;110:1382–8.[65] Miyake K, Satomi N, Sasaki S. Elastic modulus of polystyrene film from near surface to bulk measured by nanoindentation
using atomic force microscopy. Appl Phys Lett 2006;89:031925.[66] Song J, Wang X, Riedo E, Wang ZL. Elastic property of vertically aligned nanowires. Nano Lett 2005;5:1954–8.[67] Bai XD, Gao PX, Wang ZL, Wang EG. Dual-mode mechanical resonance of individual ZnO nanobelts. Appl Phys Lett
2003;82:4806–8.[68] Yum K, Wang Z, Suryavanshi AP, Yu MF. Experimental measurement and model analysis of damping effect in nanoscale
mechanical beam resonators in air. J Appl Phys 2004;96:3933–8.[69] Desai AV, Haque MA. Mechanical properties of ZnO nanowires. Sensors Actuat A 2007;134:169–76.[70] Nilsson SG, Borrise X, Montelius L. Size effect on Young’s modulus of thin chromium cantilevers. Appl Phys Lett
2004;85:3555–7.[71] Li X, Ono T, Wang Y, Esashi M. Ultrathin single-crystalline-silicon cantilever resonators: fabrication technology and
significant specimen size effect on Young’s modulus. Appl Phys Lett 2003;83:3081–3.[72] Xiong QH, Duarte N, Tadigadapa S, Eklund PC. Force-deflection spectroscopy: a new method to determine the Young’s
modulus of nanofilaments. Nano Lett 2006;6:1904–9.[73] Li XD, Wang XN, Xiong QH, Eklund PC. Mechanical properties of ZnS nanobelts. Nano Lett 2005;5:1982–6.[74] Wu B, Heidelberg A, Boland JJ. Mechanical properties of ultrahigh-strength gold nanowires. Nat Mater 2005;4:525–9.[75] Ni H, Li X, Gao H. Elastic modulus of amorphous SiO2 nanowires. Appl Phys Lett 2006;88:043108.[76] Li XD, Hao HS, Murphy CJ, Caswell KK. Nanoindentation of silver nanowires. Nano Lett 2003;3:1495–8.[77] Ngo LT, Almecija D, Sader JE, Daly B, Petkov N, Holmes JD, et al. Ultimate-strength germanium nanowires. Nano Lett
2006;6:2964–8.[78] Siavosh-Haghighi A, Thompson DL. Melting point determination from solid–liquid coexistence initiated by surface
melting. J Phys Chem C 2007;111:7980–5.[79] Chushak YG, Bartell LS. Melting and freezing of gold nanoclusters. J Phys Chem B 2001;105:11605–14.[80] Ignatescu V, Blakely JM. Morphological evidence for surface pre-melting on Si(111). Surf Sci 2007;601:5459–65.[81] Shpyrko OG, Grigoriev AY, Steimer C, Pershan PS, Lin B, Meron M, et al. Anomalous layering at the liquid Sn surface. Phys
Rev B 2004;70:224206.[82] Zhang TY, Xu WH. Surface effects on nanoindentation. J Mater Res 2002;17:1715–20.[83] Xu WH, Zhang TY. Surface effect for different types of materials in nanoindentation. Adv Fract Fail Prev 2004;261–
263:1587–92.[84] Manika E, Maniks J. Size effects in micro- and nanoscale indentation. Acta Mater 2006;54:2049–56.[85] Egry I. The surface tension of binary alloys: simple models for complex phenomena. Int J Thermophys 2005;26:931–9.[86] Shimizu RN, Demarquette NR. Evaluation of surface energy of solid polymers using different models. J Appl Polym Sci
2000;76:1831–45.[87] Haque MA, Saif MTA. Thermo-mechanical properties of nano-scale freestanding aluminum films. Thin Solid Films
2005;484:364–8.

C.Q. Sun / Progress in Materials Science 54 (2009) 179–307 293
[88] Szuecs F, Werner M, Sussmann RS, Pickles CSJ, Fecht HJ. Temperature dependence of Young’s modulus and degradation ofchemical vapor deposited diamond. J Appl Phys S 1999;86:6010–7.
[89] Wu YH, McGarry FJ, Zhu BZ, Keryk JR, Katsoulis DE. Temperature effect on mechanical properties of toughened siliconeresins. Polym Eng Sci 2005;45:1522–31.
[90] Ono N, Nowak R, Miura S. Effect of deformation temperature on Hall–Petch relationship registered for polycrystallinemagnesium. Mater Lett 2004;58:39–43.
[91] Schiotz J, Vegge T, Di Tolla FD, Jacobsen KW. Atomic-scale simulations of the mechanical deformation of nanocrystallinemetals. Phys Rev B 1999;60:11971–83.
[92] Krasilnikov NA, Pakiela Z, Lojkowski W, Valiev RZ. Excellent mechanical properties of nickel processed by high pressuretechnique. Solid State Phenom 2003;94:51–4.
[93] Kury P, Horn-von M. Impact of thermal dependence of elastic constants on surface stress measurements. Rev Sci Instr2004;75:1357–8.
[94] Burenkov YA, Nikanorov SP. Temperature-dependence of elastic-constants of silicon. Fiz Tverd Tela 1974;16:1496–8.[95] Liu Q, Wang XP, Liang FJ, Wang JX, Fang QF. Hardness enhancement and oxidation resistance of nanocrystalline TiN/MoxC
multilayer films. Mater Res Bull 2006;41:1430–6.[96] Zhang CL, Shen HS. Temperature-dependent elastic properties of single-walled carbon nanotubes: prediction from
molecular dynamics simulation. Appl Phys Lett 2006;89:081904.[97] Dingreville R, Qu JM, Cherkaoui M. Surface free energy and its effect on the elastic behavior of nano-sized particles, wires
and films. J Mech Phys Solids 2005;53:1827–54.[98] Duckham A, Zhang DZ, Liang D, Luzin V, Cammarata RC, Leheny RL, et al. Temperature dependent mechanical properties
of ultra-fine grained FeCo2V. Acta Mater 2003;51:4083–93.[99] Huang JY, Chen S, Wang ZQ, Kempa K, Wang YM, Jo SH, et al. Superplastic carbon nanotubes. Nature 2006;439:281.
[100] Untiedt C, Yanson AI, Grande R, Rubio-Bollinger G, raı̈t NAG, Vieira S, et al. Calibration of the length of a chain of singlegold atoms. Phys Rev B 2002;66:085418.
[101] Legoas SB, Galvao DG, Rodrigues V, Ugarte D. Origin of anomalously long interatomic distances in suspended gold chains.Phys Rev Lett 2002;88:076105.
[102] Häkkinen H, Barnett RN, Scherbakov AG, Landman U. Nanowire gold chains: formation mechanisms and conductance. JPhys Chem 2000;B104:9063–6.
[103] Ayuela A, Puska MJ, Nieminen RM, Alonso JA. Charging mechanism for the bond elongation observed in suspended chainsof gold atoms. Phys Rev B 2005;72:161403.
[104] Wang LF, Zheng QS, Liu JZ, Jiang Q. Size dependence of the thin-shell model for carbon nanotubes. Phys Rev Lett2005;95:105501.
[105] Mayrhofer PH, Mitterer C, Hultman L, Clemens H. Microstructural design of hard coatings. Prog Mater Sci2006;51:1032–114.
[106] Sammalkorpi M, Krasheninnikov A, Kuronen A, Nordlund K, Kaski K. Mechanical properties of carbon nanotubes withvacancies and related defects. Phys Rev B 2004;70:245416.
[107] Singh VN, Mehta BR. Nanoparticle size-dependent lowering of temperature for phase transition from In(OH)(3) to In2O3. JNanosci Nanotechnol 2005;5:431–5.
[108] Kala S, Mehta BR. Size-dependent structural, optical and hydrogenation properties of Pr nanoparticle layers. J AlloysCompd 2007;431:10–5.
[109] Tripathi S, Brajpuriya R, Sharma A, Soni A, Okram GS, Chaudhari SM, et al. Thickness dependent structural, electronic, andoptical properties of Ge nanostructures. J Nanosci Nanotechnol 2008;8:2955–63.
[110] Modrow H. Tuning nanoparticle properties – the X-ray absorption spectroscopic point of view. Appl Spec Rev2004;39:183–290.
[111] Sun CQ. Surface and nanosolid core-level shift: impact of atomic coordination number imperfection. Phys Rev B2004;69:045105.
[112] Sun CQ, Pan LK, Chen TP, Sun XW, Li S, Li CM. Distinguishing the effect of crystal-field screening from the effect of valencerecharging on the 2p3/2 and 3d5/2 level energies of nanostructured copper. Appl Surf Sci 2006;252:2101–7.
[113] Sun CQ, Pan LK, Li CM, Li S. Size-induced acoustic hardening and optic softening of phonons in CdS, InP, CeO2, SnO2, and Sinanostructures. Phys Rev B 2005;72:134301.
[114] Gu MX, Pan LK, Tay BK, Sun CQ. Atomistic origin and temperature dependence of Raman optical redshift innanostructures: a broken bond rule. J Raman Spec 2007;38:780–8.
[115] Delph TJ. Local stresses and elastic constants at the atomic scale. Proc Roy Soc A-Math Phys Eng Sci 2005;461:1869–88.[116] Cormier J, Rickman JM, Delph TJ. Stress calculation in atomistic simulations of perfect and imperfect solids. J Appl Phys
2001;89:99–104.[117] Smoluchowski R. Anisotropy of the electronic work function of metals. Phys Rev 1941;60:661.[118] Finnis MW, Heine V. Theory of lattice contraction at aluminium surfaces. J Phys F 1974;4:L37.[119] Au Yeung TC, Gu MX, Sun CQ, Chen CK, Nosik V. Impact of surface bond-order loss on phonon dispersion relations and
thermal conductivity of cylindrical Si nanowires. Phys Rev B 2006;74:155417.[120] Au Yeung TC, Chiam TC, Chen CK, Sun CQ, Shangguan WZ, Kam CH. Effect of surface bond-order loss on the electrical
resistivity of metallic polycrystalline thin films. Phys Rev B 2005;72:55417.[121] Liang LH, Wei YG, Li BW. Size-dependent interface phonon transmission and thermal conductivity of nanolaminates. J
Appl Phys 2008;103:084314.[122] Sun CQ, Bai HL, Tay BK, Li S, Jiang EY. Dimension, strength, and chemical and thermal stability of a single C–C bond in
carbon nanotubes. J Phys Chem B 2003;107:7544–6.[123] Sun CQ, Pan LK, Fu YQ, Tay BK, Li S. Size dependent 2p-level shift of nanosolid silicon. J Phys Chem B 2003;107:5113–5.[124] Sun CQ, Li CM, Bai HL, Jiang EY. Melting point oscillation of a solid over the whole range of sizes. Nanotechnol
2005;16:1290–3.[125] Pauling L. Atomic radii and interatomic distances in metals. J Am Chem Soc 1947;69:542–53.[126] Goldschmidt VM. Ber Deut Chem Ges 1927;60:1270.

294 C.Q. Sun / Progress in Materials Science 54 (2009) 179–307
[127] Feibelman PJ. Relaxation of hcp(0001) surfaces: a chemical view. Phys Rev B 1996;53:13740–6.[128] Sinnot MJ. The solid state for engineers. New York: Wiley & Sons; 1963.[129] Kittel C. In: Hoboken NJ, editor. Introduction to solid state physics. J. Wiley; 2005.[130] Huang WJ, Sun R, Tao J, Menard LD, Nuzzo RG, Zuo JM. Coordination-dependent surface atomic contraction in
nanocrystals revealed by coherent diffraction. Nat Mater 2008;7:308–13.[131] Robinson I. Coherent diffraction: giant molecules or tiny crystals? Nat Mater 2008;7:275–6.[132] Miller JT, Kropf AJ, Zha Y, Regalbuto JR, Delannoy L, Louis C, et al. The effect of gold particle size on Au–Au bond length and
reactivity toward oxygen in supported catalysts. J Catal 2006;240:222–34.[133] Tsai Y-C, Hsu C-W, Yu J-SK, Lee GH, Wang Y, Kuo T-S. Remarkably short metal–metal bonds: a lantern-type quintuply
bonded dichromium(I) complex (p NA). Angew Chem Int Ed 2008;47. doi:10.1002/anie.200801286.[134] Noor A, Wagner FR, Kempe R. Metal–metal distances at the limit: a coordination compound with an ultrashort
chromium–chromium bond (p NA). Angew Chem Int Ed 2008;47. doi:10.1002/anie.200801160.[135] Jadzinsky PD, Calero G, Ackerson CJ, Bushnell DA, Kornberg RD. Structure of a thiol monolayer-protected gold
nanoparticle at 1.1 Å resolution. Science 2007;318:430–3.[136] Kobayashi Y, Fukui K, Enoki T, Kusakabe K, Kaburagi Y. Phys Rev 2005;B71:193406.[137] Rastei MV, Heinrich B, Limot L, Ignatiev PA, Stepanyuk VS, Bruno P, et al. Size-dependent surface states of strained cobalt
nanoislands on Cu(111). Phys Rev Lett 2007;99:246102.[138] Jiang Y, Wu K, Ma J, Wu B, Wang EG, Ebert Ph. Quantum size effects in the nonmetal to metal transition of two-
dimensional Al islands. Phys Rev B 2007;76:235434.[139] Niimi Y, Matsui T, Kambara H, Fukuyama H. STM/STS measurements of two-dimensional electronic states trapped around
surface defects in magnetic fields. Physica E 2006;34:100–3.[140] Stepanyuk VS, Klavsyuk AN, Niebergall L, Bruno P. End electronic states in Cu chains on Cu(111): ab initio calculations.
Phys Rev B 2005;72:153407.[141] Crain JN, Pierce DT. End states in one-dimensional atom chains. Science 2005;307:703–6.[142] Kobayashi Y, Kusakabe K, Fukui K, Enoki T. STM/STS observation of peculiar electronic states at graphite edges. Physica E
2006;34:678–81.[143] Nakada K, Fujita M, Dresselhaus G, Dresselhaus MS. Edge state in graphene ribbons: nanometer size effect and edge shape
dependence. Phys Rev B 1996;54:17954–61.[144] Mattila S, Leiro JA, Heinonen M, Laiho T. Core level spectroscopy of MoS2. Surf Sci 2006;600:1168–75.[145] Eguchi T, Kamoshida A, Ono M, Hamada M, Shoda R, Nishio T, et al. Surface states of a Pd monolayer formed on a Au(111)
surface studied by angle-resolved photoemission spectroscopy. Phys Rev B 2006;74:073403.[146] Ciston J, Marks LD, Feidenhans’l R, Bunk O, Falkenberg G, Lauridsen EM. Experimental surface charge density of the
Si(100)-2�1H surface. Phys Rev B 2006;74:085401.[147] Fauster T, Reuß Ch, Shumay IL, Weinelt M, Theilmann F, Goldmann A. Influence of surface morphology on surface states
for Cu on Cu(111). Phys Rev B 2000;61:16168–73.[148] Hermann A, Schwerdtfeger P, Schmidt WG. Theoretical study of the localization of excess electrons at the surface of ice. J
Phys: Condens Matter 2008;20:225003.[149] Kobayashi Y, Fukui K, Enoki T, Kusakabe K. Edge state on hydrogen-terminated graphite edges investigated by scanning
tunneling microscopy. Phys Rev B 2006;73:125415.[150] Novoselov KS, Geim AK, Morozov SV, Jiang D, Zhang Y, Dubonos SV, et al. Electric field effect in atomically thin carbon
films. Science 2004;306:666–9.[151] Lee C, Wei X, Kysar JW, Hone J. Measurement of the elastic properties and intrinsic strength of monolayer graphene.
Science 2008;321:385–8.[152] Mironets O, Meyerheim HL, Tusche C, Stepanyuk VS, Soyka E, Zschack P, et al. Direct evidence for mesoscopic relaxations
in cobalt nanoislands on Cu(001). Phys Rev Lett 2008;100:096103.[153] Ma DDD, Lee CS, Au FCK, Tong SY, Lee ST. Small-diameter silicon nanowire surfaces. Science 2003;299:1874–7.[154] Chacón E, Tarazona P, González LE. Intrinsic structure of the free liquid surface of an alkali metal. Phys Rev B
2006;74:224201.[155] Magnussen OM, Ocko BM, Regan MJ, Penanen K, Pershan PS. X-ray reflectivity measurements of surface layering in liquid
mercury. Phys Rev Lett 1995;74:4444–7.[156] Mo H, Evmenenko G, Kewalramani S, Kim K, Ehrlich SN, Dutta P. Observation of surface layering in a nonmetallic liquid.
Phys Rev Lett 2006;96:096107.[157] Tostmann H, DiMasi E, Pershan PS, Ocko BM, Shpyrko OG, Deutsch M. Phys Rev B 1999;59:783–91.[158] Sun WC, Chang HC, Wu BK, Chen YR, Chu CH, Chang SL, et al. Measuring interface strains at the atomic resolution in depth
using X-ray Bragg-surface diffraction. Appl Phys Lett 2006;89:091915.[159] Sun CQ, Wang Y, Tay BK, Li S, Huang H, Zhang Y. Correlation between the melting point of a nanosolid and the cohesive
energy of a surface atom. J Phys Chem B 2002;106:10701–5.[160] Ouyang G, Sun CQ, Zhu WG. Pressure stiffened Raman optical phonons in group III nitrides: a local bond average
approach. J Phys Chem 2008;B112:5027–31.[161] Gilbert B, Zhang H, Chen B, Kunz M, Huang F, Banfield JF. Compressibility of zinc sulfide nanoparticles. Phys Rev B
2006;74:115405.[162] Pravica M, Quine Z, Romano E. X-ray diffraction study of elemental thulium at pressures up to 86 GPa. Phys Rev B
2006;74:104107.[163] Chen B, Penwell D, Benedetti LR, Jeanloz R, Kruger MB. Particle-size effect on the compressibility of nanocrystalline
alumina. Phys Rev B 2002;66:144101.[164] Birch F. Finite elastic strain of cubic crystals. Phys Rev 1947;71:809–24;
Murnaghan FD. The compressibility of media under extreme pressures. Proc Nat Acad Sci 1944;30:244–7.[165] Chen ZW, Sun CQ, Ouyang G, Zhou YC. Size dependence of the pressure induced phase transition of nanostructures. J Phys
Chem C 2007;112:2423–7.

C.Q. Sun / Progress in Materials Science 54 (2009) 179–307 295
[166] Hu J, Cai W, Li C, Gan Y, Chen L. In situ X-ray diffraction study of the thermal expansion of silver nanoparticles in ambientair and vacuum. Appl Phys Lett 2005;86:151915.
[167] Li L, Zhang Y, Yang Y, Huang X, Li G. Diameter-depended thermal expansion properties of Bi nanowire arrays. Appl PhysLetts 2005;87:031912.
[168] Comaschi T, Balerna A, Mobilio S. Temperature dependence of the structural parameters of gold nanoparticlesinvestigated with EXAFS. Phys Rev B 2008;77:075432.
[169] Gu MX, Sun CQ, Zhou YC. Atomistic origin of the thermally induced bond expansion. J Phys Chem B 2008;112:7992–5.[170] Slack GA, Bartram SF. Thermal expansion of some diamond-like crystals. J Appl Phys 1975;46:89–98.[171] Reeber RR, Wang K. Lattice parameters and thermal expansion of GaN. J Mater Res 2000;15:40–4.[172] Cardona M, Thewalt MLW. Isotope effects on the optical spectra of semiconductors. Rev Mod Phys 2005;77:1174–224.[173] Bruls RJ, Hintzen HT, de With G, Metselaar R, van Miltenburg JC. The temperature dependence of the Grüneisen
parameters of MgSiN2, AlN and beta-Si3N4. J Phys Chem Solids 2001;62:783.[174] Sheleg AU, Savastenko WA. Izv. Akad. Nauk BSSR. Ser Fiz Mat Nauk 1976;3:126.[175] Nanda KK, Sahu SN, Behera SN. Liquid-drop model for the size-dependent melting of low-dimensional systems. Phys Rev
A 2002;66:013208.[176] Chen ZW, Gu MX, Sun CQ, Zhang XY, Liu RP. Ultrastiff carbide uncovered in first principles. Appl Phys Lett
2007;91:061905.[177] Born M. Thermodynamics of crystals and melting. J Chem Phys 1939;7:591–603.[178] Omar MA. Elementary solid state physics: principles and applications. New York: Addison-Wesley; 1975.[179] Sun CQ, Li CM, Li S, Tay BK. Breaking limit of atomic distance in an impurity-free monatomic chain. Phys Rev B
2004;69:245402.[180] Eskin DG, Suyitno, Katgerman L. Mechanical properties in the quasi-solid state and hot tearing of luminium alloys. Prog
Mater Sci 2004;49:629–711.[181] Campbell J. Castings. Oxford: Butterworth-Heinemann; 1991.[182] Gu MX, Pan LK, Au Yeung TC, Tay BK, Sun CQ. Atomistic origin for the thermally-driven softening of Raman optic phonons
in group III-nitrides. J Phys Chem C 2007;111:13606–10.[183] Zhao M, Zheng WT, Li JC, Wen Z, Gu MX, Sun CQ. Atomistic origin, temperature dependence, and responsibilities of
surface energetics: an extended broken bond rule. Phys Rev B 2007;75:085427.[184] Ibach H. Role of surface stress in reconstruction, epitaxial growth and stabilization of mesoscopic structures. Surf Sci Rep
1997;29:193–263.[185] Haiss W. Surface stress of clean and adsorbate-covered solids. Rep Prog Phys 2001;64:591–648.[186] Berger R, Delamarche E, Lang HP, Gerber C, Gimzewski JK, Meyer E, et al. Surface stress in the self-assembly of
alkanethiols on gold. Science 1997;276:2021–4.[187] Magomedov MN. The surface energy of nanocrystals. Rus J Phys Chem 2005;79:711–20.[188] Vogelsberger W. Thermodynamics of homogeneous nucleation under different constricts. Z Phys Chem
2001;215:1099–120.[189] Galanakis I, Papanikolaou N, Dederichs PH. Applicability of the broken-bond rule to the surface energy of the fcc metals.
Surf Sci 2002;511:1–12.[190] Desjonquères MC, Spanjaard D. Concepts in surface physics. Springer series in surface, vol. 30. Berlin,
Heidelberg: Springer-Verlag; 1993.[191] Jiang Q, Lu HM, Zhao M. Modelling of surface energies of elemental crystals. J Phys Condens Matter 2004;16:521–30.[192] Xie D, Wang M, Cao L. A simplified model to calculate the higher surface energy of free-standing nanocrystals. Phys Stat
Sol B 2005;242:R76–78.[193] Xie D, Wang MP, Qi WH. A simplified model to calculate the surface-to-volume atomic ratio dependent cohesive energy
of nanocrystals. J Phys: Condens Matter 2004;16:L401–405.[194] Alerhand OL, Joannopoulos JD, Mele EJ. Thermal amplitudes of surface atoms on Si(111) 2 � 1 and Si(001) 2 � 1. Phys
Rev B 1989;39:12622–9.[195] Janssen GCAM, Tichelaar FD, Visser CCG. Stress gradients in CrN coatings. J Appl Phys 2006;100:093512.[196] Uryadov VG, Aristova NV, Ofitserov EN. The temperature dependence of surface tension of organic noeletrolytes. Rus J
Phys Chem 2005;79:2016–9.[197] Cao Z, Zhang X. Size-dependent creep behaviour of plasma-enhanced chemical vapour deposited silicon oxide films. J
Phys D: Appl Phys 2006;39:5054–63.[198] Garcia-Manyes S, Güell AG, Gorostiza P, Sanz F. Nanomechanics of silicon surfaces with atomic force microscopy: an
insight to the first stages of plastic deformation. J Chem Phys 2005;123:114711.[199] Wang YH, Moitreyee MR, Kumar R, Wu SY, Xie JL, Yew P, et al. The mechanical properties of ultra-low-dielectric-constant
films. Thin Solid Films 2004;462–463:227–30.[200] Zhou LG, Huang HC. Are surfaces elastically softer or stiffer? Appl Phys Lett 2004;88:1940–2.[201] Mesarovic SD, McCarter CM, Bahr DF, Radhakrishnan H, Richards RF, Richards CD, et al. Mechanical behavior of a carbon
nanotube turf. Scripta Mater 2007;56:157–60.[202] Gu MX, Sun CQ, Chen Z, Au Yeung TC, Li S, Tan CM, et al. Size, temperature and bond nature dependence of Young’s
modulus and its derivatives on extensibility, Debye temperature, and specific heat of nanostructures. Phys Rev B2007;75:125403.
[203] Kopycinska-Muller M, Geiss RH, Muller J, Hurley DC. Elastic-property measurements of ultrathin films using atomic forceacoustic microscopy. Nanotechnol 2005;16:703–9.
[204] Brazhkin V, Dubrovinskaia N, Nicol M, Novikov N, Riedel R, Solozhenko V, et al. From our readers: what does’harder thandiamond’ mean? Nat Mater 2004;3:576–7.
[205] Chung SM, Yap AUJ. Effects of surface finish on indentation modulus and hardness of dental composite restoratives.Dental Mater 2005;21:1008–16.
[206] Lu C, Mai YW, Tam PL, Shen YG. Nanoindentation-induced elastic–plastic transition and size effect in-aAl2O3(0001). PhilMag Lett 2007;87:409–15.

296 C.Q. Sun / Progress in Materials Science 54 (2009) 179–307
[207] Nix WD, Gao H. Indentation size effects in crystalline materials: a law for strain gradient plasticity. J Mech Phys Sol1998;46:411–25.
[208] Graca S, Colaco R, Vilar R. Indentation size effect in nickel and cobalt laser clad coatings. Surf Coat Technol2007;202:538–48.
[209] Sun CQ, Li S, Li CM. Impact of bond-order loss on surface and nanosolid mechanics. J Phys Chem B 2005;109:415–23.[210] Fujii H, Matsumoto T, Izutani S, Kiguchi S, Nogi K. Surface tension of molten silicon measured by icrogravity oscillating
drop method and improved sessile drop method. Acta Mater 2006;54:1221–5.[211] Zhao Q, Liu Y, Abel EW. Effect of temperature on the surface free energy of amorphous carbon films. J Colloid Interf Sci
2004;280:174–83.[212] Xiao F, Yang R, Zhang C. Surface tension of molten Ni–W and Ni–Cr alloys. Mater Sci Eng B 2006;132:183–6.[213] Halas S, Durakiewicz T. Temperature dependence of the surface energy of mercury from 0 to 250 degrees C. J Phys:
Condens Matter 2002;14:L735–737.[214] Nakanishi H, Nakazato K, Terashima K. Surface tension variation of molten silicon measured by ring tensionmetry
technique and related temperature and impurity dependence. Jpn J Appl Phys 2000;39:6487–9. Part 1.[215] Lu HM, Jiang Q. Surface tension and its temperature coefficient for liquid metals. J Phys Chem B 2005;109:15463–8.[216] Rosner-Kuhn M, Hofmeister WH, Kuppermann G, Bayuzick RJ, Frohberg MG. Investigations of the influence of oxygen on
the surface tension of zirconium by the oscillating drop technique. Surf Sci 1999;443:159–64.[217] Lee J, Shimoda W, Tanaka T. Temperature and oxygen partial pressure dependences of the surface tension of liquid Sn–Ag
and Sn–Cu lead-free solder alloys. Monatsh Chem 2005;136:1829–34.[218] Wang HP, Yao WJ, Cao CD, Wei B. Surface tension of superheated and undercooled liquid Co–Si alloy. Appl Phys Lett
2004;85:3414–6.[219] Fiori L, Ricci E, Arato E, Costa P. Dynamic surface tension measurements on a molten metal-oxygen system: the behavior
of the temperature coefficient of the surface tension of molten tin. J Mater Sci 2005;40:2155–9.[220] Sun CQ. Oxidation electronics: bond-band-barrier correlation and its applications. Prog Mater Sci 2003;48:521–685.[221] Przyborowski M, Hibiya T, Eguchi M, Egry I. Surface-tension measurement of molten silicon by the oscillating drop
method using electromagnetic-leviation. J Cryst Growth 1995;151:60–5.[222] Fujii H, Matsumoto T, Hata N, Nakano T, Kohno M, Nogi K. Surface tension of molten silicon measured by the
electromagnetic levitation method under microgravity. Metall Mater Trans A 2000;31:1585–9.[223] Paradis PF, Ishikawa T. Surface tension and viscosity measurements of liquid and undercooled alumina by containerless
techniques. Jpn J Appl Phys 2005;44:5082–5.[224] Sauerland S, Lohofer G, Egry I. Surface tension measurements on levitated aspherical liquid nickel drops. Therm Acta
1993;218:445–53.[225] Keene BJ, Mills KC, Brooks RF. Surface properties of liquid metals and their effects on weldability. Mater Sci Technol
1985;1:568–71.[226] Schade J, McLean A, Miller WA. Surface tension measurements on oscillating droplets of undercooled liquid metals and
alloys. In: Collins EW, Koch CC, editors. Proceedings of the 115th annual meeting of IUS-AIME, New Orleans; 1986. p. 233.[227] Han XJ, Wang N, Wei B. Thermophysical properties of undercooled liquid cobalt. Philos Mag Lett 2002;82:451–9.[228] Keene BJ. Review of data for the surface-tension of pure metals. Int Mater Rev 1993;38:157–92.[229] Eichel RA, Egry I. Surface tension and surface segregation of liquid cobalt–iron and cobalt–copper alloys. Z Metallkd
1999;90:371–5.[230] Yao WJ, Han XJ, Chen M, Wei B, Guo ZY. Surface tension of undercooled liquid cobalt. J Phys: Condens Matter
2002;14:7479–85.[231] Lee J, Shimoda W, Tanaka T. Temperature dependence of surface tension of liquid Sn–Ag, In–Ag, and In–Cu alloys. Meas
Sci Technol 2005;16:438–42.[232] Paradis PF, Ishikawa T, Fujii R, Yoda S. Surface tension and viscosity of liquid and undercooled tantalum measured by a
containerless method. J Appl Phys 2005;97:053506.[233] Paradis PF, Ishikawa T, Fujii R, Yoda S. Physical properties of liquid and undercooled tungsten by levitation techniques.
Appl Phys Lett 2005;86:041901.[234] Tanaka T, Nakamoto M, Oguni R, Lee J, Hara S. Measurement of the surface tension of liquid Ga, Bi, Sn, In and Pb by the
constrained drop method. Z Metallkunde 2004;95:818–22.[235] Lee J, Shimoda W, Tanaka T. Surface tension and its temperature coefficient of liquid Sn–X (X = Ag, Cu) alloys. Mater Trans
2004;45:2864–70.[236] http://hyperphysics.phy-astr.gsu.edu/hbase/surten.html#c3.[237] Sauer BB, Dee GT. Surface tension and melt cohesive energy density of polymer melts including high melting and high
glass transition polymers. Macromolecules 2002;35:7024–30.[238] Halicioglu T. Calculation of surface energies for low index planes of diamond. Surf Sci 1991;259:L714–718.[239] Nanda KK. Bulk cohesive energy and surface tension from the size-dependent evaporation study of nanoparticles. Appl
Phys Lett 2005;87:021909.[240] Chiu YP, Huang LW, Wei CM, Chang CS, Tsong TT. Magic numbers of atoms in surface-supported planar clusters. Phys Rev
Lett 2006;97:165504.[241] Hwang IS, Chang SH, Fang CK, Chen LJ, Tsong TT. Observation of finite-size effects on a structural phase transition of 2D
nanoislands. Phys Rev Lett 2004;93:106101.[242] Sun CQ, Shi Y, Li CM, Li S, Au Yeung TC. Size-induced undercooling and overheating in phase transitions in bare and
embedded clusters. Phys Rev B 2006;73:075408.[243] Magomedov MN. Dependence of the surface energy on the size and shape of a nanocrystal. Phys Solid State
2004;46:954–68.[244] Solon J, Pecreaux J, Girard P, Marie-Claude F, Prost J, Bassereau P. Negative tension induced by lipid uptake. Phys Rev Lett
2006;97:098103.[245] Dodson BW. Many-body surface strain and surface reconstructions in fcc transition metals. Phys Rev Lett
1998;60:2288–91.

C.Q. Sun / Progress in Materials Science 54 (2009) 179–307 297
[246] Streitz FH, Cammarata RC, Sieradzki K. Surface-stress effects on elastic properties. I. Thin metal films. Phys Rev B1994;49:10699–706.
[247] Zhang JM, Li HY, Xu KW. Reconstructed (110) surfaces of FCC transition metals. J Phys Chem Solids 2006;67:1623–8.[248] Baraldi A, Lizzit S, Bondino F, Comelli G, Rosei R, Sbraccia C, et al. Thermal stability of the Rh(110) missing-row
reconstruction: combination of real-time core-level spectroscopy and ab initio modeling. Phys Rev B 2005;72:075417.[249] Robinson IK, Saint-Lager MC, Dolle P, Boutet S, de Santis M, Baudoing-Savois R. Relaxations in the 1 � 5 reconstruction of
Pt(110). Surf Sci 2005;575:321–9.[250] Rost MJ, van Albada SB, Frenken JWM. Thermally activated domain boundary formation on a missing row reconstructed
surface: Au(110). Surf Sci 2003;547:71–84.[251] Nduwimana A, Gong XG, Wang XQ. Relative stability of missing-row reconstructed (110) surfaces of noble metals. Appl
Surf Sci 2003;219:129–35.[252] Sun CQ. Electronic process of Cu(Ag, V, Rh)(001) surface oxidation: atomic valence alteration and bonding kinetics. Appl
Surf Sci 2005;246:6–13.[253] Sun CQ. The sp hybrid bonding of C, N and O to the fcc(001) surface of nickel and rhodium. Surf Rev Lett 2000;7:347–63.[254] Kim S, Kihm KD. Effect of adsorption-induced surface stress change on the stiffness of a microcantilever used as a salinity
detection sensor. Appl Phys Lett 2008;93:081911.[255] Sander D, Ibach H. Experimental determination of adsorbate-induced surface stress: oxygen on Si(111) and Si(001). Phys
Rev B 1991;43:4263–7.[256] Sander D, Linke U, Ibach H. Adsorbate-induced surface stress: sulfur, oxygen and carbon on Ni(100). Surf Sci
1992;272:318–25.[257] Grossmann A, Erley W, Ibach H. Adsorbate-induced surface stress and surface reconstruction: oxygen, sulfur and carbon
on Ni(111). Surf Sci 1995;337:183–9.[258] Bombis C, Moiseeva M, Ibach H. Adsorbate-induced surface stress and self-assembly of (2 � 1)O on Cu(110) measured
with an STM. Phys Rev B 2005;72:245408.[259] Hwang KS, Eom K, Lee JH, Chun DW, Cha BH, Yoon DS, et al. Dominant surface stress driven by biomolecular interactions
in the dynamical response of nanomechanical microcantilevers. Appl Phys Lett 2006;89:173905.[260] Grossmann A, Erley W, Ibach H. Adsorbate-induced surface stress: CO on Ni(100) and Ni(111). Surf Sci
1994;313:209–14.[261] Gavriljuk VG. Nitrogen in iron and steel. Isij Int 1996;36:738–45.[262] Zheng WT, Sun CQ. Electronic process of nitridation: mechanism and applications. Prog Solid State Chem 2006;34:1–20.[263] Fu YQ, Yan B, Loh NL, Sun CQ, Hing P. Deposition of diamond coating on pure titanium using micro-wave plasma assisted
chemical vapor deposition. J Mater Sci 1999;34:2269–83.[264] Radu I, Singh R, Scholz R, Gösele U, Christiansen S, Brüderl G, et al. Formation of nanovoids in high-dose hydrogen
implanted GaN. Appl Phys Lett 2006;89:031912.[265] Lee JK, Lin Y, Jia QX, Höchbauer T, Jung HS, Shao L, et al. Role of strain in the blistering of hydrogen-implanted silicon. Appl
Phys Lett 2006;89:101901.[266] Lu GH, Zhang Y, Deng S, Wang T, Kohyama M, Yamamoto R, et al. Origin of intergranular embrittlement of Al alloys
induced by Na and Ca segregation: grain boundary weakening. Phys Rev B 2006;73:224115.[267] Fu YQ, Sun CQ, Yan B, Du H. Carbon turns the tensile surface stress of Ti to be compressive. J Phys D: Appl Phys
2001;34:L129–132.[268] Li JG, Qin Y, Kou XL, Huang JJ. The microstructure and magnetic properties of Ni nanoplatelets. Nanotechnol
2004;15:982–6.[269] Sun CQ. O–Cu(001): I. Binding the signatures of LEED STM and PES in a bond-forming way. Surf Rev Lett 2001;8:367–402.[270] Sun CQ. Exposure-resolved VLEED from the O–Cu(001): bonding kinetics. Vacuum 1997;48:535–41.[271] Mercer JR, Finetti P, Leibsle FM, McGrath R, Dhanak VR, Baraldi A, et al. STM and SPA–LEED studies of O-induced
structures on Rh(100) surfaces. Surf Sci 1996;352–354:173–8.[272] Leibsle FM. STM study of the (2 � 2) p4g nitrogen-induced surface reconstruction on Ni(100). Surf Sci 1993;297:98–105.[273] Klink C, Olesen L, Besenbacher F, Stensgaad I, Lagsgaard E, Lang ND. Interaction of C with Ni(100): atomic-resolved
studies of the ‘clock’ reconstruction. Phys Rev Lett 1993;71:4350–3.[274] Ibach H. Adsorbate-induced surface stress. J Vac Sci Technol A 1994;12:2240–3.[275] Sun CQ, Fu YQ, Yan B, Hsieh JH, Lau SP, Sun XW, et al. Improving diamond-metal adhesion with graded TiCN interlayers. J
Appl Phys 2002;91:2051–4.[276] Schoch RB, Han J, Renaud P. Transport phenomena in nanofluidics. Rev Mod Phys 2008;80:839–83.[277] Wong KFV, Kurma T. Transport properties of alumina nanofluids. Nanotechnology 2008;19:345702.[278] Baldessari F. Electrokinetics in nanochannels part I. Electric double layer overlap and channel-to-well equilibrium. J
Colloid Interf Sci 2008. doi:10.1016/j.jcis.2008.06.007.[279] Thomas JA, McGaughey AJH. Reassessing fast water transport through carbon nanotubes. Nano Lett 2008;8:2788–93.[280] Whitby M, Cagnon L, Thanou M, Quirke N. Enhanced fluid flow through nanoscale carbon pipes. Nano Lett
2008;8:2632–7.[281] Majumder M, Chopra N, Andrews R, Hinds BJ. Nanoscale hydrodynamics – enhanced flow in carbon nanotubes. Nature
2005;438:44.[282] Gnecco E, Maier S, Meyer E. Superlubricity of dry nanocontacts. J Phys Condens Matter 2008;20:354004.[283] Socoliuc A, Gnecco E, Maier S, Pfeiffer O, Baratoff A, Bennewitz R, et al. Atomic-scale control of friction by actuation of
nanometer-sized contacts. Science 2006;313:207–10.[284] Cumings J, Zettl A. Low-friction nanoscale linear bearing realized from multiwall carbon nanotubes. Science
2000;289:602–4.[285] Socoliuc A, Gnecco E, Bennewitz R, Meyer E. Transition from stick-slip to continuous sliding in atomic friction: entering a
new regime of ultralow friction. Phys Rev Lett 2004;92:134301.[286] Erdemir A, Martin JM. Superlubicity. Elsevier; 2007, ISBN 9780444527721.[287] Lee C, Choi CH, Kim CJ. Structured surfaces for a giant liquid slip. Phys Rev Lett 2008;101:064501.

298 C.Q. Sun / Progress in Materials Science 54 (2009) 179–307
[288] Li XM, Reinhoudt D, Crego-Calama M. What do we need for a superhydrophobic surface? A review on the recent progressin the preparation of superhydrophobic surfaces. Chem Soc Rev 2007;36:1350–68.
[289] Li W. Superhydrophobic surfaces: adhesive strongly to water? Adv Mater 2007;19:3421.[290] Sun RD, Nakajima A, Fujishima A, Watanabe T, Hashimoto K. Photoinduced surface wettability conversion of ZnO and
TiO2 thin films. J Phys Chem B 2001;105:1984–90.[291] Martines E, Seunarine K, Morgan H, Gadegaard N, Wilkinson CDW, Riehle MO. Superhydrophobicity and
superhydrophilicity of regular nanopatterns. Nano Lett 2005;5:2097–103.[292] Mugele F, Baret J-C. Electrowetting: from basics to applications. J Phys: Condens Matter 2005;17:R705–74.[293] Abbas Z, Labbez C, Nordholm S, Ahlberg E. Size-dependent surface charging of nanoparticles. J Phys Chem C
2008;112:5715–23.[294] Coey JMD. Dilute magnetic oxides. Current Opin Solid State Mater Sci 2006;10:83–92.[295] Roduner E. Size matters: why nanomaterials are different. Chem Soc Rev 2006;35:583–92.[296] Bai XM, Zheng WT, An T. Superhard nano-multilayers and nanocomposite coatings. Prog Nat Sci 2005;15:97–107.[297] PalDey S, Deevi SC, layer Single. multilayer wear resistant coatings of (Ti, Al)N: a review. Mater Sci Eng A
2003;342:58–79.[298] Veprek S, Argon AS. Towards the understanding of mechanical properties of super- and ultrahard nanocomposites. J Vac
Sci Technol B 2002;20:650–64.[299] Schaaf P. Laser nitriding of metals. Prog Mater Sci 2002;47:1–161.[300] Veprek S. The search for novel, superhard materials. J Vac Sci Technol A 1999;17:2401–20.[301] Andrievski RA. Particulate nanostructured silicon nitride and titanium nitride. ACS Sympos Ser 1996;622:294–301.[302] Berberich F, Matz W, Kreissig U, Schell N, Mucklich A. Mechanism of degradation of surface hardening at elevated
temperature in TiAlV-alloys by in situ synchrotron radiation diffraction. Nucl Instr Methods Phys Res B 2003;199:54–8.[303] Sjöström H, Stafström S, Boman M, Sundgren JE. Superhard and elastic carbon nitride thin films having fullerenelike
microstructure. Phys Rev Lett 1995;75:1336–9.[304] Wang C, Yang S, Li H, Zhang J. Elastic properties of a-C:N:H films. J Appl Phys 2007;101:013501.[305] Zhao ZW, Tay BK, Sun CQ, Ligatchev V. Oxygen lone-pair states near the valence-band edge of aluminum oxide thin films.
J Appl Phys 2004;95:4147–50.[306] Sun CQ. A model of bonding and band-forming for oxides and nitrides. Appl Phys Lett 1998;72:1706–8.[307] Zhang Y, Sun H, Chen CF. Strain dependent bonding in solid C3N4: high elastic moduli but low strength. Phys Rev B
2006;73:064109.[308] Champion Y, Langlois C, Gue’rin-mailly S, Langlois P, Bonnentien JL, Hytch MJ. Near-perfect elastoplasticity in pure
nanocrystalline copper. Science 2003;300:310–1.[309] Ohnishi H, Kondo Y, Takayanagi K. Quantized conductance through individual rows of suspended gold atoms. Nature
(London) 1998;395:780–3.[310] Rao CNR, Kulkarni GU, Thomas PJ, Edwards PP. Size-dependent chemistry: properties of nanocrystals. Chem Eur J
2002;8:29–35.[311] Fioravante F, Nunes RW. Semiconducting chains of gold and silver. Appl Phys Lett 2007;91:223115.[312] Takai Y, Kadwasaki T, Kimura Y, Ikuta T, Shimizu R. Dynamic observation of an atom-sized gold wire by phase electron
microscopy. Phys Rev Lett 2001;87:106105.[313] Yanson AI, Rubio-Bollinger G, van den Brom HE, Graı̈t NA, van Ruitenbeek JM. Formation and manipulation of a metallic
wire of single gold atoms. Nature (London) 1998;395:783–5.[314] Kizuka T. Atomic configuration and mechanical and electrical properties of stable gold wires of single-atom width. Phys
Rev B 2008;77:155401.[315] Smit RHM, Untiedt C, Yanson AI, van Ruitenbeek JM. Common origin for surface reconstruction and the formation of
chains of metal atoms. Phys Rev Lett 2001;87:266102.[316] Sørensen MR, Brandbyge M, Jacobsen KW. Mechanical deformation of atomic-scale metallic contacts: structure and
mechanisms. Phys Rev B 1998;57:3283–94.[317] Sánchez-Portal D, Artacho E, Junquera J, Ordejón P, Garcı́a A, Soler JM. Stiff monatomic gold wires with a spinning zigzag
geometry. Phys Rev Lett 1999;83:3884–7.[318] Torres JA, Tosatti E, Corso ADal, Ecorcolessi F, Kohanoff JJ, Di Tolla FD, et al. The puzzling stability of monatomic gold
wires. Surf Sci 1999;426:L441–446.[319] Ikemoto H, Miyanaga T. Extended X-ray absorption fine structure study of local structure and atomic correlations of
tellurium nanoparticles. Phys Rev Lett 2007;99:165503.[320] Wang XW, Fei GT, Wang B, Wang M, and Zhang LD, In situ X-ray diffraction study on the interatomic force of Ni
nanowires, Solid State Sci, in press.[321] Rodrigues V, Ugarte D. Real-time imaging of atomistic process in one-atom-thick metal junctions. Phys Rev B
2001;63:073405.[322] Koizumi H, Oshima Y, Kondo Y, Takayanagi K. Quantitative high-resolution microscopy on a suspended chain of gold
atoms. Ultramicroscopy 2001;88:17–24.[323] Novaes FD, da Silva AJR, da Silva EZ, Fazzio A. Effect of impurities in the large Au–Au distances in gold nanowires. Phys
Rev Lett 2003;90:036101.[324] Egerton RF, Li P, Malac M. Radiation damage in the TEM and SEM. Micron 2004;35:399–409.[325] Bahn S, Jacobsen KW. Chain formation of metal atoms. Phys Rev Lett 2001;87:266101.[326] Coura PZ, Legoas SB, Moreira AS, Sato F, Rodrigues V, Dantas SO, et al. On the structural and stability features of linear
atomic suspended chains formed from gold nanowires stretching. Nano Lett 2004;4:1187–91.[327] Jiang Q, Zhao M, Li JC. Formation of monatomic chains of metallic elements. Appl Surf Sci 2003;206:331–5.[328] Kocks UF, Argon AS, Ashby AS. Thermodynamics and kinetics of slip. Prog Mater Sci 1975;19:1–281.[329] Shi FG. Size-dependent thermal vibrations and melting in nanocrystals. J Mater Res 1994;9:1307–13.[330] Ohgi T, Fujita D. Consistent size dependency of core-level binding energy shifts and single-electron tunneling effects in
supported gold nanoclusters. Phys Rev B 2002;66:115410.

C.Q. Sun / Progress in Materials Science 54 (2009) 179–307 299
[331] Howard A, Clark DNS, Mitchell CEJ, Egdell RG, Dhanak VR. Initial and final state effects in photoemission from Aunanoclusters on TiO2(110). Surf Sci 2002;518:210–24.
[332] Salmon M, Ferrer S, Jazzar M, Somojai GA, et al. Core-valence-band energy-level shifts in small two-dimensional islandsof gold deposited on Pt(100): the effect of step-edge and bulk atoms. Phys Rev B 1998;28:1158–60.
[333] Zhang P, Sham TK. X-ray studies of the structure and electronic behavior of alkanethiolate-capped gold nanoparticles: theinterplay of size and surface effects. Phys Rev Lett 2003;90:45502.
[334] Castro T, Reifenberger R, Choi E, Andres RP. Size-dependent melting temperature of individual nanometer-sized metallicclusters. Phys Rev B 1990;42:8548–56.
[335] Buffat P, Borel JP. Size effect on melting temperature of gold particles. Phys Rev A 1976;13:2287–98.[336] Dick K, Dhanasekaran T, Zhang Z, Meisel D. Size-dependent melting of silica-encapsulated gold nanoparticles. J Am Chem
Soc 2002;124:2312–7.[337] Nakajima K, Watabe H, Nishi T. Single polymer chain rubber elasticity investigated by atomic force microscopy. Polymer
2006;47:2505–10.[338] Ma G, Ren Y, Zhou ZR, Li F, Cheng HM, Xiao T, et al. How long can single-walled carbon nanotube ropes last under static
and dynamic fatigue? Appl Phys Lett 2008;92:083105.[339] Baughman RH. Materials science – muscles made from metal. Science 2003;300:268–9.[340] Crabtree RH. Chemistry – a new type of hydrogen bond. Science 1998;282:2000–1.[341] Agrawal PM, Sudalayandi BS, Raff LM, Komanduri R. Comparison of different methods of Young’s modulus determination
for single-wall carbon nanotubes (SWCNT) using molecular dynamics (MD) simulations. Comput Mater Sci2006;38:271–81.
[342] Asaka K, Kizuka T. Atomistic dynamics of deformation, fracture, and joining of individual single-walled carbon nanotubes.Phys Rev B 2005;72:115431.
[343] Nakajima M, Arai F, Fukuda T. In situ measurement of Young’s modulus of carbon nanotubes inside a TEM through ahybrid nanorobotic manipulation system. IEEE Nanotech 2006;5:243–8.
[344] Krishnan A, Dujardin E, Ebbesen TW, Yianilos PN, Treacy MMJ. Young’s modulus of single-walled nanotubes. Phys Rev B1998;58:14013–9.
[345] Enomoto K, Kitakata S, Yasuhara T, Ohtake N, Kuzumaki T, Mitsuda Y. Measurement of Young’s modulus of carbonnanotubes by nanoprobe manipulation in a transmission electron microscope. Appl Phys Lett 2006;88:153115.
[346] Falvo MR, Clary GJ, Taylor II RM, Chi V, Brooks Jr EP, Washburn S, et al. Bending and buckling of carbon nanotubes underlarge strain. Nature (London) 1997;389:582–4.
[347] Thostenson ET, Ren Z, Chou TW. Advances in the science and technology of carbon nanotubes and their composites: areview. Compos Sci Technol 2001;61:1899–912.
[348] Salvetat JP, Andrew G, Briggs D, Bonard JM, Bacsa RR, Kulik A, et al. Elastic and shear moduli of single-walled carbonnanotube ropes. Phys Rev Lett 1999;82:944–7.
[349] Lu JP. Elastic properties of carbon nanotubes and nanoropes. Phys Rev Lett 1997;79:1297–300.[350] Treacy MMJ, Ebbesen TW, Gibson JM. Exceptionally high Young’s modulus observed for individual carbon nanotubes.
Nature (London) 1996;381:678–80.[351] Zhang G, Li BW. Wall”thickness” effects on Raman spectrum shift thermal conductivity and Young’s modulus of single-
walled nanotubes. J Phys Chem B 2005;109:23823–6.[352] Wang CY, Zhang LC. An elastic shell model for characterizing single-walled carbon nanotubes. Nanotechnology
2008;19:195704.[353] Scarpa F, Adhikari S. A mechanical equivalence for Poisson’s ratio and thickness of C–C bonds in single wall carbon
nanotubes. J Phys D: Appl Phys 2008;41:085306.[354] Hernández E, Goze C, Bernier P, Rubio A. Elastic properties of C and BxCyNz composite nanotubes. Phys Rev Lett
1998;80:4502–5.[355] Yakobson BI, Brabec CJ, Bernholic J. Nanomechanics of carbon tubes: instabilities beyond linear response. Phys Rev Lett
1996;76:2511–4.[356] Vodenitcharova T, Zhang LC. Effective wall thickness of a single-walled carbon nanotube. Phys Rev B 2003;68:165401.[357] Zhou X, Zhou J, Ou-Yang ZC. Strain energy and Young’s modulus of single-wall carbon nanotubes calculated from
electronic energy-band theory. Phys Rev B 2000;62:13692–6.[358] Tu ZC, Ou-yang ZC. Single-walled and multiwalled carbon nanotubes viewed as elastic tubes with the effective Young’s
moduli dependent on layer number. Phys Rev B 2002;65:233407.[359] Terrones M, Terrones H, Banhart F, Charlier JC, Ajayan PM. Coalescence of single-walled carbon nanotubes. Science
2000;288:1226–9.[360] An B, Fukuyama S, Yokogawa K, Yoshimura M. Surface superstructure of carbon nanotubes on highly oriented pyrolytic
graphite annealed at elevated temperatures. Jpn J Appl Phys 1998;37:3809–11. P1.[361] Nikolaev P, Thess A, Rinzler AG, Colbert DT, Smalley RE. Diameter doubling of single-wall nanotubes. Chem Phys Lett
1997;226:422–6.[362] Metenier K, Bonnamy S, Beguin F, Journet C, Bernier P, Lamy de La Chapelle M, et al. Coalescence of single-walled carbon
nanotubes and formation of multi-walled carbon nanotubes under high-temperature treatments. Carbon2002;40:1765–73.
[363] Sloan J, Kirkland AI, Hutchison JL, H Green ML. Structural characterization of atomically regulated nanocrystals formedwithin single-walled carbon nanotubes using electron microscopy. Acc Chem Res 2002;35:1054–62.
[364] Andrews R, Jacques D, Qian D, Dickey EC. Purification and structural annealing of multiwalled carbon nanotubes atgraphitization temperatures. Carbon 2001;39:1681–7.
[365] Bandow S, Asaka S, Saito Y, Rao AM, Grigorian L, Richter E, et al. Effect of the growth temperature on the diameterdistribution and chirality of single-wall carbon nanotubes. Phys Rev Lett 1998;80:3779–82.
[366] Bom D, Andrews R, Jacques D, Anthony J, Chen BL, Meier MS, et al. Thermogravimetric analysis of the oxidation ofmultiwalled carbon nanotubes: evidence for the role of defect sites in carbon nanotube chemistry. Nano Lett2002;2:615–9.

300 C.Q. Sun / Progress in Materials Science 54 (2009) 179–307
[367] Ajayan PM, Terrones M, de la Guardia A, Huc V, Grobert N, Wei BQ, et al. Nanotubes in a flash – ignition andreconstruction. Science 2002;296:705.
[368] Sun CQ, Fu SY, Ni YG. Dominance of broken bonds and nonbondtang unpaired electrons in the band gap expansion andedge states generation of graphene ribbons. J Phys Chem C, in press.
[369] Zhao QZ, Nardelli MB, Bernholc J. Ultimate strength of carbon nanotubes: a theoretical study. Phys Rev B2002;65:144105.
[370] Nardelli MB, Yakobson BI, Bernholc J. Mechanism of strain release in carbon nanotubes. Phys Rev B 1998;57:R4277–80.[371] Walters DA, Ericson LM, Casavant MJ, Liu J, Colbert DT, Smith KA, et al. Elastic strain of freely suspended single-wall
carbon nanotube ropes. Appl Phys Lett 1999;74:3803–5.[372] Nardelli MB, Yakobson BI, Bernholc J. Brittle and Ductile behavior in carbon nanotubes. Phys Rev Lett 1998;81:4656–9.[373] Orlikowski D, Nardelli MB, Bernholc J, Roland C. Ad-dimers on strained carbon nanotubes: a new route for quantum dot
formation? Phys Rev Lett 1999;83:4132–5.[374] Calvert P. Nanotube composites – a recipe for strength. Nature 1999;399:210–1.[375] Salvetat JP, Kulik AJ, Bonard JM, Andrew G, Briggs D, St ¨ockli T, et al. Elastic modulus of ordered and disordered
multiwalled carbon nanotubes. Adv Mater 1999;11:161–5.[376] Dowling NE. Mechanical behavior of materials: engineering methods for deformation, fracture, and fatigue. Upper Saddle
River, NJ: Prentice-Hall; 1999.[377] Ashby MF, Jones DRH. Engineering materials_pergamon, vol. 1. Oxford; 1980.[378] Gaire C, Ye DX, Tang F, Picu RC, Wang GC, Lu TM. Mechanical testing of isolated amorphous silicon slanted nanorods. J
Nanosci Nanotechnol 2005;5:1893–7.[379] Wu B, Heidelberg A, Boland JJ, Sader JE, Sun X, Li Y. Microstructure-hardened silver nanowires. Nano Lett 2006;6:468–72.[380] Wu XF, Dzenis YA. Size effect in polymer nanofibers under tension. J Appl Phys 2007;102:044306.[381] Shin MK, Kim SI, Kim SJ, Kim SK, Lee H, Spinks GM. Size-dependent elastic modulus of single electroactive polymer
nanofibers. Appl Phys Lett 2006;89:231929.[382] Astrom JA, Krasheninnikov AV, Nordlund K. Carbon nanotube mats and fibers with irradiation-improved mechanical
characteristics: atheoretical model. Phys Rev Lett 2004;93:215503.[383] Kis A, Csányi G, Salvetat J-P, Lee Thien-Nga, Couteau E, Kulik AJ, et al. Reinforcement of single-walled carbon nanotube
bundles by intertube bridging. Nature Mater 2004;3:153–7.[384] Dash JG. History of the search for continuous melting. Rev Mod Phys 1999;71:1737–43.[385] Lu L, Sui ML, Lu K. Superplastic extensibility of nanocrystalline copper at room temperature. Science 2000;287:1463–6.[386] Wang YM, Ma E, Chen MW. Enhanced tensile ductility and toughness in nanostructured Cu. Appl Phys Lett
2002;80:2395–7.[387] Valiev RZ, Islamgaliev RK, Alexandrov IV. Bulk nanostructured materials from severe plastic deformation. Prog Mater Sci
2000;45:103–89.[388] Han XD, Zheng K, Zhang YF, Zhang X, Zhang Z, Wang ZL. Low-temperature in situ large-strain plasticity of silicon
nanowires. Adv Mater 2007;19:2112–8.[389] Han XD, Zhang YF, Zheng K, Zhang XN, Zhang Z, Hao YJ, et al. Low-temperature in situ large strain plasticity of ceramic SiC
nanowires and its atomic-scale mechanism. Nano Lett 2007;7:452–7.[390] Marszalek PE, Greenleaf WJ, Li H, Oberhauser AF, Fernandez JM. Atomic force microscopy captures quantized plastic
deformation in gold nanowires. PNAS 2000;97:6282–6.[391] Santucci SC, Goldoni A, Larciprete R, Lizzit S, Bertolo M, Baraldi A, et al. Calorimetry at surfaces using high-resolution
core-level photoemission. Phys Rev Lett 2004;93:106105.[392] Hu WY, Xiao SG, Yang JY, Zhang Z. Melting evolution and diffusion behavior of vanadium nanoparticles. Eur Phys J B
2005;45:547–54.[393] Liu HH, Jiang EY, Bai HL, Wu P, Li ZQ, Sun CQ. Shell-resolved melting kinetics of 147-atom Lennard–Jones cluster. J
Nanosci Nanotechnol, in press.[394] Reiss H, Wilson IB. The effect of surface on melting point. J Colloid Sci 1948;3:551–61.[395] Sakai H. Surface-induced melting of small particles. Surf Sci 1996;351:285–91.[396] Wronski CRM. The size dependence of the melting point of small particles of tin. Br J Appl Phys 1967;18:1731–7.[397] Wautelet M. Phase stability of electronically excited Si nanoparticles. J Phys: Condensed Matter 2004;16:L163–6.[398] Ganguli D. Size effect in melting: a historical overview. Trans Ind Ceram Soc 2008;67:49–62.[399] Yu MF, Lourie O, Dyer MJ, Moloni K, Kelly TF, Ruoff RS. Strength and breaking mechanism of multiwalled carbon
nanotubes under tensile load. Science 2000;287:637–40.[400] Kondo Y, Takayanagi K. Synthesis and characterization of helical multi-shell gold nanowires. Science 2000;289:606–8.[401] Takayanagi K. Private communication. Singapore; 1998.[402] Sato F, Moreira AS, Coura PZ, Dantas SO, Legoas SB, Ugarte D, et al. Computer simulations of gold nanowire formation: the
role of outlayer atoms. Appl Phys A 2005;81:1527–31.[403] Sun CQ, Bai HL, Li S, Tay BK, Li C, Chen TP, et al. Length, strength, extensibility, and thermal stability of a Au–Au bond in
the gold monatomic chain. J Phys Chem B 2004;108:2162–7.[404] Gu QF, Krauss G, Steurer W, Gramm F, Cervellino A. Unexpected high stiffness of Ag and Au nanoparticles. Phys Rev Lett
2008;100:045502.[405] Martin CD, Antao SM, Chupas PJ, Lee PL, Shastri SS, Parise JB. Quantitative high-pressure pair distribution function
analysis of nanocrystalline gold. Appl Phys Lett 2005;86:061910.[406] Syassen K, Holzapfel WB. Isothermal compression of Al and Ag to 120 kbar. J Appl Phys 1978;49:4427–30.[407] Heinz DL, Jeanloz R. The equation of state of the gold calibration standard. J Appl Phys 1984;55:885–93.[408] Ouyang G, Tan X, Yang GW. Thermodynamic model of the surface energy of nanocrystlals. Phys Rev B
2006;74:195408.[409] Ouyang G, Li XL, Tan X, Yang GW. Size-induced strain and stiffness of nanocrystals. Appl Phys Lett 2006;89:031904.[410] L Liu Y, Zhang Y, Zhou HB, Lu GH, Kohyama M. Theoretical strength and charge redistribution of fcc Ni in tension and
shear. J Phys: Condens Matter 2008;20:335216.

C.Q. Sun / Progress in Materials Science 54 (2009) 179–307 301
[411] Gysin U, Rast S, Ruff P, Meyer E, Lee DW, Vettiger P, et al. Temperature dependence of the force sensitivity of siliconcantilevers. Phys Rev B 2004;69:045403.
[412] Wachtman JB, Tefft Jr WE, Lam Jr DG, Apstein CS. Exponential temperature dependence of Young’s modulus for severaloxides. Phys Rev 1961;122:1754–9.
[413] Bruls RJ, Hintzen HT, de With G, Metselaar R. The temperature dependence of the Young’s modulus of MgSiN2, AlN andSi3N4. J Eur Ceram Soc 2001;21:263–8.
[414] Nandanpawar ML, Rajagopalan S. Wachman equation and temperature-dependence of bulk moduli in solids. J Appl Phys1978;49:3976–9.
[415] Anderson OL. Derivation of Wachtmans equation for temperature dependence of elastic moduli of oxide compounds.Phys Rev 1966;144:553–7.
[416] Rast S, Wattinger C, Gysin U, Meyer E. Dynamics of damped cantilevers. Rev Sci Instrum 2000;71:2772–7.[417] Rabe U, Janser K, Arnold W. Vibrations of free and surface-coupled atomic force microscope cantilevers: theory and
experiment. Rev Sci Instru 1996;67:3281–93.[418] Couchman PR, Karasz FE. Effect of particle size on Debye temperature. Phys Lett A 1977;62:59–61.[419] Balerna A, Mobilio S. Dynamic properties and Debye temperatures of bulk Au and Au clusters studied using extended X-
ray-absorptioni ctroscopy. Phys Rev B 1986;34:2293–8.[420] Zhao YH, Lu K. Grain-size dependence of thermal properties of nanocrystalline elemental selenium studied by X-ray
diffraction. Phys Rev B 1997;56:4330–7.[421] Yang CC, Xiao MX, Li W, Jiang Q. Size effects on Debye temperature, Einstein temperature, and volume thermal expansion
coefficient of nanocrystals. Solid State Commun 2006;139:148–52.[422] Shandiz MA. Effective coordination number model for the size dependency of physical properties of nanocrystals. J Phys:
Condens Matter 2008;20:325237.[423] Killean RCG, Lisher EJ. Debye temperatures of cubic elements and their relationship to melting points. J Phys C: Solid State
Phys 1975;8:3510–20.[424] Peng SA, Grimvall G. Bonding and Debye temperatures in alkali earth-metal halides. J Phys Chem Solids
1994;55:707–10.[425] Martin CJ, O’Connor DA. Experimental test of Lindermanns melting law. J Phys C: Solid State Phys 1977;10:3521–6.[426] Lindemann FA. The calculation of molecular natural frequencies. Phys Z 1910;11:609–12.[427] Novotny V, Meincke PPM, Watson JHP. Effect of size and surface on specific heat of small lead particles. Phys Rev Lett
1972;28:901–3.[428] Song Q, Zheng C, Xia S, Chen S. An AC microcalorimeter for measuring specific heat of thin films. Microelect J
2004;35:817–21.[429] Lu Y, Song QL, Xia SH. Calculation of specific heat for aluminium thin films. Chin Phys Lett 2005;22:2346–8.[430] Yu J, Tan ZA, Zhang FT, Wei GF, Wang LD. Investigation of a micro calorimeter for thin-film heat capacity measurement.
Chin Phys Lett 2005;22:2429–32.[431] Lu K. Nanocrystalline metals crystallized from amorphous solids: nanocrystallization, structure, and properties. Mater Sci
Eng R 1996;16:161–221.[432] Prasher RS, Phelan PE. Non-dimensional size effects on the thermodynamic properties of solids. Int J Heat Mass Transfer
1999;42:1991–2001.[433] Stolyarov VV, Valiev RZ, Zhu YT. Enhanced low-temperature impact toughness of nanostructured Ti. Appl Phys Lett
2006;88:041905.[434] Vennila S, Kulkarni RSR, Saxena SK, Liermann H-P, Sinogeikin SV. Compression behavior of nanosized nickel and
molybdenum. Appl Phys Lett 2006;89:261901.[435] Qadri SB, Yang J, Ratna BR, Skelton EF, Hu JZ. Pressure induced structural transitions in manometer size particles of PbS.
Appl Phys Lett 1996;69:2205–7.[436] Siow KS, Tay AAO, Oruganti P. Mechanical properties of nanocrystalline copper and nickel. Mater Sci Technol
2004;20:285–94.[437] Gerberich WW, Mook WM, Perrey CR, Carter CB, Baskes MI, Mukherjee R, et al. Superhard silicon nanospheres. J Mech
Phys Solids 2003;51:979–92.[438] Li J, Li Y, Yu X, Ye W, Sun CQ. Local bond average for the temperature dependence of elastic modulus. J Phys Chem,
submitted for publication.[439] Dodd SP, Saunders GA, Cankurtaran M, James B. Ultrasonic study of the elastic and nonlinear acoustic properties of
ceramic aluminum nitride. J Mater Sci 2001;36:723–9.[440] Garai J, Laugier A. The temperature dependence of the isothermal bulk modulus at 1 bar pressure. J Appl Phys
2007;101:023514.[441] Fine ME. Elasticity and thermal expansion of germanium between �195 and 275�C. J Appl Phys 1953;24:338.[442] Czaplewski DA, Sullivan JP, Friedann TA, Wendt JR. Temperature dependence of the mechanical properties of
tetrahedrally coordinated amorphous carbon thin films. Appl Phys Lett 2005;87:161915.[443] Siegel RW, Fougere GE. Mechanical properties of nanophase metals. Nanostruct Mater 1995;6:205–16.[444] Zhang LC, Zarudi I. Towards a deeper understanding of plastic deformation in mono-crystalline silicon. Int J Mech Sci
2001;43:1985–96.[445] Concustell A, Mattern N, Wendrock H, Kuehn U, Gebert A, Eckert J, et al. Mechanical properties of a two-phase amorphous
Ni–Nb–Y alloy studied by nanoindentation. Scripta Mater 2007;56:85–8.[446] Hall EO. The deformation and aging of mild steel: 3. Discussion of results. Proc Soc Lon B 1951;64:747–53.[447] Petch NJ. The cleavage strength of polycrystals. J Iron Steel Inst 1953;174:25–8.[448] Ashby MF. Deformation of plastically non-homogeneous materials. Phil Mag 1970;21:399.[449] Wang YM, Chen MW, Zhou FH, Ma E. High tensile ductility in a nanostructured metal. Nature 2002;419:912–5.[450] Jang D, Atzmon M. Grain-size dependence of plastic deformation in nanocrystalline Fe. Appl Phys 2003;93:9282–6.[451] Conrad H, Narayan J. Mechanism for grain size softening in nanocrystalline Zn. Appl Phys Lett 2002;81:2241–3.[452] Kim HS. A composite model for mechanical properties of nanocrystalline materials. Scripta Mater 1998;39:1057–61.

302 C.Q. Sun / Progress in Materials Science 54 (2009) 179–307
[453] Van Swygenhoven H, Derlet PM, Hasnaoui A. Atomic mechanism for dislocation emission from nanosized grainboundaries. Phys Rev B 2002;66:024101.
[454] Zaichenko SG, Glezer AM. Disclination mechanism of plastic deformation of nanocrystalline materials. Interf Sci1999;7:57–67.
[455] Carlton CE, Ferreira PJ. What is behind the inverse Hall–Petch effect in nanocrystalline materials? Acta Mater2007;55:3749–56.
[456] Argon AS, Yip S. The strongest size. Phil Mag Lett 2006;86:713–20.[457] Zhao M, Li JC, Jiang Q. Hall–Petch relationship in manometer size range. J Alloys Compd 2003;361:160–4.[458] Schiotz J, DiTolla FD, Jacobsen KW. Softening of nanocrystalline metals at very small grain sizes. Nature 1998;391:561–3.[459] Giga A, Kimoto Y, Takigawa Y, Higashi K. Demonstration of an inverse Hall–Petch relationship in electrodeposited
snanocrystalline Ni–W alloys through tensile testing. Scripta Mater 2006;55:143–6.[460] Somekawa H, Nieh TG, Higashi K. Instrumented indentation properties of electrodeposited Ni–W alloys with different
microstructures. Scripta Mater 2004;50:1361–5.[461] Schuh CA, Nieh TG, Iwasaki H. The effect of solid solution W additions on the mechanical properties of nanocrystalline Ni.
Acta Mater 2003;51:431–43.[462] Yamasaki T, Schlossmacher P, Ehrlich K, Ogino Y. Formation of amorphous electrodeposited Ni–W alloys and their
nanocrystallization. Nanostruct Mater 1998;10:375–88.[463] Guicciardi S, Sciti D, Melandri C, Bellosi A. Nanoindentation characterization of submicro- and nano-sized liquid-phase-
sintered SiC ceramics. J Am Ceram Soc 2004;87:2101–7.[464] Zhou Y, Erb U, Aust KT, Palumbo G. The effects of triple junctions and grain boundaries on hardness and Young’s modulus
in nanostructured Ni–P. Scripta Mater 2003;48:825–30.[465] Inoue A, Kimura HM, Watanabe M, Kawabata A. Work softening of aluminum base alloys containing nanoscale
icosahedral phase. Mater Trans Jim 1997;38:756–60.[466] Tjong SC, Chen H. Nanocrystalline materials and coatings. Mater Sci Eng R 2004;45:1–88.[467] Ovid’ko IA. Deformation and diffusion modes in nanocrystalline materials. Int Mater Rev 2005;50:65–82.[468] Wolf D, Yamakov V, Phillpot SR, Mukherjee A, Gleiter H. Deformation of nanocrystalline materials by molecular-dynamics
simulation: relationship to experiments? Acta Mater 2005;53:1–40.[469] Sherman D, Brandon D. Mechanical properties of hard materials and their relation to microstructure. Adv Eng Mater
1999;1:161–81.[470] Andrievski RA, Glezer AM. Size effects in nanocrystalline materials: II. Mechanical and physical properties. Fiz Met I
Metalloved 2000;89:91–112.[471] Gusev AI. The effects of the nanocrystalline state in solids. Usp Fiz Nauk 1998;168:55–83.[472] Was GS, Foecke T. Deformation and fracture in microlaminates. Thin Solid Films 1996;286:1–31.[473] Suryanarayana C. Nanocrystalline materials. Int Mater Rev 1995;40:41–64.[474] Gryaznov VG, Trusov LI. Size effects in micromechanics of nanocrystals. Prog Mater Sci 1993;37:289–401.[475] Malygin GA. Plasticity and strength of micro- and nanocrystalline materials. Phys Solid State 2007;49:1013–33.[476] Meyers MA, Mishra A, Benson DJ. Mechanical properties of nanocrystalline materials. Prog Mater Sci 2006;51:427–556.[477] Li JCM, Chou YT. Role of dislocations in flow stress grain size relationships. Met Trans 1970;1:1145–8.[478] Knapp JA, Follstaedt DM. Hall–Petch relationship in pulsed-laser deposited nickel fim. J Mater Res 2004;19:218–27.[479] Armstrong RW, Head AK. Dislocation queueing and fracture in an elastically anisotropic materials. Acta Met
1965;13:759–64.[480] Louat N. Alloys strong at room and elevated temperatures from powder-metallurgy. Acta Met 1985;33:59–69.[481] Lasalmonie A, Strudel JL. Influence of grain-size on the mechanical-behavior of some high-strength materials. J Mater Sci
1986;21:1837–52.[482] Yamakov V, Wolf D, R Phillpot S, Mukherjee AK, Gleiter H. Deformation-mechanism map for nanocrystalline metals
byolecular-dynamics simulation. Nat Mater 2003;2:43–7.[483] Li JC. Transactions of the So petroleum engineers of the american institute of mining, metallurgical, and petroleum
engineers. Inc 1963;227:239.[484] Pande CS, Rath BB, Imam MA. Effect of annealing twins on Hall–Petch relation in polycrystalline materials. MATER SCI
ENG A 2004;367:171–5.[485] Mishin Y. Interatomic potentials for monoatomic metals from experimental data and ab initio calculations. Phys Rev B
1999;59:3393–407.[486] Jacobson KW, Norskov JK, Puska MJ. Interatomic interactions in the effective nmedium theory. Phys Rev B
1987;35:7423–42.[487] Ashby MF, Verrall RA. Diffusion-accommodated flow and superplasticity. Acta Metal 1973;21:149–63.[488] Van Swygenhoven H, Derlet PM, FrØseth AG. Stacking fault energies and slip in nanocrystalline metals. Nat Mater
2004;3:399–403.[489] Bei H, Xie S, George EP. Softening caused by Profuse Shear banding in a bulk metallic glass. Phys Rev Lett 2006;96:105503.[490] Fan GJ, oo H, Liaw PK, Lavernia EJ. A model for the inverse Hall–Petch relation of nanocrystalline materials. Mater Sci Eng
A 2005;409:243–8.[491] Nieh TG, Wang JG. Hall–Petch relationship in nanocrystalline Ni and Be-B alloys. Intermetallics 2005;13:377–85.[492] Ma E. Instabilities and ductility of nanocrystalline and ultrafine-grained metals. Scripta Mater 2003;49:663–8.[493] Kim HS, Estrin Y. Phase mixture modeling of the strain rate dependent mechanical behavior of nanostructured materials.
Acta Mater 2005;53:765–72.[494] Jiang Z, Liu X, Li G, Jiang Q, Lian J. Strain rate sensitivity of a nanocrystalline Cu synthesized by electric brush plating. Appl
Phys Lett 2006;88:143115.[495] Lian J, Gu C, Jiang Q, Jiang Z. Strain rate sensitivity of face-centered-cubic nanocrystalline materials based on dislocation
deformation. J Appl Phys 2006;99:076103.[496] Lefebvre S, Devincre B, Hoc T. Simulation of the Hall–Petch effect in ultra-fine grained copper. Mater Sci Eng A
2005;400:150–3.

C.Q. Sun / Progress in Materials Science 54 (2009) 179–307 303
[497] Lu C, Mai YW, Shen YG. Optimum information in crackling noise. Phys Rev E 2005;72:027101.[498] Louchet F, Weiss J, Richeton T. Hall–Petch law revisited in terms of collective dislocation dynamics. Phys Rev Lett
2006;97:075504.[499] Mohamed FA. Interpretation of nanoscale softening in terms of dislocation-accommodated boundary sliding. Metal Mater
Trans 2007;38A:340–7.[500] Song HW, Guo SR, Hu ZQ. A coherent polycrystal model for the inve Hall–Petch relation in nanocrystalline materials.
Nanostruct Mater 1999;11:203–10.[501] Cheng S, Spencer JA, Milligan WW. Strength and tension/compression asymmetry in nanostructured and ultrafine-grain
metals. Acta Mater 2003;51:4505–18.[502] Chattopadhyay PP, Pabi SK, Manna I. On the inverse Hall–Fetch relationship in nanocrystalline materials. Z Metallkunde
2000;91:1049–51.[503] Jiang B, Weng GJ. A generalized self-consistent polycrystal model for the yield strength of nanocrystalline materials. J
Mech Phys Solids 2004;52:1125–49.[504] Schiøtz J, Jacobsen KW. A maximum in the strength of nanocrystalline copper. Science 2003;301:1357–9.[505] Bata V, Pereloma EV. An alternative physical explanation of the Hall–Petch relation. Acta Mater 2004;52:657–65.[506] Yamakov V, Wolf D, Phillpot SR, Mukherjee AK, Gleiter H. Deformation mechanism crossover and mechanical behavior in
nanocrystalline materials. Phil Mag Lett 2003;83:385–93.[507] Masumura RA, Hazzledine MP, Pande CS. Yield stress of fine grained materials. Acta Mater 1998;46:4527–34.[508] Fedorov AA, Gutkin MY, Ovid’ko IA. Triple junction diffusion and plastic flow in fine-grained materials. Scripta Mater
2002;47:51–5.[509] Arzt E. Overview no. 130 – size effects in materials due to microstructural and dimensional constraints: a comparative
review. Acta Mater 1998;46:5611–26.[510] Qin XY, Zhu XG, Gao S, Chi LF, Lee JS. Compression behaviour of bulk nanocrystalline Ni–Fe. J Phys Condens Mater
2002;14:2605–20.[511] Marks LD. Experimental studies of small-particle structures. Rep Prog Phys 1994;57:603–49.[512] Chang S-Y, Chang T-K. Grain size effect on nanomechanical properties and deformation behavior of copper under
nanoindentation test. J Appl Phys 2007;101:033507.[513] Narayan J, Venkatesan RK, Kvit A. Structure and properties of nanocrystalline zinc films. J Nanopart Res 2002;4:265–9.[514] Sanders PG, Eastman JA, Weertman JR. Elastic and tensile behavior of nanocrystalline copper and palladium. Acta Mater
1997;45:4019–25.[515] Fu HH, Benson DJ, Meyers MA. Analytical and computational description of effect of grain size on yield stress of metals.
Acta Mater 2001;49:2567–82.[516] Sanders PG, Youngdahl CJ, Weertman JR. The strength of nanocrystalline metals with and without flaws. Mater Sci Eng
1997;A234–236:77–82.[517] Schuh CA, Nieh TG, Yamasaki T. Hall–Petch breakdown manifested in abrasive wear resistance of nanocrystalline nickel.
Scripta Mater 2002;46:735–40.[518] Palumbo G, Erb U, Aust KT. Triple line disclination effects on the mechanical-behavior of materials. Scripta Metall Mater
1990;24:2347–50.[519] Höfler HJ, Averback RS. Grain-growth nanocrystalline TiO2 and its relation to vikers hardness ans fracture-toughness.
Scripta Metal 1990;24:2401–6.[520] Jiang Q, Zhang Z, Li JC. Superheating of nanocrystals embedded in matrix. Chem Phys Lett 2000;322:549–52.[521] Jiang Q, Yang CC. Size effect on phase stability of nanostructures. Curr Nanosci 2008;4:179–200.[522] Vallee R, Wautelet M, Dauchot JP, Hecq M. Size and segregation effects on the phase diagrams of nanoparticles of binary
systems. Nanotechnol 2001;12:68–74.[523] Guisbiers G, Kazan M, Van Overscheide O, Wautelet M. Pereira, mechanical and thermal properties of metallic and
semiconductive nanostructures. J Phys Chem C 2008;112:4097–103.[524] Qi WH, Wang MP, Xu GY. The particle size dependence of cohesive energy of metallic nanosolids. Chem Phys Lett
2003;372:632–4.[525] Gallas MR, Piermarini GJ. Bulk modulus and youngs modulus of nanocrystalline gamma-alumina. J Am Ceram Soc
1994;77:2917–20.[526] Zhao J, Hearne GR, Maaza M, Laher-Lacour F, Witcomb MJ, Bihan TL, et al. Compressibility of nanostructured alumina
phases determined from synchrotron X-ray diffraction studies at high pressure. J Appl Phys 2001;90:3280–5.[527] Lund AC, Nieh TG, Schuh CA. Tension/compression strength asymmetry in a simulated nanocrystalline metal. Phys Rev B
2004;69:012101.[528] Huq AMA, Goh KL, Zhou ZR, Liao K. On defect interactions in axially loaded single-walled carbon nanotubes. J Appl Phys
2008;103:054306.[529] Chang YA, Pike LM, Liu CT, Bilbrey AR, Stone DS. Correlation of the hardness and vacancy concentration in FeAl.
Intermetallics 1993;1:107–15.[530] Miao MS, Lambrecht WR. Effects of vacancies and impurities on the relative stability of rocksalt and zincblende structures
for MnN. Phys Rev B 2007;76:195209.[531] Yan J, Ma X, Zhao W, Tang H, Zhu C, Cai S. Crystal Structure and carbon vacancy hardening of (W0.5Al0.5)xC1-x prepared
by a solid-state reaction. Chemphyschem 2005;6:2099–103.[532] Kaplan-Ashiri I, Cohen SR, Gartsman K, Ivanovskaya V, Heine T, Seifert G, et al. On the mechanical behavior of WS2
nanotubes under axial tension and compression. Proc Nat Acad Sci USA 2006;103:523–8.[533] Pugno NM, Ruoff RS. Quantized fracture mechanics. Philos Mag 2004;84:2829–45.[534] Jhi SH, Louie SG, Cohen ML, Ihm J. Vacancy hardening and softening in transition metal carbides and nitrides. Phys Rev
Lett 2001;86:3348–51.[535] Holleck H. Material selection for hard coatings. J Vac Sci Technol A 1986;4:2661–9.[536] Jiang X, Wang M, Schmidt K, Dunlop E, Haupt J, Gissler W. Elastic-constants and hardness of ion-beam-sputteerd TiNx
films measured by Brillouin-scattering and depth-sensing indentation. J Appl Phys 1991;69:3053–7.

304 C.Q. Sun / Progress in Materials Science 54 (2009) 179–307
[537] Toth LE. Transition metal carbides and nitrides. New York: Academic Press; 1971.[538] Sahara R, Shishido T, Nomura A, Kudou K, Okada S, Kumar V, et al. Mechanism of the increase in bulk modulus of
perovskite ScRh3Bx by vacancies. Phys Rev B 2006;73:184102.[539] Shin CS, Gall D, Hellgren N, Patscheider J, Petrov I, Greene JE. Vacancy hardening in single-crystal TiNx(001) layers. J Appl
Phys 2003;93:6025–8.[540] Luk VK, Forrestal MJ, Amos DE. Dynamic spherical cavity expansion of strain-hardening materials. J Appl Mech
1991;58:1–6.[541] Lu GH, Wang Q, Liu F. The role of vacancy on trapping interstitial O in heavily As-doped Si. Appl Phys Lett
2008;92:211906.[542] Knapp JA, Follstaedt DM, Myers SM. Hardening by bubbles in He-implanted Ni. Appl Phys Lett 2008;103:013518.[543] Poa CHP, Lacerda RG, Cox DC, Marques FC, Silva SRP. Effects of stress on electron emission from nanostructured carbon
materials. J Vac Sci Technol B 2003;21:1710–4.[544] Lacerda RG, Dos Santos MC, Tessler LR, Hammer P, Alvarez F, Marques FC. Pressure-induced physical changes of noble
gases implanted in highly stressed amorphous carbon films. Phys Rev B 2003;68:054104.[545] Poa CHP, Lacerda RG, Cox DC, Silva SRP, Marques FC. Stress-induced electron emission from nanocomposite amorphous
carbon thin films. Appl Phys Lett 2002;81:853–5.[546] Waclawski BJ, Gadzuk JW, Herbst JF. Photoemission for rare gases implanted in Ge. Phys Rev Lett 1978;41:583–6.[547] Biswas C, Shukla AK, Banik S, Barman SR, Chakrabarti A. Argon Nanobubbles in Al(111): a photoemission study. Phys Rev
Lett 2004;92:115506.[548] Citrin PH, Hamann DR. Measurement and calculation of polarization and potential-energy effects on core-electron
binding energies in solids: X-ray photoemission of rare gases implanted in noble metals. Phys Rev B 1974;10:4948–63.[549] Watson RE, Herbst JF, Wilkins JW. Core level shifts of rare-gas atoms implanted in the noble metals. Phys Rev B
1976;14:18–25.[550] Kaindl G, Chiang TC, Eastman DE, Himpsel FJ. Distance-dependent relaxation shifts of photoemission and auger energies
for Xe on Pd(001). Phys Rev Lett 1980;45:1808–11.[551] Lacerda RG, Tessler LR, dos Santos MC, Hammer P, Alvarez F, Marques FC. EXAFS study of noble gases implanted in highly
stressed amorphous carbon films. J Non-Cryst Solids B 2002;299:805–9.[552] Kim JH, Seo S-M, Lee HH. Nanovoid nature and compression effects in organic light emitting. Appl Phys Lett
2007;90:143521.[553] Lynch RW, Drickamer HG. Effect of high pressure on the lattice parameters of diamond, graphite, and hexagonal boron
nitride. J Chem Phys 1966;44:181–4.[554] Bhattacharyya S, Subramanyam SV. Metallic conductivity of amorphous carbon films under high pressure. Appl Phys Lett
1997;71:632–4.[555] Umemoto K, Saito S, Berber S, Tomanek D. Carbon foam: spanning the phase space between graphite and diamond. Phys
Rev B 2001;64:193409.[556] Mirabella S, Bruno E, Priolo F, Giannazzo F, Bongiorno C, Raineri V, et al. Role of surface nanovoids on interstitial trapping
in He implanted crystalline Si. Appl Phys Lett 2006;88:191910.[557] Lacerda RG, Hammer P, Alvarez F, Marques FC. Influence of stress on the electron core level energies of noble gases
implanted in hard amorphous carbon films. Diam Rel Mater 2001;10:956–9.[558] Ouyang G, Tan X, Cai MQ, Yang GW. Surface energy and shrinkage of a nanocavity. Appl Phys Lett 2006;89:183104.[559] Ouyang G, Tan X, Wang CX, Yang GW. Physical and chemical origin of size-dependent spontaneous interfacial alloying of
core-shell nanostructures. Chem Phys Lett 2006;420:65–70.[560] Dai CS, Wang DL, Ding F, Hu XG, Jiang ZH. Review of metal foam electrode material. Rare Metal Mater Eng 2004;33:1–5.[561] Dunand DC. Processing of titanium foams. Adv Eng Mater 2004;6:369–76.[562] Körner C, Singer RF. Processing of metal foams-challenges and opportunities. Adv Eng Mater 2000;2:159–65.[563] Hurysk KM. Steel and titanium hollow sphere foams. MRS Symp Proc 1998;521:191–204.[564] http://en.wikipedia.org/wiki/Porosity.[565] Erlebacher J, Aziz MJ, Karma A, Dimitrov N, Sieradzki K. Evolution of nanoporosity in dealloying. Nature (London)
2001;410:450–3.[566] Hodge AM, Biener J, Hayes JR, Bythrow PM, Volkert CA, Hamza AV. Scaling equation for yield strength of nanoporous
open-cell foams. Acta Mater 2007;55:1343–9.[567] Mathur A, Erlebacher J. Size dependence of effective Young’s modulus of nanoporous gold. Appl Phys Lett
2007;90:061910.[568] Biener J, Hodge AM, Hayes JR, Volkert CA, Zepeda-Ruiz LA, Hamza AV, et al. Size effects on the mechanical behavior of
nanoporous Au. Nano Lett 2006;6:2379–82.[569] Biener J, Hodge AM, Hamza AV, Hsiung LM, Satcher JH. Nanoporous Au: a high yield strength material. J Appl Phys
2005;97:024301.[570] Hodge AM, Biener J, Hsiung LL, Wang YM, Hamza AV, Satcher JH. Monolithic nanocrystalline Au fabricated by the
compaction of nanoscale foam. J Mater Res 2005;20:554–7.[571] Hakamada M, Mabuchi M. Mechanical strength of nanoporous gold fabricated by dealloying. Scripta Mater
2007;56:1003–6.[572] Volkert CA, Lilleodden ET, Kramer D, Weissmuller J. Approaching the theoretical strength in nanoporous Au. Appl Phys
Lett 2006;89:061920.[573] Lehmhus D, Banhart J. Properties of heat-treated aluminium foams. Mater Sci Eng A 2003;349:98–110.[574] Kraft O, Saxa D, Haag M, Wanner A. The effect of temperature and strain rate on the hardness of Al and Al-based foams as
measured by nanoindentation. Z Metallkunde 2001;92:1068–73.[575] Jiang B, Wang Z, Zhao N. Effect of pore size and relative density on the mechanical properties of open cell aluminum
foams. Scripta Mater 2007;56:169–72.[576] Ko S, Lee D, Jee S, Park H, Lee K, Hwang W. Mechanical properties and residual stress in porous anodic alumina structures.
Thin Solid Films 2006;515:1932–7.

C.Q. Sun / Progress in Materials Science 54 (2009) 179–307 305
[577] de Deus JF, Tavares AC, Lepienski CM, Akcelrud L. Nanomechanical properties of poly(methyl methacrylate-co-9-anthrylmethyl methacrylate). Surf Coat Technol 2006;201:3615–20.
[578] Bai XM, Li M. Nucleation and melting from nanovoids. Nano Lett 2006;6:2284–9.[579] Biener J, Hodge AM, Hamza AV. Microscopic failure behavior of nanoporous gold. Appl Phys Lett 2005;87:121908.[580] Jhi SH, Ihm J, Louie SG, Cohen ML. Electronic mechanism of hardness enhancement in transition-metal carbonitrides.
Nature (London) 1999;399:132–4.[581] Wang ZP, Jiang Q. A yield criterion for porous ductile media at high strain rate. J Appl Mech 1997;64:503–9.[582] Lubomirsky I. Mechanical properties and defect chemistry. Solid State Ionics 2006;177:1639–42.[583] Gibson LJ, Ashby MF. Cellular solids: structure and properties. 2nd ed. Cambridge, UK: Cambridge University Press; 1997.[584] Wachtman JB. In: Wachtman JB, editor. Mechanical and thermal properties of ceramics. NBS Washington: NBS Special
Publication; 1963. p. 139.[585] MacKenzie JK. The elastic constant of a solid containing spherical holes. Proc Phys Soc B 1950;63:2–11.[586] Rice RW. Use of normalized porosity in models for the porosity dependence of mechanical properties. J Mater Sci
2005;40:983–9.[587] Uchic MD, Dimiduk DM, Florando JN, Nix WD. Sample dimensions influence strength and crystal plasticity. Science
2004;305:986–9.[588] Pan LK, Sun CQ, Li CM. Estimating the extent of surface oxidation by measuring the porosity dependent dielectrics of
oxygenated porous silicon. Appl Surf Sci 2005;240:19–23.[589] Sader JE. Surface stress induced deflections of cantilever plates with applications to the atomic force microscope: V-
shaped plates. J Appl Phys 2002;91:9354–61.[590] Cammarata RC, Sieradzki K. Effects of surface stress on the elastic modulus of thin-films and superlattices. Phys Rev Lett
1989;62:2005–8.[591] Yang FQ, Li JCM. Diffusion-induced beam bending in hydrogen sensors. J Appl Phys 2003;93:9304–9.[592] Sharma P, Ganti S, Bhate N. Effect of surfaces on the size-dependent elastic state of nano-inhomogeneities. Appl Phys Lett
2003;82:535–7.[593] Yang F. Size-dependent effective modulus of elastic composite materials: spherical nanocavities at dilute concentrations.
J Appl Phys 2004;95:3516–20.[594] Pey KL, Ranjan R, Tung CH, Tang LJ, Lo VL, Lim KS, et al. Breakdowns in high-k gate stacks of nano-scale. CMOS Dev
Microelectron Eng 2005;80:353–61.[595] Tung CH, Pey KL, Tang LJ, Radhakrishna MK. Percolation path and dielectric-breakdown-induced-epitaxy evolution during
ultrathin gate dielectric breakdown transient. Appl Phys Lett 2003;83:2223–5.[596] Pan LK, Sun CQ, Chen TP, Li S, Li CM, Tay BK. Dielectric suppression of nanosolid silicon. Nanotechnol
2004;15:802–1806.[597] Veprek S. Electronic and mechanical properties of nanocrystalline composites when approaching molecular size. Thin
Solid Films 1997;297:145–53.[598] Veprek S, Reiprich S. A concept for the design of novel superhard coatings. Thin Solid Films 1995;268:64–71.[599] Zeng XT, Zhang S, Sun CQ, Liu YC. Nanometric-layered CrN/TiN thin films: mechanical strength and thermal stability. Thin
Solid Films 2003;424:99–102.[600] Tien SK, Duh JG. Comparison of microstructure and phase transformation for nanolayered CrN/AlN and TiN/AlN coatings
at elevated temperatures in air environment. Thin Solid Films 2006;515:1097–101.[601] Li YP, Zhang GP, Wang W, Tan J, Zhu SJ. On interface strengthening ability in metallic multilayers. Scripta Mater
2007;57:117–20.[602] Gu C, Lian J, Jiang Q. Layered nanostructured Ni with modulated hardness fabricated by surfactant-assistant
electrodeposition. Scripta Mater 2007;57:233–6.[603] Hao SQ, Delley B, Veprek S, Stampfl C. Superhard nitride-based nanocomposites: role of interfaces and effect of
impurities. Phys Rev Lett 2006;97:086102.[604] Ma E, Wang YM, Lu QH, Sui ML, Lu L, Lu K. Strain hardening and large tensile elongation in ultrahigh-strength nano-
twinned copper. Appl Phys Lett 2004;85:4932–4.[605] Dao M, Lu L, Shen YF, Suresh S. Strength, strain-rate sensitivity and ductility of copper with nanoscale twins. Acta Mater
2006;54:5421–32.[606] Lu L, Schwaiger R, Shan ZW, Dao M, Lu K, Suresh S. Nano-sized twins induce high rate sensitivity of flow stress in pure
copper. Acta Mater 2005;53:2169–79.[607] Afanasyev KA, Sansoz F. Strengthening in gold nanopillars with nanoscale twins. 2007;7:2056–62.[608] Froseth A, Van Swygenhoven H, Derlet PM. The influence of twins on the mechanical properties of nc-Al. Acta Mater
2004;52:2259–68.[609] Andrievski RA. Nanostructured superhard films as typical nanomaterials. Surf Coat Technol 2007;201:6112–6.[610] MacKenzie M, Craven AJ, McCom DW, De Gendt S. Interfacial reactions in a HfO2/TiN/poly-Si gate stack. Appl Phys Lett
2006;88:192112.[611] Fu SY, Lauke B, Li RKY, Mai YW. Effects of PA6,6/PP ratio on the mechanical properties of short glass fiber reinforced and
rubber-toughened polyamide 6,6/polypropylene blends. Compos: Part B 2006;37:182–90.[612] Fu SY, Pan QY, Huang CJ, Yang G, Liu XH, Ye L, et al. A preliminary study on cryogenic mechanical properties of epoxy
blend matrices and SiO2/epoxy nanocomposites. Key Eng Mater 2006;312:211–6.[613] Wang ZD, Lu JJ, Li Y, Fu SY, Jiang SQ, Zhao XX. Studies on thermal and mechanical properties of PI/SiO2 nanocomposite
films at low temperature. Compos: Part A 2006;37:74–9.[614] Sharma P, Ganti S. Size-dependent Eshelby’s tensor for embedded nano-inclusions incorporating surface/interface
energies. J Appl Mech 2004;71:663–71.[615] Lu M, Lau KT, Tam WY, Liao K. Enhancement of Vicker’s hardness of nanoclay-supported nanotube reinforced novel
polymer composites. Carbon 2006;44:383–6.[616] Liu H, Liao K. Tensile behavior and morphology studies of glass-fiber-reinforced polymeric in situ hybrid composites. J
Appl Polym Sci 2004;94:211–21.

306 C.Q. Sun / Progress in Materials Science 54 (2009) 179–307
[617] Xu XJ, Thwe MM, Shearwood C, Liao K. Mechanical properties and interfacial characteristics of carbon-nanotube-reinforced epoxy thin films. Appl Phys Lett 2002;81:2833–5.
[618] Liao K, Li S. Characteristics of carbon nanotube-polystyrene interface. Appl Phys Lett 2001;79:4225–7.[619] Li XD, Gao HS, Scrivens WA, Fei DL, Thakur V, Sutton MA, et al. Structural and mechanical characterization of nanoclay-
reinforced agarose nanocomposites. Nanotechnol 2005;16:2020–9.[620] Ci L, Suhr J, Pushparaj V, Zhang X, Ajayan PM. Continuous carbon nanotube reinforced composites. Nano Lett
2008;8:2762–6.[621] Haraguchi K, Ebato M, Takehisa T. Polymer-clay nanocomposites exhibiting abnormal necking phenomena accompanied
by extremely large reversible elongations and excellent transparency. Adv Mater 2006;18:2250–4.[622] Jiang LY, Huang Y, Jiang H, Ravichandran G, Gao H, Hwang KC, et al. A cohesive law for carbon nanotube/polymer
interfaces based on the van der Waals force. J Mech Phys Solids 2006;54:2436–52.[623] Lu CS, Mai YW, Shen YG. Recent advances on understanding the origin of superhardness in nanocomposite coatings: a
critical review. J Mater Sci 2006;41:937–50.[624] Karak N. Polymer (epoxy) clay nanocomposites. J Polym Mater 2006;23:1–20.[625] Hussain F, Hojjati M, Okamoto M, et al. and application: an overview. J Compos Mater 2006;40:1511–75.[626] Okamoto M. Recent advances in polymer/layered silicate nanocomposites: an overview from science to technology.
Mater Sci Technol 2006;22:756–79.[627] Tanaka Y, Gong JP, Osada Y. Novel hydrogels with excellent mechanical performance. Prog Polym Sci 2005;30:1–9.[628] Cantor B, Chang ITH, Knight P, Vincent AJB. Microstructural development in equiatomic multicomponent. Mater Sci Eng
2004;375–377:213–8.[629] Gao F, He J, Wu E, Liu S, Yu D, Li D, et al. Hardness of covalent crystals. Phys Rev Lett 2003;91:015502.[630] Cohen ML, Bergstresser TK. Band structures and pseudopotential form factors for fourteen semiconductors of the
diamond and zinc-blende structures. Phys Rev 1966;141:789–96.[631] Philips JC. Covalent bonding in crystals. Molecules and polimers. Chicago: Chicago University Press; 1969.[632] Litovchenko V. Analysis of the band structure of tetrahedral diamondlike crystals with valence bonds: prediction of
materials with superhigh hardness and negative electron affinity. Phys Rev B 2002;65:153108.[633] Liu AY, Cohen ML. Prediction of new low compressibility solids. Science 1989;245:841–2.[634] Wang EG. New development in covalently bonded carbon-nitride and related materials. Adv Mater
1999;11:1129–33.[635] Zheng WT, Sjostrom H, Ivanov I, Xing KZ, Broitman E, Salaneck WR, et al. Reactive magnetron sputter deposited CNx:
effects of N2 pressure and growth temperature on film composition, bonding, and microstructure. J Vac Sci Technol A1996;14:2696–701.
[636] Veprek S. Conventional and new approaches towards the design of novel superhard materials. Surf Coat Technol1997;97:15–22.
[637] Liu W, Li JC, Zheng WT, Jiang Q. NiAl(110)/Cr(110) interface, a density functional theory study. Phys Rev B2006;73:205421.
[638] Popovic ZS, Satpathy S. Wedge-shaped potential and airy-function electron localization in oxide superlattices. Phys RevLett 2005;94:176805.
[639] Mahnke HE, Haas H, Holub-Krappe E, Koteski V, Novakovic N, Fochuk P, et al. Lattice distortion around impurity atoms asdopants in CdTe. Thin Solid Films 2005;480–481:279–82.
[640] Pan ZY, Sun ZH, Xie Z, Xu JH, Kojima I, Wei SQ. Interfacial intermixing of TiN/Si3N4 super-hard multilayer films studied byfluorescence X-ray absorption fine structure. J Phys D 2006;39:2796–802.
[641] Zanchet D, Tolentino H, Alves MCM, Alves OL, Ugarte D. Inter-atomic distance contraction in thiol-passivated goldnanoparticles. Chem Phys Lett 2000;323:167–72.
[642] Kluth P, Johannessen B, Giraud V, Cheung A, Glover CJ, Azevedo GD, et al. Bond length contraction in Au nanocrystalsformed by ion implantation into thin SiO2. Appl Phys Lett 2004;85:3561–3.
[643] Chen DL, Li CS, Zhu ZG, Fan JW, Wei SQ. Interface effect of InSb quantum dots embedded in SiO2 matrix. Phys Rev B2005;72:075341.
[644] Wolska A, Lawniczak-Jablonska K, Klepka M, Walczak MS, Misiuk A. Local structure around Mn atoms in Si crystalsimplanted with Mn+ studied using X-ray absorption spectroscopy techniques. Phys Rev B 2007;75:113201.
[645] Veprek S, Veprek-Heijman MGJ. The formation and role of interfaces in superhard nc–MenN/a–Si3N4 nanocomposites.Surf Coat Technol 2007;201:6064–70.
[646] Srinivasan SG, Liao XZ, Baskes MI, McCabe RJ, Zhao YH, Zhu YT. Compact and dissociated dislocations in aluminum:implications for deformation. Phys Rev Lett 2005;94:25502.
[647] Banerjee S, Ferrari S, Piagge R, Spadoni S. Electron density profile at the interface of SiO2/Si(001). Appl Surf Sci2006;253:17–20.
[648] Li XL, Chen B, Jing HY, Lu HB, Zhao BR, Mai ZH, et al. Experimental evidence of the ”dead layer” at Pt/BaTiO3 interface. ApplPhys Lett 2005;87:222905.
[649] He JQ, Vasco E, Jia CL, Wang RH. Direct observation of a fully strained dead layer at Ba0.7Sr0.3TiO3/SrRuO3 interface. ApplPhys Lett 2005;87:062901.
[650] Stengel M, Spaldin NA. Origin of the dielectric dead layer in nanoscale capacitors. Nature (London) 2006;443:679–82.[651] Maglione M. Interface-driven magnetocapacitance in a broad range of materials. J Phys: Condens Matter
2008;20:322202.[652] Skripov VP, Koverda V, Skokov VN. Size effect on melting of small particles. Phys Status Solidi A 1981;66:109–18.[653] Zhong J, Zhang LH, Jin ZH, Sui ML, Lu K. Superheating of Ag nanoparticles embedded in Ni matrix. Acta Mater
2001;49:2897–904.[654] Sheng HW, Ren G, Peng LM, Hu ZQ, Lu K. Superheating and melting-point depression of Pb nanoparticles embedded in Al
matrices. Philos Mag Lett 1996;73:179–86.[655] Veprek S, Veprek-Heijman MGJ, Karvankova P, Prochazka J. Different approaches to superhard coatings and
nanocomposites. Thin Solid Films 2005;476:1–29.

C.Q. Sun / Progress in Materials Science 54 (2009) 179–307 307
[656] Zhang RF, Sheng SH, Veprek S. Mechanical strengths of silicon nitrides studied by ab initio calculations. Appl Phys Lett2007;90:191903.
[657] Audoit G, Kulkarni JS, Morris MA, Holmes JD. Size dependent thermal properties of embedded crystalline germaniumnanowires. J Mater Chem 2007;17:1608–13.
[658] Liang LH, Li JC, Jiang Q. Superheating thermodynamics of nanocrystals based on the interface effect. Physica B2002;322:188–92.
[659] Dimiduk DM, Woodward C, LeSar R, Uchic MD. Scale-free intermittent flow in crystal plasticity. Science2006;312:1188–90.
[660] Ogata S, Li J, Yip S. Ideal pure shear strength of aluminum and copper. Science 2002;298:807–11.[661] Fu R, Zhang TY. Influences of temperature and electric field on the bending strength of lead zirconate titanate ceramics.
Acta Mater 2000;48:1729–40.[662] Zheng X, Zhu L. Theoretical analysis of electric field effect on Young’s modulus of nanowires. Appl Phys Lett
2006;89:153110.[663] Zhao Y, Zhang J, Clausen B, Shen TD, Gray III GT, Wang L. Thermomechanics of nanocrystalline nickel under high
pressure–temperature conditions. Nano Lett 2007;7:426–32.[664] Veprek RG, Parks DM, Argon AS, Veprek S. Non-linear finite element constitutive modeling of mechanical properties hard
and superhard materials studied by indentation. Mater Sci Eng A 2006;422:205–17.[665] Mook WM, Nowak JD, Perrey CR, Carter CB, Mukherjee R, Girshick SL, et al. Compressive stress effects on nanoparticle
modulus and fracture. Phys Rev B 2007;75:214112.[666] Balibar S. How could a solid be superfluid? Physics 2008;1:16. doi:10.1103/Physics.1.16.[667] Balibar S, Caupin F. Supersolidity and disorder. J Phys: Condens Matter 2008;20:173201.[668] Kim E, Chan MHW. Probable observation of a supersolid helium phase. Nature 2004;427:225–7.[669] Day J, Beamish J. Low-temperature shear modulus changes in solid 4He and connection to supersolidity. Nature
2007;450:853–6.[670] Pollet L, Boninsegni M, Kuklov AB, Prokofév NV, Svistunov BV, Troyer M. Local stress and superfluid properties of solid
4He. Phys Rev Lett 2008;101:097202.[671] Sasaki S, Ishiguro R, Caupin F, Maris HJ, Balibar S, et al. Superfluidity of grain boundaries and supersolid behavior. Science
2006;313:1098–100.


![Time domain aero-thermo-elastic instability of two-dimensional … · 2020. 11. 3. · and Khala˝ [32]esented a numerical analysis for the aero-thermo-elastic behavior of functionally-gr()](https://static.fdocuments.in/doc/165x107/60d9ab8ca83c673d7a7c3fa2/time-domain-aero-thermo-elastic-instability-of-two-dimensional-2020-11-3-and.jpg)
![Thermo-Mechanical Behavior of Non Symmetric (Al/Al O FGM ... · Zenkour [3] presented a two-dimensional solution for bending analysis of simply supported functionally graded ceramic–metal](https://static.fdocuments.in/doc/165x107/5ed8f54c6714ca7f4768e32f/thermo-mechanical-behavior-of-non-symmetric-alal-o-fgm-zenkour-3-presented.jpg)
