THERMO-FLUID DYNAMIC EXPERIMENT of He II CAVITATING FLOW
11
Proceedings of the 7 th International Symposium on Cavitation CAV2009 – Paper No. 65 August 17-22, 2009, Ann Arbor, Michigan, USA 1 THERMO-FLUID DYNAMIC EXPERIMENT of He II CAVITATING FLOW Masahide Murakami University of Tsukuba Tsukuba, Japan Kohei Harada University of Tsukuba Tsukuba, Japan ABSTRACT We have conducted a series of experiments of superfluid helium, He II, cavitating flows. For the purpose of comparison, normal fluid, He I, flows were also examined. In the experiments liquid helium flows driven by a bellows pump were investigated by flow visualization method and PIV, and through the measurements of the temperature depression and the pressure loss. The most noticeable features characterizing superfluid cavitating flows arise from superthermal conduction, the specific heat anomaly and quantized vortices. Due to the superthermal conduction phenomena, latent heat can be supplied to cavitation bubbles from bulk liquid almost without limit, and consequently the development of cavitation is considerably rapid and in large-scale in He II. The specific heat becomes extremely large across the lambda phase transition line from He I to He II, which is known as the specific heat anomaly. In the present study, the experimental results obtained so far were examined with respect to the thermodynamic effect in He II cavitating flows referring to the Brennen thermodynamic parameter Σ. It is seen that in most aspects the thermodynamic effect is negligible in cavitating flows of He II owing to the superthermal conduction. This means He II hardly behaves as a cryogenic fluid in cavitation phenomena. It is, on the other hand, found that the temperature depression is not negligible and there is apparent temperature dependence in its variation. Consequently, He II may, in some aspects, be expected to behave as a cryogenic fluid in cavitation because of extremely large void fraction. INTRODUCTION In recent years, there is a tendency that even cryogenic liquid flows at high speed and in large quantity in the applications to large cryogenic systems, such as large scale superconductive magnets used for high energy physics accelerators and fusion reactors, and large scale space cryogenic systems for space telescopes and cryogenic fuel supply systems in liquid rocket engines. Consequently flow cavitation tends to be easily induced in cryogenic liquid flow systems. This may pose a possible engineering problem in cryogenic systems. Some characteristic features of cavitation in cryogenic fluids, such as large thermodynamic effect, large variations in physical quantities and easy transition to cavitation, have been pointed out in a number of studies [1-5]. However, so far engineering aspects of cavitation flows in cryogenic liquids have not been fully made clear experimentally. Liquid helium is now frequently utilized as a cryogenic coolant for large superconducting magnets and infrared space telescopes. However, there have been far fewer researches on liquid helium cavitating flows. Daney et al. [6,7] and Ludtke [8] experimentally studied liquid helium cavitating flows through a Venturi channel and pumps. They concluded that a larger pressure drop was induced in superfluid helium (He II, T < 2.17 K) flows than in He I (normal fluid helium) flows when cavitation was involved, and that He II was highly susceptible to cavitation while He I was more insensitive to it. Ishimoto [9] attempted a numerical study of thermal fluid characteristics of cavitating flow of liquid helium through a converging- diverging nozzle at the temperatures near the lambda point by taking into account the effect of superfluidity. Our group has performed a series of experimental studies to elucidate the characteristic features of cavitating flows of He II. Ishii [10- 12] made studies of liquid helium cavitating flows through a converging-diverging channel by visualization and measurements of the pressure loss and the temperature depression. Some of the characteristics of cavitating flows of He II were clarified by comparing them with those of He I. However, distinctive features of the cavitating flows of He II were not fully revealed in these experiments, and more quantitative studies are still required. On the other hand, in a certain period of time studies on cavitation of superfluid helium had been performed. It was once thought that all impurities (except 3 He) froze out of liquids at cryogenic temperatures, and consequently it was possible to prepare liquid helium with much higher purity than ordinary liquids at room temperature. This preconception naturally suggested that homogeneous nucleation theory could be applied to liquid helium cavitation due to extremely high purity. Most experiments had been conducted to measure the tensile strength for large volume of quiescent liquid helium. However, the experimental results in the 1960’s that the tensile strength was far smaller than the theoretical prediction were in
Transcript of THERMO-FLUID DYNAMIC EXPERIMENT of He II CAVITATING FLOW

Proceedings of the 7th International Symposium on Cavitation CAV2009 – Paper No. 65
August 17-22, 2009, Ann Arbor, Michigan, USA
1
THERMO-FLUID DYNAMIC EXPERIMENT of He II CAVITATING FLOW
Masahide Murakami University of Tsukuba
Tsukuba, Japan
Kohei Harada University of Tsukuba
Tsukuba, Japan
ABSTRACT We have conducted a series of experiments of superfluid helium, He II, cavitating flows. For the purpose of comparison, normal fluid, He I, flows were also examined. In the experiments liquid helium flows driven by a bellows pump were investigated by flow visualization method and PIV, and through the measurements of the temperature depression and the pressure loss. The most noticeable features characterizing superfluid cavitating flows arise from superthermal conduction, the specific heat anomaly and quantized vortices. Due to the superthermal conduction phenomena, latent heat can be supplied to cavitation bubbles from bulk liquid almost without limit, and consequently the development of cavitation is considerably rapid and in large-scale in He II. The specific heat becomes extremely large across the lambda phase transition line from He I to He II, which is known as the specific heat anomaly. In the present study, the experimental results obtained so far were examined with respect to the thermodynamic effect in He II cavitating flows referring to the Brennen thermodynamic parameter Σ. It is seen that in most aspects the thermodynamic effect is negligible in cavitating flows of He II owing to the superthermal conduction. This means He II hardly behaves as a cryogenic fluid in cavitation phenomena. It is, on the other hand, found that the temperature depression is not negligible and there is apparent temperature dependence in its variation. Consequently, He II may, in some aspects, be expected to behave as a cryogenic fluid in cavitation because of extremely large void fraction.
INTRODUCTION In recent years, there is a tendency that even cryogenic liquid flows at high speed and in large quantity in the applications to large cryogenic systems, such as large scale superconductive magnets used for high energy physics accelerators and fusion reactors, and large scale space cryogenic systems for space telescopes and cryogenic fuel supply systems in liquid rocket engines. Consequently flow cavitation tends to be easily induced in cryogenic liquid flow systems. This may pose a possible engineering problem in cryogenic systems. Some characteristic features of cavitation in cryogenic fluids, such as large thermodynamic effect, large
variations in physical quantities and easy transition to cavitation, have been pointed out in a number of studies [1-5]. However, so far engineering aspects of cavitation flows in cryogenic liquids have not been fully made clear experimentally. Liquid helium is now frequently utilized as a cryogenic coolant for large superconducting magnets and infrared space telescopes. However, there have been far fewer researches on liquid helium cavitating flows. Daney et al. [6,7] and Ludtke [8] experimentally studied liquid helium cavitating flows through a Venturi channel and pumps. They concluded that a larger pressure drop was induced in superfluid helium (He II, T < 2.17 K) flows than in He I (normal fluid helium) flows when cavitation was involved, and that He II was highly susceptible to cavitation while He I was more insensitive to it. Ishimoto [9] attempted a numerical study of thermal fluid characteristics of cavitating flow of liquid helium through a converging-diverging nozzle at the temperatures near the lambda point by taking into account the effect of superfluidity. Our group has performed a series of experimental studies to elucidate the characteristic features of cavitating flows of He II. Ishii [10-12] made studies of liquid helium cavitating flows through a converging-diverging channel by visualization and measurements of the pressure loss and the temperature depression. Some of the characteristics of cavitating flows of He II were clarified by comparing them with those of He I. However, distinctive features of the cavitating flows of He II were not fully revealed in these experiments, and more quantitative studies are still required. On the other hand, in a certain period of time studies on cavitation of superfluid helium had been performed. It was once thought that all impurities (except 3He) froze out of liquids at cryogenic temperatures, and consequently it was possible to prepare liquid helium with much higher purity than ordinary liquids at room temperature. This preconception naturally suggested that homogeneous nucleation theory could be applied to liquid helium cavitation due to extremely high purity. Most experiments had been conducted to measure the tensile strength for large volume of quiescent liquid helium. However, the experimental results in the 1960’s that the tensile strength was far smaller than the theoretical prediction were in

2
striking disagreement with homogeneous nucleation theory. Now, it is understood that heterogeneous nucleation mostly occurred even in liquid helium and consequently the cavitation strength was so much lower than the theoretical prediction [13]. Since no special care had been taken to keep the liquid helium clean in most previous experiments, the liquid helium had contained particles of frozen air, positive or negative ions presumably generated by cosmic rays, and quantized vortices. Of course, solid wall of the experimental cell also highly contributed to the heterogeneous nucleation. In new experiments in which small amount of highly purified liquid helium was depressed with focused ultrasonic wave the results were in much closer agreement with the theory [14, 15]. It was found that for extremely high purity He II at low temperatures below 0.2 K the tensile strength fell nearly down to the spinodal pressure and nucleation is dominated even by quantum tunneling rather than by thermal activation. On the other hand, in most engineering applications, liquid helium of ordinary grade in which solid particles, positive or negative ions and quantized vortices are contained is used, and its flow in fluid machinery is surrounded by solid walls, in which cases heterogeneous nucleation dominantly occurs in the cavitation inception process. It was thus suggested that researches on cavitation of ordinary grade liquid helium were of great importance in the engineering application fields of liquid helium as a coolant in large-scale cryogenic systems. LIQUID HE II AND TWO-FLUID MODEL The characteristic feature of superfluid dynamics of He II is described in this section. The phase diagram of helium (4He) at very low temperature is shown in Figure 1. One of the characteristic features of liquid helium is that there are two liquid phases separated by the lambda-line (λ-line). It is another singular property that anomalously large specific heat in the form of Greek character λ appears around the lambda point temperature (2.17 K) as seen in Figure 2. The liquid phase on the lower temperature side of the λ-line is called He II presenting the superfluidity, while the higher temperature phase is He I that is just a cryogenic viscous fluid. Dynamic behavior of superfluid can be well explained on the basis of the two-fluid model, in which superfluid is considered as a mixture of two fluids, that is the superfluid component with zero viscosity and entropy, and the normal fluid component with non-zero viscosity and entropy [19]. The most prominent property of superfluid that has crucial effect on He II cavitating flows is the superthermal conduction phenomena. Heating He II creates excitations, which is the normal fluid component, and it flows in the opposite direction to heating. Because of the total mass conservation, a flow of the superfluid component towards the heating site is generated. These two kinds of flows result in an internal counterflow between the two components, called the thermal counterflow, where only the normal component flow carries the entropy. Macroscopic amount of heat can be transported without any appreciable temperature gradient and viscous drag under zero net mass flow condition, and therefore it is called the superthermal conduction. This effective thermal conductivity becomes more than two orders of magnitude larger than that for high-purity copper at low temperatures, and,
Figure 1: Phase diagram of 4He at very low temperature
Figure 2: Variation of the specific heat of liquid helium with temperature. Anomaly arises around Tλ (=2.17 K) of course, far larger than the physical thermal conductivities of He II and He I as seen in Figure 3. In fact, the superthermal conduction is not a thermal conduction phenomenon but a convective one in a form of internal convection with huge effective thermal conductivity. This phenomenon enables latent heat supply nearly without limit for the development of cavitation bubbles, which makes the He II cavitation flow characteristic.
Temperature T [K]
λ-transit ion
l ine

3
Figure 3: The variations of the effective thermal conductivity for He II superthermal conduction process, κeff, with the temperature. The variations of those of some materials including κHe I are also shown in this figure EXPERIMENTAL SET UP AND TWO-FLUID MODEL An illustration of the cryostat and the evacuation system used in this series of experiments is shown in Figure 4. It is the characteristic of the cryostat that it has three optical windows for visualization and PIV application. The innermost windows are superleak tight. The cryostat is made of stainless steel, and the size is 1.5 m high and 0.4 m in outer diameter. The experimental space inside the cryostat has an ID of 14 cm and a height of 40 cm. The temperature of He II is controlled through the vapor pressure control with an automatic pressure-regulating valve by the accuracy of ±50 Pa that is equivalent to the temperature accuracy within the order of ±1 mK. Shown in Figure 5 is an illustration of the experimental cavitation flow system that is comprised of a metal bellows, a cavitation flow channel and a pressure transducer; this system was entirely immersed in liquid helium. A differential pressure transducer (Validyne 10D28A7W4F) was used to measure the pressure drop between the upstream chamber and the downstream space outside the cavitation flow channel, which is called the pressure loss. However, in the case where the pressure drop was large, an absolute pressure transducer (Validyne AP10-38A1W4F) was used. It should be noted that the total pressure drop does not only result from the pressure loss caused by cavitating flow but also from the Bernoulli pressure drop in the accelerating flow through the converging section upstream the nozzle. These pressure transducers were in-house calibrated at liquid helium temperature prior to each experiment, as small deviation had been found in liquid helium from the calibrated value at room temperature provided by the manufacturer. Liquid helium flow in the flow channel is generated by letting the bellows shrink driven by the actuator mounted on the
Figure 4: Illustration of the cryostat system
Figure 5: Schematic illustration of the key area of the experimental cavitation flow system
He II
He I
Water
Cu

4
top flange of the cryostat. The actuator is started nearly impulsively and operated at a constant velocity for 1 to 10 sec depending on the flow velocity through the nozzle throat, Vt, that is for more than 10 seconds in cases of slow flow velocity and slightly less than 1 second for the fastest velocity around 20 m/sec. The flow velocity, Vt, is accelerated from the volume flow rate given by the shrinking rate of the bellows multiplied by the average cross sectional area of the bellows. The shrinking rate can be digitally set as the actuator speed. The calibration was performed through the direct velocity measurement of liquid nitrogen flow driven by this bellows pump with a laser Doppler velocimeter (LDV). Geometrical details of the converging-diverging flow channel and the flow channel downstream the converging nozzle are shown in Figure 6. The former was used primarily for the temperature depression measurement, while the latter was applied for the PIV application for simplicity in the flow channel geometry. Cavitation is generated in each flow channel downstream the nozzle throat. These channels are composed of two pieces of thin stainless steel plates with a thickness of 3 mm shaped according to each channel profile, which are placed between the two parallel plates of quartz glass. The cross section of these channels is rectangular with a thickness of 3 mm between the glass plates, a maximum width of 15 mm at the downstream exit of each channel, and a minimum width of 5 mm at the throat of the nozzles. The coordinate system in the flow channels makes the centre of the nozzle exit the origin and takes the x-axis in the direction of the flow and the y-axis in the transverse direction of the flow. Liquid helium flows in the vertically downward direction. Visualization photos of cavitating flows were captured by a digital still camera (Nikon D1X). For the illumination a Xenon-spark light source (Japan Photonics SM-10/LH-15-D)
was used. The digital camera was set in the pitch-dark laboratory with having opened a shutter. For the PIV application, a so-called 2CPIV (two-component particle image velocimetry) was applied with the aid of the method of cross-correlation for particle image analysis. The PIV optical system consists of four components; a digital CCD camera, a light source, a timing synchronizer, and a picture accumulation system. The image resolution of the digital camera, MegaPlus In this application, several sets of two successive pictures with a 35-µs interval were captured at a frequency of 10 Hz. It should be noted that seeding particles were not added in the present PIV application because the cavitation bubbles can play the role of particles. Consequently, it is the velocity of the cavitation bubbles that was measured by the present PIV application. EXPERIMENTAL RESULTS For a general introduction of the characteristic features of cavitating flows of He II, the major results of the series of experiments [10-12, 16, 17] having been conducted by our group are presented. For the sake of comparison, the experiments were also conducted for He I above 2.2 K that is just a cryogenic viscous fluid. In these experimental studies, cavitating flows of liquid helium were investigated from various point of view using different methods such as flow visualization, the measurements of the pressure loss and the temperature depression, and the application of PIV method. In the following, the thermodynamic effects in He II cavitation flows were discussed on the basis of the accumulated experimental results. It is supposed that the characteristic features of cavitating flows of He II originate from such peculiar properties of superfluid as the superthermal conduction, the specific heat anomaly across the lambda line and the existence of quantized vortices. We focus on the thermodynamic effect in He II cavitating flows. Rapid and Large-Scale Development of He II Cavitation Owing to Superthermal Conduction It is quite natural to consider that the superthermal conduction strongly affects cavitating flows of He II. The latent heat of vaporization must be supplied for the creation and growth of cavitation vapor bubbles. It can be supplied in He II almost without limit due to superthermal conduction mechanism, while it is transported by pure thermal conduction in normal fluids such as He I, which is far less effective than the superthermal conduction. Namely, thermal conduction must be a rate controlling process in He I cavitation. This is regarded as one of the crucial factors that bring cavitating flows of He I and He II a definite difference, as the latent heat of vaporization is almost same for both He I and He II within the temperature range we are interested in. Shown in Figure 7-a) are snapshot pictures of cavitating flows of He I and He II in a downstream portion of the C-D channel at the same throat velocity, Vt, of 6.1 m/sec that is slightly above the cavitation inception velocity. The difference in the bubble configurations between He I and He II cavitating flows is quite obvious. In the case of He II, the initial small
(a) (b)
Figure 6: Geometrical details of the design of (a); the converging-diverging (C-D) channel, and (b); the converging jet nozzle channel
Converging-Diverging
Flow Channel Paral le l Flow Channel

5
He II (2.1 K) He I (2.3 K)
He II (1.9 K) He I (2.3 K) Figure 7: Snapshot visualization pictures of the cavitating flows of He II and He I. a) in the downstream portion of the C-D channel in the inception stage (low velocity, Vt = 6.14 m/s), b) in the downstream of the converging nozzle in the fully developed cavitating flow state (high velocity, Vt = 22.5 m/s) vapor bubbles extremely rapidly grew into macroscopic bubbles that had rather transparent surfaces as the cavitating flow proceeded downstream of the channel. In contrast with He II, in the cases of He I just numerous minute vapor bubbles were generated, which looked just like some lumps of dark cloud, and the size of individual bubble remained still very small even in the far downstream of the channel. Shown in Figure 7-b) are visualization pictures of cavitating flows of He II (at 1.9 K) and He I (at 2.3 K) in the flow channel downstream of the converging nozzle in the case of the fully developed cavitating flows at the velocity Vt of 22.5 m/s. It is seen that in the case of the He II flow bubbly flow region fully spreads over the full depth of the downstream-most part of the flow channel. The difference in the magnitude of development of cavitating bubbles between He II and He I cavitating flows is
much more quantitatively understood from the velocity distributions of bubbly flows shown in Figure 8, where the x-component of the bubbly flow velocity, Vx(y) measured with PIV near the downstream end of the flow channel at a distance x=31.6 mm from the nozzle exit is plotted against the downstream span y for both He II and He I for the case of fully developed cavitating flows with Vt at 22.5 m/sec. The large-scale development of He II bubbly flow is seen in this figure, in which the high-speed flow region spreads over the entire width of the flow channel because of the increase in the total volume flow rate of the bubbly flow owing to considerably large volume of vapor bubbles, that is large void fraction. The void fraction will be discussed in the following section.
a)
b)
(a)
(b)
Figure 8: The PIV result of the x-component velocity distribution Vx(y) across the downstream span y at the distance x = 31.6 mm from the nozzle exit for several velocities, Vt. Distributions (a) for He II at T = 1.9 K, and (b) for He I at T = 2.3 K

6
Pressure Loss Caused by Cavitation In the present experimental flow channel, the pressure loss in the flow is caused by cavitation and as a result of flow speed increase in the converging section due to the Bernoulli law. The pressure loss ΔPloss defined as the pressure difference between the plenum chamber upstream the throat and the outside of the flow channel is plotted against Vt
2in Figure 9. It should be noted that in every non-cavitating flow almost no difference could be found in this data plot for both He II and He I at smaller Vt than about 6 m/s. The reason why ΔPloss is nearly in proportion to Vt
2 is the major pressure drop results from the Bernoulli pressure loss in the converging portion of the flow passage. It is interesting to see that the pressure loss is larger for He II flows than for He I ones. The inference that ΔPloss is smaller for He II than for He I due to superfluid inviscid flow is not correct. In fact, the normal fluid component flows together with the superfluid component in the present flow situation and consequently the total flow is not inviscid. It is large-scale development of He II cavitating flow that induces larger pressure loss. It is also seen in Figure 9, though it is not so clear, that the ΔPloss data for He II is almost temperature independent, while those for He I have a temperature dependence in the fully developed cavitation flow region for Vt above 14 m/sec. This may be more clearly seen in Figure 10 where the pressure loss value is plotted against the temperature at a velocity value of Vt = 15.35 m/s for the case shown in Figure 9. Shown in Figure11 is a partial enlarged chart of Figure 9 for small Vt where deviation of the pressure loss branch for cavitating flow from the non-cavitating one is recognized above 6 m/sec. It is seen that the transition of the ΔPloss branch from the non-cavitating to the cavitating ones upon the cavitation inception occurs rather discontinuously for He II but continuously for He I. This results from the rapid development of cavitation bubbles for He II. Cavitation Inception The cavitation inception is a stochastic process rather than a deterministic one. The inception probability is experimentally investigated in the following manner: A flow is generated in an impulsively started manner keeping the flow velocity constant
Figure 9: Relation between the pressure loss ΔPloss and the square of the velocity at the throat Vt for both He II and He I cavitating flows at several temperatures
Figure 10: Pressure loss plotted against the temperature at a velocity value of Vt = 15.35 m/s for the case shown in Figure 9
Figure 11: Relation between the pressure loss ΔPloss and the square of the velocity at the throat Vt for small Vt. (a partial enlarged chart of Figure 9)

7
for several seconds that depends on the flow velocity tested. Each flow event is visually observed by naked eye in the latter half period of the test run with the aid of a high-speed video camera (Photron Fastcam-X 1024PCI) with a resolution of 1024 x 1024 pixels at a speed of 1000 frames/sec. The inception probability is defined by the ratio of the number of events in which bubble generation could be observed to the total event number, mostly 20 events or larger. The result is presented in Figure 12, where the inception probability is plotted as a function of velocity, Vt. A different kind of experimental procedure was also adopted in which cavitating flows were observed in a decelerating process: Each flow was first generated in an impulsively started manner at a velocity Vt of 10.2 m/sec, keeping this constant velocity for about 0.3 sec during which cavitation was always induced, and then the flow velocity Vt was decelerated to a specified constant test value to observe cavitation. The probability is defined in the same manner as the accelerating flow cases. Both the results for accelerating and decelerating flow cases are presented in Figure 12, where typical S-shaped curves are obtained for every case. It is seen that a clear hysteretic feature appears in cavitation inception and disappearance processes. The critical velocity for cavitation inception for both accelerating and decelerating cases that is defined as the velocity at which the inception probability reaches 50 % is shown in Figure 13. It is seen in Figures 12 and 13 that the cavitation inception occurs at smaller Vt for He II than for He I and cavitation disappears at smaller Vt for He II than for He I. This means that He II cavitation occurs more easily and it is harder to disappear than He I. It is also seen in Figure 13 that the critical values depend on the temperature in the case of He I but only weakly for He II. The incipient cavitation number is calculated as a function of temperature as
where the velocity Vt is evaluated by the velocity value at which the inception probability in the accelerating case reaches 50 %, and p∞ and psvp are the pressures in the plenum chamber and the saturated vapor pressure at the temperature of the initial state of the liquid. It should be noted that the second term of the numerator is the pressure rise in the plenum chamber corresponding to the pressure drop in the converging section obeying the Bernoulli law. The result is shown in Figure 14. It is clear that He II cavitation occurs at larger σi than He I and σi is almost temperature independent for He II while it strongly depends on the temperature for He I. The result indicates cavitation is more easily induced in He II than in He I. Quantized vortex lines that only exist in He II are considered to contribute to larger σi value for He II. It is reasoned that the pressure is slightly low in the core region of quantized vortex lines, and consequently bubble nucleation is more easily occur in the core region.
Cavitation-Induced Temperature Depression Latent heat supply from bulk liquid required creating and developing cavitation bubbles causes temperature drop in the liquid, which is called the temperature depression. The experimental result is presented in Figure 15, where the temperature depression is plotted against the liquid velocity, Vt.
�
σ i =p∞ − 12ρVt
2 − psvp12ρVt
2 (1)
Figure 12: Cavitation inception probability as a function of Vt in both accelerating and decelerating processes showing hysteresis feature. The accelerating cases are shown in (a) sign of a, and the decelerating cases in a sign of (d).
Figure 13: Critical flow velocities for cavitation inception Vt,i (Increase) and cavitation disappearance Vt,i (Decrease) that are defined as the velocity at which the probabilities of the cavitation inception (Increase) and cavitation disappearance (Decrease) reach 50%. The data are plotted against the temperature

8
The temperature depression was measured by a single thermometer (Cernox, LakeShore) installed on the centre axis of the flow channel at 27 mm downstream from the nozzle exit. It should be noted that the appreciable temperature depression appears along with the cavitation inception not with Vt =0. It is seen in this figure that the temperature depression is extremely large for He I, as much as 10 % of the bulk liquid temperature and is strongly temperature dependent. On the other hand, it is small for He II as compared with He I. It is, however, important to note that it is neither zero nor temperature independent, though the magnitude and the dependence are not so remarkable as He I. The result that the temperature depression in He II cavitating flows is smaller then that in He I cavitating flows is, in fact, mostly due to the large specific heat of He II. It is interesting to note that the lambda phase transition form He I to He II is registered as the level off of the data curve in the cases where the initial state is He I at the temperatures of 2.2 and 2.3 K and the temperature depression is sufficiently large. This results from the specific heat anomaly in the trans-lambda point region, which is a special feature of liquid helium. These interesting features can be reasoned by a simple theoretical prediction that was derived on the basis of the thermal balance in the latent heat supply process between bulk liquid helium and its vapor in bubbles [11]. The estimate of the temperature depression induced by cavitation is plotted against the void fraction in Figure 16 for several initial liquid temperatures. Smaller values and weaker temperature dependence of the temperature depression for He II compared with He I result from larger specific heat and smaller vapor density of He II. The data curve level-off when the lambda-phase transition from He I to He II occurs is also noted in this result. It is caused by the specific heat anomaly where the specific heat diverges across the lambda phase line.
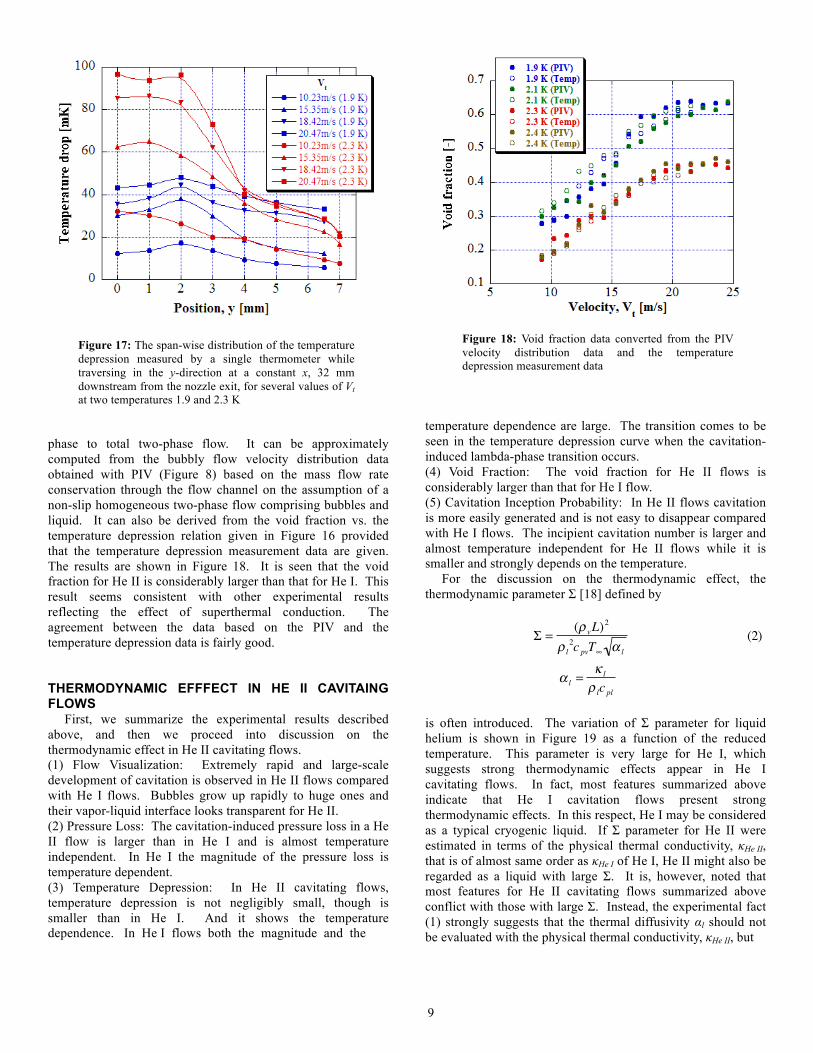
The span-wise distribution of the temperature depression measured by a single thermometer while traversing in the y-direction at a constant x, 32 mm downstream form the nozzle exit is shown in Figure 17, for several values of Vt at two temperatures 1.9 and 2.3 K. It is seen in this figure that the temperature depression is the largest around the shear layer between the main body jet and the separated layer and it is larger for He I than for He II everywhere in the flow channel. The rather uniform temperature depression distribution for He II is caused by the superthermal conduction and large-scale development of cavitating bubbles in He II cavitating flows. Void Fraction One of the measures of the magnitude of cavitation is the void fraction that is defined as the volumetric ratio of vapor
Figure 14: Incipient cavitation number plotted against the temperature
Figure 15: Measurement result of the cavitation-induced temperature drop, the temperature depression, plotted against the liquid velocity at the nozzle throat, Vt.
Figure 16: Estimation result of the cavitation-induced temperature depression as a function of void fraction
9
phase to total two-phase flow. It can be approximately computed from the bubbly flow velocity distribution data obtained with PIV (Figure 8) based on the mass flow rate conservation through the flow channel on the assumption of a non-slip homogeneous two-phase flow comprising bubbles and liquid. It can also be derived from the void fraction vs. the temperature depression relation given in Figure 16 provided that the temperature depression measurement data are given. The results are shown in Figure 18. It is seen that the void fraction for He II is considerably larger than that for He I. This result seems consistent with other experimental results reflecting the effect of superthermal conduction. The agreement between the data based on the PIV and the temperature depression data is fairly good. THERMODYNAMIC EFFFECT IN HE II CAVITAING FLOWS First, we summarize the experimental results described above, and then we proceed into discussion on the thermodynamic effect in He II cavitating flows. (1) Flow Visualization: Extremely rapid and large-scale development of cavitation is observed in He II flows compared with He I flows. Bubbles grow up rapidly to huge ones and their vapor-liquid interface looks transparent for He II. (2) Pressure Loss: The cavitation-induced pressure loss in a He II flow is larger than in He I and is almost temperature independent. In He I the magnitude of the pressure loss is temperature dependent. (3) Temperature Depression: In He II cavitating flows, temperature depression is not negligibly small, though is smaller than in He I. And it shows the temperature dependence. In He I flows both the magnitude and the
temperature dependence are large. The transition comes to be seen in the temperature depression curve when the cavitation-induced lambda-phase transition occurs. (4) Void Fraction: The void fraction for He II flows is considerably larger than that for He I flow. (5) Cavitation Inception Probability: In He II flows cavitation is more easily generated and is not easy to disappear compared with He I flows. The incipient cavitation number is larger and almost temperature independent for He II flows while it is smaller and strongly depends on the temperature. For the discussion on the thermodynamic effect, the thermodynamic parameter Σ [18] defined by
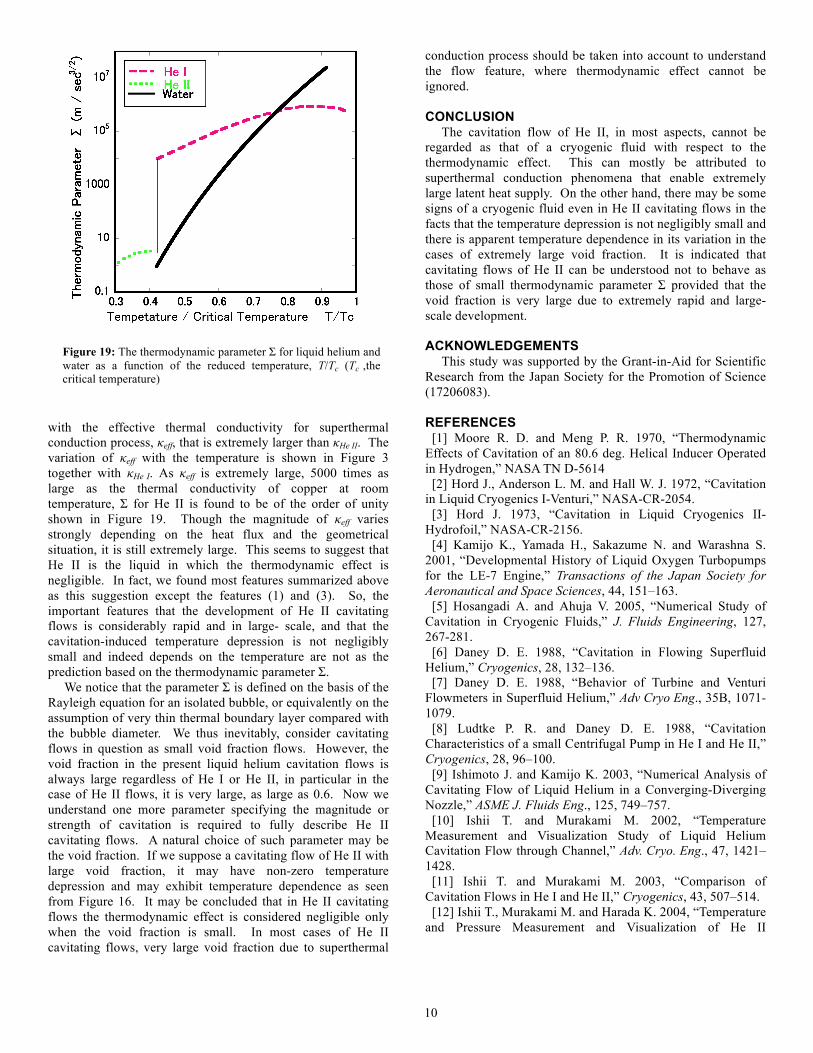
is often introduced. The variation of Σ parameter for liquid helium is shown in Figure 19 as a function of the reduced temperature. This parameter is very large for He I, which suggests strong thermodynamic effects appear in He I cavitating flows. In fact, most features summarized above indicate that He I cavitation flows present strong thermodynamic effects. In this respect, He I may be considered as a typical cryogenic liquid. If Σ parameter for He II were estimated in terms of the physical thermal conductivity, κHe II, that is of almost same order as κHe I of He I, He II might also be regarded as a liquid with large Σ. It is, however, noted that most features for He II cavitating flows summarized above conflict with those with large Σ. Instead, the experimental fact (1) strongly suggests that the thermal diffusivity αl should not be evaluated with the physical thermal conductivity, κHe II, but
�
Σ =(ρ vL)
2
ρ l2c pvT∞ α l
(2)
α l =κ l
ρ lc pl
Figure 17: The span-wise distribution of the temperature depression measured by a single thermometer while traversing in the y-direction at a constant x, 32 mm downstream from the nozzle exit, for several values of Vt at two temperatures 1.9 and 2.3 K
Figure 18: Void fraction data converted from the PIV velocity distribution data and the temperature depression measurement data
10
with the effective thermal conductivity for superthermal conduction process, κeff, that is extremely larger than κHe II. The variation of κeff with the temperature is shown in Figure 3 together with κHe I. As κeff is extremely large, 5000 times as large as the thermal conductivity of copper at room temperature, Σ for He II is found to be of the order of unity shown in Figure 19. Though the magnitude of κeff varies strongly depending on the heat flux and the geometrical situation, it is still extremely large. This seems to suggest that He II is the liquid in which the thermodynamic effect is negligible. In fact, we found most features summarized above as this suggestion except the features (1) and (3). So, the important features that the development of He II cavitating flows is considerably rapid and in large- scale, and that the cavitation-induced temperature depression is not negligibly small and indeed depends on the temperature are not as the prediction based on the thermodynamic parameter Σ. We notice that the parameter Σ is defined on the basis of the Rayleigh equation for an isolated bubble, or equivalently on the assumption of very thin thermal boundary layer compared with the bubble diameter. We thus inevitably, consider cavitating flows in question as small void fraction flows. However, the void fraction in the present liquid helium cavitation flows is always large regardless of He I or He II, in particular in the case of He II flows, it is very large, as large as 0.6. Now we understand one more parameter specifying the magnitude or strength of cavitation is required to fully describe He II cavitating flows. A natural choice of such parameter may be the void fraction. If we suppose a cavitating flow of He II with large void fraction, it may have non-zero temperature depression and may exhibit temperature dependence as seen from Figure 16. It may be concluded that in He II cavitating flows the thermodynamic effect is considered negligible only when the void fraction is small. In most cases of He II cavitating flows, very large void fraction due to superthermal
conduction process should be taken into account to understand the flow feature, where thermodynamic effect cannot be ignored. CONCLUSION The cavitation flow of He II, in most aspects, cannot be regarded as that of a cryogenic fluid with respect to the thermodynamic effect. This can mostly be attributed to superthermal conduction phenomena that enable extremely large latent heat supply. On the other hand, there may be some signs of a cryogenic fluid even in He II cavitating flows in the facts that the temperature depression is not negligibly small and there is apparent temperature dependence in its variation in the cases of extremely large void fraction. It is indicated that cavitating flows of He II can be understood not to behave as those of small thermodynamic parameter Σ provided that the void fraction is very large due to extremely rapid and large-scale development. ACKNOWLEDGEMENTS This study was supported by the Grant-in-Aid for Scientific Research from the Japan Society for the Promotion of Science (17206083). REFERENCES [1] Moore R. D. and Meng P. R. 1970, “Thermodynamic Effects of Cavitation of an 80.6 deg. Helical Inducer Operated in Hydrogen,” NASA TN D-5614 [2] Hord J., Anderson L. M. and Hall W. J. 1972, “Cavitation in Liquid Cryogenics I-Venturi,” NASA-CR-2054. [3] Hord J. 1973, “Cavitation in Liquid Cryogenics II-Hydrofoil,” NASA-CR-2156. [4] Kamijo K., Yamada H., Sakazume N. and Warashna S. 2001, “Developmental History of Liquid Oxygen Turbopumps for the LE-7 Engine,” Transactions of the Japan Society for Aeronautical and Space Sciences, 44, 151–163. [5] Hosangadi A. and Ahuja V. 2005, “Numerical Study of Cavitation in Cryogenic Fluids,” J. Fluids Engineering, 127, 267-281. [6] Daney D. E. 1988, “Cavitation in Flowing Superfluid Helium,” Cryogenics, 28, 132–136. [7] Daney D. E. 1988, “Behavior of Turbine and Venturi Flowmeters in Superfluid Helium,” Adv Cryo Eng., 35B, 1071-1079. [8] Ludtke P. R. and Daney D. E. 1988, “Cavitation Characteristics of a small Centrifugal Pump in He I and He II,” Cryogenics, 28, 96–100. [9] Ishimoto J. and Kamijo K. 2003, “Numerical Analysis of Cavitating Flow of Liquid Helium in a Converging-Diverging Nozzle,” ASME J. Fluids Eng., 125, 749–757. [10] Ishii T. and Murakami M. 2002, “Temperature Measurement and Visualization Study of Liquid Helium Cavitation Flow through Channel,” Adv. Cryo. Eng., 47, 1421–1428. [11] Ishii T. and Murakami M. 2003, “Comparison of Cavitation Flows in He I and He II,” Cryogenics, 43, 507–514. [12] Ishii T., Murakami M. and Harada K. 2004, “Temperature and Pressure Measurement and Visualization of He II
Figure 19: The thermodynamic parameter Σ for liquid helium and water as a function of the reduced temperature, T/Tc (Tc ,the critical temperature)

11
Cavitation Flow through Venturi Channel,” Adv. Cryo. Eng., 49, 1052–105 [13] Maris H. J., Balibar S. and Pettersen M. S. 1993, “Nucleation of Bubbles in Liquid Helium,” J. Low Temp. Phys., 93-5/6, 1069-1077. [14] Nissen J. A., Bodegom E., Brodie L. C. and Semura C. W. 1989, “Tensile Strength of Liquid Helium II,” Phys. Rev. B, 40, 6617-6624. [15] Caupin F., Balibar S. and Maris H. 2003, “Limits of Metastability of Liquid Helium,” Physica B, 329-333, 356-359. [16] Harada K. and Murakami M. 2006, “PIV Analysis of Cavitation Flow Characteristics of He II,” Adv. Cryo. Eng., 51A, 167-1684. [17] Harada K., Murakami M. and Ishii T. 2006, “PIV Measurements for Flow Pattern and Void Fraction in Cavitating Flows of He I and He II,” Cryogenics, 46, 648-657. [18] Brennen C. R. 1973 “The Dynamic Behavior and Complicate of a Stream of Cavitation Bubbles,” J. Fluids Eng., 95, 533-541. [19] Landau L. D. 1941, “The Theory of Superfluidity of Helium II”, J. Physics USSR, 5, 71.