Thermo Active Building Systems(TABS) - Performance...
71
General rights Copyright and moral rights for the publications made accessible in the public portal are retained by the authors and/or other copyright owners and it is a condition of accessing publications that users recognise and abide by the legal requirements associated with these rights. • Users may download and print one copy of any publication from the public portal for the purpose of private study or research. • You may not further distribute the material or use it for any profit-making activity or commercial gain • You may freely distribute the URL identifying the publication in the public portal If you believe that this document breaches copyright please contact us providing details, and we will remove access to the work immediately and investigate your claim. Downloaded from orbit.dtu.dk on: Aug 31, 2018 Thermo Active Building Systems(TABS) - Performance in practice and possibilities for optimization Kolarik, Jakub Publication date: 2016 Document Version Publisher's PDF, also known as Version of record Link back to DTU Orbit Citation (APA): Kolarik, J. (2016). Thermo Active Building Systems(TABS) - Performance in practice and possibilities for optimization. Technical University of Denmark, Department of Civil Engineering. (DTU Byg Sagsrapport; No. SR-16-04 (DK)).
Transcript of Thermo Active Building Systems(TABS) - Performance...
General rights Copyright and moral rights for the publications made accessible in the public portal are retained by the authors and/or other copyright owners and it is a condition of accessing publications that users recognise and abide by the legal requirements associated with these rights.
• Users may download and print one copy of any publication from the public portal for the purpose of private study or research. • You may not further distribute the material or use it for any profit-making activity or commercial gain • You may freely distribute the URL identifying the publication in the public portal
If you believe that this document breaches copyright please contact us providing details, and we will remove access to the work immediately and investigate your claim.
Downloaded from orbit.dtu.dk on: Aug 31, 2018
Thermo Active Building Systems(TABS) - Performance in practice and possibilities foroptimization
Kolarik, Jakub
Publication date:2016
Document VersionPublisher's PDF, also known as Version of record
Link back to DTU Orbit
Citation (APA):Kolarik, J. (2016). Thermo Active Building Systems(TABS) - Performance in practice and possibilities foroptimization. Technical University of Denmark, Department of Civil Engineering. (DTU Byg Sagsrapport; No.SR-16-04 (DK)).

DTU Byg-Sagsrapport SR-16-04 (DK)Marts 2016
Jakub Kolarik
SagsrapportInstitut for Byggeri og Anlæg2016
Thermo Active Building Systems(TABS) - Performance in practice andpossibilities for optimization
1
Thermo Active Building Systems (TABS) – Performance in practice and possibilities for
optimization Byg Sagsrapport SR 16‐04 (DK) DTU Civil Engineering Department of Civil Engineering Technical University of Denmark Building 118 DK‐2800 Kgs. Lyngby Denmark www.byg.dtu.dk Tel: (+45) 45 25 17 00 Fax: (+45) 45 88 32 82 Mail: [email protected]
2
1. Preface The project “Thermo Active Building Systems (TABS) – Performance in practice and possibilities for
optimization” was carried out at DTU Byg in the period form 1.9.2012 until 31.12.2014. The aim of the project was to conduct field measurements in modern office buildings equipped with TABS systems to fill the gap in missing data on the practical performance of such buildings. The project comprised both field data collection regarding indoor environmental quality and occupant satisfaction and analyses of data from Building Management Systems (BMS) accompanied by building energy simulations.
The project was financed by Bjarne Saxhof foundation.

3
Table of Contents 1. Preface .......................................................................................................................................... 2
2. Introduction and objectives .......................................................................................................... 4
3. Project progress ............................................................................................................................ 5
4. Research Findings ......................................................................................................................... 7
5. Conclusions ................................................................................................................................ 15
6. References................................................................................................................................... 16
7. Appendix 1 – Reports on occupant satisfaction surveys sent to investigated buildings ............ 17
8. Appendix 2 – Conference paper “OPERATIVE TEMPERATURE DRIFTS AND OCCUPANT
SATISFACTION WITH THERMAL ENVIRONMENT IN THREE OFFICE BUILDINGS USING
RADIANT HEATING/ COOLING SYSTEM” presented at Healthy Buildings 2015, Eindhoven,
The Netherlands ................................................................................................................................. 48
9. Appendix 3 – Conference paper “Influence of measurement uncertainty on classification of
thermal environment in buildings according to European Standard EN 15251” presented at 7.
Passivhus Norden | Sustainable Cities and Buildings, Copenhagen, Denmark ................................. 56

4
2. Introduction and objectives Thermo Active Building Systems (TABS) are increasingly used for heating and cooling of non-industrial
buildings. TABS consist of tube heat exchangers integrated in the concrete floor/ceiling slabs of the building. These systems allow separation of temperature control and ventilation because heat or cooling loads are extracted mainly by means of radiant heat transfer. For example, during the summer season, heat loads are absorbed during the day. Then thermal mass of the building is cooled down at night when outdoor temperature is low. This reduces, or even eliminates need for mechanical cooling. Another advantage of the system is that temperature of the cooling/heating water may be kept close to room temperature, which gives a possibility to utilize renewable energy sources (heat pumps, ground heat exchangers etc.). Experiences with buildings equipped with TABS show that their energy consumption for heating and cooling is typically 2 to 3 times lower than the one of today’s standard office building. This makes the TABS an interesting alternative for newly constructed buildings.
Despite the fact that TABS are being increasingly used, documentation of their real performance is rather limited. Majority of available measurements were made in Germany, Austria and Switzerland. Performance of TABS in Scandinavian office buildings has not been thoroughly documented yet. Moreover, most of available studies focus mainly on energy consumption and put minor weight on indoor environment. Computer simulations done at the Centre for Indoor Environment and Energy showed that it is mainly the indoor environment that can be aggravated if the system does not work properly in practice. Even thought the system was carefully designed, occupants may experience periods with aggravated thermal comfort, mainly due to too low or too high temperatures (overcooling or overheating). This is because a control strategy of the system almost always needs on site optimization (“tuning” of inlet/outlet temperatures, mass flow, pump schedule etc.). Otherwise it is difficult to reach optimal performance. The system is sensitive to dynamic thermal behaviour of the building and to the way the building is actually being operated (this mainly includes behaviour of the occupants, ventilation and solar shading). Moreover, due to the considerable inertia of involved thermal mass, it is not possible to control temperature in individual rooms. Temperature control covers typically a particular zone of the building without possibility for rapid temperature changes. In reality, the TABS are rarely operating in steady-state. The dynamics elements of the operation like the start-up, shut down etc. are the periods with highest potential for aggravated indoor environment. Unfortunately, these periods are usually left out from the analysis.
With proper tuning/optimization of the control strategy, significant reduction of periods with overcooling and overheating can be achieved. In addition, it was shown by simulations that further tuning of TABS can also result in about 10% reduction of system’s energy consumption.
In the practice, the optimization is usually done without having detailed information about thermal comfort of the occupants. Control engineer works only with building management system (BMS) that provides data on room air/operative temperatures and has therefore no possibility to evaluate possible local thermal discomfort, risk of draught etc. Moreover, direct feedback from the occupants is not included. Such additional information that would help to make the optimization process easier and more effective can be obtained by thorough post occupancy evaluation including detailed analysis of indoor environment and questionnaire survey focused on perceptions of the occupants.

5
The project had following objectives: 1. To fill the gap in missing data on the practical performance of TABS in office buildings exposed to
Danish climatic conditions. 2. To explore, to which extend can post occupancy evaluation conducted in real building with TABS
provide the information useful for optimization of the TABS control strategy. 3. To study whether such optimization will decrease energy consumption and improve indoor
environment in the building.
3. Project progress To fulfil the objectives the project was divided into three phases: Phase 1-Preparation, Phase 2-Monitoring
campaign and Phase 3-Dissemination. It was decided to broaden the scope of the project also to buildings outside Denmark. Out of five identified buildings, four agreed to participate in the project. Two buildings were situated in Denmark, one in Italy and one in Spain. Contact to facility management in the buildings was established and details of measuring campaign were individually negotiated in each building. This was necessary as each of the buildings/building owners had its own requirements rules and restrictions that had to be accepted. Table 1 summarizes the investigations conducted in each building.
Table 1 – Overview of surveyed buildings Building number
Building name
Location: Town, Country
Long-term indoor climate measurements (“start date” – “end date”)
Short-term indoor climate measurements
Collection of data from BMS system
On-line questionnaires to occupants (“month”)
1 Viborg Town Hall,
Viborg, Denmark
Yes (18.9.2012 – 27.2.2014)
Yes Yes Yes (May 2013)
2 IDOM headquarters,
Madrid, Spain
Yes (26.12.2012 – 23.1.2014)
No (Yes)* Yes (May 2013)
3 COWI headquarters,
Aalborg, Denmark
Yes (29.4.2013 – 11.2.2014)
Yes No** Yes (May 2013)
4 TiFS headquarters,
Padova, Italy
Yes (17.7.2013 – 29.9.2014)
Yes Yes
Yes (September 2013)
*Data from BMS system are available, however has not been supplied by the facility manager. As there is a manuscript in preparation describing the building and conducted measurements, it is expected that data will be delivered in spring 2015. **It was not possible to obtain any data from the BMS system in the building.
As it can be seen from the table, start of the measuring campaign was delayed for some of the buildings.
This was caused by organizational issues. For some buildings, negotiations and preparations for their inclusion in the project took longer time than foreseen in the original time schedule. As the request for project extension from 28 November 2013 was approved by the Foundation, it was possible to finish long term measurements in all buildings. It can be also seen from the Table 1 that BMS data are not collected for building number 3. The building has been equipped with BMS system; however, according to the contact person in the building, the data are not stored (only instantaneous visualization of the data is in operation). Therefore it was decided to conduct all the data analyses based on long term measurements and questionnaire survey. Additionally, an attempt was made to collect data regarding energy use and
6
performance of the radiant cooling system “manually” – by means of observation and interview with building’s facility manager.
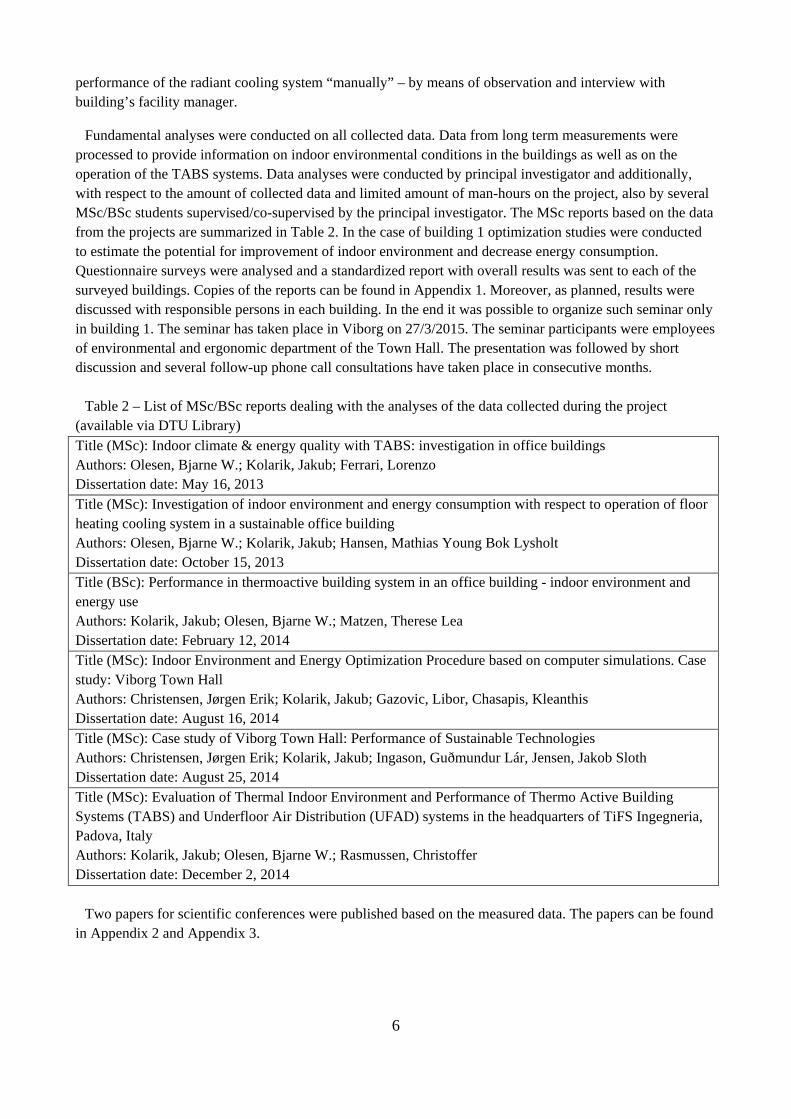
Fundamental analyses were conducted on all collected data. Data from long term measurements were processed to provide information on indoor environmental conditions in the buildings as well as on the operation of the TABS systems. Data analyses were conducted by principal investigator and additionally, with respect to the amount of collected data and limited amount of man-hours on the project, also by several MSc/BSc students supervised/co-supervised by the principal investigator. The MSc reports based on the data from the projects are summarized in Table 2. In the case of building 1 optimization studies were conducted to estimate the potential for improvement of indoor environment and decrease energy consumption. Questionnaire surveys were analysed and a standardized report with overall results was sent to each of the surveyed buildings. Copies of the reports can be found in Appendix 1. Moreover, as planned, results were discussed with responsible persons in each building. In the end it was possible to organize such seminar only in building 1. The seminar has taken place in Viborg on 27/3/2015. The seminar participants were employees of environmental and ergonomic department of the Town Hall. The presentation was followed by short discussion and several follow-up phone call consultations have taken place in consecutive months.
Table 2 – List of MSc/BSc reports dealing with the analyses of the data collected during the project
(available via DTU Library) Title (MSc): Indoor climate & energy quality with TABS: investigation in office buildings Authors: Olesen, Bjarne W.; Kolarik, Jakub; Ferrari, Lorenzo Dissertation date: May 16, 2013 Title (MSc): Investigation of indoor environment and energy consumption with respect to operation of floor heating cooling system in a sustainable office building Authors: Olesen, Bjarne W.; Kolarik, Jakub; Hansen, Mathias Young Bok Lysholt Dissertation date: October 15, 2013 Title (BSc): Performance in thermoactive building system in an office building - indoor environment and energy use Authors: Kolarik, Jakub; Olesen, Bjarne W.; Matzen, Therese Lea Dissertation date: February 12, 2014 Title (MSc): Indoor Environment and Energy Optimization Procedure based on computer simulations. Case study: Viborg Town Hall Authors: Christensen, Jørgen Erik; Kolarik, Jakub; Gazovic, Libor, Chasapis, Kleanthis Dissertation date: August 16, 2014 Title (MSc): Case study of Viborg Town Hall: Performance of Sustainable Technologies Authors: Christensen, Jørgen Erik; Kolarik, Jakub; Ingason, Guðmundur Lár, Jensen, Jakob Sloth Dissertation date: August 25, 2014 Title (MSc): Evaluation of Thermal Indoor Environment and Performance of Thermo Active Building Systems (TABS) and Underfloor Air Distribution (UFAD) systems in the headquarters of TiFS Ingegneria, Padova, Italy Authors: Kolarik, Jakub; Olesen, Bjarne W.; Rasmussen, Christoffer Dissertation date: December 2, 2014
Two papers for scientific conferences were published based on the measured data. The papers can be found
in Appendix 2 and Appendix 3.
7
4. Research Findings The first objective of the project was to fill the gap in missing data on the practical performance of TABS
in office buildings exposed to Danish climatic conditions. The two of examined buildings were situated in Denmark – Town Hall in Viborg and COWI headquarters in Aalborg. Data regarding indoor climate conditions were collected for both buildings (9 locations in Viborg Town Hall and 8 locations in COWI Aalborg). Data from BMS system were collected only for Viborg Town Hall, as no data logging was operational in COWI Aalborg building. The other two investigated buildings were situated in south European countries, Italy and Spain. Indoor climate conditions were measured at 3 locations in IDOM building in Madrid and at 6 locations in TiFs building in Padua. BMS data were accessible in both buildings. All collected data constitute a large database, which was not only used for evaluation of indoor environmental conditions provided by system in particular buildings, but it will be further utilized after the completion of the present project.
Indoor environment in studied buildings
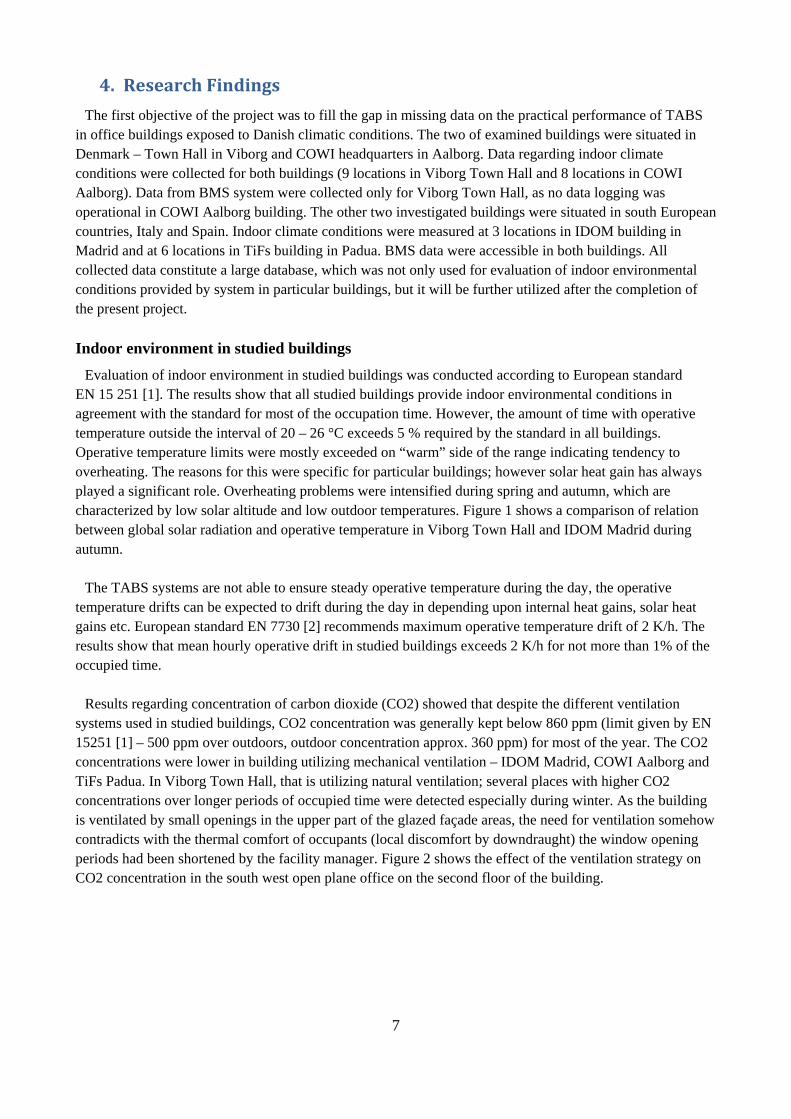
Evaluation of indoor environment in studied buildings was conducted according to European standard EN 15 251 [1]. The results show that all studied buildings provide indoor environmental conditions in agreement with the standard for most of the occupation time. However, the amount of time with operative temperature outside the interval of 20 – 26 °C exceeds 5 % required by the standard in all buildings. Operative temperature limits were mostly exceeded on “warm” side of the range indicating tendency to overheating. The reasons for this were specific for particular buildings; however solar heat gain has always played a significant role. Overheating problems were intensified during spring and autumn, which are characterized by low solar altitude and low outdoor temperatures. Figure 1 shows a comparison of relation between global solar radiation and operative temperature in Viborg Town Hall and IDOM Madrid during autumn.
The TABS systems are not able to ensure steady operative temperature during the day, the operative
temperature drifts can be expected to drift during the day in depending upon internal heat gains, solar heat gains etc. European standard EN 7730 [2] recommends maximum operative temperature drift of 2 K/h. The results show that mean hourly operative drift in studied buildings exceeds 2 K/h for not more than 1% of the occupied time.
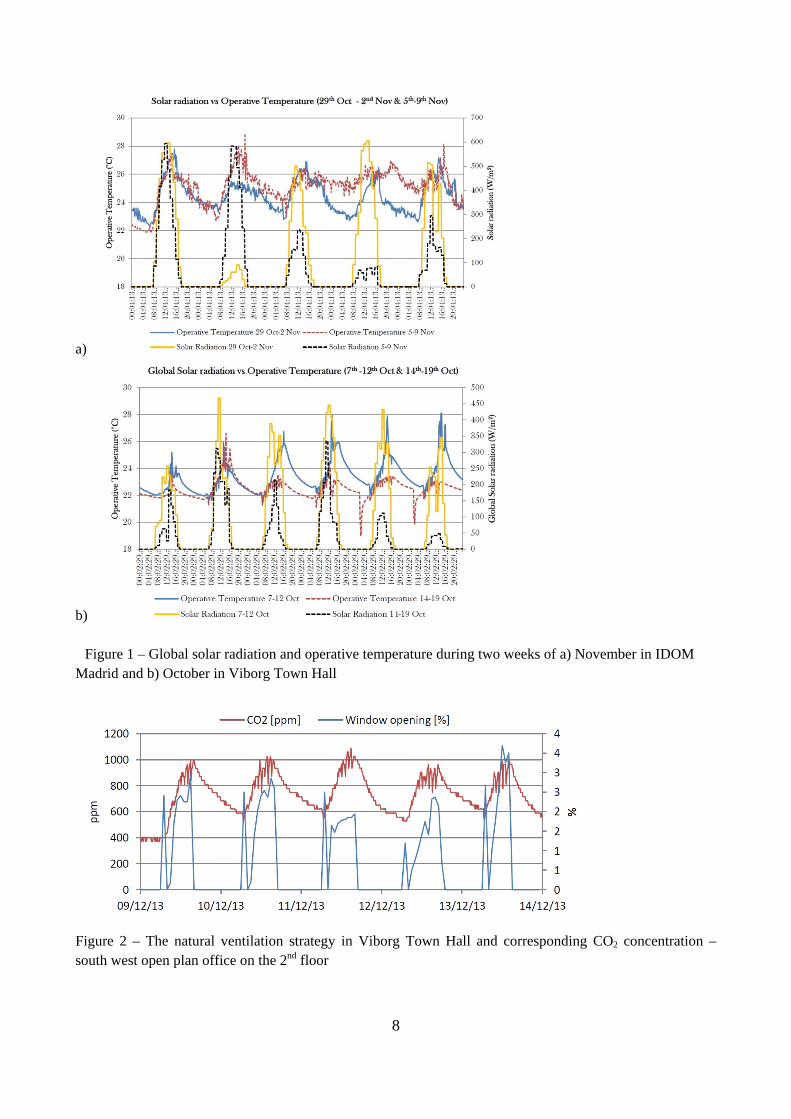
Results regarding concentration of carbon dioxide (CO2) showed that despite the different ventilation systems used in studied buildings, CO2 concentration was generally kept below 860 ppm (limit given by EN 15251 [1] – 500 ppm over outdoors, outdoor concentration approx. 360 ppm) for most of the year. The CO2 concentrations were lower in building utilizing mechanical ventilation – IDOM Madrid, COWI Aalborg and TiFs Padua. In Viborg Town Hall, that is utilizing natural ventilation; several places with higher CO2 concentrations over longer periods of occupied time were detected especially during winter. As the building is ventilated by small openings in the upper part of the glazed façade areas, the need for ventilation somehow contradicts with the thermal comfort of occupants (local discomfort by downdraught) the window opening periods had been shortened by the facility manager. Figure 2 shows the effect of the ventilation strategy on CO2 concentration in the south west open plane office on the second floor of the building.
8
a)
b) Figure 1 – Global solar radiation and operative temperature during two weeks of a) November in IDOM
Madrid and b) October in Viborg Town Hall
Figure 2 – The natural ventilation strategy in Viborg Town Hall and corresponding CO2 concentration – south west open plan office on the 2nd floor

9
Occupant satisfaction survey Figure 3 shows a box plot of temperature satisfaction from all surveyed buildings. Median temperature
satisfaction was in the range of the scale expressing satisfaction with the conditions. When considering whole interquartile range, the highest satisfaction was expressed by respondents in IDOM building in Madrid. Viborg Town hall had the lowest satisfaction rate with median of 2 and interquartile range of (1, 3) on the satisfaction scale. This corresponds well with results of physical measurements.
Figure 3 – Box plot of temperature satisfaction for all surveyed buildings (on vertical axis: 0 = "Clearly satisfied", 1 = "Satisfied", 2 = "Just satisfied", 3 = "Just dissatisfied", 4 = "Dissatisfied", 5 = "Clearly dissatisfied")
Figure 4 illustrates distribution of sources of discomfort in surveyed buildings. The percentage in the figure represents percentage of respondents that were dissatisfied with thermal conditions in the particular building.
Figure 4 – Sources of thermal discomfort in surveyed buildings – value labels indicate percentage of respondents dissatisfied with thermal conditions that indicated particular source of discomfort
01
23
45
Tem
pera
ture
sat
isfa
ctio
n
Viborg Town Hall IDOM Madrid COWI Aalborg TiSf Padua
10
Results show that almost 60 % of dissatisfied respondents in Viborg Town Hall attribute the thermal
discomfort to draught from ventilation system, however as there was only natural ventilation in the office spaces of the building, the discomfort seems to be clearly related with automatic opening of windows that was out of the influence of the occupants. Solar irradiation seemed to be bothering only for 21 % of respondents, which is in contradiction to the fact that it was the main factor contributing to overheating in the building. Solar heat gain was the main source of discomfort in COWI Aalborg together with draught form ventilation. In the TiFs Padova building, the major source of discomfort was too little air movement and high relative humidity. This is also in agreement with physical measurements conducted in the building, which showed that relative humidity was above 60 % during 26% of the occupied hours. The investigation of the local thermal comfort in the open plan offices indicated also very low air velocities in general. A 95% confidence interval of the mean air velocity across the ground and first floor was found to be as low as 0.03-0.04 m/s. Only in the zone in the centre of the first floor, measurements in ankle and abdomen level reached mean air velocities of approximately 0.1 m/s.
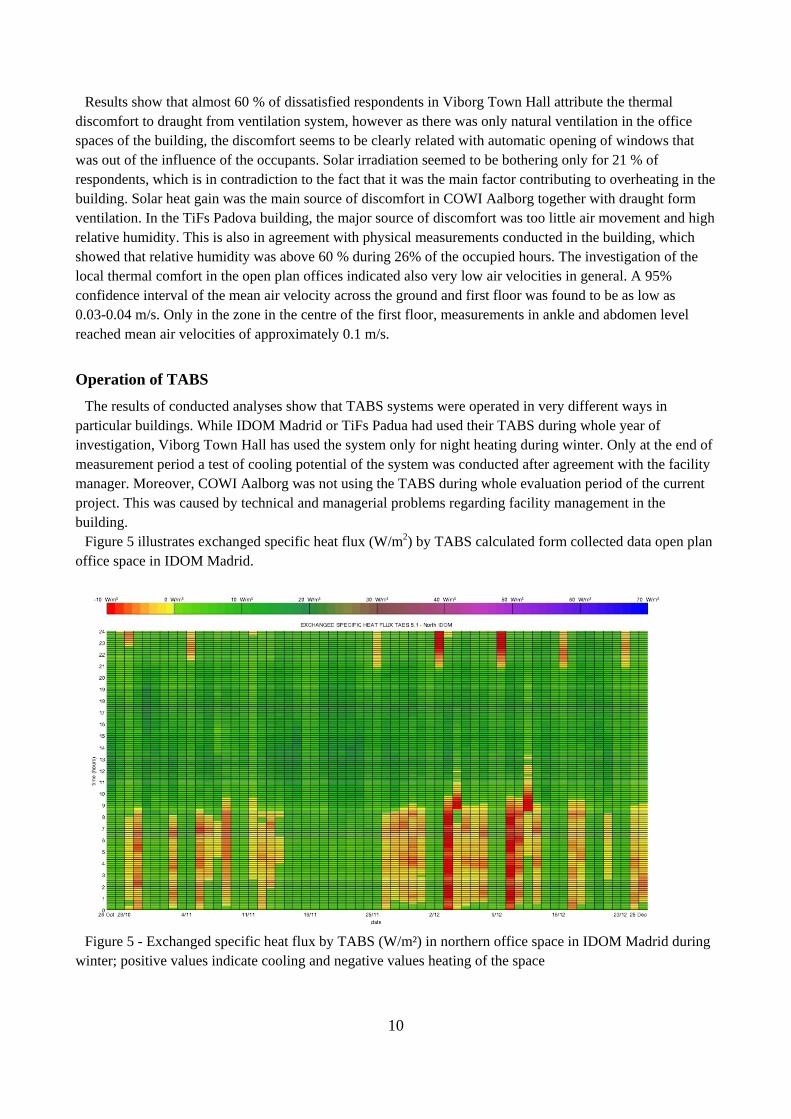
Operation of TABS The results of conducted analyses show that TABS systems were operated in very different ways in
particular buildings. While IDOM Madrid or TiFs Padua had used their TABS during whole year of investigation, Viborg Town Hall has used the system only for night heating during winter. Only at the end of measurement period a test of cooling potential of the system was conducted after agreement with the facility manager. Moreover, COWI Aalborg was not using the TABS during whole evaluation period of the current project. This was caused by technical and managerial problems regarding facility management in the building.
Figure 5 illustrates exchanged specific heat flux (W/m2) by TABS calculated form collected data open plan office space in IDOM Madrid.
Figure 5 - Exchanged specific heat flux by TABS (W/m²) in northern office space in IDOM Madrid during
winter; positive values indicate cooling and negative values heating of the space
11
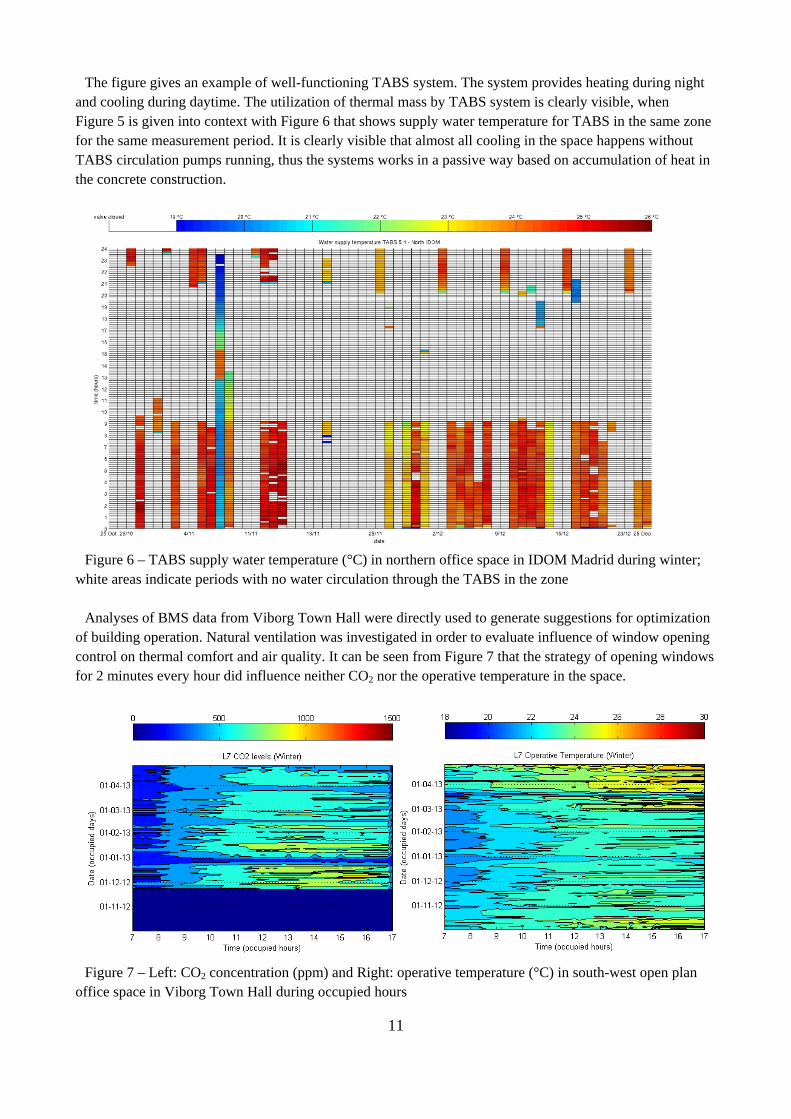
The figure gives an example of well-functioning TABS system. The system provides heating during night and cooling during daytime. The utilization of thermal mass by TABS system is clearly visible, when Figure 5 is given into context with Figure 6 that shows supply water temperature for TABS in the same zone for the same measurement period. It is clearly visible that almost all cooling in the space happens without TABS circulation pumps running, thus the systems works in a passive way based on accumulation of heat in the concrete construction.
Figure 6 – TABS supply water temperature (°C) in northern office space in IDOM Madrid during winter;
white areas indicate periods with no water circulation through the TABS in the zone Analyses of BMS data from Viborg Town Hall were directly used to generate suggestions for optimization
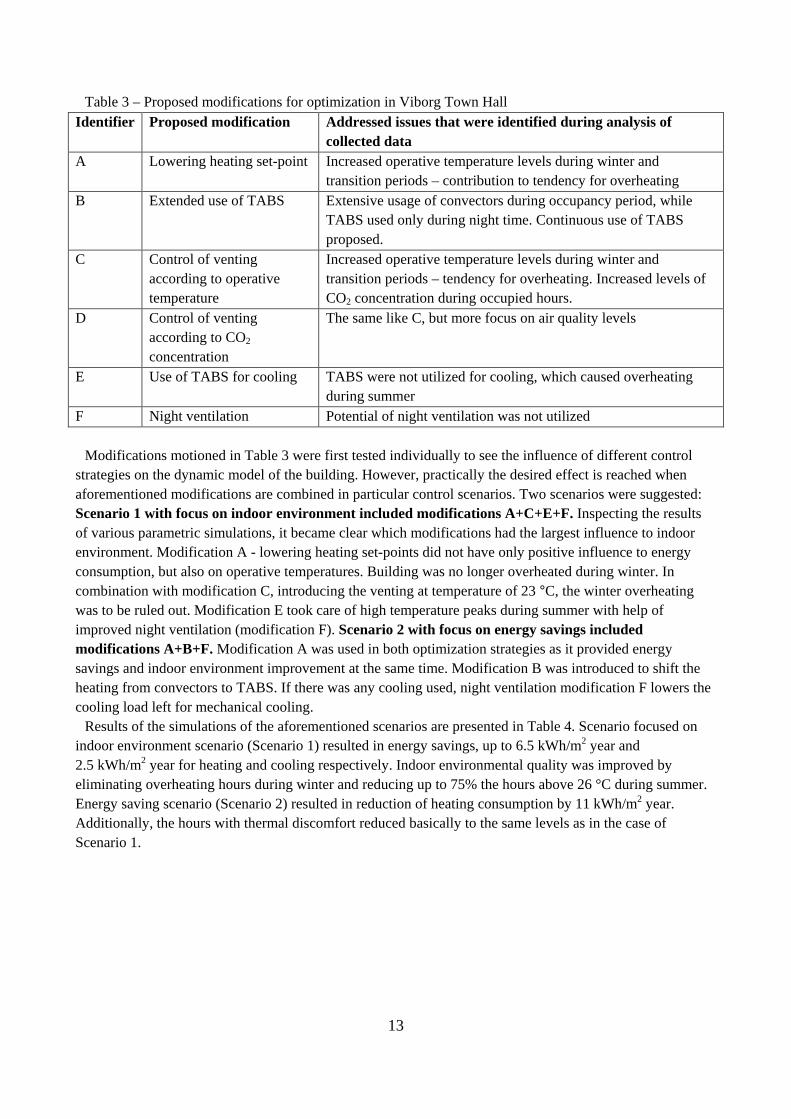
of building operation. Natural ventilation was investigated in order to evaluate influence of window opening control on thermal comfort and air quality. It can be seen from Figure 7 that the strategy of opening windows for 2 minutes every hour did influence neither CO2 nor the operative temperature in the space.
Figure 7 – Left: CO2 concentration (ppm) and Right: operative temperature (°C) in south-west open plan
office space in Viborg Town Hall during occupied hours

12
Figure 8 illustrates the control of TABS and heating convectors in the particular zone for the same period
of time. TABS system was used only for night heating while convectors, placed under glazed areas in the building, were used during the occupied hours. It is also visible from Figure 7 (Right) that operative temperature in the zone was higher than 24 °C during most of the occupancy time. Furthermore, already in April the operative temperature reached approx. 26 °C every afternoon.
Figure 8 – Left: TABS circulation pump operation and Right: operation mode of the motorized valve on
convectors under windows in south-west open plan office space in Viborg Town Hall Above mentioned results, together with results from the occupancy survey, which showed large percentage
of respondents dissatisfied with draught caused by ventilation, indicate that control strategy for thermal environment in the building deserved some optimization.
Two dynamic building performance simulation tools were used to provide optimization strategies for
Viborg Town Hall – IDA ICE and IES-VE. Figure 9 shows the model of the building in IDA ICE. Table 3 summarizes the proposed modifications to the building control strategy.
Figure 9 – Model of Viborg Town Hall in building performance simulation tool IDA ICE
13
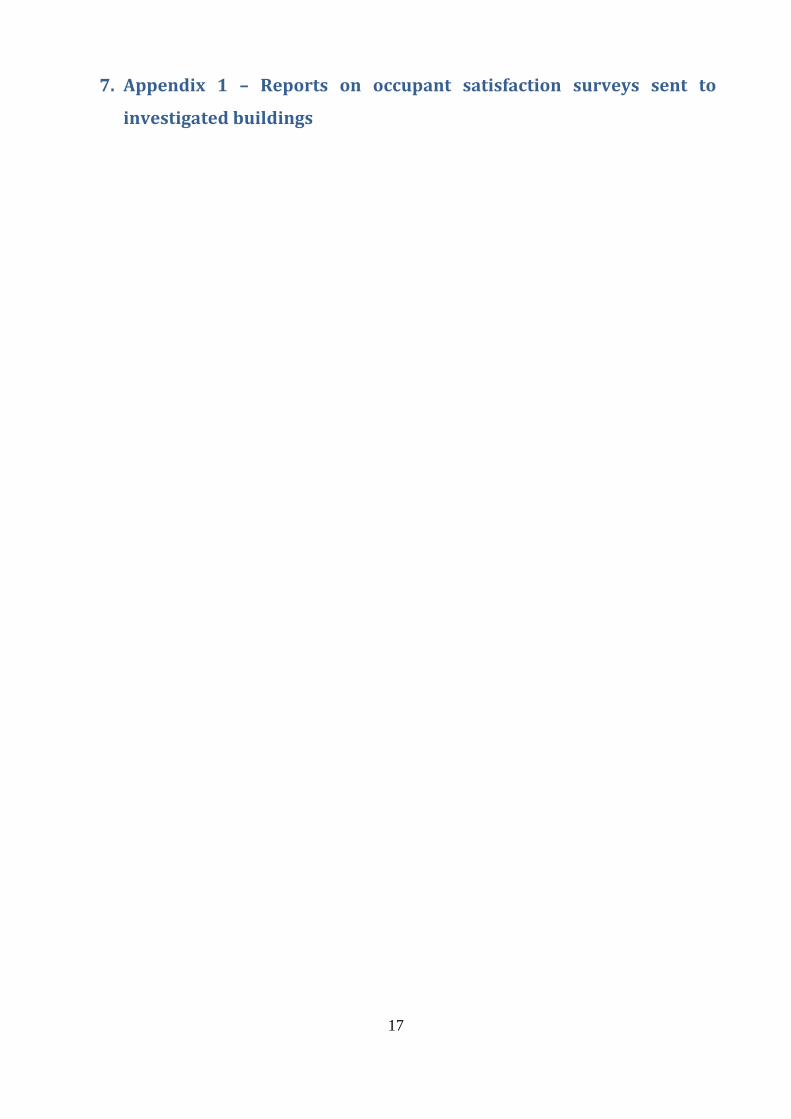
Table 3 – Proposed modifications for optimization in Viborg Town Hall
Identifier Proposed modification Addressed issues that were identified during analysis of collected data
A Lowering heating set-point Increased operative temperature levels during winter and transition periods – contribution to tendency for overheating
B Extended use of TABS Extensive usage of convectors during occupancy period, while TABS used only during night time. Continuous use of TABS proposed.
C Control of venting according to operative temperature
Increased operative temperature levels during winter and transition periods – tendency for overheating. Increased levels of CO2 concentration during occupied hours.
D Control of venting according to CO2 concentration
The same like C, but more focus on air quality levels
E Use of TABS for cooling TABS were not utilized for cooling, which caused overheating during summer
F Night ventilation Potential of night ventilation was not utilized Modifications motioned in Table 3 were first tested individually to see the influence of different control
strategies on the dynamic model of the building. However, practically the desired effect is reached when aforementioned modifications are combined in particular control scenarios. Two scenarios were suggested: Scenario 1 with focus on indoor environment included modifications A+C+E+F. Inspecting the results of various parametric simulations, it became clear which modifications had the largest influence to indoor environment. Modification A - lowering heating set-points did not have only positive influence to energy consumption, but also on operative temperatures. Building was no longer overheated during winter. In combination with modification C, introducing the venting at temperature of 23 °C, the winter overheating was to be ruled out. Modification E took care of high temperature peaks during summer with help of improved night ventilation (modification F). Scenario 2 with focus on energy savings included modifications A+B+F. Modification A was used in both optimization strategies as it provided energy savings and indoor environment improvement at the same time. Modification B was introduced to shift the heating from convectors to TABS. If there was any cooling used, night ventilation modification F lowers the cooling load left for mechanical cooling.
Results of the simulations of the aforementioned scenarios are presented in Table 4. Scenario focused on indoor environment scenario (Scenario 1) resulted in energy savings, up to 6.5 kWh/m2 year and 2.5 kWh/m2 year for heating and cooling respectively. Indoor environmental quality was improved by eliminating overheating hours during winter and reducing up to 75% the hours above 26 °C during summer. Energy saving scenario (Scenario 2) resulted in reduction of heating consumption by 11 kWh/m2 year. Additionally, the hours with thermal discomfort reduced basically to the same levels as in the case of Scenario 1.

14
Table 4 – Comparison of optimization scenarios with reference case – model calibrated according to
measured data
Heating Cooling CO2 outside comfort
range Operative temperature outside
comfort range [kWh/m2 year] [occupancy hours/year] Reference 31.4 5.3 1193 450 Scenario 1 24.9
-21% 2.8
-47% 919
-23% 396
-12% Scenario 2 19.9
-37% 4.8 -9%
1307 9%
421 -7%
Figure 10 presents the effect of Scenario 1 on operative temperatures in open plan office on 4th floor
during a representative 14-days period in summer. The temperature remains at 21 °C during night as due to the night ventilation. Scenario 1 maintained the operative temperature below 26 °C during occupied hours except during weekends when building is unoccupied. Figure 11 presents the effect of Scenario 1 on operative temperatures in open plan office on 2nd floor during a representative 14-days period in winter. In contrast to the baseline the operative temperature did not exceed 24 °C during occupancy period. Outside occupancy time the temperature dropped to 19 - 20 °C as result of lowering the heating set-points.
Figure 10 - Comparison of operative temperatures in validated model (reference) and optimization Scenario 1 at open plan office at 4th floor oriented towards south west (14 days from 8 July till 21 July)

15
Figure 11 - Comparison of operative temperatures in validated model (reference) and optimization Scenario 1 at open plan office at 2nd floor oriented towards south west (14 days from 4 Feb. till 17 Feb.)
5. Conclusions • Whole year measurements of indoor environmental conditions at minimum four locations in four office
buildings (two of them situated in Denmark) utilizing TABS for heating and/or cooling were conducted. Measured data were analysed with respect to ability of the buildings to provide indoor environmental conditions according to requirements by European standard EN 15 251.
• Data from building management system (BMS) related to the performance of TABS were collected in three buildings (Viborg Town Hall, IDOM Madrid and TiFs Padua). Data were not available in COWI Aalborg building. Data from Viborg Town Hall and IDOM Madrid were analysed.
• Post occupancy evaluation conducted based on internet distributed questionnaire was conducted in all investigated buildings. Summary reports were sent to all involved buildings.
• In the case of Viborg Town Hall, data from occupancy surveys together with indoor environmental measurements were used for optimization of building operation. Dynamic building performance simulation tool was used to evaluate influence of optimization on energy consumption indoor environment in the building.
• Simulations showed up to 37% reduction (depending on particular scenario) of energy for heating in comparison to the reference model calibrated with measured data.
• Even though the optimization scenarios decreased percentage of hours with discomfort – up to 23% in comparison to the reference model – the reduction of discomfort hours below 5% required by EN 15 215 was not reached.
From the results of the project it can be concluded that it is enormously useful to have both information
from measurements, BMS system and post occupancy evaluation to be able to conduct operational diagnostics of the building. However, this is very difficult to reach in practice, where mostly the data from BMS system are available. The results suggest that the fact that the building has been in operation for some time and its systems are therefore considered as “tuned”, does not directly give a guarantee of appropriate indoor environmental conditions and occupant satisfaction. Therefore a continuous commissioning and operational diagnostics is of outmost importance. This is even more pronounced in buildings with TABS, which require proper coordination between the thermo-active system and other climate conditioning systems applied in the building. Data from the project will be further used to investigate relations between TABS

16
operation and provided comfort as well as to determine the minimum amount of information that has to be collected in the building to ensure proper operational diagnostics.
6. References [1] EN 2007. EN 15251: Indoor environmental input parameters for design and assessment of energy performance of buildings addressing indoor air quality, thermal environment, lighting and acoustics. European Committee for Standardization, Brussels, Belgium [2] ISO 7730. 2005. International standard: Ergonomics of the Thermal Environment-Analytical Determination of Thermal Comfort by Using Calculations of the PMV and PPD Indices and Local Thermal Comfort Criteria, ISO, Geneva, Switzerland
17
7. Appendix 1 – Reports on occupant satisfaction surveys sent to
investigated buildings
Technical University of Denmark – Department of Civil Engineering Thermo Active Building Systems – Performance in practice and possibilities for optimization Research project funded by Bjarne Saxhofs Fund
1
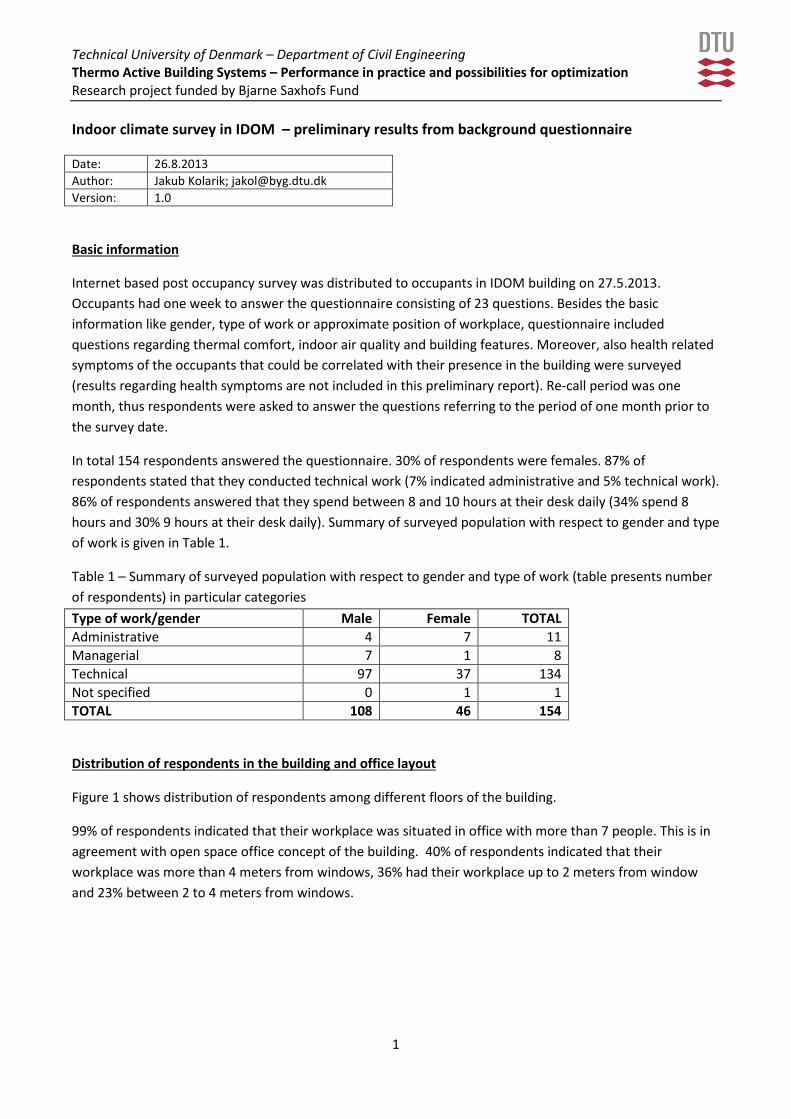
Indoor climate survey in IDOM – preliminary results from background questionnaire
Date: 26.8.2013 Author: Jakub Kolarik; [email protected] Version: 1.0
Basic information
Internet based post occupancy survey was distributed to occupants in IDOM building on 27.5.2013. Occupants had one week to answer the questionnaire consisting of 23 questions. Besides the basic information like gender, type of work or approximate position of workplace, questionnaire included questions regarding thermal comfort, indoor air quality and building features. Moreover, also health related symptoms of the occupants that could be correlated with their presence in the building were surveyed (results regarding health symptoms are not included in this preliminary report). Re-call period was one month, thus respondents were asked to answer the questions referring to the period of one month prior to the survey date.
In total 154 respondents answered the questionnaire. 30% of respondents were females. 87% of respondents stated that they conducted technical work (7% indicated administrative and 5% technical work). 86% of respondents answered that they spend between 8 and 10 hours at their desk daily (34% spend 8 hours and 30% 9 hours at their desk daily). Summary of surveyed population with respect to gender and type of work is given in Table 1.
Table 1 – Summary of surveyed population with respect to gender and type of work (table presents number of respondents) in particular categories Type of work/gender Male Female TOTAL Administrative 4 7 11 Managerial 7 1 8 Technical 97 37 134 Not specified 0 1 1 TOTAL 108 46 154
Distribution of respondents in the building and office layout
Figure 1 shows distribution of respondents among different floors of the building.
99% of respondents indicated that their workplace was situated in office with more than 7 people. This is in agreement with open space office concept of the building. 40% of respondents indicated that their workplace was more than 4 meters from windows, 36% had their workplace up to 2 meters from window and 23% between 2 to 4 meters from windows.

Technical University of Denmark – Department of Civil Engineering Thermo Active Building Systems – Performance in practice and possibilities for optimization Research project funded by Bjarne Saxhofs Fund
2
Figure 1 – Percentage of respondents on particular floors
Satisfaction with thermal environment
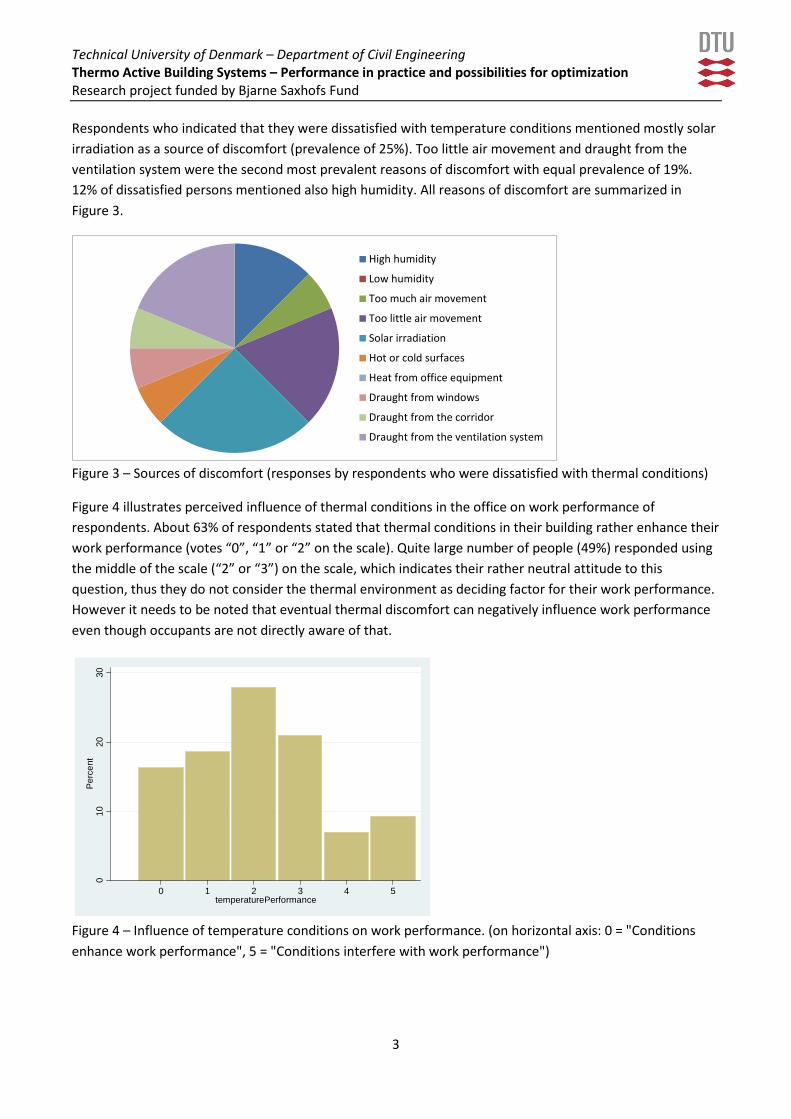
Satisfaction with thermal environment is one of the basic prerequisites for comfortable environment at the workplace. Figure 2 illustrates satisfaction of respondents with temperature conditions in the office during last month.
Figure 2 – Temperature satisfaction during last month (on horizontal axis: 0 = "Clearly satisfied", 1 = "Satisfied", 2 = "Just satisfied", 3 = "Just dissatisfied", 4 = "Dissatisfied", 5 = "Clearly dissatisfied")
It can be seen from Figure 2 that 90% of respondents expressed their satisfaction with the thermal conditions (answers between “Clearly satisfied” and "Just satisfied"). 40% were “Clearly satisfied”, that is a very good result for the building. Results indicate that majority occupants were satisfied with thermal conditions. All votes on part of the scale representing dissatisfaction represent only about 10%.
010
2030
40P
erce
nt
1 2 3 4floor
010
2030
40P
erce
nt
0 1 2 3 4 5temperatureSatisfaction

Technical University of Denmark – Department of Civil Engineering Thermo Active Building Systems – Performance in practice and possibilities for optimization Research project funded by Bjarne Saxhofs Fund
3
Figure 3 illustrates perceived influence of thermal conditions on work performance of the respondents. The distribution of answers is quite similar to Figure 2. Most of respondents thought that the conditions rather enhanced their work performance. Most of the responses – 85%, lay in the positive part of the scale.
Figure 3 – Influence of temperature conditions on work performance. (on horizontal axis: 0 = "Conditions enhance work performance", 5 = "Conditions interfere with work performance")
Most prevalent sources of discomfort were too much air movement; solar irradiation and draught from the corridor - mentioned by 16% of respondents. All reasons of discomfort are summarized in Figure 4.
Figure 4 – Sources of discomfort (responses by respondents who were dissatisfied with thermal conditions)
Air quality
Likewise satisfaction with thermal environment, satisfaction with air quality also plays important role in overall evaluation of indoor environment. Insufficient ventilation, stuffy air can lead to intensification of symptoms like headache, fatigue or to concentration difficulties. Unpleasant odours can cause distraction and thus decrease work performance. Figure 5 illustrates satisfaction with air quality in the building. More than 95% of respondents indicated that they were satisfied with air quality (answers between “Clearly satisfied” and "Just satisfied").
010
2030
40P
erce
nt
0 1 2 3 4 5temperaturePerformance
High humidity
Low humidity
Too much air movement
Too little air movement
Solar irradiation
Hot or cold surfaces
Heat from office equipment
Draught from windows
Draught from the corridor
Draught from the ventilation system
Technical University of Denmark – Department of Civil Engineering Thermo Active Building Systems – Performance in practice and possibilities for optimization Research project funded by Bjarne Saxhofs Fund
4
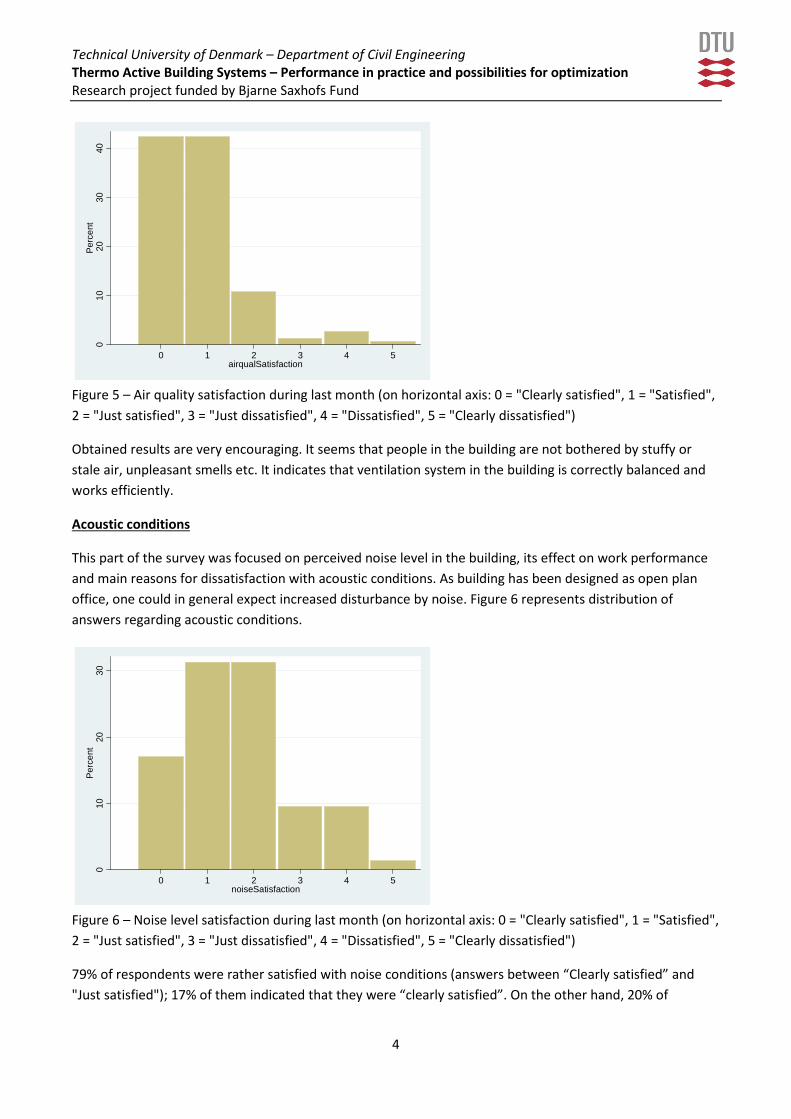
Figure 5 – Air quality satisfaction during last month (on horizontal axis: 0 = "Clearly satisfied", 1 = "Satisfied", 2 = "Just satisfied", 3 = "Just dissatisfied", 4 = "Dissatisfied", 5 = "Clearly dissatisfied")
Obtained results are very encouraging. It seems that people in the building are not bothered by stuffy or stale air, unpleasant smells etc. It indicates that ventilation system in the building is correctly balanced and works efficiently.
Acoustic conditions
This part of the survey was focused on perceived noise level in the building, its effect on work performance and main reasons for dissatisfaction with acoustic conditions. As building has been designed as open plan office, one could in general expect increased disturbance by noise. Figure 6 represents distribution of answers regarding acoustic conditions.
Figure 6 – Noise level satisfaction during last month (on horizontal axis: 0 = "Clearly satisfied", 1 = "Satisfied", 2 = "Just satisfied", 3 = "Just dissatisfied", 4 = "Dissatisfied", 5 = "Clearly dissatisfied")
79% of respondents were rather satisfied with noise conditions (answers between “Clearly satisfied” and "Just satisfied"); 17% of them indicated that they were “clearly satisfied”. On the other hand, 20% of
010
2030
40P
erce
nt
0 1 2 3 4 5airqualSatisfaction
010
2030
Per
cent
0 1 2 3 4 5noiseSatisfaction
Technical University of Denmark – Department of Civil Engineering Thermo Active Building Systems – Performance in practice and possibilities for optimization Research project funded by Bjarne Saxhofs Fund
5
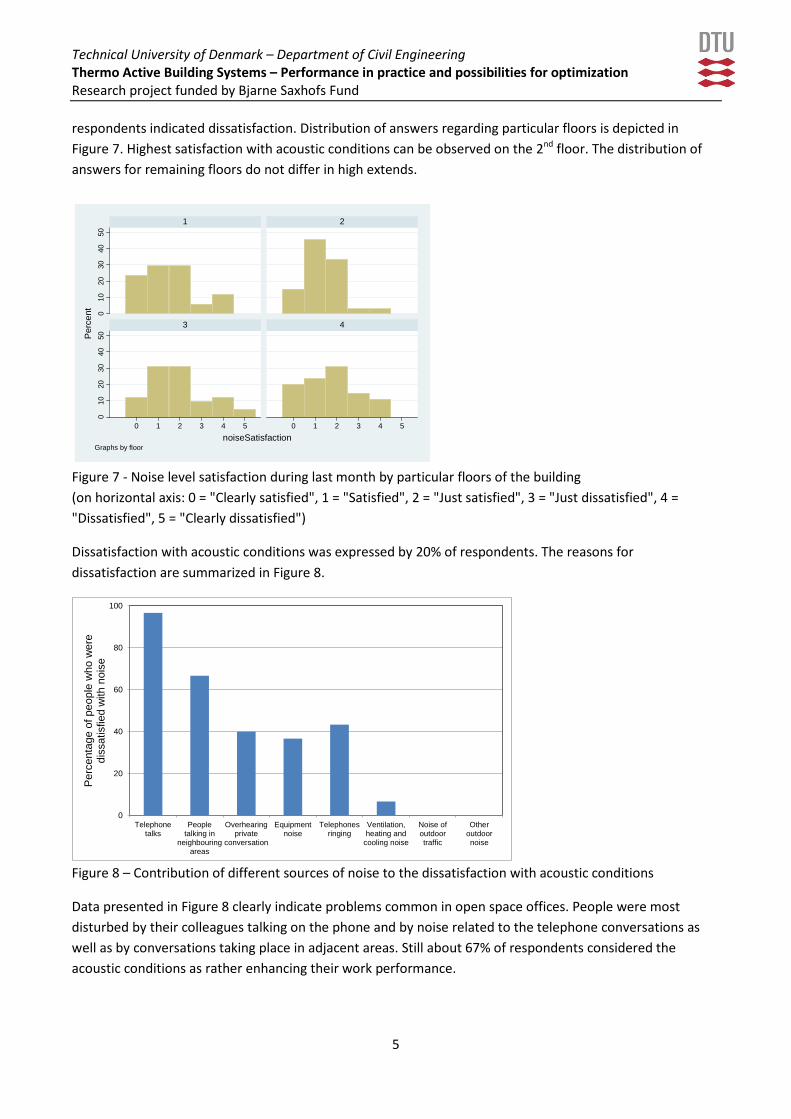
respondents indicated dissatisfaction. Distribution of answers regarding particular floors is depicted in Figure 7. Highest satisfaction with acoustic conditions can be observed on the 2nd floor. The distribution of answers for remaining floors do not differ in high extends.
Figure 7 - Noise level satisfaction during last month by particular floors of the building (on horizontal axis: 0 = "Clearly satisfied", 1 = "Satisfied", 2 = "Just satisfied", 3 = "Just dissatisfied", 4 = "Dissatisfied", 5 = "Clearly dissatisfied")
Dissatisfaction with acoustic conditions was expressed by 20% of respondents. The reasons for dissatisfaction are summarized in Figure 8.
Figure 8 – Contribution of different sources of noise to the dissatisfaction with acoustic conditions
Data presented in Figure 8 clearly indicate problems common in open space offices. People were most disturbed by their colleagues talking on the phone and by noise related to the telephone conversations as well as by conversations taking place in adjacent areas. Still about 67% of respondents considered the acoustic conditions as rather enhancing their work performance.
010
2030
4050
010
2030
4050
0 1 2 3 4 5 0 1 2 3 4 5
1 2
3 4
Per
cent
noiseSatisfactionGraphs by floor
0
20
40
60
80
100
Telephonetalks
Peopletalking in
neighbouringareas
Overhearingprivate
conversation
Equipmentnoise
Telephonesringing
Ventilation,heating and
cooling noise
Noise ofoutdoortraffic
Otheroutdoornoise
Per
cent
age
of p
eopl
e w
ho w
ere
diss
atis
fied
with
noi
se
Technical University of Denmark – Department of Civil Engineering Thermo Active Building Systems – Performance in practice and possibilities for optimization Research project funded by Bjarne Saxhofs Fund
6
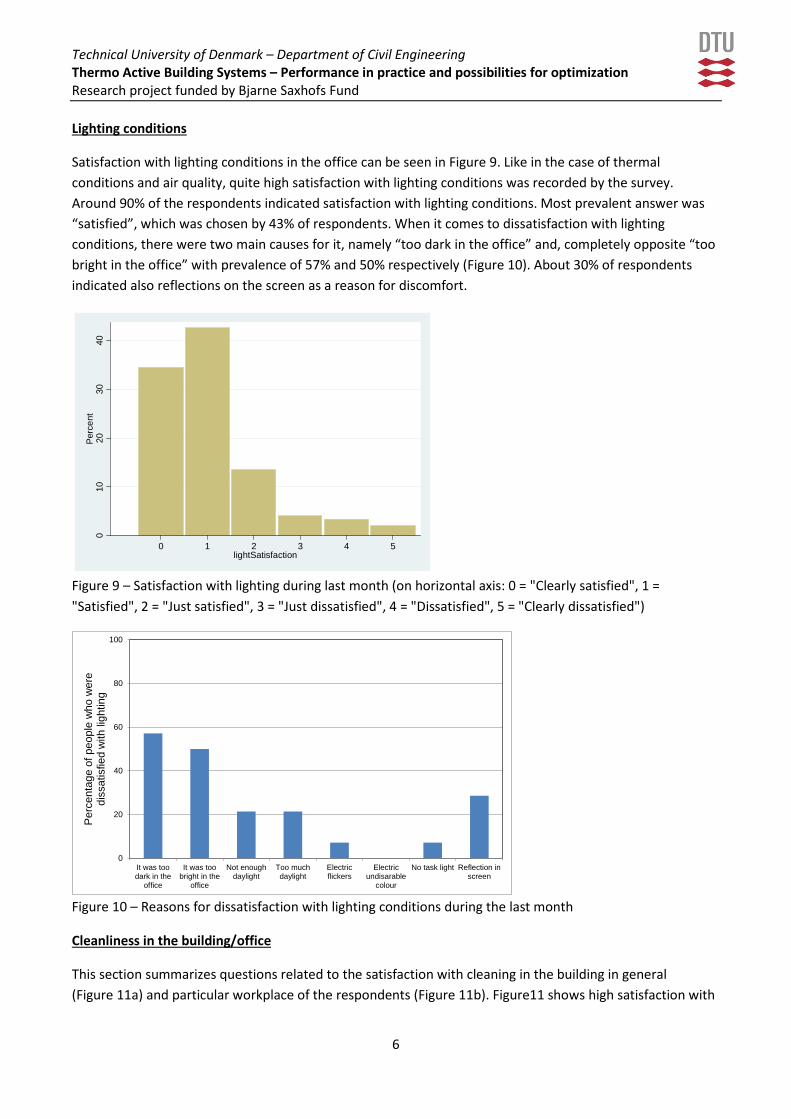
Lighting conditions
Satisfaction with lighting conditions in the office can be seen in Figure 9. Like in the case of thermal conditions and air quality, quite high satisfaction with lighting conditions was recorded by the survey. Around 90% of the respondents indicated satisfaction with lighting conditions. Most prevalent answer was “satisfied”, which was chosen by 43% of respondents. When it comes to dissatisfaction with lighting conditions, there were two main causes for it, namely “too dark in the office” and, completely opposite “too bright in the office” with prevalence of 57% and 50% respectively (Figure 10). About 30% of respondents indicated also reflections on the screen as a reason for discomfort.
Figure 9 – Satisfaction with lighting during last month (on horizontal axis: 0 = "Clearly satisfied", 1 = "Satisfied", 2 = "Just satisfied", 3 = "Just dissatisfied", 4 = "Dissatisfied", 5 = "Clearly dissatisfied")
Figure 10 – Reasons for dissatisfaction with lighting conditions during the last month
Cleanliness in the building/office
This section summarizes questions related to the satisfaction with cleaning in the building in general (Figure 11a) and particular workplace of the respondents (Figure 11b). Figure11 shows high satisfaction with
010
2030
40P
erce
nt
0 1 2 3 4 5lightSatisfaction
0
20
40
60
80
100
It was toodark in the
office
It was toobright in the
office
Not enoughdaylight
Too muchdaylight
Electricflickers
Electricundisarable
colour
No task light Reflection inscreen
Per
cent
age
of p
eopl
e w
ho w
ere
diss
atis
fied
with
ligh
ting
Technical University of Denmark – Department of Civil Engineering Thermo Active Building Systems – Performance in practice and possibilities for optimization Research project funded by Bjarne Saxhofs Fund
7
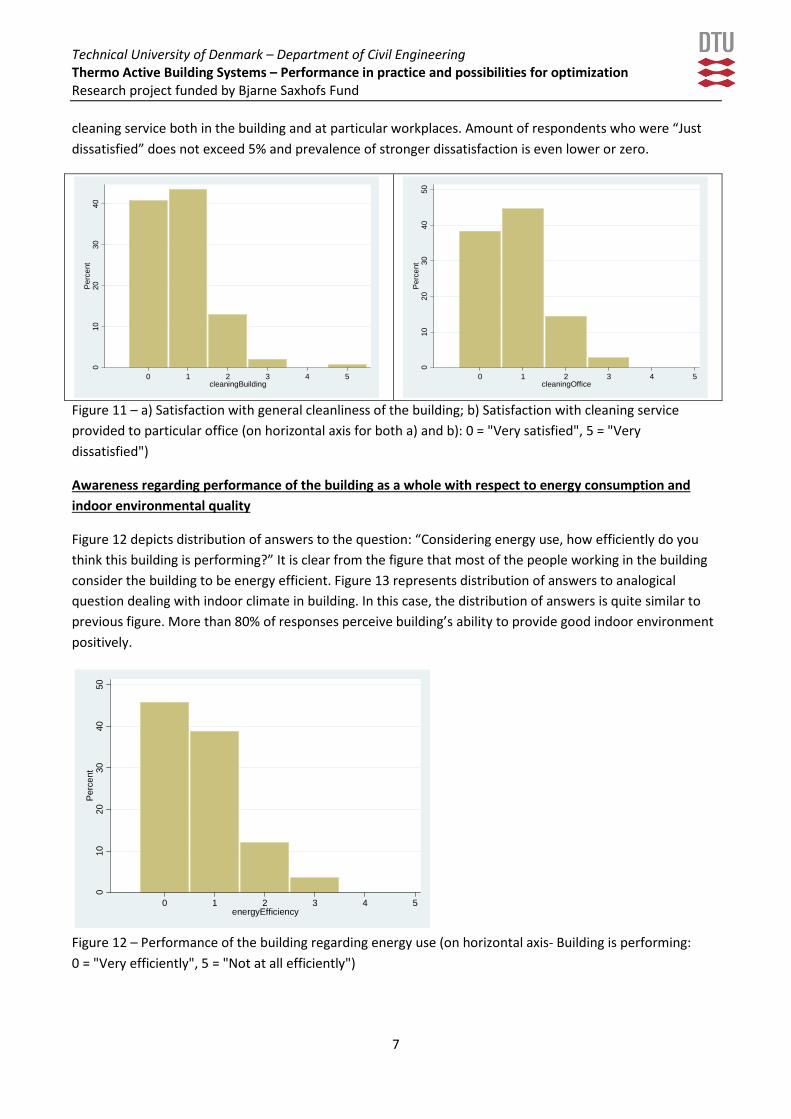
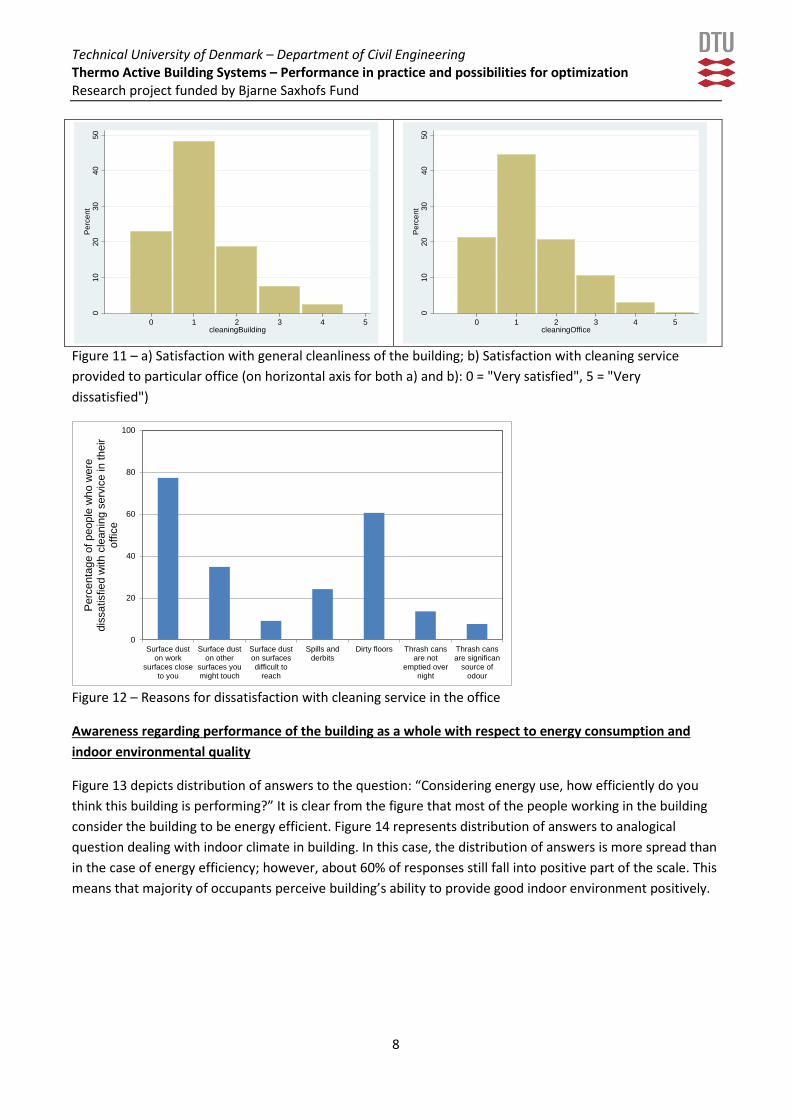
cleaning service both in the building and at particular workplaces. Amount of respondents who were “Just dissatisfied” does not exceed 5% and prevalence of stronger dissatisfaction is even lower or zero.
Figure 11 – a) Satisfaction with general cleanliness of the building; b) Satisfaction with cleaning service provided to particular office (on horizontal axis for both a) and b): 0 = "Very satisfied", 5 = "Very dissatisfied")
Awareness regarding performance of the building as a whole with respect to energy consumption and indoor environmental quality
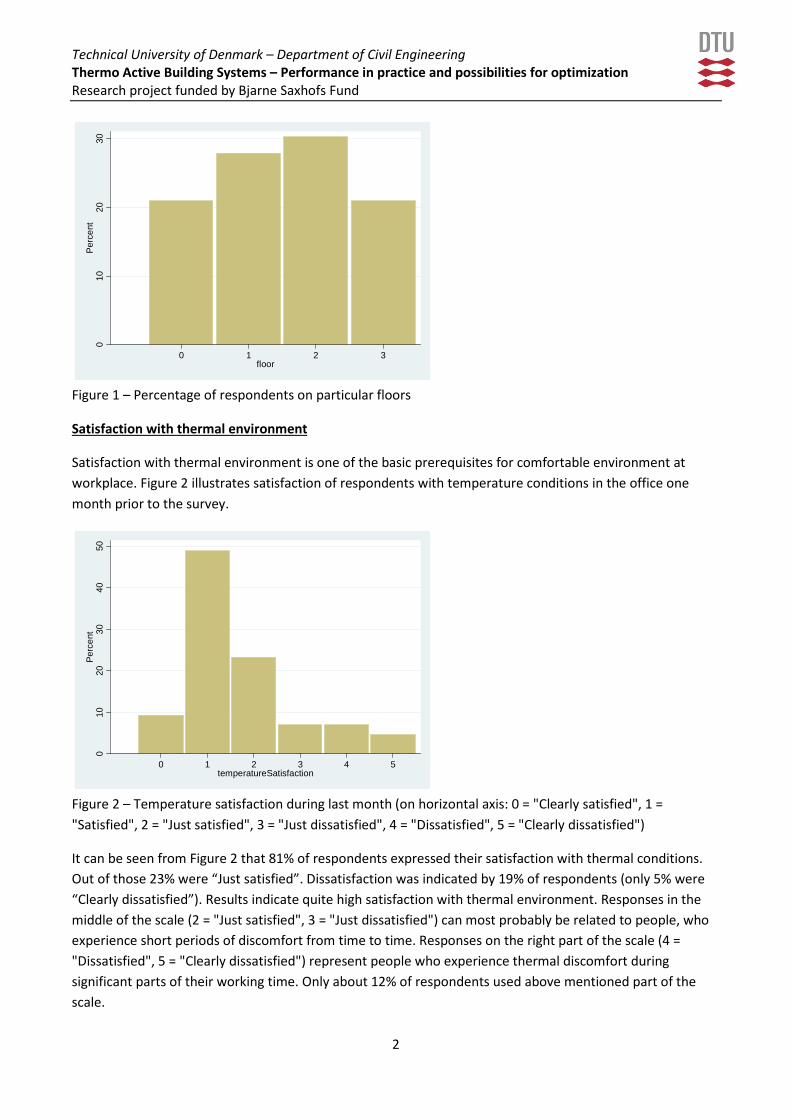
Figure 12 depicts distribution of answers to the question: “Considering energy use, how efficiently do you think this building is performing?” It is clear from the figure that most of the people working in the building consider the building to be energy efficient. Figure 13 represents distribution of answers to analogical question dealing with indoor climate in building. In this case, the distribution of answers is quite similar to previous figure. More than 80% of responses perceive building’s ability to provide good indoor environment positively.
Figure 12 – Performance of the building regarding energy use (on horizontal axis- Building is performing: 0 = "Very efficiently", 5 = "Not at all efficiently")
010
2030
40P
erce
nt
0 1 2 3 4 5cleaningBuilding
010
2030
4050
Per
cent
0 1 2 3 4 5cleaningOffice
010
2030
4050
Per
cent
0 1 2 3 4 5energyEfficiency
Technical University of Denmark – Department of Civil Engineering Thermo Active Building Systems – Performance in practice and possibilities for optimization Research project funded by Bjarne Saxhofs Fund
8
Figure 13 - Performance of the building regarding indoor climate (on horizontal axis- Building is performing: 0 = "Very well", 5 = "Not at all well")
010
2030
40P
erce
nt
0 1 2 3 4 5indoorClimate
Technical University of Denmark – Department of Civil Engineering Thermo Active Building Systems – Performance in practice and possibilities for optimization Research project funded by Bjarne Saxhofs Fund
1
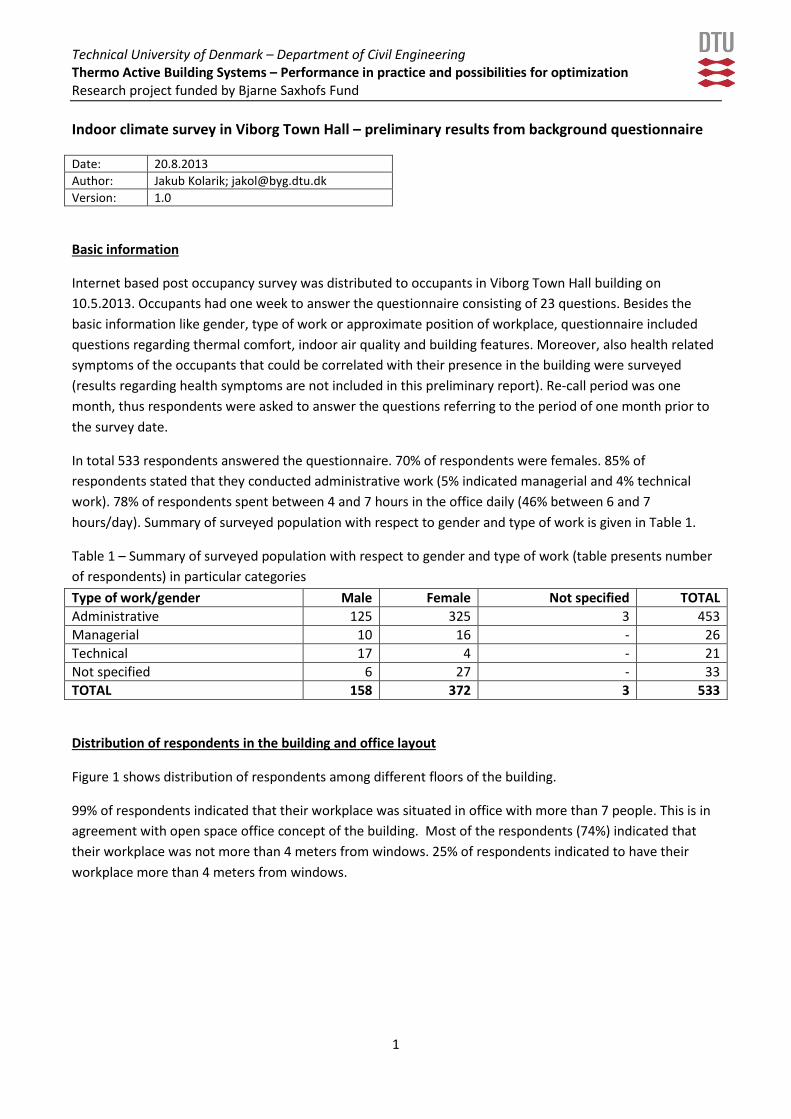
Indoor climate survey in Viborg Town Hall – preliminary results from background questionnaire
Date: 20.8.2013 Author: Jakub Kolarik; [email protected] Version: 1.0
Basic information
Internet based post occupancy survey was distributed to occupants in Viborg Town Hall building on 10.5.2013. Occupants had one week to answer the questionnaire consisting of 23 questions. Besides the basic information like gender, type of work or approximate position of workplace, questionnaire included questions regarding thermal comfort, indoor air quality and building features. Moreover, also health related symptoms of the occupants that could be correlated with their presence in the building were surveyed (results regarding health symptoms are not included in this preliminary report). Re-call period was one month, thus respondents were asked to answer the questions referring to the period of one month prior to the survey date.
In total 533 respondents answered the questionnaire. 70% of respondents were females. 85% of respondents stated that they conducted administrative work (5% indicated managerial and 4% technical work). 78% of respondents spent between 4 and 7 hours in the office daily (46% between 6 and 7 hours/day). Summary of surveyed population with respect to gender and type of work is given in Table 1.
Table 1 – Summary of surveyed population with respect to gender and type of work (table presents number of respondents) in particular categories Type of work/gender Male Female Not specified TOTAL Administrative 125 325 3 453 Managerial 10 16 - 26 Technical 17 4 - 21 Not specified 6 27 - 33 TOTAL 158 372 3 533
Distribution of respondents in the building and office layout
Figure 1 shows distribution of respondents among different floors of the building.
99% of respondents indicated that their workplace was situated in office with more than 7 people. This is in agreement with open space office concept of the building. Most of the respondents (74%) indicated that their workplace was not more than 4 meters from windows. 25% of respondents indicated to have their workplace more than 4 meters from windows.
Technical University of Denmark – Department of Civil Engineering Thermo Active Building Systems – Performance in practice and possibilities for optimization Research project funded by Bjarne Saxhofs Fund
2
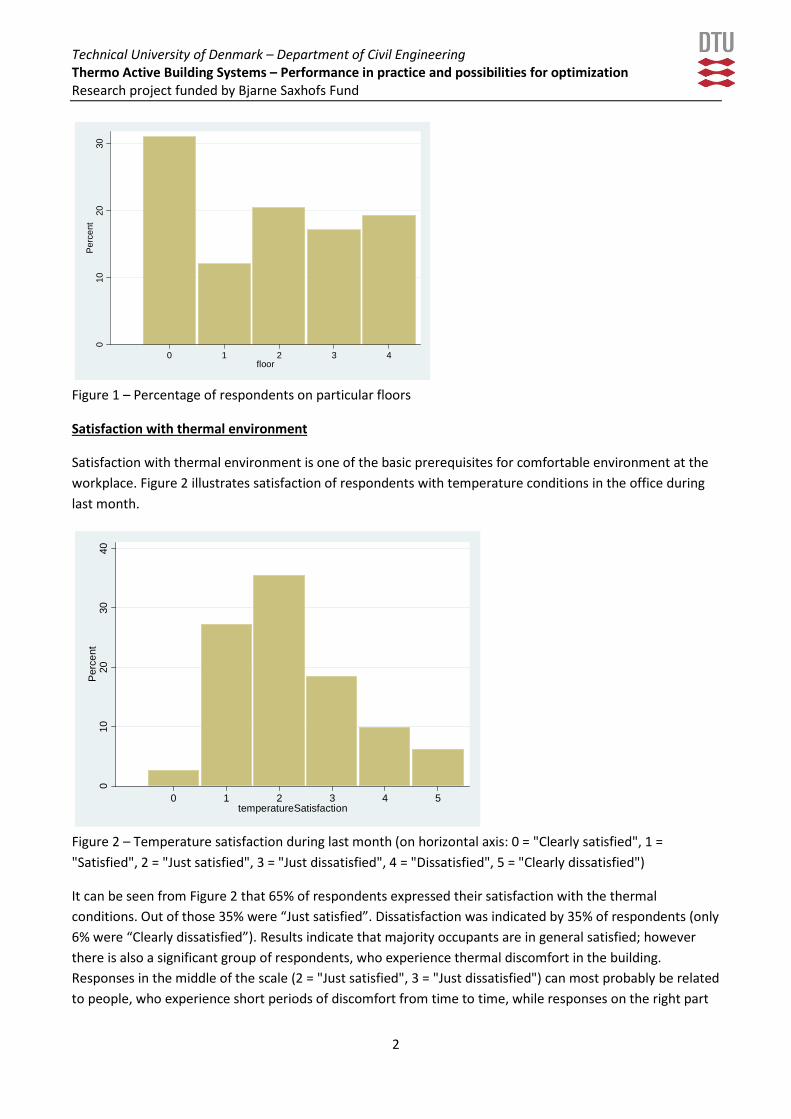
Figure 1 – Percentage of respondents on particular floors
Satisfaction with thermal environment
Satisfaction with thermal environment is one of the basic prerequisites for comfortable environment at the workplace. Figure 2 illustrates satisfaction of respondents with temperature conditions in the office during last month.
Figure 2 – Temperature satisfaction during last month (on horizontal axis: 0 = "Clearly satisfied", 1 = "Satisfied", 2 = "Just satisfied", 3 = "Just dissatisfied", 4 = "Dissatisfied", 5 = "Clearly dissatisfied")
It can be seen from Figure 2 that 65% of respondents expressed their satisfaction with the thermal conditions. Out of those 35% were “Just satisfied”. Dissatisfaction was indicated by 35% of respondents (only 6% were “Clearly dissatisfied”). Results indicate that majority occupants are in general satisfied; however there is also a significant group of respondents, who experience thermal discomfort in the building. Responses in the middle of the scale (2 = "Just satisfied", 3 = "Just dissatisfied") can most probably be related to people, who experience short periods of discomfort from time to time, while responses on the right part
010
2030
Per
cent
0 1 2 3 4floor
010
2030
40P
erce
nt
0 1 2 3 4 5temperatureSatisfaction

Technical University of Denmark – Department of Civil Engineering Thermo Active Building Systems – Performance in practice and possibilities for optimization Research project funded by Bjarne Saxhofs Fund
3
of the scale (4 = "Dissatisfied", 5 = "Clearly dissatisfied", more than 15%) represent people who experience thermal discomfort during significant parts of their working time.
Figure 3 illustrates perceived influence of thermal conditions in the office on work performance of respondents. There were a same percentage of respondents who think that thermal conditions in their building enhance their work performance as percentage of respondents stating opposite. Distribution of responses indicated that more than 50% of the respondents had a kind of neutral attitude to this question, thus they do not consider the thermal environment as deciding factor for their work performance. However it needs to be noted that thermal discomfort can negatively influence work performance even though occupants are not directly aware of that.
Figure 3 – Influence of temperature conditions on work performance. (on horizontal axis: 0 = "Conditions enhance work performance", 5 = "Conditions interfere with work performance")
Respondents who indicated that they were dissatisfied with temperature conditions mentioned mostly draught from the ventilation system as a source of discomfort (mentioned by 31% of respondents). Too little and too much air movement were the second and third most prevalent reason of discomfort with prevalence of 17% and 16% respectively. All reasons of discomfort are summarized in Figure 4.
Figure 4 – Sources of discomfort (responses by respondents who were dissatisfied with thermal conditions)
010
2030
Per
cent
0 1 2 3 4 5temperaturePerformance

Technical University of Denmark – Department of Civil Engineering Thermo Active Building Systems – Performance in practice and possibilities for optimization Research project funded by Bjarne Saxhofs Fund
4
Air quality
Likewise the satisfaction with thermal environment, satisfaction with air quality also plays important role in overall evaluation of indoor environment. Insufficient ventilation, stuffy air can lead to intensification of symptoms like headache, fatigue or to concentration difficulties. Unpleasant odours can cause distraction and thus decrease work performance. Figure 5 illustrates satisfaction with air quality in the building. More than 70% of respondents indicated that they were satisfied with air quality. Dissatisfaction with air quality was expressed by 28% of people. Stuffy or stale air was mentioned as a reason for dissatisfaction by 60% of respondents, who were dissatisfied with air quality.
Figure 5 – Air quality satisfaction during last month (on horizontal axis: 0 = "Clearly satisfied", 1 = "Satisfied", 2 = "Just satisfied", 3 = "Just dissatisfied", 4 = "Dissatisfied", 5 = "Clearly dissatisfied")
Obtained results can be considered as satisfactory. At the same time, it would be worth to investigate reasons for stuffy and stale air indicated by majority of dissatisfied respondents. As the building is naturally ventilated, it would be worth checking how effectively are different parts of the open plane offices flushed with fresh outdoor air.
Acoustic conditions
This part of the survey was focused on perceived noise level in the building, its effect on work performance and main reasons for dissatisfaction with acoustic conditions. As building is designed as open plane office, one can in general expect increased disturbance by noise. Figure 6 represents distribution of answers to the question how satisfied were respondents with noise level during last month.
010
2030
40P
erce
nt
0 1 2 3 4 5airqualSatisfaction
Technical University of Denmark – Department of Civil Engineering Thermo Active Building Systems – Performance in practice and possibilities for optimization Research project funded by Bjarne Saxhofs Fund
5
Figure 6 – Noise level satisfaction during last month (on horizontal axis: 0 = "Clearly satisfied", 1 = "Satisfied", 2 = "Just satisfied", 3 = "Just dissatisfied", 4 = "Dissatisfied", 5 = "Clearly dissatisfied")
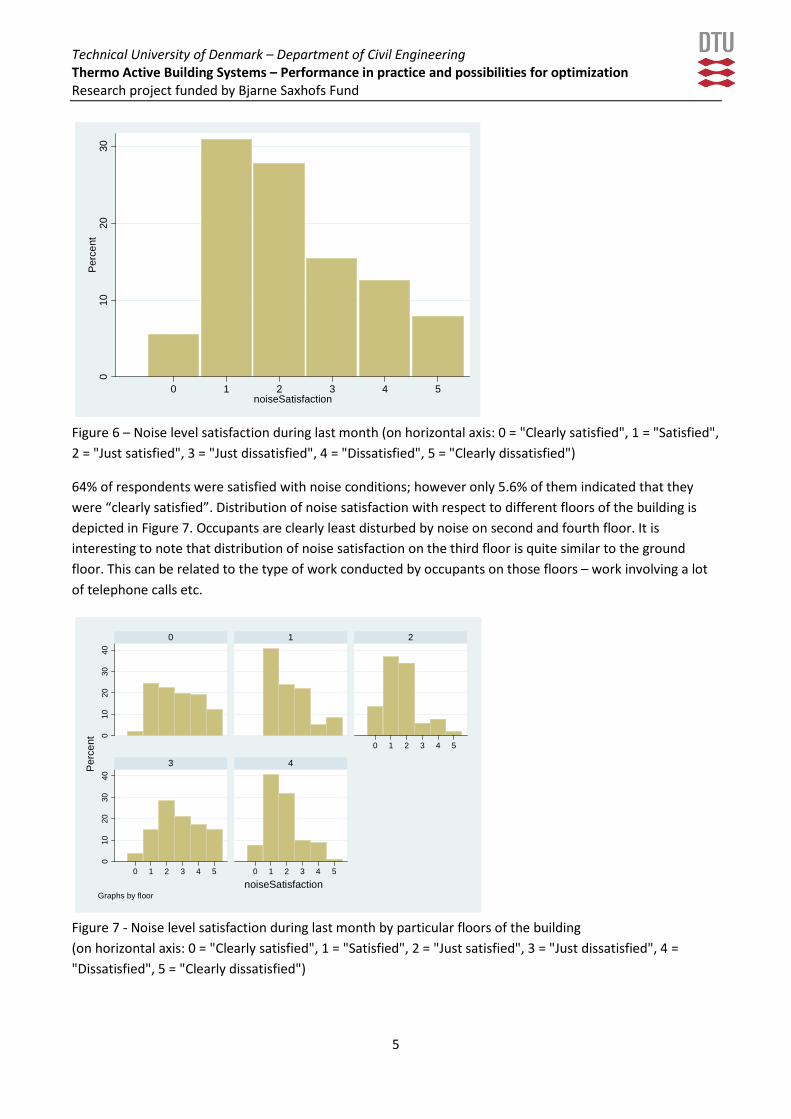
64% of respondents were satisfied with noise conditions; however only 5.6% of them indicated that they were “clearly satisfied”. Distribution of noise satisfaction with respect to different floors of the building is depicted in Figure 7. Occupants are clearly least disturbed by noise on second and fourth floor. It is interesting to note that distribution of noise satisfaction on the third floor is quite similar to the ground floor. This can be related to the type of work conducted by occupants on those floors – work involving a lot of telephone calls etc.
Figure 7 - Noise level satisfaction during last month by particular floors of the building (on horizontal axis: 0 = "Clearly satisfied", 1 = "Satisfied", 2 = "Just satisfied", 3 = "Just dissatisfied", 4 = "Dissatisfied", 5 = "Clearly dissatisfied")
010
2030
Per
cent
0 1 2 3 4 5noiseSatisfaction
010
2030
400
1020
3040
0 1 2 3 4 5
0 1 2 3 4 5 0 1 2 3 4 5
0 1 2
3 4Per
cent
noiseSatisfactionGraphs by floor

Technical University of Denmark – Department of Civil Engineering Thermo Active Building Systems – Performance in practice and possibilities for optimization Research project funded by Bjarne Saxhofs Fund
6
Dissatisfaction with noise condition was expressed by 36% of respondents. The reasons for dissatisfaction are summarized in Figure 8.
Figure 8 – Contribution of different sources of noise to the dissatisfaction with acoustic conditions during the last month
Data presented in Figure 8 clearly indicate problems common in open space offices. People were most disturbed by their colleagues talking on the phone and by noise related to the telephone conversations as well as by conversations taking place in adjacent areas. About 53% of respondents considered noise conditions as rather enhancing their work performance while 47% considered them to rather interfere with their work performance.
Lighting conditions
Satisfaction with lighting conditions in the office is depicted in Figure 9. In general quite high satisfaction with lighting conditions was recorded by the survey. Around 87% of the respondents indicated satisfaction with lighting conditions. Most prevalent answer was “satisfied”, which was chosen by 50% of respondents. When it comes to dissatisfaction with lighting conditions, there were two main causes for it, namely “too dark in the office” and “not enough daylight” with prevalence of 68% and 38% respectively (Figure 10).
0
20
40
60
80
100
Telephonetalks
Peopletalking in
neighbouringareas
Overhearingprivate
conversation
Equipmentnoise
Telephonesringing
Ventilation,heating and
cooling noise
Noise ofoutdoortraffic
Otheroutdoornoise
Per
cent
age
of p
eopl
e w
ho w
ere
diss
atis
fied
with
noi
se

Technical University of Denmark – Department of Civil Engineering Thermo Active Building Systems – Performance in practice and possibilities for optimization Research project funded by Bjarne Saxhofs Fund
7
Figure 9 – Satisfaction with lighting during last month (on horizontal axis: 0 = "Clearly satisfied", 1 = "Satisfied", 2 = "Just satisfied", 3 = "Just dissatisfied", 4 = "Dissatisfied", 5 = "Clearly dissatisfied")
Figure 10 – Reasons for dissatisfaction with lighting conditions during the last month
Cleanliness in the building/office
This section summarizes questions related to the satisfaction with cleaning in the building in general (Figure 11a) and particular workplace of the respondents (Figure 11b). Figure 11 shows in general satisfaction with cleaning service in the building. Amount of respondents who were “Just dissatisfied” does not exceed 10% and prevalence of stronger dissatisfaction is even lower. Figure 12 offers summary of reasons for dissatisfaction. Dirty floors and dust on surfaces close to the workplaces (respective at the workplace) appear to be the most prevalent reasons for dissatisfaction.
010
2030
4050
Per
cent
0 1 2 3 4 5lightSatisfaction
0
20
40
60
80
100
It was toodark in the
office
It was toobright in the
office
Not enoughdaylight
Too muchdaylight
Electricflickers
Electricundisarable
colour
No task light Reflection inscreen
Per
cent
age
of p
eopl
e w
ho w
ere
diss
atis
fied
with
ligh
ting
Technical University of Denmark – Department of Civil Engineering Thermo Active Building Systems – Performance in practice and possibilities for optimization Research project funded by Bjarne Saxhofs Fund
8
Figure 11 – a) Satisfaction with general cleanliness of the building; b) Satisfaction with cleaning service provided to particular office (on horizontal axis for both a) and b): 0 = "Very satisfied", 5 = "Very dissatisfied")
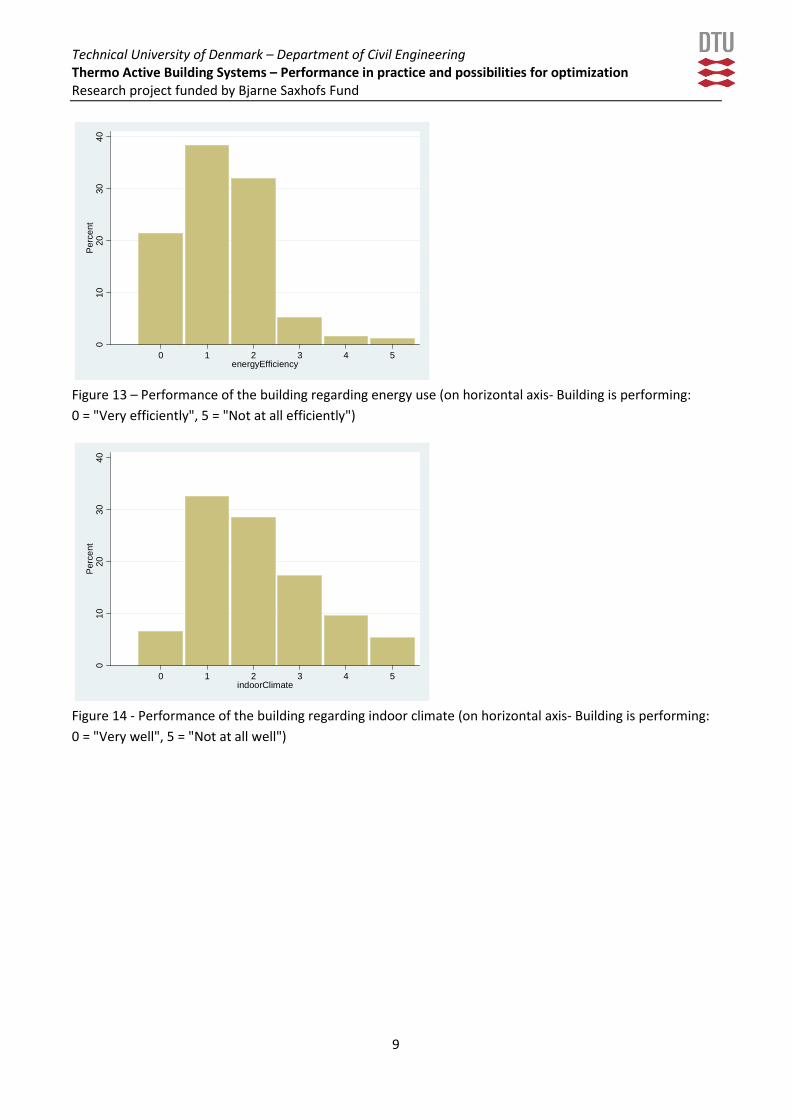
Figure 12 – Reasons for dissatisfaction with cleaning service in the office
Awareness regarding performance of the building as a whole with respect to energy consumption and indoor environmental quality
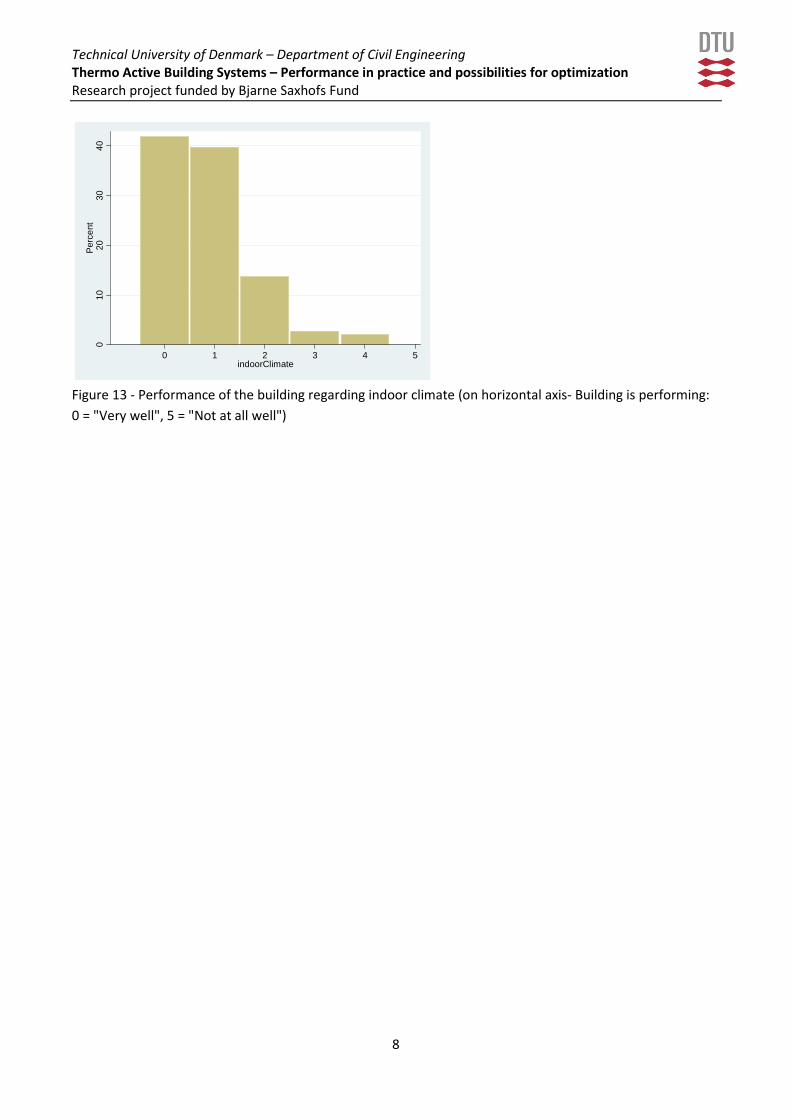
Figure 13 depicts distribution of answers to the question: “Considering energy use, how efficiently do you think this building is performing?” It is clear from the figure that most of the people working in the building consider the building to be energy efficient. Figure 14 represents distribution of answers to analogical question dealing with indoor climate in building. In this case, the distribution of answers is more spread than in the case of energy efficiency; however, about 60% of responses still fall into positive part of the scale. This means that majority of occupants perceive building’s ability to provide good indoor environment positively.
010
2030
4050
Per
cent
0 1 2 3 4 5cleaningBuilding
010
2030
4050
Per
cent
0 1 2 3 4 5cleaningOffice
0
20
40
60
80
100
Surface duston work
surfaces closeto you
Surface duston other
surfaces youmight touch
Surface duston surfacesdifficult to
reach
Spills andderbits
Dirty floors Thrash cansare not
emptied overnight
Thrash cansare significan
source ofodour
Per
cent
age
of p
eopl
e w
ho w
ere
diss
atis
fied
with
cle
anin
g se
rvic
e in
thei
r of
fice
Technical University of Denmark – Department of Civil Engineering Thermo Active Building Systems – Performance in practice and possibilities for optimization Research project funded by Bjarne Saxhofs Fund
9
Figure 13 – Performance of the building regarding energy use (on horizontal axis- Building is performing: 0 = "Very efficiently", 5 = "Not at all efficiently")
Figure 14 - Performance of the building regarding indoor climate (on horizontal axis- Building is performing: 0 = "Very well", 5 = "Not at all well")
010
2030
40P
erce
nt
0 1 2 3 4 5energyEfficiency
010
2030
40P
erce
nt
0 1 2 3 4 5indoorClimate

Technical University of Denmark – Department of Civil Engineering Thermo Active Building Systems – Performance in practice and possibilities for optimization Research project funded by Bjarne Saxhofs Fund
1
Indoor climate survey in COWI headquarters Aalborg – preliminary results from background questionnaire
Date: 23.8.2013 Author: Jakub Kolarik; [email protected] Version: 1.0
Basic information
Internet based post occupancy survey was distributed to occupants in COWI building on 6.5.2013. Occupants had one week to answer the questionnaire consisting of 23 questions. Besides the basic information like gender, type of work or approximate position of workplace, questionnaire included questions regarding thermal comfort, indoor air quality and building features. Moreover, also health related symptoms of the occupants that could be correlated with their presence in the building were surveyed (results regarding health symptoms are not included in this preliminary report). Re-call period was one month, thus respondents were asked to answer the questions referring to the period of one month prior to the survey date.
In total 43 respondents answered the questionnaire. 40% of respondents were females. 23% of respondents stated that they conducted administrative work (7% indicated managerial and 60% technical work). 81% of respondents spend more than 6 hours at their desk daily. Summary of surveyed population with respect to gender and type of work is given in Table 1.
Table 1 – Summary of surveyed population with respect to gender and type of work (table presents number of respondents in particular categories) Type of work/gender Male Female TOTAL Administrative 4 6 10 Managerial 2 1 3 Technical 20 6 26 Not specified - 4 4 TOTAL 26 17 43
Distribution of respondents in the building and office layout
Figure 1 shows distribution of respondents among different floors of the building.
97% of respondents indicated that their workplace was situated in office with more than 7 people. This is in agreement with open space office concept of the building. Most of the respondents (67%) indicated that their workplace was situated within 2 meters from windows. 19% had their workplace between 2 and 4 meters and 14% more than 4 from windows.
Technical University of Denmark – Department of Civil Engineering Thermo Active Building Systems – Performance in practice and possibilities for optimization Research project funded by Bjarne Saxhofs Fund
2
Figure 1 – Percentage of respondents on particular floors
Satisfaction with thermal environment
Satisfaction with thermal environment is one of the basic prerequisites for comfortable environment at workplace. Figure 2 illustrates satisfaction of respondents with temperature conditions in the office one month prior to the survey.
Figure 2 – Temperature satisfaction during last month (on horizontal axis: 0 = "Clearly satisfied", 1 = "Satisfied", 2 = "Just satisfied", 3 = "Just dissatisfied", 4 = "Dissatisfied", 5 = "Clearly dissatisfied")
It can be seen from Figure 2 that 81% of respondents expressed their satisfaction with thermal conditions. Out of those 23% were “Just satisfied”. Dissatisfaction was indicated by 19% of respondents (only 5% were “Clearly dissatisfied”). Results indicate quite high satisfaction with thermal environment. Responses in the middle of the scale (2 = "Just satisfied", 3 = "Just dissatisfied") can most probably be related to people, who experience short periods of discomfort from time to time. Responses on the right part of the scale (4 = "Dissatisfied", 5 = "Clearly dissatisfied") represent people who experience thermal discomfort during significant parts of their working time. Only about 12% of respondents used above mentioned part of the scale.
010
2030
Per
cent
0 1 2 3floor
010
2030
4050
Per
cent
0 1 2 3 4 5temperatureSatisfaction
Technical University of Denmark – Department of Civil Engineering Thermo Active Building Systems – Performance in practice and possibilities for optimization Research project funded by Bjarne Saxhofs Fund
3
Respondents who indicated that they were dissatisfied with temperature conditions mentioned mostly solar irradiation as a source of discomfort (prevalence of 25%). Too little air movement and draught from the ventilation system were the second most prevalent reasons of discomfort with equal prevalence of 19%. 12% of dissatisfied persons mentioned also high humidity. All reasons of discomfort are summarized in Figure 3.
Figure 3 – Sources of discomfort (responses by respondents who were dissatisfied with thermal conditions)
Figure 4 illustrates perceived influence of thermal conditions in the office on work performance of respondents. About 63% of respondents stated that thermal conditions in their building rather enhance their work performance (votes “0”, “1” or “2” on the scale). Quite large number of people (49%) responded using the middle of the scale (“2” or “3”) on the scale, which indicates their rather neutral attitude to this question, thus they do not consider the thermal environment as deciding factor for their work performance. However it needs to be noted that eventual thermal discomfort can negatively influence work performance even though occupants are not directly aware of that.
Figure 4 – Influence of temperature conditions on work performance. (on horizontal axis: 0 = "Conditions enhance work performance", 5 = "Conditions interfere with work performance")
High humidity
Low humidity
Too much air movement
Too little air movement
Solar irradiation
Hot or cold surfaces
Heat from office equipment
Draught from windows
Draught from the corridor
Draught from the ventilation system
010
2030
Per
cent
0 1 2 3 4 5temperaturePerformance

Technical University of Denmark – Department of Civil Engineering Thermo Active Building Systems – Performance in practice and possibilities for optimization Research project funded by Bjarne Saxhofs Fund
4
Air quality
Likewise the satisfaction with thermal environment, satisfaction with air quality also plays important role in overall evaluation of indoor environment. Insufficient ventilation, stuffy air can lead to intensification of symptoms like headache, fatigue or to concentration difficulties. Unpleasant odours can cause distraction and thus decrease work performance. Figure 5 illustrates satisfaction with air quality in the building. More than 92% of respondents indicated their satisfaction with air quality. 17% of them were “clearly satisfied”.
Figure 5 – Air quality satisfaction during last month (on horizontal axis: 0 = "Clearly satisfied", 1 = "Satisfied", 2 = "Just satisfied", 3 = "Just dissatisfied", 4 = "Dissatisfied", 5 = "Clearly dissatisfied")
Acoustic conditions
This part of the survey was focused on perceived noise level in the building, its effect on work performance and main reasons for dissatisfaction with acoustic conditions. As building is designed as open plane office, one can in general expect increased disturbance by noise. Figure 6 represents distribution of answers to the question how satisfied were respondents with noise level during last month.
010
2030
4050
Per
cent
0 1 2 3 4 5airqualSatisfaction

Technical University of Denmark – Department of Civil Engineering Thermo Active Building Systems – Performance in practice and possibilities for optimization Research project funded by Bjarne Saxhofs Fund
5
Figure 6 – Noise level satisfaction during last month (on horizontal axis: 0 = "Clearly satisfied", 1 = "Satisfied", 2 = "Just satisfied", 3 = "Just dissatisfied", 4 = "Dissatisfied", 5 = "Clearly dissatisfied")
76% of respondents indicated their satisfaction with acoustic conditions (responses from “0” to “2”); however only 5% of them were “clearly satisfied”. Dissatisfaction was expressed by 24% of respondents. The most prevalent reasons for dissatisfaction were telephone talks and conversations of people in neighboring areas. This is commonly observed in open space offices. People were most disturbed by their colleagues talking on the phone and by noise related to the telephone conversations as well as by conversations taking place in adjacent areas. About 66% of respondents considered acoustic conditions as rather enhancing their work performance.
Lighting conditions
Satisfaction with lighting conditions in the office is depicted in Figure 7. Rather high satisfaction with lighting conditions was recorded by the survey. 17% of the respondents were clearly satisfied with lighting conditions and 60% were “satisfied”. None of the respondents was clearly dissatisfied.
Figure 7 – Satisfaction with lighting during last month (on horizontal axis: 0 = "Clearly satisfied", 1 = "Satisfied", 2 = "Just satisfied", 3 = "Just dissatisfied", 4 = "Dissatisfied", 5 = "Clearly dissatisfied")
010
2030
40P
erce
nt
0 1 2 3 4 5noiseSatisfaction
020
4060
Per
cent
0 1 2 3 4 5lightSatisfaction
Technical University of Denmark – Department of Civil Engineering Thermo Active Building Systems – Performance in practice and possibilities for optimization Research project funded by Bjarne Saxhofs Fund
6
Cleanliness in the building/office
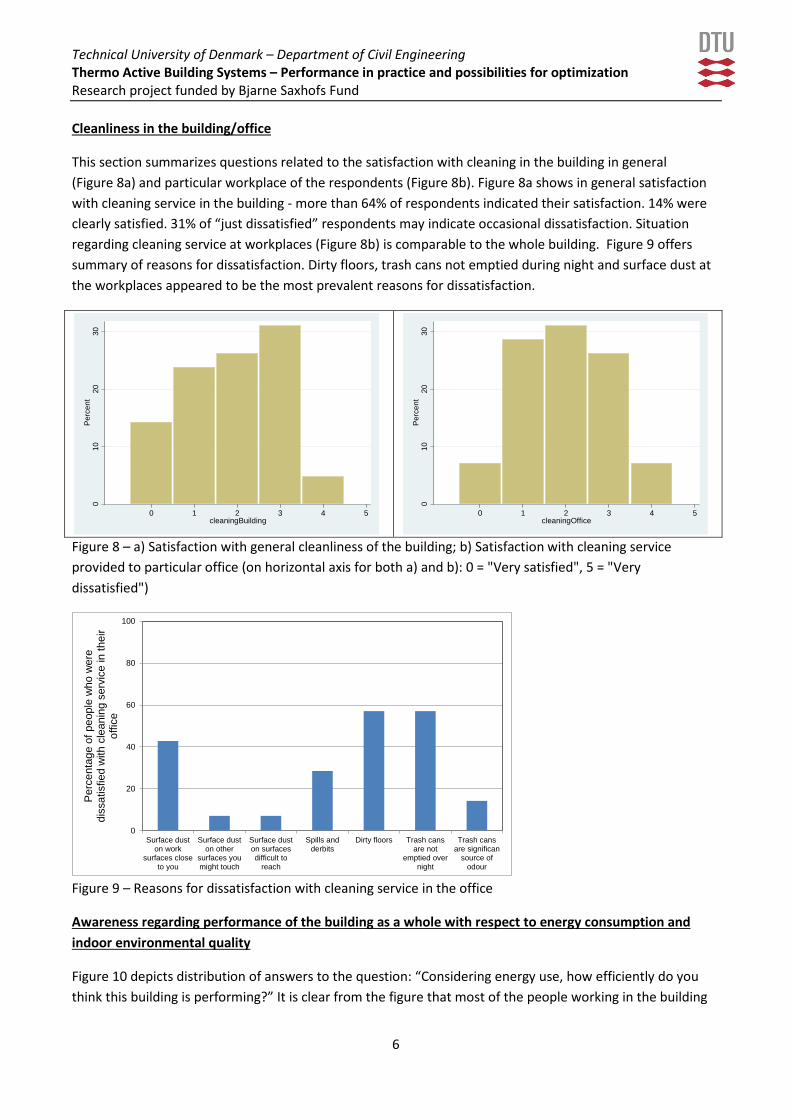
This section summarizes questions related to the satisfaction with cleaning in the building in general (Figure 8a) and particular workplace of the respondents (Figure 8b). Figure 8a shows in general satisfaction with cleaning service in the building - more than 64% of respondents indicated their satisfaction. 14% were clearly satisfied. 31% of “just dissatisfied” respondents may indicate occasional dissatisfaction. Situation regarding cleaning service at workplaces (Figure 8b) is comparable to the whole building. Figure 9 offers summary of reasons for dissatisfaction. Dirty floors, trash cans not emptied during night and surface dust at the workplaces appeared to be the most prevalent reasons for dissatisfaction.
Figure 8 – a) Satisfaction with general cleanliness of the building; b) Satisfaction with cleaning service provided to particular office (on horizontal axis for both a) and b): 0 = "Very satisfied", 5 = "Very dissatisfied")
Figure 9 – Reasons for dissatisfaction with cleaning service in the office
Awareness regarding performance of the building as a whole with respect to energy consumption and indoor environmental quality
Figure 10 depicts distribution of answers to the question: “Considering energy use, how efficiently do you think this building is performing?” It is clear from the figure that most of the people working in the building
010
2030
Per
cent
0 1 2 3 4 5cleaningBuilding
010
2030
Per
cent
0 1 2 3 4 5cleaningOffice
0
20
40
60
80
100
Surface duston work
surfaces closeto you
Surface duston other
surfaces youmight touch
Surface duston surfacesdifficult to
reach
Spills andderbits
Dirty floors Trash cansare not
emptied overnight
Trash cansare significan
source ofodour
Per
cent
age
of p
eopl
e w
ho w
ere
diss
atis
fied
with
cle
anin
g se
rvic
e in
thei
r of
fice
Technical University of Denmark – Department of Civil Engineering Thermo Active Building Systems – Performance in practice and possibilities for optimization Research project funded by Bjarne Saxhofs Fund
7
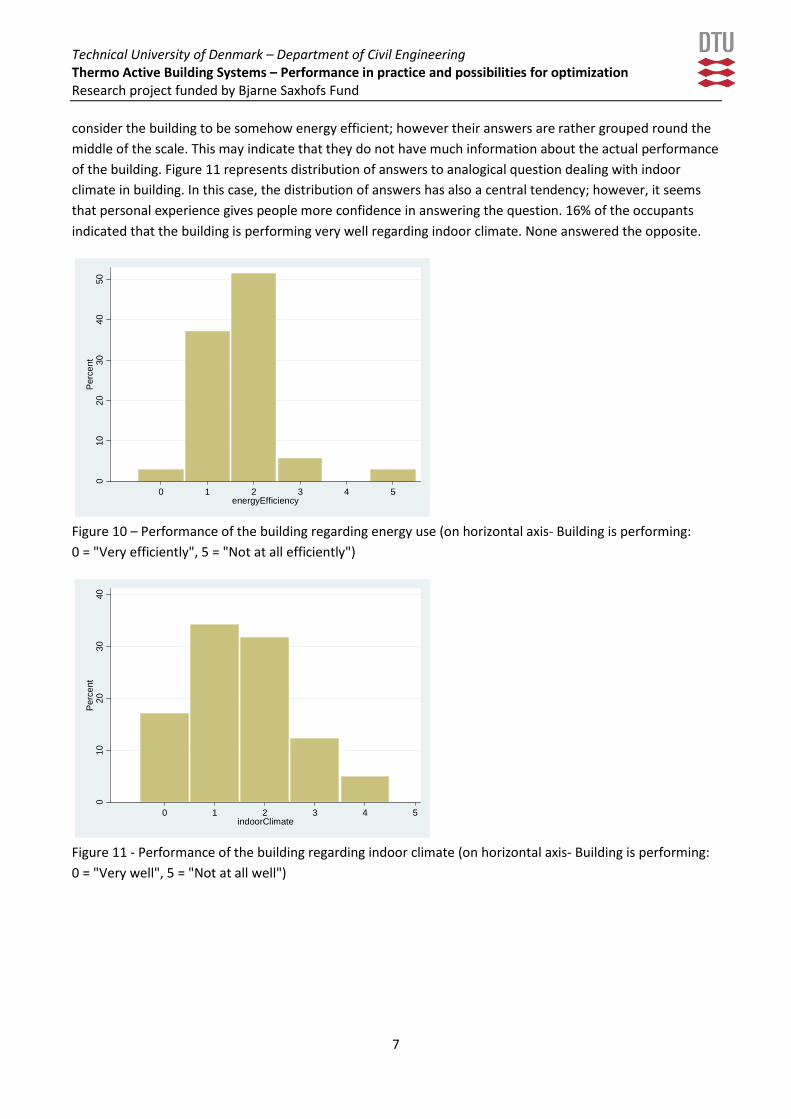
consider the building to be somehow energy efficient; however their answers are rather grouped round the middle of the scale. This may indicate that they do not have much information about the actual performance of the building. Figure 11 represents distribution of answers to analogical question dealing with indoor climate in building. In this case, the distribution of answers has also a central tendency; however, it seems that personal experience gives people more confidence in answering the question. 16% of the occupants indicated that the building is performing very well regarding indoor climate. None answered the opposite.
Figure 10 – Performance of the building regarding energy use (on horizontal axis- Building is performing: 0 = "Very efficiently", 5 = "Not at all efficiently")
Figure 11 - Performance of the building regarding indoor climate (on horizontal axis- Building is performing: 0 = "Very well", 5 = "Not at all well")
010
2030
4050
Per
cent
0 1 2 3 4 5energyEfficiency
010
2030
40P
erce
nt
0 1 2 3 4 5indoorClimate
Technical University of Denmark – Department of Civil Engineering Thermo Active Building Systems – Performance in practice and possibilities for optimization Research project funded by Bjarne Saxhofs Fund
1
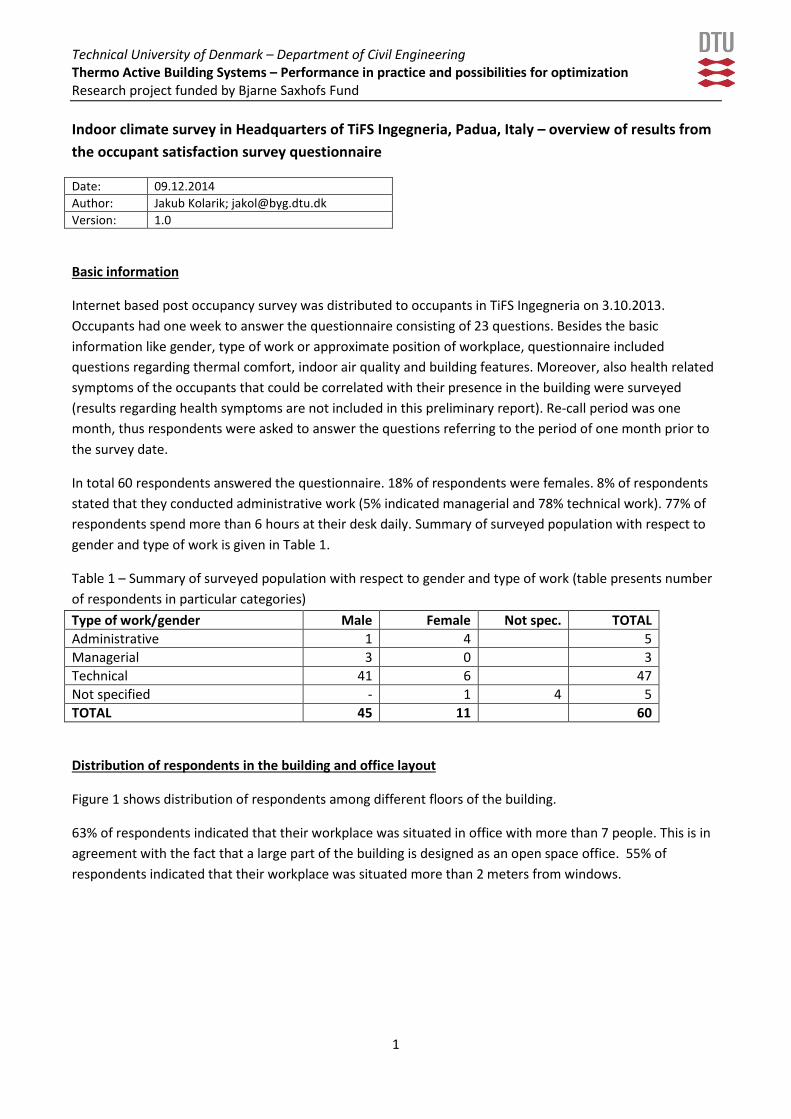
Indoor climate survey in Headquarters of TiFS Ingegneria, Padua, Italy – overview of results from the occupant satisfaction survey questionnaire
Date: 09.12.2014 Author: Jakub Kolarik; [email protected] Version: 1.0
Basic information
Internet based post occupancy survey was distributed to occupants in TiFS Ingegneria on 3.10.2013. Occupants had one week to answer the questionnaire consisting of 23 questions. Besides the basic information like gender, type of work or approximate position of workplace, questionnaire included questions regarding thermal comfort, indoor air quality and building features. Moreover, also health related symptoms of the occupants that could be correlated with their presence in the building were surveyed (results regarding health symptoms are not included in this preliminary report). Re-call period was one month, thus respondents were asked to answer the questions referring to the period of one month prior to the survey date.
In total 60 respondents answered the questionnaire. 18% of respondents were females. 8% of respondents stated that they conducted administrative work (5% indicated managerial and 78% technical work). 77% of respondents spend more than 6 hours at their desk daily. Summary of surveyed population with respect to gender and type of work is given in Table 1.
Table 1 – Summary of surveyed population with respect to gender and type of work (table presents number of respondents in particular categories) Type of work/gender Male Female Not spec. TOTAL Administrative 1 4 5 Managerial 3 0 3 Technical 41 6 47 Not specified - 1 4 5 TOTAL 45 11 60
Distribution of respondents in the building and office layout
Figure 1 shows distribution of respondents among different floors of the building.
63% of respondents indicated that their workplace was situated in office with more than 7 people. This is in agreement with the fact that a large part of the building is designed as an open space office. 55% of respondents indicated that their workplace was situated more than 2 meters from windows.

Technical University of Denmark – Department of Civil Engineering Thermo Active Building Systems – Performance in practice and possibilities for optimization Research project funded by Bjarne Saxhofs Fund
2
Figure 1 – Percentage of respondents on particular floors
Satisfaction with thermal environment
Satisfaction with thermal environment is one of the basic prerequisites for comfortable environment at workplace. Figure 2 illustrates satisfaction of respondents with temperature conditions in the office one month prior to the survey.
Figure 2 – Temperature satisfaction during last month (on horizontal axis: 0 = "Clearly satisfied", 1 = "Satisfied", 2 = "Just satisfied", 3 = "Just dissatisfied", 4 = "Dissatisfied", 5 = "Clearly dissatisfied")
It can be seen from Figure 2 that 77% of respondents expressed their satisfaction with thermal conditions. 23% of respondents were “Just satisfied”. Dissatisfaction was indicated by 23% of respondents (no one was “Clearly dissatisfied”). Results indicate relatively high satisfaction with thermal environment. Responses in the middle of the scale (2 = "Just satisfied", 3 = "Just dissatisfied") can most probably be related to people, who experience short periods of discomfort from time to time. Responses on the right part of the scale (4 = "Dissatisfied", 5 = "Clearly dissatisfied") represent people who experience thermal discomfort during significant parts of their working time. Only about 16% of respondents indicate used above mentioned part of the scale.
010
2030
4050
Per
cent
0 1 2floor
010
2030
4050
Per
cent
0 1 2 3 4 5temperatureSatisfaction
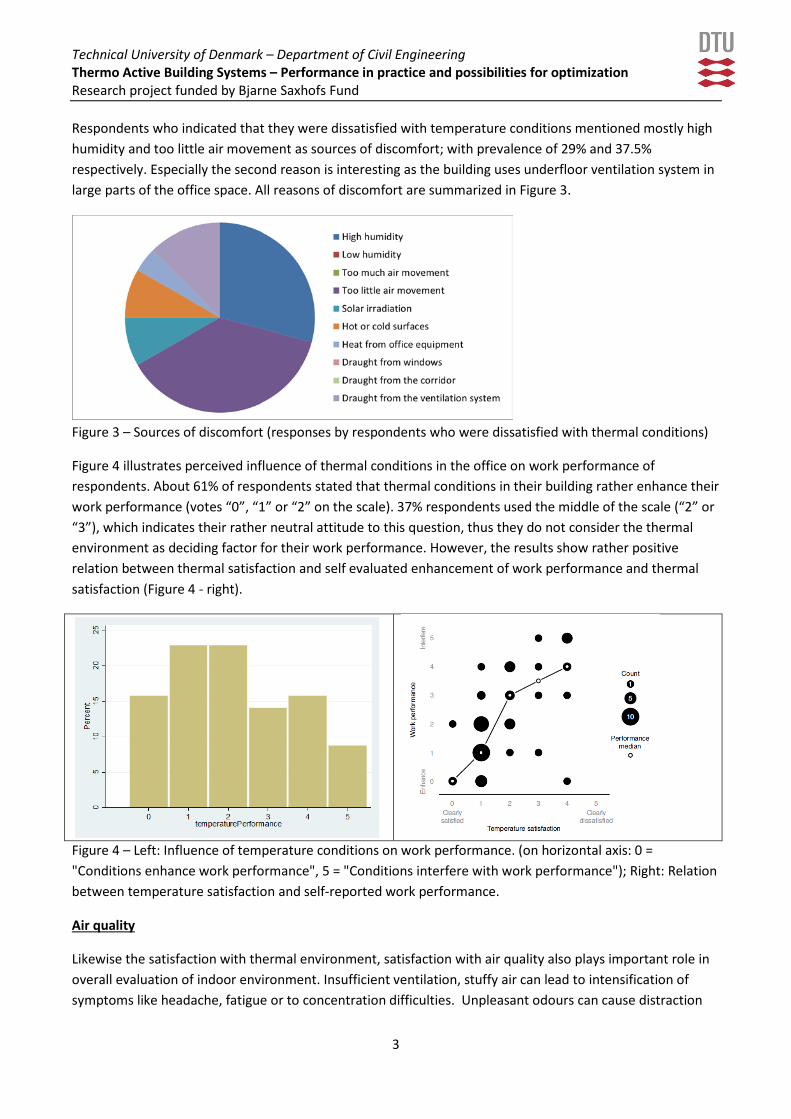
Technical University of Denmark – Department of Civil Engineering Thermo Active Building Systems – Performance in practice and possibilities for optimization Research project funded by Bjarne Saxhofs Fund
3
Respondents who indicated that they were dissatisfied with temperature conditions mentioned mostly high humidity and too little air movement as sources of discomfort; with prevalence of 29% and 37.5% respectively. Especially the second reason is interesting as the building uses underfloor ventilation system in large parts of the office space. All reasons of discomfort are summarized in Figure 3.
Figure 3 – Sources of discomfort (responses by respondents who were dissatisfied with thermal conditions)
Figure 4 illustrates perceived influence of thermal conditions in the office on work performance of respondents. About 61% of respondents stated that thermal conditions in their building rather enhance their work performance (votes “0”, “1” or “2” on the scale). 37% respondents used the middle of the scale (“2” or “3”), which indicates their rather neutral attitude to this question, thus they do not consider the thermal environment as deciding factor for their work performance. However, the results show rather positive relation between thermal satisfaction and self evaluated enhancement of work performance and thermal satisfaction (Figure 4 - right).
Figure 4 – Left: Influence of temperature conditions on work performance. (on horizontal axis: 0 = "Conditions enhance work performance", 5 = "Conditions interfere with work performance"); Right: Relation between temperature satisfaction and self-reported work performance.
Air quality
Likewise the satisfaction with thermal environment, satisfaction with air quality also plays important role in overall evaluation of indoor environment. Insufficient ventilation, stuffy air can lead to intensification of symptoms like headache, fatigue or to concentration difficulties. Unpleasant odours can cause distraction

Technical University of Denmark – Department of Civil Engineering Thermo Active Building Systems – Performance in practice and possibilities for optimization Research project funded by Bjarne Saxhofs Fund
4
and thus decrease work performance. Figure 5 illustrates satisfaction with air quality in the building. More than 67% of respondents indicated their satisfaction with air quality. 4% of them were “clearly satisfied”.
Figure 5 – Air quality satisfaction during last month (on horizontal axis: 0 = "Clearly satisfied", 1 = "Satisfied", 2 = "Just satisfied", 3 = "Just dissatisfied", 4 = "Dissatisfied", 5 = "Clearly dissatisfied")
Acoustic conditions
This part of the survey was focused on perceived noise level in the building, its effect on work performance and main reasons for dissatisfaction with acoustic conditions. As large parts of the building are designed as open plane office, one can in general expect increased disturbance by noise. Figure 6 represents distribution of answers to the question how satisfied were respondents with noise level during last month.
Figure 6 – Noise level satisfaction during last month (on horizontal axis: 0 = "Clearly satisfied", 1 = "Satisfied", 2 = "Just satisfied", 3 = "Just dissatisfied", 4 = "Dissatisfied", 5 = "Clearly dissatisfied")
61% of respondents indicated their satisfaction with acoustic conditions (responses from “0” to “2”); 10% of them were “clearly satisfied”. Dissatisfaction was expressed by 23% of respondents (7% did not answer the question).
010
2030
40P
erce
nt
0 1 2 3 4 5airqualSatisfaction
010
2030
40P
erce
nt
0 1 2 3 4 5noiseSatisfaction
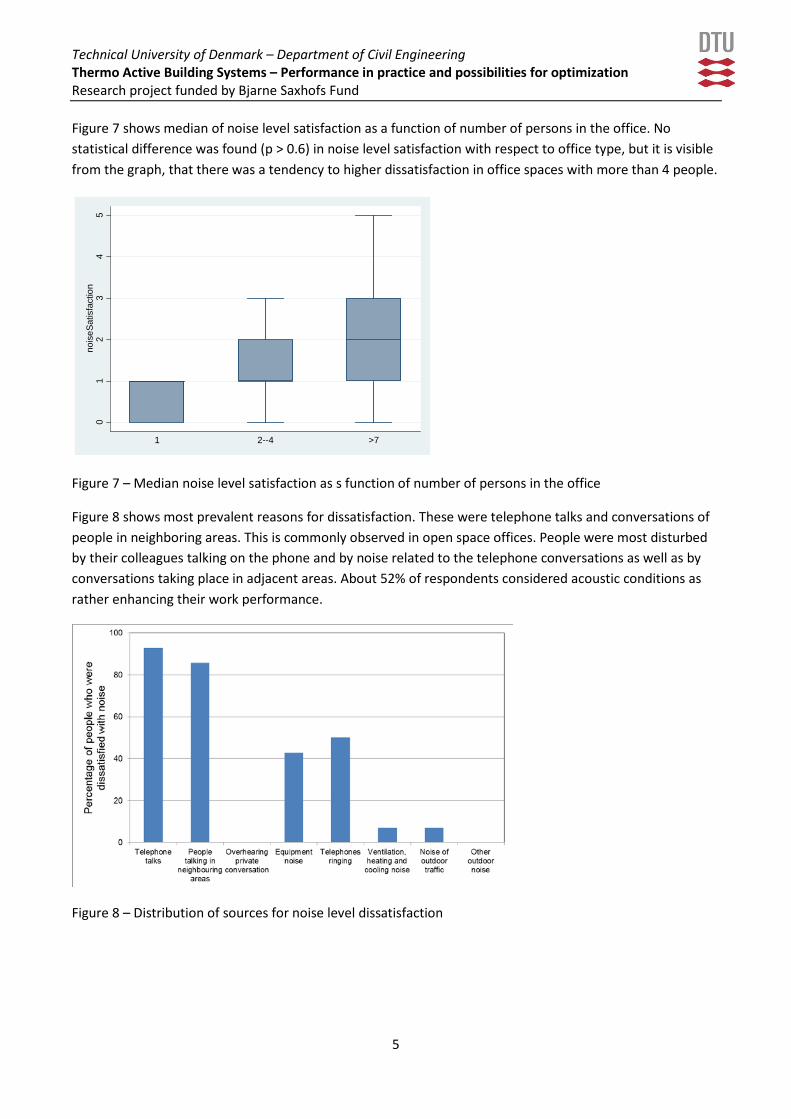
Technical University of Denmark – Department of Civil Engineering Thermo Active Building Systems – Performance in practice and possibilities for optimization Research project funded by Bjarne Saxhofs Fund
5
Figure 7 shows median of noise level satisfaction as a function of number of persons in the office. No statistical difference was found (p > 0.6) in noise level satisfaction with respect to office type, but it is visible from the graph, that there was a tendency to higher dissatisfaction in office spaces with more than 4 people.
Figure 7 – Median noise level satisfaction as s function of number of persons in the office
Figure 8 shows most prevalent reasons for dissatisfaction. These were telephone talks and conversations of people in neighboring areas. This is commonly observed in open space offices. People were most disturbed by their colleagues talking on the phone and by noise related to the telephone conversations as well as by conversations taking place in adjacent areas. About 52% of respondents considered acoustic conditions as rather enhancing their work performance.
Figure 8 – Distribution of sources for noise level dissatisfaction
01
23
45
nois
eSat
isfa
ctio
n
1 2--4 >7
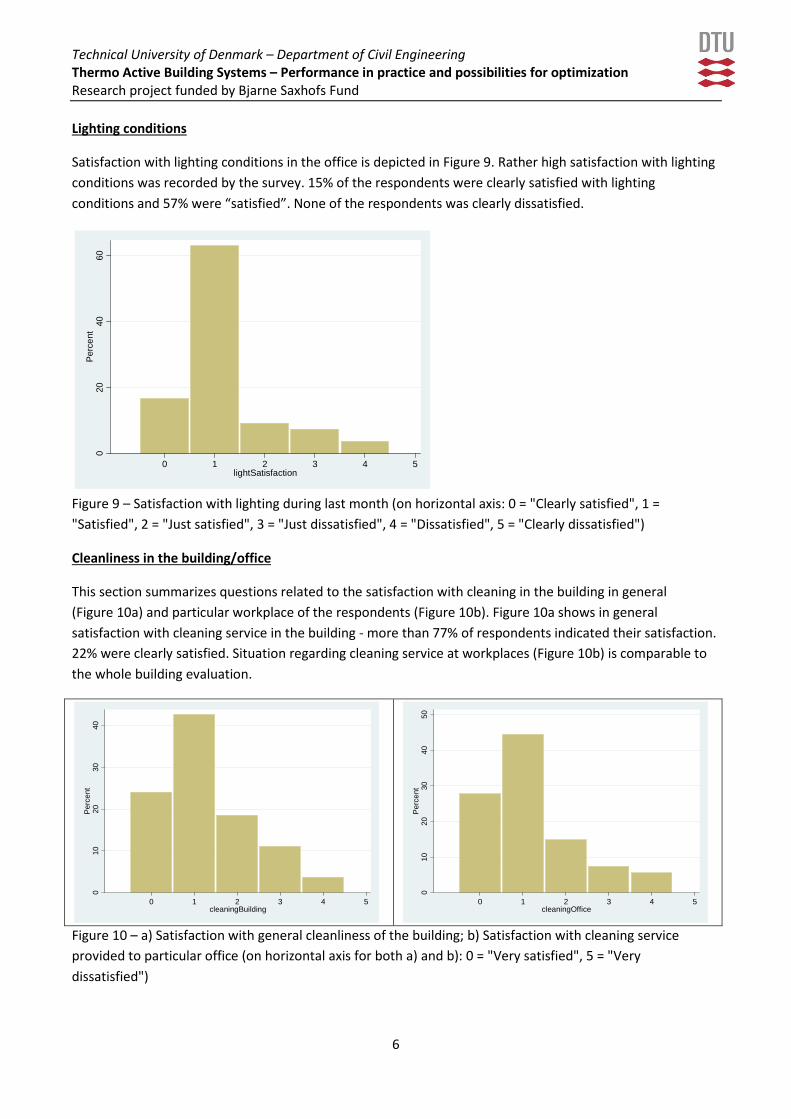
Technical University of Denmark – Department of Civil Engineering Thermo Active Building Systems – Performance in practice and possibilities for optimization Research project funded by Bjarne Saxhofs Fund
6
Lighting conditions
Satisfaction with lighting conditions in the office is depicted in Figure 9. Rather high satisfaction with lighting conditions was recorded by the survey. 15% of the respondents were clearly satisfied with lighting conditions and 57% were “satisfied”. None of the respondents was clearly dissatisfied.
Figure 9 – Satisfaction with lighting during last month (on horizontal axis: 0 = "Clearly satisfied", 1 = "Satisfied", 2 = "Just satisfied", 3 = "Just dissatisfied", 4 = "Dissatisfied", 5 = "Clearly dissatisfied")
Cleanliness in the building/office
This section summarizes questions related to the satisfaction with cleaning in the building in general (Figure 10a) and particular workplace of the respondents (Figure 10b). Figure 10a shows in general satisfaction with cleaning service in the building - more than 77% of respondents indicated their satisfaction. 22% were clearly satisfied. Situation regarding cleaning service at workplaces (Figure 10b) is comparable to the whole building evaluation.
Figure 10 – a) Satisfaction with general cleanliness of the building; b) Satisfaction with cleaning service provided to particular office (on horizontal axis for both a) and b): 0 = "Very satisfied", 5 = "Very dissatisfied")
020
4060
Per
cent
0 1 2 3 4 5lightSatisfaction
010
2030
40P
erce
nt
0 1 2 3 4 5cleaningBuilding
010
2030
4050
Per
cent
0 1 2 3 4 5cleaningOffice

Technical University of Denmark – Department of Civil Engineering Thermo Active Building Systems – Performance in practice and possibilities for optimization Research project funded by Bjarne Saxhofs Fund
7
Awareness regarding performance of the building as a whole with respect to energy consumption and indoor environmental quality
Figure 11 depicts distribution of answers to the question: “Considering energy use, how efficiently do you think this building is performing?” It is clear from the figure that most of the people working in the building, 75%, consider the building to be energy efficient. However it is interesting to note that 16% of respondents did not answer the question. Figure 12 represents distribution of answers to analogical question dealing with indoor climate in building. In this case, the distribution of answers has a central tendency. The median vote (25%, 75% percentile) for the performance regarding indoor environment was 2 (1, 3). 60% of respondents have a positive opinion regarding the indoor climate performance, while 30% have rather negative opinion. 10% did not answer the question.
Figure 11 – Performance of the building regarding energy use (on horizontal axis- Building is performing: 0 = "Very efficiently", 5 = "Not at all efficiently")
Figure 12 - Performance of the building regarding indoor climate (on horizontal axis- Building is performing: 0 = "Very well", 5 = "Not at all well")
010
2030
Per
cent
0 1 2 3 4 5energyEfficiency
010
2030
40P
erce
nt
0 1 2 3 4 5indoorClimate

48
8. Appendix 2 – Conference paper “OPERATIVE TEMPERATURE DRIFTS
AND OCCUPANT SATISFACTION WITH THERMAL ENVIRONMENT IN
THREE OFFICE BUILDINGS USING RADIANT HEATING/ COOLING
SYSTEM” presented at Healthy Buildings 2015, Eindhoven, The
Netherlands
F: Physical responses & physiology F.2. Health assessment (incl. Thermal comfort) OPERATIVE TEMPERATURE DRIFTS AND OCCUPANT SATISFACTION WITH THERMAL ENVIRONMENT IN THREE OFFICE BUILDINGS USING RADIANT HEATING/ COOLING SYSTEM Jakub Kolarik1,*, Jørn Toftum 2 and Bjarne W. Olesen2 1Department of Civil Engineering, Section for Building Energy, Technical University of Denmark, Kgs. Lyngby, Denmark 2Department of Civil Engineering, International Centre for Indoor Environment and Energy, Technical University of Denmark, Kgs. Lyngby, Denmark *Corresponding email: [email protected] Keywords: Operative temperature drift, Thermal comfort, Radiant heating/cooling SUMMARY The objective of this study was to analyse operative temperature drifts and occupant satisfaction with thermal environment in office buildings utilizing embedded radiant heating/cooling systems. Three office buildings were investigated: Town Hall in Viborg, Denmark (floor area 19400 m2), IDOM, Madrid, Spain (16000 m2), TiFS, Padua, Italy (2200 m2). Continuous measurements of operative temperature were conducted at four workplaces in each building for one year. Occupants’ satisfaction was assessed by internet based questionnaire. Results showed that mostly exceeded limits were those for 4-hour drift (0.8 K/h), which were exceeded at least in 2% and up to 52% of occupied time in investigated buildings. Limits for hourly and 2-hour drifts were exceeded in max. 2% of occupied time. Median values were in ranges of 0.12-0.29 K/h, 0.18-0.52 K/h and 0.27-0.84 K/h for 1, 2 and 4-hour drifts respectively. Occupants’ in all buildings were rather satisfied with temperature conditions. Median temperature satisfaction (0="Clearly satisfied" - 5="Clearly dissatisfied") was 2, 1 and 1 for Viborg, Madrid and Padua respectively. Temperature satisfaction slightly decreased when rate of temperature change increased, thus higher temperature drifts seemed to lead to higher dissatisfaction, however the collected data did not allow for robust statistical analysis. INTRODUCTION Radiant heating/cooling systems have become a natural part of sustainable high performing building concepts Olesen (2012). Due to the principle of their operation, utilization of such systems is associated with drifts of operative temperature. Occupants are therefore exposed to non-steady thermal conditions, which may influence their thermal comfort and productivity (Kolarik et al. 2009 and 2010). International Standard ISO/EN 7730 (2005) allows maximum drift of 2 K/h. American standard ASHRAE Standard 55 (2013) allows for 2.2 K/h for drift duration of 1 hour, but only 0.8 K/h for drift lasting 4 hours. Scientific literature reporting temperature drifts in real buildings is limited. De Carli and Olesen (2002) focused on measurements of operative temperatures four buildings with the following systems:
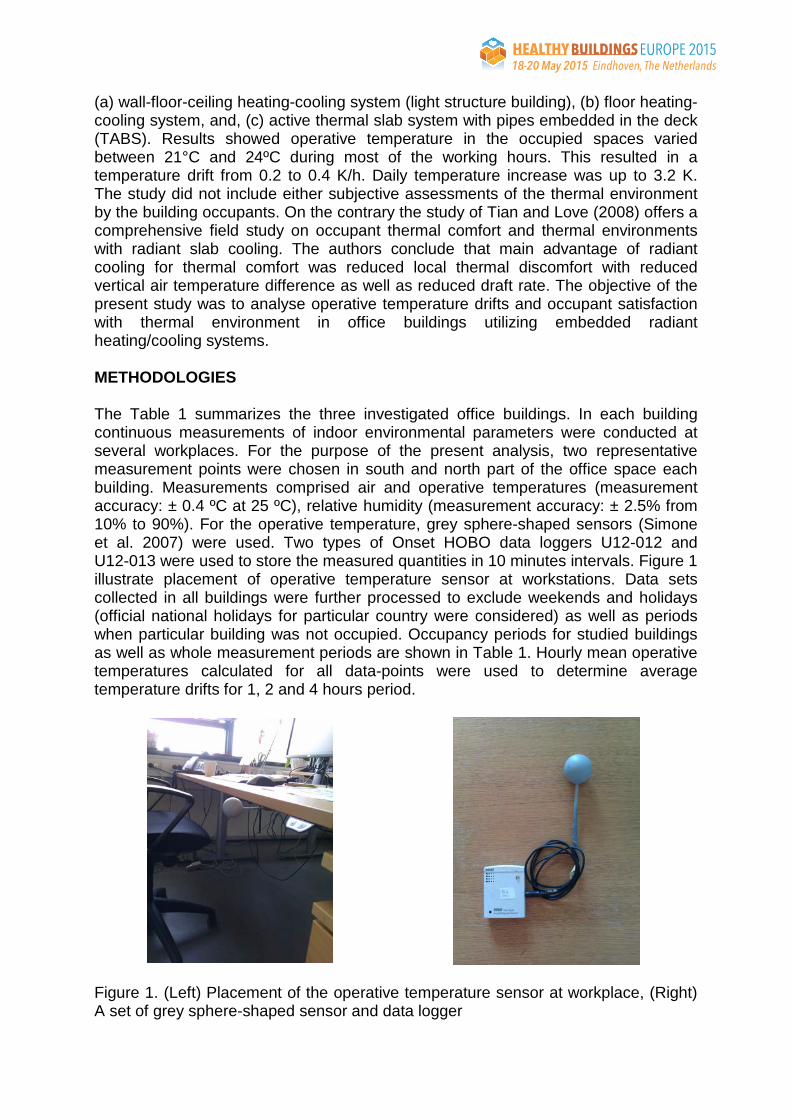
(a) wall-floor-ceiling heating-cooling system (light structure building), (b) floor heating-cooling system, and, (c) active thermal slab system with pipes embedded in the deck (TABS). Results showed operative temperature in the occupied spaces varied between 21°C and 24ºC during most of the working hours. This resulted in a temperature drift from 0.2 to 0.4 K/h. Daily temperature increase was up to 3.2 K. The study did not include either subjective assessments of the thermal environment by the building occupants. On the contrary the study of Tian and Love (2008) offers a comprehensive field study on occupant thermal comfort and thermal environments with radiant slab cooling. The authors conclude that main advantage of radiant cooling for thermal comfort was reduced local thermal discomfort with reduced vertical air temperature difference as well as reduced draft rate. The objective of the present study was to analyse operative temperature drifts and occupant satisfaction with thermal environment in office buildings utilizing embedded radiant heating/cooling systems. METHODOLOGIES The Table 1 summarizes the three investigated office buildings. In each building continuous measurements of indoor environmental parameters were conducted at several workplaces. For the purpose of the present analysis, two representative measurement points were chosen in south and north part of the office space each building. Measurements comprised air and operative temperatures (measurement accuracy: ± 0.4 ºC at 25 ºC), relative humidity (measurement accuracy: ± 2.5% from 10% to 90%). For the operative temperature, grey sphere-shaped sensors (Simone et al. 2007) were used. Two types of Onset HOBO data loggers U12-012 and U12-013 were used to store the measured quantities in 10 minutes intervals. Figure 1 illustrate placement of operative temperature sensor at workstations. Data sets collected in all buildings were further processed to exclude weekends and holidays (official national holidays for particular country were considered) as well as periods when particular building was not occupied. Occupancy periods for studied buildings as well as whole measurement periods are shown in Table 1. Hourly mean operative temperatures calculated for all data-points were used to determine average temperature drifts for 1, 2 and 4 hours period.
Figure 1. (Left) Placement of the operative temperature sensor at workplace, (Right) A set of grey sphere-shaped sensor and data logger
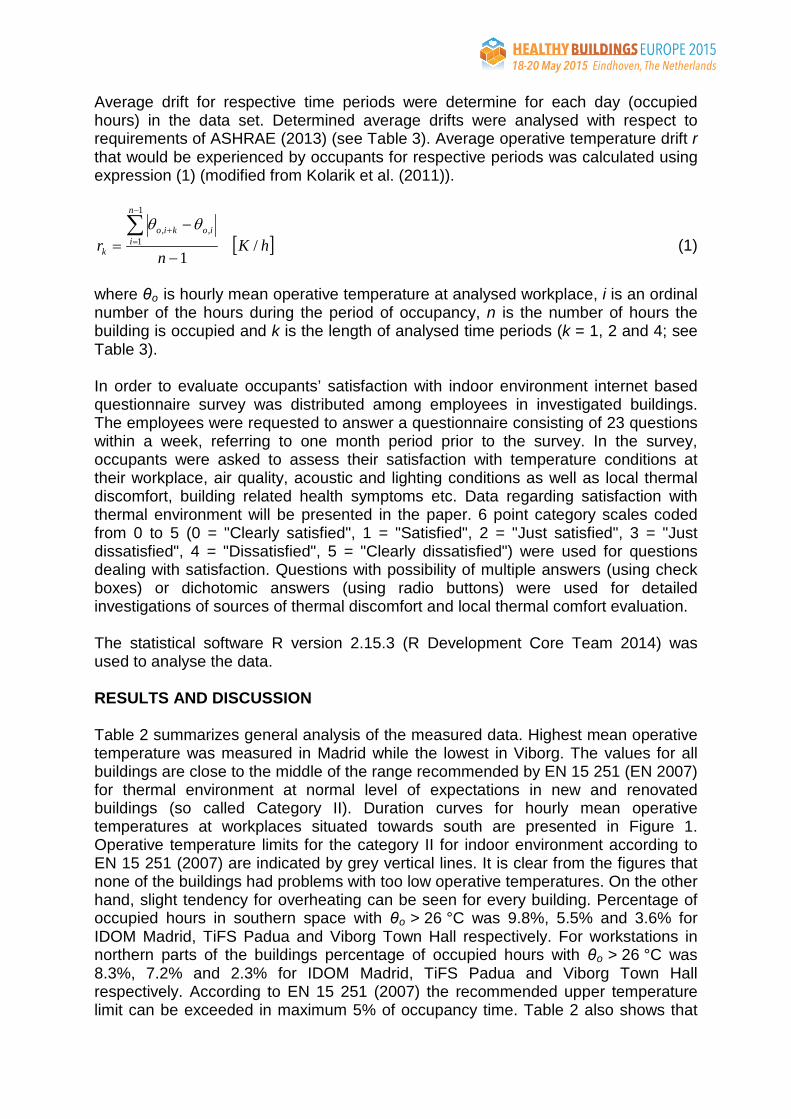
Average drift for respective time periods were determine for each day (occupied hours) in the data set. Determined average drifts were analysed with respect to requirements of ASHRAE (2013) (see Table 3). Average operative temperature drift r that would be experienced by occupants for respective periods was calculated using expression (1) (modified from Kolarik et al. (2011)).
[ ]hKn
r
n
iiokio
k /1
1
1,,
−
−=∑−
=+ θθ
(1)
where θo is hourly mean operative temperature at analysed workplace, i is an ordinal number of the hours during the period of occupancy, n is the number of hours the building is occupied and k is the length of analysed time periods (k = 1, 2 and 4; see Table 3). In order to evaluate occupants’ satisfaction with indoor environment internet based questionnaire survey was distributed among employees in investigated buildings. The employees were requested to answer a questionnaire consisting of 23 questions within a week, referring to one month period prior to the survey. In the survey, occupants were asked to assess their satisfaction with temperature conditions at their workplace, air quality, acoustic and lighting conditions as well as local thermal discomfort, building related health symptoms etc. Data regarding satisfaction with thermal environment will be presented in the paper. 6 point category scales coded from 0 to 5 (0 = "Clearly satisfied", 1 = "Satisfied", 2 = "Just satisfied", 3 = "Just dissatisfied", 4 = "Dissatisfied", 5 = "Clearly dissatisfied") were used for questions dealing with satisfaction. Questions with possibility of multiple answers (using check boxes) or dichotomic answers (using radio buttons) were used for detailed investigations of sources of thermal discomfort and local thermal comfort evaluation. The statistical software R version 2.15.3 (R Development Core Team 2014) was used to analyse the data. RESULTS AND DISCUSSION Table 2 summarizes general analysis of the measured data. Highest mean operative temperature was measured in Madrid while the lowest in Viborg. The values for all buildings are close to the middle of the range recommended by EN 15 251 (EN 2007) for thermal environment at normal level of expectations in new and renovated buildings (so called Category II). Duration curves for hourly mean operative temperatures at workplaces situated towards south are presented in Figure 1. Operative temperature limits for the category II for indoor environment according to EN 15 251 (2007) are indicated by grey vertical lines. It is clear from the figures that none of the buildings had problems with too low operative temperatures. On the other hand, slight tendency for overheating can be seen for every building. Percentage of occupied hours in southern space with θo > 26 °C was 9.8%, 5.5% and 3.6% for IDOM Madrid, TiFS Padua and Viborg Town Hall respectively. For workstations in northern parts of the buildings percentage of occupied hours with θo > 26 °C was 8.3%, 7.2% and 2.3% for IDOM Madrid, TiFS Padua and Viborg Town Hall respectively. According to EN 15 251 (2007) the recommended upper temperature limit can be exceeded in maximum 5% of occupancy time. Table 2 also shows that

median values of rk calculated for whole investigated period in particular buildings were far below 2 K/h. Highest median values were observed for southern space in Viborg Town Hall. This is most probably caused by the lack of external solar shading on the building, thus the solar heat gains play the most significant role. Table 3 summarizes percentage of occupied hours during which rk limits according to ASHRAE (2013) were exceeded. The limit value for r4 (4-hour drift; max. 0.8 K/h), was exceeded in all studied buildings. The highest percentage of occupied hours with r4 > 0.8 K/h was observed in southern space of Viborg Town Hall (52.4%), the lowest in north oriented space of IDOM Madrid (1.9%). Exceedance of temperature drift rates for shorter time periods was not that prevalent. This is consistent with nature of TABS systems installed in the buildings, which are known to impose slow but steady temperature drifts while eliminating more rapid temperature fluctuations.
Figure 1. Duration curves for hourly mean operative temperatures (θo) measured in southern spaces of the investigated buildings; amount of hours in the data-set was not equal for all buildings – end of the data-set for particular building is indicated by a vertical line at corresponding colour. Obtained results are in agreement with previous work of De Carli and Olesen (2002). They analysed daily operative temperature increase (“ramp”) in four buildings. The results of their field study showed that most prevalent drift were in a range 0.1 - 0.4 K/h. This is consistent with interquartile ranges for r1 presented in Table 3. However, the daily operative temperature increase was not considered in the present study, because preliminary analyses revealed that occupants were often not exposed to continuous temperature increased during the day. Thus detailed analysis of drifts for 1, 2 and 4-hour (r1, r2 and r4) periods seemed more representative than using of simple afternoon-morning operative temperature difference. International standard EN/ISO 7730 (EN/ISO 2005) recommends maximum operative temperature drift 2 K/h. Considering the fact that limit 2.2 K/h by ASHRAE (2013) was almost never not exceeded in the present study(see Table 3), no further analyses regarding EN/ISO (2005) limit were conducted.
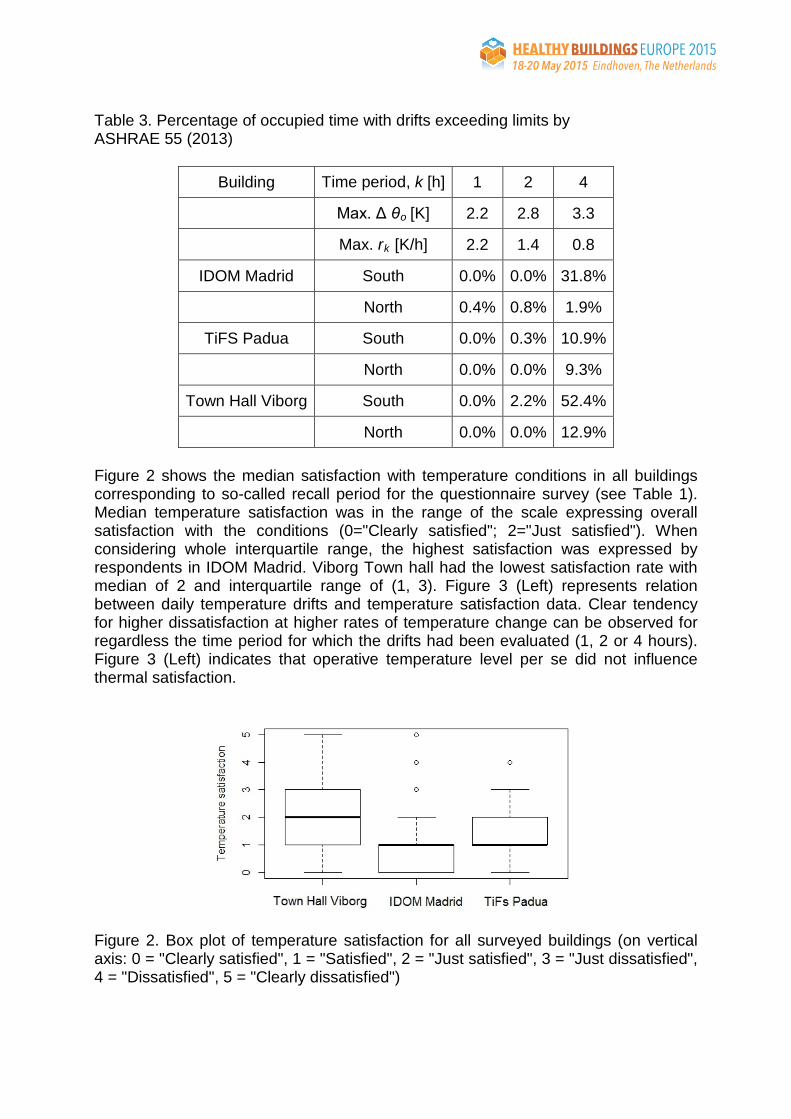
Table 3. Percentage of occupied time with drifts exceeding limits by ASHRAE 55 (2013)
Building Time period, k [h] 1 2 4
Max. Δ θo [K] 2.2 2.8 3.3
Max. rk [K/h] 2.2 1.4 0.8
IDOM Madrid South 0.0% 0.0% 31.8%
North 0.4% 0.8% 1.9%
TiFS Padua South 0.0% 0.3% 10.9%
North 0.0% 0.0% 9.3%
Town Hall Viborg South 0.0% 2.2% 52.4%
North 0.0% 0.0% 12.9%
Figure 2 shows the median satisfaction with temperature conditions in all buildings corresponding to so-called recall period for the questionnaire survey (see Table 1). Median temperature satisfaction was in the range of the scale expressing overall satisfaction with the conditions (0="Clearly satisfied"; 2="Just satisfied"). When considering whole interquartile range, the highest satisfaction was expressed by respondents in IDOM Madrid. Viborg Town hall had the lowest satisfaction rate with median of 2 and interquartile range of (1, 3). Figure 3 (Left) represents relation between daily temperature drifts and temperature satisfaction data. Clear tendency for higher dissatisfaction at higher rates of temperature change can be observed for regardless the time period for which the drifts had been evaluated (1, 2 or 4 hours). Figure 3 (Left) indicates that operative temperature level per se did not influence thermal satisfaction.
Figure 2. Box plot of temperature satisfaction for all surveyed buildings (on vertical axis: 0 = "Clearly satisfied", 1 = "Satisfied", 2 = "Just satisfied", 3 = "Just dissatisfied", 4 = "Dissatisfied", 5 = "Clearly dissatisfied")
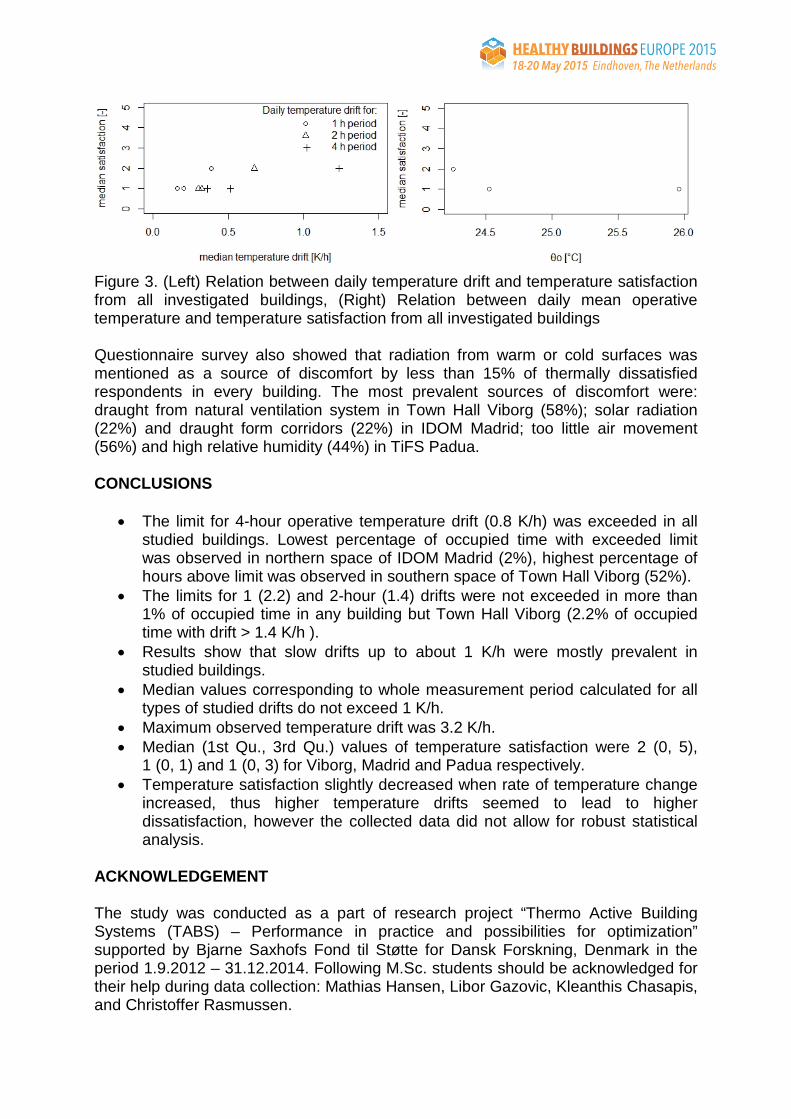
Figure 3. (Left) Relation between daily temperature drift and temperature satisfaction from all investigated buildings, (Right) Relation between daily mean operative temperature and temperature satisfaction from all investigated buildings Questionnaire survey also showed that radiation from warm or cold surfaces was mentioned as a source of discomfort by less than 15% of thermally dissatisfied respondents in every building. The most prevalent sources of discomfort were: draught from natural ventilation system in Town Hall Viborg (58%); solar radiation (22%) and draught form corridors (22%) in IDOM Madrid; too little air movement (56%) and high relative humidity (44%) in TiFS Padua. CONCLUSIONS
• The limit for 4-hour operative temperature drift (0.8 K/h) was exceeded in all studied buildings. Lowest percentage of occupied time with exceeded limit was observed in northern space of IDOM Madrid (2%), highest percentage of hours above limit was observed in southern space of Town Hall Viborg (52%).
• The limits for 1 (2.2) and 2-hour (1.4) drifts were not exceeded in more than 1% of occupied time in any building but Town Hall Viborg (2.2% of occupied time with drift > 1.4 K/h ).
• Results show that slow drifts up to about 1 K/h were mostly prevalent in studied buildings.
• Median values corresponding to whole measurement period calculated for all types of studied drifts do not exceed 1 K/h.
• Maximum observed temperature drift was 3.2 K/h. • Median (1st Qu., 3rd Qu.) values of temperature satisfaction were 2 (0, 5),
1 (0, 1) and 1 (0, 3) for Viborg, Madrid and Padua respectively. • Temperature satisfaction slightly decreased when rate of temperature change
increased, thus higher temperature drifts seemed to lead to higher dissatisfaction, however the collected data did not allow for robust statistical analysis.
ACKNOWLEDGEMENT The study was conducted as a part of research project “Thermo Active Building Systems (TABS) – Performance in practice and possibilities for optimization” supported by Bjarne Saxhofs Fond til Støtte for Dansk Forskning, Denmark in the period 1.9.2012 – 31.12.2014. Following M.Sc. students should be acknowledged for their help during data collection: Mathias Hansen, Libor Gazovic, Kleanthis Chasapis, and Christoffer Rasmussen.
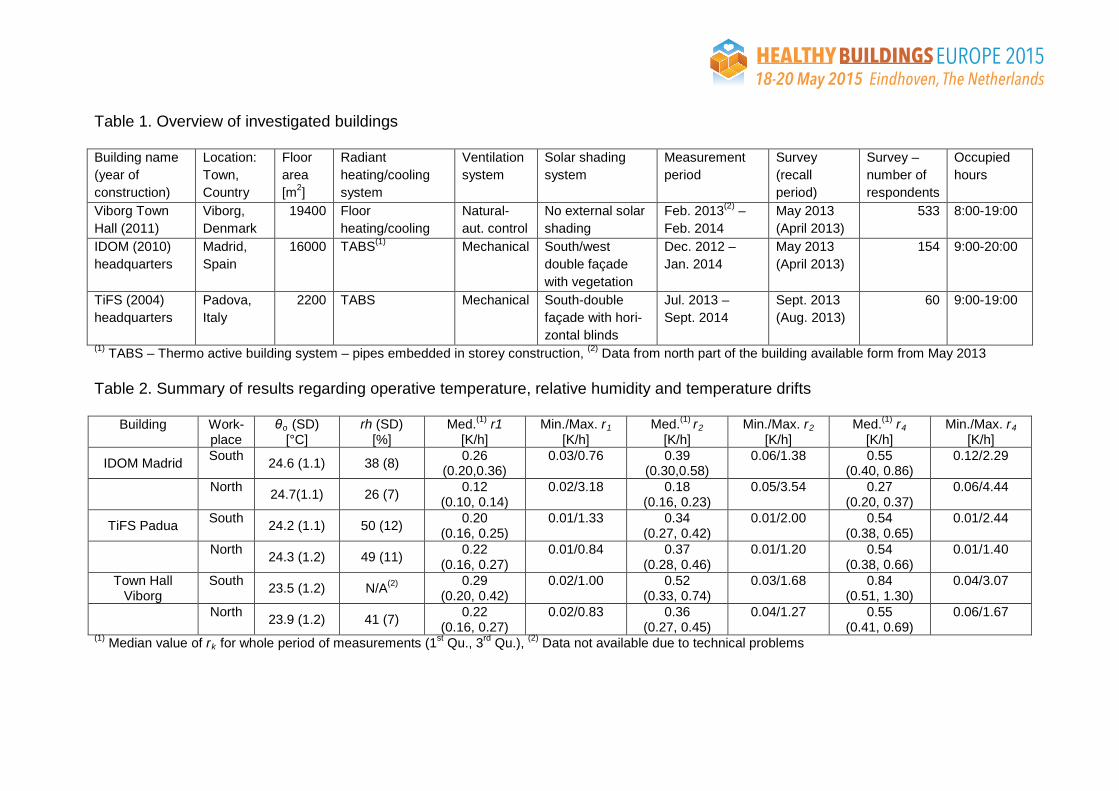
Table 1. Overview of investigated buildings Building name (year of construction)
Location: Town, Country
Floor area [m2]
Radiant heating/cooling system
Ventilation system
Solar shading system
Measurement period
Survey (recall period)
Survey – number of respondents
Occupied hours
Viborg Town Hall (2011)
Viborg, Denmark
19400 Floor heating/cooling
Natural-aut. control
No external solar shading
Feb. 2013(2) – Feb. 2014
May 2013 (April 2013)
533 8:00-19:00
IDOM (2010) headquarters
Madrid, Spain
16000 TABS(1) Mechanical South/west double façade with vegetation
Dec. 2012 – Jan. 2014
May 2013 (April 2013)
154 9:00-20:00
TiFS (2004) headquarters
Padova, Italy
2200 TABS Mechanical South-double façade with hori- zontal blinds
Jul. 2013 – Sept. 2014
Sept. 2013 (Aug. 2013)
60 9:00-19:00
(1) TABS – Thermo active building system – pipes embedded in storey construction, (2) Data from north part of the building available form from May 2013 Table 2. Summary of results regarding operative temperature, relative humidity and temperature drifts
Building
Work-place
θo (SD) [°C]
rh (SD) [%]
Med.(1) r1 [K/h]
Min./Max. r1 [K/h]
Med.(1) r2 [K/h]
Min./Max. r2 [K/h]
Med.(1) r4 [K/h]
Min./Max. r4 [K/h]
IDOM Madrid South 24.6 (1.1) 38 (8) 0.26 (0.20,0.36)
0.03/0.76 0.39 (0.30,0.58)
0.06/1.38 0.55 (0.40, 0.86)
0.12/2.29
North 24.7(1.1) 26 (7) 0.12
(0.10, 0.14) 0.02/3.18 0.18
(0.16, 0.23) 0.05/3.54 0.27
(0.20, 0.37) 0.06/4.44
TiFS Padua South 24.2 (1.1) 50 (12) 0.20 (0.16, 0.25)
0.01/1.33 0.34 (0.27, 0.42)
0.01/2.00 0.54 (0.38, 0.65)
0.01/2.44
North 24.3 (1.2) 49 (11) 0.22 (0.16, 0.27)
0.01/0.84 0.37 (0.28, 0.46)
0.01/1.20 0.54 (0.38, 0.66)
0.01/1.40
Town Hall Viborg
South 23.5 (1.2) N/A(2) 0.29 (0.20, 0.42)
0.02/1.00 0.52 (0.33, 0.74)
0.03/1.68 0.84 (0.51, 1.30)
0.04/3.07
North 23.9 (1.2) 41 (7) 0.22 (0.16, 0.27)
0.02/0.83 0.36 (0.27, 0.45)
0.04/1.27 0.55 (0.41, 0.69)
0.06/1.67
(1) Median value of rk for whole period of measurements (1st Qu., 3rd Qu.), (2) Data not available due to technical problems

REFERENCES ASHRAE (2003) Handbook–HVAC Applications, American Society of Heating,
Refrigerating and Air–Conditioning Engineers, Inc., Atlanta, GA. De Carli M, Olesen BW (2002) Field measurements of operative temperatures in
buildings heated or cooled by embedded water-based radiant systems. ASHRAE Transactions, Vol.108 PART 2, 714-725, American Society of Heating, Refrigerating and Air Conditioning Engineers, Atlanta, USA.
EN (2007) EN 15 251: Indoor environmental input parameters for design and assessment of energy performance of buildings addressing indoor air quality, thermal environment, lighting and acoustics. European Committee for Standardization, Brussels, Belgium.
EN/ISO (2005) EN/ISO 7730: International standard: Ergonomics of the Thermal Environment-Analytical Determination of Thermal Comfort by Using Calculations of the PMV and PPD Indices and Local Thermal Comfort Criteria, ISO, Geneva, Switzerland.
Kolarik J, Toftum J, Olesen BW, Shitzer A (2009). Occupant Responses and Office Work Performance in Environments with Moderately Drifting Operative Temperatures (RP-1269). HVAC&R Research, Vol. 15 (5), pp. 931-960.
Olesen BW (2012) Thermo Active Building Systems Using Building Mass To Heat and Cool. ASHRAE Journal, Vol. 54 (2), pp. 44-52, ISSN: 0001-2491.
R Development Core Team (2014) R: A language and environment for statistical computing. R Foundation for Statistical Computing, Vienna, Austria. ISBN 3-900051-07-0, http://www.Rproject.org.
Simone A, Babiak J, Bullo M, Landkilde G and Olesen BW (2007) Operative temperature control of radiant surface heating and cooling systems. In: Proceedings of Clima 2007 wellbeing indoors, the 9th REHVA World Congress, Helsinki, Finland.
Tian Z, Love JA (2008) A field study of occupant thermal comfort and thermal environments with radiant slab cooling. Building and Environment, Vol. 43 (10), pp. 1658-1670.
Toftum J, Kolarik J, Belkowska D, Olesen BW (2010) Influence on Occupant Responses of Behavioral Modification of Clothing Insulation in Nonsteady Thermal Environments (RP-1269). HVAC&R Research, Vol. 16(1), pp. 59-74.

56
9. Appendix 3 – Conference paper “Influence of measurement
uncertainty on classification of thermal environment in buildings
according to European Standard EN 15251” presented at 7. Passivhus
Norden | Sustainable Cities and Buildings, Copenhagen, Denmark
Copenhagen, 20-21 August 2015
7. Passivhus Norden | Sustainable Cities and Buildings Brings practitioners and researchers together
www.7phn.org Page 1/10
Influence of measurement uncertainty on classification of thermal environment in buildings according to European Standard EN 15251
Jakub Kolarik1,*, Bjarne W. Olesen2 1Department of Civil Engineering, Section for Building Energy, Technical University of Denmark, Kgs. Lyngby, Denmark 2Department of Civil Engineering, International Centre for Indoor Environment and Energy, Technical University of Denmark, Kgs. Lyngby, Denmark *Corresponding email: [email protected]
SUMMARY European Standard EN 15 251 in its current version does not provide any guidance on how to handle uncertainty of long term measurements of indoor environmental parameters used for classification of buildings. The objective of the study was to analyse the uncertainty for field measurements of operative temperature and evaluate its effect on categorization of thermal environment according to EN 15251. A data-set of field measurements of operative temperature four office buildings situated in Denmark, Italy and Spain was used. Data for each building included approx. one year of continuous measurements of operative temperature at two measuring points (south/south-west and north/north-east orientation). Results of the present study suggest that measurement uncertainty needs to be considered during assessment of thermal environment in existing buildings. When expanded standard uncertainty was taken into account in categorization of thermal environment according to EN 15251, the difference in prevalence of exceeded category limits were up to 17.3%, 8.3% and 2% of occupied hours for category I, II and III respectively.
KEYWORDS Measurement uncertainty, thermal environment, EN 15251, operative temperature
INTRODUCTION European standard EN 15251 (EN 2007) includes a categorization methodology for indoor environment in buildings that specifies four categories for indoor environmental quality. They can be, besides building design and certification, used also for long term evaluation of indoor environment in existing buildings. The standard is closely related to European Commission’s Energy Performance of Buildings Directive (EPBD 2003) and states that information regarding indoor environment should be included with building’s energy certificate. The design of long term measurements and used instruments must fulfil International Standard EN/ISO 7726 (ISO 2002). The standard specifies required and desired (preferable) measuring accuracy for used instruments (for example required accuracy of air temperature measurement: ± 0.5 K within 10-30 °C range). However, the standard EN 15251 does not provide any guidance on how to handle the influence of measurement accuracy, not to say uncertainty of long term measurements on allocation of buildings in particular categories. Amount of literature focused on the topic is quite limited. Studies of d’Ambrosio Alfano et al. (2013) and d’Ambrosio Alfano et al. (2011) focused explicitly on accuracy of instruments used for evaluation of thermal environment. Both studies concluded that when measurement accuracy was taken into account, a reliable attribution of the building categories (according to EN (2007)) was very difficult. The authors indicated a need for in-depth discussion focused on the topic, which would lead to standardization of both measuring and calibration protocols for long term measurements as well as redefinition of the building categories used in the EN 15251 standard. The study of Dell’Isola et al. (2012) considered broader aspects of measurement uncertainty during assessment of thermal environment and came to very similar conclusions as the two previously mentioned studies.
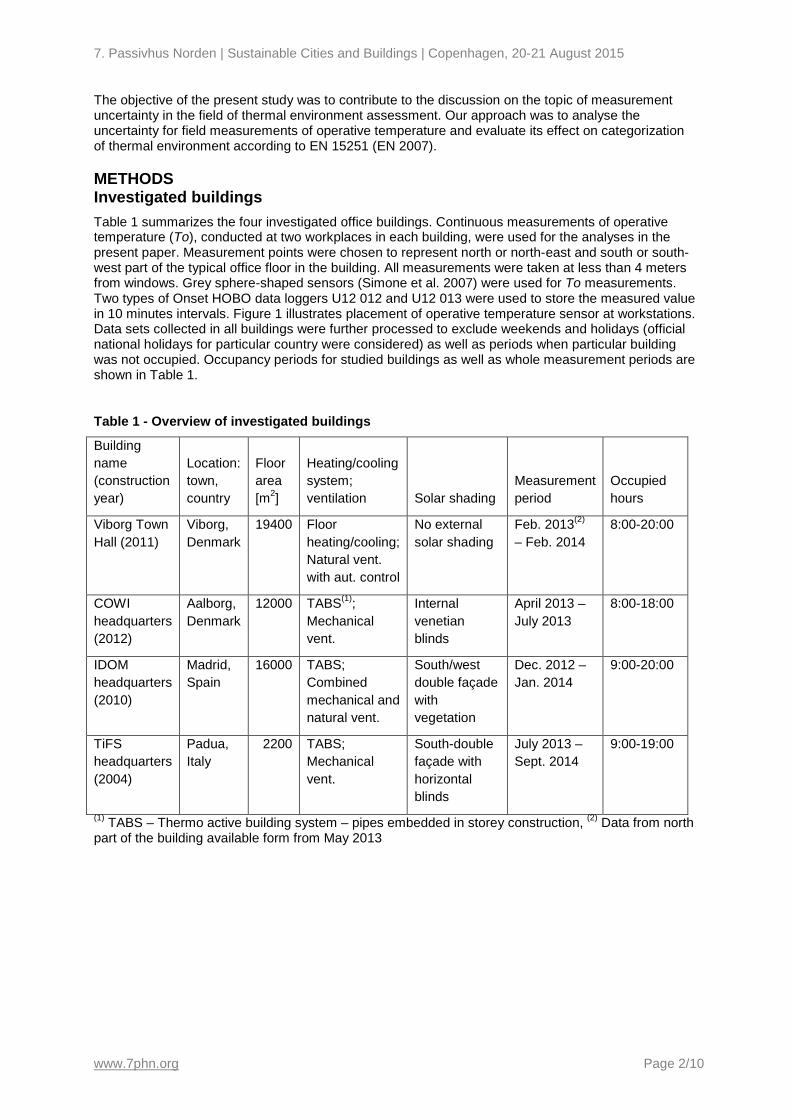
7. Passivhus Norden | Sustainable Cities and Buildings | Copenhagen, 20-21 August 2015
www.7phn.org Page 2/10
The objective of the present study was to contribute to the discussion on the topic of measurement uncertainty in the field of thermal environment assessment. Our approach was to analyse the uncertainty for field measurements of operative temperature and evaluate its effect on categorization of thermal environment according to EN 15251 (EN 2007).
METHODS Investigated buildings Table 1 summarizes the four investigated office buildings. Continuous measurements of operative temperature (To), conducted at two workplaces in each building, were used for the analyses in the present paper. Measurement points were chosen to represent north or north-east and south or south-west part of the typical office floor in the building. All measurements were taken at less than 4 meters from windows. Grey sphere-shaped sensors (Simone et al. 2007) were used for To measurements. Two types of Onset HOBO data loggers U12 012 and U12 013 were used to store the measured value in 10 minutes intervals. Figure 1 illustrates placement of operative temperature sensor at workstations. Data sets collected in all buildings were further processed to exclude weekends and holidays (official national holidays for particular country were considered) as well as periods when particular building was not occupied. Occupancy periods for studied buildings as well as whole measurement periods are shown in Table 1.
Table 1 - Overview of investigated buildings
Building name (construction year)
Location: town, country
Floor area [m2]
Heating/cooling system; ventilation Solar shading
Measurement period
Occupied hours
Viborg Town Hall (2011)
Viborg, Denmark
19400 Floor heating/cooling; Natural vent. with aut. control
No external solar shading
Feb. 2013(2) – Feb. 2014
8:00-20:00
COWI headquarters (2012)
Aalborg, Denmark
12000 TABS(1); Mechanical vent.
Internal venetian blinds
April 2013 – July 2013
8:00-18:00
IDOM headquarters (2010)
Madrid, Spain
16000 TABS; Combined mechanical and natural vent.
South/west double façade with vegetation
Dec. 2012 – Jan. 2014
9:00-20:00
TiFS headquarters (2004)
Padua, Italy
2200 TABS; Mechanical vent.
South-double façade with horizontal blinds
July 2013 – Sept. 2014
9:00-19:00
(1) TABS – Thermo active building system – pipes embedded in storey construction, (2) Data from north part of the building available form from May 2013

7. Passivhus Norden | Sustainable Cities and Buildings | Copenhagen, 20-21 August 2015
www.7phn.org Page 3/10
Figure 1 - (Left) Illustrative placement of an operative temperature sensor at a workplace, (Right) A set of grey sphere-shaped sensor and data logger
Data processing and calculation of measurement uncertainty Grey sphere-shaped sensors were equipped by Pt100 resistance thermometers. Voltage signal from the grey sphere-shaped sensors was logged via external input channel of the HOBO logger. Hourly mean values of the voltage signal Vh were calculated from the data. According to the logger’s manufacturer, accuracy of the external input channel - Δb(Vh) was ±2 mV ± 2.5% of absolute reading. Based on this accuracy specification, standard uncertainty of the external input channel reading - ua(Vh) was estimated according to equation (1) (ISO/IEC 2008).
𝑢𝑎(𝑉ℎ) = ∆𝑏(𝑉ℎ)
√3 (1)
Combined standard uncertainty of the hourly mean values - uc(Vh) was determined according to ISO/IEC (2008) as a combination of standard uncertainty related to repeated measurements, expressed as a standard error of the hourly mean - ur(Vh) and standard uncertainty related to the accuracy ua(Vh) (2).
𝑢𝑐(𝑉ℎ) = �𝑢𝑟(𝑉ℎ)2 ∙ 𝑢𝑎(𝑉ℎ)2 (2)
Prior to the measurements, the grey sphere-shaped sensors were calibrated in a climatic chamber (Simone et al. 2007). From the calibration, slope (a) and intercept (b) of the linear relationship between voltage signal and the operative temperature - To was established (Simone et al. 2007; Simone et al. 2013). This resulted into a correction function (3).
𝑇𝑜 = 𝑎 ∙ 𝑉 + 𝑏 (3)
Equation (3) was used to determine hourly mean operative temperature To,h. Combined standard uncertainty of the hourly mean operative temperature - uc(To,h) was determined as combined standard uncertainty of an indirectly measured quantity according to equation (4).
𝑢𝑐�𝑇𝑜,ℎ� = ��𝜕𝑇𝑜𝜕𝑉�2∙ 𝑢𝑐(𝑉ℎ)2 (4)
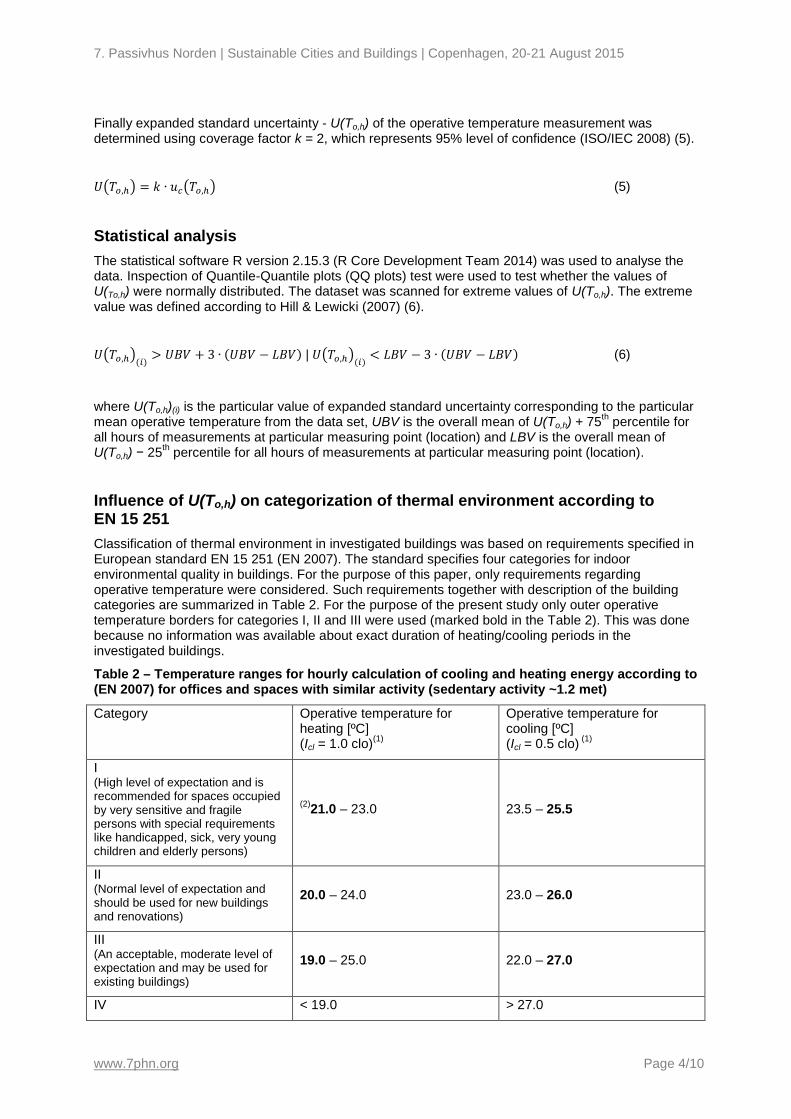
7. Passivhus Norden | Sustainable Cities and Buildings | Copenhagen, 20-21 August 2015
www.7phn.org Page 4/10
Finally expanded standard uncertainty - U(To,h) of the operative temperature measurement was determined using coverage factor k = 2, which represents 95% level of confidence (ISO/IEC 2008) (5).
𝑈�𝑇𝑜,ℎ� = 𝑘 ∙ 𝑢𝑐�𝑇𝑜,ℎ� (5)
Statistical analysis The statistical software R version 2.15.3 (R Core Development Team 2014) was used to analyse the data. Inspection of Quantile-Quantile plots (QQ plots) test were used to test whether the values of U(To,h) were normally distributed. The dataset was scanned for extreme values of U(To,h). The extreme value was defined according to Hill & Lewicki (2007) (6).
𝑈�𝑇𝑜,ℎ�(𝑖)> 𝑈𝑈𝑉 + 3 ∙ (𝑈𝑈𝑉 − 𝐿𝑈𝑉) | 𝑈�𝑇𝑜,ℎ�(𝑖)
< 𝐿𝑈𝑉 − 3 ∙ (𝑈𝑈𝑉 − 𝐿𝑈𝑉) (6)
where U(To,h)(i) is the particular value of expanded standard uncertainty corresponding to the particular mean operative temperature from the data set, UBV is the overall mean of U(To,h) + 75th percentile for all hours of measurements at particular measuring point (location) and LBV is the overall mean of U(To,h) − 25th percentile for all hours of measurements at particular measuring point (location).
Influence of U(To,h) on categorization of thermal environment according to EN 15 251 Classification of thermal environment in investigated buildings was based on requirements specified in European standard EN 15 251 (EN 2007). The standard specifies four categories for indoor environmental quality in buildings. For the purpose of this paper, only requirements regarding operative temperature were considered. Such requirements together with description of the building categories are summarized in Table 2. For the purpose of the present study only outer operative temperature borders for categories I, II and III were used (marked bold in the Table 2). This was done because no information was available about exact duration of heating/cooling periods in the investigated buildings.
Table 2 – Temperature ranges for hourly calculation of cooling and heating energy according to (EN 2007) for offices and spaces with similar activity (sedentary activity ~1.2 met)
Category Operative temperature for heating [ºC] (Icl = 1.0 clo)(1)
Operative temperature for cooling [ºC] (Icl = 0.5 clo) (1)
I (High level of expectation and is recommended for spaces occupied by very sensitive and fragile persons with special requirements like handicapped, sick, very young children and elderly persons)
(2)21.0 – 23.0 23.5 – 25.5
II (Normal level of expectation and should be used for new buildings and renovations)
20.0 – 24.0 23.0 – 26.0
III (An acceptable, moderate level of expectation and may be used for existing buildings)
19.0 – 25.0 22.0 – 27.0
IV < 19.0 > 27.0
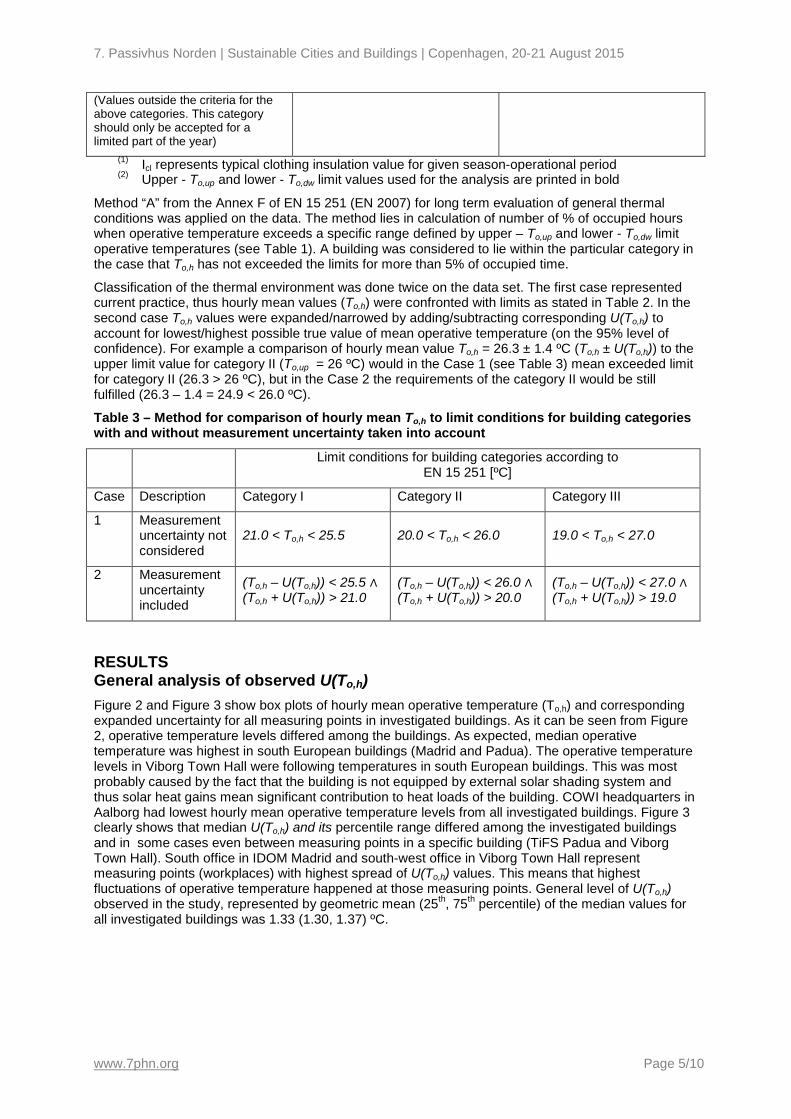
7. Passivhus Norden | Sustainable Cities and Buildings | Copenhagen, 20-21 August 2015
www.7phn.org Page 5/10
(Values outside the criteria for the above categories. This category should only be accepted for a limited part of the year)
(1) Icl represents typical clothing insulation value for given season-operational period (2) Upper - To,up and lower - To,dw limit values used for the analysis are printed in bold
Method “A” from the Annex F of EN 15 251 (EN 2007) for long term evaluation of general thermal conditions was applied on the data. The method lies in calculation of number of % of occupied hours when operative temperature exceeds a specific range defined by upper – To,up and lower - To,dw limit operative temperatures (see Table 1). A building was considered to lie within the particular category in the case that To,h has not exceeded the limits for more than 5% of occupied time.
Classification of the thermal environment was done twice on the data set. The first case represented current practice, thus hourly mean values (To,h) were confronted with limits as stated in Table 2. In the second case To,h values were expanded/narrowed by adding/subtracting corresponding U(To,h) to account for lowest/highest possible true value of mean operative temperature (on the 95% level of confidence). For example a comparison of hourly mean value To,h = 26.3 ± 1.4 ºC (To,h ± U(To,h)) to the upper limit value for category II (To,up = 26 ºC) would in the Case 1 (see Table 3) mean exceeded limit for category II (26.3 > 26 ºC), but in the Case 2 the requirements of the category II would be still fulfilled (26.3 – 1.4 = 24.9 < 26.0 ºC).
Table 3 – Method for comparison of hourly mean To,h to limit conditions for building categories with and without measurement uncertainty taken into account
Limit conditions for building categories according to EN 15 251 [ºC]
Case Description Category I Category II Category III
1 Measurement uncertainty not considered
21.0 < To,h < 25.5 20.0 < To,h < 26.0 19.0 < To,h < 27.0
2 Measurement uncertainty included
(To,h – U(To,h)) < 25.5 ∧ (To,h + U(To,h)) > 21.0
(To,h – U(To,h)) < 26.0 ∧ (To,h + U(To,h)) > 20.0
(To,h – U(To,h)) < 27.0 ∧ (To,h + U(To,h)) > 19.0
RESULTS General analysis of observed U(To,h) Figure 2 and Figure 3 show box plots of hourly mean operative temperature (To,h) and corresponding expanded uncertainty for all measuring points in investigated buildings. As it can be seen from Figure 2, operative temperature levels differed among the buildings. As expected, median operative temperature was highest in south European buildings (Madrid and Padua). The operative temperature levels in Viborg Town Hall were following temperatures in south European buildings. This was most probably caused by the fact that the building is not equipped by external solar shading system and thus solar heat gains mean significant contribution to heat loads of the building. COWI headquarters in Aalborg had lowest hourly mean operative temperature levels from all investigated buildings. Figure 3 clearly shows that median U(To,h) and its percentile range differed among the investigated buildings and in some cases even between measuring points in a specific building (TiFS Padua and Viborg Town Hall). South office in IDOM Madrid and south-west office in Viborg Town Hall represent measuring points (workplaces) with highest spread of U(To,h) values. This means that highest fluctuations of operative temperature happened at those measuring points. General level of U(To,h) observed in the study, represented by geometric mean (25th, 75th percentile) of the median values for all investigated buildings was 1.33 (1.30, 1.37) ºC.
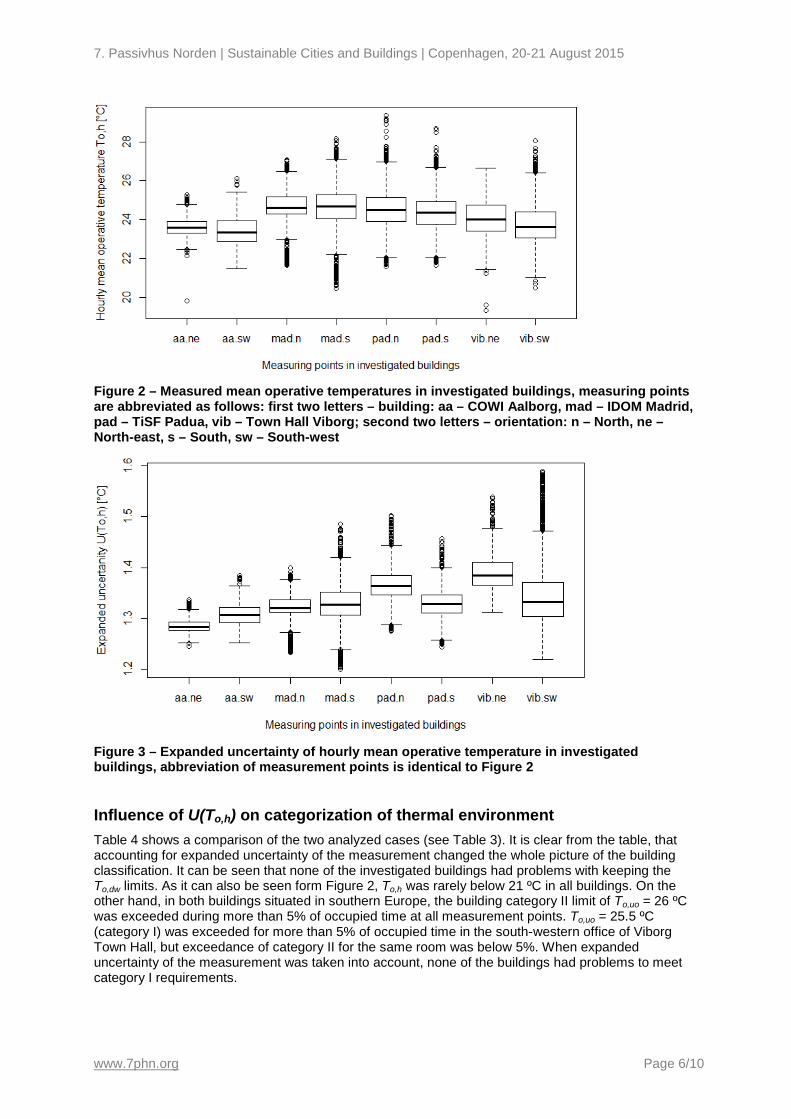
7. Passivhus Norden | Sustainable Cities and Buildings | Copenhagen, 20-21 August 2015
www.7phn.org Page 6/10
Figure 2 – Measured mean operative temperatures in investigated buildings, measuring points are abbreviated as follows: first two letters – building: aa – COWI Aalborg, mad – IDOM Madrid, pad – TiSF Padua, vib – Town Hall Viborg; second two letters – orientation: n – North, ne – North-east, s – South, sw – South-west
Figure 3 – Expanded uncertainty of hourly mean operative temperature in investigated buildings, abbreviation of measurement points is identical to Figure 2
Influence of U(To,h) on categorization of thermal environment Table 4 shows a comparison of the two analyzed cases (see Table 3). It is clear from the table, that accounting for expanded uncertainty of the measurement changed the whole picture of the building classification. It can be seen that none of the investigated buildings had problems with keeping the To,dw limits. As it can also be seen form Figure 2, To,h was rarely below 21 ºC in all buildings. On the other hand, in both buildings situated in southern Europe, the building category II limit of To,uo = 26 ºC was exceeded during more than 5% of occupied time at all measurement points. To,uo = 25.5 ºC (category I) was exceeded for more than 5% of occupied time in the south-western office of Viborg Town Hall, but exceedance of category II for the same room was below 5%. When expanded uncertainty of the measurement was taken into account, none of the buildings had problems to meet category I requirements.
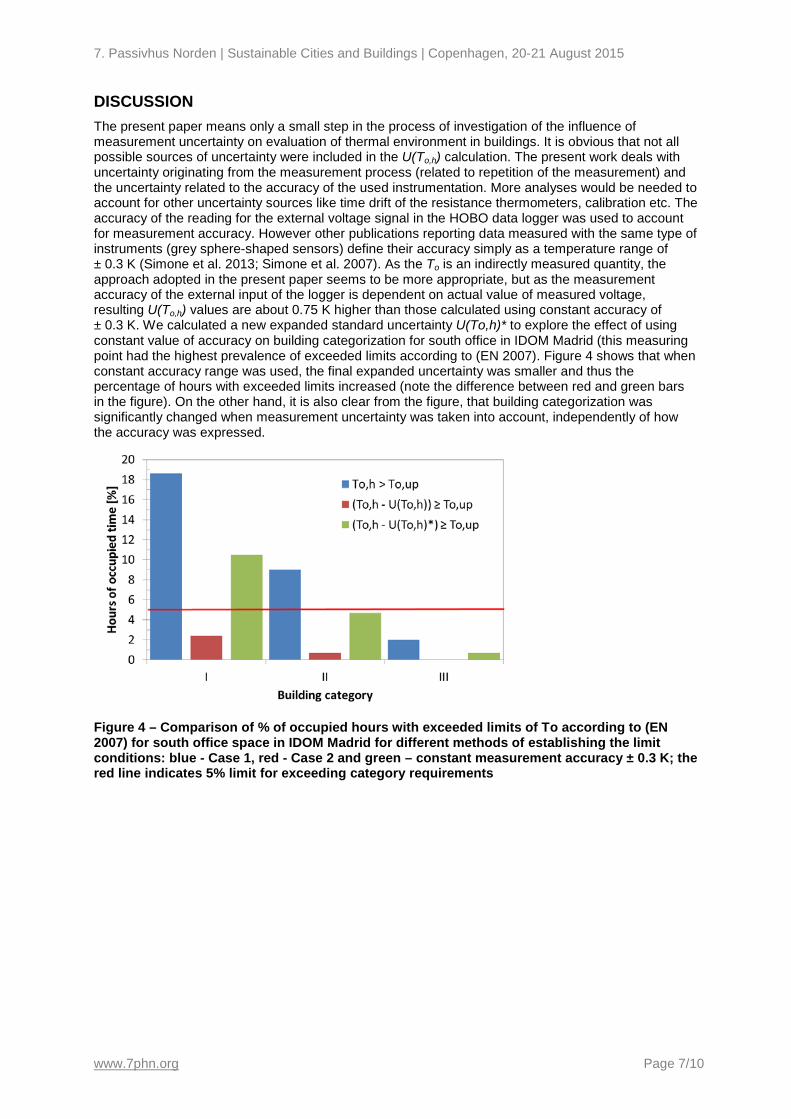
7. Passivhus Norden | Sustainable Cities and Buildings | Copenhagen, 20-21 August 2015
www.7phn.org Page 7/10
DISCUSSION The present paper means only a small step in the process of investigation of the influence of measurement uncertainty on evaluation of thermal environment in buildings. It is obvious that not all possible sources of uncertainty were included in the U(To,h) calculation. The present work deals with uncertainty originating from the measurement process (related to repetition of the measurement) and the uncertainty related to the accuracy of the used instrumentation. More analyses would be needed to account for other uncertainty sources like time drift of the resistance thermometers, calibration etc. The accuracy of the reading for the external voltage signal in the HOBO data logger was used to account for measurement accuracy. However other publications reporting data measured with the same type of instruments (grey sphere-shaped sensors) define their accuracy simply as a temperature range of ± 0.3 K (Simone et al. 2013; Simone et al. 2007). As the To is an indirectly measured quantity, the approach adopted in the present paper seems to be more appropriate, but as the measurement accuracy of the external input of the logger is dependent on actual value of measured voltage, resulting U(To,h) values are about 0.75 K higher than those calculated using constant accuracy of ± 0.3 K. We calculated a new expanded standard uncertainty U(To,h)* to explore the effect of using constant value of accuracy on building categorization for south office in IDOM Madrid (this measuring point had the highest prevalence of exceeded limits according to (EN 2007). Figure 4 shows that when constant accuracy range was used, the final expanded uncertainty was smaller and thus the percentage of hours with exceeded limits increased (note the difference between red and green bars in the figure). On the other hand, it is also clear from the figure, that building categorization was significantly changed when measurement uncertainty was taken into account, independently of how the accuracy was expressed.
Figure 4 – Comparison of % of occupied hours with exceeded limits of To according to (EN 2007) for south office space in IDOM Madrid for different methods of establishing the limit conditions: blue - Case 1, red - Case 2 and green – constant measurement accuracy ± 0.3 K; the red line indicates 5% limit for exceeding category requirements
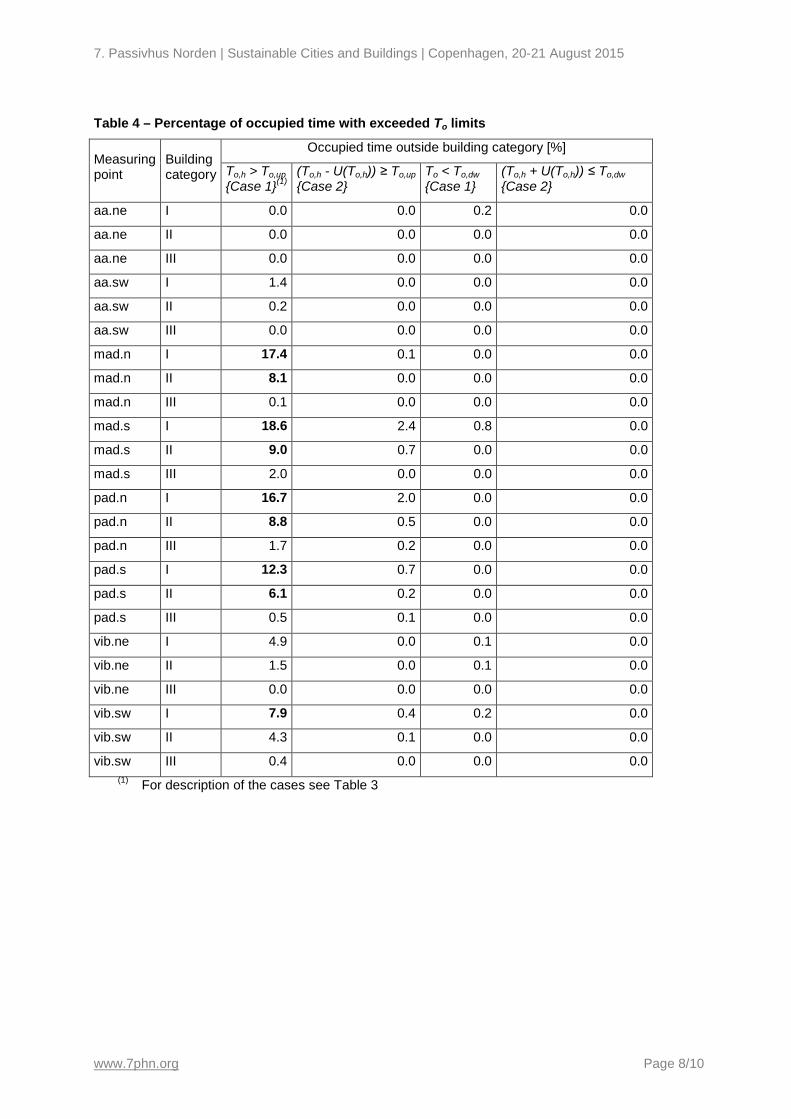
7. Passivhus Norden | Sustainable Cities and Buildings | Copenhagen, 20-21 August 2015
www.7phn.org Page 8/10
Table 4 – Percentage of occupied time with exceeded To limits
Measuring point
Building category
Occupied time outside building category [%]
To,h > To,up {Case 1}(1)
(To,h - U(To,h)) ≥ To,up {Case 2}
To < To,dw {Case 1}
(To,h + U(To,h)) ≤ To,dw {Case 2}
aa.ne I 0.0 0.0 0.2 0.0
aa.ne II 0.0 0.0 0.0 0.0
aa.ne III 0.0 0.0 0.0 0.0
aa.sw I 1.4 0.0 0.0 0.0
aa.sw II 0.2 0.0 0.0 0.0
aa.sw III 0.0 0.0 0.0 0.0
mad.n I 17.4 0.1 0.0 0.0
mad.n II 8.1 0.0 0.0 0.0
mad.n III 0.1 0.0 0.0 0.0
mad.s I 18.6 2.4 0.8 0.0
mad.s II 9.0 0.7 0.0 0.0
mad.s III 2.0 0.0 0.0 0.0
pad.n I 16.7 2.0 0.0 0.0
pad.n II 8.8 0.5 0.0 0.0
pad.n III 1.7 0.2 0.0 0.0
pad.s I 12.3 0.7 0.0 0.0
pad.s II 6.1 0.2 0.0 0.0
pad.s III 0.5 0.1 0.0 0.0
vib.ne I 4.9 0.0 0.1 0.0
vib.ne II 1.5 0.0 0.1 0.0
vib.ne III 0.0 0.0 0.0 0.0
vib.sw I 7.9 0.4 0.2 0.0
vib.sw II 4.3 0.1 0.0 0.0
vib.sw III 0.4 0.0 0.0 0.0 (1) For description of the cases see Table 3

7. Passivhus Norden | Sustainable Cities and Buildings | Copenhagen, 20-21 August 2015
www.7phn.org Page 9/10
The fact that measurement uncertainty/accuracy can have a significant in influence on building categorization in the case of use of field measurements was previously pointed out by d’Ambrosio Alfano et al. (2011) as well as Dell’Isola et al. (2012). d’Ambrosio Alfano et al. (2011) focused on accuracy of instruments for measuring indoor environmental parameters used in PMV/PPD model (ISO 2005; Fanger 1970). Authors pointed out a significant influence of accuracy for mean radiant temperature measurements as well as the need for an in-depth discussion focused on the measurement protocols and types of used instruments that would reduce reduction required accuracy levels reported in the ISO 7726 (ISO 2002). Despite the fact that the paper did not deal with expanded standard uncertainty of the particular measurements needed to determine PMV index, the authors indicated a need for broadening of the building categories specified in ISO 7730 and EN 15251 standards (ISO 2005; EN 2007). This was due to observed significant sensitivity of PMV to the measurement accuracy. Dell’Isola et al. (2012) focused directly on measurement uncertainty adopting the conformity range of measurements approach according to (UNI EN/ISO 2001). In contrast to the present study, their work was focused on comparison of different types of instruments and their ability to provide reliable input to PMV/PPPD model. Nevertheless, their results suggested that unambiguous attribution of the best building category was difficult and often impossible unless instruments with very good accuracy were used. Moreover, the use of instruments having parameters according to ISO 7726 (ISO 2002) resulted in comparable results, but often ambiguous attribution to the building category. Taking into account the results of previous research as well as the results of the present study it is clear that it would be beneficial to discuss the issue of measurement uncertainty during revision of EN 15251 standard (EN 2007), which is currently ongoing (Olesen 2015).
CONCLUSIONS • Analysis of filed measurement data for four European office buildings showed that expanded
standard uncertainty of grey sphere-shaped operative temperature sensors was in a range (1.2, 1.6) ºC with geometric mean (25th, 75th percentile) 1.33 (1.30, 1.37) ºC.
• When expanded standard uncertainty was taken into account in categorization of thermal environment according to standard EN 15251, the difference in prevalence of exceeded category limits were up to 17.3%, 8.3% and 2% of occupied hours for category I, II and III respectively.
• Use of constant measurement accuracy of ± 0.3 K for final reading of operative temperature instead of accuracy for row voltage signal from the resistance thermometer linearly dependent on absolute voltage reading had a significant effect prevalence of exceeded category limits. The difference observed for a measuring point with generally highest percentage of hours above category limits was 8% for category I and 4% for category II.
• The results of the present study indicate that measurement uncertainty needs to be considered during assessment of thermal environment in existing buildings.
ACKNOWLEDGEMENT The study was conducted as a part of research project “Thermo Active Building Systems (TABS) – Performance in practice and possibilities for optimization” supported by Bjarne Saxhofs Fond til Støtte for Dansk Forskning, Denmark in the period 1.9.2012 – 31.12.2014.
REFERENCES
d’Ambrosio Alfano, F.R. et al., 2013. On the measurement of the mean radiant temperature and its influence on the indoor thermal environment assessment. Building and Environment, 63, pp.79–88.
d’Ambrosio Alfano, F.R., Palella, B.I. & Riccio, G., 2011. The role of measurement accuracy on the thermal environment assessment by means of PMV index. Building and Environment, 46(7), pp.1361–1369.
Dell’Isola, M. et al., 2012. Influence of Measurement Uncertainties on the Thermal Environment Assessment. International Journal of Thermophysics, 33(8-9), pp.1616–1632. Available at: http://link.springer.com/10.1007/s10765-012-1228-7 [Accessed April 23, 2015].
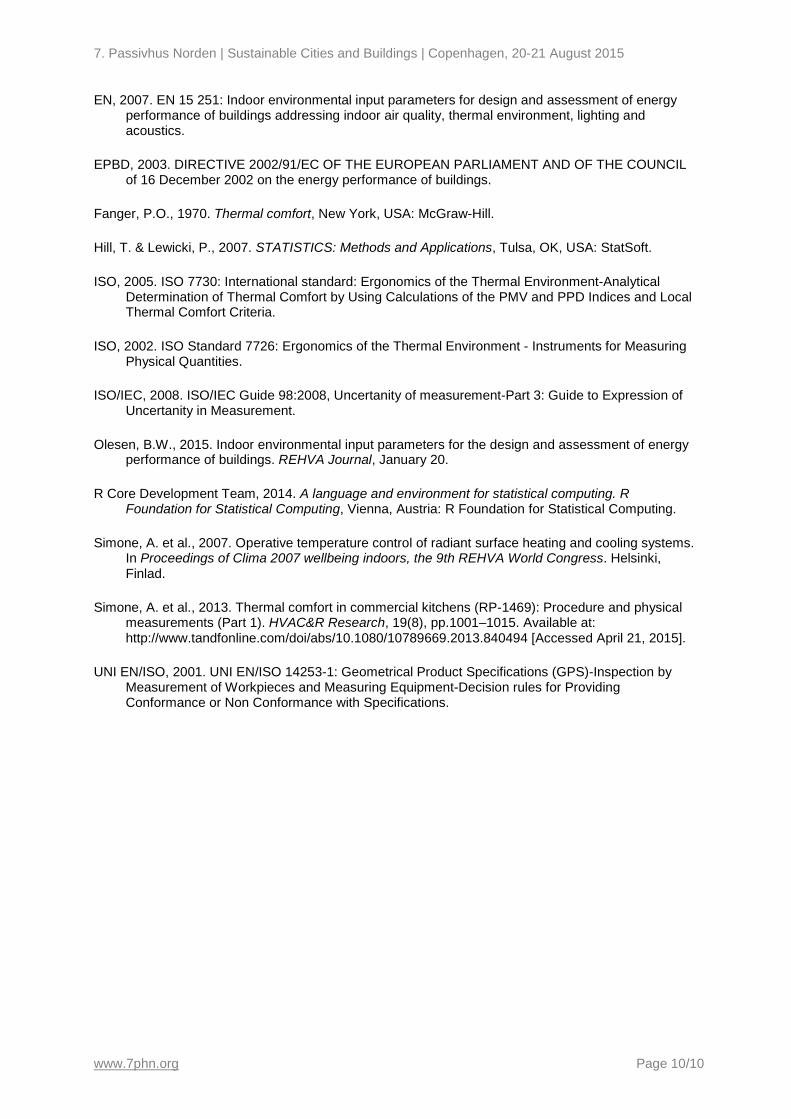
7. Passivhus Norden | Sustainable Cities and Buildings | Copenhagen, 20-21 August 2015
www.7phn.org Page 10/10
EN, 2007. EN 15 251: Indoor environmental input parameters for design and assessment of energy performance of buildings addressing indoor air quality, thermal environment, lighting and acoustics.
EPBD, 2003. DIRECTIVE 2002/91/EC OF THE EUROPEAN PARLIAMENT AND OF THE COUNCIL of 16 December 2002 on the energy performance of buildings.
Fanger, P.O., 1970. Thermal comfort, New York, USA: McGraw-Hill.
Hill, T. & Lewicki, P., 2007. STATISTICS: Methods and Applications, Tulsa, OK, USA: StatSoft.
ISO, 2005. ISO 7730: International standard: Ergonomics of the Thermal Environment-Analytical Determination of Thermal Comfort by Using Calculations of the PMV and PPD Indices and Local Thermal Comfort Criteria.
ISO, 2002. ISO Standard 7726: Ergonomics of the Thermal Environment - Instruments for Measuring Physical Quantities.
ISO/IEC, 2008. ISO/IEC Guide 98:2008, Uncertanity of measurement-Part 3: Guide to Expression of Uncertanity in Measurement.
Olesen, B.W., 2015. Indoor environmental input parameters for the design and assessment of energy performance of buildings. REHVA Journal, January 20.
R Core Development Team, 2014. A language and environment for statistical computing. R Foundation for Statistical Computing, Vienna, Austria: R Foundation for Statistical Computing.
Simone, A. et al., 2007. Operative temperature control of radiant surface heating and cooling systems. In Proceedings of Clima 2007 wellbeing indoors, the 9th REHVA World Congress. Helsinki, Finlad.
Simone, A. et al., 2013. Thermal comfort in commercial kitchens (RP-1469): Procedure and physical measurements (Part 1). HVAC&R Research, 19(8), pp.1001–1015. Available at: http://www.tandfonline.com/doi/abs/10.1080/10789669.2013.840494 [Accessed April 21, 2015].
UNI EN/ISO, 2001. UNI EN/ISO 14253-1: Geometrical Product Specifications (GPS)-Inspection by Measurement of Workpieces and Measuring Equipment-Decision rules for Providing Conformance or Non Conformance with Specifications.

DTU BygInstitut for Byggeri og AnlægDanmarks Tekniske Universitet
Brovej, Bygning 1182800 Kgs. LyngbyTlf. 45 25 17 00
www.byg.dtu.dk
ISSN 1601-8605