Thermal properties of gypsum plasterboard at high temperatures
9
FIRE AND MATERIALS Fire Mater. 2002; 26: 37–45 (DOI: 10.1002 /fam.786) Thermal Properties of Gypsum Plasterboard at High Temperatures Geoff Thomas* School of Architecture, Victoria University of Wellington, PO Box 600, Wellington, New Zealand, E-mail address: [email protected] Light timber frame wall and floor assemblies typically use gypsum-based boards as a lining to provide fire resistance. In order to model the thermal behaviour of such assemblies, the thermo-physical properties of gypsum plasterboard must be determined. The relevant literature and the chemistry of the two consecutive endothermic dehydration reactions that gypsum undergoes when heated are reviewed. The values determined for the thermo-physical properties are modified to create smooth enthalpy and thermal conductivity curves suitable for input into a finite element heat transfer model. These values are calibrated within a reasonable range and then validated using furnace and fire test data. The type of plasterboard used in these tests is an engineered product similar to the North American type C board. The temperature at which the second dehydration reaction occurs is altered to be consistent with later research with little apparent affect on the comparison with test results. Values for specific heat, mass loss rates and thermal conductivity for gypsum plasterboard that are suitable for use in finite element heat transfer modelling of light timber frame wall and floor assemblies are recommended. Copyright # 2002 John Wiley & Sons, Ltd. INTRODUCTION Light timber frame (LTF) wall and floor assemblies are used in many parts of the world. In New Zealand the use of LTF fire rated assemblies has increased since the advent of a performance based building code in 1993. The most common lining material used in LTF assemblies is gypsum plasterboard. In order to develop a heat transfer model for LTF assemblies, values for the thermo-physical properties of gypsum and hence gypsum plasterboard must be determined. The thermal properties of gypsum plasterboard at high temperatures are not well known, as is the case with many materials. The properties are difficult to measure, subject to transient effects and the method of measure- ment often appears to have a significant effect on the results found. Values can also be affected by the rate of temperature change and it is not realistic to determine appropriate values for every permu- tation of temperature variation. 1 Furthermore specific heat is affected substantially by the driving off of both free and chemically bound water. Evaporation and subsequent condensation of water in cooler parts of the sample substantially affect the apparent thermal con- ductivity. The composition of gypsum plasterboard and hence the properties vary slightly between manufacturers and countries of origin. The results of this study are expected to be of sufficient accuracy for other brands of gypsum plasterboard provided any difference in density is taken into account. The effect of discontinuities in the system such as joints between sheets of gypsum plaster has been taken into account by others, 2 but has been ignored in this study. THE FINITE ELEMENT HEAT TRANSFER MODEL The author developed a finite element heat transfer model, using the computer program tasef 3 and the finite element program abaqus, 4 for LTF walls and floors for his doctoral dissertation. 5,6 After reasonable ranges for the values for the thermal and physical properties of a wall’s component materials were found, the heat transfer model was calibrated using ISO-834 7 tests on light timber framed wall systems and small scale test data from K . onig and Noren. 8 Subse- quently the heat transfer model was validated using similar tests, floor tests, two furnace tests with non- standard time-temperature curves and a realistic fire test. THERMO- CHEMISTRY OF GYPSUM Gypsum plasterboard mainly consists of gypsum, a naturally occurring material. It is a crystalline form of calcium sulphate combined with water known as calcium sulphate dihydrate, CaSO 4 .2H 2 O. There are two crystal structures for the hemihydrate and anhy- drite, the and forms. When dehydrated to the hemihydrate, CaSO 4 .1/2H 2 O and ground, gypsum is a dry powder commonly known as ‘Plaster of Paris’. This can be mixed with water and cast in a mould to form solid shapes of gypsum plaster. Gypsum plasterboard consists mostly of gypsum with vermiculite, fibreglass and other materials in various quantities depending on the manufacturer. Copyright # 2002 John Wiley & Sons, Ltd. Received 15 May 2001 Accepted 19 March 2002 *Correspondence to: G. Thomas, School of Architecture, Victoria University of Wellington, PO Box 600, Wellington, New Zealand
-
Upload
geoff-thomas -
Category
Documents
-
view
223 -
download
4
Transcript of Thermal properties of gypsum plasterboard at high temperatures

FIRE AND MATERIALS
Fire Mater. 2002; 26: 37–45 (DOI: 10.1002/fam.786)
Thermal Properties of Gypsum Plasterboard at HighTemperatures
Geoff Thomas*
School of Architecture, Victoria University of Wellington, PO Box 600, Wellington, New Zealand,E-mail address: [email protected]
Light timber frame wall and floor assemblies typically use gypsum-based boards as a lining to provide fire resistance.
In order to model the thermal behaviour of such assemblies, the thermo-physical properties of gypsum plasterboard
must be determined. The relevant literature and the chemistry of the two consecutive endothermic dehydration
reactions that gypsum undergoes when heated are reviewed. The values determined for the thermo-physical properties
are modified to create smooth enthalpy and thermal conductivity curves suitable for input into a finite element heat
transfer model. These values are calibrated within a reasonable range and then validated using furnace and fire test
data. The type of plasterboard used in these tests is an engineered product similar to the North American type C
board. The temperature at which the second dehydration reaction occurs is altered to be consistent with later research
with little apparent affect on the comparison with test results. Values for specific heat, mass loss rates and thermal
conductivity for gypsum plasterboard that are suitable for use in finite element heat transfer modelling of light timber
frame wall and floor assemblies are recommended. Copyright # 2002 John Wiley & Sons, Ltd.
INTRODUCTION
Light timber frame (LTF) wall and floor assemblies areused in many parts of the world. In New Zealand the useof LTF fire rated assemblies has increased since theadvent of a performance based building code in 1993.The most common lining material used in LTFassemblies is gypsum plasterboard.
In order to develop a heat transfer model forLTF assemblies, values for the thermo-physicalproperties of gypsum and hence gypsum plasterboardmust be determined. The thermal properties ofgypsum plasterboard at high temperatures are notwell known, as is the case with many materials.The properties are difficult to measure, subjectto transient effects and the method of measure-ment often appears to have a significant effect onthe results found. Values can also be affected by therate of temperature change and it is not realisticto determine appropriate values for every permu-tation of temperature variation.1 Furthermore specificheat is affected substantially by the driving off of bothfree and chemically bound water. Evaporation andsubsequent condensation of water in cooler parts of thesample substantially affect the apparent thermal con-ductivity.
The composition of gypsum plasterboard and hencethe properties vary slightly between manufacturers andcountries of origin. The results of this study are expectedto be of sufficient accuracy for other brands of gypsumplasterboard provided any difference in density is takeninto account. The effect of discontinuities in the systemsuch as joints between sheets of gypsum plaster has beentaken into account by others,2 but has been ignored inthis study.
THE FINITE ELEMENT HEAT TRANSFERMODEL
The author developed a finite element heat transfermodel, using the computer program tasef
3 and thefinite element program abaqus,4 for LTF walls andfloors for his doctoral dissertation.5,6
After reasonable ranges for the values for the thermaland physical properties of a wall’s component materialswere found, the heat transfer model was calibrated usingISO-8347 tests on light timber framed wall systems andsmall scale test data from K .oonig and Noren.8 Subse-quently the heat transfer model was validated usingsimilar tests, floor tests, two furnace tests with non-standard time-temperature curves and a realistic firetest.
THERMO- CHEMISTRY OF GYPSUM
Gypsum plasterboard mainly consists of gypsum, anaturally occurring material. It is a crystalline form ofcalcium sulphate combined with water known ascalcium sulphate dihydrate, CaSO4.2H2O. There aretwo crystal structures for the hemihydrate and anhy-drite, the � and � forms. When dehydrated to thehemihydrate, CaSO4.1/2H2O and ground, gypsum is adry powder commonly known as ‘Plaster of Paris’. Thiscan be mixed with water and cast in a mould to formsolid shapes of gypsum plaster. Gypsum plasterboardconsists mostly of gypsum with vermiculite, fibreglassand other materials in various quantities depending onthe manufacturer.
Copyright # 2002 John Wiley & Sons, Ltd. Received 15 May 2001Accepted 19 March 2002
*Correspondence to: G. Thomas, School of Architecture, Victoria University of Wellington, PO Box 600, Wellington, New Zealand

Literature review on specific heat
Dry gypsum, with no free moisture, contains 21% waterby weight that is chemically bound in a crystal matrix.This water is released and evaporates during heating,but may re-condense elsewhere in the specimen. Somefree moisture is also present in gypsum boards. Theequilibrium moisture content depends on ambienttemperature and relative humidity. During heating thisfree moisture is also driven off as steam, and may alsore-condense elsewhere in the specimen.
Literature on specific heat from various authors isdescribed below and their results are summarized inFig. 1.
Harmathy Drysdale9 gives a value of specific heat of0.84 kJ/kgK for ambient temperatures. This compareswell with Harmathy,1 who gives a value of 0.88 kJ/kg.K,with a peak of 7.32 kJ/kg.K at about 1008C, a trough of0.25 kJ/kg.K at about 3508C and a rapid increase over5508C. Harmathy reports this information in a graph,rather than tabular form, which makes it difficult todetermine precise values. The width of the 1008C peakappears to be 608 to 658C. Hence the energy required todrive the moisture off is (7.32–0.88)� 62.5/2=201 kJ/kgof gypsum board. This value is low compared with thatrecommended by other authors.
Andersson and Jansson Andersson and Jansson10 do notreport a base specific heat value as such, but report that75% of the bound water starts to evaporate at 1008Crequiring 515 kJ/kg for this process to occur (Reaction1, Fig. 1 and Eq. (1)). The remaining 25% of water ofcrystallization is driven off at around 2108C. Thisprocess is also endothermic and requires 185 kJ/kg ofgypsum for completion (Reaction 2, Fig. 1 and Eq. (2)).
A base value of 0.7 kJ/kg.K was deduced for specificheat from an enthalpy plot.
Mehaffey et al Mehaffey et al.11 used a differentialscanning calorimeter and obtained a base value of0.95 kJ/kg.K for specific heat. Two scanning rates wereused, 28C/min and 208C/min. For the slower scanningrate a peak of 29 kJ/kg.K at 958C was found. A peak of14 kJ/kg.K at 1408C resulted when the faster scanningrate was used. The area under both peaks is about490 kJ/kg. Mehaffey et al. used a symmetrical peak of49.95 kJ/kg.K between 1008C and 1208C in their heattransfer model. Mehaffey et al. only measured specificheat up to 2008C and did not record the second peak at2108C (Reaction 2), where the remainder of the water ofcrystallization is driven off. More recent tests on gypsumplasterboard at the National Research Council ofCanada gave similar values for the area under the firstpeak.18
Clancy Clancy12 used Mehaffey’s values along with thepeak from the second dehydration reaction at about6008C as given by Sultan.13 This corresponds with asignificant drop in the density of gypsum (Fig. 2).
Dehydration reactions and specific heat
The base value for specific heat of gypsum was chosen as0.95 kJ/kg.K. This value is from Mehaffey et al.11 It isused because they describe the method used to reach thisvalue and the method appears to be sound. It compareswell with the value of 1.08 kJ/kg.K for pure gypsum asselenite.10
Water of crystallization During heating, gypsum plasterundergoes two endothermic decomposition reactions inwhich the water of crystallization is removed. These aredenoted Reaction 1 and Reaction 2 in Fig. 1.
The first dehydration reaction In the first reaction,shown as the first peak in Fig. 1, gypsum is convertedto calcium sulphate hemihydrate as follows:
CaSO4:2H2O ! CaSO4:12H2Oþ 32H2O ð1Þ
This reaction starts at about 1008C and is completedby about 1208C, but this range is affected by the rate ofheating as shown by Mehaffey et al.11 The heat of thisreaction is 112 kJ/kg of gypsum, assuming an � form of
0.70
Reaction 1
Reaction 2
Reaction 2(Sultan)
0
5
10
15
20
25
30
35
40
45
50
55
0 100 200 300 400 500 600 700 800
Temperature (oC)
Harmathy
Andersson
Mehaffey et al
Sultan
Sp
ecif
ic h
eat
(kJ/
kg.K
)
Figure 1. Comparison of specific heat values from different research-ers.
0.75
0.80
0.85
0.90
0.95
1.00
1.05
0 200 400 600 800 1000 1200
Temperature (OC)
Mas
s R
atio
(mas
s/o
rig
inal
mas
s)
Figure 2. Mass loss in gypsumplasterboard undergoingheating.1
G. THOMAS.38
Copyright # 2002 John Wiley & Sons, Ltd. Fire Mater. 2002; 26: 37–45

hemihydrate is formed and 100 kJ/kg for the � form.The heats of reaction are calculated using enthalpiesfrom a standard chemical engineering reference.14 Bothforms are crystals, the � form has smaller crystals and isa higher energy form. As can be seen in the equation,75% of the water of crystallization is vaporized. As thetotal water of crystallization is 20.9% by mass, then0.75� 20.9=15.675% of the total mass is water. Thiswater is then evaporated with an energy requirement of0.15675� 2260=354 kJ/kg of gypsum, with the latentheat of evaporation of water being 2.26MJ/kg.
The second dehydration reaction In the second reaction,labelled Reaction 2 in Fig. 1, calcium sulphate hemi-hydrate is converted to calcium sulphate anhydrite asfollows:
CaSO4:12H2O ! CaSO4 þ 12H2O ð2Þ
This reaction occurs at about 2108C according toAndersson and Jansson10 and at 3008C according toGroves15 and at about 6008C according to Sultan.13
More recent tests using the differential thermal analysismethod by Bakhtiary et al.16 shows this peak occurringat 2258C. This value may depend on the rate of heating.The heat of this reaction is 63.5 kJ/kg of gypsum,assuming an � form of anhydrite is formed from�-hemihydrate and 50 kJ/kg for the �-hemihydratedecomposing to �-anhydrite. The form of the anhydriteis the same as that of the hemihydrate it was derivedfrom.15 As can be seen in Eq. (2), 25% of the water ofcrystallization is vaporized. As the total water ofcrystallization is 20.9% by mass, then0.25� 20.9=5.225% of the total mass is water. Thiswater is then evaporated with an energy requirement of0.05225� 2260=136 kJ/kg of gypsum.
Mehaffey et al.’s method for accounting for thesereactions Mehaffey et al. used the overall heat ofreaction for the complete dehydration reaction shownin Eq. (3):
CaSO4:2H2O ! CaSO4 þ 2H2O ð3Þ
It was between 150 kJ/kg for �-anhydrite and 176 kJ/kg for �-anhydrite. They ignored the heat required tovaporize the 25% of water of crystallization produced
when the second part of the reaction (Eq. (2)) occurs.This method gives a total value of between 505 and531 kJ/kg for gypsum. They state that the energy
required for the first reaction (Eq. (1)) is over 455 kJ/kg, being 355 kJ/kg for the evaporation of moisture
produced and between 100 and 112 kJ/kg for the heat ofthe reaction. It appears that these values bound theaverage value for the peak, found using a scanningcalorimeter.
Effect of free moisture
The basic value of 0.950 kJ/kgK does not include theeffect of free moisture as the Mehaffey et al.11 sampleswere conditioned at 408C for 24 h to remove most of thefree moisture. If the free moisture that is removed isabout 3% to 4% of the total mass, the increase inspecific heat due to free moisture is approximately0.035/1.035� (4.184–0.95)=0.11 kJ/kg.K of the mea-sured mass of gypsum, including the mass of freemoisture, where 4.184 and 0.95 kJ/kg.K are the specificheats of water and gypsum respectively.
In tests carried out at the University of Canterbury,17
samples of gypsum plasterboard were conditioned at 508Cfor 9 days and then heated to 1808C over a period of 8weeks. The initial moisture content after conditioning wasbetween 22.4% and 23.3% of dry mass or 18.0% and18.7% of total mass. After 4 weeks at 1058C and 1 week at1208C, the samples reached a minimum weight, whichremained constant after 3 weeks of 208C incrementaltemperature rises to 1808C. As no decrease in moisturecontent was observed between 1208C and 1808C, it can beassumed that the second reaction (Eq. (2)) did not occur.In the first reaction (Eq. (1)) 15.675% of total mass isdriven off as water. Therefore between 18.02�15.7=2.3%and 18.7�15.7=3.0% of the total mass is residual freewater, that is not easily driven off. Gypsum plasterboardhas an equilibrium moisture content of about 4–8%depending on ambient conditions.17
Heats of reaction and effect on specific heat
The energy required to undertake the two reactions istaken from Andersson and Jansson.10 The peaks are 515and 185 kJ/kg of gypsum. The first (Eq. (1)) is assumedto occur between 1008 and 1208C and the second(Eq. (2)) between 2008 and 2208C.
The first dehydration reaction Assuming that the a formof the hemihydrate is produced, then the peak at 1108C(Reaction 1, Fig. 1) has a value as follows:
Assuming that the b form of the hemihydrate isproduced, then the peak at 1108C (Reaction 2, Fig. 1)has a value as follows:
The value used for the first reaction, 515 kJ/kg iswithin the range given above.
Heat of reaction 100 kJ/kgEvaporation of water of crystallization 0.75� 0.21� 2260= 354 kJ/kgEvaporation of residual free water (0.024+030)/2� 2260= 61 kJ/kg
TOTAL 515 kJ/kg
Heat of reaction 112 kJ/kgEvaporation of water of crystallization 0.75� 0.21� 2260= 354 kJ/kgEvaporation of residual free water (0.024+0.030)/2� 2260= 61 kJ/kg
TOTAL 527 kJ/kg
THERMAL PROPERTIES OF PLASTER BOARD 39
Copyright # 2002 John Wiley & Sons, Ltd. Fire Mater. 2002; 26: 37–45

The second dehydration reaction The peak at 2108C hasa value between the following:
Assuming that the a form of both hemihydrate andanhydrite is produced:
Assuming that the b form of both the hemihydrateand anhydrite is produced:
The value used for the second reaction 182 kJ/kg, isslightly on the high side, but the overall value of 700 kJ/kg is within the range of 515+168=683 and527+182=709 kJ/kg. A value on the low side for thefirst reaction, and a high value for the second may beappropriate as all the moisture may not be evaporatedby 1208C.
ENTHALPY OF GYPSUM AND GYPSUMPLASTERBOARD
The use of a specific volume enthalpy curve, rather thanseparate values for density and specific heat is desirablein a finite element heat transfer model and is used intasef
3 with units WHr/m3. Enthalpy is used to avoidnumerical instabilities and to avoid missing a peak in thespecific heat when the temperature values for an elementin consecutive time steps are below and above the peakrespectively. Enthalpy is the integral of the product ofthe specific heat, volume and density over a temperaturerange. Chemical reactions also contribute to theenthalpy value.
The initial density is determined by weighing a samplefrom a section of a gypsum plasterboard sheet that waspart of a furnace test sample. The reduction in densitywith temperature due to water being driven off is fromHarmathy1 and is shown in Fig. 2. As gypsum plaster-board is about 24% water by weight, much of this watermust remain as steam in the plasterboard, on account ofthe mass loss being less than 24%. Benichou andSultan18 found a mass loss rate that is significantlyhigher than that used in this research, but the overallaffect is not particularly significant as the mass loss issmall and the total mass remaining is used in thecalculation of enthalpy.
The enthalpy curve is constructed from theinitial density, mass ratio and specific heat. It is shownin Fig. 3 and compared with that used by otherresearchers.
Harmathy’s1 values are significantly lower than theothers. Mehaffey et al.’s values are similar to Anderssonand Jansson’s10 values, but they exclude the secondsteep rise in enthalpy due to Reaction 2 as describedearlier and their base value is slightly higher. Theenthalpy values used in this study are basically the same
as Mehaffey et al.’s, but the second reaction is included.The enthalpy as used in the heat transfer model is asmoothed version of the calculated curve. The first peakin the enthalpy was modified by the author to be
between 1008C and 1408C with a peak at 1108C, but thearea is the same on each side of 1108C. The second peak
at 2108C was modified to be between 1408C and 2208C,but the area is the same on each side of 2008C. Thesemodifications create a smoother transition between theplateau at 1008C and the subsequent temperature riseand hence minimize numerical instability and model runtime.
THERMAL CONDUCTIVITY OF GYPSUMPLASTERBOARD
Literature
Thermal conductivity values for gypsum plasterboardare shown in Fig. 4. The values given by symbols aremeasured values from Harmathy1, Andersson andJansson10 and Mehaffey et al.11
Harmathy’s values were found using a variable statescanning technique with relatively small temperaturegradients when measured. The accuracy of the resultsfrom this method were estimated to be within 7%.1
Andersson and Jansson’s values were found using thetransient hot strip (THS) method of measuring thermalconductivity. The THS method measures the resistanceof a metal strip embedded in the material and from thisconductivity is derived.
Mehaffey et al. used a thermal conductivity meter.This meter uses steady state analysis to determineconductivity. They tested 12.7mm type C and 15.9mmtype X board, both of which are fibre reinforced.Mehaffey et al. used modified values for conductivity
Heat of reaction 50 kJ/kgEvaporation of water of crystallization 0.25� 0.21� 2260= 118 kJ/kg
TOTAL 168 kJ/kg
Heat of reaction 64 kJ/kgEvaporation of water of crystallization 0.25� 0.21� 2260= 118 kJ/kg
TOTAL 182 kJ/kg
0
200
400
600
800
1000
0 100 200 300 400 500 600 700
Temperature (OC)
En
thal
py
(MJ/
m3)
Harmathy
Andersson
Mehaffey et al
Calculated
As Used
Figure 3. Enthalpy curves for gypsumplasterboard.
G. THOMAS.40
Copyright # 2002 John Wiley & Sons, Ltd. Fire Mater. 2002; 26: 37–45

over 5008C, increasing the value linearly to 0.6W/mK at10008C. This is to allow for the increased conductivitydue to the opening of cracks in the gypsum at hightemperatures and due to ablation. They state that theirtesting method prevents cracks from opening up in theboard.
Ablation
Ablation is the process by which consecutive thin layersof a material are shed as a material undergoes heating.This occurs because the material undergoes chemicaland physical changes during heating which reduce thebonding of the material to itself. Hence the alteredmaterial will fall off because it is not firmly attached tothe unaltered material underneath. As gypsum is heatedit is transformed into calcium sulphate anhydrite, whichhas the appearance of a dry cohesionless powder andwill then fall off the board. This process is slowed if theboard is reinforced with glass fibres. Anecdotal evidencefrom observation of furnace tests suggests that ablationoccurs at about 7008C for normal gypsum board and10008C for fibre reinforced board. The effect of ablationis more apparent when trying to correlate results fromtests of boards differing greatly in thickness, sinceablation has a more serious effect on a thinner boarddue to the fact that a higher proportion of the board islost.
Thermal conductivity values
The values used in the heat transfer model are derivedfrom Mehaffey et al. This is for several reasons:
(i) The method of measurement is more direct; that isthe derivation is less complex, than for Andersson andJansson’s THS method.(ii) It is close in value to Harmathy’s results, whereasAndersson and Jansson’s are isolated.
The conductivity used is as per the values measuredby Mehaffey et al. for Type X board, extrapolated to10008C. The conductivity then jumps to 0.775W/m.K at10008C over a range of and reaches 10W/m.K at40008C. These large values allow for ablation, and resultin reasonable correlations with test data. The very hightemperature extreme is necessary to prevent the equa-tion solver in tasef over-running the upper bound oftemperature during equation solving. Heat transfer bythe evaporation of moisture and subsequentcondensation further away from the heat source hasbeen ignored. Other researchers have also used thisassumption.2,12,19
FIRE RESISTANCE TEST DATA
The Building Research Association of New Zealand(BRANZ) supplied data from several fire resistance testsconducted on load bearing LTF walls and floors. Someof these data were released with permission fromWinstone Wallboards Ltd. Individual tests summarizedin Table 1 were used to calibrate or subsequentlyvalidate the heat transfer model.
The tests are all on standard LTF wall assembliesexcept that:
Test 6 included three identical specimens withdifferent loads on the studs. The temperature data fromthe three specimens were averaged.
Test 10 is a solid timber joist floor whereas the otherthree floor tests (11, 12, 13) are for floors with‘twinaplate’ composite floor joists. These floor systemsconsist of ‘I’ shaped sections composed of a thin steel
Figure 4. Conductivity values for gypsumplasterboard.
Table 1. Details of furnace tests used
Test BRANZReference Type Lining thickness (mm) Stud depth (mm) Stud width (mm) Thermo- couples Usage
1 FR1582A Wall 9.5 69 45 2 Calibration2 FR1582B Wall 9.5 90 45 2 Calibration3 FR1611 Wall 12.5 69 45 4 Calibration4 FR1777 Wall 16 90 35 4 Calibration5 FP1583B Wall 9.5 90 45 3 Calibration6 FR1515 Wall 14.5 90 45 4 Validation7 FP1583A Wall 9.5 69 45 3 Validation8 FP1970 Wall 9.5 90 45 3 Validation9 FP1972 Wall 9.5 90 45 3 Validation10 FR1202 Floor 12.5 245 45 1 Validation11 FR1572 Floor 12.5 240 67 3 Validation12 FR1369 Floor 14.5 240 67 3 Validation13 FR1370 Floor 16 240 67 3 Validation14 House Test Wall 9.5 90 45 4 Validation
THERMAL PROPERTIES OF PLASTER BOARD 41
Copyright # 2002 John Wiley & Sons, Ltd. Fire Mater. 2002; 26: 37–45

web with vertical corrugations sandwiched between twotimber flanges.
Tests 1 to 4 were on assemblies with differing studsizes and/or lining thickness, used for calibration of themodel. Test 5 was in the pilot furnace and was used tocalibrate the model for the slightly different thermalcharacteristics of the pilot furnace. Tests 6 and 7 wereused for validation of the results with tests using thestandard ISO-8347 time-temperature curve in the fullsize and pilot furnace respectively. Tests 8 and 9 were fora non-standard fire exposure in a pilot furnace. All floortests were carried out using the standard ISO-8347 time-temperature curve. All studs and joists are of Pinusradiata and the gypsum plasterboard is a Winstones20
fire rated board with glass fibre reinforcing. Theseboards are proprietary and tend to have a betterperformance than the generic ‘type X’ or ‘type C’ boardused in North America.
All the tests had more intensive instrumentation thanis necessary or usual in a standard fire test. Test numbersstarting with ‘FR’ are full-scale tests and tests startingwith the prefix ‘FP’ were carried out in a pilot furnace.The full size furnace is 3.0m by 4.0m and the pilotfurnace is 1.03m by 2.22m. The data include informa-tion from thermocouples within the cavity and throughthe stud. The thermocouples within the cavity arelocated at the points labelled 2, 3, 4 and 5 in Fig. 5 formost tests. These thermocouples are 15mm copper discsattached on the furnace side to the gypsum plasterboardand shielded on the reverse side with a small piece ofceramic material. There are between two and four sets ofthese in each wall tested. Dummy studs were installed inthe wall and instrumented with sheathed wire thermo-couples throughout their cross-section to measuretemperatures within the stud. Indicative test compar-isons are described in more detail. Further informationon the other tests is found in Thomas.5,6
Test 14 in Table 1 was from a realistic fire test on aLTF wall in a derelict home. The comparison betweenthe test and heat transfer model results is also given laterin this paper.
Comparison of model with wall test results
The comparison between test results and the heattransfer model predictions is given in detail for threewall and one floor assemblies. The walls were modelledin tasef
3 and the ‘twinaplate’ floors in abaqus,4 and the
solid timber joist floors in both programs. tasef doesnot allow for re-entrant angles in the voids in‘twinaplate’ floors whereas abaqus does.
Test 1 The test 1 wall consists of 69� 45mm studs at600mm centres lined with 9.5mm Fyreline GibraltarBoard. This wall assembly has a FRR of 30min.20 Thecomparison between test and heat transfer model resultsfor positions 2, 3 and 4 in Fig. 5, in this wall is shown inFig. 6.
The comparison between the test and model isreasonable except that the plateau at 1008C is shorterin the heat transfer model results and there is somediscrepancy towards the end of the test at position 4.Overall, the heat transfer model predicted the tempera-ture profiles quite well for this test.
The heat transfer model was run using a second peakin the specific heat (Cp) at 2108C and with a second peakat about 6508C according to Sultan.13 Temperaturepredictions using Sultan’s approach were slightly higherthrough the wall, with a slightly better correlation in thecavity, but the insulation failure criteria of a tempera-ture rise on the unexposed side of at 1408C issignificantly under predicted using the peak at thehigher temperature. Overall the correlation using thetwo different enthalpy curves is not significantlydifferent.
Non standard furnace tests In July of 1994, BRANZundertook two tests in the pilot furnace using non-standard time temperature curves. The author providedthe two time-temperature curves developed usingcompf-2.21 Test 9 is a fuel bed controlled crib fire witha high ventilation factor. The high ventilation results ina slow rate of temperature build up. The heat releaserate decreases at a rate proportional to the square rootof the mass remaining. At about 54min the heat releaserate is too low to maintain the temperature reached, andthe temperature steadily decreases.
The time temperature curve and heat transfer modelcomparison for Test 9 is shown in Fig. 7.
It can be seen that some difficulty was experienced bythe furnace operator in following a non-standardfurnace test curve. The models were run using thesmoothed furnace time-temperature curve. These curveswere smoothed, in order to reduce the number of time-
Figure 5. Section of light timber framedwall.
0
100
200
300
400
500
600
700
0 5 10 15 20 25 30 35 40 45 50
Test @ 2 Test @ 3 Test @ 4
Model@2 Model@3 Model@4
Model@2, Sultan Cp Model@3, Sultan Cp Model@4, Sultan Cp
Time (minutes)
Tem
pera
ture
(°C
)
Figure 6. Test1comparisonwithmodel.
G. THOMAS.42
Copyright # 2002 John Wiley & Sons, Ltd. Fire Mater. 2002; 26: 37–45
temperature pairs, and to avoid numerical instabilities inthe heat transfer model caused by abrupt temperaturechanges.
The correlation between the test and model isexcellent up until 50min at positions 2 and 3 and for60min at position 4. In the tests after about 50min a gap
opened up between the lining sheets. Furnace gases werethen able to enter the cavity and the stud ignited,making the heat transfer model invalid. tasef does notmodel internal heat generation satisfactorily.
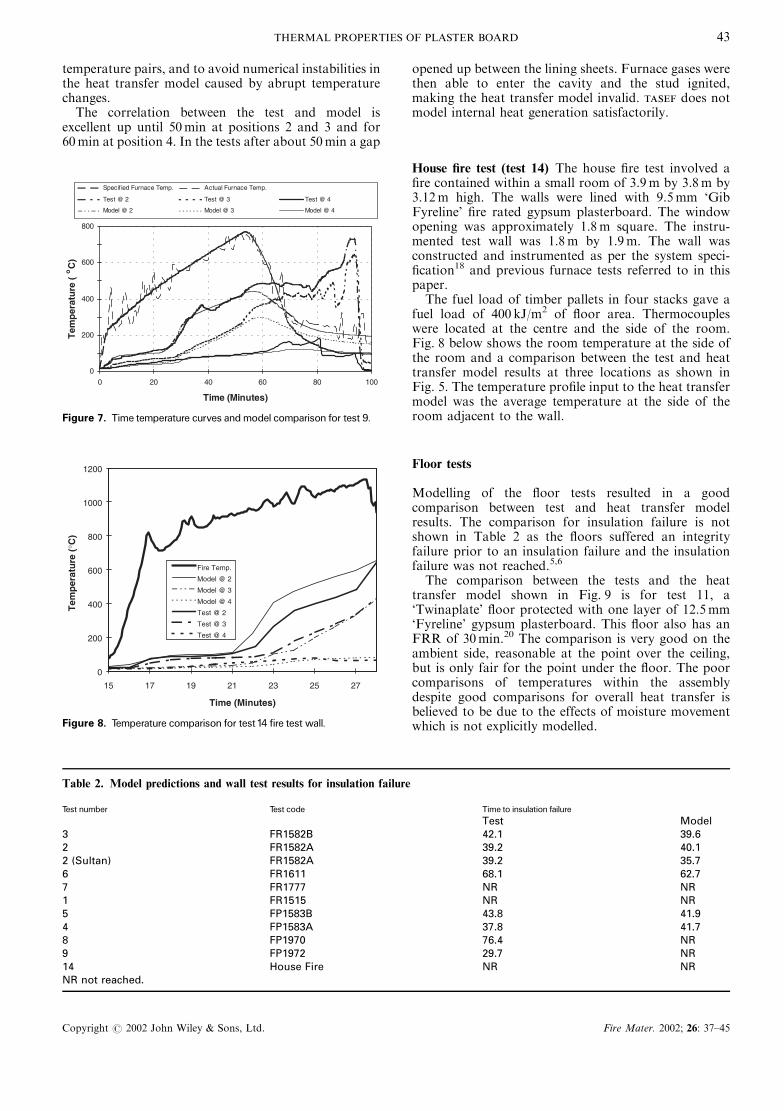
House fire test (test 14) The house fire test involved afire contained within a small room of 3.9m by 3.8m by3.12m high. The walls were lined with 9.5mm ‘GibFyreline’ fire rated gypsum plasterboard. The windowopening was approximately 1.8m square. The instru-mented test wall was 1.8m by 1.9m. The wall wasconstructed and instrumented as per the system speci-fication18 and previous furnace tests referred to in thispaper.
The fuel load of timber pallets in four stacks gave afuel load of 400 kJ/m2 of floor area. Thermocoupleswere located at the centre and the side of the room.Fig. 8 below shows the room temperature at the side ofthe room and a comparison between the test and heattransfer model results at three locations as shown inFig. 5. The temperature profile input to the heat transfermodel was the average temperature at the side of theroom adjacent to the wall.
Floor tests
Modelling of the floor tests resulted in a goodcomparison between test and heat transfer modelresults. The comparison for insulation failure is notshown in Table 2 as the floors suffered an integrityfailure prior to an insulation failure and the insulationfailure was not reached.5,6
The comparison between the tests and the heattransfer model shown in Fig. 9 is for test 11, a‘Twinaplate’ floor protected with one layer of 12.5mm‘Fyreline’ gypsum plasterboard. This floor also has anFRR of 30min.20 The comparison is very good on theambient side, reasonable at the point over the ceiling,but is only fair for the point under the floor. The poorcomparisons of temperatures within the assemblydespite good comparisons for overall heat transfer isbelieved to be due to the effects of moisture movementwhich is not explicitly modelled.
0
200
400
600
800
0 20 40 60 80 100
Time (Minutes)
Tem
per
atu
re(
oC
)
Specif ied Furnace Temp. Actual Furnace Temp.
Test @ 2 Test @ 3 Test @ 4
Model @ 2 Model @ 3 Model @ 4
Figure 7. Time temperature curves andmodel comparison for test 9.
0
200
400
600
800
1000
1200
15 17 19 21 23 25 27
Time (Minutes)
Fire Temp.
Model @ 2
Model @ 3
Model @ 4
Test @ 2
Test @ 3
Test @ 4
Tem
per
atu
re (
°C)
Figure 8. Temperature comparison for test14 fire test wall.
Table 2. Model predictions and wall test results for insulation failure
Test number Test code Time to insulation failure
Test Model3 FR1582B 42.1 39.62 FR1582A 39.2 40.12 (Sultan) FR1582A 39.2 35.76 FR1611 68.1 62.77 FR1777 NR NR1 FR1515 NR NR5 FP1583B 43.8 41.94 FP1583A 37.8 41.78 FP1970 76.4 NR9 FP1972 29.7 NR14 House Fire NR NRNR not reached.
THERMAL PROPERTIES OF PLASTER BOARD 43
Copyright # 2002 John Wiley & Sons, Ltd. Fire Mater. 2002; 26: 37–45

RESULTS
The time to insulation failure is the time taken for thetemperature in position 4 in Fig. 5 to increase by 1408Cas defined by ISO-834.7 Comparisons of these for testresults and heat transfer model predictions are shown inTable 2.
The time to insulation failure is under predicted inthree cases and over predicted in two. The worst overprediction is 4%.
Test 2 was repeated using a second peak in the specificheat for the second dehydration reaction at about 6508Cas per Sultan.13 This results in a poorer prediction forthe time to insulation failure.
RECOMMENDED VALUES
The values in Table 3 are recommended for usein modelling heat transfer through light timber framewalls for specific heat, mass loss rate and densityrespectively. Both the calculated base values and thesmoothed ‘as used’ values are given. Intermediate valuescan be calculated using linear interpolation. Thevalues are such that an enthalpy curve will be‘smooth’ however the specific heat values have somediscontinuity.
CONCLUSIONS
The heat transfer model appears to predict wall andfloor temperature profiles in tests well. It is conservativefor fast, hot fires and the prediction of temperatureprofiles in specimens subjected to temperature historieswith rapid and abrupt changes in temperature is of lesseraccuracy.
The values of conductivity of gypsum plasterboardat very high temperatures and specific heat havebeen modified to some extent in the calibration of theheat transfer model. Conductivity was increased sub-stantially at higher temperatures to allow for ablationand the specific heat was manipulated to give asmoother enthalpy curve and therefore minimize nu-merical instabilities in the heat transfer model. Theresulting values are not necessarily actual values butapparent values that are valid for a heat transfer model.They are suitable for an engineering model of heattransfer through a plasterboard clad LTF wall or floorassembly.
The heat transfer model has some limitations, such asthe inability to model mass transfer, the movement ofmoisture and pyrolysis products through the wallmaterials and across the void. Other input values forheat transfer models such as emissivities and convectioncoefficients are less well defined than thermo-physicalproperties.
0
100
200
300
400
500
600
700
800
900
0 10 20 30 40 50 60
Time (Minutes)
Test, above ceiling lining
Test, under floor sheeting
Test, ambient side
Model, ambient side
Model, under floor sheeting
Model, above ceiling lining
Tem
per
atu
re (
°C)
Figure 9. Comparison betweenmodel and floor test11.
Table 3. Recommended thermal properties for gypsum plasterboard
Temperature 8C Specific heat calculated kJ/kg.K Temperature 8C Specific heat as used kJ/kg.K Temperature 8C %Original mass Temperature 8C ConductivityW/m.K
0 0.95 0 0.95 0 100 0 0.25100 5 100 0.95 80 100 70 0.25110 52.45 110 52.45 125 95 130 0.13120 0.95 110 18.12 540 93.5 300 0.13200 0.95 140 0.95 650 91 800 0.18210 19.45 140 3.39 1000 90 1000 0.35220 0.95 220 3.39 1000 0.78600 0.95 600 0.95 4000 102000 0.95 2000 0.95
G. THOMAS.44
Copyright # 2002 John Wiley & Sons, Ltd. Fire Mater. 2002; 26: 37–45

Using a specific heat curve that incorporates theenergy required for a second dehydration reactionappears to result in a poorer prediction of time toinsulation failure but does not significantly alter thecorrelation with temperatures throughout the assembly.
Further refinement of thermal properties may be oflimited value as the accuracy of the models approach thelimits of experimental variation and error.
Acknowledgements
The author would like to thank Associate Professor Andy Buchananand Andrew Charleson for their assistance in the preparation of thismanuscript and Winstone Wallboards, BRANZ and J .uurgen K .oonig ofTRATEK, for providing test data.
REFERENCES
1. Harmathy TZ. The SFPE Handbook of Fire ProtectionEngineering. Section 1 Chapter 26. Society of Fire ProtectionEngineers/National Fire Protection Association: Boston,1988.
2. B!eenichou N, Mehaffey JR, Sultan MA., Takeda, H.. Proc.Wood and Fire Safety International Scientific ConferenceSvolen, Slovakia. 2000. 2000; 33–43.
3. Sterner E, Wickstrom U. TASEF}Temperature Analysis ofStructures Exposed to Fire. Fire Technology SP Report1990:05. Swedish National Testing Institute: Stockholm.1990.
4. Hibbitt, Karlsson and Sorensen Inc. ABAQUS User Manuals.Version 5.4. Pawtucket, Rhode Island, 1994.
5. Thomas GC. Fire Resistance of Light Timber Framed Wallsand Floors. PhD Dissertation, University of Canterbury,Christchurch, New Zealand, 1997.
6. Thomas GC. Fire Resistance of Light Timber Framed Wallsand Floors. Fire Engineering Research Report 97/71997,University of Canterbury: Christchurch, New Zealand, 1997.
7. ISO-834. Fire Resistance Tests}Elements of Construction.International Standards Organization, 1975.
8. K .oonig J, Noren J. Proc. International Conference on TimberEngineering. London. 1991;475–482.
9. Drysdale D. An Introduction to Fire Dynamics. John Wileyand Sons: Chichester, 1985.
10. Andersson L, Jansson B. Analytical Fire Design withGypsum}A Theoretical and Experimental Study. Instituteof Fire Safety Design: Lund, 1987.
11. Mehaffey JR, Cuerrier P, Carisse GA. Fire Mater.1994;18:297–305.
12. Clancy P. Time and Probability of Failure of Timber FrameWalls in Fire, PhD Dissertation, Victoria University ofTechnology, Melbourne, Australia, 1999.
13. Sultan MA. Fire Technol. 1996, 239–259.14. Lide DR (Ed.). CRC Handbook of Chemistry and Physics, 71st
edn, CRC Press: Cleveland, 1991.15. Groves AW. Gypsum and Anhydrite. Overseas Geological
Surveys, Mineral Resources Division. Her Majesty’s Station-ery Office: London, 1958.
16. Bakhtiary SB, Jafarpoor F, Firoozyar F. Asian J. Civil Eng.(Building and Housing) 2000;1:67–82.
17. Stanish AJ. 1994. Mechanical Properties of Gypsum Plaster-board. Third Professional Year Research Project Report.Department of Civil Engineering, University of Canterbury.Christchurch, New Zealand.
18. B!eenichou N, Sultan MA. Proc. Fire and Materials Confer-ence. San Francisco, California. United States. InterscienceCommunications: London, 2001; 447–458.
19. Sultan MA, Alfawakhiri F, B!eenichou N. Proc. Fire andMaterials Conference. San Francisco, California, UnitedStates. Interscience Communications: London, 2001;495–506.
20. Winstones Gib Board. Fire Rated Systems. Winstone Wall-boards Limited: Wellington, New Zealand, 1992.
21. Babrauskas V. COMPF2, A Program for Calculating Post-Flashover Fire Temperatures. NBS Technical Note 991. USDepartment of Commerce/National Bureau of Standards:Gaithersburg, 1979.
THERMAL PROPERTIES OF PLASTER BOARD 45
Copyright # 2002 John Wiley & Sons, Ltd. Fire Mater. 2002; 26: 37–45