Thermal properties of different hardwood species COST FP1105 Meeting, San Sebastian, 26-27.05.2015...
25
Thermal properties of different hardwood species COST FP1105 Meeting, San Sebastian, 26-27.05.2015 Carmen-Mihaela Popescu, Maria-Cristina Popescu ”Petru Poni” Institute of Macromolecular Chemistry of Romanian Academy, Iasi, Romania
-
Upload
rodney-day -
Category
Documents
-
view
222 -
download
4
Transcript of Thermal properties of different hardwood species COST FP1105 Meeting, San Sebastian, 26-27.05.2015...

Thermal properties of different hardwood species
COST FP1105 Meeting, San Sebastian, 26-27.05.2015
Carmen-Mihaela Popescu, Maria-Cristina Popescu
”Petru Poni” Institute of Macromolecular Chemistry of Romanian Academy, Iasi, Romania

Purpose
Provide information concerning components composition and thermal properties of different hardwood species

Materials
Species
Average
wood
density
Average component percentage
(%)
Cellulos
eLignin
Hemicellulo
ses and
others
poplar (Populus tremula) 0.45 48-49 21-25 26-31
lime (Tillia cordata) 0.48 48-51 20-22 27-32
cherry (Prunus avium) 0.50 45-47 18-21 32-37
maple (Acer
pseudoplatanus)0.56 45-47 19-22 31-36
http://www.worldagroforestrycentre.org/sea/Products/AFDbases/WD/, R. B. Hoadley. Physical and chemical properties, in: Identifying wood. Accurate results with simple tools, Taunton Press, U.S., 1990, pp. 46-53, R. M. Rowell, R. Pettersen, J. S. Han, J. S. Rowell, M. A. Tshabalala, Cell Wall Chemistry, in: Handbook of wood chemistry and wood composites, ed. R. M. Rowell, CRC Press, 2005

Methods
Thermogravimetry
Infrared spectroscopy
Two dimensional correlation infrared spectroscopy
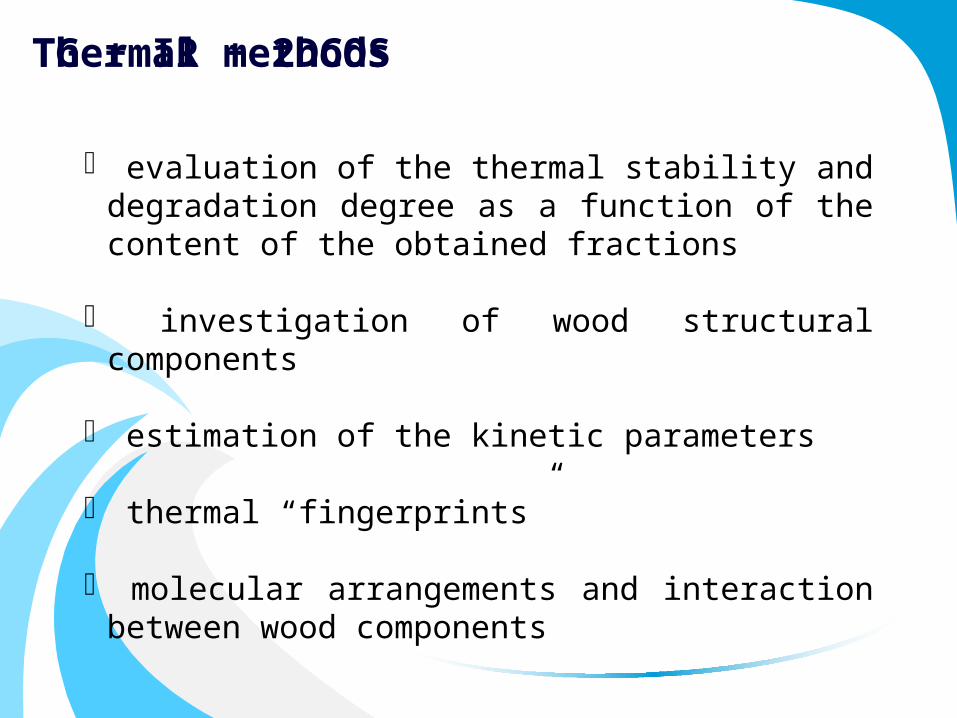
Thermal methods
evaluation of the thermal stability and degradation degree as a function of the content of the obtained fractions
investigation of wood structural components
estimation of the kinetic parameters
thermal “fingerprints”
molecular arrangements and interaction between wood components
TG + IR + 2DCOS

Termogravimetry
SpeciesStep II
Ti Tsh Tm TfW%
poplar (Populus tremula) 153.7 287.2 359.0 525.8 74.8
lime (Tilia cordata) 150.0 289.9 356.2 525.3 71.6
cherry (Prunus avium) 153.9 290.5 353.3 519.6 71.0
maple (Acer pseudoplatanus) 147.6 301.5 351.5 524.3 72.2
hemicelluloses
cellulose
lignin

Termogravimetry
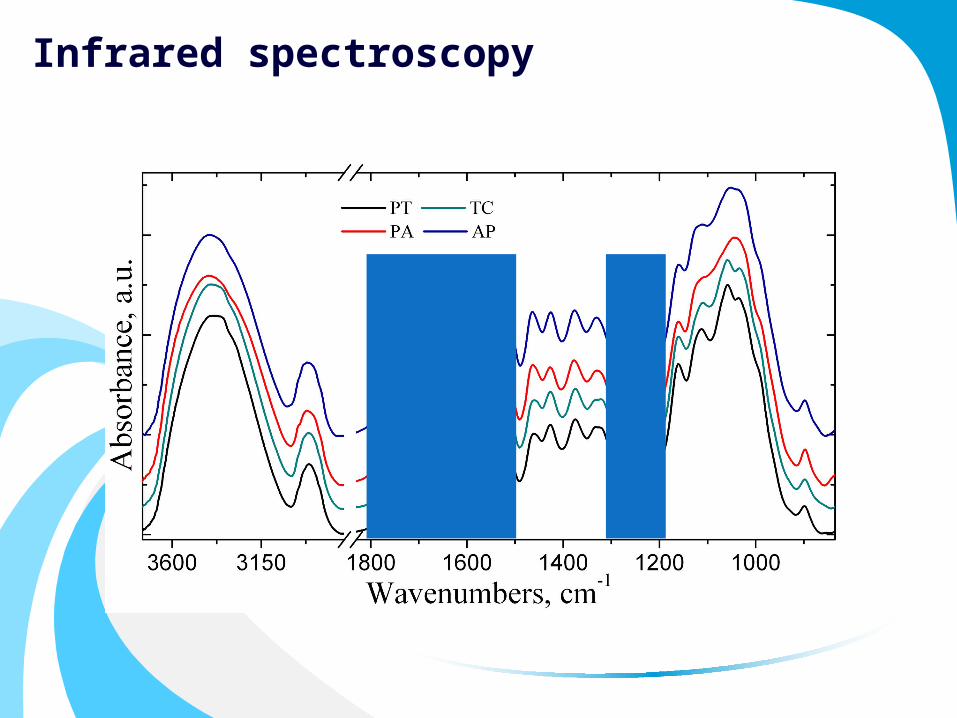
Infrared spectroscopy

Infrared spectroscopy

Infrared spectroscopy

Infrared spectroscopy
20 → 220 oC (with 1 oC/min)

Infrared spectroscopy
PT
TC
PA
AP
20 oC
220 oC

Infrared spectroscopyPT
TC
PA
AP

Infrared spectroscopy
PT
C–O in quinines and C=O in various groups → degradation of the acetyl groups and formation of other structures
C=C in aromatic skeletal components in lignin → increase of the amount of lignin due to degradation of amorphous carbohydrates
C–O of Ph–O–C in lignin and C–O in xyloglucan → loss of acetyl groups

sample
spectrum
electro-magnetic beam
External perturbation (temperature)
dynamic
Two dimensional (2D) correlation spectroscopy

Synchronous 2D correlation spectra represent the simultaneous or coincidental changes of spectral intensities measured at the wavenumbers 1 and 2
The diagonal peaks are referred to as – “autopeaks” 1= 2
The peaks located at the off–diagonal positions are referred as – “crosspeaks” 1 2
n1
n2
crosspeaks
autopeak
- +
2D IR correlation spectroscopy

Sequential, changes of spectral intensities at the wavenumbers 1 and 2. The spectrum is antisymmetric with respect to the diagonal line.The peaks located at the off–diagonal positions are referred as – “crosspeaks” 1 2
n1
n2
crosspeaks
-+
2D IR correlation spectroscopy

Simplification of complex spectra and enhancement of spectral resolution
Detailed investigation of the intra- and intermolecular interaction
Study of the process of chemical reaction or the kinetics of molecular vibrations
Band assignments based on the correlation analysis between various bands
Advantages

2D IR correlation spectroscopy

2D IR correlation spectroscopyPT TC PA AP
3287 > 3343 > 3456 cm-1

2D IR correlation spectroscopy

2D IR correlation spectroscopyPT TC PA AP
1720 > 1739 , 1558 > 1605 > 1651, 1504,
1538 > 1636 > 1785 cm-1

Conclusions
Thermogravimetry indicated the thermal properties of the studied wood samples.
The calculated percentages of the components are in good correlation with the values from literature data.
The ratio values of lignin/carbohydrate IR bands decrease and of carbonyl/carbohydrate IR bands increases with increasing the average wood density.
The infrared and 2DCOS IR spectra indicates structural modifications (induced by different reactions) in the main components of wood.

Thank you for your attention!

Questions?
Iasi