THERMAL PROPAGATION TOPICS - UNECE
37
1. Effect of Induced Metal Contaminants on Lithium-ion Cell Safety (Slides 2-18) 2. Detection of Cell Internal Shorts (Slides 19-26) 3. Industry Field Experience (Slides 27-37) Presented on behalf of OICA to the EVS GTR IWG March 2018 THERMAL PROPAGATION TOPICS 1
Transcript of THERMAL PROPAGATION TOPICS - UNECE

1. Effect of Induced Metal Contaminants on Lithium-ion Cell Safety (Slides 2-18)
2. Detection of Cell Internal Shorts (Slides 19-26)
3. Industry Field Experience (Slides 27-37)
Presented on behalf of OICA to the EVS GTR IWG
March 2018
THERMAL PROPAGATION TOPICS
1

EFFECT OF INDUCED METAL CONTAMINANTS ON LITHIUM-ION CELL SAFETY
Joint investigation between GM Global Battery Systems and GM China Science Lab
Presentation to EVS GTR IWG
March 2018
Based on material originally presented at:
Advanced Automotive Battery Conference, Advanced Automotive Battery Technology, Application & Market Symposium, Session 4 – Battery Abuse-Tolerance Design and Validation, June 19, 2015, Detroit, MI
2

¶ Metal particle contamination does not necessarily result in catastrophic thermal events, even after cycling under compression.
¶ Careful cell design (chemistry, configuration) and manufacturing process steps will minimize risk that a severe internal short circuit event can occur.
KEY MESSAGES
3
¶ Problem Definition – Metal particles in Li-ion cells may pose a safety risk due to the potential formation of an internal short circuit.
– How do metal particles cause short circuits in the cells?
– Is the severity of the short circuit dependent on the location of the particle within the cell?
– Separator poke-through versus dendrite formation
– Is the severity of the short circuit dependent on the size of the particle?
– At what minimum particle size will the effects caused by the particle be detected and the cell rejected in the manufacturing process?
– Does the severity of the short circuit increase with cycling or storage?
EFFECT OF METAL PARTICLES IN LI-ION CELLS
4
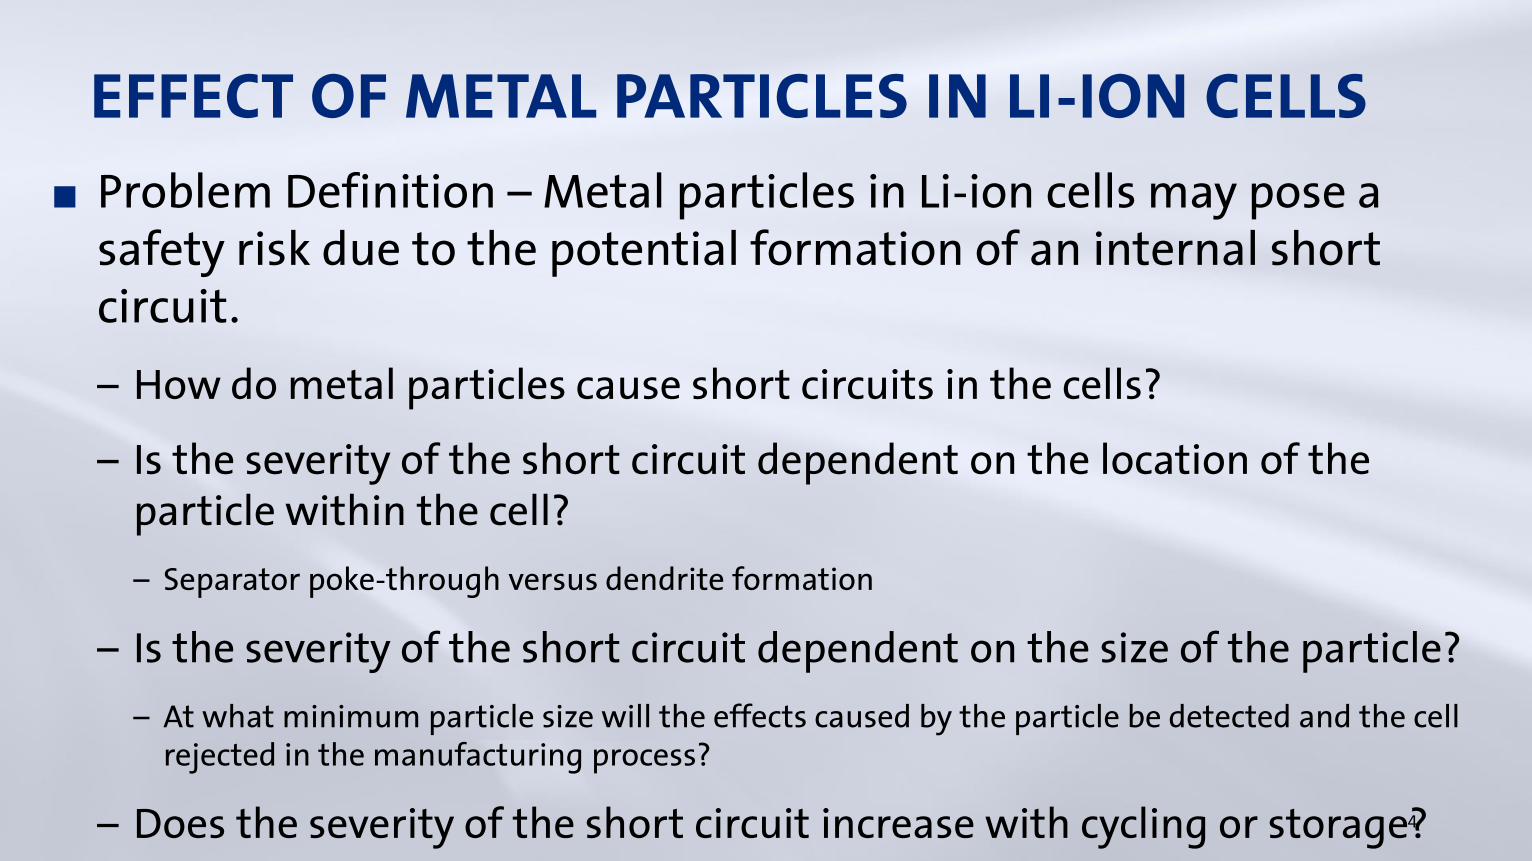
TYPES OF INTERNAL SHORTS
From “UL Transportation Tests and UL Lithium Battery ProgramUnderwriter’s Laboratory Inc. – General Experience and Status Update,”
November 11, 20085

RELATIVE RESISTANCE OF ISC TYPE
Cathode Material
Cathode Material
Shriram Santhanagopalan, Premanand Ramadass, John (Zhengming) Zhang,Analysis of internal short-circuit in a lithium ion cell,
Journal of Power Sources, Volume 194, Issue 1, 2009, Pages 550-557. 6

¶ Separator Poke-through:
– If the particle is large enough, it could rub-through or poke-through the separator and create an internal short circuit.
POTENTIAL METAL PARTICLE SHORTING MECHANISMS
¶ Dendrite Formation:
– If the particle is located on the surface of a charged positive electrode, it could undergo electrochemical dissolution, with subsequent plating of the metal onto the surface of the negative electrode.
– If dendritic growth occurs, and the particle has enough mass, then these dendrites could grow through the separator and contact the positive electrode.
7

¶ Metal Particle Sizes
– Run 1, 500-700 µm iron particles (ease of handling)
– Run 2, 50-150 µm iron particles (low end of known contaminant sizes)
¶ Detection Methods and Tests
– Hi-Pot test after electrode stack assembly
– Self-Discharge (Delta-OCV) Check during Aging process step (50% SOC at 35ºC for 7 days)
– Cycle Life Test (100% DOD at 1C/1C rate and 35ºC under compression)
– Storage Test (100% SOC at 35ºC under compression)
¶ The Cells Used
– 1.4 Ah, multi-layer, Li-ion pouch cells (baseline and 1-particle cells, 3-6 of each type)
– MCMB graphite and NMC, with uncoated 25 µm tri-layer separator and 1M LiPF6 EC/DEC/EMC electrolyte
– Fe particles placed in one of three locations: Anode Center, Cathode Center and Cathode Tab near the anode (see diagram and CT scan image)
THE STUDY:
Run #1 Particles Run #2 Particles
8

¶ All cells passed the Hi-Pot test after electrode stack assembly
¶ Only cells with large particles located on the cathode surface showed higher than normal self-discharge rates
CELL MANUFACTURING QUALITY CHECKS
RunIron Particle
SizeAnode Center
Cathode TabCathode Center
Baseline Cells
Run #1 > 500 µmPass Hi-Pot
Pass self-discharge
Pass Hi-PotFailed self-discharge
Pass Hi-PotFailed self-discharge
Pass Hi-PotPass self-discharge
Run #2
100-150µmPass Hi-Pot
Pass self-discharge
Pass Hi-PotPass self-discharge
50-100 µmPass Hi-Pot
Pass self-discharge
Pass Hi-PotPass self-discharge
Passed
Failed / High Self-discharge
Run #1 Cells
9

¶ Cathode Center particle cells showed a more rapid Ah capacity decline.
¶ Anode Center and Cathode Tab particle cells showed no significant difference compared to the Baseline cells.
¶ No cell venting occurred.
RUN #1 CELLS – CYCLE LIFE TEST
Cathode Center
Particle Cells
-- Anode Center
– Cathode Tab
– Cathode Center
– Baseline
10

¶ Cathode Tab particle cells showed a higher voltage loss at each RPT.
¶ Anode Center particle cells showed no significant difference compared to the Baseline cells.
¶ Due to monthly RPT’s, all cells showed similar capacity loss.
¶ No cell venting occurred.
¶ Cathode center particle cells did not undergo this test due to their already high self-discharge rates.
RUN #1 CELLS – STORAGE TESTAnode Center Cathode Tab Baseline
Anode Center Cathode Tab Baseline
Test Error11

¶ In all cases, both the particle containing cells and the baseline cells showed reduced 7-day self-discharge rates after their cycling or storage tests.
RUN #1 CELLS – SELF-DISCHARGE RATES AFTER CYCLING OR STORAGE TESTS
Anode Center Cathode Tab Baseline
Cathode Center
Cathode Tab Anode Center
Actual BOL self-discharge rates are >300 mV/day for these cells.
12

¶ 100-150 µm particles appear to the minimum size that causes premature cycle life failure.
¶ No cell venting occurred
RUN #2 CELLS – CYCLE LIFE TEST
Manufacturing error caused
Li metal plating
CSL622
CSL623
CSL624
CSL631
CSL632-- 50-100 µm Cathode Center
– 100-150 µm Cathode Center
-- Baseline
Apparent a low mass particle
13

¶ For cells with particles <150 µm, no significant self-discharge rates or capacity loss differences were seen between them and the Baseline cells.
RUN #2 CELLS – STORAGE TEST
50-100µm 100-150µm Baseline 50-100µm 100-150µm Baseline
14
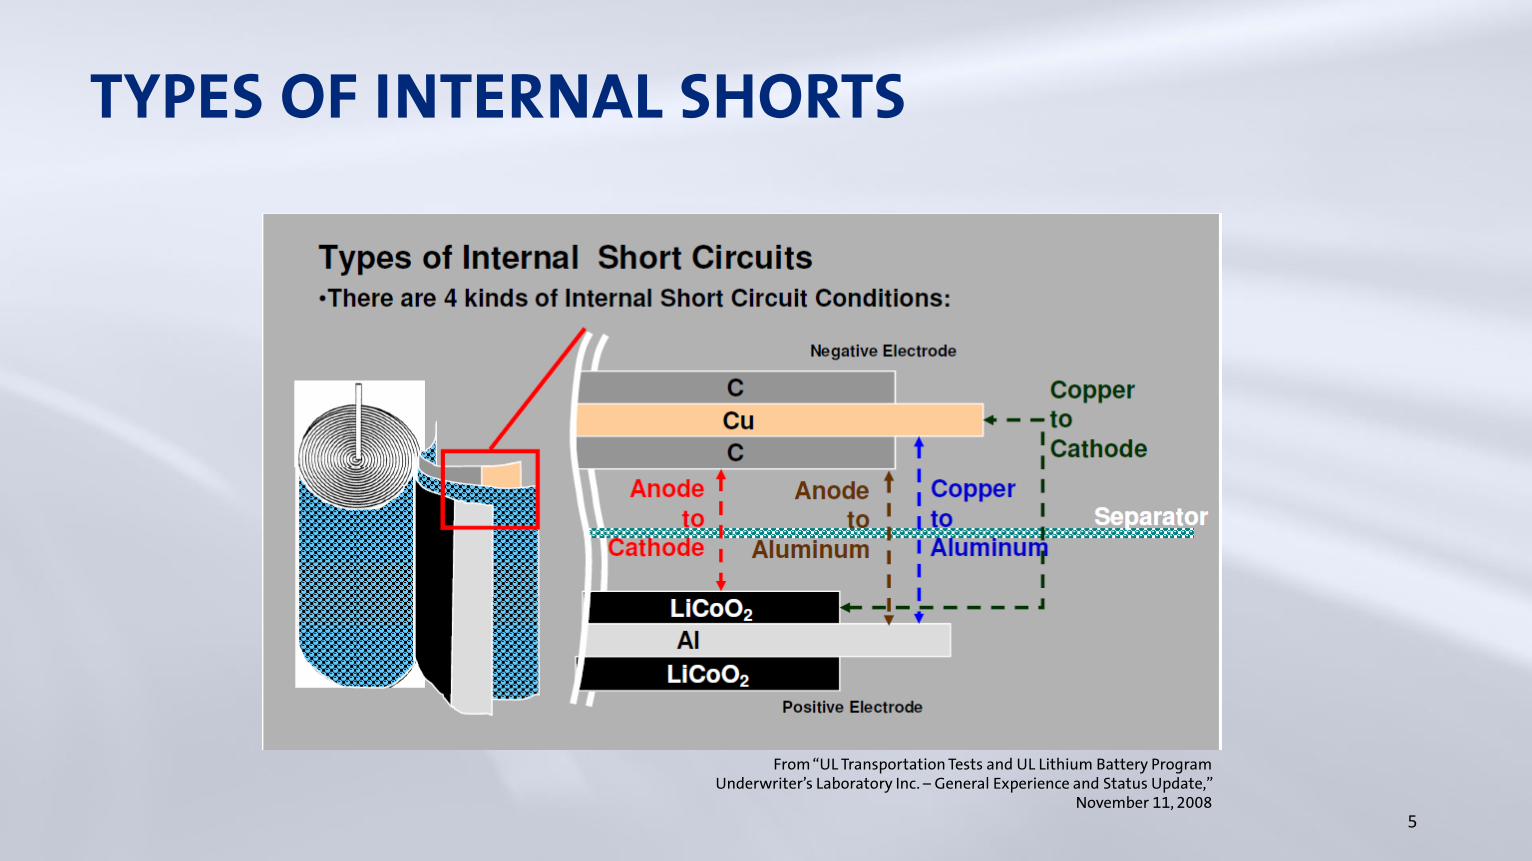
¶ In almost all cases, both the particle containing cells and the baseline cells showed reduced 7-day self-discharge rates after their cycling or storage tests.
RUN #2 CELLS – SELF-DISCHARGE RATES AFTER CYCLING OR STORAGE TESTS
50-100µm 100-150µm Baseline
50-100µm 100-150µm Baseline
15
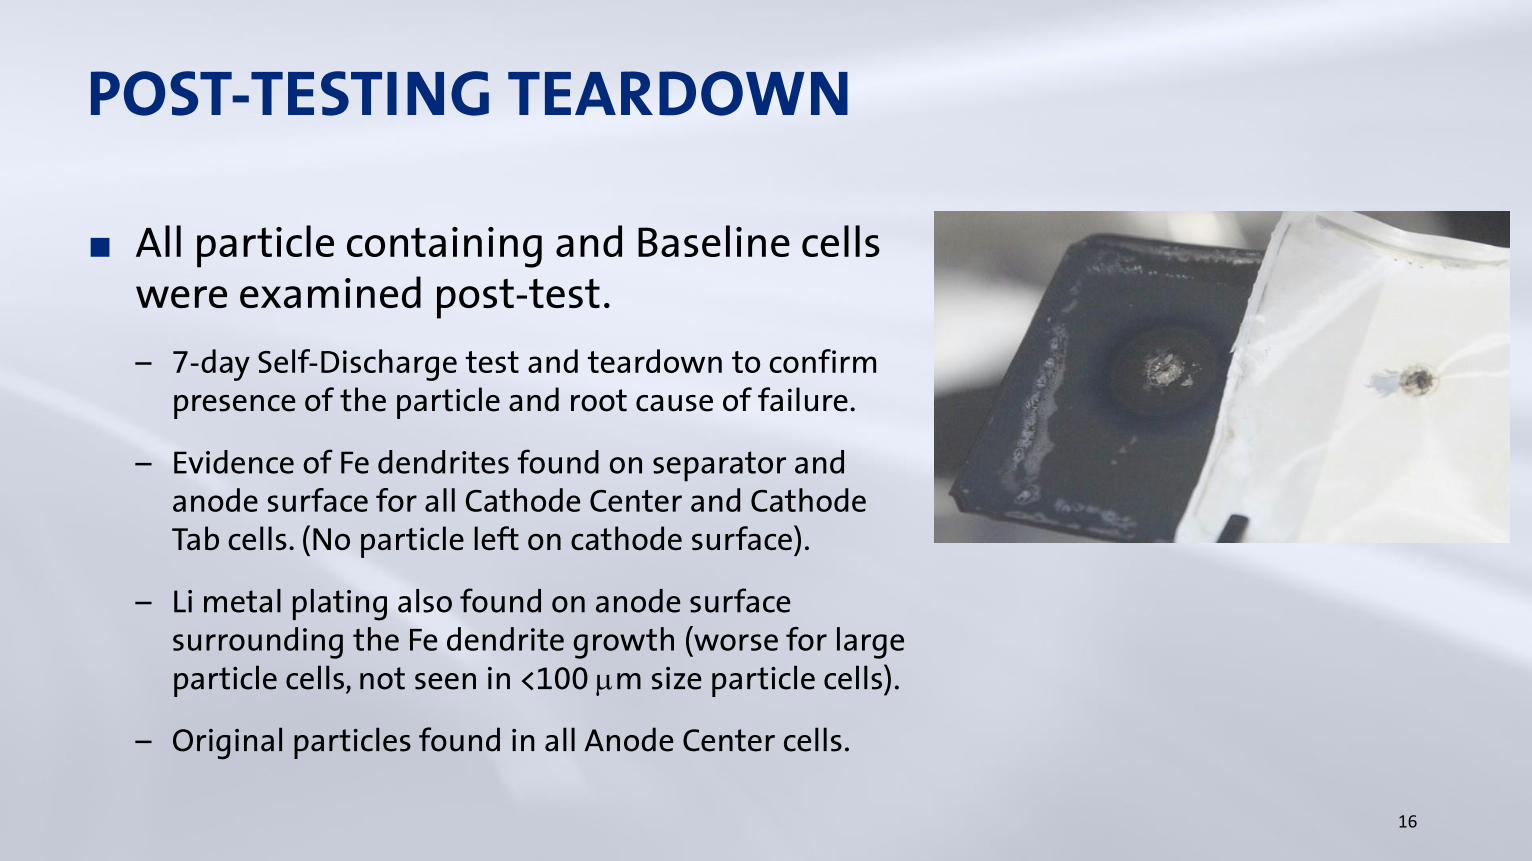
POST-TESTING TEARDOWN
¶ All particle containing and Baseline cells were examined post-test.
– 7-day Self-Discharge test and teardown to confirm presence of the particle and root cause of failure.
– Evidence of Fe dendrites found on separator and anode surface for all Cathode Center and Cathode Tab cells. (No particle left on cathode surface).
– Li metal plating also found on anode surface surrounding the Fe dendrite growth (worse for large particle cells, not seen in <100 mm size particle cells).
– Original particles found in all Anode Center cells.
16

TEST RESULT SUMMARY:
RunIron Particle
SizeParticle Location
7-day Aging OCV Check
Cycling vs.Baseline Cells
Storage vs. Baseline Cells
Run #1 >500 µm
Cathode CenterExceeded
2 mV/day LimitMore rapid
capacity fadeNot Run
Cathode TabExceeded
2 mV/day LimitNo Difference
GreaterSelf-discharge
Anode Center Passed No Difference No Difference
Run #2
100-150 µm Cathode Center PassedSlightly more rapid capacity
fadeNo Difference
50-100 µm Cathode Center Passed No Difference No Difference17

¶ Particles much larger than the separator’s thickness (20-28 times) did not push through to create an internal short, even after cycling under compression.
¶ Metal particles on the negative electrode (anode) did not cause internal cell shorting.
¶ Only metal particles initially located on the positive electrode, if of sufficient size and mass, caused internal cell shorting.
¶ Large metal particles are detectable by self-discharge and capacity loss in the manufacturer’s Aging/Storage process step.
¶ Particles below 100 µm have limited or no effect, while particles near 150 µm did cause pre-mature cycle life failure.
CONCLUSIONS:
18

Detection of Cell Internal Shorts
OICA Presentation to the EVS GTR IWG
March 2018
19
Key Messages
• Many internal shorts can be detected during manufacture and in usage
• Internal short behavior can often be measured and understood
20

Types of Shorts
• Immediate• Largely managed by cell design and manufacturing control
• Possibly detectable during manufacturing process
• Developing• Likely not possible to fully prevent
• Possibly detectable during usage –• Requires appropriate cell measurements and diagnostic algorithms
• Assumes that short develops over multiple cycles / days
21

Possible Detection Methods
• In manufacturing process• Self-discharge rate – monitor for values above a defined limit
• Times, methods, limits vary by manufacturer
• High voltage test prior to electrolyte added
• In vehicle• Cell voltage – monitor for low cell voltage
• Cell to cell voltage difference – monitor for differences above a defined limit
22
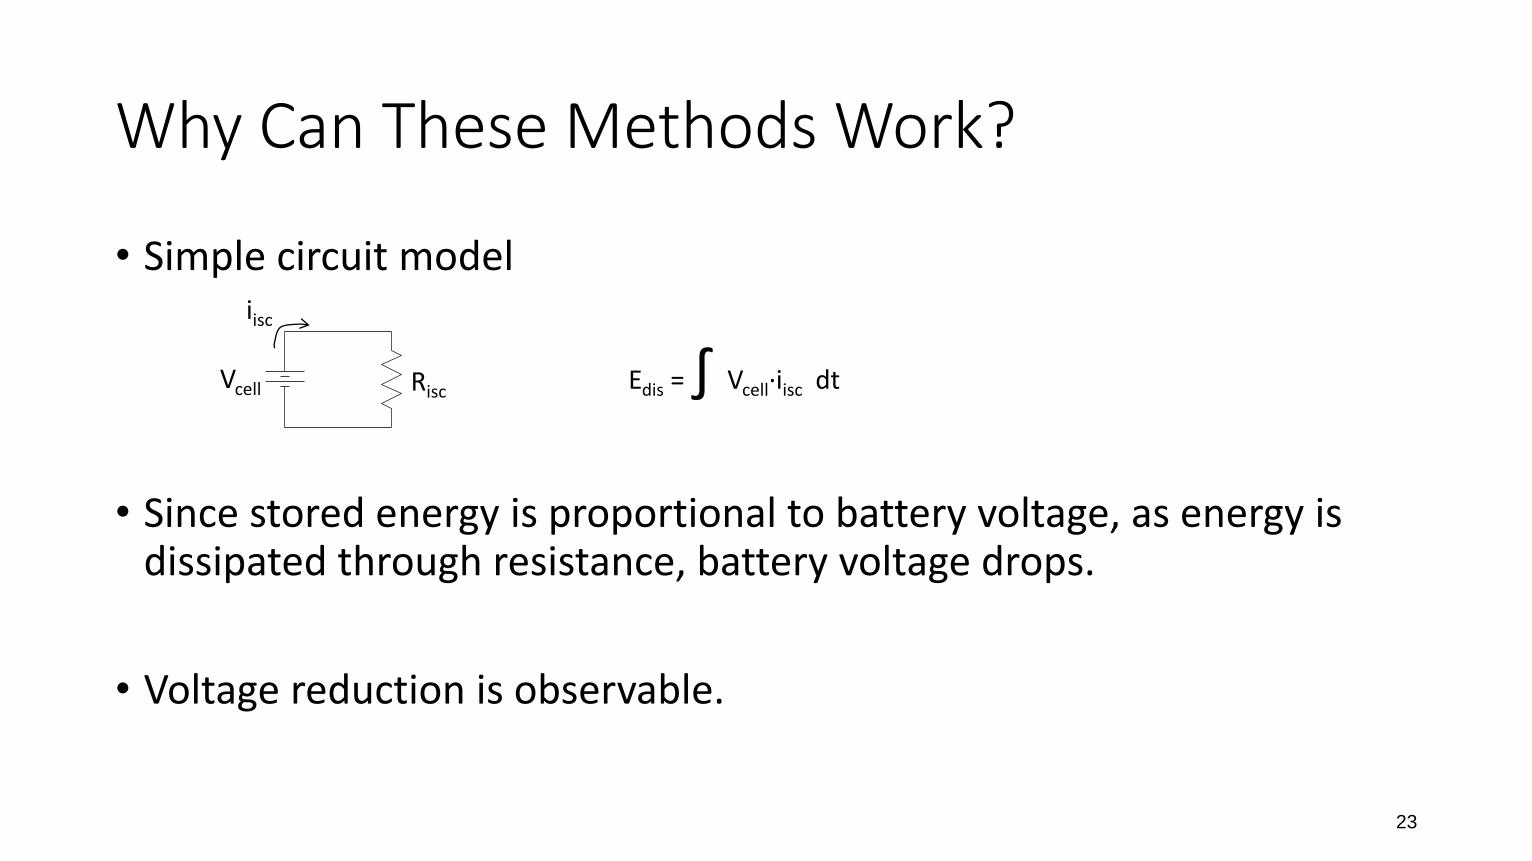
Why Can These Methods Work?
• Simple circuit model
• Since stored energy is proportional to battery voltage, as energy is dissipated through resistance, battery voltage drops.
• Voltage reduction is observable.
RiscVcell
iisc
Edis = ∫ Vcell∙iisc dt
23

Example of Manufacturing Process Detection
• Voltage degradation monitored for a period of time
• Measured degradation compared to acceptable limit values
24

Internal Short Resistance Behavior In Use
• Resistance reduces over time
• Cell energy (voltage) is reducing throughout time
• As energy loss integrates over time, can reach detectable level prior to short circuit at critical level
McCoy, C., Sriramulu, S., Stringfellow, R., Ofer, D. & Barnett, B. Lithium-Ion Battery Safety: Detection of Developing Internal Shorts and Suppression of Thermal Runaway. 46th Power Sources Conference, 2014.
25

Critical Internal Short Resistance
• Depending on cell chemistry, cell design, and application, there exists a threshold between thermal runaway and no thermal runaway
Barnett B., Ofer D., Sriramulu S., Stringfellow R. (2013) Lithium-Ion Batteries, Safety. In: Brodd R. (eds) Batteries for Sustainability. Springer, New York, NY 26

Industry Field ExperienceLithium Ion Battery Internal Short
Presentation to EVS GTR IWG
March 2018
27

Key Messages
• Industry has extensive field experience with lithium ion cells
• There have been no known incidents of internal short circuits resulting in cell thermal runaway
28

General Motors ExperienceLithium ion cells in field since 2010
Multiple vehicle applications
29

GM battery cell varieties
• Chevrolet Volt• Construction type: Pouch• Cathode material:
• 50% LMO / 50% 111 NMC• 30% LMO / 70% 442 NMC• 532 NMC
• Spark EV• Construction type: Pouch• Cathode material:
• LFP (limited volume)• 30% LMO / 70% 442 NMC
• Bolt• Construction type: Pouch• Cathode material:
• 622 NMC
• Mild Hybrid• Construction type: Cylindrical• Cathode material:
• 111 NMC
• Strong Hybrid• Construction type: Prismatic can• Cathode material:
• 442 NMC
30

Chemistry Description
• Cathodes• LMO - lithium manganese oxide
• LiMn2O4
• Sometimes called Manganese Spinel or Li Manganese Spinel
• NMC – lithium nickel manganese cobalt oxide• Li(NixMnyCoz)O2
• Numerical prefix refers to relative amount of each metal in the structure
• LFP – lithium iron phosphate• LiFePO4
• Anodes• Carbon
• Mixtures of various types of carbons (hard and soft) and/or graphites (artificial and natural with an amorphous carbon coating).
31
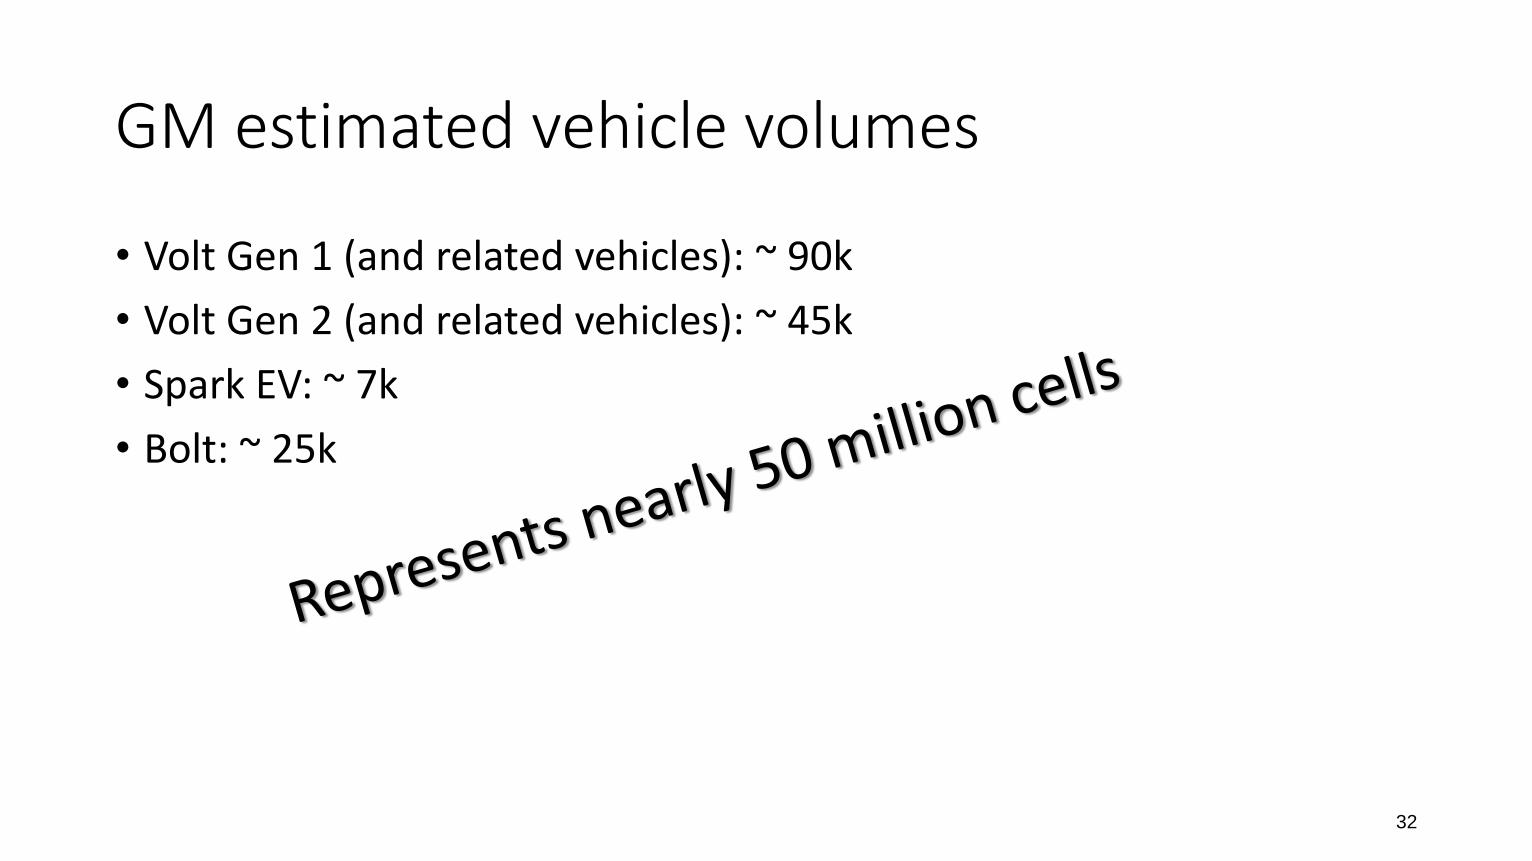
GM estimated vehicle volumes
• Volt Gen 1 (and related vehicles): ~ 90k
• Volt Gen 2 (and related vehicles): ~ 45k
• Spark EV: ~ 7k
• Bolt: ~ 25k
32

Known Internal Short Induced Thermal Events
• NONE
33

Possible internal short frequency
• Varies somewhat by cell type and manufacturer
• Overall GM experience shows ~2-5 events per million cells for detected cell internal short in customer vehicles
34

Ford Motor Company Experience

Ford Battery Cell Varieties
• Focus Electric• Construction Type: Pouch cell• Cathode Material: 622 NMC• Anode Material: Carbon
• Fusion / Mondeo / Lincoln MKZ Hybrid• Construction Type: Aluminum Can• Cathode Material: 111 NMC• Anode Material: Carbon
• Fusion Energi• Construction Type: Aluminum Can• Cathode Material: 111 NMC• Anode Material: Carbon
• C-Max Hybrid• Construction Type: Aluminum Can• Cathode Material: 111 NMC• Anode Material: Carbon
• C-Max Energi• Construction Type: Aluminum Can• Cathode Material: 111 NMC• Anode Material: Carbon
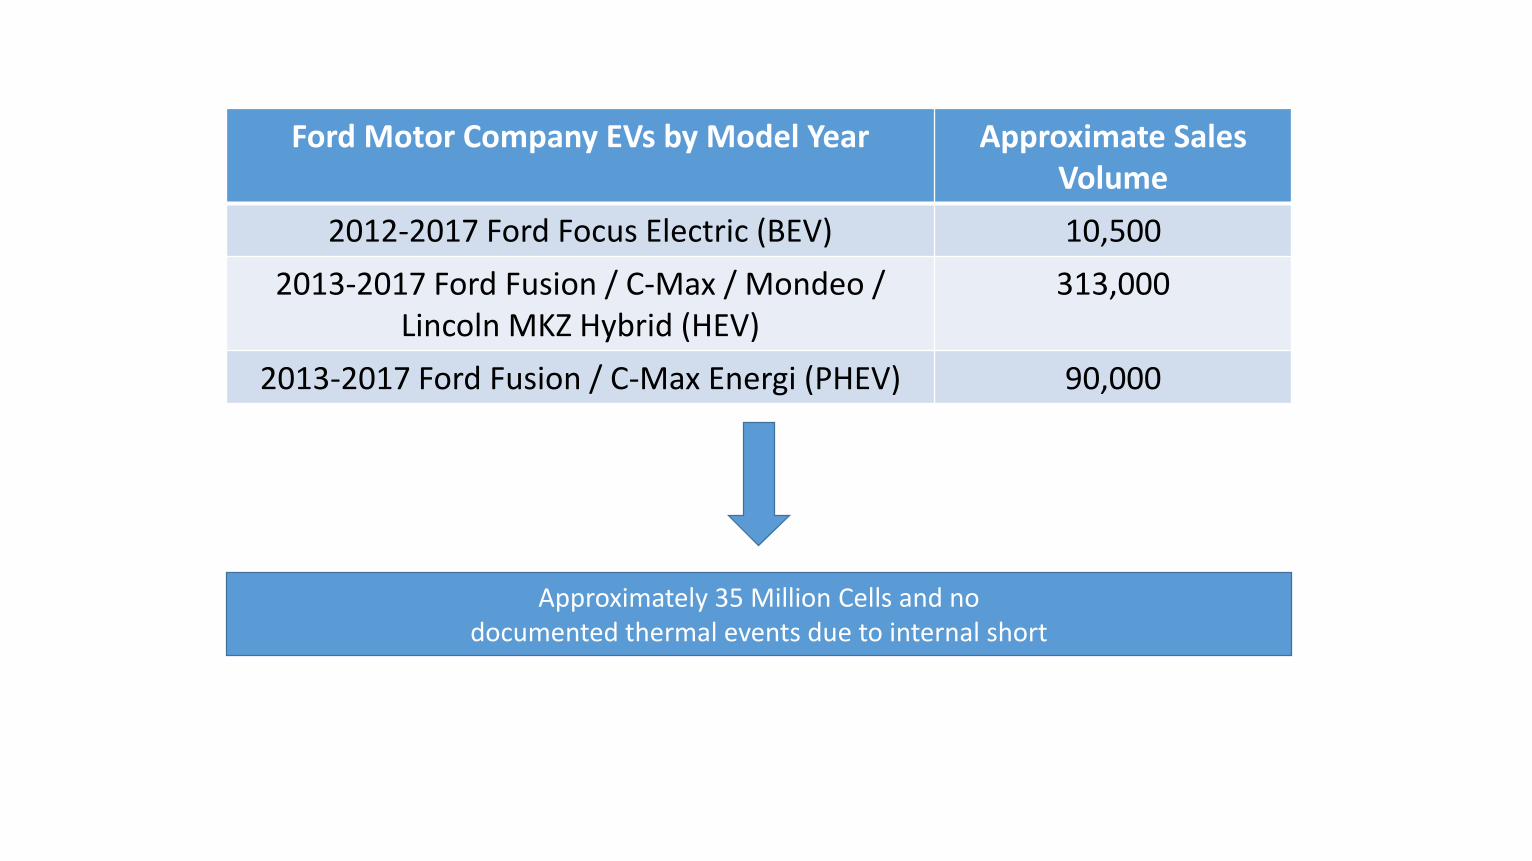
Ford Motor Company EVs by Model Year Approximate Sales Volume
2012-2017 Ford Focus Electric (BEV) 10,500
2013-2017 Ford Fusion / C-Max / Mondeo / Lincoln MKZ Hybrid (HEV)
313,000
2013-2017 Ford Fusion / C-Max Energi (PHEV) 90,000
Approximately 35 Million Cells and nodocumented thermal events due to internal short