
Thermal processes for resource recovery from waste · Thermal processes for resource recovery from...
26
www.aquaenviro.co.uk Thermal processes for resource recovery from waste David Tompkins, Bioresources Technical Manager
Transcript of Thermal processes for resource recovery from waste · Thermal processes for resource recovery from...

www.aquaenviro.co.uk
Thermal processes for resource recovery from waste
David Tompkins, Bioresources Technical Manager
www.aquaenviro.co.uk
• Why choose thermal?• UK waste production
• Quantities available for thermal treatment• Other materials for thermal conversion
• The question of recovery vs recycling• Potential barriers to market
Overview

www.aquaenviro.co.uk
Why choose thermal?
www.aquaenviro.co.uk
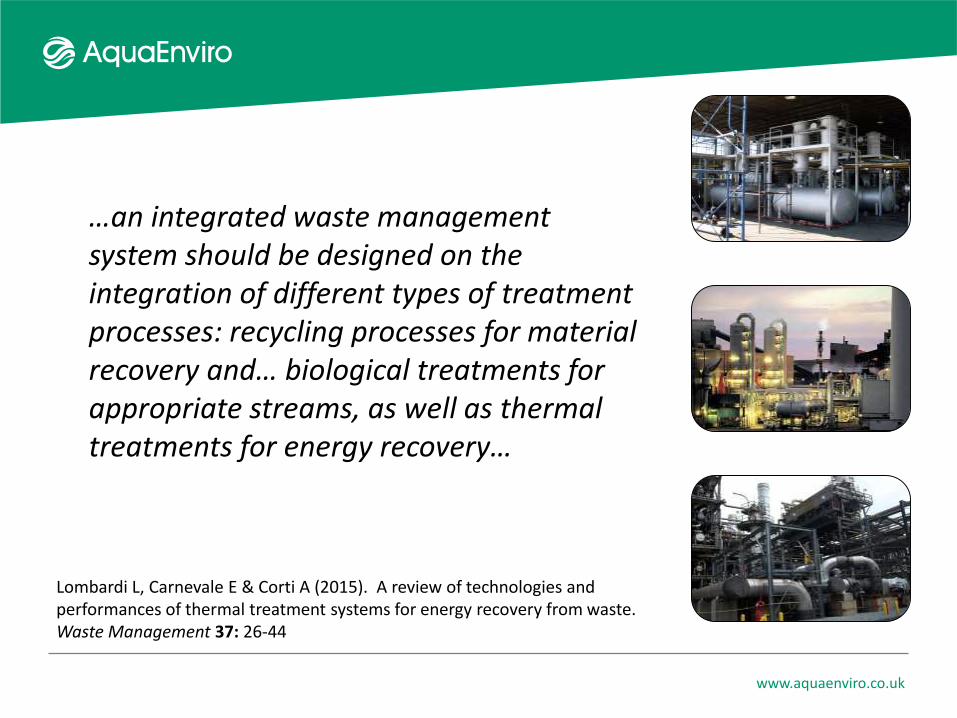
…an integrated waste management system should be designed on the integration of different types of treatment processes: recycling processes for material recovery and… biological treatments for appropriate streams, as well as thermal treatments for energy recovery…
Lombardi L, Carnevale E & Corti A (2015). A review of technologies and performances of thermal treatment systems for energy recovery from waste. Waste Management 37: 26-44

www.aquaenviro.co.uk
Because of the planetary physics of the Earth, agrofuels produced each year will always be inadequate to make up for the decline of liquid transportation fuels from petroleum accumulated over 460 million years or more
http://www.oecd.org/sd-roundtable/papersandpublications/40225820.pdf

www.aquaenviro.co.uk

www.aquaenviro.co.uk
http://www.r-e-a.net/pdf/member/10_REA_GP_Leaflet_FINAL.pdf
www.aquaenviro.co.uk
UK waste production

www.aquaenviro.co.uk
Energy recovery
Incineration
Recovery other than
energy recovery -
Except backfilling
Recovery other than
energy recovery -Backfilling
Deposit onto or into
land (landfill)
Land treatment
and release into water
bodies
Total
1,585 6,102 77,467 14,114 48,512 38,383 186,163
0.9% 3.3% 41.6% 7.6% 26.1% 20.6% 100.0%
2012 Waste treatment in the UK (`000 tonnes*)
*Sludges and dredging spoils have been reported or converted to dry weight
https://www.gov.uk/government/statistical-data-sets/env23-uk-waste-data-and-management#history

www.aquaenviro.co.uk
Final treatment methodTotal waste sent
to final treatment
Total waste that was recovered
Deposit onto or into land (landfill)
Chemical wastes 300,854 272,824 28,030
Industrial effluent sludges 27,084 14,143 12,941
Sludges & liquid wastes from waste treatment 91,654 441 91,213
Health care & biological wastes 211,839 107,012 104,828
Paper & cardboard wastes 6,434,466 6,430,362 4,104
Rubber wastes 150,699 148,861 1,838
Plastic wastes 2,594,006 2,478,158 115,848
Wood wastes 1,531,790 1,511,967 19,823
2012 Waste treatment in the UK (tonnes*) (1 of 2)
*Sludges and dredging spoils have been reported or converted to dry weight
https://www.gov.uk/government/statistical-data-sets/env23-uk-waste-data-and-management#history

www.aquaenviro.co.uk
Final treatment methodTotal waste sent
to final treatment
Total waste that was recovered
Deposit onto or into land (landfill)
Textile wastes 1,316,082 1,312,422 3,660
Animal & mixed food waste 1,346,942 1,257,432 89,511
Vegetal wastes 4,120,077 4,020,263 99,813
Animal faeces, urine & manure 308,429 305,760 2,669
Household & similar wastes 14,390,159 6,340,539 8,049,620
Mixed & undifferentiated materials 1,598,767 1,280,080 317,987
Sorting residues 9,089,563 819,219 8,270,344
Common sludges 949,301 947,511 1,790
2012 Waste treatment in the UK (tonnes*) (2 of 2)
https://www.gov.uk/government/statistical-data-sets/env23-uk-waste-data-and-management#history
*Sludges and dredging spoils have been reported or converted to dry weight

www.aquaenviro.co.uk
http://www.wrap.org.uk/content/estimates-waste-food-and-drink-supply-chain
Food waste Total ‘Preventable’
Household1 7.0 5.4
Hospitality and Food Services 0.90 0.70
Retail 0.25 0.25
Manufacturing 3.9 3.9
Farm ~3.0 unknown
Food waste in the UK (million tonnes*)
*Fresh weight
1Includes both avoidable and possibly avoidable food waste (items which some people may eat, some of the time, including potato peelings, bread crusts)

www.aquaenviro.co.uk
* Millions of tonnes (Data from the REA Gasification and Pyrolysis Group’s consultation response on the 2012 review of RO banding)
Year Arup (2010) Tolvik (2010) Eunomia (2011) SITA (2009/10)
2010 3.90 27.9 26.0 -
2020 7.80 23.0 24.0 25.0
2030 12.5 20.8 24.0 36.0
Post-recycling residual waste*

www.aquaenviro.co.uk
Livestock manures and slurries
Stock numbers Quantity (tonnes*)
Dairy cattle - 20,000,000
Beef cattle - 5,000,000
Broilers 110,374,000 2,097,000
Egg-laying hens 48,404,000 1,985,000
Turkeys (etc) 10,907,000 578,000
Pigs 4,510,000 3,608,000
Total 33,268,000
*Fresh weight

www.aquaenviro.co.uk
Sewage sludge
Sludge Re-used (tonnes*) Sludge Disposed (tonnes*)
Soil and Agriculture
Others Landfill Incineration Others
2008 1,241,639 90,845 10,882 185,890 1,523
2010 1,118,159 23,385 8,787 259,642 2,863
*Dry solids
https://www.gov.uk/government/uploads/system/uploads/attachment_data/file/69592/pb13811-waste-water-2012.pdf

www.aquaenviro.co.uk
Recycling vs Recovery
www.aquaenviro.co.uk
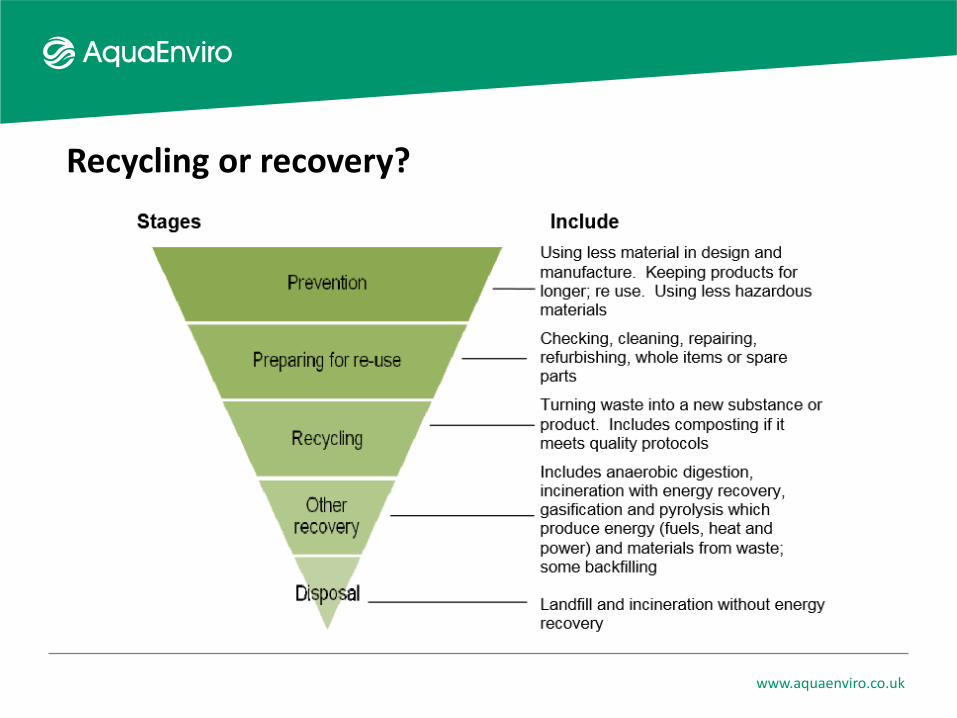
Recycling or recovery?

www.aquaenviro.co.uk
Recycling or recovery?

www.aquaenviro.co.uk
From the Waste Framework Directive:
‘recycling’ means any recovery operation by
which waste materials are reprocessed into
products, materials or substances whether
for the original or other purposes. It includes
the reprocessing of organic material but
does not include energy recovery and the
reprocessing into materials that are to be
used as fuels or for backfilling operations.
Recycling or recovery?

www.aquaenviro.co.uk
Recycling or recovery? Recycling targets
England Wales Scotland Northern Ireland
Currently as per WFD requirements (50% of household waste
by 2020)
Recycling, preparation for reuse
or composting of Local Authority
collected municipal waste:
58% by 2015/1664% by 2019/2070% by 2024/25
Recycling, preparation for reuse
or composting of Local Authority
collected household waste:
50% by 201360% by 202070% by 2025
Currently as per WFD requirements (50% of household waste
by 2020)

www.aquaenviro.co.uk
Recycling or recovery? Landfill diversion targets
• By 2010 reduce the biodegradable municipal waste landfilled to 75% of that produced in 1995
• By 2013 reduce the biodegradable municipal waste landfilled to 50% of that produced in 1995
• By 2020 reduce the biodegradable municipal waste landfilled to 35% of that produced in 1995

www.aquaenviro.co.uk
http://www.sepa.org.uk/media/162646/sepa-guidance-for-local-authorities-zwp.pdf

www.aquaenviro.co.uk
Potential barriers to market
www.aquaenviro.co.uk
Barriers to market
• Perception• Opacity• Legislation

www.aquaenviro.co.uk
In summary
• Thermal processes should form part of integrated waste management approaches
• Recycling requirements may limit the availability of specific waste streams – and this may change in the future
• The variety of processing and feedstock interactions can make it difficult to present the benefits
• Independent evidence is needed to demonstrate safety of non-fuel products from thermal processes