Thermal performance of properties prior to installation of CWI · Thermal transmittance of walls of...
111
Thermal transmittance of walls of dwellings before and after application of cavity wall insulation Prepared for: James Russill Energy Saving Trust March 2008 Report number 222077
Transcript of Thermal performance of properties prior to installation of CWI · Thermal transmittance of walls of...
Thermal transmittance of walls of dwellings before and after application of cavity wall insulation
Prepared for: James RussillEnergy Saving Trust
March 2008
Report number 222077


Thermal transmittance of walls of dwellings before and after application of insulation
Prepared by
Name Sean Doran Bernard Carr
Position Senior Consultant Consultant
Signature
Approved on behalf of BRE
Name Brian Anderson
Position Technical Director
Date
Signature
BRE ScotlandKelvin RoadEast KilbrideGlasgow, G75 0RZT +44 (0) 1355 576200F + 44 (0) 1355 [email protected]
This report is made on behalf of BRE. By receiving the report and acting on it, the client - or any third party relying on it - accepts that no individual is personally liable in contract, tort or breach of statutory duty (including negligence).
BRE Client report number 222077Commercial in confidence
© Building Research Establishment Ltd 2008

Thermal transmittance of walls of dwellings before and after application of insulation
BRE Client report number 222077Commercial in confidence
© Building Research Establishment Ltd 2008

Executive Summary
This report describes the results of in situ measurements carried out to determine the as built thermal performance of a sample of seventy dwellings during 2005 and 2006. The dwellings in the sample had all been targeted for cavity wall insulation under the Warm Front and related programmes. For most dwellings thermal performance was tested both before and after the application of insulation.
The project was funded by Defra and commissioned by the Energy Saving Trust. It was carried out in collaboration with organisations administering the Warm Front and related Programmes. A number of dwellings were identified by the Warm Front teams and their addresses, together with information about each, were relayed to BRE for inclusion in the project. BRE selected a representative sub-sample from that list of dwellings for inclusion in the project, covering a range of age and type, and approached the occupiers to carry out in situ thermal performance research on their properties. In selecting the dwellings it was aimed to include a balance between dwellings erected before 1978 and dwellings erected after 1978. In practice, however, the sample of dwellings available was weighted towards pre-1978 rather than post-1978 dwellings. It was also aimed to include a mixture of built forms, including detached and semi-detached dwellings and bungalows.
For each property, thermographic imaging, wall cavity inspections and in-situ U-value measurements were to be carried out both before and after application of cavity wall insulation. In the end, however, this was not always possible and there are some instances, amounting to 10 out of the total of 70 properties, where a dwelling was visited either before or after installation of insulation, but not both. There were a number of reasons why it was not possible to carry out measurements both before and after application of insulation and these are discussed in this report. The fact that most of the dwellings were subject to U-value measurements both before and after insulation was advantageous insofar as it helped to eliminate most of the systematic errors which would have been present had the measurements only been taken after the application of insulation.
The thermographic imaging indicated that surface temperatures at lintels remain high after application of insulation, suggesting strong thermal bridging at lintels. In many cases there could be thermal bridging at junctions between walls and floors. There were were also, in some cases, areas in the cavities where insulation was either of low compactness1 or had voids which were large enough to be detectable by a thermal imaging camera.
For each dwelling, heat flow datasets were collected over two-week periods, using heat flux meters, in order to determine the U-values both before and after the application of insulation. The heat flux meters were thermopile-based, approximately 80 mm in diameter and approximately 5 mm thick. They were pressure-fixed against the wall being tested throughout the period of monitoring. In several cases there was an opportunity to record heat flow over periods of more than two weeks in order to obtain a better indication of the errors arising from random fluctuations in temperature and sunlight, and this additional data proved to be helpful in assessing the accuracy of the measurements. The measured U-values are presented alongside the calculated U-values to facilitate comparison.
Although there were generally two heat flow measurements per dwelling, some of the measurements were considered to be of reduced reliability for a variety of reasons and of the measurements that were carried out, about 100 were considered suitable for inclusion in the final analysis.
1 Based upon visual endoscopic inspection

Daylight (or flash) photography was carried out in order to assist in the interpretation of the data, particularly the thermal imaging data, and photographs are provided in the appendices. The appendices also contain other useful information about the properties. Further information can be obtained from the spreadsheet which accompanies this report.
Following application of cavity wall insulation some of the installers were contacted and structured interviews were held between the installers and BRE staff. Where possible, the actual persons carrying out the insulation were interviewed, and the findings are summarised in this report. In general, quality control procedures were found to be of a good standard. Cavity drill holes were also examined and in general the spacing of cavity drill holes was in accordance with guidance documentation.
Through this work, a better understanding of the effectiveness of cavity wall insulation, as currently applied in existing dwellings, has been obtained, together with an estimation of the benefit in practice of cavity wall insulation. It can be said with certainty that the application of cavity wall insulation helps to improve the energy efficiency of dwellings. It is clear, however, that for many dwellings the coverage of cavity wall insulation is not complete partly as a result of the nature of wall constructions, including lintels, tile-hung areas, adventitious voids and areas in and around conservatories.
Recommendations are given on how methods of applying insulation might be improved with a view to making installations more effective. It is also clear that the actual realised improvements to U-values are in many cases less than would be expected on the basis of conventional methods of calculating U-values, even when the actual measured cavity widths are taken into account. Moreover it was found, contrary to expectations, that there was no discernible correlation between the benefits obtained from cavity insulation and the widths of the cavities being filled. Indications are that the improvement in thermal resistance is, on average, around 38% less than that which would be expected on the basis of measured cavity width, and low insulation compactness might account for some of this difference. It was also noted that in the majority of cases the measured improvement in thermal resistance was less than the improvement that would be expected on the basis of the measured cavity width, and this is true not only for the sample of houses as a whole but also of the modal class.
It is not considered necessary to carry out further U-value measurements in the immediate future. It is, however, recommended to carry out research within the next few years in order to find ways of improving the effectiveness of cavity wall insulation and monitoring such improvements. This report gives some recommendations regarding further development of approaches to insulating cavity walls.
It is also suggested that in considering the realisable benefits of cavity wall insulation to existing housing, and the fact that actual benefits tend to fall short of theoretical benefits, it should be borne in mind that thermal performance shortfall is by no means restricted to this kind of wall construction. Indeed there are several studies which have shown that insulation performs less well in practice than in theory in many, if not most types of wall construction and a number of these studies are discussed in this report. Furthermore, the shortfall identified in the case of cavity fill to existing housing is not considered atypical when compared with “new-build” constructions.
Appendices A1 to A70 to this report give thermal images, daylight photographs and other relevant observations for the properties. The information in those appendices is intended to be supplementary but non-exhaustive.

Contents
Factors influencing the performance of thermal insulation 1Factors influencing the performance of thermal insulation 1Factors influencing the performance of thermal insulation 1Previous research involving in-situ U-value measurement 3Previous research involving in-situ U-value measurement 3Previous research involving in-situ U-value measurement 3Interviews of the cavity insulation installers 11Interviews of the cavity insulation installers 11Interviews of the cavity insulation installers 11Monitoring of the dwellings 14Monitoring of the dwellings 14Monitoring of the dwellings 14Wall constructions 16Wall constructions 16Wall constructions 16The heat flux measurements 18The heat flux measurements 18The heat flux measurements 18Results of the U-value measurements 19Results of the U-value measurements 19Results of the U-value measurements 19Thermal images and daylight photographs 36Thermal images and daylight photographs 36Thermal images and daylight photographs 36Estimating the fraction of wall area covered by the insulation 36Estimating the fraction of wall area covered by the insulation 36Estimating the fraction of wall area covered by the insulation 36Issues identified and proposed refinements 40Issues identified and proposed refinements 40Issues identified and proposed refinements 40Analysis of the heat flux measurement data 41Analysis of the heat flux measurement data 41Analysis of the heat flux measurement data 41Tests on dataloggers 41Tests on dataloggers 41Tests on dataloggers 41Hole drill patterns 41Hole drill patterns 41Hole drill patterns 41Influence of sunlight upon the measurements 43Influence of sunlight upon the measurements 43Influence of sunlight upon the measurements 43Thermal bridging arising from incomplete insulation 44Thermal bridging arising from incomplete insulation 44Thermal bridging arising from incomplete insulation 44

Weather conditions and resulting U-values 45Weather conditions and resulting U-values 45Weather conditions and resulting U-values 45Improvements to living conditions arising from the application of insulation 47Improvements to living conditions arising from the application of insulation 47Improvements to living conditions arising from the application of insulation 47Adventitious air movement resulting from poorly fitting insulation 54Adventitious air movement resulting from poorly fitting insulation 54Adventitious air movement resulting from poorly fitting insulation 54Gaps or holes in an insulating layer. 56Gaps or holes in an insulating layer. 56Gaps or holes in an insulating layer. 56Continuous air leakage paths in walls 57Continuous air leakage paths in walls 57Continuous air leakage paths in walls 57General workmanship control issues 57General workmanship control issues 57General workmanship control issues 57Monitoring results 59Monitoring results 59Monitoring results 59Instrumentation issues 60Instrumentation issues 60Instrumentation issues 60Possible future measures relating to the application of insulation 60Possible future measures relating to the application of insulation 60Possible future measures relating to the application of insulation 60Other issues and suggestions for future energy-related work 61Other issues and suggestions for future energy-related work 61Other issues and suggestions for future energy-related work 611. Errors in the calibrations of the heat flux meters 241. Errors in the calibrations of the heat flux meters 241. Errors in the calibrations of the heat flux meters 242. Errors in the temperature measurement 292. Errors in the temperature measurement 292. Errors in the temperature measurement 293. Temperature variations within the space (allowing for height and distance from HFM)293. Temperature variations within the space (allowing for height and distance from HFM)293. Temperature variations within the space (allowing for height and distance from HFM)294. Accuracy of the data logging system. 294. Accuracy of the data logging system. 294. Accuracy of the data logging system. 295. Thermal contact between the heat flux meter and the surface 295. Thermal contact between the heat flux meter and the surface 295. Thermal contact between the heat flux meter and the surface 296. Operational error due to the shape of the HFM. (Trisco) 306. Operational error due to the shape of the HFM. (Trisco) 30

6. Operational error due to the shape of the HFM. (Trisco) 307. Time-dependent variations 307. Time-dependent variations 307. Time-dependent variations 308. Differences between air and radiant temperatures 318. Differences between air and radiant temperatures 318. Differences between air and radiant temperatures 319. Measurement of the widths of the cavities 319. Measurement of the widths of the cavities 319. Measurement of the widths of the cavities 3110. Dislodging of the heat flux meters 3110. Dislodging of the heat flux meters 3110. Dislodging of the heat flux meters 3111. Possible mis-identification of blockwork density 3211. Possible mis-identification of blockwork density 3211. Possible mis-identification of blockwork density 3212. Possible mis-identification of plaster 3212. Possible mis-identification of plaster 3212. Possible mis-identification of plaster 3213. Appropriate positioning of the heat flux meters 3213. Appropriate positioning of the heat flux meters 3213. Appropriate positioning of the heat flux meters 3214. Analysis of weightings and errors and weighted arithmetic means 3214. Analysis of weightings and errors and weighted arithmetic means 3214. Analysis of weightings and errors and weighted arithmetic means 3215. Application of errors 3315. Application of errors 3315. Application of errors 33


Introduction
BRE has been commissioned by the Energy Saving Trust, funded by Defra, to assess the thermal performance of a sample of dwellings in order to determine how well cavity wall insulation is performing in practice. To achieve this, thermographic surveys, heat flow measurements and cavity wall inspections were carried out during 2005 and early 2006 on a sample of dwellings.
This report provides information on::-
1. Measurement of U-values (thermal transmittance values) using the methods in ISO 9869 and comparisons between measured and expected U-values.
2. Interpretation of qualitative information, involving infrared thermography, endoscopic inspection of cavities and collection of various data about the properties.
The Energy Efficiency Commitment, Warm Front and Warm Deal programmes are leading to an increase in the energy efficiency of the United Kingdom housing stock, giving reduced heating bills for occupiers, reduced carbon emissions to the environment and increased comfort for occupiers. Cavity wall insulation represents a major part of the above programmes and is considered to be one of the most effective ways of improving the energy efficiency of existing dwellings.
Factors influencing the performance of thermal insulation
The effectiveness of a dwelling in conserving energy is dependent upon the effectiveness of its walls, floor, roof, windows and doors in reducing the rate of heat escaping from the internal environment of the dwelling to the outside. The ability of a wall, floor, roof, window or door to impede heat loss from a dwelling is described in terms of its thermal transmittance (U-value), which is expressed as the transfer of heat in watts per square metre of area per degree difference in temperature. A wall, roof or floor that is well insulated will have a low U-value whereas one which is poorly insulated will have a high U-value.
The calculation procedure described in BS EN ISO 6946 is the main standard for calculating U-values of walls. It is largely based on “ideal” constructions, although limited provision is made for imperfections in the structure, such as small air gaps around the insulation. The standard also allows for the thermal conductivities of construction materials, geometrical effects and some types of air voids, but does not deal with moisture-related phenomena, adventitious air movement or factors that may be influenced by workmanship or performance of machinery. Furthermore, certain types of construction are more vulnerable to these processes than others, and there are a number of factors, such as cavity width, robustness of insulation materials, the use of air/vapour barriers, and the use of rendering or moisture control layers which could potentially affect the U-value of a building element over time. Some research[Ref 18] has also been carried out by IEA Annex 32 on the impact of building techniques which has shown that certain construction defects carry a risk not only of causing higher U-values but also of the onset of major problems such as fungal defacement, rain penetration, reduction in comfort and interstitial condensation. Further studies[Ref 19]
on the impacts of quality-related problems have shown that U-values can in some cases be raised considerably as a result of these factors.

It is thought that the main benefits of reduced U-values, which ensue as a result of the application of cavity wall insulation, are:
1. More comfortable indoor environments with reduced risk of hypothermia, safer indoor environments
2. Reduced energy consumption and reduction in associated costs
3. The possibility of reduced sizing of the heating system when the heating system is subsequently replaced.
The main environmental benefits are often considered to be:
1. Less damage to the environment
2. Lower reliance on fossil fuel stocks
3. Reduced carbon dioxide (CO2) emissions
The precise effectiveness of cavity wall insulation depends not only upon the theoretical properties of the insulating material but depends also on the manner of installation and on the environmental conditions which the insulation is subjected to.
The U-value of an insulated cavity wall can be influenced by several factors, including the following:
[1] Thickness of the insulation.
[2] Thermal conductivity of the insulation (which depends upon the material used, its density and the environmental conditions to which the material is subject).
[3] The presence of any air gaps or voids in the insulation and the distribution of these.
[4] The presence of any areas in the insulation where the insulation is of lower than normal compactness or where the material is inhomogeneous2.
[5] Air movement through and around the insulation (which in turn is likely to be influenced by convection, external wind conditions and the air-tightness of other parts of the wall construction).
[6] Thermal bridging of the insulation caused by wall ties, mortar snots or other obstructions within the cavity.
[7] The grade or density of the concrete blocks forming the inner leaf of the cavity wall.
Some of the above factors may in turn be influenced by the following factors:
[1] The condition of the insulant, including presence of moisture and, in the case of insulating beads, the composition of the binding agent.
[2] The spacing of the drill holes made by the installers of the cavity wall insulation. Too wide a spacing could potentially lead to air voids in the insulation layer.
[3] The settings in the machinery used to blow or inject the insulation into the cavity and accuracy of machinery calibration.
2 This is sometimes loosely referred to as 'density'

[4] The condition and cleanliness of the cavity and presence of obstructions (e.g. rubble or dpc sheeting) prior to the installation of the cavity wall insulation.
[5] The accuracy of the estimation of the amount of insulation material needed.
Previous research involving in-situ U-value measurementU-value measurement on new dwellings
Research carried out by BRE between 1998 and 2000[Ref 1] showed that true (measured) U-values were often higher than expected, even when thermal bridging and wall ties were taken into account. The difference depended upon the type of construction. The differences between measured U-values[Ref 4] and expected U-values[Ref 5] were found to be as follows:
1. For internally insulated cavity walls, 0.05 W/m²K (approx.)
2. For fully filled cavity walls, 0.05 W/m²K (approx.)
3. For partially filled cavity walls, 0.10 W/m²K (approx.)
4. For timber frame walls, agreement between measured U-values and calculated U-values appears to be close, but accurate cutting of mineral wool quilt at horizontal timbers is likely to be crucial to the overall energy efficiency.
5. For sloping ceilings with insulation in the slope of the ceiling, actual realised U-values can be very high in some cases
Recent in-situ U-value measurements on existing dwellings
In 2004, AEA Technology carried out, for the Energy Saving Trust, a study[Ref 17] of 41 dwellings receiving cavity wall insulation and found that in practice U-values were significantly higher than would be expected on the basis of standard U-value calculations. The AEA study was extensively peer-reviewed and CIGA, George Henderson and BRE were involved in that review.
The review noted some recommended changes to the analysis and initial drafts of their report raised some inconsistencies which were subsequently rectified. In particular it appeared that heat flow readings were initially combined in an incorrect manner (although this in itself did not, of course, invalidate their field measurements). There was also a concern that it was unclear whether insulation might have been missing at some of the measurement points.
It was noted in the AEA study that the measured U-values were, on average, 23% higher than would be expected on the basis of conventional methods of calculating U-values. However the peak (modal point) of the distribution occurred where the measured U-value was in reasonable agreement with the calculated U-value, indicating that there was a significant number of instances where the insulation was performing satisfactorily. There were, however, a large number of cases where the measured U-value was significantly higher than expected.
Thermographic imaging of the cavity walls indicated that about 40% of the houses showed defects in the installation leading to higher heat losses, and AEA estimated that the area of coverage was equivalent to 10% or more unfilled cavity.

Theoretically, the U-value of an insulated cavity wall would be expected to be less for wider cavities than for narrow cavities, however, in that study, no clear correlation between the measured U-values and the measured cavity widths was found in practice.
Although that study included a range of house age groups, ranging from 1940 to 1970, there was no significant correlation between the age of the house and the U-value of the walls, although the researchers did consider a number of plausible reasons why this might be the case.
In conclusion it was suggested that wind speed might have influenced the U-values to some extent, making correlations more difficult to discern.
The breadth of the distribution of U-value results and the evidence gained from thermographic imaging both suggested a need for greater quality control at the time of installation. However it was concluded that there are other influences apart from workmanship that can influence performance of cavity insulation in practice.
Recent research into the effect of discontinuity in insulation
In 2004, thermographic testing and visual inspection were carried out in a sample of relatively new houses in the City of Aberdeen to find out why houses were losing more heat than expected and why occupiers were finding their houses difficult to heat[Ref 16]. As a result, poorly-fitted loft insulation with gaps around roof trusses and pipework, for example, were found to be causing high levels of heat loss. The thermal images from that project indicated that the quality of installation of insulation can be very important and that areas where insulation is poorly fitted can incur high levels of heat loss. The thermal images from that project also showed that insulation which looks only slightly untidy can still have major consequences for thermal performance in practice.

Effect of insulation density
The thermal conductivity of mineral wool is know to vary with density. For densities lower than the typical installation density of around 25 kg/m3, the thermal conductivity is higher, leading to higher U-values and therefore poorer insulation performance. On the basis of published figures[Ref 21] mineral wool of low density will conduct significantly more heat than mineral wool with a density that is close to optimum. Density of insulation, therefore, is an important determinant of thermal performance in practice. Also notable is the fact that the deterioration in conductivity is only slight for densities a little higher than the optimum suggesting that the use of higher densities of cavity fill would only have a slight detrimental effect upon thermal performance. The following figures illustrate the relationship between conductivity and density for one particular type of mineral wool.
Density, kg/m 3 Conductivity, W/m · K
10 0.042
20 0.035
30 0.033
40 0.032
50 0.031
100 0.032
150 0.033
It is notable that the relationship between density and conductivity will not always follow the table above, depending upon the exact nature of the material, however it is true that for mineral wools in general, including glasswools, there is an optimum density and that the conductivity is higher for densities lower than the optimum.

The present project
The overall aim of the present project has been to investigate how well cavity insulation performs in practice and to develop a better understanding of those factors which affect U-values, with a particular focus on housing which is being improved under programmes such as Warm Front.
U-values of walls were measured both before and after application of cavity wall insulation using circular Hukseflux heat flow meters which were each 5 mm thick and 80 mm in diameter. To ensure that the HFM's were located at appropriate representative positions thermal imaging cameras were used. The purpose of the thermal imaging cameras here was to ascertain whether the internal surface temperature of the wall was uniform in the room where the U-value measurement was to be carried out. Areas of wall which showed non-uniform surface temperatures were avoided.
Owing to the cost of purchasing equipment for U-value measurement it would have been too expensive to carry out all of the measurements simultaneously. It was therefore decided at an early stage to divide the dwellings into two batches of broadly equal numbers and the equipment which was used for testing the first batch of houses was re-used for testing the second batch. During the course of the project the number of properties was revised slightly, and this possibility was anticipated and allowed for back at the invitation to tender stage prior to the project being carried out.
In order to support the project, the Warm Front teams contacted households which were due to receive cavity wall insulation in order to inform them of the research project and to ask them whether they would be willing to participate in it. The selection of houses was in most respects random, however the houses were clustered according to postcode in order to reduce travel costs. Occupiers were informed of how the project might affect them and were told of the compensatory payment that they would receive. The Warm Front team then compiled a list of the households willing to participate and this list was forwarded to BRE. The Warm Front team also provided information about the age and built form of each dwelling.
In order to assist BRE with this study, two of the BRE Centres of Excellence were involved in the project, namely the University of Strathclyde and the University of Cardiff. The properties, which were divided into four geographical areas (known as Lot 1, Lot 2, Lot 3 and Lot 4) were visited by teams from those two universities together with a team from BRE (Garston) and a team from BRE Scotland. The four teams met for a meeting and training day before visiting the properties in order to ensure that each team was aware of how to install the heat flux meters and dataloggers as well as to discuss how best to carry out the measurements. John Hart of BRE also attended the training day and spent some time with the teams discussing thermography techniques and giving each of the teams some hands-on experience of using a thermal imaging camera.
At the outset of the project the characteristics of the houses in the sample were examined with a view to obtaining a representative sub-sample. The intention was that the sub-sample would lead to a statistically meaningful result and that it would provide a reasonable reflection of that part of the UK housing stock which could potentially receive cavity wall insulation in the future. To obtain a suitable statistical sample of dwellings, BRE assigned priority ratings against each dwelling in the list and the teams agreed to approach the houses which had been labelled as high priority before approaching the houses which had been labelled low priority. The priority ratings were set according to the age and built form of each dwelling, taking into

consideration the needs of the project and the national mix of housing. The list for the first batch of properties, along with their priority ratings, were distributed at a meeting on the 2nd of March 2005 to the four teams carrying out the monitoring. A second batch of houses were prioritised in a similar way for visiting in December 2005.
The first batch of houses were visited in March 2005 (prior to insulation) and revisited in November 2005 (after insulation). A second batch were visited in December 2006 (prior to insulation) and revisited around February 2006 (after insulation). The two batches of properties were of similar sizes (approximately 35 houses in each) and the equipment used in the first batch of houses was used for the second batch.
Initially it was intended that the housing sample should include a significant number of mid-terraced housing, however it transpired that relatively few mid-terraced dwellings are given cavity wall insulation and it was not possible for the Warm Front team to source many such dwellings.
The four teams who were to visit the properties were assigned houses in specific areas within Britain to visit both before and after application of cavity wall insulation. The properties were assigned with a view to minimising travel and were located in the following areas:-
Lot Team covering the Lot Area of coverage and times of measurements
1 ESRU, Strathclyde University
Dwellings in Glasgow, Edinburgh and Ratho (March 2005 & November 2005)
2 BRE Scotland Dwellings in Bradford, Leeds, Pudsey, Gomersal and Huddersfield (March 2005 & November 2005)
3 Cardiff University Dwellings in Birmingham, Bromsgrove, Halesowen, Stourport-on-Severn and Rednal(March 2005 & November 2005)
4 BRE (Garston) Dwellings in Epping, Essex, Chelmsford, Nazeing, Waltham Abbey, Hockley, Rochford and Great Wakering (March 2005 & November 2005)
1 ESRU, Strathclyde University
Dwellings in Glasgow, Milngavie, Cumbernauld, Balfron and Balloch (December 2005 & February 2006)
2 BRE Scotland Dwellings in Manchester, Cheshire, Wigan and Rainhill (December 2005 & February 2006)
3 Cardiff University Dwellings in Nottingham and Derbyshire(December 2005 & February 2006)
4 BRE (Garston) Dwellings in Gloucestershire, Milton Keynes, Oxon and Basingstoke (December 2005 & February 2006)
The households identified by Warm Front were contacted by telephone and, where occupiers were still willing, dates were arranged for visiting the properties with a view to carrying out thermographic surveys, inspecting cavities and installing equipment for measuring heat transfer. It was found that some of the

properties were unavailable or unsuitable for the infrared thermography and measurement of heat transfer for various reasons, including the following:-
1. Some occupiers changed their mind about participating and decided that they were unable or unwilling to take part in the project.
2. Some dwellings were found to have already received cavity wall insulation under the Warm Front or Warm Deal programmes.
3. Some insulation installations were aborted at a late stage due to them being deemed by the cavity wall insulation installers to be unsuitable for cavity wall insulation, despite them being earmarked by the initial surveyor. The main reasons for late aborting appeared to be cracked brickwork, presence of tying bricks in the cavity, other obstructions in the cavity or cavites being too narrow for filling. In some cases the late cancellations led to occupiers expressing dissatisfaction.
4. Some dwellings were found to have had cavity wall insulation installed at an earlier date without the prior knowledge either of the occupiers or of the surveyors who had earmarked the properties and the insulation was only discovered when the cavity was inspected as part of the work being done in this project.
5. Some occupiers requested at a late stage that particular wall facades were not to be insulated.
Once a dwelling had been selected and consent from the occupiers confirmed, the properties were visited with a view to installing two heat flux meters in each property. Measurements were carried out on two different locations on the wall in order to assess the repeatability of the measurement and to provide a safeguard against equipment failure. Appendix G shows pictures of a heat flux meter affixed to a wall.
Immediately prior to installing the heat flux meter for the first time thermal imaging and borescopic examination of the cavity were carried out by the research teams. The purpose of these examinations was to ensure that the proposed positioning of the heat flux meter was representative and to ensure that there were no unusual features regarding the condition of the cavity adjacent to the proposed measurement point.
Some dwellings presented difficulties or uncertainties for U-value measurement and reasons for difficulties arising included the following:-
1. In some dwellings there were relatively few locations in the dwelling which were considered suitable for U-value measurement, due to the presence of heating appliances, draughts, safety-related issues and/or nearness to windows, doors or partition walls.
2 At the locations identified as being otherwise suitable, wallpaper or wall finishings were embossed, tiled or ‘artexed’, leading to possible concerns about achieving good thermal contact between the heat flux meter and the wall surface.
3. In some dwellings the only suitable walls were south-facing walls or walls that were nearly south-facing, leading to uncertainties about the effects of sunlight upon the instruments.
4. In some dwellings the ceiling coving was very deep or the ceiling was sloping. This made it difficult or impossible to fit the teleprops which were needed to support the heat flux meters against the walls.
5. Occupiers in some dwellings imposed tight restrictions about where the heat flux meters could be sited and in a small number of cases the occupiers were found to tamper with or damage the equipment.

Out of the dwellings supplied, a sub-sample of 70 dwellings were monitored. The dwellings which were monitored are shown in Table 1. The priority level in the final column of the table was used to help the teams select the most appropriate dwellings for inclusion in the study, and was based on factors such as age and built form.
Ref: Customer location Year of Build
Property Type (e.g. detached)
Area 1st visit (pre-CWI)
Insulation 2nd visit (post-CWI)
Priority level
1 Epping 1958 Detached Bungalow Lot 4 Mar 05 12 May 05 Nov 05 2
2 Roydon 1945 Semi Detached Lot 4 Mar 05 26 Apr 05 Nov 05 2
3 Chelmsford 1955 Semi Detached Lot 4 Mar 05 10 May 05 Nov 05 2
4 Gloucestershire 1982-90 Detached Lot 4 Dec 05 26 Jan 06 Feb 06 1
5 Nazeing 1955 Detached Lot 4 Mar 05 18 Apr 05 Nov 05 2
6 Waltham Abbey 1965 Semi Detached Lot 4 Mar 05 11 May 05 Nov 05 3
7 Hockley 1965 Detached Lot 4 Mar 05 20 Jun 05 Nov 05 3
8 Hockley 1955 Semi Detached Lot 4 Mar 05 5 May 05 Nov 05 2
9 Oxon 1950-65 Semi Detached Lot 4 Dec 05 20 Feb 06 Feb 06 3
10 Rochford 1955 Semi Detached Lot 4 Mar 05 7 Jun 05 Nov 05 3
11 Milton Keynes 1982-90 Detached Lot 4 Dec 05 6 Feb 06 Feb 06 1
12 Great Wakering 1960 Semi Detached Lot 4 Mar 05 29 Apr 05 Nov 05 3
13 Milton Keynes 1966-74 Detached Lot 4 Dec 05 15 Feb 06 Feb 06 2
14 Gloucestershire 1950-65 Detached Lot 4 Dec 05 8 Jan 06 Feb 06 2
15 Gomersal 1945 Semi Detached Lot 2 Mar 05 29 Jun 05 Nov 05 3
16 Huddersfield 1965 Semi Detached Lot 2 Mar 05 22 Jul 05 Nov 05 2
17 Bradford 1935 Semi Detached Lot 2 Mar 05 (not filled) (not filled) 3
18 Leeds 1974 Semi Detached Lot 2 Mar 05 (not filled) (not filled) 2
19 Manchester 1950-69 Semi Detached Lot 2 Dec 05 12 Jan 06 Feb 06 3
20 Pudsey 1955 Semi Detached Lot 2 Mar 05 30 Mar 05 Nov 05 2
21 Bradford 1960 Semi Detached Lot 2 Mar 05 29 Jun 05 Nov 05 3
22 Bradford 1955 Semi Detached Lot 2 Mar 05 (not filled) (not filled) 2
23 Bradford 1971 Detached Bungalow Lot 2 Mar 05 (not filled) (not filled) 2
24 Rainhill 1980 Detached Lot 2 Dec 05 13 Feb 06 Mar 06 2
25 Cumbernauld 1978 Mid-terrace Lot 1 Dec 05 2 Dec 05 Feb 06 1
26 Glasgow 1977-1990 Detached Lot 1 Mar 05 12 Jul 05 Nov 05 1
27 Edinburgh 1977-1990 Detached Lot 1 Mar 05 - - 1
28 Edinburgh 1977-1990 Semi Detached Lot 1 Mar 05 21 Jul 05 Nov 05 1
29 Ratho 1977-1990 Detached Lot 1 Mar 05 4 May 05 Nov 05 1
30 Balfron 1968 Detached Lot 1 Dec 05 31 Jan 06 Feb 06 1
31 Glasgow 1900-1929 Detached Lot 1 Mar 05 1 Jun 05 Nov 05 3
32 Glasgow 1930-1949 Detached Lot 1 Mar 05 26 Apr 05 Nov 05 3
33 Glasgow 1970 Semi Detached Lot 1 Dec 05 11 Jan 06 Feb 06 1
34 Glasgow 1967 End terrace Lot 1 Dec 05 23 Dec 05 Feb 06 1
35 Edinburgh 1950-1966 Semi Detached Lot 1 Mar 05 26 May 05 Nov 05 2

Ref: Customer location Year of Build
Property Type (e.g. detached)
Area 1st visit (pre-CWI)
Insulation 2nd visit (post-CWI)
Priority level
36 Milngavie 1970 Detached Lot 1 Dec 05 18 Nov 05 Feb 06 1
37 Balloch 1955 Semi Detached Lot 1 Dec 05 24 Feb 06 Mar 06 1
38 Glasgow 1970 Semi Detached Lot 1 Dec 05 5 Dec 05 Feb 06 1
39 Glasgow 1950-1966 Semi Detached Lot 1 Mar 05 6 Apr 05 Nov 05 2
40 Edinburgh 1966-1976 Semi Detached Lot 1 Mar 05 4 Aug 05 Nov 05 2
41 Halesowen 1958 Semi Detached Lot 3 Mar 05 18 Jul 05 Nov 05 3
42 Bromsgrove 1990 Semi Detached Lot 3 Mar 05 6 Apr 05 Nov 05 1
43 Birmingham 1950-65 Semi Detached Lot 3 Dec 05 24 Jan 06 Feb 06 3
44 Stourport on Severn 1969 Semi Detached Lot 3 Mar 05 27 Apr 05 Nov 05 3
45 Halesowen 1979 Semi Detached Lot 3 Mar 05 16 Mar 05 Nov 05 1
46 Birmingham 1975-81 Detached Lot 3 Dec 05 5 Jan 06 Feb 06 1
47 Rednal 1955 Semi Detached Lot 3 Mar 05 4 Apr 05 Nov 05 3
48 Nottingham 1950-65 Detached Lot 3 Dec 05 (not filled) (not filled) 2
49 Bromsgrove 1965 Semi Detached Lot 3 Mar 05 11 Jul 05 Nov 05 3
50 Birrmingham 1965-1976 Semi Detached Lot 3 Mar 05 2 Apr 05 Nov 05 3
51 Birmingham 1960-1970 Semi Detached Lot 3 Mar 05 10 Jun 05 Nov 05 3
52 Birmingham 1950-1966 Detached Lot 3 Mar 05 15 Apr 05 Nov 05 2
53 Derbyshire 1975-81 Detached Lot 3 Dec 05 15 Feb 06 Feb 06 1
54 Derbyshire 1930-49 Detached Lot 3 Dec 05 17 Feb 06 Feb 06 2
55 Nottingham 1950-65 Detached Lot 3 Dec 05 27 Jan 06 Feb 06 2
56 Basingstoke 1966-74 Semi Detached Lot 4 Dec 05 12 Jan 06 Feb 06 3
57 Wintney 1966-74 Semi Detached Lot 4 Dec 05 13 Jan 06 Feb 06 3
58 Basingstoke 1975-81 Detached Lot 4 Dec 05 12 Jan 06 Feb 06 1
59 Gloucestershire 1950-69 Semi Detached Lot 4 Dec 05 16 Feb 06 Feb 06 3
60 Glasgow 1965 Semi Detached Lot 1 Dec 05 7 Nov 05 Feb 06 1
61 Hale 1950-69 Semi Detached Lot 2 Dec 05 10 Feb 06 Feb 06 3
62 Mancheser 1938 End Terrace Lot 2 (filled) 21 Dec 00 Dec 05 2
63 Manchester 1940 Semi Detached Lot 2 Dec 05 25 Feb 06 Mar 06 3
64 Rainhill 1950-65 Detached Bungalow Lot 2 (filled) no record Dec 05 2
65 Wigan 1989 Semi Detached Lot 2 (filled) no record Dec 05 3
66 Rainhill 1962 Semi Detached Lot 2 (filled) 24 Jan 06 Feb 06 3
67 Manchester 1982-90 Detached Lot 2 Dec 05 4 Feb 06 Feb 06 1
68 Wigan 1960 Semi Detached Lot 2 Dec 05 2 Feb 06 Feb 06 3
69 Nottingham 1975-81 Detached Lot 3 Dec 05 5 Jan 06 Feb 06 1
70 Derbyshire 1930-49 Detached Lot 3 Dec 05 24 Jan 06 Feb 06 2
Table 1: A list of the properties included in the study, shaded according to the Lot in which the property is located

Interviews of the cavity insulation installers
Following the application of cavity wall insulation several installers were contacted and interviewed by BRE staff during the autumn of 2005. As part of this process BRE developed a structured interview form to be used as the basis of the face-to-face interviews. Information was collected at the interviews and the results of the interviews were reported to EST. The installers were generally helpful and willing to participate in the interview and in many cases they expressed a keen interest in the research being carried out.
Six cavity wall insulation installers were interviewed in order to obtain a better understanding of the cavity wall insulation (CWI) approaches taken. The six selected contractors between them covered 17 of the dwellings in the study.
The questionnaires and methods of survey were agreed with the EST Contract Manager and Data-analysis contractor prior to the interviews being carried out. The approach used was to compile a questionnaire for collecting information from the cavity wall installers in order to determine the installers' understanding and compliance with relevant standards, good practice guides, procedures and general issues relating to CWI installations.
The property type, cavity thickness and the type of insulation were obtained extracted from the installer’s records and compared with what was found on site. This was used as a way of assessing the completeness of the installation.
The conclusion from the interviews and examination of installer records was that quality control is at a high level compared to other sectors of the building industry. The general high standards indicated by the interviews matched fairly well the observations at the houses, with holes drilled at regular intervals and repaired carefully and to the satisfaction of the occupiers. It also became evident during the interviews that there are a number of quality assurance procedures in place demonstrating that the quality controls have improved compared with installations which were carried out in previous decades.
Installer number
Installer name Number of properties
Technicians interviewed
Comment
1 Everwarm Services Limited 1 1
2 McSence Heatwise Limited 3 1
3 Jack Frost Services Limited 2 2
4 KHI Limited 3 3 Records not provided
5 West Anglia Insulation Ltd 5 1 Records not provided
6 Castlepoint Insulation Ltd 3 2
TOTAL 17 10

As a result of the interviews quality control was found to be at a level that is high compared to other sectors of the building industry and technicians were found to be quite knowledgeable about the issues and many of the interviewees were able to offer useful insights. While the majority installers used glass fibre or rock fibre fill, one company (namely Jack Frost Insulation) used expanded polystyrene beads. The general high standards indicated by the interviews matched fairly well the observations at the houses, with holes drilled at regular intervals and repaired carefully and to the satisfaction of the occupiers.
It became evident during the interviews that there are a number of quality assurance procedures in place, amounting to up to three tiers of checks. Of those interviewed all of the technicians received extensive BBA training. The interviewees indicated that ongoing quality control inspection from BBA, which is routinely carried out on a sub-sample of their CWI installations, is also having a beneficial effect on the quality of installations. The managing agents for Government-funded CWI programmes (e.g. Warm Deal, Warm Front) also have their own quality assurance systems in place and routinely carry out spot checks on installations. (This was the case for EAGA). Fuel utilities, who are responsible for EEC schemes, also have their own quality assurance systems in place. This includes site quality checks on a sub-sample of installations.
The Cavity Insulation Guarantee Agency (CIGA) is an independent agency provides independent 25 year Guarantee covering CWI all the CWI installers are members of CIGA. Once the CWI is installed the installer applies to CIGA for a Guarantee, and a certificate is sent to the householder. The CIGA guarantee provides the householders with an independent guarantee covering defects in materials and workmanship. CIGA carry out there own quality checks on a percentage of CWI installations. Additionally, some of the CWI manufacturers (e.g. Knauf) also provide training to installers that are geared specifically to installing their products and some of the interviewees had benefited from such product-specific training. Although the installers assist in training of technicians, they do not themselves provide any ongoing quality control checks or provide any feedback on their specific installations.
One observation which arose as a result of the interviews was the tendency for individual technicians within a team to specialise in particular tasks. Whilst this would not be expected to be a problem under normal circumstances, there could be an issue when staff change or when one member of the team is off sick.
In addition, the various insulation manufacturers provide their own technical publications, advising technicians of correct installation procedures. Isowool, for instance, give guidance on their Walltherm system. Knauf also provide guidance manuals on their insulation products. Guidance is also given for Instafibre. The guidance publications generally give guidance on spacing and distribution of drill holes and 'test box' calibration of installation equipment (e.g. the density box test).
Generally the guidance advises technicians to calibrate the equipment twice a day. For mineral fibre there is a density box test and for polystyrene bonded beads there is a bead flow test. Some interviewees, however, were of the opinion that such calibration tests did not need to be carried out as frequently as advised in the published guidance.
Generally the technicians had also received Approved Code of Practice (ACOPS) training for gas safety matters such as smoke tests. Interviewees had also received health and safety training and ladder-use training.
One of the installers discussed CWI from a historical perspective and in his view the industry had made great progress since the early 1980's when the industry had suffered from a lot of problems and had earned

a poor reputation for quality. He was of the view that quality assurance schemes and training had done a lot to improve the industry and its image since then.
Further details of the findings from the installer interviews are given in BRE Report 222066[Ref 28].

Monitoring of the dwellings
Once each property had been identified and earmarked for inclusion in the study the four teams visited the selected uninsulated properties to carry out thermographic surveys, wall cavity inspections and installation of the equipment for measuring U-values. The equipment for measuring U-values included Hukseflux heat flux meters (mounted using teleprops), thermistor temperature probes and Eltek data-loggers. The same properties were revisited, subsequent to the application of cavity wall insulation, to perform a similar series of tests.
From the outset the Energy Saving Trust provided the heat flux meters, supporting teleprops, dataloggers and thermistors and this saved valuable time at the beginning of the project, thereby avoiding delays in the delivery of the equipment.
The properties were divided into two batches. The first batch were visited in March 2005, prior to application of insulation and these same properties were revisited in November 2005. The second batch were visited in December 2006 and these same properties were revisited in January, February and March 2006. Owing to delays in the application of cavity wall insulation, many of the 2006 revisits had to be staggered and it was not possible to include all of the properties within the thermal imaging surveys due to the high equipment hire costs.
Thermographic imaging was used both before and after application of cavity wall insulation to identify anomalies in the wall construction that could alter the thermal performance of the walls and to help in establishing the wall constructions. In particular, the thermographic imaging was carried out to identify any areas of the wall where there may be excessive thermal bridging, and also to determine instances in which lightweight concrete blockwork was used. For carrying out the thermographic imaging, most of the teams used a hand-held Flir Thermacam, although the team covering Lot 4 (Southern England) used a slightly higher specification Flir Agema infrared camera which has a better spatial resolution. In February 2006, IRT Surveys carried out thermography of post-CWI properties in Lot 2. Thermal images were taken of the houses from the outside under suitable weather conditions. The images taken externally were usually taken under cold, clear, dry conditions, after dark (or before dawn), with low wind speeds. For thermal images taken internally the time of day and external weather are less critical and internal thermal images were usually taken during the day.
In most cases, thermal bridging was observed at lintels above windows and doors both before and after application of insulation and the regions of high heat transfer (for lintels) were typically 200 mm - 300 mm high, extending across the full widths of the window openings and door openings. There were also many cases, particularly in Scotland, where there was significant thermal bridging at ground floor level, particularly where suspended floors were used or where the inside floor surface was significantly above the outside ground level. Where this occurred the area of elevated heat transfer tended to be around 300 mm high. One interesting but surprising observation from the thermal imaging before and after application of cavity wall insulation was that it was possible to identify lightweight concrete blockwork even after cavity wall insulation had been installed, and this was particularly apparent among some of the properties in Lot 4 (i.e. Southern England).
Daylight photographs were also taken from the same locations in order to assist in the interpretation of the thermal images. The intention when taking these photographs was to provide clues that would assist in the interpretation of the thermal images. Thermal images were also taken from the insides of some of the houses in the areas where the heat flux meters were due to be sited in order to determine whether there

were any atypical features of the wall in that area and to help determine whether the inner leaf blockwork of the wall consisted of dense concrete or lightweight concrete. In some cases, where unusual features or defects were identified in the cavities, the heat flux meters could be re-sited to locations which were considered to be more representative of the wall construction as a whole prior to carrying out the U-value measurements, however such re-siting was not necessary in practice because voids were generally very small and sporadic and tended not to coincide with locations where the U-value was measured.
Subsequent to application of insulation, the thermographic imaging helped to identify areas where insulation was missing or of low compactness. (It also helped to identify the locations where it was not possible to insulate, such as at lintels.) Where un-insulated (unfilled) areas were identified in the thermal imaging surveys, inspection holes were drilled in the wall and the cavity was examined using a borescope in order to determine whether insulation was missing or of unusually low compactness. Using thermography, voids were found in a number of the properties, however the voids tended to be relatively small in area.
Appendix A to this report presents the thermal images and daylight photographs. Conclusions from the thermal images and daylight photographs are given in this report for each property. The individual teams presented some comments about the images and the conditions under which they were taken, and brief conclusions are given in the report for the thermal imaging surveys.
Appendix A is divided into 70 sections, one for each of the properties. The numbering system for the properties presented is based on the numbers used in Table 1 above.

Wall constructions
Prior to installation of insulation, the research teams collected information about the cleanliness of the cavity, the condition of wall ties and the presence of any objects or debris lodged in the cavity, or any materials that could bridge the cavity. Other features which might reduce the effectiveness of cavity wall insulation were also noted such as, for example, unusual features at window cills or jambs which might prevent insulation from being distributed evenly. In conjunction with the cavity inspection, the widths of the cavities were measured using suitable rods and hooks. The firmness of the inner leaf material was also assessed, by testing it with a sharp metal rod (passed via the external inspection hole), in order to gauge its strength, and thereby obtain further clues about the material composition of the wall.
One aspect of the construction which was difficult to determine was the density of the concrete. Lightweight blocks could be identified by a combination of thermal imaging and firmness testing, but there was no unambiguous way to distinguish between dense blocks (typical conductivity 1.13 W/m·K) and light aggregate blocks (typical conductivity 0.5 W/m·K). Additionally thermal imaging could only be used as a means of identifying lightweight concrete blocks when a plaster finish was used (as opposed to plasterboard on dabs or plasterboard on battens). As a result of this, the thermal conductivity of concrete blocks was assessed using the criteria in Tables 2 and 3. Inner leaf clay brickwork was identified by boroscopic inspection by examining the size and colour of the blocks. Interestingly, it was found in the course of this project that thermal imaging could be used as a means of identifying lightweight blocks even after cavity insulation had been installed (provided the thermal imaging camera was of a sufficiently high specification).
In a number of wall constructions it was found, on inspection, that insulation was already present in the cavity preventing any information being obtained about how the property had performed prior to insulation being installed. There were also some properties for which the installer had intended to fill with insulation but the insulation install was aborted at a late stage either due to unsuitable constructions only being identified at the final visit by the insulation installer or through cancellation of installation on some or all of the wall facades at the request of the occupiers.
Some aspects of the wall construction could not be ascertained without damaging the wall. In particular, it was not possible to determine whether or not the plasterboard was foil-backed and it was not possible to determine whether there was air movement in the space behind the plasterboard. In all cases involving plasterboard, the ISO 6946 calculation was carried out on the assumption that the plasterboard was not foil-backed and that the airspace behind the plasterboard was not ventilated.
In calculating the U-values to ISO 6946 the effects of the plastic films were ignored, as they were considered to be negligible. In most cases, the thin substrate material (usually heat sink paste or petroleum jelly) was also ignored, except in cases where the substrate was of a significant thickness such as in the case of high relief surfaces (e.g. embossed wallpaper, patterned surfaces or ‘artex’) when an allowance for the estimated thickness of substrate (typically 0.5 mm) was included within the U-value calculation (although in practice this allowance had a very small effect on the U-value).

Condition of concrete blockwork Assumed conductivity (W/m²K)
Assumed density (kg/m3)
Outline of blocks clearly visible on thermal image and blocks found not to be very firm
0.18 700
Outlines of blocks not visible on thermal image (taken from inside dwelling) and blocks found to be very firm, and dwelling built prior to 1976
1.13 1800
Outlines of blocks not visible on thermal image (taken from inside dwelling) and blocks found to be very firm, and dwelling built after 1976
0.5 1500
Table 2.1 Criteria used for estimating thermal conductivity of concrete blockwork
Assumptions made about the thermal conductivities of other materials used in the wall constructions are given in Table 2.2.
Material Assumed conductivity (W/m²K)
Assumed density (kg/m3)
Assumed specific heat capacity (J/kg.K)
Reference source
Render 1.00 1800 1000 BS EN ISO 10456Brick (outer leaf) 0.77 1700 800Brick (inner leaf) 0.56 1700 800Concrete (inner leaf) variable variable 1000Plaster (dense) 0.57 1300 1000 BS EN ISO 10456Light plaster 0.18 600 1000 BS EN ISO 10456Plasterboard 0.21 700 1000 BR 443Tiles 1.3 2300 840 BS EN ISO 10456Mineral wool 0.040 10 to 40 1030 BS EN ISO 10456Expanded polystyrene 0.040 20 1450 BS EN ISO 10456Heat flux meter 0.80 1700 800 ManufacturerAir Variable 1.25 1000 BS EN ISO 6946Petroleum jelly (substrate) 0.18 - - ManufacturerHeat sink paste (substrate) 0.2 - - EstimatedTable 2.2 Assumed thermal properties of materials
Note: The data sheets for the HFP01 Hukseflux meters indicates that their thermal resistance is in the region of 0.00625 m2K/W. Since their thickness is 5 mm the thermal conductivity of the heat flux meters should be 0.8 W/m.K (i.e. thickness divided by resistance). Unfortunately, however, it is plausible that the thermal conductivity of the central active area may differ slightly from the thermal conductivity of the rest of the disk, and information about the thermal properties of the central active area in relation to the peripheral inactive area is not provided by the manufacturer.

The heat flux measurements
In order to measure the U-value of a wall it is necessary to measure the heat flow, internal temperature and external temperature continuously over a sufficiently long period of time. In this project Hukseflux heat flux meters were used to measure heat flow and thermistors were used to record internal and external temperatures. U-values were determined by comparing the heat flow through the element with the temperature difference across it. In an ideal situation the internal and external temperatures would be constant, giving a steady and accurately determined U-value. In practice steady state conditions do not occur, however, and consideration has to be given to the variations in temperatures and heat flows before the U-value can be determined reliably. Since most building structures have a significant thermal mass, variations in internal or external temperatures lead to large fluctuations in the heat flow either into or out of the element and it was necessary to measure the heat flows and temperatures over several days in order to arrive at a reliable result.
In all cases a paste was placed on the heat flux meter and this was then covered by a thin polythene film (e.g. 'cling film') in order to protect internal surface finishings. Latterly where cling film was used it was decided to use two layers of cling film (or a more robust plastic film) in order to minimise risk of the paste substrate (e.g. heat sink paste or petroleum jelly) affecting wallpaper or paintwork. In all cases the heat flux meters (80 mm in diameter) were pressure-fixed against the wall using a flexible plastic bracket supported by a teleprop. Given that the thickness of the polythene was very small its effect upon the U-value was expected to be negligible.
The approach taken made use of ISO 9869, a standard which gives guidance on measuring U-values using small heat flux meters. In order to ensure that the selected location of a heat flux meter was representative infrared thermography was carried out. The purpose of the thermography was to establish whether there were any significant variations in the internal surface temperature near to the heat flux meter as large variations in temperature would indicate that the selected measurement point was atypical of the wall as a whole.
Wherever possible the heat flux meters were left for a minimum continuous period of two weeks, and in several instances the measurement period was extended to 3 weeks or more.
The probes used for monitoring internal temperatures were usually located approximately 10 mm from the internal wall surface and were located at the same height as the neighbouring heat flux meter, and situated so as to face the room (i.e. to receive a similar radiant temperature to that of the room interior). For the outside air temperature the probes were positioned (suspended in air) about 10 mm from the external wall surface, but with the wire taped or hooked to the wall surface to provide anchoring. For each dwelling the temperatures and EMF signals were continuously logged over approximately two weeks. The signals were measured every minute but, to save logger memory, the loggers were set to record the average signal over each half hour interval. In some instances, quarter-hour intervals were used instead of half-hour intervals, however reducing the intervals from half-hourly to quarter-hourly did not appear to lead to any memory-related problems with the dataloggers.
In some instances, it was found that the adhesive tape (duct tape) supporting the external temperature sensors had become loose as a result of a combination of wind and heavy rain and over the course of the project the teams switched to using eye hooks (or similar) as a means of supporting the external temperature probes, an idea which was developed initially by the team covering the Lot 4 properties. This approach involved bedding metal eye hooks in the mortar or outer brickwork and using the eye hooks to support the thermistors at the selected location of the wall.

In a small number of cases the period of measurement was significantly above two weeks and the data from those cases will facilitate an analysis of the relationship between experimental error and length of the period of measurement, however that particular analysis is not reported here.
Results of the U-value measurements
Errors and confidence level
Experimental errors are given for the measured U-values. For a more detailed discussion on measurement errors see Appendix H.
In addition, each measurement point was also assigned a confidence level which is a measure of how optimal or representative the measurement conditions were considered to be. Where measurement conditions were considered to be good, a high confidence level was assigned to the measurement result. Where measurement conditions were considered to be poor a low or zero confidence level was assigned to the measurement result.
The following confidence levels were used:
Type of confidence level Optimal condition Less optimal conditions
Confidence level associated with contrast between internal and external temperature (either before or after application of CWI)
If average temperature difference between inside and outside is more than 10°C: 100% confidence
If temperature difference is between 5 and 10 degrees, confidence is equal to temperature difference divided by 10. If temperature difference is less than 5 degrees C: confidence is zero.
Confidence associated with availability of measurements both before and after application of CWI
If measurement is carried out both before and after CWI: 100% confidence
If measurement is omitted either before or after CWI, and increase in thermal resistance is being examined: confidence is set to zero.
Confidence associated with representativeness of the wall construction
If house is traditional cavity wall: 100% confidence
If house is non-traditional: zero confidence.
Confidence associated with distance from nearest window/door jamb or window sill
If distance is at least 400 mm: 100% confidence
If distance is less than 400 mm: 80% confidence
Confidence associated with compass direction of the wall at the point of measurement
If wall faces north, north west, east, west or north east: 100% confidence
If wall faces south east, south west or south: 80% confidence
Table 3.1
Note: For the confidence associated with the contrast between internal and external temperature there are two correction factors that are applied; there is a correction factor for the measurement that was taken prior to installing CWI and there is another correction factor for the measurement that was taken after installing CWI.

The overall confidence level for a measurement was determined by multiplying together the individual confidence levels associated with each of the above criteria.
In many parts of the analysis a threshold confidence level (or alternatively a series of threshold confidence levels as a sensitivity analysis) was used and only those measurements which had a confidence level reaching or exceeding the selected threshold were included in the analysis.
To take an example, the following, based on cases 4A and 4B, show how the confidence levels were combined in order to obtain an overall confidence level.
Confidence Case 4A Case 4BConfidence associated with temperature contrast prior to CWI
100% (contrast of more than 10°C)
100% (contrast of more than 10°C)
Confidence associated with temperature constrast after CWI
100% (contrast of more than 10°C)
100% (contrast of more than 10°C)
Confidence associated with repsresentativeness of the type of construction
100% (traditional construction)
100% (traditional construction)
Confidence associated with distance to nearest window jamb
100% (more than 400 mm from jamb)
100% (more than 400 mm from jamb)
Confidence associated with compass direction 80 % (south facade) 100% (west facade)
Overall confidence level, obtained by multiplying together the above
80% 100%
Table 3.2
In this example, therefore, the overall confidence weighting was 80% for case 4A and 100% for case 4B.
Results for the measured U-values
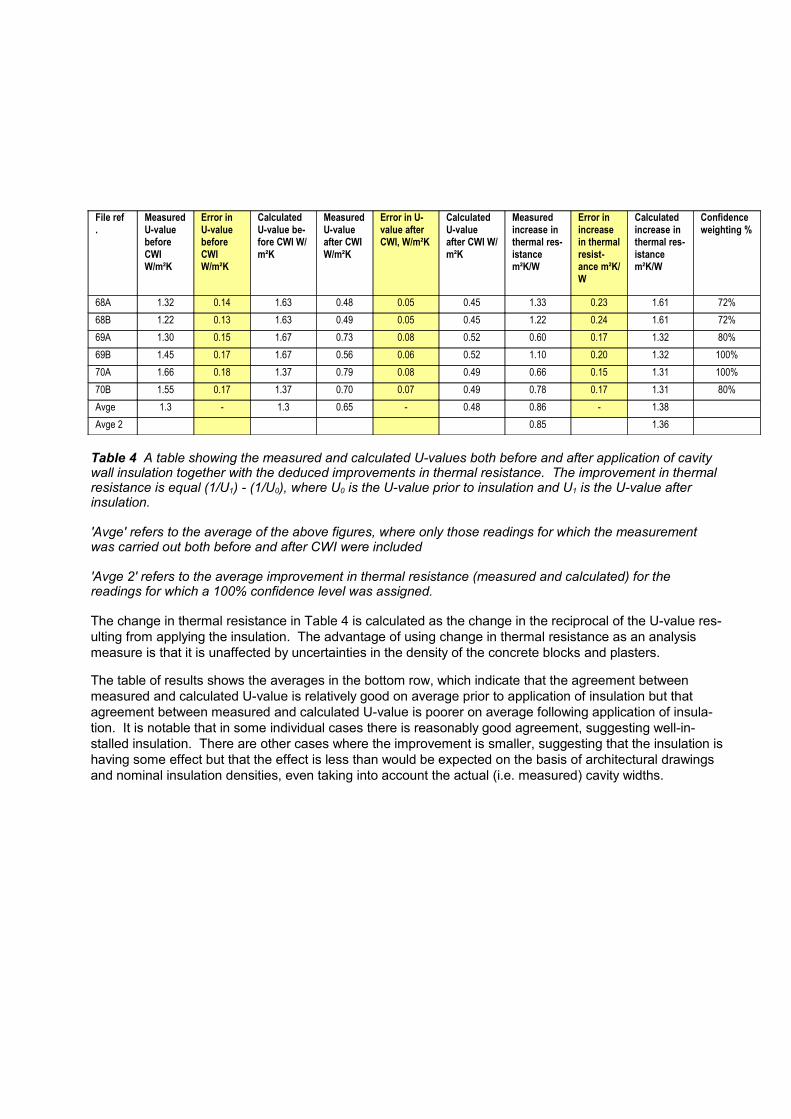
Table 4 lists the U-values measured before and after application of cavity wall insulation (CWI), shown together with the calculated U-values for comparison. Also given is the change in thermal resistance resulting from the insulation on the basis of measurement (ISO 9869[Ref 2]) and calculation (ISO 6946[Ref 3]).
The calculations of the U-values in all cases assumed an internal surface resistance of 0.13 m2K/W and an external surface resistance of 0.04 m2K/W, as is normally done in ISO 6946 calculations. In all cases, both mineral wool and expanded polystyrene, the thermal conductivity of the insulant (for the ISO 6946 calculation) was taken to be 0.04 W/m∙K. In some cases, some of the readings from the dataloggers were missing, due to electrical/technical faults, and in such cases it was necessary to carry out the analysis on a reduced dataset. When this had to be done it usually did not have a large impact on the resulting U-value, except in a small number of cases where this did lead to an increased error (e.g. case no. 62). There were, however, some instances where it was necessary to repeat the measurement owing to complete logger failure (e.g. cases 24 and 37) or to abandon the measurement (e.g. case 67 where equipment was damaged while it was logging).
The most important parameter is the change in the thermal resistance of the wall resulting from the application of the cavity insulation, as this parameter should not be affected by uncertainties caused by uncertainties in the composition of the wall's inner leaf. Unfortunately, this particular parameter could only be evaluated in the instances where the U-value was measured both before and after application of CWI.
Errors are also given for the measured U-values. For a more detailed discussion on measurement errors, together with a discussion of confidence levels, see Appendix H.

File ref.
Measured U-value before CWIW/m²K
Error in U-value before CWI W/m²K
Calculated U-value be-fore CWI W/m²K
Measured U-value after CWI W/m²K
Error in U-value after CWI, W/m²K
Calculated U-value after CWI W/m²K
Measured increase in thermal res-istance m²K/W
Error in increase in thermal resist-ance m²K/W
Calculated increase in thermal res-istance m²K/W
Confidence weighting %
01A 1.00 0.32 1.67 0.41 0.04 0.58 1.44 0.41 1.13 0%01B 0.98 0.11 1.66 0.44 0.05 0.54 1.25 0.26 1.25 0%02A 1.33 0.19 1.39 0.47 0.05 0.56 1.38 0.25 1.07 51%02B 1.37 0.20 1.39 0.86 0.09 0.55 0.43 0.16 1.10 60%03A 1.29 0.18 1.42 0.80 0.11 0.56 0.47 0.21 1.08 74%03B 1.58 0.18 1.42 0.59 0.07 0.56 1.06 0.21 1.08 71%04A 1.18 0.12 1.02 0.51 0.05 0.49 1.11 0.22 1.06 64%04B 1.55 0.16 1.02 0.44 0.05 0.49 1.63 0.25 1.06 80%05A 1.66 0.19 1.42 0.57 0.06 0.55 1.15 0.20 1.11 64%05B 1.16 0.13 1.42 0.56 0.06 0.55 0.92 0.22 1.11 48%06A 1.02 0.11 1.42 1.10 0.11 0.55 -0.07 0.14 1.12 0%06B 1.50 0.17 1.42 0.46 0.05 0.55 1.51 0.24 1.11 62%07A 1.26 0.13 1.66 0.75 0.08 0.56 0.54 0.16 1.18 56%07B 1.34 0.15 1.66 1.08 0.12 0.56 0.18 0.14 1.18 0%08A 1.02 0.11 0.94 0.61 0.06 0.47 0.66 0.20 1.06 60%08B 1.62 0.18 0.94 0.59 0.06 0.47 1.08 0.19 1.06 0%09A 2.26 0.24 1.53 0.79 0.09 0.58 0.82 0.15 1.07 80%09B 1.64 0.17 1.53 0.66 0.07 0.58 0.91 0.18 1.07 80%10A 1.45 0.26 1.44 0.83 0.09 0.54 0.52 0.18 1.16 47%10B 1.59 0.20 1.44 0.88 0.09 0.54 0.51 0.14 1.16 100%11A 0.93 0.10 0.82 0.46 0.05 0.34 1.10 0.25 1.72 100%11B 0.85 0.09 0.82 1.07 0.11 0.34 -0.24 0.16 1.72 0%12A - - 1.42 0.71 0.08 0.55 - - 1.11 0%12B 0.74 0.08 1.42 0.54 0.06 0.55 0.50 0.24 1.11 46%13A 0.75 0.08 0.97 0.85 0.10 0.48 -0.16 0.20 1.05 0%13B 0.90 0.09 0.97 0.44 0.05 0.48 1.16 0.26 1.05 80%14A 1.65 0.18 1.02 - - - -0.61 0.07 -0.98 0%14B 1.94 0.21 1.02 0.53 0.06 0.49 1.37 0.22 1.06 80%15A 1.06 0.11 1.57 0.66 0.07 0.40 0.57 0.19 1.86 47%15B 1.18 0.13 1.57 1.00 0.11 0.43 0.15 0.14 1.69 0%16A 1.12 0.12 1.24 0.52 0.05 0.36 1.03 0.22 1.97 72%16B 1.37 0.15 1.20 0.52 0.05 0.38 1.19 0.21 1.80 80%17A 1.08 0.12 1.35 - - - - - 0.00 0%17B 1.03 0.11 1.35 - - - - - 0.00 0%18A - - - - - - - - 0.00 0%18B - - - - - - - - 0.00 0%19A 1.26 0.13 1.65 0.52 0.06 0.50 1.13 0.22 1.39 58%19B 1.19 0.13 1.65 0.46 0.05 0.50 1.33 0.25 1.39 55%20A 1.29 0.14 1.63 0.52 0.05 0.53 1.15 0.22 1.27 90%20B 1.65 0.19 1.63 0.69 0.07 0.54 0.84 0.17 1.24 90%21A 0.84 0.09 1.63 0.41 0.05 0.40 1.25 0.30 1.89 39%21B 0.96 0.10 1.63 0.47 0.05 0.39 1.09 0.25 1.98 41%

File ref.
Measured U-value before CWIW/m²K
Error in U-value before CWI W/m²K
Calculated U-value be-fore CWI W/m²K
Measured U-value after CWI W/m²K
Error in U-value after CWI, W/m²K
Calculated U-value after CWI W/m²K
Measured increase in thermal res-istance m²K/W
Error in increase in thermal resist-ance m²K/W
Calculated increase in thermal res-istance m²K/W
Confidence weighting %
22 1.04 0.11 1.51 - - - - - 0.00 0%23A 1.18 0.13 1.36 - - - - - 0.00 0%23B 1.15 0.14 1.36 - - - - - 0.00 0%24A 0.98 0.11 1.67 0.32 0.03 0.48 2.10 0.35 1.48 51%24B 0.91 0.10 1.67 0.62 0.07 0.48 0.51 0.21 1.48 41%25 0.84 0.09 1.17 0.58 0.06 0.44 0.53 0.22 1.42 80%26A 0.66 0.08 1.00 0.44 0.05 0.55 0.76 0.30 0.82 69%26B 0.88 0.09 1.12 0.57 0.06 0.58 0.62 0.22 0.83 78%27A 1.01 0.11 1.37 - - - - - 0.00 0%27B 1.13 0.12 1.37 - - - - - 0.00 0%28A 1.01 0.11 1.39 0.79 0.08 0.49 0.28 0.17 1.32 80%28B 1.04 0.11 0.94 0.84 0.09 0.36 0.23 0.16 1.71 80%29A 1.22 0.13 0.98 0.60 0.06 0.41 0.85 0.19 1.42 80%29B 1.25 0.13 0.95 0.73 0.08 0.45 0.57 0.17 1.17 80%30A 1.60 0.17 1.54 0.53 0.06 0.45 1.26 0.21 1.57 100%30B 1.66 0.17 1.54 0.79 0.08 0.45 0.66 0.15 1.57 100%31A 1.51 0.16 1.29 0.71 0.08 0.40 0.75 0.17 1.72 64%31B 1.49 0.16 1.29 0.61 0.07 0.40 0.97 0.19 1.72 64%32A 1.45 0.17 1.24 0.81 0.09 0.35 0.54 0.15 2.05 80%32B 1.53 0.17 1.24 0.82 0.09 0.35 0.57 0.15 2.05 74%33A 1.75 0.18 1.33 1.00 0.10 0.49 0.43 0.12 1.29 72%33B 1.71 0.18 1.31 0.66 0.07 0.53 0.93 0.17 1.12 90%34A 1.68 0.18 1.23 1.01 0.11 0.42 0.39 0.12 1.57 80%34B 1.17 0.13 1.11 0.53 0.06 0.45 1.03 0.22 1.32 88%35 1.30 0.15 1.59 0.46 0.05 0.48 1.40 0.24 1.45 54%36A 1.43 0.15 1.20 0.86 0.09 0.44 0.46 0.14 1.44 90%36B 1.14 0.12 1.20 0.70 0.07 0.44 0.55 0.18 1.44 72%37 1.34 0.14 1.47 0.62 0.07 0.49 0.87 0.20 1.36 100%38A 2.17 0.25 1.51 0.86 0.10 0.39 0.70 0.14 1.90 80%38B 1.91 0.27 1.39 0.71 0.07 0.42 0.88 0.17 1.64 100%39A 1.56 0.35 1.55 0.81 0.09 0.45 0.59 0.20 1.58 80%39B 1.13 0.13 1.21 0.65 0.07 0.40 0.65 0.20 1.69 71%40A 1.73 0.25 1.57 0.97 0.12 0.51 0.45 0.15 1.32 80%40B 1.64 0.20 1.59 1.02 0.11 0.41 0.37 0.13 1.83 80%41A 1.45 0.15 1.38 0.63 0.07 0.56 0.90 0.20 1.06 72%41B 1.60 0.18 1.43 0.90 0.09 0.54 0.49 0.13 1.15 71%42A 0.76 0.09 0.76 0.49 0.05 0.35 0.73 0.26 1.52 80%42B 0.83 0.09 0.80 0.40 0.04 0.39 1.30 0.29 1.32 80%43A 1.31 0.14 0.93 0.55 0.06 0.38 1.05 0.21 1.56 80%43B 1.24 0.13 0.93 0.47 0.05 0.38 1.32 0.24 1.56 80%44A 1.55 0.28 1.42 0.85 0.09 0.46 0.53 0.17 1.47 48%44B 1.50 0.27 1.42 0.95 0.10 0.46 0.39 0.17 1.47 58%

File ref.
Measured U-value before CWIW/m²K
Error in U-value before CWI W/m²K
Calculated U-value be-fore CWI W/m²K
Measured U-value after CWI W/m²K
Error in U-value after CWI, W/m²K
Calculated U-value after CWI W/m²K
Measured increase in thermal res-istance m²K/W
Error in increase in thermal resist-ance m²K/W
Calculated increase in thermal res-istance m²K/W
Confidence weighting %
45 1.21 0.27 1.31 0.56 0.06 0.48 0.96 0.26 1.32 100%46A 1.38 0.15 1.43 - - - - - -0.70 0%46B 0.91 0.11 0.92 0.48 0.05 0.42 0.98 0.25 1.29 80%47A 1.28 0.14 1.40 0.77 0.08 0.46 0.52 0.16 1.46 72%47B 1.26 0.16 1.47 0.66 0.07 0.35 0.72 0.20 2.19 58%48A 1.72 0.18 1.50 - - - - - -0.67 0%48B 1.73 0.18 1.50 - - - - - -0.67 0%49 1.04 0.11 1.40 0.42 0.04 0.44 1.42 0.27 1.56 71%50A 1.20 0.13 1.65 0.55 0.06 0.49 0.98 0.21 1.43 100%50B 1.18 0.13 1.39 0.58 0.06 0.49 0.88 0.20 1.32 100%51A 1.38 0.15 1.66 0.81 0.09 0.55 0.51 0.15 1.22 59%51B 1.30 0.14 1.66 0.74 0.08 0.49 0.58 0.17 1.44 62%52A 1.18 0.13 1.59 0.40 0.04 0.55 1.65 0.28 1.19 51%52B 1.05 0.15 1.65 0.80 0.08 0.45 0.30 0.19 1.62 44%53A 1.13 0.12 0.86 0.47 0.05 0.37 1.24 0.25 1.54 100%53B 1.17 0.13 0.82 0.47 0.05 0.36 1.27 0.25 1.56 100%54A 1.63 0.17 1.38 0.72 0.08 0.52 0.78 0.16 1.20 100%54B 1.48 0.16 1.38 0.78 0.08 0.52 0.61 0.15 1.20 100%55A 1.32 0.14 1.67 0.60 0.07 0.52 0.91 0.20 1.32 100%55B 1.44 0.15 1.67 0.77 0.08 0.52 0.60 0.16 1.32 100%56A 1.08 0.12 0.94 0.49 0.05 0.47 1.11 0.24 1.06 100%56B 1.16 0.12 0.93 0.51 0.05 0.47 1.10 0.22 1.05 90%57A 1.67 0.18 0.94 0.48 0.05 0.47 1.48 0.23 1.06 80%57B 1.16 0.12 0.93 0.47 0.05 0.47 1.27 0.24 1.05 100%58A 1.77 0.19 0.94 0.69 0.07 0.40 0.88 0.17 1.44 100%58B 1.27 0.13 0.94 0.64 0.07 0.40 0.78 0.19 1.44 100%59A 0.86 0.09 0.83 0.65 0.07 0.44 0.38 0.20 1.06 80%59B 1.00 0.22 1.64 0.50 0.05 0.60 1.00 0.31 1.07 72%60A 1.60 0.17 1.67 0.78 0.08 0.65 0.66 0.15 0.94 70%60B 1.54 0.16 1.61 0.45 0.05 0.38 1.57 0.24 2.01 58%61A 1.55 0.17 1.65 0.67 0.08 0.51 0.85 0.18 1.35 78%61B 1.59 0.17 1.65 0.70 0.08 0.51 0.80 0.18 1.35 78%62 - - 0.00 0.74 0.11 0.60 - - 0.00 0%63A 0.77 0.09 1.66 0.80 0.09 0.63 -0.05 0.20 0.98 0%63B 0.65 0.07 1.66 0.59 0.06 0.63 0.16 0.24 0.98 0%63C - - 1.66 0.82 0.09 0.63 - - 0.00 0%64 - - 0.00 0.63 0.07 0.47 - - 0.00 0%65 - - 0.00 0.46 0.05 0.55 - - 0.00 0%66A - - 0.00 0.54 0.06 0.59 - - 0.00 0%66B - - 0.00 0.38 0.04 0.59 - - 0.00 0%67A 0.80 0.09 1.61 - - - - - 0.00 0%67B 0.71 0.08 1.61 - - - - - 0.00 0%
File ref.
Measured U-value before CWIW/m²K
Error in U-value before CWI W/m²K
Calculated U-value be-fore CWI W/m²K
Measured U-value after CWI W/m²K
Error in U-value after CWI, W/m²K
Calculated U-value after CWI W/m²K
Measured increase in thermal res-istance m²K/W
Error in increase in thermal resist-ance m²K/W
Calculated increase in thermal res-istance m²K/W
Confidence weighting %
68A 1.32 0.14 1.63 0.48 0.05 0.45 1.33 0.23 1.61 72%68B 1.22 0.13 1.63 0.49 0.05 0.45 1.22 0.24 1.61 72%69A 1.30 0.15 1.67 0.73 0.08 0.52 0.60 0.17 1.32 80%69B 1.45 0.17 1.67 0.56 0.06 0.52 1.10 0.20 1.32 100%70A 1.66 0.18 1.37 0.79 0.08 0.49 0.66 0.15 1.31 100%70B 1.55 0.17 1.37 0.70 0.07 0.49 0.78 0.17 1.31 80%Avge 1.3 - 1.3 0.65 - 0.48 0.86 - 1.38Avge 2 0.85 1.36
Table 4 A table showing the measured and calculated U-values both before and after application of cavity wall insulation together with the deduced improvements in thermal resistance. The improvement in thermal resistance is equal (1/U1) - (1/U0), where U0 is the U-value prior to insulation and U1 is the U-value after insulation.
'Avge' refers to the average of the above figures, where only those readings for which the measurement was carried out both before and after CWI were included
'Avge 2' refers to the average improvement in thermal resistance (measured and calculated) for the readings for which a 100% confidence level was assigned.
The change in thermal resistance in Table 4 is calculated as the change in the reciprocal of the U-value res-ulting from applying the insulation. The advantage of using change in thermal resistance as an analysis measure is that it is unaffected by uncertainties in the density of the concrete blocks and plasters.
The table of results shows the averages in the bottom row, which indicate that the agreement between measured and calculated U-value is relatively good on average prior to application of insulation but that agreement between measured and calculated U-value is poorer on average following application of insula-tion. It is notable that in some individual cases there is reasonably good agreement, suggesting well-in-stalled insulation. There are other cases where the improvement is smaller, suggesting that the insulation is having some effect but that the effect is less than would be expected on the basis of architectural drawings and nominal insulation densities, even taking into account the actual (i.e. measured) cavity widths.

The results are summarised below. The results indicate that the measured improvement (derived from the heat flow measurements) in the thermal performance is, on average, less than the calculated improvement (derived from conventional U-value calculations but using measured cavity widths).
Confidence-weighted average measured change in thermal res-istance arising from application of insulation
0.85 m2K/W
Confidence-weighted average calculated change in thermal res-istance arising from application of insulation
1.39 m2K/W
Discrepancy between average measured increase in thermal resistance and average calcu-lated increase in thermal resist-ance
38%
Table 4.2
The above figures refer to the measurements at points on the walls where the cavity was known to be filled. These figures do not include the impact of void areas (where insulation was not installed) and it does not take account of the effect of thermal bridging at lintels and junctions. The impact of void areas, lintels and junctions are discussed elsewhere in this report.

Figure 2A and 2B show histograms of the improvements in thermal performance, expressed as increase in thermal resistance, as measured and as calculated, showing that on average the measured improvement is less than the calculated improvement. The histograms are based on 100 measurements which were deemed to have a reasonable level of confidence. The data used in the generation of these histograms were based on the data given in the electronic spreadsheet accompanying this report.
Increase in thermal resistance resulting from insulation
0.00
5.00
10.00
15.00
20.00
25.00
>0.25, <=0.5 >0.5, <=0.75 >0.75, <=1 >1, <=1.25 >1.25, <=1.5 >1.5, <=1.75 >1.75, <=2 >2, <=2.25 >2.25, <=2.5 >2.5, <=2.75 >2.75, <=3
Increase in thermal resistance (m²K/W)
Num
ber o
f cas
es (w
eigh
ted)
Figure 2A Measured increase in thermal resistance for the dataset as a whole. The mean increase in thermal resistance is found to be 0.85 m²K/W.
Increase in thermal resistance resulting from insulation
0.00
5.00
10.00
15.00
20.00
25.00
30.00
>0.25, <=0.5 >0.5, <=0.75 >0.75, <=1 >1, <=1.25 >1.25, <=1.5 >1.5, <=1.75 >1.75, <=2 >2, <=2.25 >2.25, <=2.5 >2.5, <=2.75 >2.75, <=3
Increase in thermal resistance (m²K/W)
Num
ber o
f cas
es (w
eigh
ted)
Figure 2B Calculated increase in thermal resistance for the dataset as a whole. The mean increase in thermal resistance is expected to be 1.39 m²K/W. It is also notable that the modal class for measured im-provement differs from the modal class for calculated improvement.

Sensitivity to measurement confidence
In order to investigate whether the average increase in thermal resistance (resulting from insulation) was sensitive to the confidence levels a series of threshold confidence levels were used, as shown in Table 5.1 and Table 5.2. The purpose of this sensitivity analysis was to determine whether the degree of stringency in the quality of the measurement conditions was critical to the results. In each case, i.e. for each threshold confidence level, the error-weighted mean was calculated using all of the readings which had a confidence level at or above the selected threshold confidence.
Threshold confidence level (100% being the most strin-gent threshold, 1% the least stringent)
Average change in thermal resistance (measured), m²K/W, with each measurement given an equal weighting.
Average change in thermal resistance (calculated), m²K/W
Number of measurements at or above the threshold con-fidence level
1% 0.85 ± 0.10 1.39 10120% 0.87 ± 0.10 1.38 9840% 0.88 ± 0.10 1.37 9560% 0.90 ± 0.11 1.37 7980% 0.93 ± 0.13 1.37 60100% 0.85 ± 0.17 1.36 35
Table 5.1 NOTE: The figures in this table do not take into consideration U-value measurement accuracy and they exclude non-traditional constructions.
Threshold confidence level (100% being the most strin-gent threshold, 1% the least stringent)
Average change in thermal resistance (measured), m²K/W, with each measurement weighted according to the reciprocal of the square of the measurement error.
Average change in thermal resistance (calculated), m²K/W
Number of measurements at or above the threshold con-fidence level
1% 0.74 ± 0.02 1.40 10120% 0.76 ± 0.02 1.39 9840% 0.77 ± 0.02 1.39 9560% 0.79 ± 0.02 1.39 7980% 0.78 ± 0.02 1.40 60100% 0.75 ± 0.03 1.39 35
Table 5.2 NOTE: The figures in this table were obtained by weighting each measurement according to the reciprocal of the square of the measurement error. They exclude non-traditional constructions.
The results show that the average improvement in thermal resistance is not especially sensitive to the se-lected threshold confidence weighting. This might suggest that the confidence multipliers, used in calculat-ing confidence levels, are conservative or cautious, and that the selected threshold is not especialy critical to the results.
The results are, however, sensitive to the size of the measurement error. If each measurement is weighted according to the reciprocal of the square of the measurement error, as was done in Table 5.2 above, the results turn out to be less favourable than if all U-value measurements are assigned an equal measurement error (as done in Table 5.1).
Correlation with insulation voids (where voids are not attributable to any obvious obstructions)
During the course of the thermography, several houses were found to have voids in their insulation (which were large enough to be detected by thermal imaging) raising questions about whether the measured U-val-ues were poorer in those houses compared with the houses where thermal insulation was found to be of ex-cellent continuity. While it was the case that there were no voids discovered at any of the U-value measure-ment points, the presence of voids elsewhere in the dwelling could potentially reduce confidence in the in-tegrity of the insulation at the measurement points and it was therefore considered necessary to compare houses with voids discovered against houses with no voids discovered.

The results are summarised in Table 5.3.
All measurements All measurements in houses where no in-sulation voids were found in the thermo-graphic surveys
All measurements where the property was rendered
All measurements in houses where the property was rendered where no insulation voids were found in the thermographic surveys
Average measured in-crease in thermal resist-ance, m²K/W
0.85 ± 0.10 0.86 ± 0.11 0.69 ± 0.16 0.72 ± 0.18
Average calculated in-crease in thermal resist-ance, m²K/W
1.39 1.42 1.43 1.43
No. of measurements 101 78 37 30Table 5.3 Increase in thermal resistance resulting from insulation, where all measurements were equally weighted
It was found, therefore, that excluding houses with known insulation voids had only a slight impact on the average U-values measured, suggesting that there is no particular reason to exclude U-value measure-ments in houses where voids had been discovered. It does appear, however, that the measured thermal performance of rendered walls is probably poorer than that of non-rendered walls.
Correlations between render and completeness of fill
There have been suggestions that rendered properties, where the CWI installer has to drill through brick rather than through mortar, may be more likely to contain pieces of brick rubble, leading to increased thermal bridging and increased risk of air voids in the insulation. Correlations were examined to determine whether rendered properties were more likely to have incomplete insulation fill or poorer U-values, com-pared with non-rendered dwellings.
On examination of the estimated area of voids (whether or not obstructions were identifiable), it was found that the total void area in non-rendered properties was approximately 13 m² and the total void area in rendered properties was approximately 4.2 m² (out of 42 non-rendered properties and 21 rendered proper-ties).
There is therefore no obvious correlation between void area identified and presence of render on the prop-erty. This result does not, however, suggest that render does not have an impact, but rather it suggests that render is not the main reason for voids of more than 1 square metre (approx.) in the insulation occurring.
The effect of plasterboard
There was a concern that air movement behind plasterboard could have an impact upon the measured U-values in this project and to determine whether this was the case the U-value measurements were separ-ated according to whether or not plasterboard was the internal finish.
The results of separating the measurements according to internal finish are shown in Table 5.4.
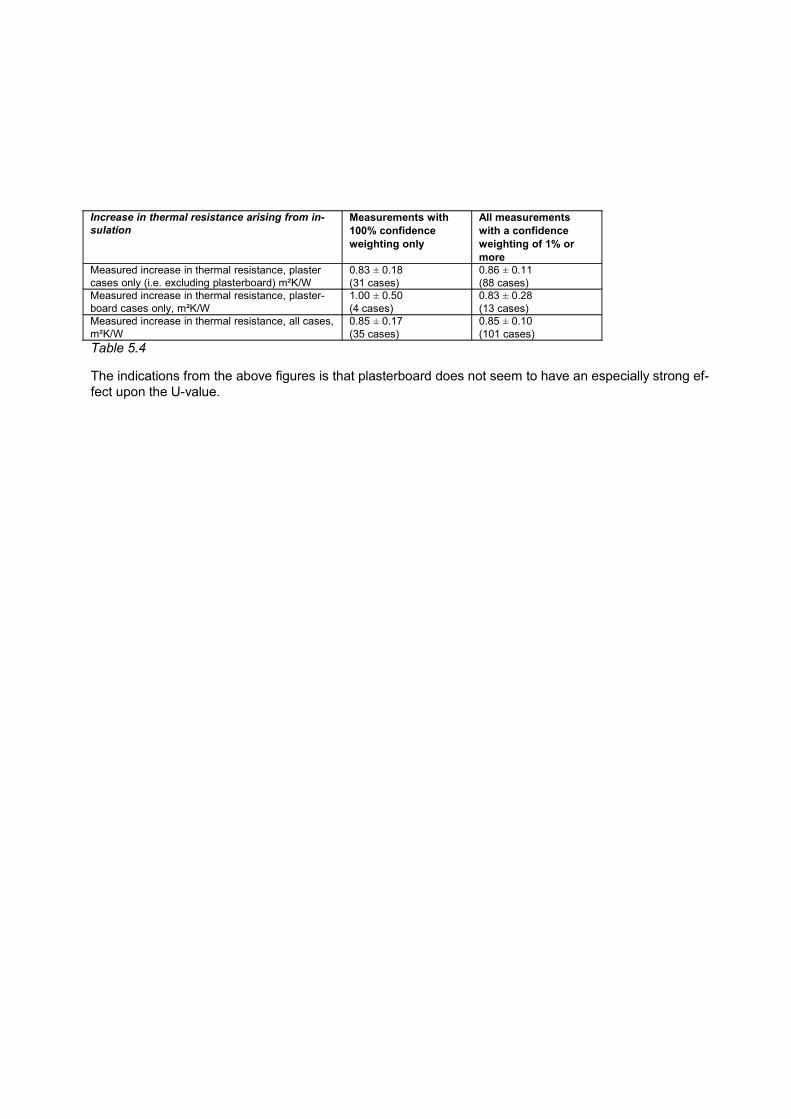
Increase in thermal resistance arising from in-sulation
Measurements with 100% confidence weighting only
All measurements with a confidence weighting of 1% or more
Measured increase in thermal resistance, plaster cases only (i.e. excluding plasterboard) m²K/W
0.83 ± 0.18(31 cases)
0.86 ± 0.11(88 cases)
Measured increase in thermal resistance, plaster-board cases only, m²K/W
1.00 ± 0.50(4 cases)
0.83 ± 0.28(13 cases)
Measured increase in thermal resistance, all cases, m²K/W
0.85 ± 0.17(35 cases)
0.85 ± 0.10 (101 cases)
Table 5.4
The indications from the above figures is that plasterboard does not seem to have an especially strong ef-fect upon the U-value.

EPS bonded beads and geographical variation
Within the overall dataset there were five instances where the cavities were insulated using expanded poly-styrene bonded beads instead of blown mineral fibre. The mean improvement for the expanded polystyrene cases alone was 0.37 m²K/W (measured) and 1.52 m²K/W (calculated).
The EPS cases were all in Lot 1 (Scotland). They refer to cases 25, 28A, 28B, 40A and 40B.
Owing to the very small numbers of cases where EPS beads were used it is difficult to arrive at any firm conclusions about EPS bonded beads other than the fact that, in our sample, the improvements in thermal resistance fell well short of the improvements that might be expected on the basis of U-value calculations to ISO 6946. The increases in thermal resistance (resulting from application of insulation) are given in Table 5.5 below, for both the measured and calculated increases.
Table of mean change in thermal resistance, m²K/W arising from CWI
Expanded polystyrene cases only(measured; calculated)
Mineral wool cases only (measured; calculated)
Lot 1 0.37 ± 0.05; 1.52(5 cases)
0.78 ± 0.06; 1.49(24 cases)
Lot 2 n.a. 1.09 ± 0.09; 1.58(15 cases)
Lot 3 n.a. 0.85 ± 0.06; 1.40(29 cases)
Lot 4 n.a. 0.90 ± 0.08; 1.14(27 cases)
All lots 0.37 ± 0.05; 1.52(5 cases)*
0.89 ± 0.04; 1.38(95 cases)
Table 5.5
*In calculating this, no threshold confidence was used. If a stringent 100% threshold confidence is used, this becomes 0.41 m²K/W (measured); 1.58 m²K/W (calculated) (2 cases)
The means and errors in the above table were calculated on the basis of each measurement being weighted equally.
It is notable that the measured improvements for Lots 2 and 4 are larger than for Lots 1 and 3. The differ-ence between measured and calculated is least for Lot 4 and most for Lot 1.
Mineral wool
It is notable that if we eliminate the EPS cases, so that only mineral wool cases are included in the analysis, the average measured increase in thermal resistance rises from 0.86 ± 0.10 to 0.89 ± 0.10 W/m²K
Non-traditional wall constructions
There was one instance (case 59) where the wall construction was thought to be non-traditional. When this case was eliminated from the dataset the mean measured increase in thermal resistance rose very slightly, by approximately 0.01 m²K/W. In general, the analysis tables in this report exclude the non-traditional wall due to uncertainties about its representativeness.

Effect of cavity width
The mean increases in thermal resistance were examined for different ranges of cavity widths and were found to be as follows:
0 to 50 mm 51 mm to 60 mm 61 mm to 70 mm 71 mm or more
No. of data points (All Lots) 20 31 28 22
Average measured increase (All Lots) m²K/WWhere measurements are given equal weighting
0.94 ± 0.22 0.78 ± 0.18 0.91 ± 0.19 0.83 ± 0.21
Average measured increase (All Lots) m²K/WWhere measurements are weighted according to their individual errors
0.87 ± 0.05 0.68 ± 0.03 0.80 ± 0.04 0.66 ± 0.04
Average calculated increase (All Lots)
1.04 1.25 1.47 1.81
No. of data points (Lot4) 17 7 2 1
Average measured increase (Lot 4)
0.99 ± 0.25 0.73 ± 0.35 0.83 ± 0.71 1.10
Average calculated (i.e.ex-pected) increase (Lot 4)
1.07 1.14 1.44 1.72
Table 5.6 Correlation between improvement in thermal resistance and measured cavity width
The results in Table 5.6 lead to the very surprising conclusion that there is no discernible correlation between the measured improvement in the U-value and the measured cavity width. The results were calcu-lated both for the dataset in its entirety and for the Lot 4 cases (South England) only. The results for Lot 4 were found to have a higher preponderance of relatively narrow cavities (i.e. less than 65 mm wide) but were found to show the same general pattern insofar as there was no discernible correlation between meas-ured improvement in thermal resistance and measured cavity width.

Effect of dwelling age
One topic which has been subject to frequent discussion has been the question of whether the results could be different for newer dwellings compared with older dwellings.
Following the 1976 regulations there was a move towards using lighter concrete blocks in the inner leaves of walls, in order to achieve a calculated U-value of 1.0 W/m²K or less[Ref 23], using the U-value calculation method which was in place at that time. Requirements were further tightened from approximately 1983 on-wards when wall U-values tended to fall further, to 0.6 W/m²K or less, again using the U-value calculation method in place at the time[Ref 24]. Among the post-1983 stock it is likely that some walls were built with insu-lation in the cavity but there appear to be no definitive figures for the national proportion of dwellings in this age group that were insulated at time of construction.
It was therefore of interest in this project to determine whether the measured insulation improvements could have been affected by the age of the dwelling. The results for the increase in thermal resistance are sum-marised below:
All age groups
Pre-1976 only 1976 to 1983 Post-1983 only
Average measured increase, m²K/W,(ISO 9869)
0.85 ± 0.10 0.84 ± 0.10 1.00 ± 0.30 0.83 ± 0.30
Average calculated increase, m²K/W,(ISO 6946)
1.39 1.40 1.42 1.27
No. of measure-ments
101 79 11 11
Table 5.7 Improvement in thermal resistance resulting from the application of insulation. All measurements were weighted equally in calculating these results
The results suggest a possible slightly higher improvement for dwellings in the 1976 to 1983 age band and a possibly slightly lower improvement for dwellings in the post-1983 age group, although the number of dwell-ings in these later age categories are smaller than the number in the pre-1976 age category.
Given the measurement error in the average increase in thermal resistance evaluated for the post-1976 dwellings it is possible that there could be relatively little dependence of the improvement in thermal resist-ance with age of the dwelling.

Roughness of internal finished surfaces
Some of the cases were identified as having rough internal finishes on the walls, such as ‘artex’, tiles or em-bossed wallpaper. When the measurements involving rough internal surfaces were excluded from the ana-lysis, reducing the sample from 101 to 89, the average measured thermal resistance was found to increase very slightly, by 0.02 m²K/W. The conclusion from this was that the internal surface roughness did not have a strong effect upon the improvement in thermal resistance ensuing from CWI. While this fact does not prove that a measured U-value is independent of internal surface roughness it appears to indicate that the effect of surface roughness on the measurement is negligible (or can be represented by a fixed thermal res-istance, Rsr, where Rsr is the same both before and after application of insulation).
Effect of compass direction
Owing to the numerous restrictions placed on the research teams in terms of where HFMs could be sited it was often necessary to examine walls which were not north facing. It was found, however, that the improve-ment in U-value appeared to correlate slightly with compass direction.
The following figures summarise the improvement to thermal resistance arising from insulation, showing how this varies with compass direction
All data taken to-gether
Northerly orienta-tions (N, NE, NW) only
measured increase in thermal resist-ance, m²K/W
0.85 ± 0.10 0.72 ± 0.10
calculated increase in thermal resist-ance, m²K/W
1.38 1.39
No. of measurements 101 34Table 5.8 Increase in thermal resistance resulting from the application of insulation. All measurements were weighted equally
Note: the orientations assessed in this table do not correspond exactly with the criterion given in Table 3.1 for obtaining a 100% confidence weighting for compass direction.
The results suggest that there could be some influence of compass orientation on the U-value, where north-erly orientations appear to have slightly poorer improvements in thermal resistance compared with non-northerly orientations, however the degree of variation is still within the estimated measurement error.

Extrapolation of U-value results to national housing statistics
In the course of the study the built form (i.e. whether the house was detached or semi-detached etc.) was noted. The numbers of dwellings in each built form category were compared with national statistics, based upon the Ecohomes model[Ref 25].
The national statistics figures were as follows[Ref 25]:
TOTAL DetachedSemi-de-tached Terraced Bungalow Flats
Other types
Total no. of dwellings (A) 25128 4070 7138 6960 2111 4774 75Dwellings with external cavity walls (B) 18294 3398 5548 4097 1858 3355 38Dwellings with cavity wall insulation (C) 6882 1844 1978 1379 783 867 31Dwellings without cavity wall insulation (D) 3613 584 1357 883 414 375 0Dwellings where it is not known whether wall is insulated (E) 7799 970 2213 1835 662 2112 7Dwellings insulated in this project (F) 63 22 35 3 3 0 0F / D 0.02 0.04 0.03 0.00 0.01 0.00 0.00
Table 5.9
The numbers of houses, nationally, which can be insulated are not exact owing to there being a significant number of houses where it is not known whether the cavity is insulated. It is evident from the above figures, however, that semi-detached dwellings make up the largest category (roughly 40%) of houses which could potentially receive cavity wall insulation. The second largest category appears to be that of terraced houses (roughly 20 to 25%). Detached houses appear to make up the third largest category (roughly 15%).
When we compare the numbers of dwellings in this project (row F in the table) with the numbers nationally that could be insulated (row D) it appears that in our sample detached and semi-detached houses are pos-sibly over-represented whereas terraced houses, bungalows and flats are possibly under-represented. Giv-en that flats and terraced houses tend to have more windows and doors per unit wall area (compared with detached and semi-detached houses) this project might be underestimating the effects of window and door openings on the continuity of insulation.
Conservatories and porches
A number of conservatories and porches were encountered over the course of the project and cavity insula-tion installers appeared reluctant to insulate walls in the vicinity of conservatories or porches. It is possible that the walls above conservatories were often not filled due to the reluctance of installers to set up scaffold-ing above the conservatories.
Henderson[Ref 23] estimates that approximately 13% of cavity walled homes have a conservatory and that where installers insulate a home with a conservatory between 15% and 26% of the wall area is likely to be left uninsulated. On the basis of these figures we might expect 3% of wall area nationally to be left uninsu-lated as a result of the inaccessibility posed by conservatories.

Correlations with geographical location for rendered and un-rendered properties
The average improvement in thermal resistance appeared to be higher for some areas than others, and it is possible that these apparent geographical variations could be attributable to particular factors (e.g. prepon-derance of render) rather than geographical location itself.
In order to determine whether geographical variations in thermal resistances could be attributable to the geographical distribution of external render, it was sought to determine whether the geographical variations became less marked when rendered properties were analysed separately from un-rendered properties.
The following figures show the average increase in thermal resistance resulting from insulation, given in m²K/W, for rendered and non-rendered walls. In brackets is the number of measurements from which the average was obtained.
Lot Rendered
m²K/W
Non-rendered
m²K/W
All dwellings
m²K/W
Proportion rendered
Lot 1(Scot.)
0.69 ± 0.06(23 cases)
0.77 ± 0.17 (6 cases)
0.71 ± 0.06 (29 cases)
79%
Lot 2(N. Eng.)
0.57 (only 1 case)
1.13 ± 0.09 (14 cases)
1.09 ± 0.09 (15 cases)
7%
Lot 3(Midl.)
0.76 ± 0.06(5 cases)
0.87 ± 0.07 (24 cases)
0.85 ± 0.06 (29 cases)
17%
Lot 4(S. Eng.)
0.73 ± 0.19 (7 cases)
0.96 ± 0.08 (20 cases)
0.90 ± 0.08 (27 cases)
26%
Total 0.71 ± 0.05(36 cases)
0.95 ± 0.13 (64 cases)
0.86 ± 0.04 (100 cases)
36%
Table 5.10 Increase in thermal resistance for rendered and un-rendered properties, shown lot-by-lot. All measurements are assigned an equal weighting.
Based on housing statistics data for England, 1,480,000 properties have rendered un-insulated cavity walls out of a total of 9,220,000 properties with un-insulated cavity walls. In other words 16% of properties with un-insulated cavity walls are rendered[Ref 26]. The rendered proportion of the housing stock in Wales is thought to be similar to that for England.
The reason for the proportion of rendered walls in the sample being above 16% is partly attributable to the fact that an appreciable number of the properties were located in Scotland, where there is a higher prepon-derance of rendered walls. According to the 2002 Scottish House Condition Survey, 69% of dwellings have a rendered external finish[Ref 27]. This figure rises to 88% for the 1945-1964 age band and 78% for the 1965-1997 age band.
Over England, Wales and Scotland as a whole, we might expect the overall proportion of houses that are rendered to be approximately 23%, based on a weighted mean of the figures for England and Scotland, as-suming that approximately 90% of the dwellings lie in England or Wales and approximately 10% lie in Scot-land. In the sample of measurements in the present study, however, some 36% of the walls were rendered. Rendered properties, therefore, are slightly over-represented, compared with national statistics.
The proportion of walls in Lot 1 in the sample that were rendered (i.e. 79%) appears to be consistent with the figures from the Scottish House Condition Survey. The overall proportion in Lots 2, 3 and 4 was 18% which agrees closely with the 16% from the English House Condition Survey
Examining the figures above, rendered properties tend to show a lower improvement in thermal resistance compared with non-rendered properties.
On the basis of the figures in Table 5.10 the presence of external render appears to account for some of the apparent geographical variation and the average improvement in thermal resistance (resulting from applica-

tion of insulation) appears to be less dependent on geographical location than on whether or not the prop-erty is rendered.
Thermal images and daylight photographs
Appendix A to this report contains information about dwellings which were visited both before and after application of insulation. They include thermal images, daylight photographs and results of cavity inspections but the information in those appendices is not exhaustive. A summary table is also given in Appendix B providing summarised information obtained from the thermal imagery of the properties.
Estimating the fraction of wall area covered by the insulation
There were a number of areas in properties where insulation could generally not be installed effectively, some of the principal ones being:
1. Adventitious voids in the insulation that are large enough to be detectable through thermal imaging (0.3%, theoretically fillable)
It is hard to determine why some voids were occurring but they were often observed in cavities which appeared to be clean and fully suitable for insulation and therefore it was not always the case that the insulation was being obstructed. Sometimes, but not always, these voids had a large vertical dimension, perhaps only 500 mm wide but extending from the top to the bottom of a whole storey.
Such voids were relatively easy to find through the use of thermal imaging cameras but in total they accounted for a relatively small proportion of the total wall area.
Altogether, in 13 out of the 61 post-CWI thermal imaging surveys (roughly a quarter) it was noted that there were voids in the insulation. The total area of void, where there were no obvious obstructions present, was estimated to be 15.2 square metres, out of a total net3 wall area estimated at 5350 square metres. This amounts to 0.3% of the net wall area.
2. Voids in the insulation attributable to obstructions that are large enough to be detectable through thermal imaging (0.04%, not fillable)
In a number of cases voids were noted in the cavities where insulation was missing where it appeared that insulation had been impeded. It is estimated that this was observed in approximately four of the properties, covering a total wall area of 2 square metres. When divided by an estimated net wall area of 5350 square metres this gives a percentage area of 0.04%. (This percentage does not include sub-floor areas)
3. The area immediately below roof eaves (assumed to be filled)
Below roof eaves (on non-gable walls) there was generally a band of approximately 100 mm to 200 mm high where temperatures were high. It is not clear why this was the case but it may be that insulation did not reach completely to the wall heads or that there could be strong thermal bridging effects near wall heads. It is possible, however, that the elevated temperatures could be caused, at least in part, by warm air upwelling from windows or as a result of sheltering from night sky radiation.
3 Net wall area is wall area excluding area of doors and windows

Warm areas at eaves (on non-gable walls) were noted in 27 of the 61 post-CWI thermal imaging surveys, amounting to nearly 50% of cases.
Given that drill holes were observed to be close to eaves it seems unlikely that the warm areas are due to missing insulation (unless there is subsequent settling). It is therefore possible that the warm areas at eaves are mainly attributable to thermal bridging as a result of eaves detailing (on non-gable walls) rather than due to any defects in the insulation. If this is the case, energy calculations can be addressed by using the BREDEM-12 or SAP 2005 (BREDEM 9) treatment of non-robust detailing through the use of Ψ-values or y-factors.
4. The area immediately above ground floor area (cavities not fillable below dpc level)
In many cases, particularly where suspended ground floors were used, a band of approximately 200 mm to 300 mm high was observed where external surface temperatures were elevated. For a typical two-storey dwelling this would amount to approximately 5% of the total gross wall area or 7% of the total net wall area.
Elevated external surface temperatures at wall-floor junctions were noted in 10 out of the 61 post-CWI thermal imaging surveys.
It has been assumed, for this report, that the impact of detailing at wall-floor junctions is best addressed through the use of Ψ-values or y-factors as is done for other types of thermal bridging at junctions and around openings.
5. The area around lintels (not fillable)
Generally a band of high heat transfer was noted around lintels leading to a 250 mm warm band at each lintel. It is estimated, on the basis of typical window widths, that the total area of high heat transfer at lintels is approximately 4% of the gross wall area or 5% of the net wall area.
Significant heat transfer at lintels was noted in 32 out of the 61 thermal imaging surveys.
Detailing at lintels is, however, allowed for in SAP 2005 calculations, which has an in-built allowance for non-robust details in general, and such non-robust detailing may best be dealt with through the y-value methodology associated with SAP 2005 or the Ψ-value methodology in BREDEM-12(2001).
6. Conservatories (3%, not fillable)
Studies by Henderson[Ref 23] et al suggest that perhaps around 13% of cavity walled homes have a conservatory and that, when installers encounter a conservatory, they may leave between 15% and 26% of the wall area uninsulated. On the basis of these figures we might expect around 3% of the wall area nationally to be left uninsulated as a result of the presence of conservatories.

7. Missing insulation below windows (accounted for alongside other 'adventitious voids')
Sometimes it was observed, through the thermal imaging surveys, that the walls below windows, particularly bay windows, were not insulated. In some instances, particularly when bays had a different external finish to other parts of the wall, it was not possible to determine whether insulation was present and cavity inspection was necessary. It is difficult to arrive at a percentage estimate of the bay window area not covered, however it became clear in the course of the project that there is a reasonable chance of insulation not being present beneath bay windows.
National statistics suggest that on average we may have 1.0 square metre of area below bay window per dwelling. If we assume that the walls below bay windows are left uninsulated in a fraction of cases this would amount to an average uninsulated area of a fraction of a square metre per dwelling, contributing to the overall fraction of wall area that is classed under 'adventitious voids'.
8. Junctions with extensions (not fillable)
Thermal bridging at junctions between an extension and the rest of the house was noted in approximately 10% of cases and was clearly visible in some of the thermal images. Such junctions may best be addressed by applying linear thermal bridging terms (Ψ-values) or a y-value for the dwelling as a whole) to allow for the fact that the detailing at junctions with extensions is probably not robust in general.
9. Insulation of gable peaks (no correction applied and fillability is not relevant)
In general, CWI installers were found to have insulated gable peaks as a matter of course, with drill holes being carefully sited just two or three bricks below the line of the roof. The practice of insulating gable peaks will not normally have any effect upon heat loss, since the additional area covered generally applies to an area which is unheated. The reason for this practice was not to improve thermal performance but to reduce risks such as rain penetration. Indications from the project are that, on the basis of observed hole drill patterns, installers are insulating gable peaks consistently.
10. Tile hung and timber-paneled walls (not fillable)
During the course of the project several of the houses had tile hung or timber panelled walls where it was not possible to insulate. In some cases the area of wall covered by such panels was relatively small but there were other instances (e.g. property no. 12) where the area was relatively large.
In previous EEC calculations, tile-hung walls and timber-panelled walls had not been allowed for. Information from the 2004 English House Condition Survey indicates that for existing uninsulated cavity walls, some 5% of the wall area is taken up by tile, timber or other cladding[Ref 26].
11. Instances where the customer requests that certain facades are not insulated (not fillable)
There were some instances where the customer was concerned about the appearance of drill holes and requested that certain facades not be insulated. It would be difficult to estimate nationally how often this is likely to occur, however.
Figure 3 illustrates the categories of voids in the insulation in walls, showing their relative proportions.

Adventitious voids in theinsulationVoids in the insulation that areattributable to blockagesVoids due to conservatories
Voids due to tile-hung andtimber-panelled walls
Figure 3
On the basis of the above factors, we might expect approximately 10% of the wall area nationally to be left uninsulated, mainly as a result of conservatories, tile hanging, adventitious voids and voids due to obstructions (e.g. DPC sheets or rubble) preventing the insulation from filling. The effects of lintels, roof eaves (on non-gable walls), window sills and wall-floor junctions are not included here as these are considered to be covered in either the BREDEM-12 Ψ-values or the SAP 2005 y-factors.
The basis of the energy calculations and the results are given in Appendix C.

Issues identified and proposed refinements
In the course of the analysis, some issues were identified and there was some considerable discussion between the teams on how these issues might best be tackled. The general aim of these discussions has been to consider opportunities to improve and refine techniques in order to maximise accuracy and reliability of the measurements. This has led to refinements to the approach. the following points, developed from those discussions, may offer useful pointers for future research of this nature:
In some cases, particularly in the case of south facing walls, unexpectedly high temperatures were occasionally recorded by the thermistors. While this only happened over restricted time periods and only on certain days, it is thought that these temperature peaks arose from sunshine falling on the thermistors.
It was initially thought that a better indication of wall surface temperatures could be obtained by firmly taping small type-T thermocouples to the wall using a suitable masking tape (or duct tape), however tests by BRE during the summer of 2005 established that thermocouples installed in this way do not give the same temperature as the neighbouring brick surface, and it seems as though the duct tape can act as a kind of sun trap.
To gain a better understanding, some walls in Lot 2 were given embedded sensors, which were typically situated 50 mm into the mortar joints. This was done in case study no. 19, for example, which had U-value measurements carried out on the south-west facing facade. The results in the table show that the results for the embedded sensor agreed well with those derived from the readings given by the external thermistor, suggesting that in most cases the method of external temperature measurement is unlikely to be critical to the resulting U-value.
Case study no. 19 Result when measured using an external temperature sensor (as was done for most measurements in the project)
Result when measured using embedded sensor in the brickwork
Difference in thermal resistance, m2K/W
U-value prior to insulation, W/m2K 1.26 1.44 -
Thermal resistance value, prior to insulation, m2K/W
0.79 0.69 0.10
U-value after insulation, W/m2K 0.52 0.56 -
Thermal resistance value, after insulation, m2K/W
1.92 1.79 0.13
Change in thermal resistance, m2K/W
1.1 1.1 -
Table 5.11
It is to be expected that the U-values will be slightly higher in the case of the embedded sensors since the sensors were embedded fairly deeply in the brickwork (perhaps 50 mm, equivalent to a difference in thermal resistance of 0.050/0.77, or 0.065 m2K/W) and the embedded sensors also do not include the effect of surface resistance (typically 0.04 m2K/W). It would therefore be expected that the difference in thermal resistance between the two types of measurement to be approximately 0.105 m2K/W, a figure which closely agrees with the last column of the above table. The results in this table

therefore appear to suggest that it does not matter whether the external sensor is suspended in air (near the wall surface) or embedded in the brickwork.
Another approach would be to extend the length of the monitoring period from two weeks to approximately four weeks and to select the data corresponding to the most cloudy periods, thereby minimising the effects due to sunlight.
Analysis of the heat flux measurement data
All of the teams relayed the raw heat flux measurement data to BRE for analysis of the 70 dwellings. In order to facilitate a consistent analysis, in-house software was used. This software has provided a convenient interface and facilitated in the development of some of the results tables. The software not only provides U-values on the basis of heat flows but can also provide instant comparisons with expected U-values, derived on the basis of the constructions.
Tests on dataloggersFollowing the problems that were encountered with some of the Eltek dataloggers in the initial batch of measurements in March 2005, the team covering Lot 1 carried out some systematic tests of the dataloggers over the summer of 2005. The loggers were set to record data over extended periods of time in order to test whether battery life was an issue as well as to find out whether some of the loggers would stop logging of their own accord.
One particular Eltek logger malfunctioned in a property in Lot 1 in March 2005 and stopped logging after only 4 days of being installed. The Lot 1 team decided to leave this particular logger to run continuously over a period of a few months. The team found that it was still logging after 2.5 months. It then stopped logging of its own accord, and the Darca downloading program, when run, could not find data to offload. The battery voltage by the end of this time was down to 6.5V. Despite the depleted battery power it was still possible to connect to the logger, and the clock and settings were still correct. The team tried changing the batteries in order to find out whether this would enable the data to be offloaded, but after changing the bat-teries it was still not possible to offload the data. This was surprising as the dataloggers each incorporate a lithium cell which is designed to act as a backup to the standard AA batteries which are used, and the lithi-um cell under normal conditions should preserve recorded data (and clock settings) while AA batteries are being changed. No clear conclusion could be reached about exactly how the datalogger was malfunctioning but it appears that when the AA battery voltage falls too low, it is quite likely to lead to loss of data in at least some of the Eltek dataloggers.
Hole drill patternsOnce cavity insulation had been installed the walls were inspected in order to locate the drill holes which had been made by the installers. In general, it was found that a row of drill holes had been made approximately every 12 courses of bricks. This is broadly in keeping with recommendations from manufacturers of mineral wool. Horizontally, the drill holes were generally spaced every 5 brick widths, again broadly in keeping with manufacturers recommendations for mineral wool. Most of the installers tended to use a staggered pattern rather than a grid pattern. Some geographical variations have been observed, and are thought to be due to variations in the practice of individual CWI installers. For example, in Lot 4, many of the properties were carried out by just one or two installation companies.
Additionally, some of the occupiers in Milton Keynes, who took a keen interest in the work, had liaised with the installers and found that the installers were monitoring their own work closely and, when they found that

they had underestimated the amount of fill material needed, had taken the trouble to install additional insula-tion material in order to ensure that the job was carried out correctly.
It was noted that in the north of England (Lot 2) hole patterns were not always precise and that in some in-stances spacings could be as little as 3 or 4 brick widths over parts of the wall and in other parts of the same wall horizontal spacings could be as much as 6 or 7 brick widths. Vertical spacings could also vary and in some cases could be up to 18 brick courses. Additionally, holes were not always made on the same level (brick course). A row of holes could, at times, drop by one brick course or rise by one course of bricks in a seemingly haphazard fashion, perhaps due to the installer encountering mortar that was difficult to drill through or obstacles such as wall ties.
In the Midlands (Lot 3) the brick spacings tended to be about 5 bricks (horizontally) but they could be as little as 3 bricks (where there are perturbations) or occasionally as much as 6 bricks. Vertically the holes were spaced around 12 brick courses but in some cases the vertical spacings could be as much as 15 courses
In Essex (Lot 4), hole patterns were found to be quite regular, suggesting that the installers in the area were particularly precise in the way they positioned drill holes.
In Scotland (Lot 1) it was difficult to examine drill patterns due to the fact that most of the walls were rendered and drill holes tended to be very well camouflaged. It was difficult, therefore, to make firm conclu-sions about the spacings of CWI drill holes in Scotland. Where discernible, hole spacings tended to be in the range 1000 to 1500 mm both horizontally and vertically, which is roughly in keeping with manufacturers' guidelines. Despite this wide range, in any one house the spacings looked to be fairly consistent. Holes were positioned 200 to 250 mm below cills and spaced 500 to 800 mm horizontally.
Below window sills, in all areas, there was generally a row of holes approximately 3 brick courses (in some cases 2) below the window sill and these holes tended to be located fairly close together.
Drill holes in all areas tended to be either 2 or three brick courses below eaves and holes tended to be posi-tioned relatively close together with a horizontal spacing typically of around 4 brick widths.
Only a small number of instances of EPS insulation were observed, however, as expected, these had a markedly different drill-hope pattern. In one property in Scotland there were only two rows of holes in the wall, one in the middle, and one high up, with approximately 700 mm horizontal spacing between the holes. In this property there were also some larger holes which may have been made for the installation of a barri-er brush to prevent migration (i.e. trespass) of insulation to the adjoining property.
Overall, therefore, the hole drill patterns were found to be good, suggesting that installers are following pub-lished guidance.

Influence of sunlight upon the measurementsOver the course of the project, sunlight affected both the thermographic imaging and the U-value measure-ment.
Firstly, thermal imaging was sometimes found to be affected by residual warmth in the south-facing and west-facing walls well after dark, and this effect was quite prevalent in the November 2005 thermal images (post-CWI). It was also quite prevalent in the December 2005 thermal images (pre-CWI) due to the sunny weather at the time. In both cases solar-related heat storage was still apparent even at 9.00 pm. It was generally less of a problem in the March 2005 and February 2006 images. In order to allow for residual sol-ar heat it was at times necessary to revisit properties later in the evening in order to allow the wall surfaces to cool, and in a number of cases, in both Lot 1 and Lot 3, the properties were revisited shortly before dawn in order to minimise thermal storage effects.
Sunlight also affected heat flow measurements. On the one hand, the warming of the wall surfaces would have a tendency to reduce heat losses as the external brick surfaces become warmer than the air outside, leading to reduced heat loss. On the other hand, the sunlight tends to warm the external thermistors, lead-ing to the thermistors having a higher temperature than either the external air temperature or the external wall temperature. Although these two effects cancel out to some extent there is some uncertainty about how well they cancel.
It was noted from the measurements that some thermistors were warming up during sunny times of the day and there were also suggestions from the data that thermistors were getting very cold on clear nights. Observation of the data revealed that during clear, sunny periods the statistical variance in the temperature of the external temperature probes was very high whereas on cloudy periods the variance in measured external temperature was much lower. The indications from the data are that the variance in the measured external temperature could provide a good indication of whether sunlight-related effects are coming into play.
Examination of the correlations of wall orientation with measured U-value seems to suggest that the effect of thermistors warming up in sunlight has not led to a major distortion in the measured U-values, however it does raise a long-term question about how best to address this problem.
It would seem reasonable to suppose that north facing facades will be minimally affected by sunlight and that measurements taken on such facades will be free from sunlight-related distortions. Similarly, walls which are heavily shaded by bushes, trees or neighbouring buildings are also likely to be relatively free from sunlight-related distortions. Unfortunately, however, it is not always possible to locate heat flux meters on north facades, particularly if occupiers impose restrictions on where they will permit heat flux meters to be sited or if there are radiators and heating pipes in the way or if windows are very large (leading to relatively little suitable wall being left). It would, therefore, be of some benefit if a method could be developed which would enable U-values to be measured reliably on wall surfaces of more southerly orientations.
Intuitively, it might be expected that the effect of sunlight is minimal in midwinter when sunlight is weak and therefore any sunlight-related errors would tend to be small at that time of the year. It is also intuitively expected that north-facing facades would be relatively free of sunlight-related distortions. There is, however, a potential problem with regard to night-sky radiation, whereby external temperature sensors can become colder than the surrounding air and adjacent brickwork, through a mechanism similar to that which leads to the development of ground frost. Therefore, there is the potential that during mid-winter the probes may be underestimating external temperatures whereas in autumn and spring, particularly during sunny periods in autumn and spring, the external temperatures may be being overestimated. There is also the possibility that external temperatures could be being underestimated at north facing facades (particularly

when there are cold clear nights), whereas external temperatures may be being overestimated on south facing facades (particularly during sunny weather). All of these distortive effects are likely to be less marked during cloudy weather and more marked during clear, sunny weather, however the drawback with cloudy weather is that cloudy periods are often associated with mild outdoor temperatures, leading to poorer contrasts in temperature between inside and outside.
The simplest way of dealing with these problems would be to carry out U-value measurements over longer time periods and to select those parts of the data for which the weather was known to be cloudy, however carrying out measurements over longer periods does introduce its own problems. For example, there is the increased risk of dataloggers failing. In the end, the researchers agreed to carry out several of the measurements over three week periods instead of the usual two weeks. This approach required negotiations with occupiers but in the end extended measurements were carried out in properties in all of the Lots covered in this study. The data from these has been particularly helpful and it was observed that in many cases the 'drift' in the U-value was relatively slight, although it has to be said that the results are not fully conclusive. In some instances an unexplained 'drift' was detected but it is difficult to be certain that other environmental conditions were not coming into play and in particular the possibility of occupiers accidentally dislodging some of the heat flux meters.
It would in principle be possible, in future studies, to shield the thermistor probes from sunlight, but this approach would not address the fact that the brick facades (or external render) are themselves heated by the sun and that simply shielding thermistors, therefore, may lead to misleading results. Probably the ideal solution would be to provide shade to the whole section of wall which is being tested, so that the thermistor AND the brickwork would both be in the shade. An approach which might be acceptable, but which would need verification, would be to shelter the facade using a flexible foil-faced insulation material, which should be relatively impervious to visible sunlight, infrared and most other parts of the solar spectrum. The shading device would need to allow easy circulation of air behind it in order to keep the measurement as realistic as possible. If it were possible to establish that shading devices were suitable, the use of shading might, in principle, enable U-value measurements to be carried out during marginal months such as April and October.
From the analysis carried out in this project, there was usually no general direction of drift in the U-value, ex-cept in a small number of instances. It is therefore concluded, on the basis of preliminary anaysis and ex-amination of correlations, that sunlight has only a relatively small effect upon a U-value measurement, provided that the contrast in temperature between inside the dwelling and outside is fairly large. Property number 68, shown in Appendix A68, was used as a test case (based on an east facing facade during sunny February weather) and the dataset from that property suggests that the effect of sunlight can affect the U-value by around 0.02 W/m2K. A similar study was also carried out on property number 24, which involved a south-facing facade during February 2006, which suggested that the error in the U-value for a south-facing facade might be as large as 0.04 W/m2K.
Thermal bridging arising from incomplete insulationOver the course of the investigations of the houses carried out subsequent to insulation being installed, a significant number of instances of missing or defective insulation were identified. This was especially true among the Lot 1 properties which were examined in February 2006, but it was also true of all the Lots covered in the project both in the November 2005 and the December 2006 visits.
In one house, in Pudsey, Yorkshire, it was found that there were no drill holes below the bay window of the lounge. On examining the cavity it transpired that the cavity was clear of obstructions and yet had not been filled with insulation. It was not established for certain whether the cavity was fully 50 mm wide, however it

was notable that the cavity did not appear even to have been inspected by the installers.
Generally, however, cavity walls at bay windows were filled and this uninsulated wall below the bay window was the exception rather than the rule. There were, however, instances where the bay window had panel-ling or did not have a cavity suitable for insulation, and therefore there were, in total, a number of instances where the wall immediately beneath a window was not insulated.
In one house in Hale (case study no. 61) thermal imaging revealed that parts of the rear wall were leaking considerably more heat than other parts of the facade. The property was revisited during the day and an in-spection hole was drilled. It was found that there were considerable voids, measuring about half a metre square, where the glasswool insulation had not reached. This was surprising as there were no obvious ob-structions in the cavity and the cavity was relatively clean, and the CWI drill holes were spaced in the usual way. It was not understood, therefore, why the insulation had not filled the cavity, although it is theoretically possible (but by no means definite) that the blow pipe had not been switched on for long enough when this location was filled.
In one house in Manchester (case study no. 19) thermal imaging revealed that parts of the front facade were slightly warmer than other parts of the facade. The property was therefore revisited during the day and inspection holes drilled. Inspection revealed that mineral wool insulation had indeed been installed but that the compactness of the insulation was unusually low and that there was a small gap, perhaps 5 or 10 mm wide, between the mineral wool fill and the outer brickwork, where it was possible to see several inches down the wall. It seems possible that the low compactness of the insulation at this part of the wall was lead-ing to increased heat loss.
In one house, in Gomersal, it was found that the section of wall between the front door and the side wall was losing a considerable amount of heat despite there being drill holes evident. On inspecting the cavity it was found that this section of wall was completely empty. This was very surprising as there were drill holes present and the cavity did not seem to have any obvious signs suggesting that it was unsuitable for CWI.
Some properties in Scotland and in the Midlands were found to have missing sections of insulation which were vertical in shape and about one or two feet wide. It is not clear why this happened and it seems pos-sible that CWI installation equipment might have been malfunctioning. Property number 26 fell into this cat-egory and photographs of the cavity are shown in the relevant section of the Appendix.
In one instance in Nottingham (case study no. 48) the cavity was found to be only 12 mm wide and was ob-served to have obstructions in places. Nevertheless, it was indicated by the installer that they intended to fill the cavity despite it being less than the advisory minimum of 50 mm. A pre-insulation U-value measure-ment was therefore carried out. Following the initial U-value measurement, the CWI installer decided in the end not to fill the cavity.
While thermal imaging was helpful in finding many sections of missing insulation there were some instances where the thermal imaging failed to draw attention to sections of wall which in the end were found to be un-insulated. It is therefore concluded that although thermal imaging is a good way of finding areas which may be uninsulated it should not, in the author's view, be regarded as a substitute for inspecting a cavity visually.
Weather conditions and resulting U-values
Weather conditions can have a significant impact on the quality of the U-value measurement. The optimal weather conditions for carrying out U-value measurements correspond to cold, overcast and calm weather where there are large differences between the internal temperatures and the external temperatures.
If the data has been affected by changing weather conditions or from mild weather or sunny spells then the U-value on the graph tends to drift either upwards or downwards (with respect to time). An upward or

downward drift could also be caused by changing wind speeds, although in this case this effect would need to be considered to be a real variation in the U-value.
Some research has suggested that wind could influence U-values through a phenomenon known as 'wind-washing', whereby wind-driven air passes through parts of a wall, passing around or through the insulation and removing heat in the process. To assess this reliably would require careful monitoring of wind speed and direction over an extended period of time in order to examine whether the U-value drifts between periods of low wind and periods of high wind. Strictly speaking this effect is not an error but is a genuine variation in the U-value but it is an effect which is difficult to interpret in practice.
A systematic study of drifts in U-values caused by changes in wind speed revealed few definitive clues, except in case 19, where some evidence of a U-value drift with wind speed was found. The reason for the limited results regarding wind speed correlations may be due to
(a) The U-value is thought to be influenced by wind only on the windward side of the house
(b) A given dataset needs to contain both a windy and a calm period where both the windy and the calm period need to last for about three or more consecutive days. This seldom happened, but did happen in case study 19, where the U-value was observed to drift by up to 10% at both southwest-facing measurement points.
All of the measurements prior to application of cavity wall insulation were carried out either in March 2005 or December 2005. All of the measurements following application of cavity wall insulation were carried out either in November 2005 or early 2006. Commentary summarising the weather throughout the UK during this period was available from the Met Office web site. Information on the weather conditions according to the Met Office web page during this period are given in Appendix D and were used to assist in interpretation of the results.

Improvements to living conditions arising from the application of insulation
Over the course of the project it was noted that many occupiers perceived an improvement in internal temperatures, particularly if they had received both loft insulation and cavity wall insulation. Other properties, however, did not seem to experience a significant rise in temperature but instead occupiers had commented that their heating system was on less often. Table 5.12 gives the temperatures before and after the application of insulation, based on the recorded temperatures during the measurements.
Ref. Ti, pre-CWI Te, pre-CWI Ti-Te (pre-CWI) Ti, post-CWI Te, post-CWI Ti-Te post-CWI01A 15.4 6.0 9.4 15.0 10.8 4.201B 11.2 7.8 3.4 17.3 11.7 5.602A 18.1 9.3 8.8 19.4 12.2 7.202B 18.4 9.1 9.3 20.2 12.2 8.003A 19.1 9.0 10.1 18.6 9.3 9.303B 19.5 9.7 9.8 19.0 10.0 9.004A 18.2 5.1 13.1 18.7 4.0 14.704B 17.5 4.7 12.8 18.4 3.4 15.005A 18.4 10.0 8.4 19.4 9.9 9.505B 18.8 10.0 8.8 19.6 11.1 8.506A 20.3 10.8 9.5 21.0 14.2 6.906B 20.0 10.3 9.7 20.2 12.2 8.007A 19.3 11.1 8.2 20.6 11.2 9.407B 20.5 11.5 9.0 19.9 10.7 9.208A 17.9 9.7 8.2 18.8 9.6 9.208B 14.9 10.1 4.9 16.5 10.0 6.509A 21.3 4.8 16.5 21.0 1.9 19.109B 21.2 5.2 16.1 20.3 1.9 18.410A 19.7 11.0 8.7 19.3 10.0 9.310B 20.2 10.1 10.1 20.5 10.4 10.111A 20.4 4.8 15.6 22.1 5.1 17.011B 21.4 5.1 16.3 21.2 3.3 17.912A 17.6 10.8 6.8 19.1 11.2 7.912B 18.0 11.2 6.8 19.2 10.7 8.513A 20.7 4.7 16.0 20.1 3.0 17.113B 18.7 5.0 13.7 19.5 2.8 16.714A 19.5 7.2 12.314B 16.5 5.5 11.0 18.7 4.4 14.315A 17.1 7.9 9.2 18.4 9.5 8.915B 17.7 7.9 9.8 18.4 9.9 8.516A 17.9 6.9 11.0 19.2 8.7 10.516B 17.2 6.9 10.3 19.5 8.8 10.717A 18.5 8.0 10.5 17.5 8.0 9.517B 17.5 8.0 9.518A18B

Ref. Ti, pre-CWI Te, pre-CWI Ti-Te (pre-CWI) Ti, post-CWI Te, post-CWI Ti-Te post-CWI19A 18.0 6.1 11.9 17.8 4.0 13.819B 18.0 6.1 11.9 17.5 8.0 9.520A 21.2 7.5 13.7 19.9 9.2 10.720B 21.6 7.5 14.1 20.4 9.2 11.221A 17.2 8.3 8.9 15.9 9.8 6.121B 17.7 8.8 8.9 17.1 9.1 8.022X 16.4 7.5 8.923A 20.2 8.3 11.923B 20.3 8.2 12.124A 18.5 6.1 12.4 17.5 5.4 12.124B 19.1 6.1 13.0 18.1 4.8 13.325X 20.8 5.1 15.7 20.8 5.1 15.726A 18.0 8.9 9.1 18.7 9.2 9.526B 19.4 8.7 10.7 18.9 9.2 9.727A 20.6 9.4 11.227B 20.6 10.0 10.628A 20.9 7.7 13.2 19.0 7.5 11.528B 21.9 7.9 14.0 21.1 7.5 13.629A 23.0 9.2 13.8 19.6 8.6 11.029B 23.5 9.4 14.1 19.8 8.8 11.030A 19.8 5.3 14.5 20.7 3.8 16.930B 18.3 5.4 12.9 19.0 3.8 15.231A 21.7 8.9 12.8 20.3 9.1 11.231B 21.7 8.9 12.8 20.6 9.3 11.332A 20.4 10.4 10.0 20.1 9.2 10.932B 19.6 10.3 9.3 19.3 9.1 10.233A 21.5 6.1 15.4 23.5 4.9 18.633B 16.5 6.2 10.3 18.0 4.9 13.134A 16.2 6.1 10.1 16.0 4.6 11.434B 16.6 6.8 9.8 17.1 5.3 11.835X 18.5 9.7 8.8 18.1 8.5 9.636A 20.9 5.7 15.2 21.1 4.0 17.136B 21.9 5.9 16.0 21.1 4.0 17.137X 21.1 6.2 14.9 21.0 4.0 17.038A 19.3 5.7 13.6 18.9 4.6 14.338B 19.3 6.0 13.3 19.9 4.8 15.139A 21.5 5.3 16.2 22.3 9.2 13.139B 18.1 8.2 9.9 20.5 9.2 11.340A 20.1 8.6 11.5 20.0 8.3 11.740B 19.5 8.6 10.9 18.8 8.0 10.841A 20.7 10.3 10.4 20.9 8.5 12.441B 20.1 10.3 9.8 20.4 8.5 11.942A 20.8 10.4 10.4 21.5 9.5 12.042B 21.0 10.4 10.6 21.8 9.5 12.343A 19.1 6.3 12.8 19.7 6.1 13.6

Ref. Ti, pre-CWI Te, pre-CWI Ti-Te (pre-CWI) Ti, post-CWI Te, post-CWI Ti-Te post-CWI43B 18.8 6.3 12.5 19.7 4.7 15.044A 19.4 12.5 6.9 19.2 9.5 9.744B 19.3 12.5 6.8 19.0 9.5 9.545X 20.8 6.1 14.7 21.0 9.3 11.746A 21.0 5.9 15.1 21.0 5.5 15.546B 19.4 5.9 13.5 19.5 5.5 14.047A 19.8 8.6 11.2 20.4 9.0 11.447B 20.0 8.6 11.4 20.6 9.0 11.648A 22.6 4.8 17.848B 24.3 4.8 19.549X 19.9 11.0 8.9 18.8 8.6 10.250A 19.6 8.6 11.0 21.2 8.8 12.450B 20.2 8.6 11.6 21.5 8.8 12.751A 17.7 11.2 6.5 18.7 8.6 10.151B 18.1 11.2 6.9 19.0 8.6 10.452A 18.8 9.5 9.3 17.3 10.5 6.852B 16.8 9.5 7.3 18.0 10.5 7.553A 14.9 4.1 10.8 14.0 2.9 11.153B 17.2 4.3 12.9 15.9 2.9 13.054A 14.6 4.6 10.0 15.2 2.2 13.054B 17.8 4.6 13.2 18.3 2.2 16.155A 19.3 4.3 15.0 20.6 3.4 17.255B 16.2 4.3 11.9 18.3 3.8 14.556A 20.2 4.9 15.3 20.5 3.8 16.756B 17.8 4.9 12.9 19.1 3.8 15.357A 21.6 4.1 17.5 22.2 4.3 17.957B 18.6 4.1 14.5 20.1 4.3 15.858A 20.5 4.4 16.1 21.0 8.6 12.458B 19.1 6.0 13.1 19.6 6.0 13.659A 19.5 6.2 13.3 23.2 5.7 17.559B 19.4 5.6 13.8 20.0 4.1 15.960A 15.7 6.0 9.7 16.3 4.6 11.760B 14.4 6.3 8.1 15.6 4.8 10.861A 14.2 5.5 8.7 13.8 3.4 10.461B 14.2 5.5 8.7 13.8 3.4 10.462X 13.6 4.5 9.163A 17.4 5.9 11.5 18.5 8.2 10.363B 17.4 5.9 11.5 18.1 8.1 10.063C64X 12.8 6.5 6.365X 18.2 5.6 12.666A 15.9 3.4 12.566B 16.9 3.4 13.567A 19.6 6.6 13.067B 19.6 6.6 13.0

Ref. Ti, pre-CWI Te, pre-CWI Ti-Te (pre-CWI) Ti, post-CWI Te, post-CWI Ti-Te post-CWI68A 21.9 5.6 16.3 22.2 3.3 18.968B 21.9 5.6 16.3 21.7 4.7 17.069A 19.6 4.4 15.2 19.9 4.2 15.769B 19.0 4.4 14.6 19.7 4.2 15.570A 18.4 4.6 13.8 20.1 4.4 15.770B 17.8 4.6 13.2 18.4 4.4 14.0
Average 19.1 7.4 11.7 19.1 7.0 12.2
Table 5.12 Improvements to living conditions resulting from the application of cavity wall insulation
It is notable from the table that, although the internal temperatures did not change significantly the average difference in temperature between inside and outside increased by approximately 0.5 degrees C. This would seem to suggest that there was a comfort uptake but that this comfort could have been masked by the change in weather conditions.
Defining a measured U-value
Under steady temperature conditions the U-value of a wall construction is equal to the heat flow, Q (in watts), through unit area (in square metres), A, divided by the difference between the internal temperature, Ti (in °C), and the external temperature, Te (in °C). In other words,
U = Q / A (Ti - Te)
provided that the internal temperature is higher than the external temperature.
The heat flux, q, is the flow of heat (in watts) per unit area (in square metres). The above relation can there-fore be rewritten as
U = q / (Ti - Te)
In occupied buildings, steady state conditions do not occur in practice since internal and external temperat-ures will both fluctuate. As a result, heat flows will also fluctuate due to a combination of variations in tem-perature and heat storage effects.
However, the ratio of average heat flow to average difference in temperature remains reasonably constant provided that the period of averaging is sufficiently long. The necessary period of averaging depends upon the thermal mass or thermal inertia of the construction and tends to be longer for heavy constructions and shorter for lightweight constructions. An averaging period of two weeks appears to be sufficient for tradition-al cavity walls, although there are advantages in using longer periods of measurement.
Table 12 gives the daily average readings from one of the measurements (case 6B), giving the date, the mean internal temperature for that day (Ti), the mean external temperature for that day (Te), the mean EMF signal from the heat flux meter, the mean heat flux (q) and inferred U-values.
The error in a U-value measurement depends upon the period of averaging and tends to be less when averaged over a large number of days and greater when averaged over a smaller number of days. The error also tends to be larger if the statistical variances (or standard deviations) in the internal and external temperatures are large.
Since it is not possible to determine a U-value accurately from just one day's worth of data, a U-value has to

be calculated from the average temperature and heat flux readings, taken over several days. The column in Table 12 entitled "U5-day" gives the U-values inferred from the readings taken over the previous 5 days. It is notable that this "5-day" U-value fluctuates considerably due to the heat storage effects in the wall construc-tion. The "5-day" U-value is, however, a useful parameter as it gives a measure of the size of the random fluctuations in internal temperature, internal temperature and heat storage in the wall. A high degree of fluc-tuation indicates a large error arising from random fluctuations whereas a low degree of fluctuation indicates a small error arising from random fluctuations.
The 5-day U-value is calculated as the mean heat flux over 5 consecutive days divided by the mean differ-ence in temperature over the same 5 day period. In other words,
U5-day = q5-day / (Ti, 5-day - Te, 5-day)
Similarly, a 10-day U-value is calculated as the mean heat flux over 10 consecutive days divided by the mean difference in temperature over the same 10 day period. The random fluctuations in the 10-day U-value will normally be less than the random fluctuations in the 5-day U-value. This can be seen by inspec-tion of the 5-day and 10-day U-values shown in the table.
Date Ti Te EMF(mV) q(W/m²) U5-day U10-day U15-day U19-day
29/10/2005 21.769 15.358 0.139 2.367 - - - -30/10/2005 22.250 17.329 0.206 3.517 - - - -31/10/2005 21.390 15.000 0.070 1.189 - - - -01/11/2005 20.415 12.469 0.135 2.293 - - - -02/11/2005 20.635 15.356 0.217 3.704 0.422 - - -03/11/2005 21.219 15.296 0.165 2.818 0.444 - - -04/11/2005 20.440 11.123 0.151 2.577 0.361 - - -05/11/2005 19.406 10.235 0.246 4.188 0.414 - - -06/11/2005 20.227 13.875 0.226 3.851 0.475 - - -07/11/2005 21.115 11.754 0.346 5.902 0.482 0.456 - -08/11/2005 21.746 14.383 0.330 5.627 0.533 0.495 - -09/11/2005 21.402 9.325 0.249 4.248 0.537 0.460 - -10/11/2005 20.740 12.194 0.305 5.198 0.568 0.497 - -11/11/2005 20.219 13.933 0.071 1.212 0.509 0.494 - -12/11/2005 18.640 8.948 0.118 2.009 0.416 0.448 0.441 -13/11/2005 17.262 6.817 0.229 3.906 0.352 0.437 0.439 -14/11/2005 18.556 5.723 0.465 7.916 0.423 0.478 0.446 -15/11/2005 16.969 11.319 0.241 4.106 0.426 0.496 0.472 -16/11/2005 7.781 7.862 -0.052 -0.878 0.443 0.478 0.477 0.457
Average 19.588 12.016 0.203 3.461 0.454 0.474 0.455 -Std. dev. 3.217 3.234 0.116 1.978 0.063 0.022 0.018 -
Table 12
From the figures in Table 12 the standard devation in the 5-day U-value is 0.063 W/m²K, the standard devi-ations in the 10-day and 15-day U-values are only about 0.02 W/m²K, suggesting that as the measurement period becomes longer, the uncertainties in the measurement become less. The means of the 5-day, 10-day and 15-day U-values are 0.45 W/m²K, 0.47 W/m² and 0.46 W/m²K respectively. This variation in the mean U-value caused as a result of combining the readings in different ways gives an indication of the error
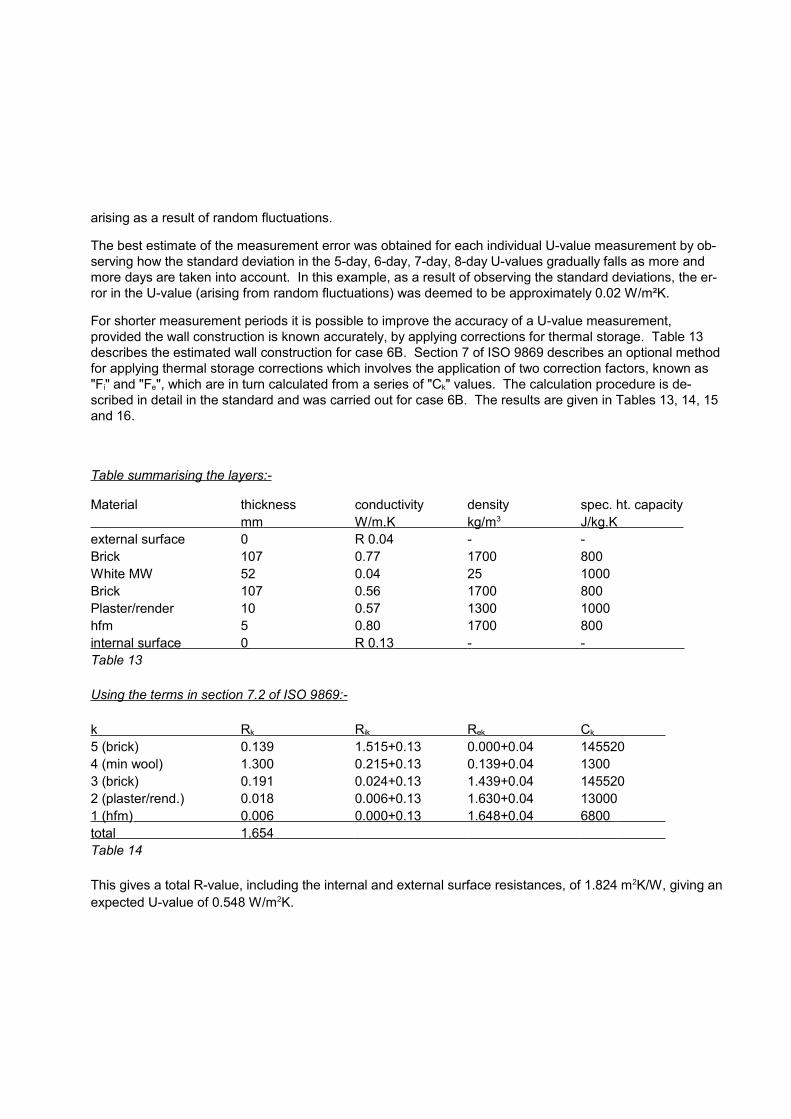
arising as a result of random fluctuations.
The best estimate of the measurement error was obtained for each individual U-value measurement by ob-serving how the standard deviation in the 5-day, 6-day, 7-day, 8-day U-values gradually falls as more and more days are taken into account. In this example, as a result of observing the standard deviations, the er-ror in the U-value (arising from random fluctuations) was deemed to be approximately 0.02 W/m²K.
For shorter measurement periods it is possible to improve the accuracy of a U-value measurement, provided the wall construction is known accurately, by applying corrections for thermal storage. Table 13 describes the estimated wall construction for case 6B. Section 7 of ISO 9869 describes an optional method for applying thermal storage corrections which involves the application of two correction factors, known as "Fi" and "Fe", which are in turn calculated from a series of "Ck" values. The calculation procedure is de-scribed in detail in the standard and was carried out for case 6B. The results are given in Tables 13, 14, 15 and 16.
Table summarising the layers:-
Material thickness conductivity density spec. ht. capacity mm W/m.K kg/m 3 J/kg.K external surface 0 R 0.04 - -Brick 107 0.77 1700 800White MW 52 0.04 25 1000Brick 107 0.56 1700 800Plaster/render 10 0.57 1300 1000hfm 5 0.80 1700 800internal surface 0 R 0.13 - - Table 13
Using the terms in section 7.2 of ISO 9869:-
k R k R ik R ek C k 5 (brick) 0.139 1.515+0.13 0.000+0.04 1455204 (min wool) 1.300 0.215+0.13 0.139+0.04 13003 (brick) 0.191 0.024+0.13 1.439+0.04 1455202 (plaster/rend.) 0.018 0.006+0.13 1.630+0.04 130001 (hfm) 0.006 0.000+0.13 1.648+0.04 6800 total 1.654 Table 14
This gives a total R-value, including the internal and external surface resistances, of 1.824 m2K/W, giving an expected U-value of 0.548 W/m2K.

k R ek/R R k2 /3R 2 -R ikRek/R 2 F ik
5 (brick) 0.0219 0.0019 -0.0198 5954 (min wool) 0.098 0.169 -0.096 3243 (brick) 0.8109 0.003655 -0.0685 1085862 (plaster/rend.) 0.916 0.000 -0.330 110151 (hfm) 0.925 0.000 -0.007 5844Table 15
This gives a total Fi of 126362.
k R k/R (R ik+Rek)/3R F ek 5 (brick) 0.076 0.308 500734 (min wool) 0.713 0.096 3683 (brick) 0.105 0.298 505142 (plaster/rend.) 0.010 0.330 43541 (hfm) 0.003 0.332 2270Table 16
This gives a total Fe of 26860.
Although thermal storage corrections were calculated there was a concern that the wall constructions might not have been identified sufficiently accurately to be able to apple the corrections accurately and reliably and it was decided not to use thermal storage corrections. Nevertheless, the Fi and Fe factors have been calculated for all cases, facilitating any future analysis of thermal storage.

Discussion on other research involving in-situ U-value measurement
To date, the amount of research into comparing in-situ measured U-values with calculated U-values is relat-ively limited, although in the United Kingdom there has been increased activity in this field in the last few years. Research has been carried out on both existing constructions and new constructions but data on both are relatively limited, however the little research data that exist may offer some useful pointers to help in understanding why the performance of insulation in wall constructions is often different from that expec-ted.
The research that has been carried out appears to indicate, despite refinements to methods of calculating U-values, that existing U-value calculation procedures are still leading to a general underestimation of heat losses both for existing buildings and for new buildings. As a result, heating requirements for buildings which are assessed on the basis of calculated U-values are likely to be underestimated in many cases.
This could have a number of negative ramifications, including the following:
(a) Greater than expected consumption of fuel to heat buildings, due to heat losses being higher than ex-pected. This leads to greater cost to the occupier, greater use of fuel resources and higher carbon emissions and as a consequence places limitations on the effectiveness of efforts aimed at conserving fuel and power.
(b) Heating systems (which are sized according to expected heating needs) being unable to heat a building adequately leading to occupiers suffering discomfort, using supplementary heating or needing to extend or expand their heating system. It has been suggested that some heating designers could be deliber-ately oversizing heating systems in order to reduce the risk of such problems occurring.
(c) Inability to obtain an accurate measure either of the environmental or of the cost benefit of applying in-sulation.
A number of reasons for the difference have been identified. The following include some of the reasons:
(1) The degree to which a particular insulation system can be installed correctly, taking into consideration the conditions under which it is assembled.
(2) Quality of installation of insulation.
(3) Limitations to good fit of insulation arising from the condition of the existing building.
Previous published work and field studies by BRE point to a number of reasons why actual realised U-val-ues may differ from calculated U-values and these factors can be considered under a number of headings, each of which will be considered below.
Adventitious air movement resulting from poorly fitting insulationIn many wall and roof constructions, insulation may be installed less well and more irregularly than is cur-rently allowed for in calculation procedures. This can lead to convection-driven or wind-driven air movement leading to heat being lost within the construction.
An example of this, which can occur in some types of insulated cavity walls, is where mortar "snots" or

debris in the cavity may make it difficult to install insulation tightly against the blockwork and consequently there is the opportunity for air to circulate around both the warm side and the cold side of the insulating lay-er. Another example, which can occur in ceilings and in timber frame constructions, is where tolerances of joists or studs may be such that gaps exceeding 5 mm to 10 mm could exist between an insulation slab and the adjacent joist, nogging or stud.
Lecompte[Ref 4] carried out a study of partially filled cavity walls and showed that the U-value can be altered substantially when air is able to circulate on both the warm side and cold side of the insulation (a situation which seems quite plausible when there are mortar snots present on the inner leaf). Lecompte reported that where there is a gap of 10 mm at the top, bottom and sides of the insulation board the U-value can rise by over 90% leading to near-doubling of the wall U-value. Lecompte also points out that air permeability of in-sulation materials can be a major factor in influencing heat loss and he recommends that mineral wool insu-lations in cavity walls should be of high density in order to reduce this effect. Lecompte concludes that the presence of small air leaks can cause a substantial increase in heat transfer in practice. It seems that some of these problems can be alleviated when the cavity is fully filled (rather than partially filled) and where the insulation is compressible enough to accommodate the rough faces of the walls[Ref 5]. Lecompte suggests that sealing the joints between insulation slabs and sealing between insulation slabs and other construction parts could be ways of improving the thermal performance of some insulation systems. As a general point, however, Lecompte points to quality of construction as a major factor in determining whether cavity walls achieve expected U-values.
Lowe and Bell[Ref 6] also note that partially-filled cavity walls are very susceptible to gaps in insulation related to poor workmanship and roughening of the blockwork surface due to mortar protrusions and question whether or not partially filled cavities are advisable. Lowe[Ref 7] has suggested providing an air barrier on the outside of insulation layers (in order to reduce air movement) and has referred to Danish Building Regula-tions (1995) which refer to the need for such a barrier.
Hens, Janssens and Deprataere[Ref 8] also discuss the specific problem of air rotation (convection-driven air movement), which may result when air spaces at both sides of the insulation are interconnected by leaks in the insulating layer. In such a situation a pattern combining air intrusion and wind washing (wind-driven air movement) with air rotation (convection-driven air movement) may develop. Hens et al attribute the causes of excessive infiltration and exfiltration to inappropriate design (i.e. a problem of buildability) and poor work-manship.
Hens and Janssens[Ref 9] refer to studies of partially-filled cavity walls in Belgium where it was observed in a very high proportion (about 95%) of cases that the partial fill was not pressed properly against the inner leaf of the wall and gaps occurred at corners where there was the opportunity for air to circulate around the insu-lation.
It would appear, from the above published research, therefore, that the extent to which air can be ex-changed between the warm and cold side of the insulating layer will have a strong effect upon the overall thermal performance of the construction. Among the main factors influencing this air exchange are likely to be:
(a) The roughness of the surface against which the insulation is fixed
(b) The compressibility of the insulation
(c) The air permeability or air permeance of the insulation
(d) Air gaps in the insulating layer
Figure 11 shows an extract from research in Sweden, carried out by Bankvall[Ref 20], again showing the effect of air gaps upon realised U-values, and showing that this effect can be very large in practice. That research
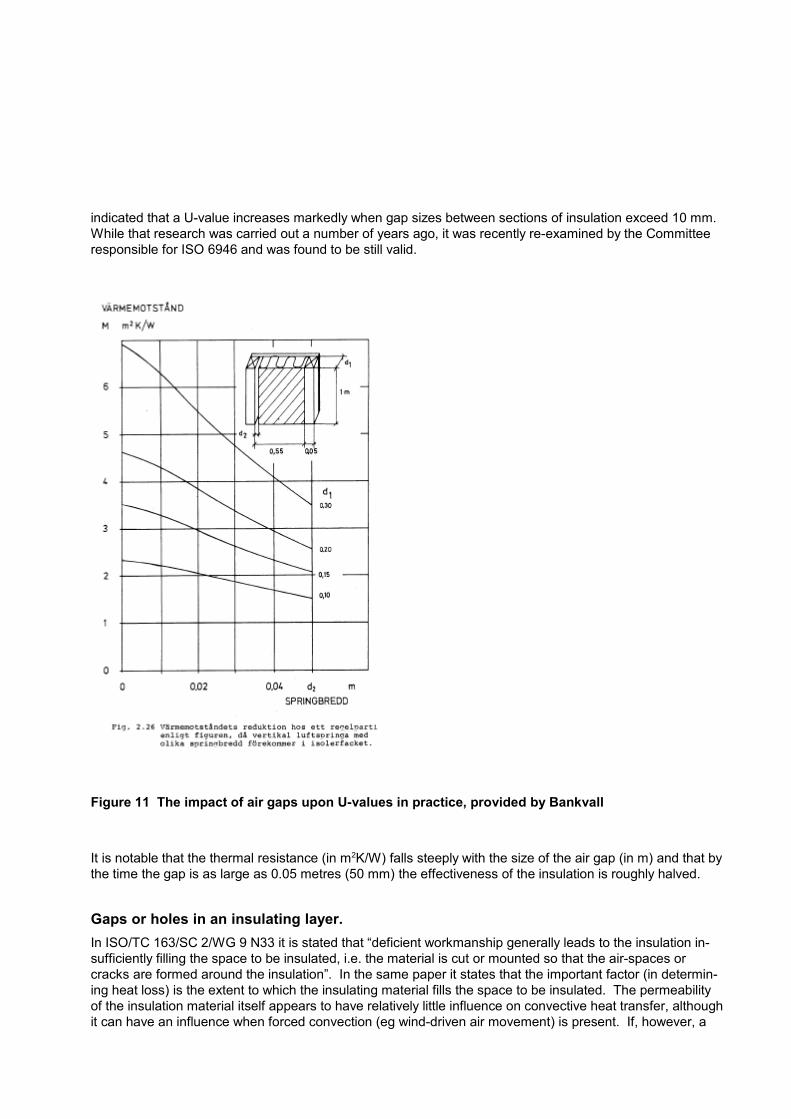
indicated that a U-value increases markedly when gap sizes between sections of insulation exceed 10 mm. While that research was carried out a number of years ago, it was recently re-examined by the Committee responsible for ISO 6946 and was found to be still valid.
Figure 11 The impact of air gaps upon U-values in practice, provided by Bankvall
It is notable that the thermal resistance (in m2K/W) falls steeply with the size of the air gap (in m) and that by the time the gap is as large as 0.05 metres (50 mm) the effectiveness of the insulation is roughly halved.
Gaps or holes in an insulating layer.In ISO/TC 163/SC 2/WG 9 N33 it is stated that “deficient workmanship generally leads to the insulation in-sufficiently filling the space to be insulated, i.e. the material is cut or mounted so that the air-spaces or cracks are formed around the insulation”. In the same paper it states that the important factor (in determin-ing heat loss) is the extent to which the insulating material fills the space to be insulated. The permeability of the insulation material itself appears to have relatively little influence on convective heat transfer, although it can have an influence when forced convection (eg wind-driven air movement) is present. If, however, a
permeable material is protected by a material which resists the flow of air the U-value will be reduced since it becomes less affected by forced convection due to the protection offered by the wind barrier.
Continuous air leakage paths in wallsIn practice, a brick veneer or a blockwork inner leaf of a wall are usually far from being airtight. Where dry lining is applied internally over cavity walls there is a risk of a continuous air leakage path developing across virtually the entire construction. Air may leak through the mortar joints of both the inner and outer leaf and cold air may then dissipate behind the plasterboard leading to a general cooling of the plasterboard and in-creased heat loss.
Hens, Janssen and Deprataere[Ref 8] note that wet plastering of the internal leaf can considerably reduce air permeance of a wall (as it tends to interrupt any continuous gaps through which air could otherwise flow). They conclude that plastering is a key activity in obtaining acceptable airtightness and they note that up to 40 times more air can pass through a wall if there is no internal plaster finish.
It is also possible that poor preparation of mortar, or poor storage of materials on site (eg where it could be exposed to frost, soiling from passing traffic, ground moisture, or sulphate-bearing materials) could lead to greater air-leakiness in the mortar. While this may not have a large impact where wet plastering intercepts air flow paths it could be important where dry lining is used. It is notable that the risk of shrinkage cracking, particularly with concrete blockwork and calcium silicate brickwork, is greater when units have been wetted unnecessarily due to lack of protection during construction.
Partially-filled cavity walls are a particular case where air movement could be particularly detrimental to thermal performance. In the case of partially-filled cavity walls, therefore, it is possible that there may be some benefit in fitting a wind barrier or breather membrane adjacent to the insulation, preferably located between the insulation and the residual cavity. Any tears or cracks appearing in the membrane during con-struction, should, of course, be repaired (e.g. taped) before completing the construction, but this might not always happen in practice.
General workmanship control issuesThere are many aspects of building works which come under the general heading of workmanship. These can influence the neatness or accuracy to which insulation can be fitted and the degree to which the insula-tion layer is continuous. The cleanliness or dimensional accuracy of the area in which the insulation is fitted and the accuracy to which the insulation is cut are both workmanship related and both will influence the real-ised U-value of a construction. Quality of construction can be particularly important at corners, openings[Ref
10] or areas where the detailing is slightly unusual[Ref 11].
Hens, Janssen and Deprataere[Ref 8] report on tests carried out using heat flux meters on a sample of test houses. Some of the test houses were constructed carefully in a manner that could be described as good workmanship while others were constructed in such a way as to mimic poor workmanship (indicated in page 10 of their report). It was noted that features associated with poor workmanship could in some cases cause the U-value to rise by as much as 310%.
The level of site supervision may be an important determinant of workmanship and one factor which may well be relevant is the question of the extent to which the clerk of works is present at the site. If the clerk of works has 24-hour free access to the site, and is therefore able to make spot checks as necessary, this may have a significant bearing upon the care involved in the construction of the building.
Lowe and Bell[Ref 12] have commented on the importance of good workmanship and have called for a specific recognition of quality of workmanship in U-value calculations. In practice this would mean the use of greater thicknesses of insulation as a way of compensating for uncertainties in workmanship. Some Building Con-

trol bodies, however, have raised concerns that this would not eliminate 'rogue' cases where U-values could be extremely high in a small number of instances[Ref 13]. Many Building Control Officers are of the view that there is more pressure for site operatives to carry out their work quickly than there is on quality, and as a result, workmanship will probably be decreasing in quality.
Variations in the width of the wall cavity
Although cavities of walls will tend to have a nominal thickness, as given in plans, actual cavity widths tend to vary. Previous work by Iles[Ref 14] would suggest that a 20 mm variation in gap might not be atypical.
While a small gap on either side of the insulation, perhaps up to 5 mm, may not have a strong effect, the work by Lecompte[Ref 4] would suggest that gaps of 10 mm or more could seriously impact on the U-value, and this would seem to be likely in some situations where rigid or semi-rigid insulation of fixed width is in-stalled. This threshold level of 10 mm appears to be confirmed by the Bankvall research mentioned earlier.
Blown or pumped insulation, on the other hand, will tend to accommodate variations in cavity width, and in cases where the cavity is wider than that drawn on plan, the actual U-value may be better than expected (if we were to base the U-value calculation on the nominal cavity width).

Conclusions
Monitoring results
On the basis of the monitoring and preliminary analysis, the main conclusions are:
1. Thermographic data, wall construction data and heat flow data were collected for 70 selected dwellings. In most cases the dwellings were visited both before and after application of insulation but this was not always possible. The heat flows were collected over two-week periods in order to collect heat flow data for determining U-values. In several cases it was decided to record heat flow over longer periods in order to obtain a better indication of the errors arising from random fluctuations in temperature and sunlight. Thermographic images have been commented upon briefly and the data has undergone analysis to obtain U-values. The measured U-values are presented alongside the calculated U-values to facilitate comparison.
The results for the improvement in thermal resistance may have been influenced slightly by the fact that the built forms and the proportion of houses rendered did not match national statistics exactly, however it is felt that these distortions are minor and that the dataset can be considered to be a reasonable representation of the British housing stock for cavity walled dwellings.
2. The application of CWI has had variable impacts upon the conditions within the properties. In some houses, internal temperatures were found to increase as a result of applying insulation, leading to more comfortable conditions. In other properties, internal temperatures were minimally affected but heat flow through the walls was reduced. In some instances, elderly occupiers were found to be living in temperatures averaging around 16 °C and the application of CWI did little to increase internal temperatures, suggesting that some elderly occupiers could still be at risk despite the application of CWI.
3. Although thermal storage effects are apparent in the data, the two-week periods of monitoring appear to be adequate, although longer monitoring periods will still lead to increased accuracy and are particularly helpful if sunlight is an issue (eg for facades which are not north-facing or for tests carried out during mild weather).
4. It was found that a number of properties had already been insulated without either the occupiers or the Warm Front team knowing. This led to costly loss of potential case studies. It was also found that, despite the intention to install CWI, some installers had to abort at a late stage, leading to loss of case studies.
5. Comparisons between measured and calculated U-values show agreement in some cases, but in other cases differences were observed and a table of U-values against various measurement conditions is given in order to give clues about the possible reasons for the differences. No definitive reasons for the differences were identified, although there are indications that in some instances the insulation may be of low compactness. Results in Table 4 could in principle give an indication of the adjustment that would be needed in order to estimate the effectiveness of cavity wall insulation in practice.
6. Examination of the properties which were insulated using mineral wool occasionally showed vertical voids, perhaps half a metre wide, where the insulation was completely missing. In some cases there were no obvious reasons for the gaps occurring. Practitioners in the industry have suggested that this may be due to obstructions such as wall ties interrupting the smooth flow of the insulation, leading to distorted flow patterns, however the observations made in this project cannot verify this theory.
7. Examination of properties which were insulated using expanded polystyrene revealed that in some cases there were areas where the cavity had been left unfilled. In some cases it appears that this was due to physical obstructions (eg fire stops or mortar-based obstructions).
Instrumentation issues
8. During the course of the visits, some instrumentation issues were encountered, as described elsewhere in this report. These include technical failures in a small number of the data-loggers, leading to loss of heat flow data, and in one particular property (i.e. the property in Leeds) both of the data-loggers developed technical faults. There were also, in a small number of cases, problems arising from limited battery life. Suspect loggers were re-tested over the summer in order to gain a better understanding of their reliability and in general most loggers would continue logging for considerably more than two weeks. There were instances where loggers did not register heat flows over parts of the monitoring, leading to uncertainties about the final result - where heat flows did not register a zero heat flow was assumed, leading to a possible underestimation of the U-value. It is recommended that future researchers involved in U-value measurement continue to be wary of instrumentation-related problems.
9. As a result of this project, a better understanding has been developed in regard to the effects of sunlight upon the thermistors, treatment of ‘artexing’, substrates, issues relating to mounting the heat flux meters, mild weather, spectral and pixel resolution of thermal imaging cameras, interpretation of thermal images and problems relating to timing of cavity wall installers. It is recommended that future research teams continue to be vigilant about such issues with a view to continually improving the methodologies employed in measurement of U-values.
Possible future measures relating to the application of insulation
10. The preponderance of instances where insulation was found to be incomplete, particularly in the February 2006 visits in Lot 1, raises the question about whether CWI installers could routinely use borescopes or detection sticks as a way of monitoring density of insulation and helping to eliminate voids. Such an approach may well be viable given that borescopes and borescope cameras can be obtained for prices in the region of £4000 and can be hired for approximately £300 per week, but consultation with the industry may be advisable. The use of borescopes would have the added advantage of reducing the risk of insulation being installed in walls which are unsuitable, such as steel frame walls, for example.
11. In view of the fact that a number of properties visited had already received cavity wall insulation, it is suggested that ways of improving the auditing of CWI installations be considered. One possibility might be the development of a national database of insulated properties in order to reduce the incidence of abortive (or ineffectual) visits by CWI installers. Such a database may, however, be subject to restrictions resulting from the Data Protection Act.

12. Whilst a considerable amount of work has been carried out on the thermal performance of cavity walls before and after insulation, it is recommended that this issue be revisited within the next few years in order to continue the monitoring of the effectiveness of this process and to determine whether improved methods of cavity wall insulation are having an effect in practice.
13. In view of the fact that U-value measurement is a complex process it is suggested that a publication be developed, based upon the existing publication on post-construction testing, specifically looking at techniques for U-value measurement to ISO 9869.
14. It is suggested that an improved, more stringent test procedure be developed for determining, under laboratory conditions, how well insulation products are able to fill cavities. Existing test procedures assume a relatively clean cavity, however a more flexible test apparatus could determine better the conditions under which fill insulation materials can perform when conditions in the cavity are not optimal. Such a test facility could be designed to contain mortar deposits on wall ties and have small quantities of rubble in the mock cavity. Such a test rig would be aimed at finding out whether such obstructions could interfere with the flow of insulation materials during the filling process. The use of rigorous test procedures could enable insulation materials to be graded according to their ability to fill cavities of varying levels of 'dirtiness' taking account of the most typical types of obstructions which are encountered in cavities. These rigorous test procedures could take cognisance of the effects of adventitious mortar deposits, dirty wall ties, rubble, tying bricks and detailing around windows and doors. Coupled with such testing there would need to be consideration of the density of insulation, taking account of the fact that low compactness areas can be detrimental to U-values whereas, at least in the case of mineral fibre fill, areas of high insulation density are not considered to be strongly detrimental to U-values (although they might be associated with other types of technical risk). By establishing such test methods it may be possible to grade insulation fill materials (perhaps grading them A to G for example) to indicate how tolerant they are of varying levels of cavity 'dirtiness'.
Other issues and suggestions for future energy-related work
15. While this project has provided information about the thermal performance in practice of insulation which has been newly-installed, there is less knowledge about the performance of wall insulation which has been in use for several years, and it is possible that properties with older insulation could be performing less well than properties which have just had insulation installed. There are two possible reasons for older properties performing less well: (a) Because installation techniques and quality controls at that time were different, and (b) Because the insulation has physically deteriorated since it was installed due to ageing processes, weathering processes, disturbance by operatives (eg plumbers or electricians) or biological processes. It is suggested, therefore, that a future project could be carried out to investigate properties which had cavity wall insulation installed several years ago and carry out in-situ U-value measurements on them, using the same equipment as was used in this project. Such a project would need to source housing stock for which the year of CWI installation is known (with a reasonable degree of certainty). As with the present project it is suggested that thermographic surveys be carried out in order to identify areas where insulation may be missing or of low compactness and to follow up rigorously such surveys with cavity inspections. Once these have been done, it would be possible to identify suitable locations for siting heat flux meters in order to carry out U-value measurements on representative areas. This combination of investigations would give an indication of the percentage coverage of effective insulation and an indication of whether the measured U-values match reasonably well the calculated U-values (calculated to BS EN ISO 6946[Ref 3]) or whether an increment should be applied to the calculated U-values in any housing stock calculations. Identifying

housing stock which would be likely to be well-documented would need some consideration, however stock which has been MOD-owned or owned by Local Authorities or housing associations may have better documentation that housing which is purely private sector, and it may be possible to partner with a sample of Local Authorities to identify housing which they would consider to be sufficiently well documented for such a project.
16. Given the lack of research over the past fifteen years into the validity and accuracy of the BRE Domestic Energy Model (used for predicting energy savings in dwellings) it is recommended that research be carried out within the next few years to investigate whether, in the light of changing lifestyles and changing conditions in the construction, boiler and insulation industries, BREDEM can still be regarded as an accurate predictor of energy consumption and of trends in energy consumption and to identify in which ways BREDEM may require updating.
17. Although data correlations suggest that sunlight falling on the external thermistor temperature probes has not excessively altered the measured U-values, there could still be benefits in examining, as part of future research, the precise effect of sunlight on measured U-values. Some case studies from this project suggest that, for east-facing walls in early spring, very sunny weather might distort the measured U-value by up to 0.02 W/m2K. It is suggested that some research be carried out into the use of shading devices as a way of reducing distortions attributable to sunlight and night sky radiation.
18. In view of the fact that the correlation between the measured insulation improvement and expected insulation improvement (the latter being calculated from cavity widths) was very weak it is suggested that research be carried out to find out if densities of fill insulation are lower for wider cavities.
19. Over the course of the project consideration has been given as to how costs of future heat flow measurements could be reduced. One proposed way of doing this, which could hold promise for future U-value measurements, was discussed with a datalogger manufacturing company in Reddish called AIID Solutions Ltd who have proposed to design a device which could incorporate a heat flux meter, a thermistor and a light-weight datalogging facility as a single unit. Such a device, if developed successfully may be lightweight enough to be supported on a wall by picture hooks, possibly eliminating the need for teleprops to support it. It would also, by eliminating the need for trailing wires, be able to be installed quickly, thereby reducing the inconvenience to occupiers. Such a proposed device would have a high initial cost, to cover the expenses in developing the system, but could in the long term open the door to large scale roll-out, leading to cheaper U-value measurements in the long term.
20. While carrying out the project, many of the householders took a keen interest in the performance of their properties and asked whether they could receive a copy of the final results of the study carried out on their property. This would seem to suggest that some occupiers at least would be likely to be willing to take part in follow-up surveys. It may, therefore, be possible to carry out a follow-up satisfaction survey involving structured telephone interviews to find out whether occupiers considered their houses to be more comfortable or easier to heat and to what extent they were satisfied with the insulation that they had received, and their perceptions could be compared with the U-value improvements noted in this project. Clearly many of the properties had received both loft and wall insulation and this would need to be taken into account in any such survey.
21. Whilst there has been research into the performance of existing cavity walls over the past three years, there appears to have been less research in the UK on new wall constructions. Research in this area was carried out over the period 1998 - 2001, however there may have been little research on new buildings since then. In particular, there appears to have been little research on thermal insulation
performance in practice of housing built since the 2002 Regulations on conservation of fuel and power came into effect. Indications are that workmanship is an area of concern among new housing[Ref 15] and that in percentage terms the effect of poor workmanship on the U-value is likely to increase as thicknesses of insulation increase. In particular, the insulation of walls and floors in new housing are often not subject to systematic inspection by Building Control Offers and in instances where insulation is inspected, those carrying out the inspection are not sure how to determine whether the insulation is likely to perform adequately and are therefore unsure of the level of standards or quality that should be demanded. Some research suggests that a gap of more than 10 mm between successive sections of insulation can have a significantly detrimental impact upon the performance of the insulation and it may be possible to use this criterion in judging whether insulation for either new or existing buildings it of an adequate standard.
22. Whilst there has been research into the thermal performance of lofts and cavity walls both in theory and in practice, there has been less examination of solid ground floors and suspended ground floors. A significant fraction of the heat from a dwelling can escape through the floor, as was evident in a number of the thermal images which were taken as part of this project. It is suggested that more studies be carried out examining the feasibility of applying floor insulation in more properties and of examining of the thermal performance of floor decks and solid floors in practice. This said, it needs to be borne in mind that U-value measurements for solid floors are more difficult than for suspended floors owing to the very high levels of thermal storage which occur in solid ground floors - typically it takes a whole winter to measure the U-value of a solid ground floor accurately, although it might be possible to reduce this measurement time considerably if temperature probes are placed immediately above and immediately below the insulating layer and assumptions made about the thermal behaviour of the soil.
23. It is suggested that a feasibility study be carried out into the use of internet-enabled sensing technology as a means of monitoring heat loss through the fabric of dwellings. The use of such technology has the potential to reduce the number of times that dwellings need to be revisited for the purposes of measuring U-values, however the reduced staffing costs would need to be offset against the costs of wireless sensing technology being used to measure U-values and ventilation-related heat losses. Such a project could give pointers to the way forward for developing systems for self-monitoring of the energy efficiency of housing but would need to be strongly collaborative with the technology provider.
24. Whilst a large number of traditional cavity walls continue to be insulated through programmes such as Warm Front, one concern which has been raised in some quarters is the question of how to upgrade insulation levels in 'non-traditional' housing. Such housing, which is very common in some areas, incorporates a variety of types of wall and floor constructions and relatively little work has been carried out examining how best such housing can be insulated without posing risks of adverse effects such as condensation, rain penetration or interference with electrical supply. In particular, Aberdeen City Council have expressed an interest in looking at how best to insulate such properties.
25. Over the course of the measurements carried out on the second batch of properties, delays in the application of cavity wall insulation led to complications for all four of the teams carrying out the thermography and U-value measurements, particularly when significant extra travel was involved, which was especially the case for the teams covering Lot 2, Lot 3 and Lot 4.
The delays in the insulation meant that more liaison was necessary and efforts were made by staff at Eaga and EST to try to speed up the insulation installations as much as possible. The teams dealt with the problem of delays to the CWI installations creditably and made a number of additional visits to the

properties to ensure that data was collected for as many properties as possible. One team (covering Lot 3) actually hired an infrared camera for two additional weeks in order to maximise the coverage of thermal imaging surveys.
Additionally, some of the occupiers presented major difficulties for the teams and had the teams not persevered to the extent that they did there would have been incomplete data for those properties. Had the teams not been so diligent and had not been willing to carry out extra visits the coverage of properties at this crucial post-insulation stage would have been much reduced and it would have been very detrimental to the data collected had the teams not shown the level of commitment which they did.
26. It is suggested that in considering the realisable benefits of cavity wall insulation to existing housing, and the fact that actual benefits tend to fall short of theoretical benefits, it should be borne in mind that thermal performance shortfall is by no means restricted to this kind of wall construction. Indeed there are several studies which have shown that insulation performs less well in practice than in theory in many, if not most types of wall construction. Furthermore, the shortfall identified in the case of cavity fill to existing housing is not considered atypical when compared with newbuild constructions.

References
[Ref 1] Field investigations of the thermal performance of construction elements as built, S M Doran, November 2000, BRE Client Report No. 78132.
[Ref 2] ISO 9869 Thermal insulation – Building elements – In-situ measurement of thermal resistance and thermal transmittance
[Ref 3] BS EN ISO 6946 Building components and building elements – Thermal resistance and thermal transmittance – Calculation method
[Ref 4] J Lecompte: 'The influence of natural convection on the thermal quality of insulated cavity construction'. Building research and practice, CIB, 1990
[Ref 5] Bernard Carr, BRE, private communication, January 2005. It was found, through visual inspection of cavities under construction, that whereas some types of materials (eg mineral wool) can accommodate rough surfaces to some extent, semi-rigid materials are often poorly-fitting against such surfaces, and this can be especially problematic in partially-fillled cavity walls.
[Ref 6] Robert Lowe, Malcolm Bell, Building regulation and sustainable housing. Part 2: technical issues. Structural Survey, Volume 18 Number 2 2000 77-88. This paper describes U-value calculations and points out that "thermal performance of dwellings is highly dependant on the quality of construction. Degradation of thermal performance takes place due to: missing insulation; air movement within and through elements of the thermal envelope; uncontrolled air leakage between the heated space and the outside."
[Ref 7] Robert Lowe, Impacts of construction defects V2 2003, Leeds Metropolitan University
[Ref 8] H Hens, A Janssens, W Deprataere: Cavity Walls with High Insulation Quality: Performance Prediction Using Calculation Procedures and Field Testing, IEA-Annex 32, IBEPA, 1999
[Ref 9] H Hens, A Janssens: Risk analysis: Filled Cavity Walls, IEA-Annex 32, IBEPA, 1998
[Ref 10] Bernard Carr, BRE, private communication, January 2005
[Ref 11] Private communication, City of York Building Control, December 2004
[Ref 12] Robert Lowe, Malcolm Bell, Building regulation and sustainable housing. Part 2: technical issues. Structural Survey, Volume 18 Number 2 2000 77-88. This paper describes U-value calculations and points out that "thermal performance of dwellings is highly dependant on the quality of construction. Degradation of thermal performance takes place due to: missing insulation; air movement within and through elements of the thermal envelope; uncontrolled air leakage between the heated space and the outside."
[Ref 13] Private communication, Aberdeen City Council Building Control, 2004
[Ref 14] P Iles, BRE, private communication, 2003

[Ref 15] BRE report 15921 - On site inspections and thermal insulation performance, BRE, August 2005, available from www.est.org.uk
[Ref 16] Thermal performance of new housing in the Aberdeen area, BRE report 15996, October 2004
[Ref 17] Measurement of the Performance of Cavity Wall Insulation Installed in Domestic Dwellings, Christine Capel & Julian Wilczek, Final Report for Energy Saving Trust, AEA Technology plc, 13 May 2004.
[Ref 18] H Hens & A Janssens “Risk Analysis: Filled Cavity Walls” Report STA-B-98/2
[Ref 19] Hens, Janssens & Depraetere "Cavity walls with high insulation Quality: Performance prediction using calculation procedures and field testing" STB-B-99/R1
[Ref 20] Figure 2.26 of ISO/TC 163/SC 2/WG 9 N33/N55, which has recently been prepared by the international committee responsible for ISO 6946, was obtained from earlier research by Bankvall and gives an indication of how a U-value is affected by air gap sizes.
[Ref 21] Analysis, selection and statistical treatment of thermal properties of building materials for the preparation of harmonised design values - Final Report of the Thermal Values Group, BRE, March 1999
[Ref 22] BS EN ISO 10456 Building materials and products – Hygrothermal properties – Tabulated design values
[Ref 23] John Henderson, BRE, private communication, June - November 2006.
[Ref 24] CIBSE Guide A3, 1980, describes older methods of calculating U-values]
[Ref 25] Les Shorrock, BRE, private communication
[Ref 26] Jack Hulme, private communication, November 2006
[Ref 27] Table 2.4 of the 2002 Scottish House Condition Survey
[Ref 28] BRE Report 222066, David Shearer Performance of cavity wall insulation – interviews of insulation installers, November 2005
Thermal transmittance of walls of dwellings before and after application of cavity wall insulation
Appendix A – The thermographic images and daylight photographs (supplied in cover CD)
This Appendix reports summarised data from the first batch of dwellings, which were visited in March 2005 and November 2005, together with the second batch of dwellings, which were visited in December 2005 and February 2006. The appendices give a brief description of each dwelling, thermographic images, daylight photographs and information about the wall constructions.
While the intention was that the second series of properties would all be insulated in January 2006, many of the insulation installers were unable to complete these by the end of January, leading to delays in the U-value measurements, cavity inspections and thermography. In addition, malfunctioning of dataloggers led to many properties being revisited in March 2006.
Due to their overall size it was necessary to bind this series of Appendices (A1 to A70) separately. They are given in the accompanying CD to this report.
BRE Client report number 222077Commercial in confidence - 1 -

Thermal transmittance of walls of dwellings before and after application of cavity wall insulation
Appendix B Summary of the results of the thermal imaging
Table B1 gives a summary of the observations made in the thermal imaging.
Property no.
Figure no.
Comments
1, pre-cwi (Lot 4) Mar 05
A.1.1 Front wall (right hand side): Fairly uniform heat flow
1, pre-cwiMar 05
A1.2 Front wall (left hand side): Fairly uniform heat flow. Appears to be a high heat loss from the roof (thermal imaging was carried out on a overcast day so effects from solar radiation should be minimum)
1, pre-cwiMar 05
A1.3 Gable wall: Fairly uniform heat loss
1, pre-cwiMar 05
A1.4 Rear wall (left hand side): Fairly uniform heat loss. Cold spot at eaves.
1, pre-cwiMar 05
A1.5 Rear wall (right hand side): Fairly uniform heat loss. Cold spot at eaves.
1, pre-cwiMar 05
A1.6 Rear wall (centre): Fairly uniform heat loss. Cold spot at eaves.
1, pre-cwi A1.7- Elevated heat transfer at lintels and eaves.1, pre-cwi Elevated heat transfer at lintels and eaves; high heat loss from roof;
cold spots at eaves on rear wall1, post-cwi High levels of heat transfer observed at lintels and eaves (area of
elevated heat flow appears to be from eaves down to 5 brick layers below eaves)
2 (Lot 4) Mar 05
A2.1 Front wall: Fairly uniform heat loss
Mar 05 A2.2 Front wall: Fairly uniform heat lossMar 05 A2.3 Gable wall: Uniform heat loss. Slightly higher heat loss at chimney
flue. Nov 05, post-cwi
A2.4 Thermal bridging observed at wall-ceiling junction
Nov 05, post-cwi
A2.6 Thermal bridging at wall-ceiling junction
3 (Lot 4) Mar 05
A3.1 Front wall: Uniform heat loss. Rendered part of wall appears to have a lower heat loss which is an effect possibly caused the emissivity of the painted render. The hot spots on the wall are open windows and a burglar alarm. Heat loss from radiators is visible. On the windows, reflection from the sky is visible.
Mar 05 A3.2 Front wall: Slightly higher heat loss below windowsMar 05 A3.3 Rear wall ground floor level: Fairly uniform heat loss Mar 05 A3.4 Rear wall mid floor: Fairly uniform heat lossMar 05 A3.5 Rear wall first floor (right hand side): Slightly higher heat loss below
window but mostly uniform. Mar 05 A3.6 Rear wall first floor (left hand side): Uniform heat lossMar 05 A3.7 Gable wall: Fairly uniform heat loss.Nov 05 A3.10,
A3.11Cold area around window (post insulation)
BRE Client report number 77Commercial in confidence - 2 -

Thermal transmittance of walls of dwellings before and after application of cavity wall insulation
Property no.
Figure no.
Comments
Nov 05 A3.14 Variations in surface temperatures on gable wallDec 05 A4.3 Blockwork visible, indicating low density concrete (pre-insulation)Dec 05 A4.6 High heat transfer at wall-floor junction (pre-insulation)Dec 05 A4.9 High heat transfer at locations of radiators (pre-insulation)Feb 06 A4.11
A4.12The block work is still visible on the south wand west walls even although insulation has now been installed
Feb 06 A4.14 No real change after the wall insulation has been installed for the west wall junction with the north wall
Feb 06 A4.16 High heat transfer near roof space possibly due to access problems4, post-cwi Patchy areas on west facade, suggesting possible missing insulation
or voids in the insulation.5 (Lot 4) Mar 05
A5.1 Front wall (left hand side): High heat loss below first floor window. Hot spot is a security light. High heat loss from wood/tile-hung area.
Mar 05 A5.2 Front wall (right hand side): There is a large area on the wall where there is a significantly higher heat loss.
Mar 05 A5.3 Rear wall (left hand side): There is a higher heat loss around the right hand window but on the whole the heat loss from the wall is mostly uniform.
Mar 05 A5.4 Rear wall (right hand side): There is a higher heat loss around the windows but on the whole the heat loss from the wall is mostly uniform.
Mar 05 A5.5 Gable wall: Fairly uniform heat loss5, post-cwi Elevated heat loss at lintels and at junctions between walls and
ceilings; Some signs of elevated heat loss at window sills.Mar 056 (Lot 4)
A6.1 Front and gable wall: Uniform heat loss on both front and gable wall. The vertical strip on the gable wall corresponds to a chimney flue, suggesting heat from a heating appliance or fire.
Mar 05 A6.2 Rear wall (ground floor): Slightly higher heat loss below the window.Mar 05 A6.3 Rear wall first floor: Uniform heat loss Mar 05 A6.4 Gable wall: Fairly uniform heat loss. Vertical strip corresponds to
chimney flue. Mar 05 A6.5 Gable wall: hot spot corresponds to an internal fire (pre-insulation)Nov 05 A6.6
A6.10 A6.13
Elevated heat loss at wall-floor junction (post-insulation)
Nov 05 A6.15 Thermal bridging at gable peak and around window (post-insulation)Mar 0507 (Lot 4)
A7.1 Front and gable wall corner: Uniform heat loss.
Mar 05 A7.2 Gable wall (taken inside garage): Higher heat loss on wall perpendicular to gable wall. Note the warm air egress at the soffit, which would be expected to be reduced after CWI is installed.
Mar 05 A7.3 Front wall: Uniform heat lossMar 05 A7.4 Mid-rear wall (above patio doors): Uniform heat lossMar 05 A7.5 Rear wall (right hand side of patio doors): Uniform heat lossMar 05 A7.6 Rear wall (left hand side of patio doors): Uniform heat lossMar 05 A7.7 Gable wall: Uniform heat loss. The wall perpendicular to the gable
wall (brick wall) is made of lightweight concrete blocks as the mortar joints can be seen on the thermal image as being colder.
Nov 05 A7.8 Strong thermal bridging above window (post-insulation)Nov 05 A7.10 Indication of lightweight concrete blocks, visible even after insulation
has been installed. Also note the thermal bridging in the vicinity of the window.
Nov 05, post-cwi
A7.11 Thermal bridging at lintels and warm band connecting top of window to top of nearby door.
BRE Client report number 77Commercial in confidence - 3 -

Thermal transmittance of walls of dwellings before and after application of cavity wall insulation
Property no.
Figure no.
Comments
8 (Lot 4) A8.1 Front wall: Uniform heat loss. There may be some sky reflection in the uPVC cladding, leading to a misleading result, and it may be difficult to assess the improvement at the cladding when the post-CWI thermal images are taken. The uPVC cladding may also have a lower emissivity than the brickwork.
Mar 05 A8.2 Front wall first floor level (left hand side): Fairly uniform heat loss. Slightly higher heat loss below the window.
Mar 05 A8.3 Front wall first floor level (right hand side): Fairly uniform heat loss. Slightly higher heat loss below the window. High heat loss at party wall between properties.
Mar 05 A8.4 Gable wall 1 ground floor level: Uniform heat loss. Vertical strip corresponds to a chimney flue.
Mar 05 A8.5 Gable wall 1 first floor level: Uniform heat loss. Vertical strip corresponds to a chimney flue.
Mar 05 A8.6 Gable wall 2: Hot spot corresponds to an internal heating fire. Mar 05 A8.7 Gable wall 2: Vertical strip corresponds to a chimney flue.Mar 05 A8.8 Rear wall first floor: Fairly uniform heat loss8, pre-cwi, Mar 05
A8.9 Rear wall ground floor: Slightly lower heat loss surrounding the first floor window. Hot spot corresponds to an air brick (pre-insulation)
8, post-cwi, Nov 05
Thermal bridging at wall-ceiling junctions; the lightweight blocks are still visible even after application of insulation
9, pre-cwi Cold bridging was noted at particular places on the walls9, post-cwi Thermal bridging noted where there was a step in the level of the
wall; evidence of voids in the insulation (west wall); elevated heat transfer near the top of the east wall; many of the existing cold bridges remained after insulation.
10 (Lot 4) A10.1 Front wall: Uniform heat lossMar 05 A10.2 Front wall (ground floor): Uniform heat lossMar 05 A10.3 Gable wall 1: Uniform heat loss Mar 05 A10.4 Rear wall: There appears to be a lower heat loss to the left hand
side of the facade, however this may be an effect from the moderately strong wind when the thermal image was taken. The hot spot in the centre of the wall could be a boiler flue or an extractor fan.
Mar 05 A10.5 Gable wall 2: Fairly uniform heat loss. Cold patch on the wall corresponds to the un-heated loft space. The hot spot on the wall corresponds to an air vent
10, post-cwi Elevated heat loss at eaves and lintels; poorly-fitted ceiling insulation; high heat transfer at junction between the dwelling and the extension.
11, pre-cwi Clear pattern of dot and dab adhesive
BRE Client report number 77Commercial in confidence - 4 -

Thermal transmittance of walls of dwellings before and after application of cavity wall insulation
Property no.
Figure no.
Comments
11, post-cwi Inside to outside only showed cool areas around the corners of the building and where wall meet the floor dot and dab adhesive not so visible as before, suggesting that insulation is performing
12 (Lot 4) A12.1 Gable wall first floor (right hand side): Uniform heat loss. Note the painted timber cladding has a lower heat loss possibly caused by the emissivity of the cladding
Mar 05 A12.2 Gable wall first floor (left hand side): Uniform heat loss Mar 05 A12.3 Gable wall ground floor: Uniform heat loss. Note the vertical cold
strips correspond to garden canes in front of the therma cam. Mar 05 A12.4 Rear wall first floor: Fairly uniform heat loss. Hot stop corresponds to
open window Mar 05 A12.5 Rear wall mid wall: Uniform heat lossMar 05 A12.6 Front wall first floor (inverted corner): Uniform heat loss on both
walls. Higher heat loss at wall-wall junction. The uPVC cladding is likely to have a lower emissivity than the brickwork and the cladding may well be showing reflections.
Nov 05 A12.9 Possible missing insulationNov 05 A12.11 Possible missing insulation13, pre-cwi Bridging noted at cill level; evidence of low density blockwork; 13, post-cwi IR images were taken inside only due to very wet
external conditions; thermal bridging at wall-ceiling junctions and above windows;
14 pre-cwi The building was nearing the end of some building works to double its size. There were areas that showed up where the new building met the old and as a result caused conduction down the wall into the occupied space; evidence of lightweight blockwork; thermal bridging at wall-floor junction; elevated heat transfer around eaves;
14, post-cwi There were some patchy areas on the north wall but on the whole the building appeared to have a regular drilling pattern even though it did not meet the guide as the building was a bungalow with very low external walls front and rear; strongly elevated heat transfer at eaves and at junction between existing dwelling and extension; elevated heat loss at lintels; thermal bridging at wall-floor junctions; evidence of areas of elevated heat loss (or elevated external surface temperatures) on the north wall;
15, pre-cwi Elevated heat loss at point where a partition wall meets the external wall; uniform heat loss on gable wall; elevated heat loss around patio doors
15, pre-cwi (Lot 2) Mar 05
A15.1 Front wall: Appears to be a uniform heat loss through the façade however there is a higher heat loss at the inverted corner of the wall. A cavity inspection of the inverted corner showed that the partition wall joined onto the external wall causing a cold bridge.
Mar 05 A15.2 Front wall and gable wall at first floor level: The thermal image shows that there is a fairly uniform heat loss on the gable wall.
Mar 05 A15.3 Gable wall: Uniform heat lossMar 05 A15.4 Rear wall first floor level: Fairly uniform heat lossMar 05 A15.5 Rear wall ground floor level: Fairly uniform heat loss. Hot spot to the
left of wall is a security light. 15, post-cwi Nov 05
A15.7 Warming around patio doors
Nov 05 A15.8 Demonstration of the effect of glass upon thermal images, showing the apparent temperature of a reflection of the moon from a window on a cold night, suggesting a surface temperature of 23 °C.
Nov 05 A15.10 Thermal bridging at lintels and eaves
BRE Client report number 77Commercial in confidence - 5 -

Thermal transmittance of walls of dwellings before and after application of cavity wall insulation
Property no.
Figure no.
Comments
Nov 05 A15.11 Thermal bridging at party wall where property meets extension on neighbour's property.
Nov 05, post-cwi
A15.12 Thermal bridging at lintels and eaves
16 (Lot 2) Mar 05
A16.1 & A16.2
Front and gable wall: There were difficulties in taking thermal images of this property as it was particularly windy. The images however show that there is a fairly uniform heat loss from the gable wall and slightly varied heat loss from the front wall.
Nov 05 A16.3 Warm band at eaves17 (Lot 2) Mar 05
A17.1 Front wall: Uniform heat loss. No hot spot areas.
Mar 05 A17.2 Rear wall: Uniform heat loss. Hot spot on side of extension is an external light and cold spot to the right of upper window is a vent. There are a number of washing lines in the back court, and one of the clothes lines is particularly prominent in the thermal image but less so in the daylight photograph.
Mar 05 A17.3 Gable wall: Fairly uniform heat loss through the wall although there is a hot spot below the first floor window. A cavity inspection at this point showed that there were bricks that tied the inner and outer leaf together (i.e. the bricks bridged the cavity)
17, post-cwi This property was not insulated because the installer was concerned about the condition of the cavity and considered the property to be unsuitable for insulating.
18 (Lot 2) Mar 05
A18.1 Front & side walls: Fairly uniform heat loss through both side and front wall. Hot spot on front wall is an external light. The presence of the large garage may lead to practical difficulties for the CWI installer and it will be interesting to assess the continuity of the insulation in the autumn re-visit.
Mar 05 A18.2 Rear & side walls: Fairly uniform heat loss through both side and front wall. On the side wall just above the garage roof there is an unexplained hot spot. Other hot spots on gable wall are caused vents or external lights
Mar 05 18.3 Rear wall: Fairly uniform heat loss through wall although there is a slightly higher heat loss below the large window on the first floor level. The hot spot on the wall is an external light and the cold spot is a burglar alarm.
Mar 05 A18.4 Internal thermal image of HFM: The thermal image shows the mortar joints as being colder than the blockwork suggesting that the internal leaf is lightweight concrete blocks. The HFM was positioned to avoid the mortar joints, although unfortunately the data-logger malfunctioned and heat flow data could not be recorded.
18, post-cwi The occupiers decided not to proceed with cavity wall insulation and therefore no post-insulation images are available.
19, pre-cwi, Dec 05
Possible slightly elevated heat loss just below bay windows.
BRE Client report number 77Commercial in confidence - 6 -

Thermal transmittance of walls of dwellings before and after application of cavity wall insulation
Property no.
Figure no.
Comments
19Feb 05
Thermal image revealed slightly warm area between the front door and the front lounge window. Borescope examination revealed that there was insulation here but that it was at low compactness with an air gap of approximately 10 mm between the insulation and the outer brickwork. An obstruction in the cavity was also found. There was thermal bridging at some lintels but not at the side window where a new lintel had been installed just a few years earlier. Interestingly, there is prominent thermal bridging at lintel above the front door, but this was not noticeable before the application of insulation, showing that the insulation did make a significant difference. There was also some warm areas around the chimney breast, probably due to a hot water leak.
20 (Lot 2) Mar 05
A20.1 Front & gable walls: This thermal image is of poor quality which makes it difficult to make conclusions. From the image it appears that the gable wall has a fairly uniform heat loss (colder areas are caused by drain pipes and satellite dish) while the front wall has a more varied heat loss. There seems to be a higher heat loss below the smaller window on the front wall compared with the rest of the wall area (- this is possibly due to radiators and can be verified when the property is re-visited). If the warm areas are due to radiators, they should show a marked improvement after CWI is installed.
Mar 05 A20.2 Rear wall first floor level (left hand side): Uniform heat loss with a slightly higher loss above the window lintel.
Mar 05 A20.3 Rear wall first floor level (right hand side): Slightly higher heat loss below the window in comparison with the rest of the wall.
Mar 05 A20.4 Rear wall ground floor level (left hand side): The heat loss is fairly uniform although there is a hot spot beside the drain pipe above the window.
Mar 05 A20.5 Rear wall ground floor level (right hand side): The heat loss is fairly uniform although there is an area below the upper window as described in A20.3
Nov 05 A20.6A20.7
Higher heat loss on walls immediately below bay windows
Nov 05 A20.9 Significant thermal bridging at wall-ceiling junction ustairs where internal surface temperature falls below 14 °C.
21 (Lot 2) Mar 05
A21.1 & A21.2
Front & gable wall: Fairly uniform heat loss although below both large windows on the ground floor and first floor of the front wall there is a higher heat loss at these areas. The hot spot on the gable wall (visible on Figure A21.2) is an air vent.
Nov 05 A21.3 Slight thermal bridging below window sill of living roomNov 05 A21.4 Thermal bridging at eavesNov 05 A21.5 Contrast between insulation of property and lack of insulation in
adjoining property22 (Lot 2) Mar 05
A22.1 Front wall: Uniform heat loss throughout façade. Hot spot below right hand side window on ground floor is possibly caused by air leakage from the single glazed window.
Mar 05 A22.2 Rear wall (left hand side): Uniform heat loss though façadeMar 05 A22.3 Rear wall (right hand side): Uniform heat loss though façade with a
slightly higher heat loss below right hand side window.22, post-cwi This property was not insulated. The occupiers were disqualified for
and insulation grant following a re-assessment of the income of the occupiers.
BRE Client report number 77Commercial in confidence - 7 -
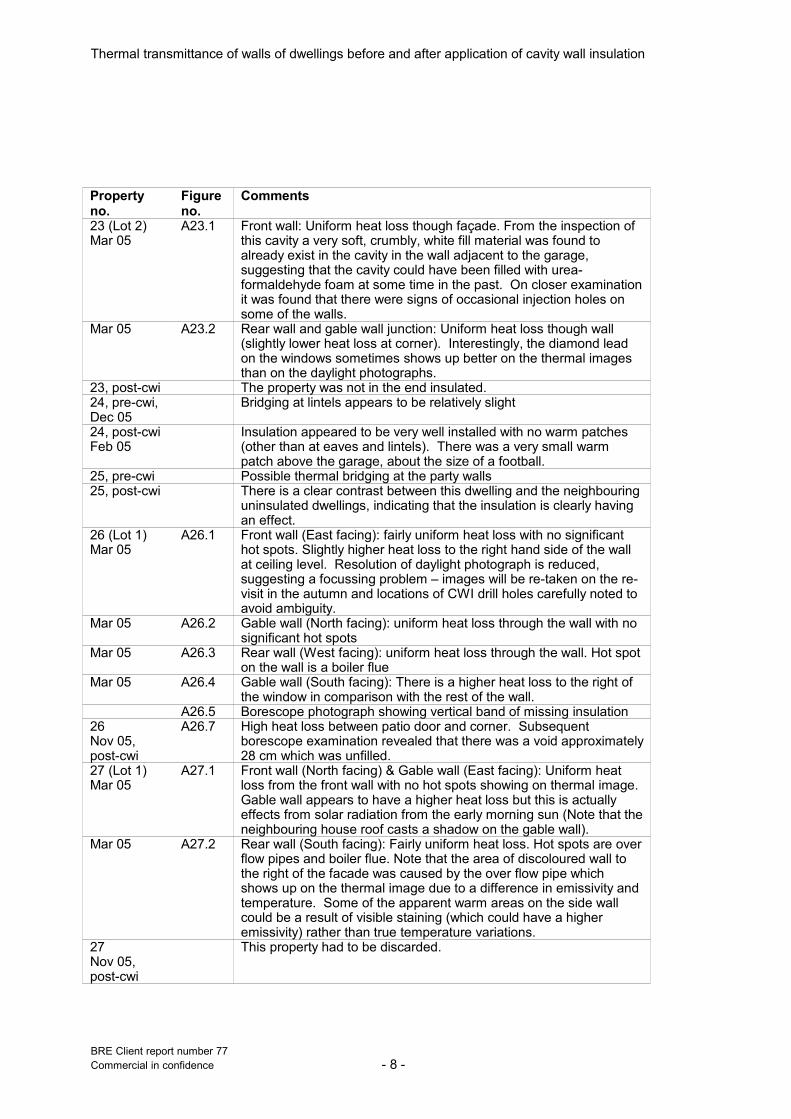
Thermal transmittance of walls of dwellings before and after application of cavity wall insulation
Property no.
Figure no.
Comments
23 (Lot 2) Mar 05
A23.1 Front wall: Uniform heat loss though façade. From the inspection of this cavity a very soft, crumbly, white fill material was found to already exist in the cavity in the wall adjacent to the garage, suggesting that the cavity could have been filled with urea-formaldehyde foam at some time in the past. On closer examination it was found that there were signs of occasional injection holes on some of the walls.
Mar 05 A23.2 Rear wall and gable wall junction: Uniform heat loss though wall (slightly lower heat loss at corner). Interestingly, the diamond lead on the windows sometimes shows up better on the thermal images than on the daylight photographs.
23, post-cwi The property was not in the end insulated.24, pre-cwi, Dec 05
Bridging at lintels appears to be relatively slight
24, post-cwiFeb 05
Insulation appeared to be very well installed with no warm patches (other than at eaves and lintels). There was a very small warm patch above the garage, about the size of a football.
25, pre-cwi Possible thermal bridging at the party walls25, post-cwi There is a clear contrast between this dwelling and the neighbouring
uninsulated dwellings, indicating that the insulation is clearly having an effect.
26 (Lot 1) Mar 05
A26.1 Front wall (East facing): fairly uniform heat loss with no significant hot spots. Slightly higher heat loss to the right hand side of the wall at ceiling level. Resolution of daylight photograph is reduced, suggesting a focussing problem – images will be re-taken on the re-visit in the autumn and locations of CWI drill holes carefully noted to avoid ambiguity.
Mar 05 A26.2 Gable wall (North facing): uniform heat loss through the wall with no significant hot spots
Mar 05 A26.3 Rear wall (West facing): uniform heat loss through the wall. Hot spot on the wall is a boiler flue
Mar 05 A26.4 Gable wall (South facing): There is a higher heat loss to the right of the window in comparison with the rest of the wall.
A26.5 Borescope photograph showing vertical band of missing insulation26Nov 05, post-cwi
A26.7 High heat loss between patio door and corner. Subsequent borescope examination revealed that there was a void approximately 28 cm which was unfilled.
27 (Lot 1) Mar 05
A27.1 Front wall (North facing) & Gable wall (East facing): Uniform heat loss from the front wall with no hot spots showing on thermal image. Gable wall appears to have a higher heat loss but this is actually effects from solar radiation from the early morning sun (Note that the neighbouring house roof casts a shadow on the gable wall).
Mar 05 A27.2 Rear wall (South facing): Fairly uniform heat loss. Hot spots are over flow pipes and boiler flue. Note that the area of discoloured wall to the right of the facade was caused by the over flow pipe which shows up on the thermal image due to a difference in emissivity and temperature. Some of the apparent warm areas on the side wall could be a result of visible staining (which could have a higher emissivity) rather than true temperature variations.
27Nov 05, post-cwi
This property had to be discarded.
BRE Client report number 77Commercial in confidence - 8 -

Thermal transmittance of walls of dwellings before and after application of cavity wall insulation
Property no.
Figure no.
Comments
28 (Lot 1) Mar 05
A28.1 Front wall (North facing) & Gable wall (East facing): Fairly uniform heat flow throughout. It was suggested that hot or cold spots on the front wall are thought could be caused by plastic wall plugs used to support climbing plants and wall fixings, but a closer visual examination could verify whether this is the case.
Mar 05 A28.2 Rear wall (South facing) & Gable wall (East facing): Uniform heat loss from both walls. There a small patch between the ground floor window and the first floor window on the Rear wall where there seems to be a lower heat loss. The hot spot next to the conservatory is a boiler flue. The lead flashing on the conservatory roof shows up very prominently in the thermal image.
Mar 05 A28.3 Internal thermal image of location of ground floor HFM: The thermal image shows the mortar joints as being colder than the blockwork suggesting that the internal leaf is lightweight concrete blocks. The HFM was positioned to avoid the mortar joints.
28, post-cwiNov 05
Heat loss at eaves and especially at lintels and over the conservatory
29 (Lot 1) Mar 05
A29.1 Front wall (South West facing): Fairly uniform heat loss through the wall but there is a slightly higher heat loss around the ground floor window. There is a lower heat loss at the loft of this property suggesting that the loft is un-heated.
Mar 05 A29.2 Rear wall (North East facing): This thermal image appears to show a wide range of heat losses from this wall, however the warm area on the wall above the patio doors is caused by air leakage from the doors which are broken. The area of wall below the ground floor window shows a low heat loss.
Mar 05 A29.3 Gable wall (South East facing): From this thermal image there appears to be an area of high heat loss on the upper part of the wall with a significant hot spot to the left of the wall. The possible causes for this area of high heat loss is either that a boiler is located at this position within the wall or that there is warm air from the vent (hot spot in the middle of wall) causing this effect.
Mar 05 A29.4 Internal thermal image of the location of HFM 2: The thermal image shows the mortar joints as being colder than the blockwork suggesting that the internal leaf is lightweight concrete blocks. The HFM was positioned to avoid the mortar joints. The vertical strip is caused by a poorly adhering decorative boarder.
Nov 05 A29.9 Thermal bridging at eaves and at lintelsNov 05 A29.10 Thermal bridging at wall-floor junctionNov 05 A29.12 Thermal bridging at eaves29Nov 05, post-cwi
Increased heat loss at eaves (100 mm warm band) at junction between wall and ground floor (approx 100 mm warm band) and at lintels
30, pre-cwi Thermal bridging at wall-floor junction and below window framing30, post-cwi Thermal imaging showed no anomalies31 (Lot 1) Mar 05
A31.1 Front wall (South East facing): Fairly uniform heat loss throughout wall except under bay window where there appears to be a higher heat loss
Mar 05 A31.2 Gable wall (South West facing): Some parts this wall appear to have a slightly higher heat loss than others but on the whole is fairly uniform.
BRE Client report number 77Commercial in confidence - 9 -

Thermal transmittance of walls of dwellings before and after application of cavity wall insulation
Property no.
Figure no.
Comments
Mar 05 A31.3 Rear wall (North West facing): This thermal image is not very clear although it does show cold areas above and below the windows and also on the area of wall between the windows.
Mar 05 A31.4 Front wall below bay windows: The thermal image indicates that the area of wall below the bay window has a high heat loss in comparison with other parts of the wall. The cold spots on the wall are caused by air bricks.
31Nov 05, post-cwi
Elevated temperatures around chimney stack, below eaves and below some windows
32 (Lot 1) Mar 05
A32.1 Front wall (North of North West facing): Fairly uniform heat loss from this wall (slightly higher heat loss on wall around window).
Mar 05 A32.2 Gable wall (East of North East facing): The thermal image shows an uneven distribution of heat loss. When this thermal image was taken it was quite windy which may have had an effect on the image. It was also noted that this house had complicated wall constructions, with operational or abandoned flues in the gable walls, and some cupboards recessed into these walls.
Mar 05 A32.3 Gable wall (West of South West facing): The thermal image shows an uneven distribution of heat loss through the wall with some warm patches to either side of the window. The hot spot to the far right of the wall is a boiler flue.
Mar 05 A32.4 Rear wall (South of South East facing): The thermal image shows an uneven distribution of heat loss through the wall with a cold patch at ground floor level.
Mar 05 A32.5 Rear wall: Fairly uniform heat loss through the wall. Note there is a significant heat loss from underneath the roof tiles, possibly caused by air leakage.
32Nov 05, post-cwi
Warm area below eaves, at junction of two walls and on chimney stack, although images have been influenced by residual solar radiation which needs to be taken into account when interpreting the south and west facades.
33, pre-cwi Different upper and lower wall constructions noted. Dirty wall tie in the vicinity of one of the heat flux meters
33, post-cwi Insulation voids discovered. Cold bridging at lintels.34, Dec 05, pre-cwi
Lot 1 Plaster dabs were visible internally prior to installation of insulation
34, Feb 05, post-cwi
Lot 1 No anomalies were noted after insulation, suggesting that insulation was well installed
Mar 05, pre-cwi
A35.1 Front wall at ground floor level (West of South West facing): Fairly uniform heat loss with a slightly higher loss to the right of the window. Thermal images suggest that there may have been recent sunshine.
Mar 05 A35.2 Front wall at first floor level: Fairly uniform heat loss. Note there is a slightly higher heat loss from the exposed brick (i.e. un-rendered part of wall)
35, post-cwiNov 05
High temperatures noted at lintels and also below a window sill.
36, pre-cwi Warm areas at eaves and lintels36, post-cwi Warm area above a window was investigated and it was found that
there was a void in the insulation there.37, pre-cwi High heat loss where extension abuts the main building. Air leakage
from window warming the area below eaves. 37, post-cwi No post-cwi survey.
BRE Client report number 77Commercial in confidence - 10 -
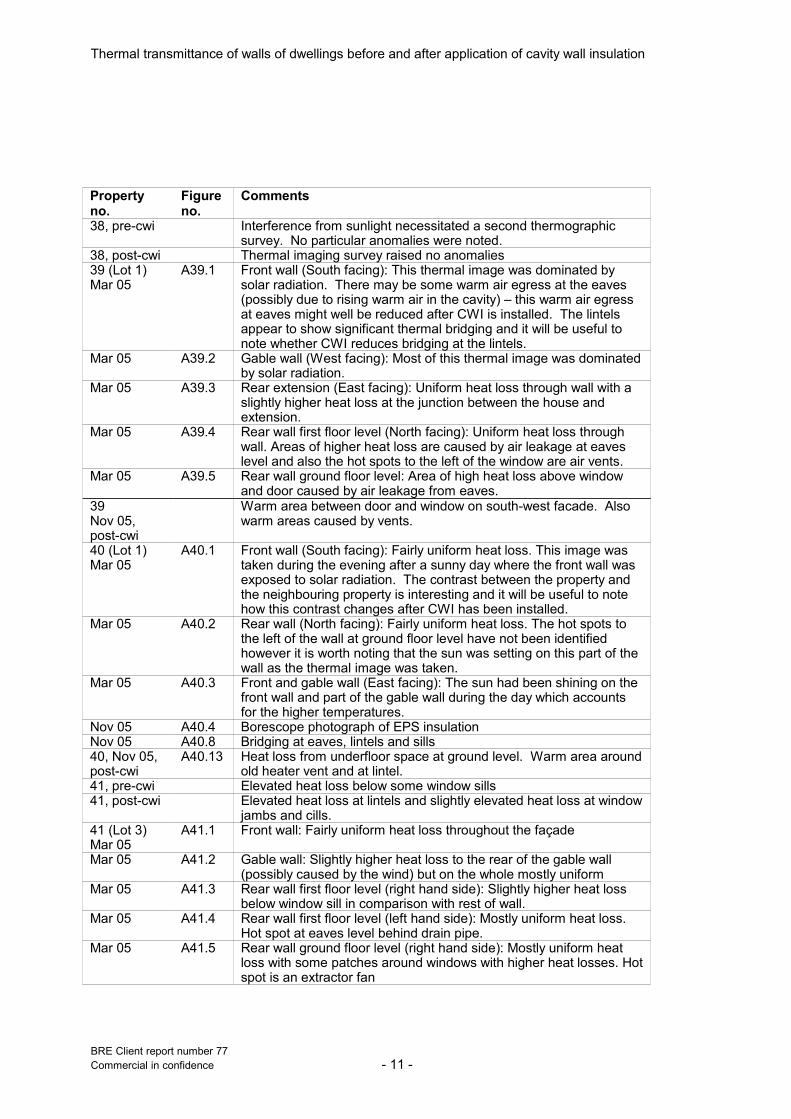
Thermal transmittance of walls of dwellings before and after application of cavity wall insulation
Property no.
Figure no.
Comments
38, pre-cwi Interference from sunlight necessitated a second thermographic survey. No particular anomalies were noted.
38, post-cwi Thermal imaging survey raised no anomalies39 (Lot 1) Mar 05
A39.1 Front wall (South facing): This thermal image was dominated by solar radiation. There may be some warm air egress at the eaves (possibly due to rising warm air in the cavity) – this warm air egress at eaves might well be reduced after CWI is installed. The lintels appear to show significant thermal bridging and it will be useful to note whether CWI reduces bridging at the lintels.
Mar 05 A39.2 Gable wall (West facing): Most of this thermal image was dominated by solar radiation.
Mar 05 A39.3 Rear extension (East facing): Uniform heat loss through wall with a slightly higher heat loss at the junction between the house and extension.
Mar 05 A39.4 Rear wall first floor level (North facing): Uniform heat loss through wall. Areas of higher heat loss are caused by air leakage at eaves level and also the hot spots to the left of the window are air vents.
Mar 05 A39.5 Rear wall ground floor level: Area of high heat loss above window and door caused by air leakage from eaves.
39Nov 05, post-cwi
Warm area between door and window on south-west facade. Also warm areas caused by vents.
40 (Lot 1) Mar 05
A40.1 Front wall (South facing): Fairly uniform heat loss. This image was taken during the evening after a sunny day where the front wall was exposed to solar radiation. The contrast between the property and the neighbouring property is interesting and it will be useful to note how this contrast changes after CWI has been installed.
Mar 05 A40.2 Rear wall (North facing): Fairly uniform heat loss. The hot spots to the left of the wall at ground floor level have not been identified however it is worth noting that the sun was setting on this part of the wall as the thermal image was taken.
Mar 05 A40.3 Front and gable wall (East facing): The sun had been shining on the front wall and part of the gable wall during the day which accounts for the higher temperatures.
Nov 05 A40.4 Borescope photograph of EPS insulationNov 05 A40.8 Bridging at eaves, lintels and sills40, Nov 05, post-cwi
A40.13 Heat loss from underfloor space at ground level. Warm area around old heater vent and at lintel.
41, pre-cwi Elevated heat loss below some window sills41, post-cwi Elevated heat loss at lintels and slightly elevated heat loss at window
jambs and cills.41 (Lot 3) Mar 05
A41.1 Front wall: Fairly uniform heat loss throughout the façade
Mar 05 A41.2 Gable wall: Slightly higher heat loss to the rear of the gable wall (possibly caused by the wind) but on the whole mostly uniform
Mar 05 A41.3 Rear wall first floor level (right hand side): Slightly higher heat loss below window sill in comparison with rest of wall.
Mar 05 A41.4 Rear wall first floor level (left hand side): Mostly uniform heat loss. Hot spot at eaves level behind drain pipe.
Mar 05 A41.5 Rear wall ground floor level (right hand side): Mostly uniform heat loss with some patches around windows with higher heat losses. Hot spot is an extractor fan
BRE Client report number 77Commercial in confidence - 11 -

Thermal transmittance of walls of dwellings before and after application of cavity wall insulation
Property no.
Figure no.
Comments
Mar 05 A41.6 Rear wall ground floor level (left hand side): Mostly uniform heat loss with some patches around windows with higher heat losses. cold spot is a wooden box.
41Nov 05, post-cwi
A41.7 Thermal bridging at eaves and lintels
42 (Lot 3) Mar 05
A42.1 Front wall first floor level: Fairly uniform heat loss throughout wall area. The hot spot is an air vent. Note that the emissivity is 0.93.
Mar 05 A42.2 Front wall, ground floor level: Fairly uniform heat loss throughout wall area.
Mar 05 A42.3 Gable wall first floor level: Fairly uniform heat loss throughout wall area. Hot spot is a trickle vent
Mar 05 A42.4 Gable wall ground floor level: Fairly uniform heat loss throughout wall area
Mar 05 A42.5 Rear wall first floor level (left hand side): At this location there is a party wall that separates the two properties which explains why there is a high heat loss at this point.
Mar 05 A42.6 Rear wall first floor level (right hand side): Slightly higher heat loss on the area of wall to the right of the window
Mar 05 A42.7 Rear wall mid floor: Higher heat loss above the lintel of the ground floor patio doors.
Nov 05, post-cwi
A42.8 Thermal bridging at eaves and lintels
43, pre-cwi Elevated heat loss below bay window; elevated heat loss at lintel; possible elevated heat loss above conservatory;
43, post-cwi Elevated heat loss below bay window persisting after application of insulation; insulation voids detected as a result of the thermography; clearly elevated heat loss at lintels but not at eaves; elevated heat loss above conservatory;
44 (Lot 3) Mar 05
A44.1 Front wall: This thermal image was affected by solar radiation from earlier in the day which explains the high temperatures on the roof and front wall. The image does however show that there might be a higher heat loss below the bay window.
Mar 05 A44.2 & A44.3
Gable wall: These images were affected by solar radiation.
Mar 05 A44.4 Rear wall first floor level (left hand side): This image has been affected by solar radiation
Mar 05 A44.5 Rear wall first floor level (right hand side): This image has been affected by solar radiation
Mar 05 A44.6 Rear wall ground floor level (left hand side): This image has been affected by solar radiation
44, post-cwiNov 05
A44.7 Thermal bridging at eaves and sides of bay window
45 (Lot 3) Mar 05
A45.1 Front wall first floor level: Fairly uniform heat loss through the area of wall. Slightly higher loss below right hand side window
Mar 05 A45.2 Front wall ground floor level: Fairly uniform heat loss through the area of wall.
BRE Client report number 77Commercial in confidence - 12 -

Thermal transmittance of walls of dwellings before and after application of cavity wall insulation
Property no.
Figure no.
Comments
Mar 05 A45.3 Rear wall first floor level (right hand side): Higher heat loss on wall is an effect possibly caused by heat escaping from glass conservatory.
Mar 05 A45.4 Rear wall first floor level (left hand side): Mostly uniform heat loss. Slightly higher heat loss to the right hand side of window caused by partition wall between properties. After CWI has been installed it will be useful to take a close look at the wall next to the conservatory to assess the continuity of the insulation in this area, taking account of the practicalities of installing CWI in the vicinity of a conservatory and the possibility of CWI slumping down into areas of the wall that are missed by the installer.
Mar 05 A45.5 Gable wall: Fairly uniform heat loss through this area of wall. The hot spots on first floor are caused by two open windows and on the ground floor by a boiler vent
45Nov 05, post-cwi
A45.6 Thermal bridging at eaves and lintels
46, pre-cwi Thermal bridging at wall-floor junction46, post-cwi Some areas of facade left unfilled due to confusion about location of
existing insulation in the extensions. Thermal bridging at lintels.47 (Lot 3) Mar 05
A47.1 Front wall: High heat loss below the sills of the first floor and ground floor bay windows. The high heat loss could be due to radiators below the bay windows and this can be verified on the autumn re-visit. It will be useful to note whether the CWI installation can correct the very poor thermal performance around the bay windows. Note that the camera emissivity setting was 0.93.
Mar 05 A47.2 Front wall first floor level: Mostly a uniform heat flow.Mar 05 A47.3 Front wall first floor bay window: High heat loss below sill of windowMar 05 A47.4 Front wall ground floor bay window: High heat loss below sill of
windowMar 05 A47.5 Rear wall first floor level: Fairly uniform heat lossMar 05 A47.6 Rear wall ground floor level: Slightly higher heat loss below sill of
double windowMar 05 A47.7 Gable wall: Fairly uniform heat lossNov 05 A47.8 High heat loss from wall below bay window48, pre-cwi Warm area below bay window48, post-cwi Warm areas at lintels, warm area below satellite dish.49 (Lot 3) Mar 05
A49.1 Front wall first floor level: Fairly uniform heat loss throughout wall area. It will be useful to note whether the tile-covered wall creates any impediment to the application of insulation. e = 0.92.
Mar 05 A49.2 Front wall, ground floor level: The bay window was part of a recent garage conversion where an insulation panel was fitted below the window which shows up as a cold spot on the thermal image
Mar 05 A49.3 Front wall ground floor: Insulated bay window Mar 05 A49.4 Gable wall: Uniform heat flow. Lower heat loss at loft level indicating
that this space is un-heated. Mar 05 A49.5 Rear wall left hand side of first floor level: Area of high heat loss
adjacent to window is caused from a missing tile on the claddingMar 05 A49.6 Rear wall mid floor level (right hand side): Uniform heat loss. Hot
spot is a security light.Mar 05 A49.7 Rear wall ground floor level (left hand side): Uniform heat loss. Cold
spots are air vents.
BRE Client report number 77Commercial in confidence - 13 -

Thermal transmittance of walls of dwellings before and after application of cavity wall insulation
Property no.
Figure no.
Comments
49, post-cwi Slightly elevated heat loss immediately below bay window, but indications are that the area below the bay window was insulated effectively.
50 (Lot 3) Mar 05
A50.1 Front wall first floor level: Mostly uniform heat flow. Slightly higher heat loss below right hand side window.
Mar 05 A50.2 Front wall ground floor level: Mostly uniform heat loss with some patches of higher heat flow around windows.
Mar 05 A50.3 Gable wall: Uniform heat loss Mar 05 A50.4 Rear wall first floor level (right hand side): Uniform heat loss. Slightly
higher heat loss below window sill. Note the reflections in the window glass.
Mar 05 A50.5 Rear wall first floor level (left hand side): Slightly higher heat loss at partition wall between properties
Mar 05 A50.6 Rear wall ground floor level: Uniform heat loss. Slightly higher loss around patio doors. There is a curious staining effect to the left of the patio door and it would be useful to investigate this more closely on the re-visit in the autumn. e = 0.95.
Nov 05 A50.7 Thermal bridging at lintels and eaves and high heat loss from large area of side wall
51 (Lot 3) Mar 05
A51.1 Front wall first floor: Fairly uniform heat loss
Mar 05 A51.2 Front wall ground floor: Fairly uniform heat lossMar 05 A51.3 Front/ gable wall: Fairly uniform heat lossMar 05 A51.4 Rear wall first floor (left hand side): Fairly uniform heat lossMar 05 A51.5 Rear wall first floor (right hand side): Fairly uniform heat lossMar 05 A51.6 Rear wall ground floor (right hand side): Fairly uniform heat loss. To
the right hand side of the patio doors there is an area of lower heat loss caused by the migration of the next door neighbours insulation (this was confirmed via a cavity inspection)
Mar 05 A51.7 Rear wall mid storey: Fairly uniform heat lossMar 05 A51.8 Rear wall ground floor (left hand side): Fairly uniform heat loss51Nov 05, post-cwi
A51.9 Thermal bridging at lintels and eaves and wall below bay window
52 (Lot 3) Mar 05
A52.1 Front wall (right hand side): Fairly uniform heat loss. There was solar radiation earlier in the day which accounts for the high temperatures on the roof.
Mar 05 A52.2 Centre of front wall: Fairly uniform heat loss. Timber panels below windows show a lower heat loss, an effect possibly caused the emissivity of the painted panels.
Mar 05 A52.3 Front wall (left hand side): Fairly uniform heat loss. Timber panel below window appearss to have a lower heat loss, an effect possibly caused the emissivity of the painted panels.
Mar 05 A52.4 Wall perpendicular to front wall: Appears to have a slightly lower heat loss at eaves level. This wall was affected by solar radiation so image may not be a true representation of the heat loss. Timber panel below window shows to have a lower heat loss, an effect possibly caused the emissivity of the painted panels.
Mar 05 A52.5 Wall perpendicular to front wall: This wall was affected by solar radiation so image may not be a true representation of the heat loss. Timber panel below window shows to have a lower heat loss, an effect possibly caused the emissivity of the painted panels.
Mar 05 A52.6 Rear wall: Small section of wall below window has a slightly higher heat loss next to patio doors.
BRE Client report number 77Commercial in confidence - 14 -

Thermal transmittance of walls of dwellings before and after application of cavity wall insulation
Property no.
Figure no.
Comments
Mar 05 A52.7 Rear wall: Very little area of wall. Higher heat loss next to openings.Mar 05 A52.8 Rear wall: Fairly uniform heat loss. Cold spots are drain pipes and
obstructions leaning against the wall. This wall was affected by solar radiation so image may not be a true representation of the heat loss.
52Nov 05, post-cwi
A52.9-A52.16
Thermal bridging at wall-floor junction & possible air leakage at patio doors
53, Dec05, pre-cwi
High heat loss at lintels, warm areas at eaves above windows
53, Feb 05, post-cwi
High heat loss at lintels, air voids noted in the cavity on one part of the wall; thermal bridging at balcony
54, Dec 05 pre-cwi Warm areas around windows, including window sills and below bay windows
54, Feb 06 postcwi Non-uniform surface temperatures below some windows. High heat loss at some wall-roof junctions; elevated heat loss at lintels; interesting picture of a brush in a cavity;
55, pre-cwi Heat loss at ground floor level, high heat loss below some window sills, warm areas at roof eaves above some windows
55, post-cwi High heat loss at ground floor level, high heat loss at some lintels, warm areas at roof eaves above some windows. In contrast to the situation before insulation there were no instances of high heat loss identified below window sills, suggesting that the warm areas might have been due to radiators. No obvious signs of insulation defects.
56, pre-cwi LOT4
Lightweight blocks identified
56, post-cwi Surprisingly, the lightweight blocks are visible even after installation fo insulation. No obvious signs of insulation defects.
57, pre-cwi Lightweight blockwork evident, elevated temperature at eaves level and at ground floor level. High heat loss noted at wall corners
57, post-cwi No obvious defects in the insulation58, pre-cwi Evidence of lightweight blockwork; high heat loss at wall-wall
junctions; high heat loss below windows where radiators are located58, post-cwi High heat loss from walls below damp-proof course; east wall only
partially insulated due to proximity to neighbouring property; numerous defects in the insualtion layer noted on the west facade
59, pre-cwi Cold patches on walls noted; high heat loss at ground floor level;59, post-cwi Some cold patches on the walls have gone but some have not
(small patches where heat loss is high); high heat loss at ground floor level; high heat loss at lintels; some evidence of thermal bridging extending well above lintels. Some areas of high heat loss just below ceiling at roof line.
60, pre-cwiLOT1
Some thermal bridging in cavity near to where the second heat flux meter was sited; elevated temperatures at eaves especially on south east facade;
60, post-cwi No features of note; insulation appears to be satisfactory61, Feb 05, post-cwi
Warm area to either side of the kitchen window. Subsequent borescope examination revealed that there was missing insulation in an area approximately half a meter square. Otherwise the wall appeared to be well insulated.
62, pre-cwi Property had already been insulated without the initial surveyors knowing.
BRE Client report number 77Commercial in confidence - 15 -

Thermal transmittance of walls of dwellings before and after application of cavity wall insulation
Property no.
Figure no.
Comments
62, Dec 05, post-cwi
Some warming noted at eaves and lintels and slight warming at some window sills. The panel below the front upstairs bay window appears to be losing more heat than the surrounding wall (although this could be an emissivity-related effect)
63, pre-cwi, Dec 05
Elevated heat loss at eaves and at inverted corner.
63, post-cwi It was not possible to carry out a thermal imaging survey after insulation due to the insulation timescales.
64, Dec 05, post-cwi
Property had been insulated, unbeknown to the installers; slightly elevated heat loss at window surrounds and lintels (but only slight)
65, Dec 05, post-cwi
Property had been insulated unbeknown to installers; Thermal images not available;
66, pre-cwi This property had already been insulated under Warm Front and was selected at a late stage to increase the dataset.
66Feb 05
There were some warm patches on the front facade, particularly below the window sill in the main front bedroom. The rear wall appeared to be well insulated, however thermal bridging was evident at the junction between the existing dwelling and the kitchen extension and also at eaves and lintels.
67, pre-cwi Some areas of elevated heat transfer around jambs and cills.67Feb 05, post-cwi
Insulation appeared to be well installed. A vertical warm patch was noted on the side wall adjacent to the fire and chimney stack. There was also a warm area below internal floor level all around the perimeter of the house (Warm area approx. 200 mm vertical dimension).
68Dec 05 & Feb 06
Pre-CWI: No notable features, but slight warm areas where wall meets ground as well as warm areas immediately below eaves. Warm area noted at the inverted corner adjacent to the front door.
Post-CWI: The area below the east facing window (close to ground level), the area below the rear kitchen window (close to ground level) and the two sides of the kitchen window indicate a possibility of insulation being missing or an unknown structural feature being present. As commonly observed in dwellings in general there is a warm band below the roof eaves, perhaps 100 to 200 mm wide.
69, Dec 05 & Feb 06
An additional area of high surface temperature was observed post CWI on the internal corner of the front façade above the main entrance running up to the eaves. This was too high to safely carry out a cavity inspection. However when viewing the same location from inside the property no corresponding “cold patch” was observed which would have confirmed insulation voids or failures.
70, Dec 05 & Feb 06
Elevated heat loss at window surrounds, particularly sills, both before and after application of insulation.
Table B.1 Summarised results of the thermal imaging.
BRE Client report number 77Commercial in confidence - 16 -

Thermal transmittance of walls of dwellings before and after application of cavity wall insulation
Appendix C Energy savings predictions
Table C.1 shows the basis of the calculations, showing the basis of the existing EEC calculations and the proposed basis of revised calculations, both using BREDEM-12.
Category BREDEM 12-2001 assumed impact
(EEC3)
BREDEM-12 allowing for U-values
Fillable areas (but unfilled)Adventitious voids n.a. 0.3%
Unfillable AreasVoids due to obstructions n.a. 0.04%Uninsulated due to conservatory n.a. 3%Uninsulated due to tile hanging, timber panelling etc.
n.a. 5%
Other areas where heat loss occursThermal bridging at lintels n.a. y factor of 0.15Thermal bridging at roof eaves n.a. y factor of 0.15Thermal bridging at wall-floor junctions n.a. y factor of 0.15Thermal bridging at vertical corners Ψ-value y factor of 0.15Allowance for comfort uptake yes yes
Total assumed impact A global 30% factor is used which partly allows for comfort uptake
8% (excluding thermal bridging at junctions & lintels)
Assumed percentage of wall area which is left uninsulated
0% 8%
Other assumptionsU-value of wall before insulation (pre - 1976 dwellings),
1.44 1.40 ± 0.03(measured)
U-value of wall after insulation (pre-1976 dwellings), not allowing for unfilled areas
0.48 0.67 ± 0.08(measured)
U-value of wall after insulation, pre-1976, allowing for 8% unfilled areas
0.557 0.73 ± 0.07 (if 8% unfilled)
U-value of wall before insulation (1976 - 1983), 1.0 1.18 ± 0.08(measured)
U-value of wall after insulation (1976 - 1983), not allowing for unfilled areas
0.420 0.56 ± 0.19(measured)
U-alue of wall after insulation, 1978-83, allowing for 8% unfilled areas
0.466 0.61 ± 0.17
U-value of wall before insulation (post - 1983 dwellings),
0.694 1.03 ± 0.07(measured)
U-value of wall after insulation (post - 1983 dwellings), not allowing for unfilled areas
0.343 0.57 ± 0.14(measured)
U-value of wall after insulation (post-1983) allowing for 8% unfilled areas
0.371 0.61 ± 0.13
U-value of wall before insulation (whole sample of dwellings)
1.300 1.33 ± 0.03(measured)
U-value of wall after insulation (whole sample of dwellings), not allowing for unfilled areas
0.456 0.65 ± 0.07(measured)
U-value of wall after insulation (whole sample of dwellings), allowing for 8% unfilled areas
- 0.70 ± 0.06
Boiler efficiency 78% 78%U-value of windows 2.8 2.8
BRE Client report number 77Commercial in confidence - 17 -

Thermal transmittance of walls of dwellings before and after application of cavity wall insulation
Category BREDEM 12-2001 assumed impact
(EEC3)
BREDEM-12 allowing for U-values
U-value of doors 3.0 3.0U-value of roof 0.322 0.322U-value of floor 0.684 0.684Total window area (m²) 16.9 16.9Total door area (m²) 3.8 3.8Net wall area (excl. window/door area) 102.5 102.5Energy saving for pre-1976 propertieskWh/yr 3746 3679 ± 10% (if 8% unfilled)Energy saving for 1976-83 propertieskWh/yr 2217 3078 ± 28% (if 8% unfilled)Energy saving for post-1983 propertieskWh/yr 1363 2235 ± 21% (if 8% unfilled)Energy saving, averaged for whole sample, kWh/yr 3290 3393 ± 9% (if 8% unfilled)Table C.1
In calculating the overall heat loss, allowing for thermal bridging at lintels and junctions (right hand column), the term in BREDEM known as "ΣAU" is increased by y × ΣA, where y = 0.15 W/m²K ("y-factor") and ΣA is the sum of all the external areas, including walls, windows, doors, roofs and ground floors.
From the results in Table C.1 it is notable that the overall consumption predicted by BREDEM-12, allowing for the measured U-values, is not dissimilar from the consumption figure for the assumed impact, which used a global correction of 30%.
It is notable that the error in the improvements for the 1978-1983 and post-1983 age categories is quite large, however the overall error in the average improvement across all age groups is less. If we combine the 1978-1983 and post-1983 groups we obtain a resulting mean saving of approximately 2650 ± 18%. These figures suggest that the saving for post-1976 dwellings is slightly less than the saving for pre-1976 dwellings but it cannot be concluded with certainty (95% confidence) that the savings for the two age groups are different.
BRE Client report number 77Commercial in confidence - 18 -

Thermal transmittance of walls of dwellings before and after application of cavity wall insulation
Appendix D Summary of the weather conditions (bound separately)
Table D.1 gives a summary of the weather conditions observed by the Met Office during the periods of measurement used in this project. Those weather conditions, given in the separately-bound Appendix D, were used to assist in the interpretation of the results.
BRE Client report number 77Commercial in confidence - 19 -

Thermal transmittance of walls of dwellings before and after application of cavity wall insulation
Appendix E (CONFIDENTIAL) Addresses of the properties
This Appendix provides a list of occupier names and addresses of the properties in the study. The information is confidential and to protect confidentiality for the occupiers this Appendix is bound separately.
BRE Client report number 77Commercial in confidence - 20 -

Thermal transmittance of walls of dwellings before and after application of cavity wall insulation
Appendix F Dates of CWI installation and periods of monitoring
Dates of CWI installation are given in Table F.1.
File ref. First day of heat flow measure-ment (pre-cwi)
Last day of heat flow measure-ment (pre-cwi)
Date of applica-tion of insulation
First day of heat flow measure-ment (post-cwi)
Last day of heat flow measure-ment (post-cwi)
1 08/03/2005 22/03/2005 12-May-05 26/10/2005 15/11/20052 08/03/2005 23/03/2005 26-Apr-05 26/10/2005 17/11/20053 08/03/2005 23/03/2005 10-May-05 02/11/2005 18/11/20054 08/12/2005 22/12/2005 26-Jan-06 01/02/2006 20/02/20065 00/01/1900 00/01/1900 18-Apr-05 25/10/2005 22/11/20056 00/01/1900 00/01/1900 11-May-05 28/10/2005 16/11/20057 14/03/2005 25/03/2005 20-Jun-05 01/11/2005 17/11/20058 11/03/2005 29/03/2005 05-May-05 02/11/2005 18/11/20059 05/12/2005 21/12/2005 20-Feb-06 14/02/2006 08/03/200610 11/03/2005 29/03/2005 07-Jun-05 01/11/2005 18/11/200511 05/12/2005 21/12/2005 06-Feb-06 14/02/2006 08/03/200612 14/03/2005 04/04/2005 29-Apr-05 02/11/2005 16/11/200513 07/12/2005 21/12/2005 15-Feb-06 14/02/2006 08/03/200614 08/12/2005 22/12/2005 08-Jan-06 01/02/2006 20/02/200615 07/03/2005 21/03/2005 29-Jun-05 31/08/2005 14/09/200516 08/03/2005 21/03/2005 22-Jul-05 01/11/2005 14/11/200517 09/03/2005 23/03/2005 (not filled) nihil nihil18 nihil nihil (not filled) nihil nihil19 07/12/2005 19/12/2005 12-Jan-06 25/01/2006 08/02/200620 07/03/2005 21/03/2005 30-Mar-05 02/11/2005 16/11/200521 10/03/2005 24/03/2005 29-Jun-05 01/11/2005 15/11/200522 08/03/2005 22/03/2005 (not filled) nihil nihil23 09/03/2005 23/03/2005 (not filled) nihil nihil24 06/12/2005 20/12/2005 13-Feb-06 08/03/2006 27/03/200625 05/12/2005 21/12/2005 02-Dec-05 23/01/2006 22/02/200626 09/03/2005 24/03/2005 12-Jul-05 31/10/2005 15/11/200527 11/03/2005 26/03/2005 - nihil nihil28 11/03/2005 30/03/2005 21-Jul-05 01/11/2005 17/11/200529 14/03/2005 30/03/2005 04-May-05 28/10/2005 17/11/200530 06/12/2005 21/12/2005 31-Jan-06 06/02/2006 22/02/200631 09/03/2005 24/03/2005 01-Jun-05 31/10/2005 15/11/200532 15/03/2005 30/03/2005 26-Apr-05 31/10/2005 15/11/200533 05/12/2005 21/12/2005 11-Jan-06 23/01/2006 22/02/200634 05/12/2005 21/12/2005 23-Dec-05 23/01/2006 22/02/200635 14/03/2005 30/03/2005 26-May-05 01/11/2005 17/11/200536 07/12/2005 21/12/2005 18-Nov-05 23/01/2006 22/02/2006
BRE Client report number 77Commercial in confidence - 21 -

Thermal transmittance of walls of dwellings before and after application of cavity wall insulation
File ref. First day of heat flow measure-ment (pre-cwi)
Last day of heat flow measure-ment (pre-cwi)
Date of applica-tion of insulation
First day of heat flow measure-ment (post-cwi)
Last day of heat flow measure-ment (post-cwi)
37 06/12/2005 21/12/2005 24-Feb-06 06/02/2006 14/03/200638 06/12/2005 21/12/2005 05-Dec-05 06/02/2006 22/02/200639 08/03/2005 12/03/2005 06-Apr-05 31/10/2005 15/11/200540 11/03/2005 30/03/2005 04-Aug-05 01/11/2005 17/11/200541 09/03/2005 24/03/2005 18-Jul-05 01/11/2005 17/11/200542 10/03/2005 29/03/2005 06-Apr-05 31/10/2005 15/11/200543 13/12/2005 12/01/2006 24-Jan-06 12/01/2006 07/02/200644 14/03/2005 29/03/2005 27-Apr-05 02/11/2005 17/11/200545 08/03/2005 15/03/2005 16-Mar-05 02/11/2005 17/11/200546 13/12/2005 11/01/2006 05-Jan-06 00/01/1900 00/01/190047 08/03/2005 24/03/2005 04-Apr-05 31/10/2005 16/11/200548 12/01/2006 08/02/2006 (not filled) nihil nihil49 10/03/2005 29/03/2005 11-Jul-05 02/11/2005 17/11/200550 09/03/2005 24/03/2005 02-Apr-05 01/11/2005 16/11/200551 14/03/2005 29/03/2005 10-Jun-05 01/11/2005 16/11/200552 09/03/2005 24/03/2005 15-Apr-05 01/11/2005 16/11/200553 14/12/2005 11/01/2006 15-Feb-06 15/02/2006 08/03/200654 14/12/2005 12/01/2006 17-Feb-06 17/02/2006 08/03/200655 15/12/2005 11/01/2006 27-Jan-06 27/01/2006 08/02/200656 06/12/2005 20/12/2005 12-Jan-06 30/01/2006 17/02/200657 06/12/2005 20/12/2005 13-Jan-06 30/01/2006 17/02/200658 06/12/2005 20/12/2005 12-Jan-06 30/01/2006 17/02/200659 00/01/1900 00/01/1900 16-Feb-06 01/02/2006 09/03/200660 05/12/2005 21/12/2005 07-Nov-05 30/01/2006 22/02/200661 07/12/2005 21/12/2005 10-Feb-06 25/01/2006 08/02/200662 nihil nihil 21-Dec-00 05/12/2005 09/12/200563 08/12/2005 21/12/2005 25-Feb-06 27/03/2006 19/04/200664 nihil nihil no record 08/12/2005 20/12/200565 nihil nihil no record 06/12/2005 20/12/200566 nihil nihil 24-Jan-06 24/01/2006 07/02/200667 08/12/2005 21/12/2005 04-Feb-06 nihil nihil68 06/12/2005 20/12/2005 02-Feb-06 22/02/2006 15/03/200669 15/12/2005 11/01/2006 05-Jan-06 11/01/2006 08/02/200670 14/12/2005 11/01/2006 24-Jan-06 24/01/2006 08/02/2006
Table F.1
It is notable that in some cases the monitoring was being carried out on the day that insulation was installed. In these cases, the heat flux meters were left in place on the day of the insulation and in the analysis the data collected was split into two parts – one part corresponding to the condition of the wall prior to insulation and one part corresponding to the condition after.
BRE Client report number 77Commercial in confidence - 22 -

Thermal transmittance of walls of dwellings before and after application of cavity wall insulation
Appendix G Images of the heat flux meter arrangement
Figure G.1 shows an example of a heat flux meter affixed to a wall.
During the course of the U-value measurements the heat flux meters were supported by adjustable vertical poles, known as teleprops, which were located approximately 50 mm from the internal finished surface of the wall. Once the teleprop was positioned, a heat flux meter was carefully positioned and a gutter clamp inserted between the heat flux meter and the teleprop. The position of the teleprop was then adjusted to ensure that the heat flux meter was pressed firmly against the wall surface. In order to ensure good thermal contact a substrate was pasted to the heat flux meter (usually petroleum jelly or heat sink paste) in order to eliminate air pockets between the heat flux meter and the wall surface. To protect the internal wall finish from being stained or damaged a thin plastic film was placed between the substrate and the wall surface (the plastic film is visible in the Figure). In order to monitor internal temperature a thermistor probe was used, as shown in the Figure. The thermistor probe was approximately 55 mm long and 3 mm in diameter. Care was taken to ensure that the thermistor probe was not more than 30 mm from the centre of the heat flux meter in order to be certain that the temperature being recorded was representative of the environmental conditions being presented to the heat flux meter.
Figure G.1 A heat flux meter affixed to a wall
BRE Client report number 77Commercial in confidence - 23 -

Thermal transmittance of walls of dwellings before and after application of cavity wall insulation
Appendix H Analysis of errors in the U-value measurements
The errors in the measured U-values were estimated taking into account the various factors that are listed (and briefly described) in Section 9 of ISO 9869. The error analysis took account of the following:
1. The accuracy of the manufacturer's calibration of the heat flux meters (i.e. the stated relationship between the voltage signal from the HFM and the heat flux which that voltage indicates)
2. Accuracy in the measurement of the internal and external temperatures.3. Temperature variations within the space.4. Accuracy of the data logging system.5. Imperfections in the thermal contact between the heat flux meters and the internal finished surfaces of
the walls.6. Operational errors arising from the shape of the heat flux meters.7 Random time-dependent fluctuations.8. Differences between air temperatures, radiant temperatures and surface temperatures.
In this appendix the above factors will each be considered in turn in order to arrive at an overall error in the measured U-values.
1. Errors in the calibrations of the heat flux metersThe heat flux meters used to measure the U-values of the wall constructions were purchased by the Energy Saving Trust and were manufactured by a Dutch company called Hukseflux. The Hukseflux heat flux meters were individually supplied with calibration certificates. The calibration constants supplied by the manufacturer are expressed as a ratio between the induced electrical EMF and the heat flux (expressed in watts per square metre). Each of the manufacturer’s certificates states that the calibration is traceable to the “guarded hot plate” of National Physical Laboratory (NPL).
The manufacturer’s calibration process involved Hukseflux testing the meters in accordance with ISO 8302, making use of calibration samples provided by NPL. The estimation of error in the calibration factors took into account a wide range of measurement uncertainties and the resulting error quoted by Hukseflux in their calibration certificates was 20%.
Given the fact that all of the calibration factors were in the range 57 to 63 microvolts per W/m², the 20% error seemed large, unless there was a global systematic error applying to all of the heat flux meters, and applying to each of them in the same direction. Otherwise, the 20% error would appear to be conservative.
To assess this uncertainty, it was decided to carry out laboratory tests in order to determine whether the true accuracy of the HFMs was in fact better than their quoted value of 20%. In order to determine their accuracy two separate laboratory tests were carried out. Firstly, one of the HFMs was tested by National Physical Laboratories in Teddington to determine its actual sensitivity, so that this could be compared with the sensitivity given by the manufacturers. Secondly, approximately twenty HFMs, including the one which was tested by National Physical Laboratory, were subjected to nearly-identical conditions, in an environmental chamber at Glasgow Caledonian University, in order to determine the difference between their actual sensitivities and the manufacturer's quoted sensivities.
The tests carried out by National Physical Laboratories
BRE Client report number 77Commercial in confidence - 24 -

Thermal transmittance of walls of dwellings before and after application of cavity wall insulation
One HFM was sent to National Physical Laboratory and between 7 December 2007 and 17 January 2008 NPL carried out tests using their thermal conductivity measurement apparatus conforming to ISO 8302:1991. The serial number of this HFM was 1097. The tests were carried out at three different temperatures: 10°C, 20°C and 30°C, and it was found that the sensivitity varied slightly with temperature. The tests were carried out for three different levels of heat flux, with mean density of heat flow rates of 5 W/m², 15 W/m² and 25 W/m². The results were presented in calibration certificate PP21/E07110311/2 (30 January 2008).
The heat flux transducer (HFM) was calibrated using a precision single-sided 305 mm guarded hot-plate (NPL VGHP), in which the transducer was mounted horizontally in a specifically designed 305 mm square guarding sheet provided by the transducer manufacturer (Hukseflux) and made from the same material as the transducer. Thermocouples were mounted on each surface of the transducer, as well as on surfaces of the guarding sheet, and thermal contact sheets were used to help ensure that there was an even distribution of heat flow. In this apparatus, plate-mounted thermocouples and a differential thermocouple were used to monitor the temperature balance between the guard and metering area of the heater plate. Linear temperature gradient edge guards were also used to further minimise lateral heat flow from the metering area. All the temperature sensors and electrical instruments used were calibrated with traceability to national standards.
q = (v(16.48 - 0.0491θ)) W/m²
where v is the transducer output in millivolts and θ is the temperarature in degrees Celsius.
The overall uncertainty of the NPL calibration is estimated by NPL to be within ±1%, based on a standard uncertainty multiplied by a coverage factor k=2, providing a level of confidence of approximately 95%.
The tests carried out at Glasgow Caledonian University's environmental chamberGlasgow Caledonian University prepared a test panel, which was fitted between two environmental chambers, each one with a controlled temperature. One environmental chamber was kept at a temperature of approximately 22°C and the other environmental chamber was kept at a temperature of approximately 2°C. 22 Hukseflux meters were attached to the panel for calibration testing, where one of the 22 Hukseflux meters was the one which had been calibrated by National Physical Laboratories (NPL had calibrated the Hukseflux meter with serial number 1097). The Hukseflux meters were installed in the environmental chamber on Friday 22 February 2008 and de-installed on Wednesday 27 February 2008. The university also arranged for air to circulate around the warmer environmental chamber for the duration of the test in order to keep temperatures as uniform as possible.
The test panel consisted of varnished plywood (approximately 10 mm thick) bonded to approximately 20 mm of extruded polystyrene insulation. The Hukseflux meters were arranged in three columns and were attached using duct tape and double-sided sticky tape. Duct tape was attached the the Hukseflux meter, since duct tape can later be peeled off without damaging the meter. The Hukseflux meter with duct tape was then attached to the varnished plywood surface using strong double-sided sticky tape. The serial numbers of the Hukseflux meters, together with their relative positions, are shown in Figure 1.
BRE Client report number 77Commercial in confidence - 25 -

Thermal transmittance of walls of dwellings before and after application of cavity wall insulation
2704* 1954* 1070*
1093 1088 1449
1098 1104 1412
1090 1450 1102
1092 1080 1416
1083 1097* 1101
1448 1086 1091
1094 1085 1089
1081
Figure 1 The relative locations of the Hukseflux meters on the test panel
*The three HFMs at the top were lent by Glasgow Caledonian University in order to increase the size of the statistical sample. The other 22 HFMs are the property of EST.
As can be seen in the photograph in Figure 2 the Hukseflux meters were located away from the perimeter edge of the panel. They were also positioned to avoid the boundaries between adjacent insulation slabs, since there may be a disturbance to the heat flow pattern at these boundaries (the boundaries are shown as thin white tapes laid on the face of the plywood).
Owing to the calibration panel being able to accommodate more HFMs than was first envisaged, it was decided to add three additional HFMs to the panel, these being HFMs owned by Glasgow Caledonian University to find out if their separate batch behaved similarly to the batch which had been purchased by EST. The HFMs provided by Glasgow Caledonian University were the three at the top of the panel, with serial number 2704, 1954 and 1070.
BRE Client report number 77Commercial in confidence - 26 -

Thermal transmittance of walls of dwellings before and after application of cavity wall insulation
Figure 2 A photograph of the HFMs being tested in the warm environmental chamber at Glasgow Caledonian University
BRE Client report number 77Commercial in confidence - 27 -

Thermal transmittance of walls of dwellings before and after application of cavity wall insulation
Figure 3 A photograph taken from the cold environmental chamber, showing the cold side of the insulation which was bonded to the plywood.
On the basis of the calibration factor supplied by NPL for the HFM of serial number 1097, the U-value of the test panel was found to be 1.199 W/m²K.
The mean apparent U-value of the panel, based on the Hukseflux quoted calibrations, was 1.208 W/m²K, and the standard deviation of the apparent U-value was found to be 0.035 W/m²K (i.e. a standard deviation about the mean of 2.9%).
Table 1 shows the Hukseflux calibration factors and the calibration factors which were obtained using the NPL tests in conjunction with the tests at Glasgow Caledonian University.
Serial number of HFM
Hukseflux calib-ration factorμV per W/m²
Revised calibra-tion factorμV per W/m²
Ratio of revised factor to original factor
HF1097* 62.70 64.75 1.0327HF1080 62.50 63.18 1.0109HF1086 61.30 63.40 1.0343HF1085 62.30 63.21 1.0146HF1450 60.70 62.10 1.0231HF1104 63.20 61.73 0.9767HF1088 62.30 63.09 1.0127HF1449 60.20 61.40 1.0199HF1412 61.20 58.33 0.9531HF1102 60.70 62.26 1.0257HF1091 62.40 65.99 1.0575HF1101 62.00 63.57 1.0253HF1416 60.60 61.62 1.0168HF1089 62.10 65.63 1.0568HF1092 61.50 62.50 1.0163HF1448 59.70 62.77 1.0514HF1094 62.40 60.86 0.9753HF1083 63.10 62.11 0.9843HF1098 62.00 60.40 0.9742HF1093 61.40 60.62 0.9873HF1090 60.80 59.49 0.9785HF1081 62.60 62.44 0.9974Mean 61.71 62.34 1.0101
Standard devi-ation
0.029
Standard error 0.006 (0.6%)*The HFM which was calibrated at NPL's labs
It was found that the mean of the revised calibration factors for the HFMs was only 1.01% higher than the mean of the calibration factors quoted by Hukseflux. Owing to the fact that this adjustment was very small in relation to the overall error it was decided not to make this adjustment. This adjustment is, however, less than the standard deviation of the calibration factors and similar to the size of the standard error.
BRE Client report number 77Commercial in confidence - 28 -

Thermal transmittance of walls of dwellings before and after application of cavity wall insulation
2. Errors in the temperature measurementA number of thermistor temperature sensors were paired together to measure the same environmental temperature. It was found that the readings from the two sensors tended to differ slightly with a typical difference of approximately 0.1 degrees C. This error is expected to apply to both the internal and external temperatures.
Since a typical temperature difference was 10°C the error in accuracy of measured differences in temperature (between inside and outside), Ti - Te, was therefore estimated to be 1%.
3. Temperature variations within the space (allowing for height and distance from HFM)
It would not be possible, within the scope of this project, to obtain a full understanding of how best to measure indoor temperatures accurately, taking full cognisance of temperature stratification and radiation-related effects, each of which lead to small inaccuracies in the measurement of temperatures.
The above test, involving the use of two internal temperature probes, does however indicate that this effect is not large. It is therefore assumed that this error is effectively taken into account in the error in the temperature measurement.
4. Accuracy of the data logging system.ISO 9869 requires that the accuracy of the logging system be considered and, where appropriate, taken into account.
This error is thought to be negligible, in comparison with other measurement errors, owing to the Eltek dataloggers all being of high accuracy and all being less than three years old.
No error or correction to the data was used, therefore, to allow for accuracy of the logging system.
5. Thermal contact between the heat flux meter and the surfaceISO 9869 suggests that the error in contact is typically 5 % due to the problem of making a firm and reliable contact with a wall surface. This error is likely, however, to depend on the nature of the wall surface and is expected to be higher in the case of high relief surfaces such as artex or deeply embossed wallpapers compared with smooth wall surfaces.
Many of the properties had artexing, embossed wallpaper or other deeply patterned high relief wall surfaces. Where possible, these surfaces were avoided, however it was not always possible to avoid them owing to a variety of restrictions on where HFM's could be sited.
In general, undulations in the wall surface can lead to a risk of air pockets being present behind the heat flux meter. If the air pockets are sufficiently large there could be an additional risk of air circulation occurring between the room and the air spaces behind the heat flux meter. The effects of these could be a reduction in the measured heat flow leading to an underestimation of the U-value.
Where artexing or deep wallpaper embossing was present, it was decided to use a thicker substrate in order to fill the air pockets as well as possible. In order to make the comparisons as valid as possible the calculated U-values allowed for the presence of thicker substrate by incorporating an estimation of the thickness of the substrate within the U-value (ISO 6946) calculations.
In order to determine whether artexing or wallpaper embossing could be an issue, the cases of artexing and wallpaper embossing were analysed separately from the cases where the surfaces
BRE Client report number 77Commercial in confidence - 29 -

Thermal transmittance of walls of dwellings before and after application of cavity wall insulation
were smooth. It was found, by carrying out this comparison, that there was no significant correlation between the surface roughness and the measured improvement in insulation performance. It was therefore considered that surface roughness was not a major source of error. It was decided, however, as an additional precaution, to reduce the confidence weightings of the measurements involving high relief surfaces during the analysis process.
Adjustments to the U-value calculations for the presence of thicker layers of substrate, as a means of compensating for the high relief surfaces were carried out for cases 20A, 21A, 27B, 34B, 36B and 59B.
6. Operational error due to the shape of the HFM. (Trisco)Owing to the geometry of the heat flux meter the heat flux is slightly distorted by the presence of the meter, potentially influencing the accuracy of the measurement. The effect of the hfm was modelled using Trisco software, indicating that the bending of the heat flux lines was small at the active area of the HFM. ISO 9869 suggests that once the geometrical error has been applied there is a residual error of approximately 2.5%.
Since each heat flux meter has a thickness of approximately 5 mm and a thermal resistance of approximately 0.0063 m²K/W there will be a slight distortion of the heat flux pattern at the rim of the heat flux meters. Since this thermal resistance is relatively small compared with the typical internal surface resistance of 0.13 m²K/W (assumed in BS EN ISO 6946) and, since the active area of the heat flux meters is at the centre rather than at the rim, the error due to geometrical effects is relatively small. Numerical (thermal) modelling calculations were carried out to model heat traversing a heat flux meter, with the active area and inactive areas shown in Figure H.1. It was found that the direction of heat flow at the boundary of the active area was diverted by and angle of 5°, suggesting a 1.5% error due to the geometry of the HFM. Combining the above 2.5% with the 1.5% gives a combined absolute error of 4%.
Figure H2 A thermal model of a heat flux meter pressure-fixed on plaster
7. Time-dependent variationsDuring the course of the U-value measurements variations in the environmental conditions, particularly temperatures, influenced the measurements.
BRE Client report number 77Commercial in confidence - 30 -

Thermal transmittance of walls of dwellings before and after application of cavity wall insulation
ISO 9869 suggests comparing the U-value derived from the first two-thirds of the data with the U-value derived from the last two-thirds of the data. This technique was considered but was not, in the end used, because of concerns that a U-value could be relatively unstable and yet coincidentally satisfy this single criterion. It was therefore decided instead to calculate U-values from a variety of time periods in order to assess the variations in the U-value and to use this degree of variation to assess the error. The errors of the individual measurements are reported in Table 4.
8. Differences between air and radiant temperaturesAs part of the initial meeting and training day in March 2005, at the outset of the project, the research teams were asked to avoid sources of radiant heat, including radiators, lamps, TV sets and room heaters. Where it was not possible to avoid heating pipes the research teams were asked to lag or insulate the pipes to minimise their interference.
There were, however, a small number of instances where it was not possible to avoid sources of heat, such as, for example, case study 68.
Case study 68 was one of the instances where one HFM was in the vicinity of a source of (long wave) radiant heat. This case involved two heat flux meters, where the lower heat flux meter (68B) was in the vicinity of a radiator and the upper heat flux meter (68A) was well away from the radiator. Despite their positioning the temperatures at the upper HFM were generally higher than those at the lower HFM, suggesting that indoor temperature stratification is a more important factor than nearness to the radiator, suggesting that radiant heat, in this instance, was not a major issue.
Owing to the care taken by the teams in this regard it was decided not to apply an error or correction to cases where the HFM might have been in the vicinity of a heat source.
One issue which was difficult to eliminate was the possibility of sunlight falling on heat flux meters from time to time, and it is possible that this may have happened in some measurements, leading to occasional off-scale readings in the heat flux meters and occasionally very high recorded internal temperatures. In practice this tended not to occur, although there were some borderline cases, such as the readings in cases 11 and 13.
The above errors may be combined either as a summation or they can be combined in quadrature.
9. Measurement of the widths of the cavitiesIn the course of the measurements, the widths of the cavities were measured by passing metal rods through the drill holes until they came into contact with the inner leaf. The inner leaf, however, is unlikely to be exactly uniform and in practice it is difficult to be certain that the metal rod touched the blocks and not the mortar joints between the blocks. There is, therefore, an error in the cavity width. The size of this error could depend, to some extent upon the techniques used to measure cavity width, and to allay this problem cavity width measurement was discussed and rehearsed at the kick off meeting in March 2005. The error in the cavity width is estimated to be approximately 5 mm, and will have a minor impact upon the calculated (ISO 6946) U values against which the measured U-values are compared.
10. Dislodging of the heat flux metersIt is possible, during U-value measurements, that heat flux meters can become dislodged, leading to poor thermal contact with the wall surface.
In case 67 (post-CWI), both of the heat flux meters were dislodged at an early stage and as a result this study had to be eliminated from the analysis.
BRE Client report number 77Commercial in confidence - 31 -

Thermal transmittance of walls of dwellings before and after application of cavity wall insulation
11. Possible mis-identification of blockwork densityIt is possible that firm blocks could have a conductivity ranging from approximately 0.5 W/mK to about 1.5 W/mK, leading to errors in the calculated (ISO 6946) U-values. On the basis of typical wall constructions involving 100 mm inner leaf blocks it is estimated that mis-identification of blockwork densities could affect the U-value by up to 0.35 W/m2K (or 20%), in the case of uninsulated walls or by up to 0.05 W/m2K (or 10%) in the case of insulated walls. Whilst this error will apply to U-value measurements it will not apply to measurements of the improvement in thermal resistance since the properties of the blocks should not change significantly after insulation.
12. Possible mis-identification of plasterSome post-1965 dwellings involve lightweight plaster, such as 'carlite'. This plaster could be up to 25 mm thick in places. Where type of plaster is misidentified this could lead to an error in the calculated (ISO 6946) thermal resistance of up to 0.1 m²K/W. For uninsulated properties this could potentially lead, in extreme cases, to a U-value error of up to 15%. For insulated properties this could potentially lead, in extreme cases, to a U-value error of up to 5%. While this error applies to U-values it does not apply to measured increases in thermal resistance.
13. Appropriate positioning of the heat flux metersFrom the outset of the project it was clear to the teams that the use of 80 mm diameter heat flux meters amounts to spot measurements rather than measurements of a whole wall facade. Because of this, it was important to be certain that the chosen location of the heat flux meters was representative of the wall. In order to do this, thermal imaging cameras were used to determine whether there were any significant variations in the surface temperatures of the wall and it was ensured that the heat flux meters were not located on any cold spots which might be considered to be atypical of the wall as a whole.
14. Analysis of weightings and errors and weighted arithmetic meansIn the analysis of the measured U-values and measured thermal resistance values it was decided to assign confidence weightings. These confidence weightings were designed to reflect the quality of the measurement conditions, taking into consideration factors such as temperature contrasts (between inside and outside), compass orientations, roughness of wall surface and nearness to window jambs or cills. For cases where the measurement conditions were optimal a confidence weighting of 100% was assigned. Otherwise the resulting confidence weighting was less than 100%.
In the analysis the arithmetic means obtained by only including measurements with high confidence weightings were compared with the arithmetic means obtained by including all measurements in order to determine whether the results correlated strongly with confidence.
Normally, when calculating a combined arithmetic mean of two measurements, namely Xm±Sm, and Xn±Sn, each with experimental errors, the combined measurement, Xm,n Sm,n, where
Xm,n = [Sm-2 + Sn
-2]-1 (Xm/Sm2 + Xn/Sn
2)
Sm,n-2 = Sm
-2 + Sn-2
In parts of the analysis of the data in this study, each measurement, Xm, had its error, Sm, enhanced by dividing it by √(Wm), where Wm is the weighting assigned to that measurement. At other times, a series of threshold confidence levels was used (where only measurements with a confidence above the set threshold are included in the analysis) where the weighted mean was repeatedly calculated for different threshold levels in order to determine whether the mean was sensitive to the threshold level chosen.
BRE Client report number 77Commercial in confidence - 32 -

Thermal transmittance of walls of dwellings before and after application of cavity wall insulation
15. Application of errorsThe following list indicates some of the errors which were allowed for in the analysis for assessing the precision of U-value measurements:
A Calibration of each HFM (in relation to other HFMs)
0.6% (from the tests at Glasgow Caledonian University)
B Calibration of the HFM which was tested by NPL 1% (figure quoted by NPL)C Error in temperature sensing (0.1C) 2% (based on comparisons between pairs of
thermistors)D Temperature variations in space 0.5% (estimated)E Thermal contact of HFM with wall 5.0% (conservative estimated based on
ISO9869 guidelines)F Shape of HFM 4.0% (based on thermal modelling calculations)
Cumulative error 10% (if errors combined in quadrature)Cumulative error 13% (if errors combined as a summation)
The estimated error, therefore, is in the range 10% to 13%. In the analysis of the individual U-value measurements, this error was combined with the estimated error due to random fluctuations which had been assessed for the measurements individually.
Note: Whilst most of the errors were combined in quadrature in the usual way, the global systematic error in calibration (which was based upon the NPL test results) and the estimated error in temperature variation were treated more conservatively and were simply added to the the overall error (rather than being added in quadrature).
BRE Client report number 77Commercial in confidence - 33 -

Thermal transmittance of walls of dwellings before and after application of cavity wall insulation
Appendix I Information from national statistics
The prevalence of external tile, timber and other claddings in the cavity walled stock in England.
Data from the 2004 English House Condition Survey has been analysed by the BRE Housing Centre[Ref 26] to examine the prevalence of tile, timber and other claddings in the cavity walled English housing stock.
Definitions:
a) The cavity walled stock is defined as all dwellings with greater than 50% of the wall area being of cavity wall construction.
b) Tile, timber and other claddings are those which are marked as the wall finish being i) Shiplap timber ii) Tile hung iii) Slip/Tile faced oriv) Wood/metal/plastic panels
Results:
The number of dwellings split by the proportion of wall area which is clad shown in Table I.1 below:
Predominant wall type
Proportion of wall area covered in tile, timber or other cladding(Thousands of dwellings)
None <10% 10-25% 25-50% 50-75% 75-100%Total
Cavity with insulation 4,780 520 310 180 40 0 5,830Cavity uninsulated 7,210 890 560 440 100 20 9,220Other 5,690 340 170 140 100 140 6,570Total 17,670 1,750 1,030 750 240 170 21,610
Table I.1: The extent of tile, timber and other cladding in the cavity walled stock in England.All figures rounded to nearest 10,000 dwellings and expressed in 1000s of dwellings (hence some totals do not sum exactly).
Table I.2 below shows the average proportion of wall area which is covered by claddings of this type. (Note that the proportions are of total wall area of dwellings with predominantly each type of wall construction, some of these dwellings will be of mixed wall type).
Predominant wall type
Average proportion of external wall area (of all types) covered in tile, timber or other cladding (All dwellings of this wall type)
Cavity with insulation 3%Cavity uninsulated 5%Other 5%Average all wall types 4%
Table I.2: The extent of tile, timber and other cladding in the cavity walled stock in England.All figures rounded to nearest percentage.
Bay windows
BRE Client report number 77Commercial in confidence - 34 -

Thermal transmittance of walls of dwellings before and after application of cavity wall insulation
Below bay windows there is an increased risk of the wall not being insulated. It was therefore sought to de-termine what proportion of wall area lies below bay windows in order to obtain an indication of the potential impact of missing insulation below bay windows on energy savings.
It is possible to gain a picture of the national numbers of bay windows from the English House Condition Survey data, although obtaining a definitive estimate of the area of wall is much more difficult. BRE have therefore counted the number of bay windows.[Ref 26]
In counting the bay windows, if the bay was just on one storey (normally the ground) it was counted as one bay window. If it was across two storeys it was counted as two bay windows, and if across three then three etc. (i.e. a multi-storey bay window was counted as the number of storeys it covered).
Using the above definition there were approximately 10.1 million bay windows in England, found in around 6.7 million dwellings in England (i.e. in nearly one third of the total of 21 million dwellings).
Of these dwellings approximately 45% (3.0 million) have solid walls, 18% (1.2 million) have insulated cavity walls and 37% (2.4 million) have uninsulated cavity walls.
There are 4.6 million bay windows in the solid walled stock (45% of all bay windows), 1.7 million bay win-dows in dwellings with insulated cavity walls (16% of all bays) and 3.9 million bay windows in dwellings with uninsulated cavity walls (38% of all bays)[Ref 26]
Therefore there are 3.9 million bay windows among the 2.4 million dwellings that have bay windows and un-insulated cavity walls, amounting to an average of 1.6 bay windows per dwelling. Overall, approximately 32% of all dwellings have bay windows. This is therefore equivalent to an average of 0.52 bay windows per uninsulated dwelling. If we assume that the wall area under a bay window is typically around 2 square metres, this would amount to about 1.0 square metres of wall area per dwelling that is below a bay window.
BRE Client report number 77Commercial in confidence - 35 -