Thermal Performance of Phase Change Wallboard for .../67531/metadc677467/m2/1/high... · Change...
29
LBL-38320 UC- 1600 ERNEST ORLANDO LAWRENCE B ERKELEY NATIONAL LABORATORY Thermal Performance of Phase Change Wallboard for Residential Cooling Application Helmut E. Feustel and Corina Stetiu Environmental Energy Technologies Division April 1997
-
Upload
phungduong -
Category
Documents
-
view
218 -
download
0
Transcript of Thermal Performance of Phase Change Wallboard for .../67531/metadc677467/m2/1/high... · Change...

LBL-38320 UC- 1600
ERNEST ORLANDO LAWRENCE B ERKELEY NATIONAL LABORATORY
Thermal Performance of Phase Change Wallboard for Residential Cooling Application
Helmut E. Feustel and Corina Stetiu Environmental Energy Technologies Division
April 1997
DISCLAIMER
This document was prepared as an account of work sponsored by the United States Government. While this document is believed to contain correct information, neither the United States Government nor any agency thereof, nor The Regents of the University of California, nor any of their employees, makes any warranty, express or implied, or assumes any legal responsibility for the accuracy, completeness, or usefulness of any information, apparatus, product, or process disclosed, or represents that its use would not infringe privately owned rights. Reference herein to any specific commercial product, process, o r service by its trade name, trademark, manufacturer, or otherwise, does not necessarily constitute or imply its endorsement, recommendation, or favoring by the United States Government or any agency thereof, or The Regents of the University of California. The views and opinions of authors expressed herein do not necessarily state or reflect those of the United States Government or any agency thereof, or The Regents of the University of California.
This report has been reproduced directly from the best availabIe copy.
Available to DOE and DOE Contractors from the Office of Scientific and Technical Information
P.O. Box 62, Oak Ridge, TN 37831 Prices available from (615) 576-8401
Available to the public from the National Technical Information Service
U.S. Department of Commerce 5285 Port Royal Road, Springfield, VA 22161
Ernest Orlando Lawrence Berkeley National Laboratory is an equal opportunity employer.

LBL-38320 UC- 1600
Thermal Performance of Phase Change Wallboard for Residential Cooling Application
Helmut E. Feustel and Corina Stetiu Indoor Environment Program
Environmental Energy Technologies Division Lawrence Berkeley National Laboratory
University of California Berkeley, CA 94720, USA
April 1997
kk MSTRlBUTlON Of THIS DOCUMENT tS WNLIM-
This work was supported by the Assistant Secretary for Energy Efficiency and Renewable Energy, Office of Building Technologies of the U.S. Department of Energy under contract No. DE-AC03-76SF00098.

Portions of this document may be illegiile in eiectFonic image products. Images are produced from the best avaiiable original document.

DISCLAIMER
This report was prepared as an account of work sponsored by an agency of the United States Government. Neither the United States Government nor any agency thereof, nor any of their employees, make any warranty, express or implied, or assumes any legal liabili- ty or responsibility for the accuracy, completeness, or usefulness of any information, appa- ratus, product, or process disclosed, or represents that its use would not infringe privately owned rights. Reference herein to any specific commercial product, process, or service by trade name, trademark, manufacturer, or otherwise does not necessarily constitute or imply its endorsement, recommendation, or favoring by the United States Government or any agency thereof. The views and opinions of authors expressed herein do not necessar- ily state or reflect those of the United States Government or any agency thereof.

-1 -
Thermal Performance of Phase Change Wallboard for Residential Cooling Application
Helmut E. Feustel and Corina Stetiu Indoor Environment Program
Energy and Environment Division Lawrence Berkeley National Laboratory
University of California Berkeley, CA 94720, USA
ABSTRACT Cooling of residential California buildings contributes significantly to electrical consumption and peak power demand mainly due to very poor load factors in milder climates. Thermal mass can be utilized to reduce the peak-power demand, downsize the cooling systems, and/or switch to low-energy cooling sources. Large thermal storage devices have been used in the past to overcome the shortcomings of alternative cooling sources, or to avoid high demand charges. The manufacturing of phase change material (PCM) implemented in gypsum board, plaster or other wall-covering material, would permit the thermal storage to become part of the building structure. PCMs have two important advantages as storage media: they can offer an order-of-magnitude increase in thermal storage capacity, and their discharge is almost isothermal. This allows the storage of high amounts of energy without significantly changing the temperature of the room envelope. As heat storage takes place inside the building, where the loads occur, rather than externally, additional transport energy is not required. RADCOOL, a thermal building simulation program based on the finite difference approach, was used to numerically evaluate the latent storage performance of treated wallboard. RADCOOL was developed in the SPARK environment in order to achieve compatibility with the new family of simulation tools under development at the Lawrence Berkeley National Laboratory. Extended storage capacity obtained by using double PCM-wallboard is able to keep the room temperatures close to the upper comfort limits without using mechanical coolingSmulation results for a living room with high internal loads and weather data for Sunnyvale, California, show significant reduction of room air temperature when heat can be stored in PCM-treated wallboards.
-2-
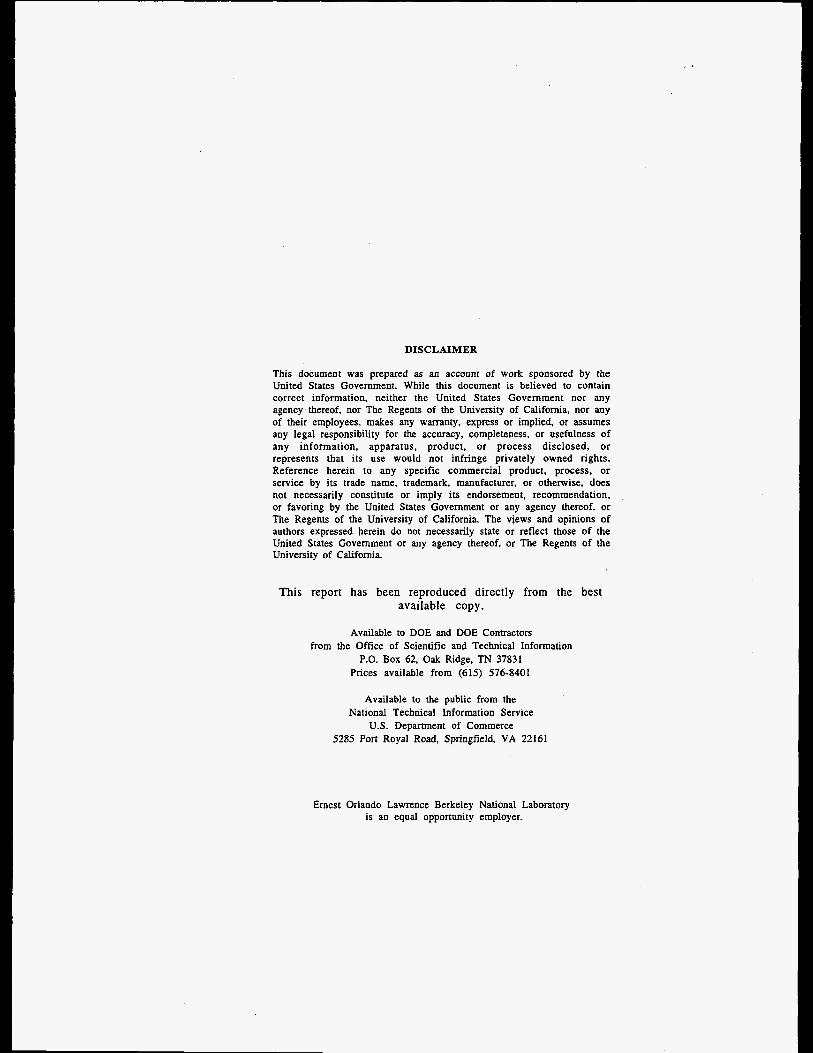
TABLE OF CONTENTS ABSTRACT ................................................................................................................................................... 1 TABLE OF CONTENTS .............................................................................................................................. 2 NOMENCLATURE ...................................................................................................................................... 2 BACKGROUND ............................................................................................................................................ 3 THERMAL PERFORMANCE .................................................................................................................... 4 PHYSICALPROPERTIES OF TREATED WALLBOARD ........................................................................................... 4 NUMERICAL DESCRIPTION OFPHASE CHANGE MATERI AL ................................................................................ 5 NUMERICAL STUDY .................................................................................................................................. 7 BUILDING DESCRIPTION .................................................................................................................................... 7 WEATHER DATA ............................................................................................................................................... 8 VENTILATNE COOLING .................................................................................................................................... 9
COMPARISON OF THERMAL STORAGE POTENTIAL .......................................................................................... 20 CONCLUSIONS .......................................................................................................................................... 21 FUTURE WORK ......................................................................................................................................... 21 ACKNOWLEDGMENTS ........................................................................................................................... 21 LITERATURE- ............................................................................................................................................. 22 APPENDIX ................................................................................................................................................... 23 BOUNDARY CONDITIONS FOR NUMERICAL STUDY: ........................................................................................ 23
Building Description: ............................................................................................................................... 23
VENTILATIVE COOLING AND DOUBLE WALLBOARD ....................................................................................... 15
NOMENCLATURE p inclination [-I p density [kg/m3] z cP specific heat [kJ/kg-K] h specific enthalpy [kJ/kg] h heat coefficient [W/m2-K] k thermal conductivity [W/m-K] T temperature ['C]
width of the melting zone [K]
Indices 1 solid phase 2 liquid phase r radiative C convective m melting 0 operative

-3-
BACKGROUND Cooling of residential California buildings contributes significantly to electrical consumption and peak demand mainly due to very poor load factors in milder climates. The peak cooling load requires utilities to build, operate and maintain peak-power plants, and size their distribution network accordingly. For the building owner, the peak-cooling load determines the size of the equipment and the choice of the cooling source. Several steps can be taken to downsize the cooling systems and to allow switching to low-energy cooling sources:
incorporate facades which provide an effective shelter from ambient conditions install highly efficient thermal distribution systems (e.g., hydronic systems) apply thermal conditioning by radiation rather than by convection
0 provide thermal mass. Large thermal storage devices have been used in the past to overcome the shortcomings of alternative cooling sources, or to avoid high demand charges. Buildings designed to make use of thermal storage include features which increase thermal mass. These may be used for storage only, or may serve both as storage and as structural elements. Several structural materials satisfy the requirements for sensible heat storage; these include concrete, steel, adobe, stone and bricks. Latent heat storage uses a phase change material as a storage medium. This concept is particularly interesting for lightweight building construction. While undergoing phase change - freezing, melting, condensing, or boiling - a material absorbs or releases large amounts of heat with small changes in temperature. Phase change applications typically involve liquid/solid transitions. The Phase Change Material (PCM) is solidified when cooling resources are available, and melted when cooling is needed. PCMs have two important advantages as storage media: they can offer an order-of-magnitude increase in heat capacity, and for pure substances, their discharge is almost isothermal (Feustel et. ai., 1992). So far, only samples of PCM-treated wallboard exist. There are several approaches to treat wallboard with PCM material; however, none of these approaches has been tried in the industrial production process. The manufacturing of phase change material (PCM) imbedded in gypsum board, plaster or other wall-covering material would allow the thermal storage to become part of the building's structure. This would permit the storage of high amounts of energy without changing the temperature of the room envelope. Since storage would take place inside the building where the loads occur, rather than outside, additional transport energy would not be required. Considering that more than 7 billion square meters of plaster board are being produced annually in the US, PCM-treated wallboard could have a significant impact on the utility peak (E-Source, 1993). At the same time, it could help to moderate temperature

-4-
swings and improve thermal comfort in homes. Phase change materials can only store energy, but not remove it. In passive applications of structural thermal storage, the heat is being released into the room as soon as the room air temperature falls below the phase change temperature. This heat release mechanism keeps the surface temperatures of the room envelope at a high temperature level for a long time. This has certain advantages for the heat transfer mechanism during the discharge of the thermal storage. Besides the passive application, treated wallboard could be coupled with a hydronic loop. Combining continuous discharge and phase change material allows the discharge of thermal energy storage without releasing the energy back into the conditioned space.
THERMAL PERFORMANCE Physical Properties of Treated Wallboard Table I shows the physical properties for wallboard with a homogenous distribution of PCM material as measured by Oak Ridge National Laboratory (Tomlinson and Heberle, 1990). Unfortunately, the same data is not available for wallboard treated with PCM encapsulated in pellets.
I I 58.3 [30% PCM 998 1.467 0.232 I As all organic PCM will continue to burn in normal atmospheric conditions after igniting, potentially severe fire-hazards related to PCM-treated wallboard exist. Two tested methods have shown promising results in eliminating the fire hazard for treated wallboards: limiting the amount of PCM to 20%, and sequentially treating the plasterboard with PCM, and with an insoluble fire retardant (Salyer and Sircar, 1990) .*
~~ ~~
' The physical properties shown represent wallboard treated with PCM by means of post- manufacturing imbibing of liquid PCM into the pore space of the plasterboard. (Salyer and Sircar, 1993).
However, no determination has been attempted with regards of fire codes and to the ability of phase change wallboard to be certified in relation to them.

-5-
Only ultra-pure paraffins melt and freeze sharply at a given temperature (Salyer and Sircar, 1990). Mixtures of PCM show a region of temperatures where melting takes place (Egolf and Manz, 1994). Results from experimental studies and simulation exercises showed clearly that the treated wallboard does not act like an ideal storage material, which would melt and freeze at a specific temperature. Comparison between measured data and simulation results for the dynamic behavior of a stack of wall boards showed that the best agreement was obtained if the specific heat as a function of temperature was modeled by the typical triangular-shaped curve.
Numerical Description of Phase Change Material As the specific heat is taken as the temperature derivative of the specific enthalpy h, the specific heat as a function of temperature shows a discontinuity at the melting temperature T, . The specific heat can be described by:
dh dT
C, ( T ) = -
and the enthalpy by:
T
h = Ic,(T)dT 0
At the melting point T,, the specific heat shows very high positive values. The thermal diffusivity a ( T ) is constant at high and low temperature levels, where we find the linear temperature regimes. While crystalline substances and eutectics show a discontinuous transition, many materials (e.g., mixtures) show continuous enthalpy curves as a function of temperature. This leads to a “mushy region” between the solid and the liquid phase. In the mushy region, the thermal diffusivity decreases, with different derivatives on both sides of the melting point. Egolf and Manz (1993) formulated the following description for the specific ent ha1 py :
with
T l T ,

-6-
The dynamic thermal building simulation model RADCOOL (Stetiu et al, 1995) used for the analysis imposes certain restrictions regarding the use of logical statements. It was therefore necessary to find not only a continuous equation for the enthalpy, but also a function which describes the enthalpy as a function of the temperature for the whole temperature range found in buildings.
Figure 1 : Discontinuous (A) and Continuous (B) Functions for Specific Enthalpy [Egolf and Manz]
For materials which show a symmetrical distribution of the specific heat for the melting region
2 - _ - 2 , =z, 2
the hyperbolic tangent shows some similarity with the mushy region of the enthalpy curve. Feustel (1 995) describes the simplifications which allow to describe the enthalpy and specific heat capacity as a hyperbolic function and its

-7-
derivative. The enthalpy can be described as:
and, as the specific heat capacity is the first derivative of the specific enthalpy, we obtain:
The functional description of the specific heat based on experimental data (see Table 1) was implemented into some of the wall modules available for RADCOOL, which is a thermal building simulation program based on the finite difference approach. RADCOOL was developed in the SPARK environment (Buhl et al, 1990). in order to achieve compatibility with the new family of simulation tools under development at the Lawrence Berkeley National Laboratory. Tests were performed to determine the critical time-step as a function of the temperature change and the latent storage characteristics.
NUMERICAL STUDY Building Description The thermal building simulation model used in this study is the single-zone model RADCOOL (Stetiu et. al, 1995). The model is based on the finite difference approach; each wall is divided in several layers, which allows the modeling of multi-layer walls. The zone being modeled is a living room with 35m2 floor area and two exterior walls. The longer of the exterior walls (7 m) is facing West; the shorter (5 m) is facing south. The window area (shading factor 55%) is 20% of the exterior wall area. The opaque part of the walls has a U-value of 0.266 W/m'K (R-21), while the double-pane windows have a U-value of 0.95 W/m2-K (R-6). The ceiling insulation level amounts to a U-value of 0.17 W/m2-K (R-32). The attic is vented and well shielded by means of a radiant barrier. The floor is made of a 0.1 m concrete slab above 1.0 m of sand. The temperature below the sand is assumed to be constant at 20 "C. All the walls and the ceiling are covered with PCM-treated wallboard (0.015 m) containing 20% paraffin with a melting temperature of 25 "C and a melting range of z = 4K. The interior walls are stud walls covered with treated gypsum board on both sides. To simplify the boundary conditions, we assumed that no heat is

-8-
being transferred to the adjacent rooms. The interior walls are therefore treated as adiabatic in the center of the wall. The living-room is occupied by four persons from 6:OO in the morning until 22:OO hours at night. During the time of occupancy there is a constant additional load of 150 W (television) and also 100 W of electric lights for the last two hours of the occupied period. For more details on the simulation boundary conditions, please refer to the Appendix. The thermal storage is being discharged by means of ventilation.
Weather Data The climatic conditions chosen represent Sunnyvale, California (see California Energy Commission, 1991, climate zone ctzO4c). Sunnyvale is located at the southern tip of the San Francisco Bay. This and other parts of the Bay Area represent one of the California transition climates, where cooling of residential buildings is only necessary for a few days during the year. Figure 2 shows the ambient temperature profile for the period of June 11 through 17. While the first three days of the period chosen are relatively mild, on day 4, outdoor temperatures reach almost 40 "C.
40
30 --
t 0 24 48 72 96
Time [h] 120 144 168
Figure 2: Ambient Air Temperature Profile for the Period June 1 1 through 17

-9-
Even though the ambient temperature profile shows a peak on the fourth day of the chosen period, the solar radiation obtained from the weather data is very stable for the 7-day period. Figure 3 shows the calculated solar energy received by the West wall.
The peak solar radiation on the West wall reaches 750 to 800 W/m' on each of the days during the considered period.
N" 800
700 E .2 600 (0
500 a: o 400 = $ 300 CL
Q
E
c, .-
.-
2 200
r-0 100 .c,
0
I
0 24 48 72 96 120 144 168
Time [h]
Figure 3: Calculated Solar Energy received by the West Wall
Ventilative Cooling In this example, the supply air is not being cooled. Ten air changes per hour (ACH) of outside air provide ventilative cooling if the ambient air is below 25 "C. Above 25 "C, the ventilation rate is being reduced to 1.5 ACH. In case the outside air temperature is below 19 "C, outside air is mixed with recirculation air in order to keep the supply air temperature at the 19 "C level. Figure 4 shows the development of the indoor air temperature for the chosen period. On days four through six, air temperatures reach well above 30 "C, if the room is equipped with conventional wallboard. With PCM-treated wallboard, the fourth day shows a significant decrease of the peak temperature from 31 to 28"C, while the temperature reduction for the following two days is much smaller. The shape of the temperature curves for PCM-treated wallboard signal the saturation of the latent storage capacity.

-1 0-
0 24 48 72 96 120 144 168
Time [h]
Figure 4: Indoor Air Temperature Profile with Ventilative Cooling
The temperature differences between the wall temperatures and the air temperature for conventional wallboard are shown in Figure 5. The differences range from -1 K to 4 K for the West wall and -0.7 K to 3 K for the interior walls. With the reduced cooling capability of the air, surface temperatures lower than the air temperature are experienced at peak temperatures. Highest temperature differences are observed when the ventilative cooling starts in the late afternoon. As long as there is latent storage capacity available, the surface temperatures of the PCM-treated wallboard are closer to the air temperature at peak than the surface temperatures of conventional wallboard. It should be mentioned that the temperature differences for the surfaces of the interior and exterior walls are much smaller for PCM-treated wallboard than those of conventional wallboard (compare Figure 5 and Figure 6). This suggests that some of the energy transmitted through the exterior wall is being stored in the wall before reaching the interior surface.

-1 1-
3
2
1
0
-1
-2
I l- West Wall Surface - Air I -- Interior Wall Surface - Air - - - - - .
T - 3 4 : : : : : : : : : : : : : : : : : : : : : : : : : : : 0 24 48 72 96 120 144 168
Time [h]
Figure 5: Temperature Difference between the Wall Surfaces and the Air for Conventional Wallboard
- West Wall Surface - Air Interior Wall Surface - Air -- - - - - - -
--
I
Figure 6: Temperature Difference between the Wall Surfaces and the Air for PCM- Treated Wallboard
-1 2-
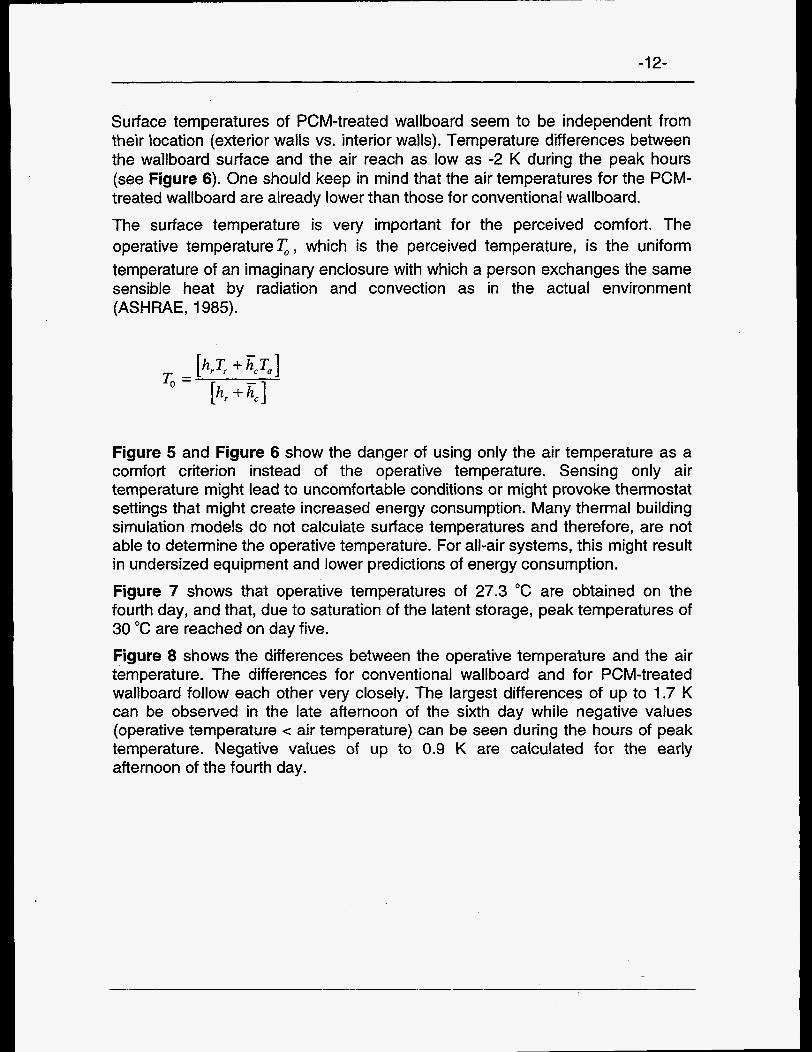
Surface temperatures of PCM-treated wallboard seem to be independent from their location (exterior walls vs. interior wails). Temperature differences between the wallboard surface and the air reach as low as -2 K during the peak hours (see Figure 6). One should keep in mind that the air temperatures for the PCM- treated wallboard are already lower than those for conventional wallboard. The surface temperature is very important for the perceived comfort. The operative temperature T, , which is the perceived temperature, is the uniform temperature of an imaginary enclosure with which a person exchanges the same sensible heat by radiation and convection as in the actual environment (ASHRAE, 1985).
Figure 5 and Figure 6 show the danger of using only the air temperature as a comfort criterion instead of the operative temperature. Sensing only air temperature might lead to uncomfortable conditions or might provoke thermostat settings that might create increased energy consumption. Many thermal building simulation models do not calculate surface temperatures and therefore, are not able to determine the operative temperature. For all-air systems, this might result in undersized equipment and lower predictions of energy consumption. Figure 7 shows that operative temperatures of 27.3 "C are obtained on the fourth day, and that, due to saturation of the latent storage, peak temperatures of 30 "C are reached on day five. Figure 8 shows the differences between the operative temperature and the air temperature. The differences for conventional wallboard and for PCM-treated wallboard follow each other very closely. The largest differences of up to 1.7 K can be observed in the late afternoon of the sixth day while negative values (operative temperature c air temperature) can be seen during the hours of peak temperature. Negative values of up to 0.9 K are calculated for the early afternoon of the fourth day.

-1 3-
35 Conventional Wallboard I -
30
25
20
15 1 1 1 1 1 l 1 1 1 1 1 l 1 1 1 1 1 l 1 1 1 1 1 1 1 1 1 l 1 1 1 1 1 1 1 1 1 1 l 1 1 1 1 1 l 1 1 1 1 1 1 1 1 1
0 24 48 72 96 120 144 168
Time [h]
Figure 7: Operative Temperature Profile with Ventilative Cooling
7
ij 2
Conventional Wallboard - I -PCM-treated --.-.. Wallboard -
~
-1
-2
--
--
-3 1 1 1 l 1 1 1 1 1 1 1 1 1 1 1 1 1 1 1 1 1 1 1 1 1 1 1 1 1 1 1 I I I I I I I 1 1 1 I 1 l 1 1 1 1 1 1 I I I I
0 24 48 72 96
Time [h] 120 144 168
Figure 8: Temperature Differences between Operative Temperature and Air Temperature with Ventilative Cooling

-1 4-
Figure 9 shows the variation of the specific enthalpy with time. When comparing the values for conventional wallboard with those for the PCM-treated wallboard, one has to keep in mind that the absolute values of the specific enthalpy are not important. The ability to store heat at an increase of temperature, as expressed by the specific heat capacity, is more important than the value of the enthalpy itself. The higher specific sensible heat capacity for PCM-treated wallboard is due to the paraffin content. The specific enthalpy reaches 80 kJ/kg-K on days five and six, which shows that the end of the mushy region is reached. The graph clearly shows that the latent storage capacity is being exhausted during the three days of the hot spell. After the fourth day, PCM-treated wallboard already contains a specific enthalpy of 60 kJ/kg, and even at the end of the seventh day, the latent storage is not being fully discharged. The reason for the high enthalpy values is the high night-time indoor air temperatures. During the night between the fourth to the fifth day, night-time air temperatures do not fall below 23 "C, and in the following night, temperatures are still above 22 "C. These air temperatures, and the short periods they occur, do not allow sufficient discharge of the PCM.
\ . ' ' \ I . * \
' * ..
Conventional Wallboard . ( I
. I
. # . e --
.I ' I .
--
Figure 9: Specific Enthalpy Variation for the Wallboard of the West Wall with Ventilative Cooling
Figure 10 shows the specific heat capacity for the ventilative cooling case. Two times, in the late afternoons of the fifth and the sixth day, the specific heat

-1 5-
7
Conventional Wallboard PCM-treated Wallboard
- -- - - - - - -
capacity reaches its minimum. During the last 18 hours of the investigated period, the heat capacity stays close to the maximum, indicating wallboard temperatures of about 25 "C.
. I
1 1 1 1 1 1 1 1 1 1 1 1 1 1 1 1 1 1 1 1 1 1 1 1 1 1 1 1 (
0 24 48 72 96 120 1 44 168
Time [h] Figure IO: Specific Heat Capacity Variation for the Wallboard of the West Wall
with Ventilative Cooling
Ventilative Cooling and Double Wallboard In order to increase the thermal storage capacity of the structure, double thickness wallboard can be installed. Figure 11 shows the indoor air temperature profiles for ventilative cooling, if double wallboard is installed. The temperature peaks for the case with conventional wallboard are only slightly lower than those shown in Figure 4. PCM-treated wallboard, however, performs much better. In this case we see significant reduction of the indoor air temperature for all three days of the heat wave. Temperature differences between the surface temperature and the air temperature show slightly higher negative values for both conventional and PCM-treated wallboard (see Figures 12 and 13). For the PCM-treated wallboard, negative temperature differences of more than 2 K are calculated for the early afternoon of the fourth day. The two following days see temperature differences of up to -1.5 K and -1.2 K. When the ambient air temperature drops below 25 "C and ventilative cooling is provided, temperature differences of more than 3 K are calculated.

-1 6-
z Y
Double Conventional Wallboard 1 -Double - - - - - - PCM-treated Wallboard
0 24 48 72 96 120 144
Time [h]
Figure 11 : Indoor Air Temperature Profile with Ventilative Cooling
168
4
3
2
1
0
-1
-2
West Wall Surface - Air interior Wall Surface - Air
- -- - - - - - .
0 24 .48 72 96
Time [h] 120 144 168
Figure 12: Temperature Difference between the Wall Surfaces and the Air for Conventional Wallboard

-1 7-
-- Double Conventional Wallboard _ _ _ _ _ _ Double PCM-treated Wall board Summer Comfort Limit
- 1 1 1 1 1 1 1 1 1 1 1 1 1 1 1 1 1 1 1 1 l l l l l 1 1 l l l l l l l i l l l l l l l l 1 l l l l ~ l l 1 1 l
4 West Wall Surface - Air 1 -
z3 Y
0 24 48 72 96 120 144 168
Time [h]
Figure 13: Temperature Difference between the Wall Surfaces and the Air for PCM- Treated Wallboard
35
0" O-
2 30 E S
Q)
4-
25
Q1 > .- 4-
E 20 Q)
0" 15
Figure 14: Operative Temperature Profile with Ventilative Cooling

-1 8-
The operative temperature profile for PCM-treated wallboard with double thickness (Figure 14) shows a significantly better performance than that for single sheets (shown in Figure 7). Particularly for the fifth and sixth day, significant temperature reductions are being reached when compared to double conventional wallboard. On the sixth day, the highest operative temperature for PCM-treated double wallboard is reached at 28.2 "C, while the peak temperature for double conventional wallboard occurs at 31.5 "C on day five. Again, the performance for the PCM-treated wallboard could be enhanced if the possibility to discharge the latent storage was available. Differences between the operative temperature and the indoor air temperature are shown in Figure 15. For the first two days, differences remain in the range between 0 K and 1K; the third day brings temperature differences of up to -0.5 K. With increased indoor air temperature amplitudes, the amplitude of the differences also increases. At peak, the operative temperatures are lower. When ambient air temperatures drop below 25 "C and ventilative cooling starts, the differences show positive values.
Double Conventional Wallboard Double PCM-treated Wallboard
U
0 24 48 72 96 120 144 168
Time [h]
Figure 15: Temperature Differences between Operative Temperature and Air Temperature wifh Ventilative Cooling
When compared with the data shown in Figure 9, the specific enthalpy for the double-thick PCM-treated wallboard shows reduced values (see Figure 16). Peak values are reached with 73 kJ/kg on day five and 75 kJ/kg on day six. On the morning of day six, ventilative cooling is not able to reduce the specific

-1 9-
--
70
60
50
40
30
20
10
.\ .- * -- . * ' . . * . *
. I
.J
. - .-, -- \ . , e - *.
I '
8 . - - e . * - \ a
* . . . . , a . *
. a -- r \ , . , I
--
0 24 48 72 96 120 144 168
Time [h]
Figure 16: Specific Enthalpy Variation for the Wallboard of the West Wall with Ventila five Cooling
-- Double Conventional Wallboard
- - - - - . Double PCM-treated Wallboard
-
-. ,-- ,' ' - e '\
.. ' -
t
. * * . , . , . , . Double Conventional Wallboard Double PCM-treated Wallboard
. ' - . . . ' . ' 4
2
0 1 : : : : : : : ~ : ~ ~ ~ : ~ ~ ~ : : ~ : : ~ : : : : :
--
_ _ - - - _ - I . - * . I -- '--'
0 24 48 72 96
Time [h] 120 144 168
Figure 17: Specific Heat Capacity Profile for the Wallboard of the West Wall with Ventila five Cooling

-20-
enthalpy below 57 kJ/kg, and thus cannot force the wallboard temperature below the melting temperature of the paraffin. The specific heat capacity, shown in Figure 17, reaches the peak on day four, when the specific enthalpy reaches its peak. Decreasing temperatures lead to decreasing enthalpy and specific heat capacity. The fifth day with his increase of specific enthalpy up to 73 kJ/kg sees decreasing values for the specific heat capacity. Approximately 5 kJ/kg-K correspond to the enthalpy peak. The sixth day starts with a slightly recovered specific heat capacity of 10.5 kJ/kg-K but almost reaches its minimum during the peak temperature on late afternoon.
Comparison of Thermal Storage Potential When compared with single-conventional wallboard, doubling the thickness of the wallboard only provides minimal reduction of the peak operative temperatures. Maximum reduction values are below 1 K. The use of PCM- treated wallboard provides a good temperature reduction for the first day of the heat spell, but saturation of the latent storage diminishes the reduction potential. Doubling PCM-treated wallboard shows a significant improvement for the temperature reduction potential. After two days of reducing the operative temperature by more than 4 K, the third day of the heat wave still sees a temperature reduction of 3.3 K.
- Double Conventional Wallboard - - - - - . Single PCM-treated Wallboard
2
I .
z 1 - - Y
J
- 5 1 i : : i i t i : f I : : : : : : : i i : I : t i : i i 0 24 48 72 96 120 144 168
Time [h]
Figure 18: Ventilative Cooling; Temperature Reduction of Operative Temperature for Double Conventional and Single- and Double PCM-treated
Wallboard when compared with Single-Conventional Wallboard

-21 -
CONCLUSIONS PCM4reated wallboard has the potential to convert light buildings, as often found in earthquake-prone areas, into thermally heavy constructions. In Californian climates with large diurnal swings, thermally heavy residences can be kept thermally comfortable by using night-time ventilation to discharge the latent storage of the wallboard. Therefore, mechanical cooling or evaporative cooling could be eliminated by applying PCM-treated wallboard. The high surface-to-volume ratio of the wallboard helps to utilize the storage capacity over a short cycle (24 hours). Compared to strictly sensible thermal storage, the storage density of PCM-treated wallboard is much higher, which allows to provide the necessary storage in a relatively thin layer. Longer cycles between charge and discharge can be mastered with higher thermal storage capacity. The additional storage capacity can be provided by multiple layers or thicker layers of treated wallboard. Cooling the envelope of a room by means of air transport through the room provides a very inefficient way of heat transfer. Air movement close to the walls, which determines the amount of heat being transferred, is relatively small. Particularly in periods of relatively high ambient temperatures during the night, it would be beneficial to force the supply air along the wall surfaces to facilitate good heat exchange.
FUTURE WORK In order to determine the amount of thermal latent storage that would keep the operative temperature within the comfort zone for different California climates, a parametric study, taking internal loads and weather parameters into account, will be performed. The limited discharge capacity of ventilative cooling during heat spells calls either for increased storage capacity or can cause the thermal storage to fail. New ways to discharge the latent storage have to be investigated. Coupling latent thermal storage with the ground by means of a hydronic loop is on the research agenda.
ACKNOWLEDGMENTS The suggestions of the reviewers are gratefully acknowledged. This work was supported by the Assistant Secretary for Conservation and Renewable Energy, Office of Building Technologies of the US Department of Energy under Contract No. DE-AC03-76SF00098 in cooperation with the Alternatives to the Compressor Cooling Project sponsored by the California Institute for Energy Efficiency.

-22-
LITERATURE: Buhl, W.F., E. Erdem, J.-M. Nataf, F. Winkelmann, M.A. Moshier, and E.F. Sowell; “Advances in SPARK,” Lawrence Berkeley Laboratory Report LBL- 29419, Rev. 1, 1994, and Proc. Third International Conference on System Simulation in Buildings, Liege, Dec. 3-5, 1990 California Energy Commission, “Climate Zone Weather Data Analysis and Revision Project”, Consultant Report prepared for the California Energy Commission by Augustyn & Co, 1991 Egolf, P.W. and H. Manz; “Theory of Phase Change Materials with and without Mushy Regions,” International Journal of Heat and Mass Transfer, 1993 E-Source; “Phase Change Wallboard for Peak Demand Reduction,” Tech Memo, TM-94-4, E-Source Inc., Boulder, CO, 1993 Feustel, H. E., A. de Almeida, C. Blumstein; “Alternatives to Compressor Cooling in Residences,” Energy and Buildings, 18, 1992 Feustel, H. E; “Simplified Numerical Description of Latent Storage Characteristics for Phase Change Wallboard, Lawrence Berkeley Laboratory Report LBL- 36933,1995 Salyer, 1.0. and A.K. Sircar; “Phase Change Materials for Heating and Cooling of Residential Buildings and other Applications,” Proceedings of the 25th Annual lntersociety Energy Conservation Engineering Conference, 1990 Salyer, 1.0. and A.K. Sircar; “Development of Phase Change Technology for Heating and Cooling of Residential Buildings and other Applications,’’ Proceedings of the 28th Annual lntersociety Energy Conservation Engineering Conference, 1993 Stetiu, C., H. E. Feustel, and F. Winkelmann, “Development of a Simulation Tool to Evaluate the Performance of Radiant Cooling Ceilings”, Lawrence Berkeley Laboratory Report, LBL-37300. 1995 Tomlin and Heberle; ”Analysis of Wallboard Containing a Phase Change Material”, Proceedings of the 25th Annual lntersociety Energy Conservation Engineering Conference, 1990

-23-
Window area Shading factor for windows U-value for opaque part U-value for windows
Appendix Boundary Conditions for Numerical Study:
Building Description:
20% 55% 0.266 W/m2K 0.95 W/m2K
Floor Area
Length Window area Shadina factor for windows
I35 m2
5 m 20% 55%
~ ~~~~~ ~~
Exterior Walls: West wall
U-value for opaque part U-value for windows
Interior walls:
I Lenath 17m
0.266 W/m2K 0.95 W/m'K
Construction:
Cei 1 i ng : U-value
I Souih wall
stud-frame wall with wallboard on both sides, adiabatic plane in the middle of the wall
0.1 7 W/m*/k Attic
Floor: Slab
Subslab
Vented, shielded by radiant barrier
Concrete, 0.1 m Sand, 1 m, temperature level below sand is kept constant at 20 "C

~~
-24-
Wallboard: Conventional wallboard Thickness 0.015 m Phvsical DroDerties see Table 1
I PCM-treated wallboard I I Thickness 0.015 m Physical properties Modeling data Melting temperature 25 “C Meltina ranae 5 K
see Table 1 for 20% PCM
Inclination 0 1.4
Thermal loads Occupants Number of occmants . 4 Persons
all loads 50% convective, 50% radiative
Schedule
Liahts
6 o’clock through 22 o’clock Heat output per person 1oow
- Heat output of lights 1oow 20 o’clock through 22 o’clock Schedule
Amliances n/ 150 W Schedule 6 o’clock through 22 o’clock