
Hot Disk Transient Plane Source Technique - Thermal Conductivity

Thermal Modeling of Multiple-Line-Heat-Source Guarded Hot Plate Apparatus
By
William M. Healy
Heat Transfer and Alternative Energy Systems Group Building and Fire Research Laboratory
National Institute of Standards and Technology Gaithersburg, MD 20899-8632
And
Daniel R. Flynn
President and Chief Scientist MetSys Corporation
Millwood, VA 22646-0317
Reprinted from STP 1426, ASTM International Standards, Insulation Materials, Testing and Applications, V4, 2002
ISBN 0-8031-2898-3
NOTE: This paper is a contribution of the National Institute of Standards And Technology and is not subject to Copyright.

William M. Healy’ and Daniel R. Flynn2
Thermal Modeling of Multiple-Line-Heat-Source Guarded Hot Plate Apparatus
REFERENCE: Healy, W. M. and Flynn, D. R., “Thermal Modeling of Multiple- Line-Heat-Source Guarded Hot Plate Apparatus,” Insulation Materia1s:Testing and Appfications:4th Volume, ASTMSTP 1426, A. 0. Desjarlais and R. R. Zarr, Eds., ASTM International, West Conshohocken, PA, 2002.
ABSTRACT: The National Institute of Standards and Technology is building a guarded hot plate apparatus of advanced design to provide very accurate thermal transmission properties for specimens of thermal insulation 500 mm in diameter, with thicknesses up to 110 mm, at mean temperatures from 90 K to 900 K. This paper documents some of the extensive thermal modeling and analyses that were camed out in the course of designing this apparatus and characterizing potential errors and uncertainties. In an idealized guarded hot plate apparatus, the effective thermal conductivity is simply computed from the measured power input to the meter plate heater, the effective area of the metering plate, the temperature of the hot plate and the two cold plates, and the specimen thickness. In an actual apparatus, there may be (a) temperature variations in the hot plate and cold plates, (b) radial heat flow within the specimen, and (c) transient temperature fluctuations that add uncertainty to the measured thermal conductivity. For the new 500 mm apparatus, both analytical solutions and finite element analyses were used to model temperature distributions in critical thermal components, heat flows that might affect the measured thermal conductivity values, and the effects of departures from ideal steady-state conditions on test results. This paper focuses on the results of these analyses and computations.
KEYWORDS: finite element analysis, guarded hot plate, heat conduction, heat transfer, insulation, R-value, thermal analysis, thermal conductivity, thermal insulation, thermal resistance
Introduction
The National Institute of Standards and Technology (NIST) is designing a new guarded hot plate to test thermal insulation from 90 K to 900 K. An accompanying paper [ I ] describes the major components and design concepts of this proposed apparatus. The plate design is based on ASTM Test Method for Steady State Heat Flux Measurements and Thermal Transmission Properties (C 177), ASTM Practice for
Mechanical Engineer, Building and Fire Research Laboratory, National Institute of
President and Chief Scientist, MetSys Corporation, Millwood, VA 22646-03 17.
I
Standards and Technology, Gaithersburg, MD 20899-8632.
79

80 INSULATION MATERIALS: TESTING AND APPLICATIONS
Guarded-Hot-Plate Design Using Circular Line-Heat Sources (C 1043), and I S 0 International Standard: Thermal Insulation - Determination of Steady-State Thermal Resistance and Related Properties - Guarded Hot-Plate Apparatus (IS0 8302).
Determination of the thermal conductivity of the insulation follows from the applicable approximation to Fourier’s Law in one dimension:
AT hz
Q=ilA-,
where A is the thermal conductivity, Q is the time rate of heat flow through the specimen, & is the specimen thickness, A is the area through which the heat flows, and AT is the temperature difference across the thickness of the specimen. 2 is determined by measuring the temperatures, heat flow, and specimen thickness and applying Eq. (1).
The proposed guarded hot plate will add greater range to the measurement capability at NIST. Zarr [2 ] has documented the history of NIST’s role in testing heat insulators. Overviews of this procedure and of plates throughout the world have been given by Klarsfeld [3] and Pratt [4 ] . A number of articles have been written that describe thermal analyses of guarded hot plates. Hahn et a1 [5] discuss the line-heat source concept, the technique for creating known temperature distributions on a plate that was adopted as part of C 1043. The authors suggest that placing ring heaters in a circular plate leads to more accurate determinations of the plate temperatures because the plate temperatures can be accurately modeled mathematically. Other mathematical analyses of plates are included in [6-91. Recently, numerical methods have played a greater role in the design and evaluation of guarded hot plates. Troussart [IO] was the first to demonstrate the use of finite element analysis to examine edge losses and the effect of a gap temperature differential in a rectangular plate. Subsequent analyses have become more sophisticated as finite element resources have advanced [11-I3]. Recently, Virgone et al [14] used a three-dimensional finite difference algorithm to model the edge losses and gap effects in a square plate. In all of these works, focus has been placed on the effects of edge losses. The present work examines edge losses in the design of the new guarded hot plate at NIST. Additional results show the expected temperature profiles for a real application of the multiple-line heat source concept and for coolant tubes in the plates.
The purpose of this paper is to discuss the thermal analyses that guided the design process and have helped to identify performance characteristics of the apparatus. The initial designs were typically created with the help of analytical techniques to predict temperature fields within the plates. Finite element analysis, using a commercial software package, was utilized to predict thermal performance in those parts of the plate where analytical techniques would have been excessively cumbersome. Decreasing the uncertainty in the measurements was the ultimate goal in the thermal analyses. The major areas of uncertainty related to the thermal design can be deduced from Eq. (1). Measurement errors can arise from imperfect guarding, inaccurate determination of temperature differences, failure to reach thermal equilibrium, and incorrect determination of the specimen thickness. The thermal analyses have three main objectives: (1) Ensure that the hot and cold plates are nearly isothermal so that the measured temperature is an accurate estimation of the actual average surface

HEALY AND FLYNN ON THERMAL MODELING 81
temperatures, (2) determine whether the design minimizes radial heat flow in the meter section of the specimen SO that effectively all heat input to the meter plate travels uniaxially through the specimen to the cold plate, and (3) estimate errors associated with non-steady state operation. The investigation of the plate typically involved each component of the plate separately, and the following discussion provides analyses for the major components of the proposed apparatus.
Overview of Design
Figure 1 shows a cross-sectional schematic of the guarded hot plate apparatus. The apparatus consists of round plates with a diameter of 500 mm and accepts cylindrical specimens on both sides of the meter plate. Each cold plate is composed of one single disk, while the hot plate is made up of a disc-shaped meter plate surrounded by an annular guard ring. The metering plate will have a diameter of 200 mm to the center of the guard gap, which will be 1.4 111117 wide on the surface. The plates will be oriented vertically, as shown in Fig. 1. Plate temperatures are determined by standard platinum resistance thermometers (SPRTs) inserted in wells in the meter plate and cold plates. A thermopile will be used to measure the temperature differential across the guard gap, and thermocouples will be installed to check the uniformity of the temperature distribution of the plates. An edge guard controlled to the mean temperature of the hot and cold plate will surround the specimen to minimize radial heat flow within
guard
assembly
the specimens. Electric heaters will be placed in the meter plate, guard ring, cold plates, and edge guards. Coolant tubes will be inserted in the cold plates and the edge guard. Since the plate will be operated at temperatures far from ambient, precautions are needed to prevent heat loss through the SPRT, thermocouple wires, heater leads, and support cables. These protrusions will be thermally grounded to a connection guard block that is maintained at the temperature of each plate. Auxiliary insulation will encapsulate these components, and a water-cooled jacket will form the outside of the apparatus. The entire apparatus will be installed in a bell jar so that variable pressure can be applied to the system. For further detail on the design, the reader is referred to Flynn et a1 [ I ] .
Figure 1 - Schematic of guarded hot plate cross section.

82 INSULATION MATERIALS: TESTING AND APPLICATIONS
Parameter
Provision of Isothermal Surfaces
Value
Hot Plate
Meter plate - Heating of both the metering plate and the guard ring of the guarded hot plate occurs through the use of multiple line source heaters. Procedures for computing the preferred locations for circular heaters have previously been published in C 1043. These procedures were used to determine the optimal number of circular heaters to produce a surface temperature with sufficient uniformity. The ideal heater layout was then modified to accommodate practical heaters as discussed in C 1043.
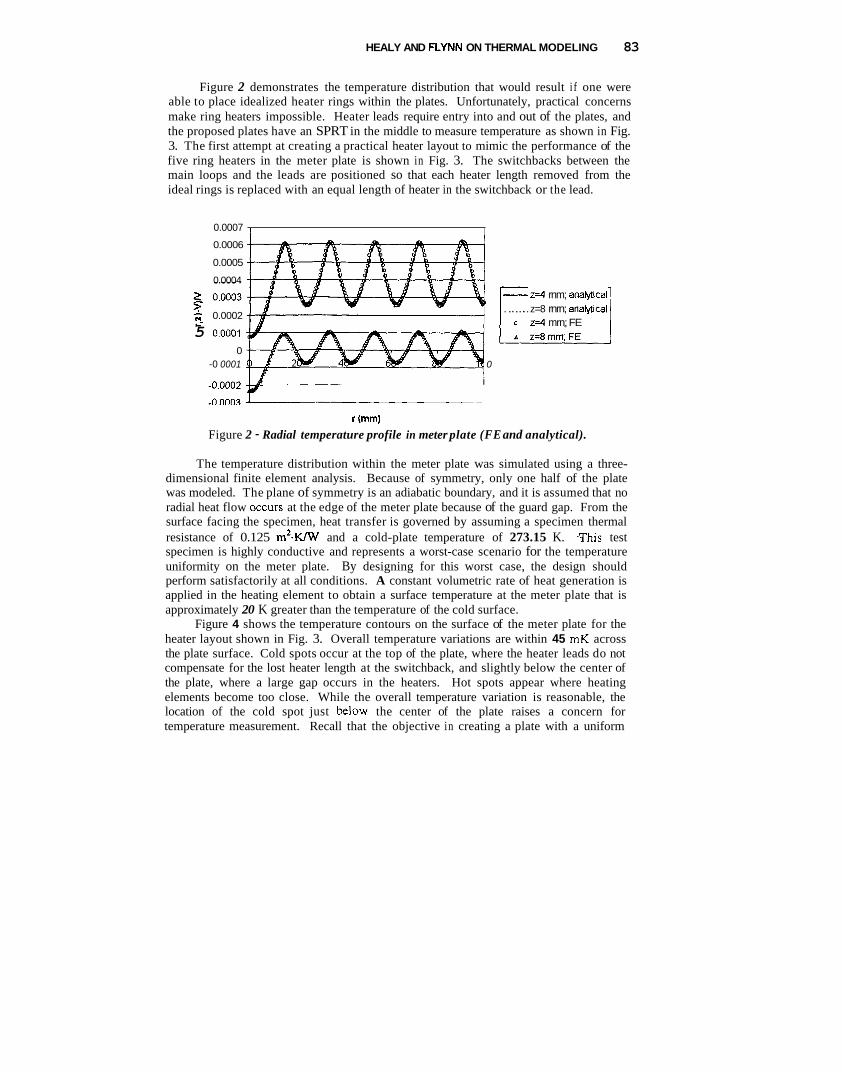
Table 1 shows the critical parameters for the hot plate simulations. Five concentric ring heaters are used in each of the meter plate and the guard ring. The plates are 16 mm thick, with the heating elements located at the midplane. Because of symmetry, only one half of each plate thickness is modeled, so all axial locations are measured in reference to the heating elements. Figure 2 shows results both from analytical solutions using series expansions and from finite element analyses for the normalized temperature profile in the meter plate. The local temperature is given as v(r,z) and the average temperature over the top surface is V. In these simulations, it was assumed that no heat transfer occurred from the edges or bottom of the plate, and a constant heat flux was removed from the top surface adjacent to the specimen. The finite element solution overlays the lines depicting the analytical solution, indicating an excellent match between the two techniques. At z = 4 mm, the amplitude of the temperature fluctuations are greater than at z = 8 mm because of the closer proximity to the heaters. More smoothing occurs in the temperature profile further away from the heaters because of lateral heat conduction. The close agreement of these two techniques provided confidence that the finite element analyses would sufficiently simulate millikelvin temperatures. Temperature fluctuations are miniscule with 5 heaters, and the temperature peaks are quite uniform. Similar plots of the predicted temperature distribution in the guard ring due to five circular rings show that the finite element predictions match the analytical predictions.
Plate h
Radius
Thickness
70 W/(m.K)
250 mm
16 mm
Guard Gap Width 1.6 mm
Radial Location of Center of Guard Gap
Heater Diameter
HEALY AND FLY" ON THERMAL MODELING 83
Figure 2 demonstrates the temperature distribution that would result i f one were able to place idealized heater rings within the plates. Unfortunately, practical concerns make ring heaters impossible. Heater leads require entry into and out of the plates, and the proposed plates have an SPRT in the middle to measure temperature as shown in Fig. 3. The first attempt at creating a practical heater layout to mimic the performance of the five ring heaters in the meter plate is shown in Fig. 3. The switchbacks between the main loops and the leads are positioned so that each heater length removed from the ideal rings is replaced with an equal length of heater in the switchback or the lead.
0.0007 I I 0.0006
0.0005
0.0004
0.0002 5 5 0.0001
0 -0 0001 0
z d rnm; analytlcai . . . . . . . z=8 rnrn; anawcal
z d mrn; FE
i
r (mm) Figure 2 - Radial temperature profile in meter plate (FE and analytical).
The temperature distribution within the meter plate was simulated using a three- dimensional finite element analysis. Because of symmetry, only one half of the plate was modeled. The plane of symmetry is an adiabatic boundary, and it is assumed that no radial heat flow occurs at the edge of the meter plate because of the guard gap. From the surface facing the specimen, heat transfer is governed by assuming a specimen thermal resistance of 0.125 m * . W and a cold-plate temperature of 273.15 K. This test specimen is highly conductive and represents a worst-case scenario for the temperature uniformity on the meter plate. By designing for this worst case, the design should perform satisfactorily at all conditions. A constant volumetric rate of heat generation is applied in the heating element to obtain a surface temperature at the meter plate that is approximately 20 K greater than the temperature of the cold surface.
Figure 4 shows the temperature contours on the surface of the meter plate for the heater layout shown in Fig. 3. Overall temperature variations are within 45 mK across the plate surface. Cold spots occur at the top of the plate, where the heater leads do not compensate for the lost heater length at the switchback, and slightly below the center of the plate, where a large gap occurs in the heaters. Hot spots appear where heating elements become too close. While the overall temperature variation is reasonable, the location of the cold spot just below the center of the plate raises a concern for temperature measurement. Recall that the objective in creating a plate with a uniform

84 INSULATION MATERIALS: TESTING AND APPLICATIONS
I
Temp W) 1 293 127 I 293 131 I 293 135
293 I4 293 144 293 148 293 I52 293 1 5 1
0 293 161 0 293 165
I
with oacks
T ~ P (K) 293 12 293.125 29313 293.135 293 14 293.145 293.15
tcB 293.155 293.16 293 165
I
Figure 3 - Original heater layout in meter plate.
Figure 4 - Temperature contours on surface of meter plate with original
heater layout.
surface temperature is to ensure that the measured temperature accurately represents the true average surface temperature. For the meter plate, the temperature will be measured using an SPRT inserted in the middle of the plate as shown in Fig. 3. The sensitive region of the SPRT is a 50 mm length at the center of the plate. The concern with the estimated temperature distribution in the meter plate is that the cold spot below the center of the plate lies close to the region of the SPRT. The dip in temperature begins to approach the sensitive region of the SPRT, and potential exists for erroneous readings in the temperature. To avoid this potential problem, the heater layout was redesigned to move this temperature trough away from the SPRT.
Figure 5 shows the revised heater layout in the meter plate, and Fig. 6 displays the resulting surface temperature profile. The temperature range seen on the plate surface is similar to that seen in the previous simulation, but by bringing the heater leads down along the SPRT, the temperature variation along the SPRT has been diminished.
Figure 5 - Re-designed heater layout in meter plate.
Figure 6 - Sugace temperature contours for revised heater layout.

86 INSULATION MATERIALS: TESTING AND APPLICATJONS
containing the heating elements and the plate touching the specimen and containing the SPRT (hereafter called the “thermometry” plate). Analytical modeling showed that the temperature fluctuations dropped to 0.001 mK at the plate surface and 0.002 mK at the SPRT depth when this composite construction was utilized.
Because the temperature variations indicated by the analytical results were negligible, finite element simulations of the three-dimensional temperature distribution arising from the heating elements were not performed. Instead, the focus of the finite element analysis was on the temperature field resulting from the coolant channels. The temperature distribution resulting from the coolant channels is a concern because, unlike heaters, a constant heat flux is not removed at all points along the channel.
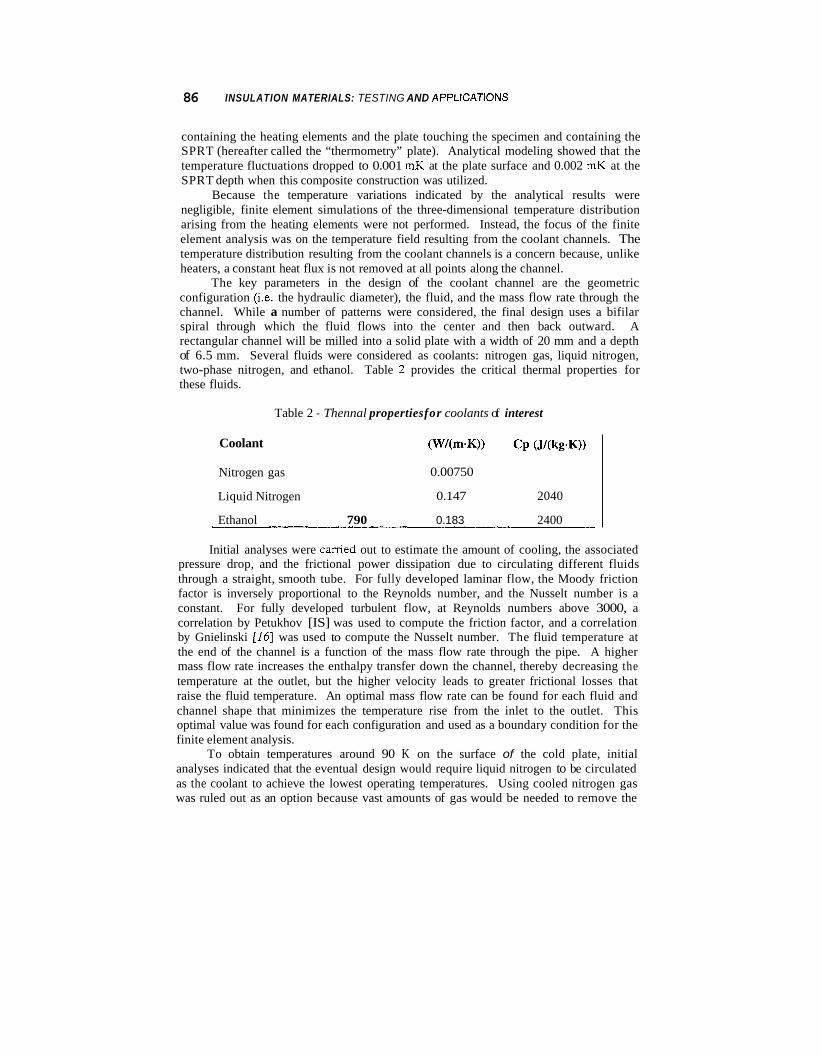
The key parameters in the design of the coolant channel are the geometric configuration (i.e. the hydraulic diameter), the fluid, and the mass flow rate through the channel. While a number of patterns were considered, the final design uses a bifilar spiral through which the fluid flows into the center and then back outward. A rectangular channel will be milled into a solid plate with a width of 20 mm and a depth of 6.5 mm. Several fluids were considered as coolants: nitrogen gas, liquid nitrogen, two-phase nitrogen, and ethanol. Table 2 provides the critical thermal properties for these fluids.
Table 2 - Thennal properties for coolants of interest
Coolant (W/(m.K)) Cp (J4kg.K))
Nitrogen gas 0.00750
Liquid Nitrogen 0.147 2040
Ethanol 790 0.183 2400
Initial analyses were carried out to estimate the amount of cooling, the associated pressure drop, and the frictional power dissipation due to circulating different fluids through a straight, smooth tube. For fully developed laminar flow, the Moody friction factor is inversely proportional to the Reynolds number, and the Nusselt number is a constant. For fully developed turbulent flow, at Reynolds numbers above 3000, a correlation by Petukhov [IS] was used to compute the friction factor, and a correlation by Gnielinski [16] was used to compute the Nusselt number. The fluid temperature at the end of the channel is a function of the mass flow rate through the pipe. A higher mass flow rate increases the enthalpy transfer down the channel, thereby decreasing the temperature at the outlet, but the higher velocity leads to greater frictional losses that raise the fluid temperature. An optimal mass flow rate can be found for each fluid and channel shape that minimizes the temperature rise from the inlet to the outlet. This optimal value was found for each configuration and used as a boundary condition for the finite element analysis.
To obtain temperatures around 90 K on the surface of the cold plate, initial analyses indicated that the eventual design would require liquid nitrogen to be circulated as the coolant to achieve the lowest operating temperatures. Using cooled nitrogen gas was ruled out as an option because vast amounts of gas would be needed to remove the

HEALY AND FLY" ON THERMAL MODELING 87
heat from the plate, and the resulting temperature profile showed large variations on the plate surface. Liquid ethanol could be used to achieve cold plate temperatures from room temperature down to approximately 210 K. To attain cold plate temperatures between the boiling point of nitrogen (77 K) and 210 K, liquid nitrogen will be used in the coolant channels and heat will be provided from the heating element in the cold plate to raise it to the desired temperature. The use of the heater i n tandem with coolant in the same metal plate, however, posed a serious control problem. To alleviate this problem, an additional layer of insulation was added between the plate containing the heating elements and the plate containing the cooling channel. A schematic of the cross-section of the cold plate is given in Fig. 9.
I
14 0.5
0.5 6
16
Plate Insulation
38
I I 500
Figure 9 - Cross section of cold-plate assembly (not to scale; dimensions in mm).
The first finite element analysis that was performed involved gaseous nitrogen cooled to 90 K. Table 3 displays the key parameters for all simulations. Figure 10 shows the resulting temperature profile on the surface of the cold plate facing the
Table 3 - Cold plate simulation parameters.
Parameter I Value Plate material Nickel
Plate h 100 W/(m.K)
Specimen R-value 0.125 m 2 . W
Hot Plate Temp.
Auxiliary insulation 0.630 m 2 . W R-value
Environmental 298 K TemDerature
110 K, or 270 K
Figure 10 - Surface temperature profile on cold plate with gaseous nitrogen as
coolant.
88 INSULATION MATERIALS: TESTING AND APPLICATIONS
specimen. A large asymmetry in the temperature profile exists, and the span of temperatures is estimated as 98 mK.
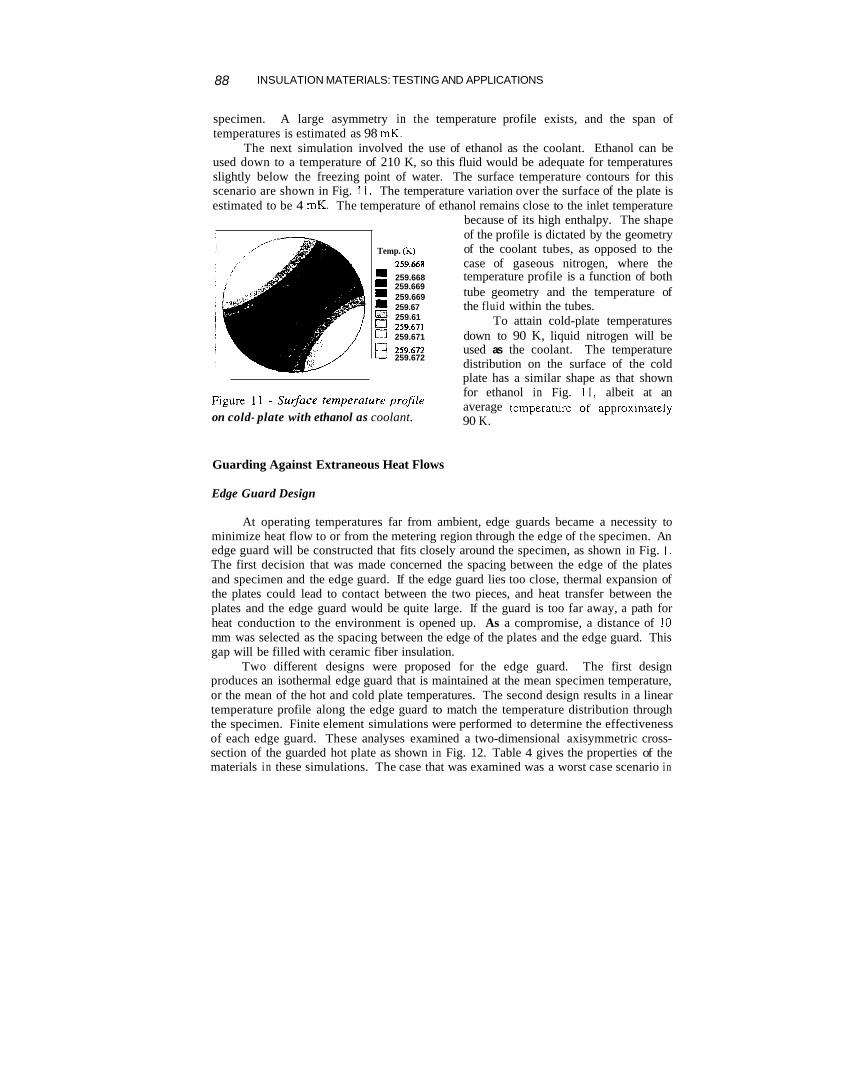
The next simulation involved the use of ethanol as the coolant. Ethanol can be used down to a temperature of 210 K, so this fluid would be adequate for temperatures slightly below the freezing point of water. The surface temperature contours for this scenario are shown in Fig. 1 1. The temperature variation over the surface of the plate is estimated to be 4 mK. The temperature of ethanol remains close to the inlet temperature
because of its high enthalpy. The shape of the profile is dictated by the geometry of the coolant tubes, as opposed to the
259.668 case of gaseous nitrogen, where the 259.668 temperature profile is a function of both
tube geometry and the temperature of E 259.67 the fluid within the tubes. To attain cold-plate temperatures
259.671 down to 90 K, liquid nitrogen will be n 259.672 used as the coolant. The temperature
distribution on the surface of the cold plate has a similar shape as that shown for ethanol in Fig. 1 I , albeit at an
90 K.
Temp. (K)
259.669 259.669
259.61 0 259.671
259.672
Figure 1 1 - Surface temperature profile average temperature of approximately on cold- plate with ethanol as coolant.
Guarding Against Extraneous Heat Flows
Edge Guard Design
At operating temperatures far from ambient, edge guards became a necessity to minimize heat flow to or from the metering region through the edge of the specimen. An edge guard will be constructed that fits closely around the specimen, as shown in Fig. 1. The first decision that was made concerned the spacing between the edge of the plates and specimen and the edge guard. If the edge guard lies too close, thermal expansion of the plates could lead to contact between the two pieces, and heat transfer between the plates and the edge guard would be quite large. If the guard is too far away, a path for heat conduction to the environment is opened up. As a compromise, a distance of 10 mm was selected as the spacing between the edge of the plates and the edge guard. This gap will be filled with ceramic fiber insulation.
The first design produces an isothermal edge guard that is maintained at the mean specimen temperature, or the mean of the hot and cold plate temperatures. The second design results in a linear temperature profile along the edge guard to match the temperature distribution through the specimen. Finite element simulations were performed to determine the effectiveness of each edge guard. These analyses examined a two-dimensional axisymmetric cross- section of the guarded hot plate as shown in Fig. 12. Table 4 gives the properties of the materials in these simulations. The case that was examined was a worst case scenario in
Two different designs were proposed for the edge guard.

HEALY AND FLYNN ON THERMAL MODELING 89
which the specimen temperature (910 K) deviated the furthest .from ambient and the specimen thickness was greatest (100 mm). Sufficient performance under these conditions would prove that the edge guard would effectively mitigate radial heat flow in the meter section under expected conditions.
100 150 10 50
8
100
24.5
34
d
ation
Figure 12 - Simulation model for edge guard studies (dimensions in mm).
Table 4 - Model parameters for edge guard simulations.
Plate material j Nickel Plate thermal conductivity Edge guard material ! Nickel Edge guard thermal conductivity Specimen material i Fiberglass batt Specimen thermal conductivity
1 70 W/(m.K)
~ , _ 1 20 W/(m.K)
I 0.0328 W/(mK) ( T = 300 K) -
___
- ._a__ 1 0.106 W/(m-K) ( T = 1000 K) Aux. insulation material Aux. insulation thermal conductivity
i Alumina board 0.0627 W/(m.K) (T= 297 K) - : 0.160 W/(m.K) ( T = 1073 K)
Edge insulation material i Ceramic Fiber Edge insulation thermal conductivity ~ 0.038 W/(mK) (T = 297 K) -
Edge guard temperature __ I 910K Ambient temperature 298 K

90 INSULATION MATERIALS: TESTING AND APPLICATIONS
.
In this model, certain simplifying aspects are included. Details of the heaters in all plates are replaced by uniform volumetric heat generation in the plates. The three-part composite construction of the cold plate is replaced by a two-part construction, with the plate holding the coolant tubes being combined with the plate containing the heaters. Additionally, details of the edge guard are omitted and are replaced by a perfect cylinder surrounding the specimen. These simplifications should not affect the result of interest, namely the edge heat losses.
Figure 13 shows temperature contours within the specimen for an isothermal edge guard and a temperature difference of 40 K across the specimen. In the meter section the isotherms are nearly parallel, indicating that the heat is transferred in a one-dimensional manner. At the edge of the specimen, the isotherms diverge because the edge guard is maintained at the mean temperature of the specimen. Figure 14 shows a similar plot for an edge guard with a linear temperature profile. Parallel isotherms are maintained throughout the entire specimen. The linear edge guard thus qualitatively provides superior guarding.
Temp. (K) 889.5 I 894.056 I 898.611
903.167 I 907.722 I 912.278
916.833 @ 921.389 G 925.944
930.5
Temp. (K) 889.S I 894.056 I 898.611 I 903.167 I 907.722 I 912.278
916.833 0 921.389 0 925.944 a 930.5 iJ
Figure 13 - Temperature contours within the specimen with an isothennal
edge guard.
U
Figure 14 - Temperature contours vithin the specimen with a linear edge
guard.
The errors in the thermal conductivity measurements were also computed for both cases. Since the thermal conductivity of the specimen is known in the model, Eq. (1) can be used to determine an experimental thermal conductivity. The surface temperature over the meter plate and the meter section of the cold plate are determined from the model and the heat flow from the meter plate is also determined. In both cases, the error in the thermal conductivity measurement was less than 0.2 % for the 40 K temperature difference. For a AT = 10 K, the errors were worse, but errors for both cases lay between 0.5 % and 0.7 %. Within the bounds of the accuracy of the model, negligible differences exist between the two types of edge guards.
While the above analysis indicates that either edge guard will work equally well, that analysis assumes that one knows the true surface temperature. In the actual experiment, uncertainty exists in the temperature measurements. The SPRT measures only the temperature in the center of the plate. With this in mind, it is useful to examine the surface temperature profiles in both cases. Figure 15a shows the profiles along both the hot plate and the cold plate for both simulations, while Fig. 15b shows those same

HEALY AND FLYNN ON THERMAL MODELING 91
r (mm)
--r Cold Plate, Isothermal + Hot Plate, Isothermal +- Cold Plate, Linear - Hot Plate, Linear
(a>
r (mm)
+Cold Plate, Isothermal -4 Hot Plate, Isothermal *Cold Plate, Linear - Hot Plate, Linear
(b)
Figure 15 - Surface temperatures in edge guard simulations with & = 100 mm (a) AT = 40 K, (b ) AT = 10 K
profiles for a AT = 10 K. In (a), the temperatures at the edges of all plates deviate from ilic average. For the isothermal guard, the edge of the cold plate increases in Icrnperature, while the edge of the hot plate decreases in temperature because of heat flow to or from the edge guard, respectively. For the linear edge guard, both the cold pliite and hot plate see slight decreases in temperatures at the edge because of heat loss io the environment. For the case where AT = 10 K, interesting observations can be iriade. For the isothermal guard, the behavior of the hot plate is similar to that for the picvious case in that its temperature drops as r increases. The cold plate, however, Iwchaves in a different manner when AT = 10 K versus the case where AT = 40 K. With a dil'fcrence of only 5 K between the cold plate and the edge guard, heat flow from the d g c guard to the cold plate is overwhelmed by heat flow from the cold plate to the uivironment. Because of the net heat flow out of the cold plate, the temperature at the

92 INSULATION MATERIALS: TESTING AND APPLICATIONS
edge drops. For the linear case, the hot plate temperature profile is similar to that of the previous case, but the cold plate temperature drops more severely with AT = 10 K than with AT = 40 K. The reason for this behavior is that the cold plate does not receive as much heat from either the hot plate or the edge guard to make up for the heat lost to the environment. The lesson learned from these plots is that both a linear edge guard and an isothermal edge guard could lead to errors in temperature measurement of the plate, depending upon the operating conditions.
The decision concerning which edge guard to use was dictated more by manufacturing issues than thermal issues. The thermal analyses showed that either guard would provide satisfactory results, so the fact that the isothermal guard would be much easier to fabricate than the linear guard made the choice for an isothermal guard.
Connection Guard Block Design
Key paths for heat flow to or from the hot and cold plates are the SPRT, thermocouple and thermopile wires, heater leads, and support cables. Because the plates will be operated at temperatures far from ambient, precautions need to be made to minimize the heat flow through these entities. To accomplish this guarding, all leads are attached to a connection guard block. Each plate has one connection guard block adjacent to it that will be controlled to be at the same temperature as the plate. The edge guard will also have connection guard blocks to minimize heat loss through the heater and thermocouple leads in that component.
Figure 16 shows a schematic of a connection guard block. Only the SPRT is shown passing through the block, but heater wires and thermocouple leads will also pass through it. The circles on the block are mandrels that hold heater wire or coolant tubes. The location of those mandrels is different on the hot plate connection guard block than on the cold plate connection guard block. The block is removed from each plate by a distance of 10 mm. Finite element analysis was used to determine the temperature distribution within these blocks. Since the blocks are so close to the plates, i t was
k necessary to ensure that the temperature variation along the edge that is near the plate is as uniform as possible. The blocks were modeled in isolation from the surrounding plate under the
Guard Block assumption that adiabatic boundaries existed everywhere except where heat was lost through the connections and where heat was added to the block. Simulations were run with the blocks at 930 K to estimate the worst-case
_ _ _ ..... - -.---- .. .. . . . . .
Plate
scenario, that where the block’s temperature is furthest from room temperature. The effect of the SPRT
Figure 16 - Connection guard block and wire leads was modeled by estimating the thermal resistance caused by these items between the guard blocks
schematic.

HEALY AND FLYNN ON THERMAL MODELING 93
Parameter
and a room temperature block located a known distance from the connection guard blocks. That condition was applied to a small area on the top of the block. The effect of the support cables was modeled in a similar fashion. Table 5 describes critical parameters for the simulations.
Value
Table 5 - Parameters for connection guard block studies
Block thermal conductivity 70 W/(m.K)
Thermal resistance of support cable 2.62 1 0 ' ~ m2.K/W
Thermal resistance of SPRT + wires 2.86 x m2.K/W
Environmental Temperature 298 K
Heat flux on each hot plate CGB mandrel
Heat flux on each cold plate CGB mandrel
4010.8 W/m2
2005.8 W/m2
Figure 17 shows the temperature contours on the hot plate connection guard block. Figure 17a shows the complete range of temperatures seen on the block in an oblique view. This block has four bosses on it, with two bosses having heating elements and the other two having cooling coils. In this simulation, the high temperature case was of interest, so heat was applied on the front-left boss and the back-right boss. The necessary heat flux needed on those surfaces was calculated to match the heat loss through the cables and SPRT with the block at 930 K. Figure 17b shows a narrower range of temperatures in a front view of the block. The temperature span along the lower portion of the block is approximately 0.56 K. While this temperature span is large compared to those seen in the meter plate, insulation between the plate and the block
Temp. (K) 924.849 926884 I 928.92 I 930.955
7 Temp. (K)
Figure 17 - Temperature contours on the hotplate connection guard block.
94 INSULATION MATERIALS: TESTING AND APPLICATIONS
will prevent those temperature fluctuations from causing any severe problems in the plate itself. While it would have been desirable to decrease that temperature span, packaging issues prevented a better location of the bosses.
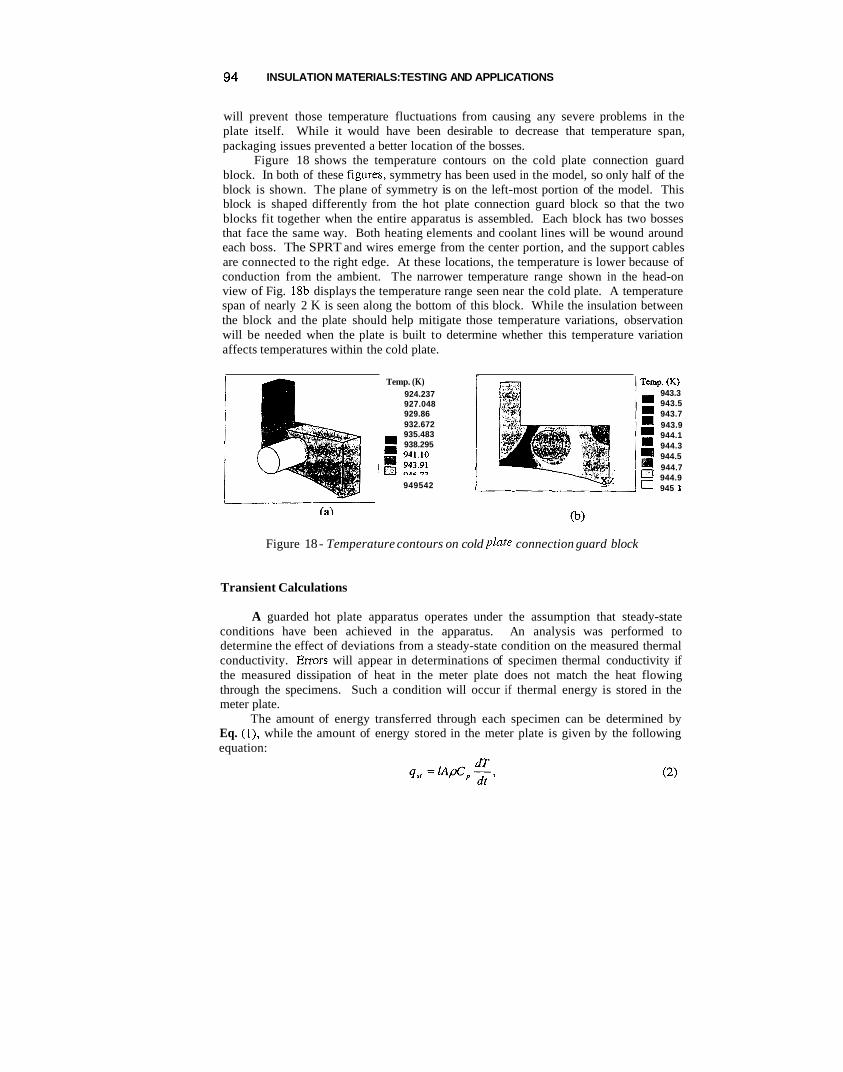
Figure 18 shows the temperature contours on the cold plate connection guard block. In both of these figures, symmetry has been used in the model, so only half of the block is shown. The plane of symmetry is on the left-most portion of the model. This block is shaped differently from the hot plate connection guard block so that the two blocks fit together when the entire apparatus is assembled. Each block has two bosses that face the same way. Both heating elements and coolant lines will be wound around each boss. The SPRT and wires emerge from the center portion, and the support cables are connected to the right edge. At these locations, the temperature is lower because of conduction from the ambient. The narrower temperature range shown in the head-on view of Fig. 18b displays the temperature range seen near the cold plate. A temperature span of nearly 2 K is seen along the bottom of this block. While the insulation between the block and the plate should help mitigate those temperature variations, observation will be needed when the plate is built to determine whether this temperature variation affects temperatures within the cold plate.
Temp. (K) 924.237 927.048 929.86 932.672 935.483 : 938.295
949542
Temp. (K) 943.3 = 943.5 = 943.7
= 944.1 = 944.3 = 944.5
0 944.9 0 945 1
943.9
944.7
Figure 18 - Temperature contours on cold plate connection guard block
Transient Calculations
A guarded hot plate apparatus operates under the assumption that steady-state conditions have been achieved in the apparatus. An analysis was performed to determine the effect of deviations from a steady-state condition on the measured thermal conductivity. Errors will appear in determinations of specimen thermal conductivity if the measured dissipation of heat in the meter plate does not match the heat flowing through the specimens. Such a condition will occur if thermal energy is stored in the meter plate.
The amount of energy transferred through each specimen can be determined by Eq. (1). while the amount of energy stored in the meter plate is given by the following equation:
HEALY AND FLYNN ON THERMAL MODELING 95
Condition Specimen R- value [ r n Z . ~ ]
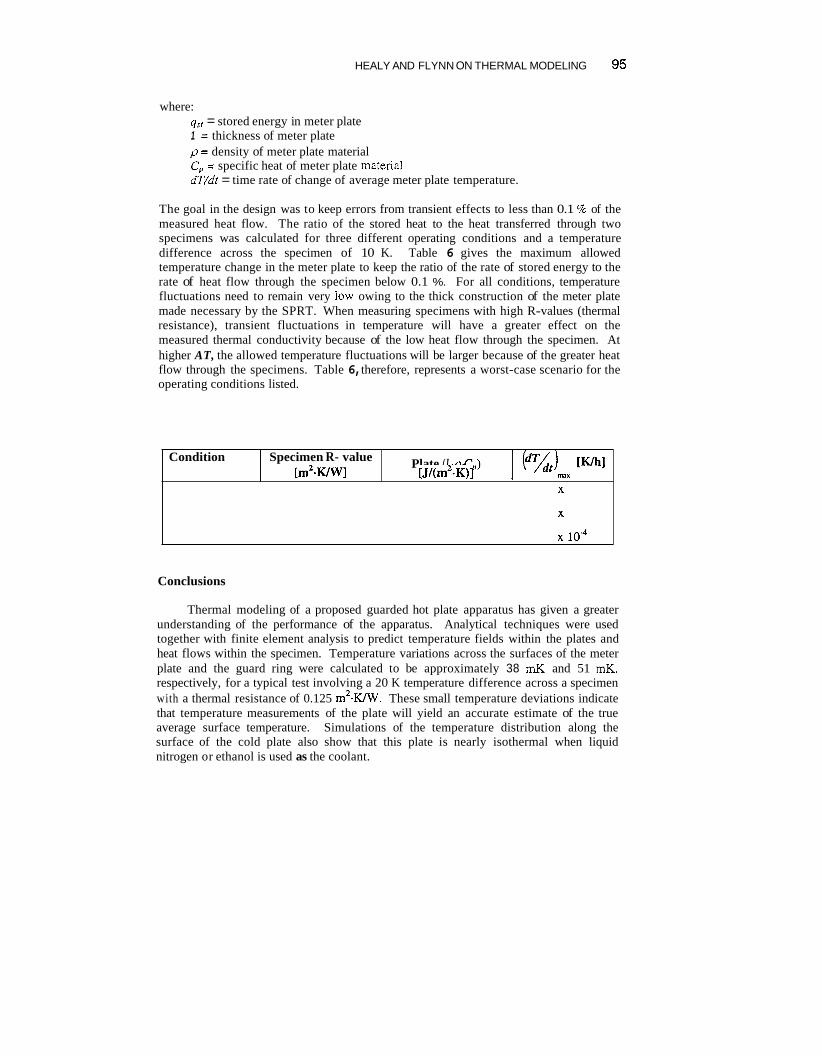
where: qs, = stored energy in meter plate 1 = thickness of meter plate p= density of meter plate material C, = specific heat of meter plate material dT/dt = time rate of change of average meter plate temperature.
Plate ( I p€,) I [WI [J/(mZ-K)l I naX
The goal in the design was to keep errors from transient effects to less than 0.1 % of the measured heat flow. The ratio of the stored heat to the heat transferred through two specimens was calculated for three different operating conditions and a temperature difference across the specimen of 10 K. Table 6 gives the maximum allowed temperature change in the meter plate to keep the ratio of the rate of stored energy to the rate of heat flow through the specimen below 0.1 %. For all conditions, temperature fluctuations need to remain very low owing to the thick construction of the meter plate made necessary by the SPRT. When measuring specimens with high R-values (thermal resistance), transient fluctuations in temperature will have a greater effect on the measured thermal conductivity because of the low heat flow through the specimen. At higher AT, the allowed temperature fluctuations will be larger because of the greater heat flow through the specimens. Table 6, therefore, represents a worst-case scenario for the operating conditions listed.
Conclusions
Thermal modeling of a proposed guarded hot plate apparatus has given a greater understanding of the performance of the apparatus. Analytical techniques were used together with finite element analysis to predict temperature fields within the plates and heat flows within the specimen. Temperature variations across the surfaces of the meter plate and the guard ring were calculated to be approximately 38 mK and 51 mK, respectively, for a typical test involving a 20 K temperature difference across a specimen with a thermal resistance of 0.125 m2.WW. These small temperature deviations indicate that temperature measurements of the plate will yield an accurate estimate of the true average surface temperature. Simulations of the temperature distribution along the surface of the cold plate also show that this plate is nearly isothermal when liquid nitrogen or ethanol is used as the coolant.

96 INSULATION MATERIALS: TESTING AND APPLICATIONS
The proposed plate will have an isothermal edge guard maintained at the mean specimen temperature. Modeling showed that this component effectively guards the meter section from environmental effects, even at a worst-case scenario involving a thick specimen at an operating temperature far from ambient. Errors in thermal conductivity measurements of the specimen are estimated to be less than or equal to 0.7 % at these extreme conditions. Measurements taken on thinner specimens at temperatures closer to room temperature will result in negligible errors due to edge losses. To further guard the plates from the surrounding environment, connection guard blocks will be included in the design to minimize unwanted heat flow through heater and thermometry leads and support mechanisms.
Analyses of the transient performance of the guarded hot plate apparatus revealed the importance of maintaining steady-state conditions throughout each test. It was found that temperature fluctuations in the meter plate need to be kept below 1 mWh to ensure that errors arising from transient effects are lower than 0.1 % for the cases studied.
The use of finite element analysis in tandem with analytical techniques has provided significant insight into the operation of the proposed guarded hot plate apparatus and will allow better estimates of the uncertainties associated with measurements of the thermal conductivity of thermal insulation.
References
[ l ] Flynn, D. R., Zarr, R. R., Hahn, M. H., and Healy, W. M., “Design Concepts for a New Guarded Hot Plate Apparatus,” Insulation Materials: Testing and Applications: 4th Volume, ASTM STP 1426, A.O. Desjarlais and R. R. Zarr, Eds., American Society for Testing and Materials, West Conshohocken, PA, 2002.
[2] Zarr, R. R., “A History of Testing Heat Insulators at the National Institute of Standards and Technology,” to appear in ASHRAE Transactions, Vol. 107, Pt.2.
[3] Klarsfeld, S., “Guarded Hot Plate Method for Thermal Conductivity Measurements,” in Comperrdium of Thermophysicczl Property Measurement Methods, Vol. 2, Recommended Measurement Techniques and Practices, K.D. Maglic, A. Cezairliyan, and V.E. Peletsky, Eds., Plenum Press, New York, 1992, pp. 99-131.
[4] Pratt, A. W., “Heat Transmission in Low Conductivity Materials,” in Thermal Condicctivi~, Col. 1, R.P. Tye, Ed., Academic Press, London, 1969, pp. 301- 405.
[5] Hahn, M. H., Robinson, H. E., and Flynn, D. R., “Robinson Line-Heat Source Guarded Hot Plate Apparatus,” in Heat Transmission Measurements in Thermal Insulation, ASTM STP 544, R.P. Tye, Ed., American Society for Testing and Materials, Philadelphia, 1974, pp. 167-192.

HEALY AND FLYNN ON THERMAL MODELING 97
[6] Flynn, D. R. and Gorthala, R., "Thermal Design of a Miniature Guarded Hot Plate Apparatus," in Insulation Materials: Testing and Applications: Third Volume, ASTM STP I320, R.S. Graves and R.R. Zarr, Eds., American Society for Testing and Materials, West Conshohocken, PA, 1997, .
[7] De Ponte, F. and Di Filippo, P., "Thermal Conductivity Measurements of Insulating Materials Down to 100 K," Proc. Of the XIII Intl. Congress of Refrigeration, Progress in Refrigeration Science and Technology, 1973 pp. 7-14.
[8] De Ponte, F. and Di Filippo, P., "Some Remarks on the Design of Isothermal Plates," in Some Thermophysical Properties of Refrigerants and Insulants, 1973.
[9] De Ponte, F. and Di Filippo, P., "Design Criteria for Guarded Hot Plate Apparatus," in Heat Transmission Measurements in Thermal Insulations: ASTM STP 544, Ed. R.P. Tye, American Society for Testing and Materials, Philadelphia, PA, 1974, pp. 97-1 17.
[ lo] Troussart, L. R. "Three-Dimensional Finite Element Analysis of the Guarded Hot Plate Apparatus and its Computer Implementation," J. Thermal Insulation Vol. 4, 1981, pp. 225-254.
[ l l ] Pham, Q. T. and Smith, C. G. "Thermal Imbalance Errors and Effective Area in Guarded Hot Plates," Rev. Sci. Instrum. Vol. 57, 1986, pp. 99-105.
[12] Nicolas, J., Martin, F., Andre, Ph., and Rivez, J. -F. "Finite-Element Design of a Guarded Heating Cylinder to Measure Thermal Properties of Materials," Rev. Sci. Instrum. Vol. 61, 1990, pp. 3876-3882.
[ 131 Ashworth, E. and Ashworth, T. "Finite Element Analysis of Unguarded Hot-Plate Thermal Conductivity Apparatuses, " Thermal Conductivity 18: Proc. Intl. Thermal Conductivity Conference, 1985, pp 599-609.
[ 141 Virgone, J., Yezou, R., and Roux, J., "Computer Simulation of the Measurement Error with the Guarded Hot-Plate System," High Temperatures-High Pressures V O ~ . 31, 1999, pp. 275-281.
[15] Petukhov, B. S., "Heat Transfer and Friction in Turbulent Pipe Flow with Variable Physical Properties," in Advances in Heat Transfer, Vol.6, T.F. Irvine and J.P. Hartnett, eds., Academic Press, New York, 1970, pp. 503-564.
[16] Gnielinski, V., "New Equations for Heat and Mass Transfer in Turbulent Pipe and Channel Flow," Intl. Chem. Eng. Vol. 16, 1976, pp. 359-368.