“Thermal Mass and Thermoregulation: A Study of Thermal ... · A Study of Thermal Comfort in...
285
i “Thermal Mass and Thermoregulation: A Study of Thermal Comfort in Temperate Climate Residential Buildings” by Samuel Parsons Bachelor of Science (Honours) Submitted in fulfulment of the requirements for the Degree of Doctor of Philosophy Centre for Environmental Studies School of Geography and Environmental Studies University of Tasmania Oct 2011
Transcript of “Thermal Mass and Thermoregulation: A Study of Thermal ... · A Study of Thermal Comfort in...
i
“Thermal Mass and Thermoregulation:
A Study of Thermal Comfort in
Temperate Climate Residential
Buildings”
by
Samuel Parsons
Bachelor of Science (Honours)
Submitted in fulfulment of the requirements for the
Degree of Doctor of Philosophy
Centre for Environmental Studies
School of Geography and Environmental Studies
University of Tasmania
Oct 2011
i
STATEMENT OF ORIGINALITY
This thesis contains no material which has been accepted for a degree or diploma by
the University or any other institution, except by way of background information and
duly acknowledged in the thesis, and to the best of my knowledge and belief no
material previously published or written by another person except where due
acknowledgement is made in the text of the thesis, nor does the thesis contain any
material that infringes copyright.
Samuel Parsons
October 2011

ii
STATEMENT OF AUTHORITY
This thesis may be reproduced, archived, and communicated in any material form in
whole or in part by the University of Tasmania or its agents, and may be made available
for loan and copying in accordance with the Copyright Act 1968.
Samuel Parsons
October 2011

iii
STATEMENT OF ETHICAL
CONDUCT
The research associated with this thesis abides by the international and Australian
codes on human and animal experimentation, and the rulings of the Safety, Ethics and
Institutional Biosafety Committees of the University.
Samuel Parsons
October 2011
ii
ABSTRACT
The thermoregulatory influence of building materials to improve the thermal comfort of
buildings has been examined primarily using climate modelling based on the work of
Fanger (1972). This modelling has limitations because it does not accept that building
occupants are active participants in controlling their thermal environment. This thesis
addresses this knowledge gap by examining how thermal comfort in the temperate climate
of Hobart, Tasmania, Australia is influenced by thermal mass in buildings. This research
assessed: how the temperate climate of Hobart impacts the thermal environment of a
building; how past research in passive design for energy efficiency has been adopted, and;
what methods of modelling and studying thermal comfort are appropriate. The nine case
studies examined a range of building and occupant types. An analysis was undertaken for
each building including zoning and layout, building materials and insulation. Occupants
were interviewed at the commencement of each case study which included examining
acclimatisation to the local climate and thermal satisfaction with the dwelling. Seasonal
temperature data were recorded in the central living space of buildings over a three month
period. The research gathered dry bulb temperatures, surface temperatures, and humidity
data in each building. Direct observations were made on the activities of the occupants
within their thermal environment and they were surveyed regarding thermal comfort levels.
Results indicate that thermal mass impacts thermal comfort levels of occupants. However,
this impact can be negative or positive depending on other external factors such as the
placement of thermal mass within the building, exposure of thermal mass to insolation and
insulating materials around the thermal mass. In dwellings with poor thermal performance
occupants can increase thermal comfort levels by more closely adapting to the thermal
environment. Such techniques for adaptation include: the adjustment of clothing; the use
of controls such as windows and blinds; relocation within the building; changes in posture
and levels of physical activity; and acclimatisation to the local climate.
The results of this research are widely applicable to Hobart‟s housing stock and could be
implemented into the passive design of new buildings and retrofitting of existing buildings
to improve thermal efficiency. This research shows the importance of thermal mass in
passive design concepts of residential buildings. It provides details on how thermal mass
should be ideally implemented in a building, including placement, orientation, and access to
solar gain.
iii
ACKNOWLEDGEMENTS
First and foremost I would like to acknowledge and thank my supervisor, Lorne K
Kriwoken for the faith he has placed in me to complete this project, his time an effort
invested in my work, his support of me through some exceptionally difficult personal
experiences, and his fantastic sense of humor.
Elaine Stratford for her words of wisdom, and the belief in me that never failed to spur me
into action; Manuel Nunez for help with climatological advice and information; Mick
Russell for invaluable equipment assistance; Aidan Davison for his supervision; and John
Todd words of wisdom and advice.
The homeowners who agreed to participate in my study.
Phillipa Watson for more help, love, and advice than I can really include here.
Tristan Barnes et al. for being a home away from home on so many occasions, for lyrics
that inspire me, for music that I love, and for making my Sunday mornings the best they
can be.
The following composers who have provided the soundtrack to my writing: Jon Brion,
Stan the 3rd, Carter Burwell, John Murphy, Danny Elfman, Trent Reznor, Clint Mansell,
Damon Albarn, James Horner, Daniel Licht, Rolfe Kent, Michael Andrews, Javier
Navarrete, Nick Cave, Warren Ellis, Angelo Badalamenti, Mark Snow, Brian Reitzell,
Michael Nyman, Mike Garson, Thomas Newman, and Jonsi & Alex.
Keith Bates, my partner and love. Home is not just what I write about, but what we have
built together.
This work is dedicated to the loving memory of my dear friend Tommy Hay.
iv
TABLE OF CONTENTS
STATEMENT OF ORIGINALITY ................................................................................................ i STATEMENT OF AUTHORITY .................................................................................................. ii STATEMENT OF ETHICAL CONDUCT ................................................................................ iii ABSTRACT ........................................................................................................................................... ii ACKNOWLEDGEMENTS ............................................................................................................ iii Chapter 1: Introduction ....................................................................................................................... 1
1.1. Background .......................................................................................................................... 2 1.2. Significance of this Study .................................................................................................. 6 1.3. Study Scope and Aims ....................................................................................................... 6 1.4. Chapter Outline................................................................................................................... 8
Chapter 2: An Overview of Hobart, Tasmania ............................................................................ 10 2.1. Introduction ...................................................................................................................... 10 2.2. Climate of Tasmania........................................................................................................ 10 2.3. Socio-Economic Evaluation of Hobart ....................................................................... 24 2.4. Housing Stock of Hobart ............................................................................................... 25 2.5. Chapter Summary ............................................................................................................ 34
Chapter 3: Sustainable Housing Design ........................................................................................ 36 3.1. Introduction ...................................................................................................................... 36 3.2. Sustainability ..................................................................................................................... 38 3.3. Passive Design .................................................................................................................. 42 3.4. Climate ............................................................................................................................... 46 3.5. Building Site ...................................................................................................................... 47 3.6. Building Orientation and Shape .................................................................................... 47 3.7. Building Heat Flows ........................................................................................................ 55 3.8. Glazing ............................................................................................................................... 61 3.9. Building Materials and Thermal Mass .......................................................................... 66 3.10. Insulation ........................................................................................................................... 78 3.11. Passive Cooling ................................................................................................................ 88 3.12. Landscaping ...................................................................................................................... 96 3.13. Retrofitting ........................................................................................................................ 97 3.14. Solar Heating Systems ..................................................................................................... 98 3.15. Summary .......................................................................................................................... 108
Chapter 4: Thermal Comfort......................................................................................................... 110 4.1. Introduction: What is Thermal Comfort, and why is it of importance? ............. 110 4.2. Modelling Thermal Comfort ....................................................................................... 111 4.3. An Adaptive Approach to Thermal Comfort Modelling and Analysis ............... 117 4.4. Thermal Comfort Analysis Using Adaptive Principles ........................................... 121 4.5. Design for Thermal Comfort ...................................................................................... 126 4.6. Chapter Summary .......................................................................................................... 128
Chapter 5: Case Study Method ..................................................................................................... 129 5.1. Introduction .................................................................................................................... 129 5.2. Techniques for Designing the Case Studies ............................................................. 130 5.3. Selection of Participants ............................................................................................... 131 5.4. Occupant Background Information ........................................................................... 133 5.5. Building Profile Information ....................................................................................... 134 5.6. Building Temperature Data ......................................................................................... 135 5.7. Building Night-Time Surveys ...................................................................................... 136 5.8. Study Limitations ........................................................................................................... 141 5.9. Ethics Approval ............................................................................................................. 141
v
5.10. Pilot Studies .................................................................................................................... 142 5.11. Conclusion ...................................................................................................................... 142
Chapter 6: Case Study Results ....................................................................................................... 143 6.1. Case Study 1 – A Large Open Plan Home Designed by an Architect ................ 143 6.2. Case Study 2 – A Medium Sized Weatherboard Cottage ....................................... 161 6.3. Case Study 3 – A Medium Sized Two Storey Double Brick Home .................... 178 6.4. Case Study 4 – A Small Brick Veneer House with Attached Sun Room on a
North Facing Slope ....................................................................................................... 191 6.5. Case Study 5 – A Small Double Brick House with Attached Sun Room in an
East-West Running Valley ........................................................................................... 200 6.6. Case Study 6 – A Modern Top-Storey Unit ............................................................. 214 6.7. Case Study 7 – A Medium Sized Modern Three Storey Concrete Block Dwelling
226 6.8. Case Study 8 – Government Housing Estate Incorporating Sustainability
Principles into its Design .............................................................................................. 232 6.9. Chapter Summary .......................................................................................................... 241
Chapter 7: Discussion and Conclusion ....................................................................................... 242 7.1. Research aims and objectives ...................................................................................... 242 7.2. Research Themes ........................................................................................................... 242 7.3. Hypotheses ...................................................................................................................... 250 7.4. The Role of Thermal Mass in Improving Thermal Comfort in Tasmania‟s
Housing Stock ................................................................................................................ 253 7.5. New Knowledge, Limitations and Opportunities for Further Research ............ 257 7.6. Conclusion ...................................................................................................................... 258
REFERENCES ............................................................................................................................... 259 Appendix 1: PRELIMINARY SURVEY DATA SHEET ..................................................... 268 Appendix 2: BUILDING ANALYSIS DATA SHEET ......................................................... 269 Appendix 4: CONSENT FORM ................................................................................................. 273 Appendix 5: INFORMATION SHEET .................................................................................... 274
TABLE OF FIGURES
Figure 2.1: Tasmania Mean Maximum Temperatures, 1 October 2007 to 30 September 2010............................................................................................................................................. 12
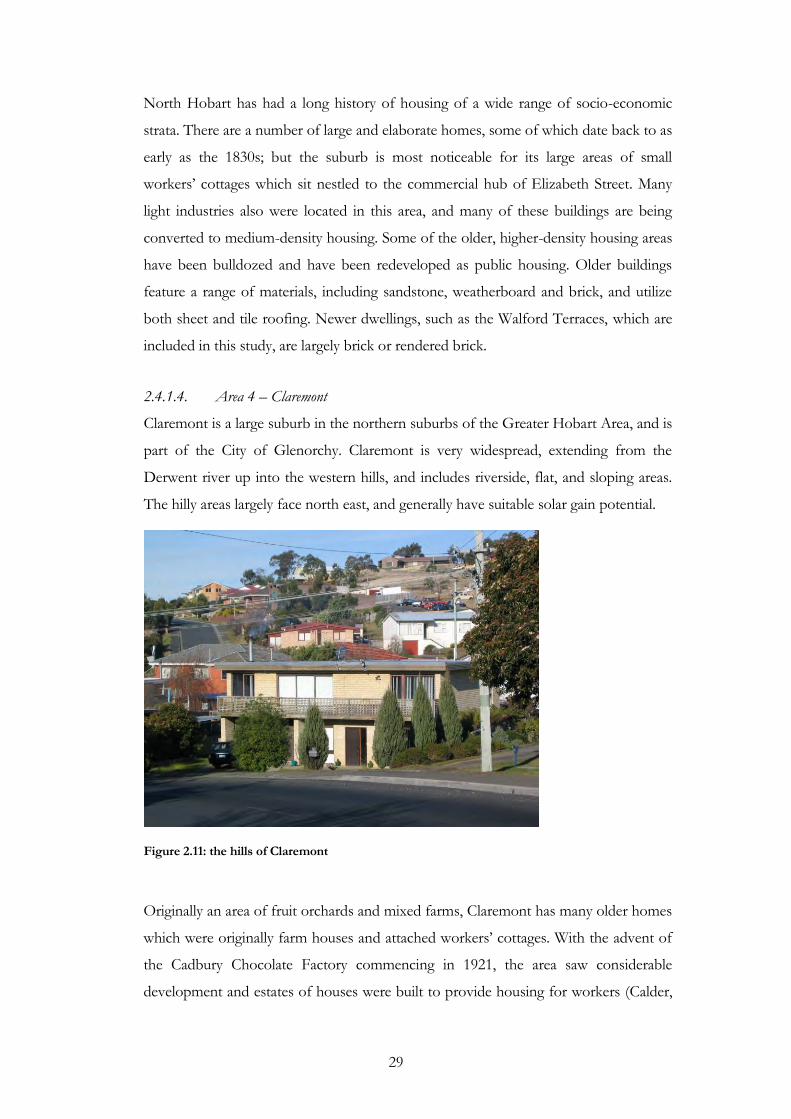
Figure 2.2: Mean Minimum Temperatures, 1 October 2007 to 30 September 2010............ 13 Figure 2.3: Tasmanian Rainfall Totals (mm), 1 October 2007 to 30 September 2010. ........ 14 Figure 2.4: Greater Hobart Area ..................................................................................................... 16 Figure 2.5: Hobart Mean Maximum Monthly Temperatures 1881-2010 ............................... 17 Figure 2.6: Hobart Mean Minimum Monthly Temperature (ºC) 1882-2010 ......................... 18 Figure 2.7: Hobart Mean Number of Cloudy Days 1893-2010 ................................................ 19 Figure 2.8: Hobart Mean Monthly Rainfall 1882-2010 .............................................................. 20 Figure 2.9: the Hillside of Sandy Bay ............................................................................................. 26 Figure 2.10: A valley in South Hobart showing shaded houses on the south facing slope . 28 Figure 2.11: the hills of Claremont ................................................................................................. 29 Figure 2.12: a dwelling in the newer area of Claremont ............................................................. 30 Figure 2.13: Overlooking Austins Ferry, showing the prevalence of black tiled roofs ........ 31
Figure 3.1: Influence of the Sun on Seasonal Variation 48 Figure 3.2: Seasonal Paths of the Sun 49
vi
Figure 3.3: Seasonal Angles of the Sun 50 Figure 3.4: Recommended Building Zoning 53 Figure 3.5: Eaves as a Summer Shade 54 Figure 3.6: Solar Energy and Solid Objects 57 Figure 3.7: Re-Radiation and the Building's Greenhouse Effect 60 Figure 3.8: Louvres as a Seasonal Shading Device 62 Figure 3.9: Plantings for Appropriate Light & Shade 64 Figure 3.10: North Facing Clerestory Windows in a Skillion Roof to Allow Solar
Penetration 66 Figure 3.11: Common Wall Types 70 Figure 3.12: Internal Walls as a Source of Thermal Mass for Direct Solar Gain 71 Figure 3.13: Water as a Source of Thermal Mass 73 Figure 3.14: Insulation in Ceiling Cavity 83 Figure 3.15: Under-Floor Insulation in Timber Floor Building 84 Figure 3.16: Slab Insulation 85 Figure 3.17: Ideal Flow of Air Across Building Interior 94 Figure 3.18: Cooling Ventilation from Courtyard 95 Figure 3.19: Basic Direct Gain System 99 Figure 3.20: Modified Greenhouse 102 Figure 3.21: Semi-Enclosed Sunspace 103 Figure 3.22: Basic Thermal Storage Wall 105 Figure 3.23: Thermal Storage Wall with Ducts 106
Figure 6.1.1: Case Study 1 - Building Layout.............................................................................. 145 Figure 6.1.2: Spring Study – Internal Data Logger .................................................................... 148 Figure 6.1.3: Weather Station Temperature Data 5/06/2006 1(BOM, 2010e) ................... 148 Figure 6.1.4: Dry Bulb Temperatures by Room ........................................................................ 149 Figure 6.1.5: Humidity by Room .................................................................................................. 149 Figure 6.1.6 Weather Station Humidity Data 5/06/2006 (BOM, 2010e) ............................. 150 Figure 6.1.7: Summer Study – Internal Data Logger ................................................................ 153 Figure 6.1.8: Summer Study - External Data Logger ................................................................ 153 Figure 6.1.9: Weather Station Temperature Data 11/12/2006 (BOM, 2010e) ................... 154 Figure 6.1.10: Summer Study - Dry Bulb Temperatures by Room ....................................... 154 Figure 6.1.11: Summer Study - Humidity by Room .................................................................. 155 Figure 6.1.12: Weather Station Humidity Data 11/12/2006 (BOM, 2010e) ....................... 155 Figure 6.1.13: Winter Study - External Data Logger ................................................................ 157 Figure 6.1.14: Weather Station Temperature Data 14/05/07 (BOM, 2010e) ..................... 158 Figure 6.1.15: Winter Study - Dry Bulb Temperatures by Room ........................................... 158 Figure 6.1.16: Winter Study - Humidity by Room .................................................................... 159 Figure 6.1.17: Weather Station Humidity Data 14/05/07 (BOM, 2010e) ............................ 159
Figure 6.2.1: Case Study 2 - Building Layout.............................................................................. 162 Figure 6.2.2: Spring Study - Internal Data Logger ..................................................................... 165 Figure 6.2.3: Spring Study - External Data Logger ................................................................... 165 Figure 6.2.4: Dry Bulb Temperature by Room .......................................................................... 166 Figure 6.2.5: Weather Station Temperature Data 03/10/2006 (BOM, 2010e) ................... 166 Figure 6.2.6: Humidity by Room .................................................................................................. 167
vii
Figure 6.2.7: Weather Station Humidity Data 03/10/2006 (BOM, 2010e) ......................... 167 Figure 6.2.8: Autumn Study - Internal Data Logger ................................................................. 169 Figure 6.2.9: Autumn Study - External Data Logger ................................................................ 170 Figure 6.2.10: Dry Bulb Temperature by Room ........................................................................ 170 Figure 6.2.11: Weather Station Temperature Data 03/04/2010 (BOM, 2010e) ................. 171 Figure 6.2.12: Humidity by Room ................................................................................................ 171 Figure 6.2.13: Weather Station Humidity 03/04/2007 (BOM, 2010e) ................................. 172 Figure 6.2.14: Winter Study - Internal Data Logger .................................................................. 174 Figure 6.2.15: Winter Study - External Data Logger ................................................................ 174 Figure 6.2.16: Dry Bulb Temperature by Room ........................................................................ 175 Figure 6.2.17: Weather Station Temperature Data 02/08/2007 (BOM, 2010e) ................. 175 Figure 6.2.18: Humidity by Room ................................................................................................ 176 Figure 6.2.19: Weather Station Humidity Data 02/08/2007 (BOM, 2010e) ....................... 176
Figure 6.3.1 Case Study 3 - Building Layout ............................................................................... 180 Figure 6.3.2: Spring Study - Internal Data Logger ..................................................................... 182 Figure 6.3.3: Spring Study - External Data Logger ................................................................... 183 Figure 6.3.4: Dry Bulb Temperature by Room .......................................................................... 183 Figure 6.3.5: Weather Station Temperature Data 09/10/2006 (BOM, 2010e) ................... 184 Figure 6.3.6: Humidity by Room .................................................................................................. 185 Figure 6.3.7: Weather Station Humidity Data 09/10/2006 (BOM, 2010e) ......................... 185 Figure 6.3.8: Autumn - Internal Data Logger ............................................................................ 187 Figure 6.3.9: Autumn Study - Internal Data Logger ................................................................. 187 Figure 6.3.10: Dry Bulb Temperature by Room ........................................................................ 188 Figure 6.3.11: Weather Station Temperature 04/05/2007 (BOM, 2010e) ........................... 188 Figure 6.3.12: Humidity by Room ................................................................................................ 189 Figure 6.3.13: Weather Station Humidity Data 04/05/2007 (BOM, 2010e) ....................... 189
Figure 6.4. 1: Case Study 4 - Building Layout ............................................................................ 193 Figure 6.4.2: Autumn Study – Internal Data Logger ................................................................ 196 Figure 6.4.3: Autumn Study - External Data Logger ................................................................ 196 Figure 6.4.4: Dry Bulb Temperatures by Room ........................................................................ 197 Figure 6.4 5: Weather Station Temperature Data 15/03/2007 (BOM, 2010e) ................... 197 Figure 6.4.6: Humidity by Room .................................................................................................. 198 Figure 6.4.7: Weather Station Humidity Data 15/03/07 (BOM, 2010e) .............................. 198
Figure 6.5.1: Case Study 5 - Building Layout.............................................................................. 202 Figure 6.5.2: Spring Study - Internal Data Logger ..................................................................... 205 Figure 6.5.3: Dry Bulb Temperatures by Room ........................................................................ 206 Figure 6.5.4: Room A - External Sun Room Temperatures .................................................... 206 Figure 6.5.5: Weather Station Temperature Data 02/10/2006 (BOM, 2010e) ................... 207 Figure 6.5.6: Humidity by Room .................................................................................................. 207 Figure 6.5.7: Weather Station Humidity Data 02/10/2006 ..................................................... 208 Figure 6.5.8: Summer Study - Internal Data Logger ................................................................. 210 Figure 6.5.9: Summer Study - External Data Logger ................................................................ 210

viii
Figure 6.5.10: Dry Bulb Temperatures by Room ...................................................................... 211 Figure 6.5.11: Weather Station Temperature Data 21/02/2007 (BOM, 2010e) ................. 211 Figure 6.5.12: Humidity by Room ................................................................................................ 212 Figure 6.5.13: Weather Station Humidity Data 21/02/2007 (BOM, 2010e) ....................... 212
Figure 6.6.1: Case Study 6 - Building Layout.............................................................................. 215 Figure 6.6.2: Spring Study - Internal Data Logger ..................................................................... 218 Figure 6.6.3: Spring Study - External Data Logger ................................................................... 218 Figure 6.6.4: Dry Bulb Temperatures by Room ........................................................................ 219 Figure 6.6.5: Weather Station Temperature Data 12/10/2006 (BOM, 2010e) ................... 219 Figure 6.6.6: Humidity by Room .................................................................................................. 220 Figure 6.6.7: Weather Station Temperature Data 12/10/2006 (BOM, 2010e) ................... 220 Figure 6.6. 8: Autumn Study - Internal Data .............................................................................. 222 Figure 6.6.9: Autumn Study - External Data Logger ................................................................ 222 Figure 6.6.10: Dry Bulb Temperatures by Room ...................................................................... 223 Figure 6.6.11: Weather Station Temperature Data 27/03/2007 (BOM, 2010e) ................. 223 Figure 6.6.12: Humidity by Room ................................................................................................ 224 Figure 6.6.13: Weather Station Humidity Data 27/03/2007 (BOM, 2010e) ....................... 224
1
Chapter 1: Introduction
Thermal mass is one physical factor that impacts on the thermal environment within a
building, and subsequently the thermal comfort of occupants. Thermal mass refers to
solid elements used in the construction of houses or other buildings that store
incoming energy from the sun or other sources, and later release this energy as heat
(Givoni, 1991, Givoni, 1998). The most commonly used materials for thermal mass are
water and masonry such as concrete, stone or brick (Anderson, 1980). Thermal mass,
along with north facing windows, is one of the main constituents of a passive heating
system, however, volumes and types of thermal mass can greatly affect the ease with
which comfortable living temperatures can be maintained in the majority of residential
buildings (Reardon et al., 2005, Smith, 2009).
Thermal comfort is widely recognised as a psychological state where an individual is
satisfied with the body‟s thermal environment (de Dear, 1998). This can include a
number of factors and extend further than being a simple reaction to air temperature.
Personality, culture, and mood, along with other social and individual differences all
influence a person‟s level of thermal comfort. Because of these factors and the relative
difficulty in comprehensively defining thermal comfort, methods of analysis of thermal
comfort are often quite involved and complex (de Dear, 1998). Thermal comfort
analysis can yield important information for the design of residential buildings that are
thermally efficient, generating suitable thermal comfort levels for inhabitants (Tuohy et
al., 2008). Incorrect analysis of thermal comfort in the design of buildings can result in
many problems including the unnecessary installation of air conditioning and heating
units, as well as dissatisfaction with the thermal climate of the dwelling. Overall, the
more comprehensive the knowledge of thermal comfort, the more effectively and
efficiently buildings can be designed (Ong, 1995, Tuohy et al., 2008).
Passive design is the implementation of design features into buildings so that they
utilise and work in collaboration with natural processes to provide natural sources of
heating, ventilation and lighting (Beggs, 2007, Garcia-Hansen et al., 2002). Passively
designed buildings should run with a minimum of energy input, and provide a
thermally comfortable and healthy living environment for residents. Passive design
principles include: the correct orientation of buildings to assist them in working with
2
natural processes, such as the movement of the sun the use of natural air flows; the use
of glazing to allow solar radiation to penetrate the building envelope for heating and
lighting; the implementation of correctly placed thermal mass to thermoregulate the
internal thermal environment of the building; and the control of air currents in and out
of, and within the building, providing natural ventilation or prevent unwanted
exchange of air between the internal and external environments where appropriate
(Baker and Standeven, 1996, Balcomb, 1984, Beggs, 2007, Hollo, 1995, Wrigley, 2005).
Passive solar systems are a subset of passive solar design, and are those solar heating
systems that collect and transport heat into the living space of buildings without the
use of mechanical means, and are unlike active systems which utilise mechanical and
electrical hardware to collect and transport solar energy (Yudelson, 2007)(Garcia-
Hansen et al., 2002, Mazria, 1979, Reardon et al., 2005). The two primary principles
employed by passive solar systems are the use of north facing glazing for maximum
solar access, and the presence of dark coloured thermal mass for the absorption,
storage and distribution of heat. Direct gain passive solar systems are those where the
living space and thermal mass are heated directly by incoming solar radiation during the
day, which is released into the air as it cools during the night time (Givoni, 1991,
Grimmer et al., 1978, Hollo, 1995). This is regarded as the more effective passive solar
system and centers on sunspace style design. Less effective are indirect gain systems,
where the thermal mass is located between the incoming solar radiation and the living
space, such as thermal storage walls and roof ponds (Henze et al., 2004, Hollo, 1995,
Sutton and McGregor, 1983).
1.1. Background
Historically, Tasmanians have perceived that they have access to inexhaustible and
cheap energy sources, and a culture of gratuitous energy consumption has evolved.
During much of the twentieth century, hydroelectricity was promoted as an
inexpensive and boundless source of domestic energy. This combined with a ready
supply of cheap firewood, and more recently the aggressive marketing of natural gas
supplies to urban areas, has promoted a culture, where it is considered sensible to
throw another log on the fire, or to turn up the central heating rather than addressing
3
thermal inefficiency and implementing passive design principles and practices to
achieve long term benefits and savings.
Furthermore, consumers have been dissociated from the non-financial impacts of
profligate energy consumption, and as a result air pollution, to which the consumption
of many fuel types contributes, has become more apparent. As climate change has
become more acknowledged, it has become evident that there is an increasing need and
desire to switch to renewable fuels and to reduce energy consumption wherever
possible (Crocombe, 2007, Dallas, 2008, Dupont and Pearman, 2006, Durmayaz et al.,
2000, Frank, 2005).
While responsibility for reductions in consumption and subsequent pollution is
frequently held to be a government responsibility, individual households contribute to
the total energy consumption of the country and subsequently the planet (Crocombe,
2007). The responsibility therefore cannot solely be relegated to government, who
instead should undertake such activities as regulating the building industry, and
facilitating and assisting householders to improve thermal efficiency (Ballinger et al.,
1992, Crocombe, 2007). Thermal design principles allow the individual to reduce their
personal energy consumption. Todd (1997) suggests that passive design techniques
such as the provision of direct gain sunspaces, and the proper implementation of
thermal mass are a practical way of reducing heating energy wastage, and providing as
much as 80% of heating requirements in residential buildings. Research in Tasmania by
Weaver (2004) has indicated that the implementation of passive design principles, even
as a retrofitting process, can result in health and comfort benefits, particularly to
younger building occupants. In addition to environmental benefits, the opportunity for
low consumption houses that yield significant financial benefit and improved living
conditions can make passive design principles attractive to homeowners (Crocombe,
2007, Givoni, 1991, Hollo, 1995, Mobbs, 2001, Wrigley, 2005).
With such benefits to the individual and to the environment, the question of why
thermal design principles are not more widely integrated into modern houses must be
asked. In other cultures the principles of thermal design have existed for centuries.
Native American dwellings in the US and Mexico have thermal mass to store solar
radiation and thermoregulate to minimise temperature fluctuations during the day and
night (Gray, 2002, Kosny et al., 2001). Despite this, principles of thermally efficient
design have been widely ignored in Tasmanian housing, and many houses are still being
4
built with ignorance to passive design principles. Tasmanian houses are varying in style,
building materials, and thermal efficiency, and include: heritage buildings of stone and
brick; weatherboard cottages; modern apartments; and brick veneer houses. Tasmania
has been slow to adopt new housing developments and technologies, and a majority of
Tasmanian houses have no insulation (Weaver, 2004).
One possible reason for the poor uptake of passive design features into houses is that
Tasmanian winters are considerably less hostile than in Europe, Asia and North
America at similar latitudes (BOM, 2010d). Despite this, Tasmanian houses frequently
require more energy expenditure on heating than necessary to maintain thermal
comfort. Tasmania has mild summers with, low rainfall, and sea breezes in coastal
areas; and winters that are free of extreme cold, particularly in comparison to similar
latitudes in the northern hemisphere (ABS, 2006a). While Tasmania‟s climate can be
uncomfortably cold, it is less likely to be life threatening than the colder areas of
Europe (BOM, 2010d). Therefore, Tasmanians may have viewed it as less imperative
to implement passive solar and other thermal design principles into housing design as it
is primarily a matter of comfort, savings and environmental gain, rather than of
survival.
Information regarding the financial, social, and health benefits of implementing
thermally efficient and passive solar design has also been slow to disperse and in many
cases resisted, despite the efforts of dedicated organizations such as the Australia and
New Zealand Solar Energy Society (ANZSES) and Sustainable Living Tasmania.
Disinformation regarding the additional cost of implementing such design, at both the
construction stage and during retrofitting, has potentially been disconcerting to
prospective and current home owners. Practitioners in both the housing design and
building industries are sometimes unaware of, or unresponsive to, new developments
in thermal design.
In Tasmania, issues within the housing industry have also affected the uptake and
implementation of thermal efficiency principles. Since the 1950s, the number of new
houses being constructed surpassed the number sufficient to account for population
growth. As a result Tasmania‟s building industry experienced a severe slump in the
1990s due to a glut of available housing (ABS, 2008c). From 1996 to 1997, approvals
for new buildings dropped to the lowest they had been in 20 years (ABS, 2008b). The
small number and the slow rate of construction of new dwellings did little to facilitate

5
the uptake of new design principles, including those of passive design. The capital city
of Tasmania, Hobart, situated at the foot of Mt Wellington and on the River Derwent,
in the south of the state, is characterised by older housing stock with little or no
insulation; poor solar access; and inappropriate application of thermal mass. As a result
of this local climate and the lack of implementation of principles of passive design,
houses in Hobart frequently consume large amounts of firewood and electricity to
maintain thermal comfort levels (Todd, 1997, Weaver, 2004).
The housing explosion of the early 2000s lead by mainland investors and people
desiring a “sea change”, has contributed to increased property values and construction
of new homes. Much of this construction activity has been centered around the larger
cities of Hobart, and Launceston and in the smaller towns and cities along North West,
and East Coasts, such as Burnie and Devonport (ABS, 2008b, ABS, 2008c). Housing
sales have risen since the late 1990s and from 2003 to 2004 there were 22,954 property
sales in Tasmania. This was a substantial increase of 10,835 from the number of
housing sales from 1999-2000 (ABS, 2006q). From 2003-04 there was $489.1 million
worth of residential building construction work undertaken, an increase of $170.3
million (53.4%) from $318.8 million from 2002-03 and an increase of $255.1 million
(109.0%) from $234.0 million from 1999-2000 (ABS, 2006r).
Of the residential building construction carried out in Tasmania in 2003-04, $350.2
million (71.6%) was for new houses, $96.7 million (19.8%) was for alterations and
additions to residential buildings, and $42.2 million (8.6%) was for other new
residential buildings (ABS, 2006r). This increase both in property sales and new
construction means that despite the slump in housing in the late 1990s supporting the
push to focus on retrofitting existing houses, there is considerable rationale to focus on
ensuring that new houses are constructed using principles of thermally efficient design,
while continuing retrofitting to improve the thermal efficiency of existing building
stock.
Home ownership may also increase the desire and capacity of householders to
implement principles of thermal efficiency both in the construction of new dwellings as
well as in retrofitting earlier constructions. Owner occupancy encourages the
householder to update and upgrade as they will reap the benefits of financial outlay,
because of savings in energy expenditure. In 2001 there were 181,174 occupied private
dwellings in Tasmania. 75,331 (41.6%) were fully owned, 51,153 (28.2%) were being
6
purchased, and 43,650 (24.1%) were rented. (ABS, 2006p). Given appropriate
dissemination of information, this high level of home ownership indicates that there is
a large potential for householders to take on board, understand and implement
thermally efficient designs; or to retrofit their homes.
1.2. Significance of this Study
Because of the way cities historically have expanded in Australia, unrestricted by land
shortages 98% of the population live in self-contained dwellings, and 78% of
residential buildings are free standing houses (ABS, 2009b). Hobart has the highest
percentage of freestanding residential buildings of any capital city, with 85% being
separate houses (ABS, 2009b). The residential sector also accounts for 9.8% of
electricity consumption (938.4 million kWh) in Tasmania (ABS, 2002). This means that
energy efficient house design is an important step in reducing energy consumption and
resultant greenhouse gas emissions. Because heating makes up a majority of the energy
expenditure in residential buildings, passive solar heating is the single most effective
way of reducing the home energy expenditure of a residence.
Passive design also yields many other social, economic and environmental benefits.
Individuals living in a well-designed, thermo-regulated environment, with the ability to
affect control over their thermal environment, experience higher levels of thermal
comfort. This control, coupled with lower temperature fluctuations means that
householders will generally have better health and be subject to illness far less often.
Decreased expenditure on fuel such as electricity, firewood and gas will provide
environmental benefits such as reductions in greenhouse emissions and other pollution
as well as being of financial benefit to the householder.
1.3. Study Scope and Aims
Materials capable of capturing and storing thermal energy that make up the structure of
residential buildings have significant impact on their internal environment. This
thermal mass affects the air temperature, radiant temperature, and humidity. These
factors in turn impact on the thermal comfort of individuals within the building.

7
Thermal mass can minimise fluctuations of these conditions, which in turn can
increase thermal comfort of occupants.
This study includes a series of case studies that examine the impact that the thermal
mass of a building has over the thermal comfort levels of building occupants. It takes
the form of eight case studies examining ten buildings from a range of building types,
with a variety of occupants. These case studies accept the adaptive approach to the
study of thermal comfort, which recognises that building occupants are not inert
subjects in a thermal environment, and can actively influence their surroundings to
optimise their thermal comfort levels (de Dear and Brager, 2001, Humphreys, 1995b,
Tuohy et al., 2008).
The case studies gathered a mix of qualitative and quantitative data, to allow analysis of
the thermal comfort of building occupants, and how thermal comfort levels are
influenced by the thermal mass of the building. Occupants were interviewed at the
outset of each study, and information was gathered on their satisfaction with the
thermal performance of the building, their history that may affect their acclimatisation
to the local climate, and their behavioural traits that may affect how they adapt to the
building‟s thermal environment. Data loggers recorded seasonal temperature in the
living spaces of these buildings, to allow fluxes in temperature to be recorded. Night
time studies were undertaken seasonally where: air and surface temperature, humidity,
and globe temperature recordings were made throughout the building; occupants were
observed, with reference to their interaction with the thermal environment, their
clothing levels, and their activity levels; occupants were regularly questioned regarding
their thermal comfort levels.
The first aim of this research is to determine the thermoregulatory effect of thermal
mass in residential buildings. The second aim of this research is to determine the
impact of thermal mass on the thermal comfort levels of building occupants.
The objectives of this research are, therefore, to compare the performance of thermal
mass across different types of houses in Tasmania, examining the habits and activities
of occupants with regard to thermal comfort, and critically determine optimal thermal
mass volumes, placement and type that should be applied by architects and housing
designers.

8
To achieve this four hypotheses have been posited:
in cool climates, increased volumes of appropriately applied thermal mass will lead
to increased radiative emissions that will enhance thermal comfort by
thermoregulation;
insufficient thermal mass and solar access results in the increased use of active
heating systems, and the reduced acclimatising of the occupant to local
temperatures;
low volumes of thermal mass and solar access result in lower levels of thermal
comfort; and
excessive thermal mass and insufficient solar access results in lower levels of
thermal comfort.
1.4. Chapter Outline
Chapter 2 examines the climatic, geographic, social, and economic setting of Hobart,
Tasmania, Australia, with regard to residential housing and heating systems. This
chapter examines the various factors that have contributed to the existing state of
housing, presents an analysis of the existing housing stock of Hobart, and explains the
need for the implementation of passive solar design within the context of the study
location.
Chapter 3 examines the principles of passive design, its integration into both modern
and ancient buildings, and why it is such an important factor in building design. This
chapter examines the principles that can be implemented in new and existing housing
to improve sustainability, and how climate, building orientation, glazing, thermal mass,
insulation, and ventilation impact on thermal comfort within a building.
Chapter 4 examines the definitions and principles of thermal comfort, how it is
analysed, and how individuals control and adapt to their thermal environment. This
chapter explores the paradigm shifts in how thermal comfort is both perceived and
measured over time, and introduces the relationship between thermal comfort and
9
thermal mass. In understanding thermal comfort, there can be a better analysis of the
impact of passive design features such as thermal mass.
Chapter 5 details techniques for conducting case studies, including the gathering of
physical data, interviewing techniques and observations. This chapter also explains the
method for a series of case studies that examined the thermal performance of a series
of dwellings in Hobart, and the corresponding behaviour of the occupants in
modifying their thermal environment.
The results of the survey are presented in Chapter 6, including data on the case study
houses, as well as a government housing estate known as the Walford Terraces. This
chapter draws themes from each case study.
Chapter 7 discusses the results of the case studies presented in the previous Chapter. It
draws together similar themes from each case study, uses them to address the
hypotheses presented in Chapter 1, and presents the conclusions of the study. This
chapter will examine the case studies and present guidelines and considerations for
determining optimal thermal mass volumes, placement and types in residential housing
design.
10
Chapter 2: An Overview of Hobart, Tasmania
2.1. Introduction
In a study so influenced by climatic and geographic factors, it is important to provide a
context for the case studies and assist in the interpretation of the case studies presented
in Chapter 6, that the immediate and surrounding locale is explained. The aim of this
chapter is to provide a context for the case studies used in the thesis. The chapter
commences with an examination of the climate and geography of Hobart. This is
followed by an examination of cultural and socio-economic factors relevant to the
study and a critical assessment of the existing housing stock.
2.2. Climate of Tasmania
Tasmania is the southernmost state of Australia, and is located at a latitude of 40°
south and 144° east. It is an island state that is separated from mainland Australia by
Bass Strait, a distance of roughly 250km. Tasmania features a mild maritime climate
with discernable seasons, but is located in the “Roaring Forties”, a maritime wind
steam that circles the Earth. The west coast of Tasmania has one of the highest
rainfalls of any place in the world (see Figure 2.1), however a rainshadow created by the
central highlands makes the east coast particularly dry (State of the Environment
Report 2009, Brand Tasmania, 2009). The westerly airstream brings varied rainfall
patterns, temperature and cloud levels. This results in cool, wet and cloudy weather in
the highlands on the west coast, and dryer, sunnier and milder weather on the East
coast and in lowlands.
This section draws largely from data obtained and interpreted by the Australian Bureau
of Statistics (ABS) and the Australian Bureau of Meteorology (BOM). The BOM has
weather stations across Tasmania, including several around Hobart. Weather stations at
Ellerslie Rd (Battery Point), Mount Wellington and the Hobart Airport are of particular
importance for this research.
Tasmania‟s summers are relatively mild, with sporadic hot periods, and lower rainfall
(especially in the north and north-west), and afternoon sea breezes in coastal areas.
11
Tasmanian winters are not excessively cold, particularly in comparison to counterparts
in the northern hemisphere with the same latitude, although cold fronts brought across
the state by westerly winds occasionally cause cold spells and snow to low altitudes
(ABS, 2006a).
The three main influences on Tasmania's temperature are: the proximity to the sea,
which gives milder temperature regimes to coastal locations than inland ones; elevated
locations that are generally cooler, as increases in altitude result in decreases in
temperature; and lower daytime temperatures in the west because of increased cloud
cover. The central plateau has particularly low temperatures as it is distant from the sea
which moderates the temperature of coastal areas.
Temperatures also increase in the south and south-east of the state when air is carried
south from the mainland. This occurs when high pressure systems over the Australian
mainland move air in a southerly direction over Tasmania. The lower layers of this air
are cooled as they pass over Bass Strait and while they warm the south of the state,
they moderate the temperatures of the north. (ABS, 2006k). Figure 2.1 shows the mean
maximum temperatures across Tasmania from 1 October 2007 until 30 September
2010. It shows cooler maximum temperatures of 9°C in elevated locations, and
maximum temperatures of 12°C down the western side of the state (BOM, 2010a).
12
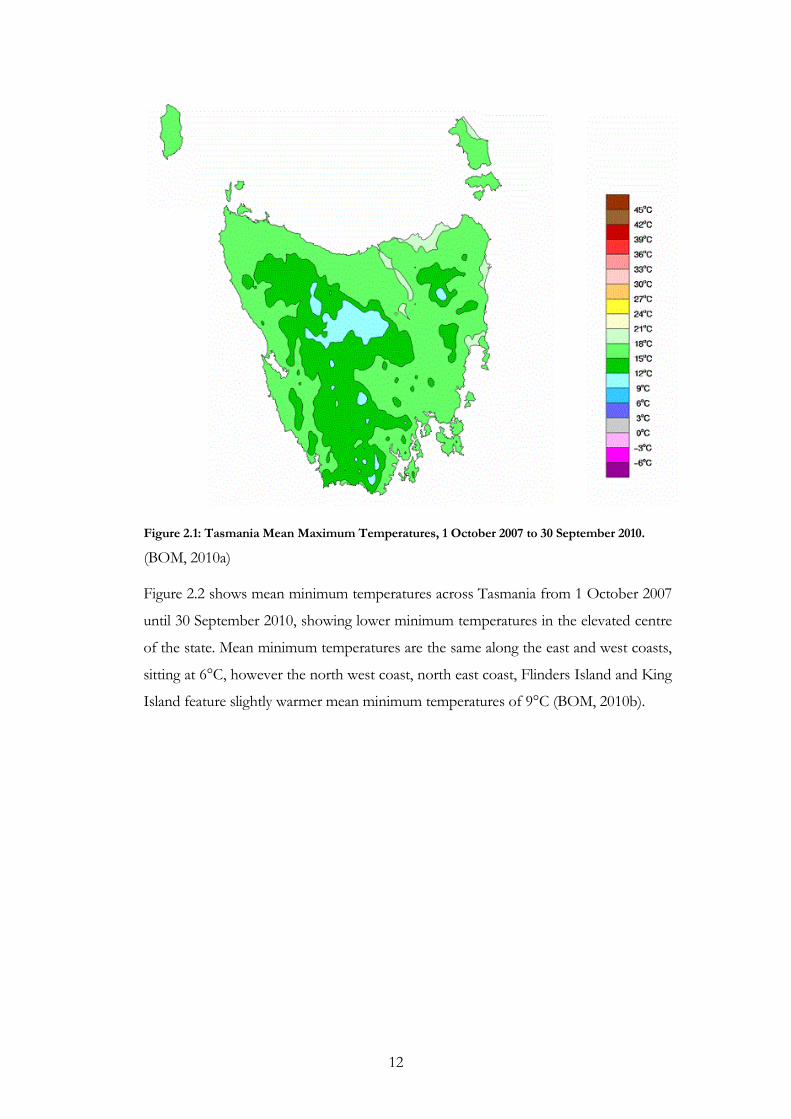
Figure 2.1: Tasmania Mean Maximum Temperatures, 1 October 2007 to 30 September 2010.
(BOM, 2010a) Figure 2.2 shows mean minimum temperatures across Tasmania from 1 October 2007
until 30 September 2010, showing lower minimum temperatures in the elevated centre
of the state. Mean minimum temperatures are the same along the east and west coasts,
sitting at 6°C, however the north west coast, north east coast, Flinders Island and King
Island feature slightly warmer mean minimum temperatures of 9°C (BOM, 2010b).
13
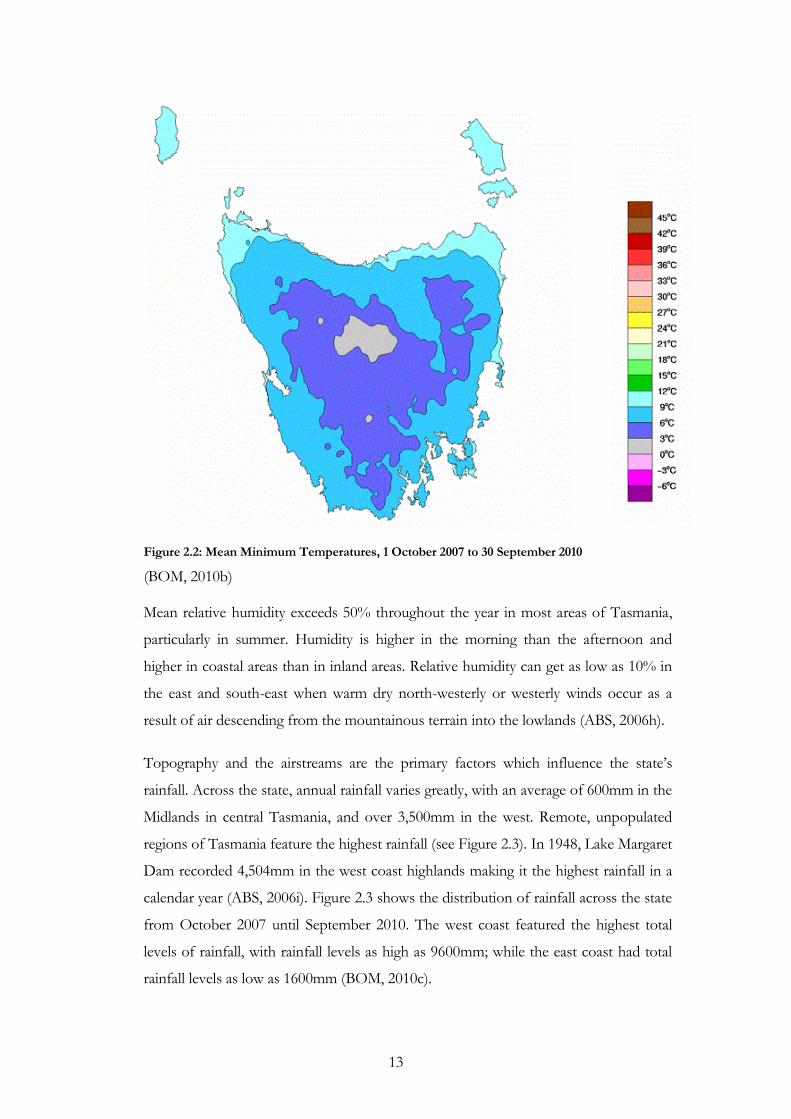
Figure 2.2: Mean Minimum Temperatures, 1 October 2007 to 30 September 2010
(BOM, 2010b) Mean relative humidity exceeds 50% throughout the year in most areas of Tasmania,
particularly in summer. Humidity is higher in the morning than the afternoon and
higher in coastal areas than in inland areas. Relative humidity can get as low as 10% in
the east and south-east when warm dry north-westerly or westerly winds occur as a
result of air descending from the mountainous terrain into the lowlands (ABS, 2006h).
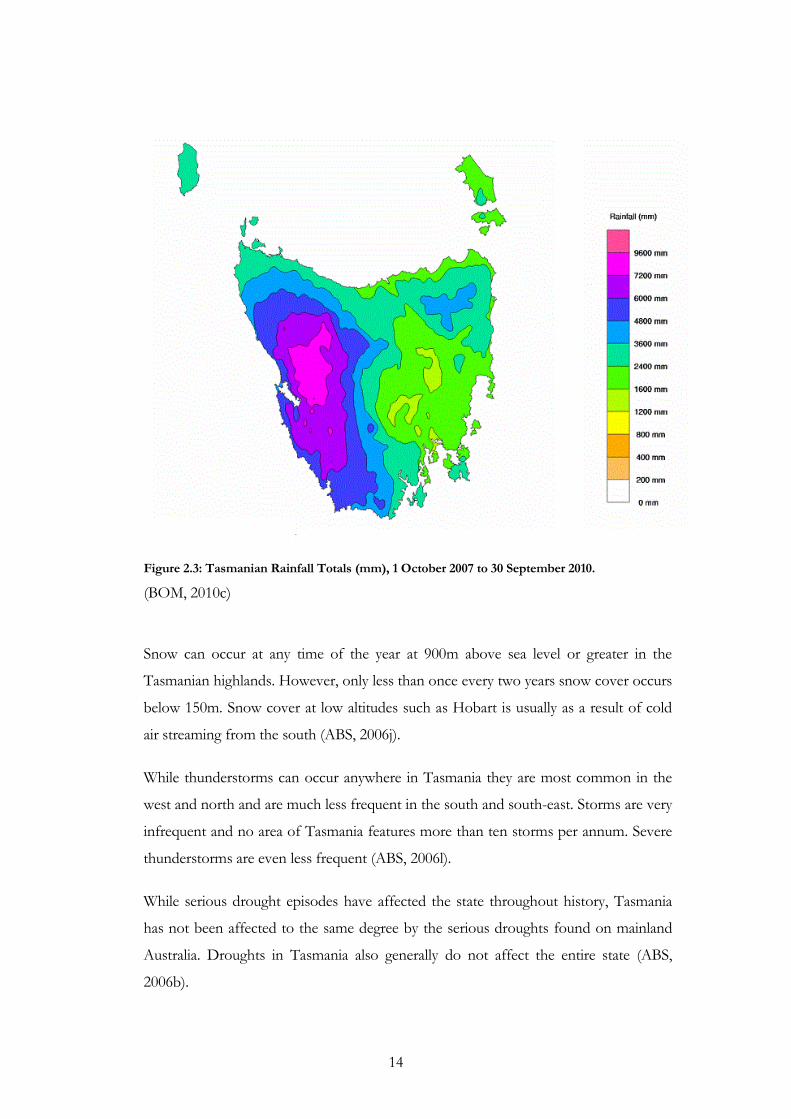
Topography and the airstreams are the primary factors which influence the state‟s
rainfall. Across the state, annual rainfall varies greatly, with an average of 600mm in the
Midlands in central Tasmania, and over 3,500mm in the west. Remote, unpopulated
regions of Tasmania feature the highest rainfall (see Figure 2.3). In 1948, Lake Margaret
Dam recorded 4,504mm in the west coast highlands making it the highest rainfall in a
calendar year (ABS, 2006i). Figure 2.3 shows the distribution of rainfall across the state
from October 2007 until September 2010. The west coast featured the highest total
levels of rainfall, with rainfall levels as high as 9600mm; while the east coast had total
rainfall levels as low as 1600mm (BOM, 2010c).
14
Figure 2.3: Tasmanian Rainfall Totals (mm), 1 October 2007 to 30 September 2010.
(BOM, 2010c)
Snow can occur at any time of the year at 900m above sea level or greater in the
Tasmanian highlands. However, only less than once every two years snow cover occurs
below 150m. Snow cover at low altitudes such as Hobart is usually as a result of cold
air streaming from the south (ABS, 2006j).
While thunderstorms can occur anywhere in Tasmania they are most common in the
west and north and are much less frequent in the south and south-east. Storms are very
infrequent and no area of Tasmania features more than ten storms per annum. Severe
thunderstorms are even less frequent (ABS, 2006l).
While serious drought episodes have affected the state throughout history, Tasmania
has not been affected to the same degree by the serious droughts found on mainland
Australia. Droughts in Tasmania also generally do not affect the entire state (ABS,
2006b).

15
Evaporation is highest at 1,500mm in the northern Midlands, Huon Valley and
Derwent Valley. Evaporation in western, central and southern areas is much lower,
usually under 750mm per year, and at around 15mm monthly in the winter and 100mm
in the summer (ABS, 2006c).
2.2.1. Climatology of Hobart
Hobart is located in the southeastern corner of the state of Tasmania at 42 degrees
south latitude and 147 degrees east latitude. Immediately south of Hobart is Storm Bay
and beyond is the Southern Ocean. Hobart is located near the mouth of the River
Derwent, at the base of Mount Wellington, and is surrounded by forested slopes.
Because of the rainshadow affecting the east coast of Tasmania, Hobart is the second
driest capital in the country (Brand Tasmania, 2009). The proximity of Storm Bay, the
Tasman Sea and the Southern Ocean give Hobart a cool maritime climate. Mount
Wellington has significant impacts on the local climate of Hobart. The close proximity
of this mountain brings: reduced rainfall, particularly in summer; increased cloud
cover; mountain breezes; and cooler temperatures (Critchfield, 1974, Meteorology,
2010, Brand Tasmania, 2009).
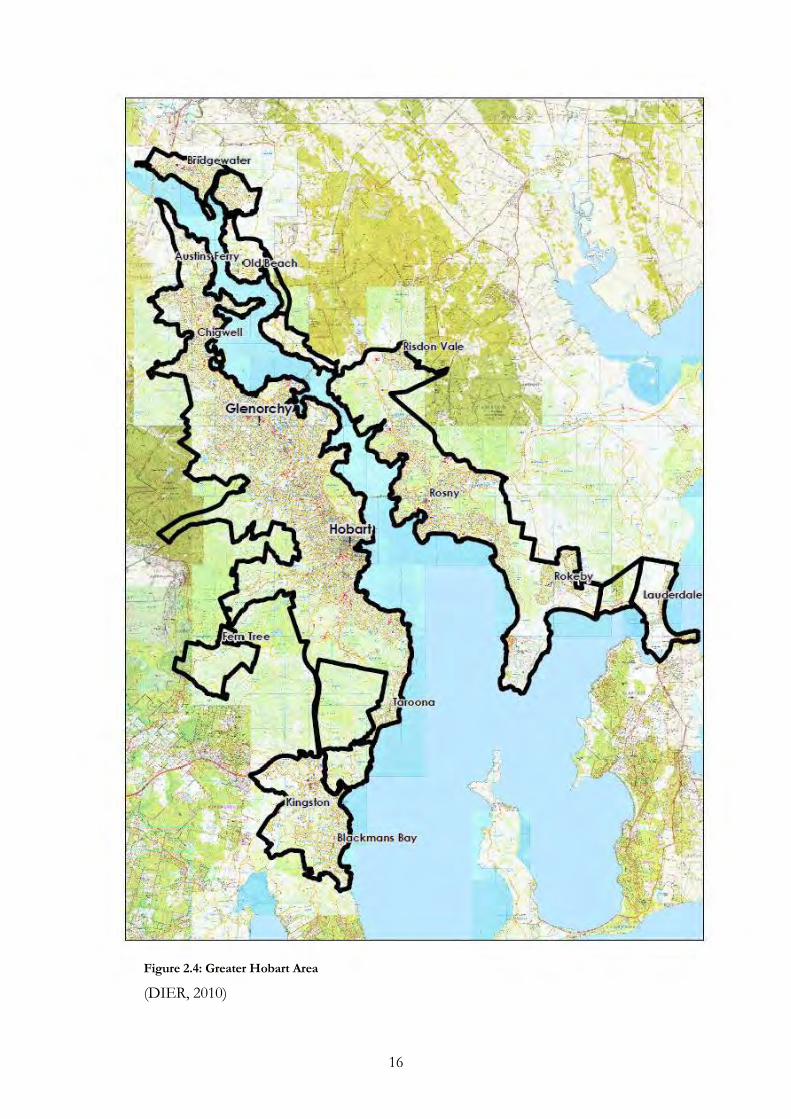
The Greater Hobart Area has urban and suburban development spreading: to the
north into the City of Glenorchy and the Municipality of Brighton: along the eastern
shore in the City of Clarence and; to the south in the Municipality of Kingborough
(see Figure 2.4).
16
Figure 2.4: Greater Hobart Area
(DIER, 2010)
17
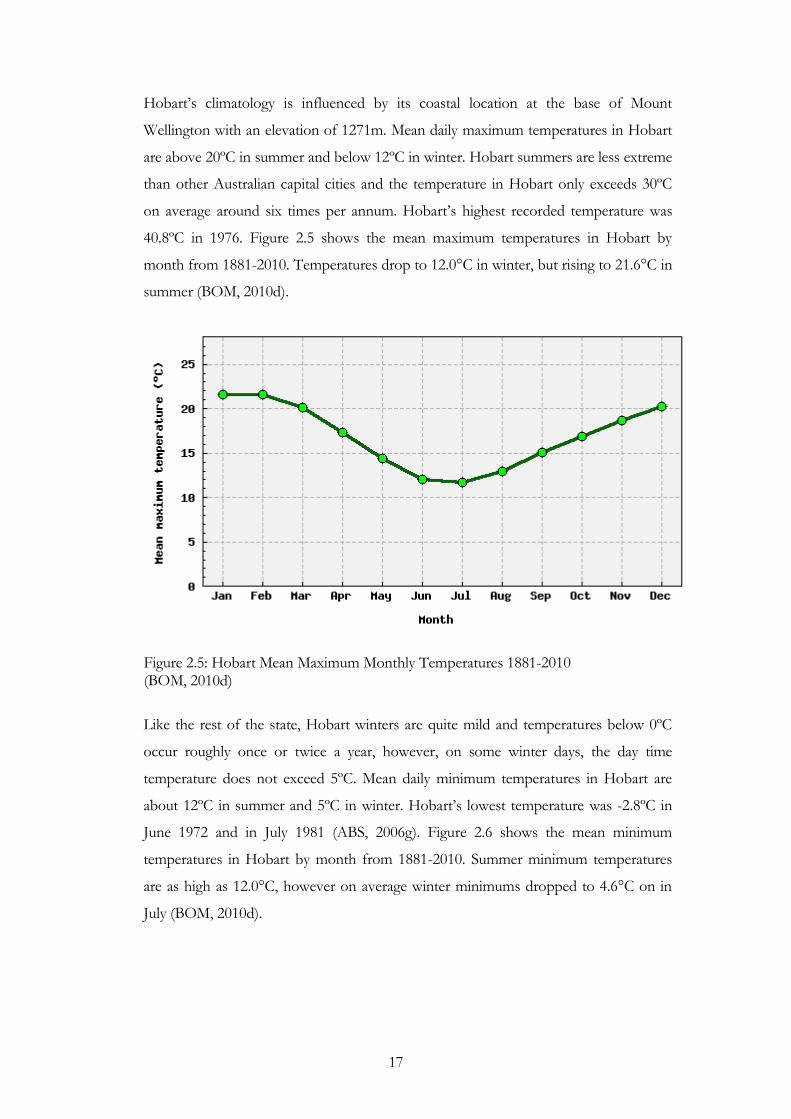
Hobart‟s climatology is influenced by its coastal location at the base of Mount
Wellington with an elevation of 1271m. Mean daily maximum temperatures in Hobart
are above 20ºC in summer and below 12ºC in winter. Hobart summers are less extreme
than other Australian capital cities and the temperature in Hobart only exceeds 30ºC
on average around six times per annum. Hobart‟s highest recorded temperature was
40.8ºC in 1976. Figure 2.5 shows the mean maximum temperatures in Hobart by
month from 1881-2010. Temperatures drop to 12.0°C in winter, but rising to 21.6°C in
summer (BOM, 2010d).
Figure 2.5: Hobart Mean Maximum Monthly Temperatures 1881-2010 (BOM, 2010d)
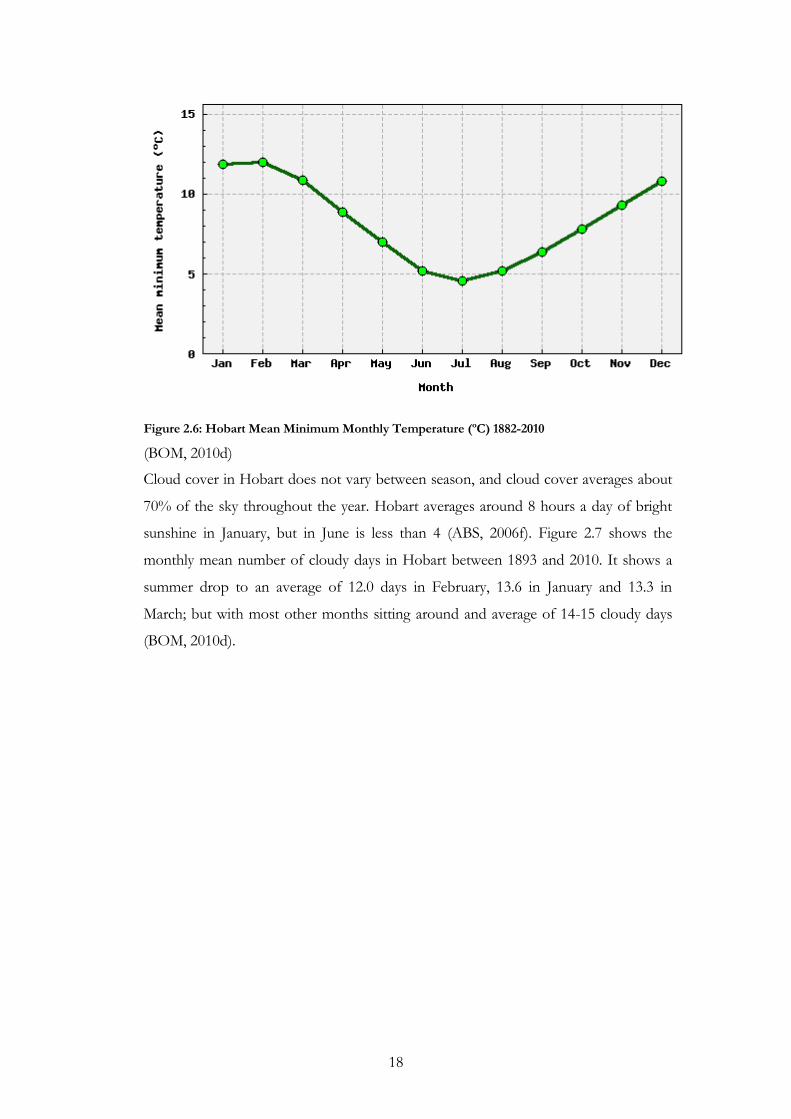
Like the rest of the state, Hobart winters are quite mild and temperatures below 0ºC
occur roughly once or twice a year, however, on some winter days, the day time
temperature does not exceed 5ºC. Mean daily minimum temperatures in Hobart are
about 12ºC in summer and 5ºC in winter. Hobart‟s lowest temperature was -2.8ºC in
June 1972 and in July 1981 (ABS, 2006g). Figure 2.6 shows the mean minimum
temperatures in Hobart by month from 1881-2010. Summer minimum temperatures
are as high as 12.0°C, however on average winter minimums dropped to 4.6°C on in
July (BOM, 2010d).
18
Figure 2.6: Hobart Mean Minimum Monthly Temperature (ºC) 1882-2010
(BOM, 2010d)
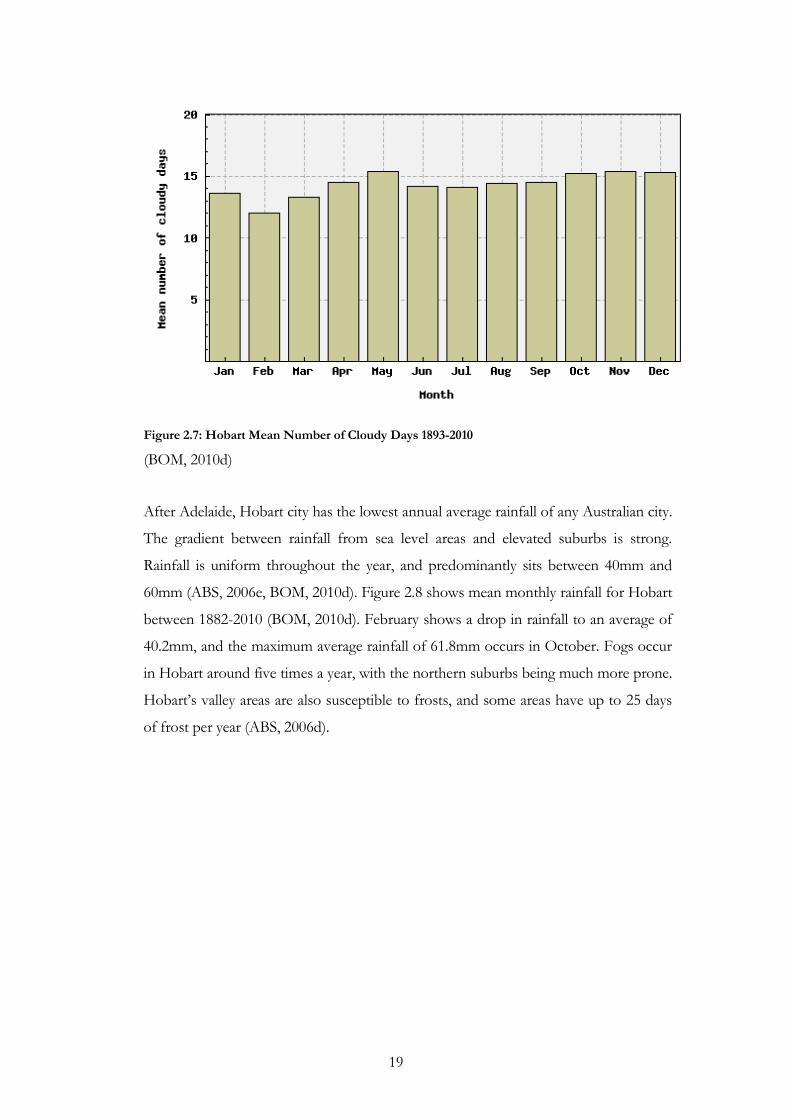
Cloud cover in Hobart does not vary between season, and cloud cover averages about
70% of the sky throughout the year. Hobart averages around 8 hours a day of bright
sunshine in January, but in June is less than 4 (ABS, 2006f). Figure 2.7 shows the
monthly mean number of cloudy days in Hobart between 1893 and 2010. It shows a
summer drop to an average of 12.0 days in February, 13.6 in January and 13.3 in
March; but with most other months sitting around and average of 14-15 cloudy days
(BOM, 2010d).
19
Figure 2.7: Hobart Mean Number of Cloudy Days 1893-2010
(BOM, 2010d)
After Adelaide, Hobart city has the lowest annual average rainfall of any Australian city.
The gradient between rainfall from sea level areas and elevated suburbs is strong.
Rainfall is uniform throughout the year, and predominantly sits between 40mm and
60mm (ABS, 2006e, BOM, 2010d). Figure 2.8 shows mean monthly rainfall for Hobart
between 1882-2010 (BOM, 2010d). February shows a drop in rainfall to an average of
40.2mm, and the maximum average rainfall of 61.8mm occurs in October. Fogs occur
in Hobart around five times a year, with the northern suburbs being much more prone.
Hobart‟s valley areas are also susceptible to frosts, and some areas have up to 25 days
of frost per year (ABS, 2006d).

20
Figure 2.8: Hobart Mean Monthly Rainfall 1882-2010
(BOM, 2010d)
2.2.2. Hobart weather for 2006
In order to provide a context for the case studies used in this research it is necessary to
present a summary of the weather for the period in which the experiments were
conducted. Seasons discussed in this section are the Australian seasons, running from
the beginning of the month in which they begin, rather than from the equinox or
solstice.
Hobart experienced a range of extremes in 2006, with wide ranging temperatures and a
number of extreme weather events. Most notably, Hobart, along with many other areas
of Tasmania, had the driest year on record, (Delfatti and Barnes-Keoghan, 2007). The
year began with very dry temperatures, punctuated with thunderstorms and snow
events. Hobart experienced the lowest January to November rainfall of 321.2mm,
against an average of 560.3mm. April and May featured cooler, wetter weather, before
the latter half of the year returned to exceptionally dry conditions. The year began with
warmer than average temperatures, but April plunged into an early winter with very
cold temperatures. Temperatures began to warm early, and September was above
average. Overall, temperatures were slightly above average (Delfatti and Barnes-
Keoghan, 2007).

21
2006 also featured cool nights, and once the warm start to the year ended, night time
temperatures began to drop well below average, and March was the beginning of a year
of cool nights. Clear skies and outbreaks of cold in October and November resulted in
a long period of cold nights and frosts. Overall, mean daily minimum temperatures
overnight were around normal in Hobart, despite being lower around the rest of the
state (Delfatti and Barnes-Keoghan, 2007).
Spring in 2006 was very dry, and featured a number of extreme days with high winds
and temperature. 11 and 12 October had particularly high temperatures. This extreme
combination of high winds and temperature resulted in bushfires, however,
temperatures dropped dramatically on 16 October and on 26 October there were
severe frosts. Nights were cold and minimum temperatures in Hobart reached 7.4°C
which is around 1.5°C lower than the spring time average of 8.6°C. October and
November both featured frost and hail events. Overall, because nights were so cold
and there were several extremely hot days, daytime temperatures were relatively normal
for Hobart, and were on average 0.5°C above average. The maximum spring
temperature was 33.1°C and minimum temperature was 2.1°C (Barnes-Keoghan,
2006). Rainfall was very low across the whole state, and Hobart was no exception,
experiencing one of its driest springs on record. Eleven locations recorded their lowest
spring rainfall on record, including Launceston, where rainfall was 81.0mm against a
spring average of 168.6mm. Thirty three locations recorded their lowest spring rainfall
for at least twenty years (Barnes-Keoghan, 2006).
2.2.3. Hobart weather for 2007
Hobart featured warm and dry conditions in 2007, with Tasmania having one of the
warmest years on record. Hobart missed out on the rain events that occurred in other
areas of the state, making it a particularly dry year – although not as dry as 2006. Total
rainfall for Hobart was 549.8mm against an average of 616.6mm. Both night time and
day time temperatures were above average in Hobart during this period. Maximum
temperatures were 0.6°C above the mean maximum of 14.5°C, and minimum
temperatures were 1.0°C above the mean minimum of 3.1°C (Barnes-Keoghan,
2008a).
Despite January, early December and Christmas featuring cold bursts, summer was
warmer than average, with locations in the north and north west recording their

22
highest summer mean daily minimum and mean daily maximum temperatures on
record. Hobart was 1.1°C despite January, early December and Christmas featuring
cold periods above its summer mean maximum of 22.2°C, and 0.9°C above its summer
mean minimum of 12.5°C. Similar to the preceding spring, night time temperatures
were frequently cool, although on average night time temperatures in January and
February were slightly warmer than normal, and summer temperatures in Hobart
ranged from 35.2°C maximum to 6.4°C minimum (Barnes-Keoghan, 2007c).
Despite a very dry December 2006, heavy showers and thunderstorms in January and
February resulted in above average summer rainfall for Hobart, where total rainfall was
171.2mm against a summer average of 145.3mm. Glenorchy featured the wettest day
of summer across the entire state, where a thunderstorm on the afternoon of January
21 deposited 96mm of rain (Barnes-Keoghan, 2007c).
Autumn 2007 was characterised by very warm temperatures, with autumn mean
maximum daytime temperatures of 30.7°C being 1.2°C above average, and autumn
mean minimum temperatures also higher of 10.4°C being 1.5°C higher than average
(Barnes-Keoghan, 2007a). All months featured temperatures of between 1.0°C and
3.0°C above average, driven by many instances of particularly hot days, however, the
constant warmth and lack of cool days in May meant that this was Hobart‟s warmest
autumn on record. These warm temperatures are attributed to a lack of cold fronts
normally present in autumn coupled with slow moving high pressure systems in the
Tasman Sea and Bass Strait which brought warm air from mainland Australia (Barnes-
Keoghan, 2007a). April was dry, but March and May featured high rainfall, and overall,
seasonal rainfall was close to average. There were westerlies bringing cold fronts and
showers in March, high pressure systems and cold fronts in April, and northwesterlies
in May (Barnes-Keoghan, 2007a). Rainfall for Hobart was 81.6mm, which is below the
autumn mean average of 143.4mm (Barnes-Keoghan, 2007a).
Winter in 2007 was drier and cooler than average, matching previous recent years.
Temperatures were mostly below average, despite several warm days and nights.
Maximum daytime temperatures were predominantly between 0.2°C and 0.5°C below
average. In late August however, Hobart feature some days with temperatures in the
low 20s (Barnes-Keoghan, 2007d). Night time temperatures were cold and frosty from
June until mid August, and were mostly below average by around 0.5°C (Barnes-
Keoghan, 2007d). Even though August featured flooding rain, rainfall was also below

23
average around the majority of the state. Despite this, Hobart featured slightly above
average rainfall (Barnes-Keoghan, 2007d).
Warm days were predominant in spring, and Hobart featured its highest spring mean
daily maximum temperature on record of 18.4°C, with maximum temperatures of
33.7°C. September and October did feature cold nights, with minimum temperatures
reaching 1.2°C (Barnes-Keoghan, 2007b). Hobart featured a below average rainfall,
with all months being particularly dry in Hobart. Total rainfall was 70.2mm, which is
just 53% of average spring rainfall (Barnes-Keoghan, 2007b).
2.2.4. Hobart weather for 2008
Hobart was warm and dry in 2008 and featured below average rainfall, as did the entire
state. There was considerable fluctuation in temperatures, but overall the temperatures
were above average and Tasmania‟s average temperature was in the top 20 warmest on
record (Barnes-Keoghan, 2008b).
Hobart experienced a warm summer with both December 2007 and January 2008
having maximum temperatures well above average. February was cooler, with
maximum temperatures 0.5°C to 1.0°C below average. Night time temperatures were
generally quite mild, with the exception of several very cool nights, and overall
temperatures were above average (Barnes-Keoghan, 2008c). Rainfall varied greatly
across the state, with some areas very wet and others quite dry. Hobart was one of the
drier areas, with the south east of the state missing out on the bigger rain events
(Barnes-Keoghan, 2008c).
Autumn featured very little rain, few major weather events, and temperatures slightly
above average. Winds of over 100km/h occurred in early April as a result of a low
pressure system. These winds caused a significant amount of damage in Hobart and
across the state (Webb, 2008).
Hobart featured record average daytime temperatures of as much as 1.5°C above
autumn average, reaching 18.7°C. It also had a particularly warm March, registering its
highest autumn daily temperature on record at 37.0°C (Webb, 2008). Night time
temperatures were very close to average, and generally no more than 0.5°C less than
average (Webb, 2008). Rainfall in Hobart was particularly low, reaching only 60.4mm
(Webb, 2008).
24
2.3. Socio-Economic Evaluation of Hobart
Hobart, the second oldest city in Australia (after Sydney), is the capital city of the
smallest of Australia‟s six states, and is the primary administrative and commercial
centre of Tasmania. Hobart was first settled by Europeans in 1803 at what is now
Risdon Cove. In 1804 settlers moved across the River Derwent to what is now Hunter
Island. By 1900 Hobart had a population of 36,060, which was 21% of the population
of Tasmania and functioned primarily as a shipping port (DPL, 2001). By the 1960s
Hobart had a population of 115,900 and had attracted large energy-intensive industries
such as pulp and paper mills and aluminum smelters (Lahmeyer, 2006). Hobart is
currently the largest city in Tasmania, with a population of 212,019 (ABS, 2009a).
Housing stock in Hobart, and the spread of residential areas, has been influenced by
changing industrial activity and growing population, and resultantly Hobart has a range
of housing styles with varying levels of thermal efficiency.
Around half of the population of Tasmania lives in the south of the state, with the
majority residing in the greater Hobart area. Population size, characteristics and
movement all impact housing prices and numbers. Population increases generally result
in a demand for the building of new houses (ABS, 2007). Between 1996 and 2006
Tasmania has experienced: an increase in birth rate; positive net migration; reduction in
household sizes, and; changes in family structure, with ABS (2007) reporting a rise of
population of3.1%, bringing the population from 474,400 to 488,900. In combination,
these factors have resulted in the need for more housing. The number of people in
Tasmanian households has decreased, meaning that the number Tasmanian of
households has increased at a higher rate than rate than population growth alone would
cause (ABS, 2007).
This study occurred prior to the global financial crisis in 2008, in a period of favourable
economic conditions that included economic growth and the lowest rates of
unemployment on record (Baily and Elliott, 2009). From 2000-01 until 2007-08 the
Tasmanian economy featured solid economic growth and unemployment rates in 2007
dropped as low as 4.3% (ABS, 2007).
25
Tasmanian incomes also increased, with average household 2005-06 incomes
increasing 14.3% from 2003-04 and 69.1% from 1999-2000 average household
incomes. As a result, confidence in making housing investments was high because of
employment and economic stability (ABS, 2007).
2.4. Housing Stock of Hobart
The type of houses in a locale will impact upon the health and comfort of occupants
and can greatly influence recommendations for retrofitting for improved thermal
performance. Few studies have been previously undertaken to examine building
materials, the function of such materials, and building design trends in Hobart,
however a study undertaken of building materials in Hobart in 1959 by the University
of Tasmania identified patterns of building materials existent at that time (Scott, 1959).
This study identified that the most predominant building materials were iron and
timber, with timber framed, weather board, iron roofed houses being the most
common. Georgian stone and brick buildings were common in the early days of
Hobart, as a result of regulations put in place by Governor Macquarie, however
weatherboard houses increased at the turn of the 20th Century to become the
predominant housing type (Scott, 1959). Since this study, brick, roof tiles, and concrete,
have emerged as more common building materials, and modern designs and building
materials such as mud brick, rammed earth, and straw bale are sporadically being used
but are still uncommon. These materials are discussed in further detail in Chapter 3.
2.4.1. Visual Examination
Visual examination was made of the housing stock of the Hobart Greater Area, in
collaboration with an architect and fellow postgraduate student. This examination was
undertaken over a period of three days, and includes notes that were handwritten and
made on a digital audio recorder, as well as photographs of each housing area. Because
of the short time frame however, the level of discernable information on each building
is limited, and focus was on general building types, building ages, block sizes and the
surrounding landscape. Six areas were examined on 26 June 2007, to give a
representation of the older and heritage housing in Hobart, as well as housing in newer
developments:
26
Area 1 – Sandy Bay, Lower Sandy Bay, and Taroona;
Area 2 – South Hobart;
Area 3 – North Hobart;
Area 4 – Claremont;
Area 5 – Austins Ferry and Granton; and
Area 6 – Rokeby.
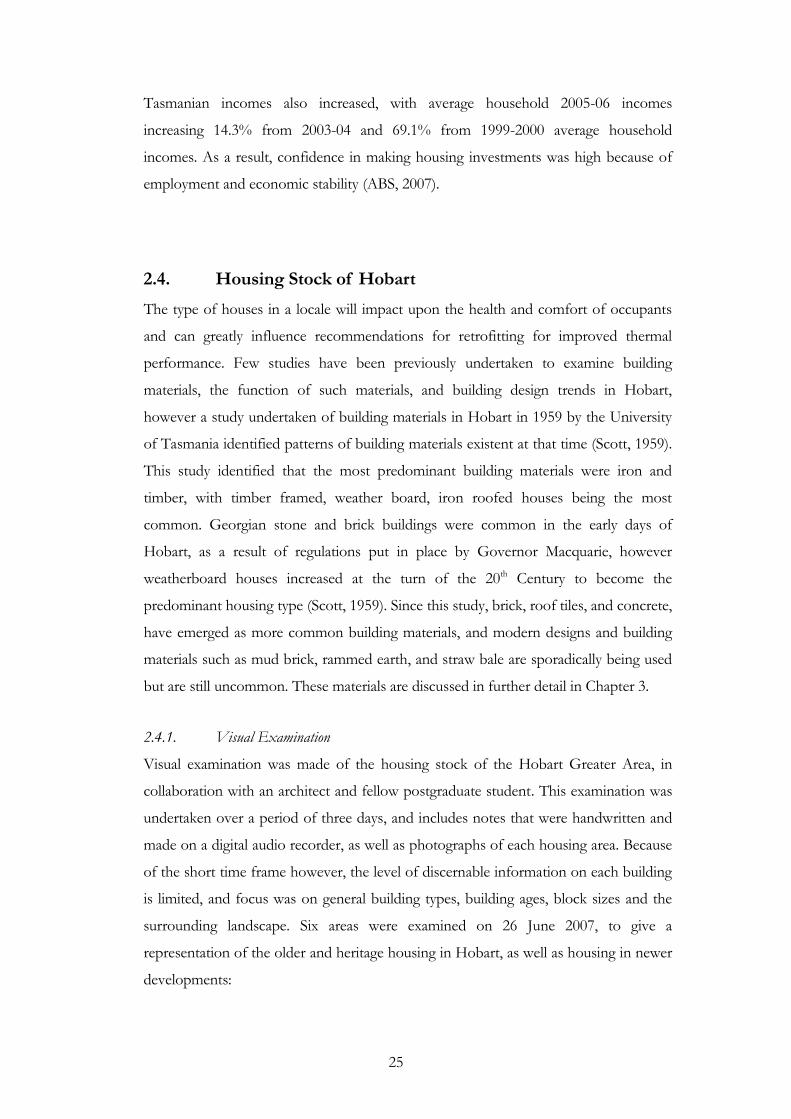
2.4.1.1. Area 1 – Sandy Bay, Lower Sandy Bay, and Taroona
Figure 2.9: the Hillside of Sandy Bay
While a large portion of Sandy Bay is flat, the newer areas of the suburb spread into the
hills to the west, reducing western evening sun and creating Eastern, North Eastern
and South Eastern facing slopes. The commercial value of housing stock increases in
the hilled areas, with larger, newer, and more opulent houses built to face the view,
rather than to take advantage of solar gain. Figure 2.9 shows the steep slopes of the
hills, which provide equitable views to houses, and ensure that what solar gain is
27
present is accessible to more houses. Block sizes are small and houses occupy a large
proportion of these blocks. Resultantly there are few trees, and existing trees are largely
evergreen, which provide shade benefits but reduce solar gain in winter. Houses are
largely brick and tile, with a prevalence of terraced yards, providing considerable
thermal mass.
The flatter areas of these suburbs feature older housing stock, with a prevalence of
weatherboard, but still a large number of tiled roofs. Some houses are brick-fibro or
brick-weatherboard combination, and there is more sheet roofing than on the hills to
the west. There is a larger focus on establishing traditional garden beds rather than
terraced yards. Houses range from periods such as Georgian, Victorian andArt
Nouveau-influenced, to contemporary houses built on previous industrial sites. There
is a large amount of established foliage, providing shade to houses but in some
instances preventing valuable solar gain.
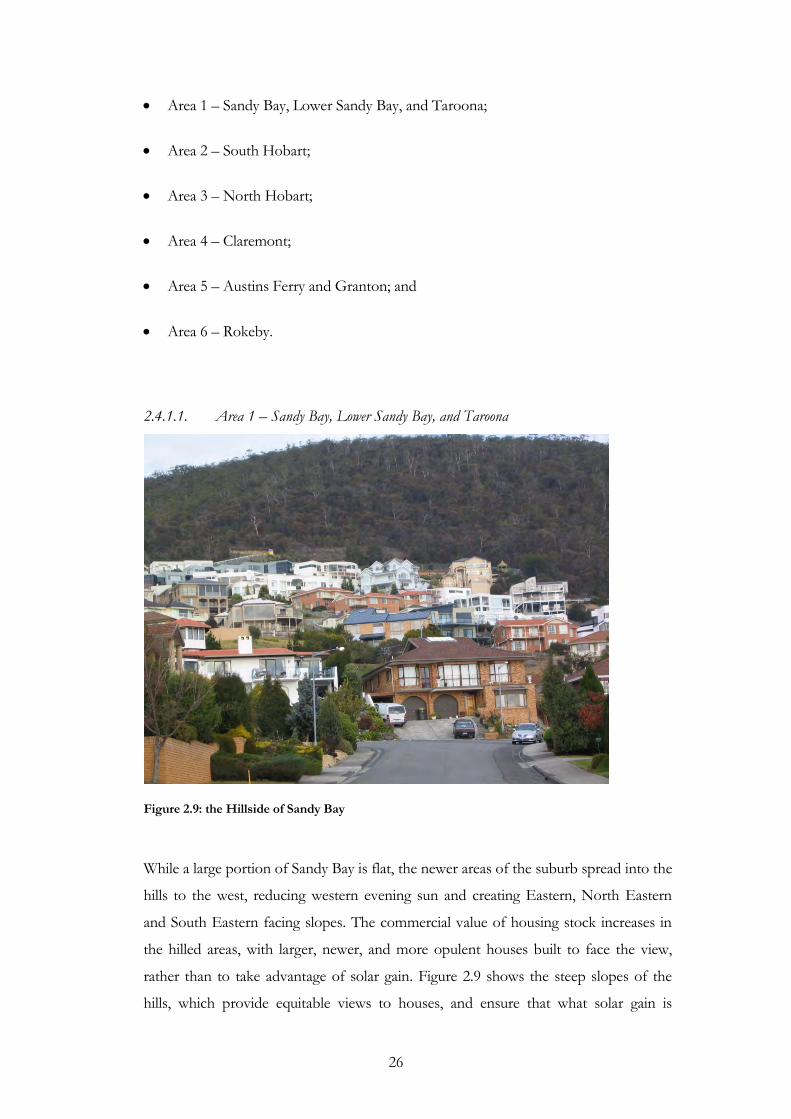
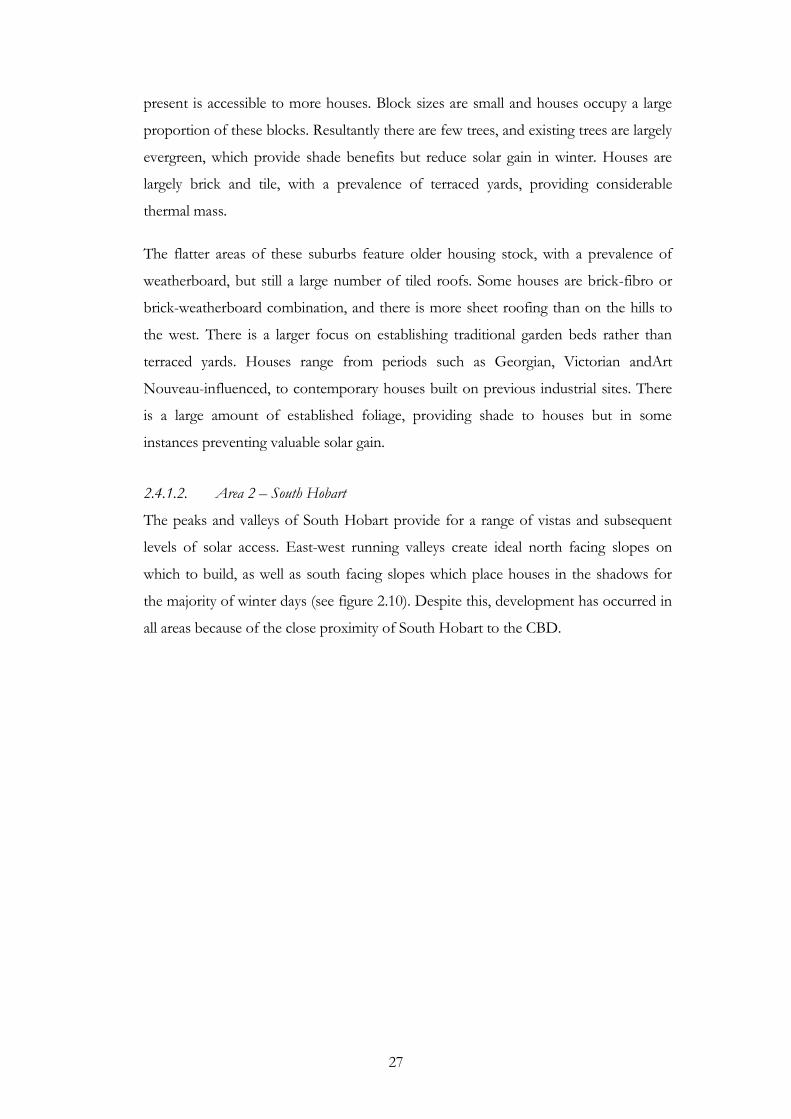
2.4.1.2. Area 2 – South Hobart
The peaks and valleys of South Hobart provide for a range of vistas and subsequent
levels of solar access. East-west running valleys create ideal north facing slopes on
which to build, as well as south facing slopes which place houses in the shadows for
the majority of winter days (see figure 2.10). Despite this, development has occurred in
all areas because of the close proximity of South Hobart to the CBD.
28
Figure 2.10: A valley in South Hobart showing shaded houses on the south facing slope
Construction of housing in this area dates back to early in the State‟s settlement and
houses range from sandstone Georgian cottages to post-World War Two
weatherboard houses. Since the 1980‟s there has been development on the steeper
slopes and these houses tend to be brick and tile construction. The valley floors are
subject to cold air drainage, and the pollution that occurs with associated inversion
layers. The prevalence of wood fired heaters contributes to smoke problems in lower
lying areas in the winter, and houses lower in the valleys could potentially face air
quality issues.
South Hobart is heavily gardened and features large numbers of well-established trees,
with a mix of evergreen and deciduous. The placement of these trees in many cases
shows little thought to principles of passive design, and inhibits solar gain in many
instances.
2.4.1.3. Area 3 – North Hobart
North Hobart largely sits on a gentle south facing slope, where suitable design can
facilitate sufficient solar gain. The suburb is close to the CBD, yet has its own central
business hub at the northern end of Elizabeth Street.
29
North Hobart has had a long history of housing of a wide range of socio-economic
strata. There are a number of large and elaborate homes, some of which date back to as
early as the 1830s; but the suburb is most noticeable for its large areas of small
workers‟ cottages which sit nestled to the commercial hub of Elizabeth Street. Many
light industries also were located in this area, and many of these buildings are being
converted to medium-density housing. Some of the older, higher-density housing areas
have been bulldozed and have been redeveloped as public housing. Older buildings
feature a range of materials, including sandstone, weatherboard and brick, and utilize
both sheet and tile roofing. Newer dwellings, such as the Walford Terraces, which are
included in this study, are largely brick or rendered brick.
2.4.1.4. Area 4 – Claremont
Claremont is a large suburb in the northern suburbs of the Greater Hobart Area, and is
part of the City of Glenorchy. Claremont is very widespread, extending from the
Derwent river up into the western hills, and includes riverside, flat, and sloping areas.
The hilly areas largely face north east, and generally have suitable solar gain potential.
Figure 2.11: the hills of Claremont
Originally an area of fruit orchards and mixed farms, Claremont has many older homes
which were originally farm houses and attached workers‟ cottages. With the advent of
the Cadbury Chocolate Factory commencing in 1921, the area saw considerable
development and estates of houses were built to provide housing for workers (Calder,
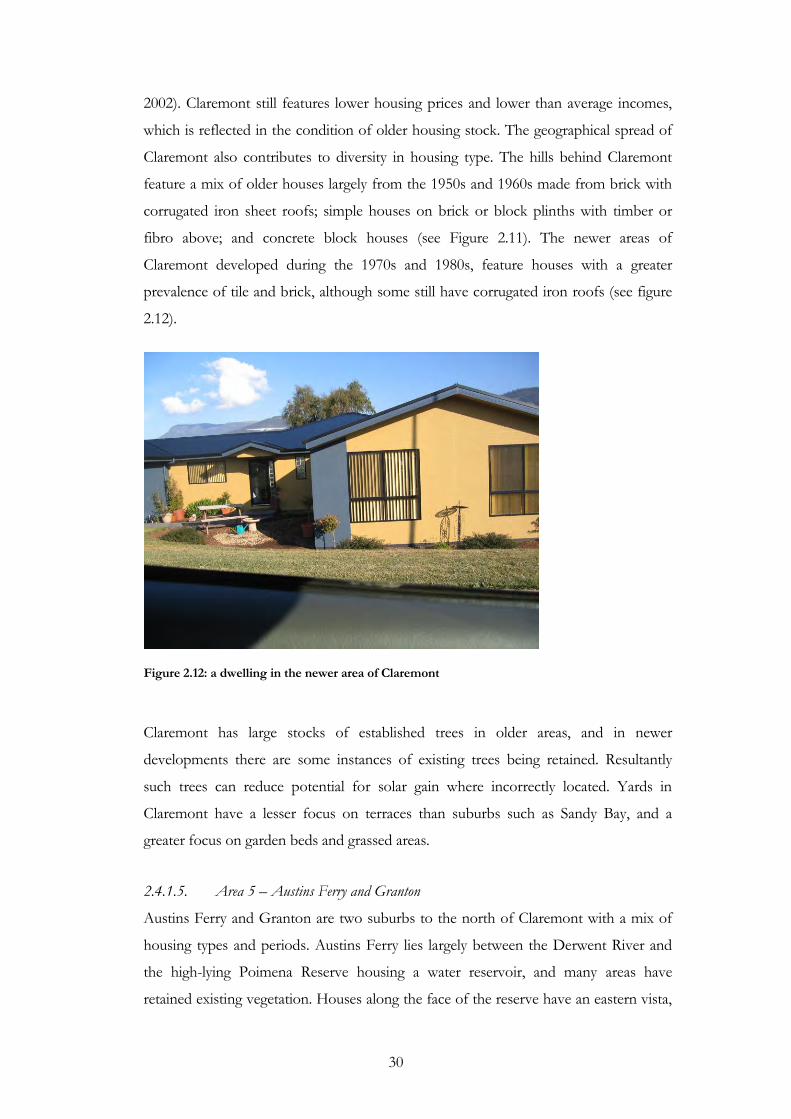
30
2002). Claremont still features lower housing prices and lower than average incomes,
which is reflected in the condition of older housing stock. The geographical spread of
Claremont also contributes to diversity in housing type. The hills behind Claremont
feature a mix of older houses largely from the 1950s and 1960s made from brick with
corrugated iron sheet roofs; simple houses on brick or block plinths with timber or
fibro above; and concrete block houses (see Figure 2.11). The newer areas of
Claremont developed during the 1970s and 1980s, feature houses with a greater
prevalence of tile and brick, although some still have corrugated iron roofs (see figure
2.12).
Figure 2.12: a dwelling in the newer area of Claremont
Claremont has large stocks of established trees in older areas, and in newer
developments there are some instances of existing trees being retained. Resultantly
such trees can reduce potential for solar gain where incorrectly located. Yards in
Claremont have a lesser focus on terraces than suburbs such as Sandy Bay, and a
greater focus on garden beds and grassed areas.
2.4.1.5. Area 5 – Austins Ferry and Granton
Austins Ferry and Granton are two suburbs to the north of Claremont with a mix of
housing types and periods. Austins Ferry lies largely between the Derwent River and
the high-lying Poimena Reserve housing a water reservoir, and many areas have
retained existing vegetation. Houses along the face of the reserve have an eastern vista,

31
and will not generally receive evening sun. Granton features smaller hilly terrain, where
houses generally have suitable solar access. Both areas feature a mix of older houses,
dating back to the 1830s, and recent more developments, particularly those of post
World War Two origin. Calder (2002) states that the majority of the houses in the
Granton area were built in the late 1960s and early 1970s. Newer housing areas
beginning in the 1990s generally feature brick veneer or rendered block with sheet
roofs that are generally dark in colour, although there are some tiled roofs in these
areas (see Figure 2.13). Older houses vary from brick veneer to weatherboard, but
sheet roofs seem to still be prevalent.
Figure 2.13: Overlooking Austins Ferry, showing the prevalence of black tiled roofs
2.4.1.6. Area 6 – Rokeby
Rokeby is a satellite suburb on the eastern shore of the Derwent River developed in the
1970s as a public housing area. Most dwellings were built in this period, with a small
number of newer houses (Lewis, 2002). Dwellings are a mix of: weatherboard with
sheet roofing and brick chimneys on external walls; and brick veneer with either tile or
32
sheet roofing. Rokeby was built on an existing plain, and the landscape in the suburb is
relatively flat, with surrounding tree covered hills. Residents have not planted shade
trees in large numbers and resultantly, most houses have potential for suitable solar
gain.
2.4.1.7. Summary
The Greater Hobart Area has features a wide range of building types, varying greatly in
age, materials, style, and thermal performance. Overall, while some newer buildings are
beginning to incorporate principles of passive design, there is a distinct lack of such
principles in the existing housing stock. A large proportion of existing houses have
poor thermal performance, low levels of insulation, insufficient solar access, and
potentially very low levels of thermal comfort for residents without substantial energy
consumption and associated economic and environmental costs.
Tasmania has historically been slow to adopt new housing technologies, and was the
last state to adopting and enforcing the 2007 Building Code of Australia. Modern
developments in Hobart, like many areas in Australia, have featured large numbers of
black or dark coloured tiled roofs. This trend is driven largely by fashion, and has
detrimental impacts on the thermal performance of buildings during hotter periods.
Chapter 3 discusses this in further detail. Insulation levels in Tasmanian houses are low,
with as little as 10% of houses having insulation (Weaver, 2004).
The undular nature of the landscape has meant that there are a variety of slopes in
Hobart, with varying amounts of solar access, and that some dwellings are affected by
cold air drainage and overshadowing. Tree plantings are common in suburban yards,
and largely have not occurred in consideration of their impact on solar access, with
many evergreen trees on the northern side of buildings.
There is great potential to improve the housing stock of Hobart by: incorporating
passive design principles, and; considering the local landscape and climate in new
developments; and through retrofitting existing buildings for thermal efficiency.
2.4.2. Housing Development
House price indexes for houses are established by examining sales prices against
geographical and physical characteristics. The Australian Bureau of Statistics (ABS,
2006n, , 2008c) developed house price indexes for Hobart by financial year. The

33
average price of houses increased by 44.9% in 2003-04, before dropping to an increase
of 11.8% in 2004-2005 and an increase of 6.6% in 2005-06. Newly built homes
experienced a lower rise in house price index than existing homes from 2001 until the
last record in 2006 (ABS, 2006n). There was however an increase in the price of houses
in Hobart earlier in the decade (ABS, 2006n).
The cost of building materials also impacts upon the implementation of sustainable
design principles into residential buildings. Many passive design features can require
little or no additional expense, particularly when implemented early in the design phase
of new buildings, and many of these features that have an associated cost will recover
that cost in energy savings. Despite this, the higher cost of building materials can cause
these features to be removed in the early stages of building design, and can delay or
prevent retrofitting existing buildings. Building costs in Hobart have increased steadily
this decade, and at a greater rate than the capital cities of other Australian states (ABS,
2006m, , 2008b).
2.4.3. Community Housing
Due to lower than Australian average wage earnings, and the high costs of building in
Tasmania, Hobart has a reliance on public housing, and accommodation support from
charitable organisations. Three State Government dwellings are included in this study.
Housing Tasmania, a division of the State Government‟s Department of Health &
Human Services is the primary provider of public housing. In 2003-04 expenditure on
public housing was $115.9 million (with $34.6 million from the Commonwealth State
Housing Agreement), and a further $2.1 million provided by Housing Tasmania in the
delivery of private rental assistance.
The Community Housing Program is a Housing Tasmania delivered and
Commonwealth funded program that targets individuals with special housing needs
and provides suitable accommodation. The program encourages a variety of housing
types and providers, such as community organisations, local government, and housing
co-operatives. The Australian Bureau of Statistics (2008a) noted that there are over 400
properties funded by this program. Programs such as this provide opportunity for
Government to implement passive design principles into housing stock.

34
2.4.4. The Early 2000s Housing Boom
In the early 2000s, a number of factors contributed to Tasmania experiencing a rapid
increase in the price of housing. In 1999-2000 the mean sale price for houses was
$96,876, and by 2003-04 this had risen to $178,615 (ABS, 2008c). ABC (2003) reported
that between March 2002 and March 2003 the average house price in Tasmania rose by
38%, which was greater than the national average. Factors that contributed to this price
increase included: economic trends of solid economic growth, low unemployment rates
and low interest rates (ABS, 2007); an increase in investment from mainland
Australians, caused in part by “sea changers” and retirees taking advantage of
Tasmania‟s low house prices (ABC, 2003); and the First Home Buyers Scheme, which
was introduced in 2000 and at that stage provided grants of up to $7000 for people
purchasing their first home.
As well as the social problems of rental-stress associated with the housing boom (ABC,
2003), there were a number of potential implications on the uptake of passive design
features in new buildings and the retrofitting of existing buildings. With increase in the
cost of buildings, investors frequently desire to reduce building cost. In such situations
environmental features are often the first features to be not included in building plans.
As well as increases in the value of houses, the number of new buildings also increased
during that period. ABS (2006o) recorded 3,141 residential buildings approved for
development in 2003-2004, which was an increase on the 1,893 approved in 1999-
2000. Of these approvals: 85.5% (2,687) were new houses; 12.3% (387) were new
residential buildings other than houses, such as flats and units; and the remaining 2.1%
(67) were other dwellings such as conversions and redevelopments (ABS, 2006o, ABS,
2007). The value of this building was $740.7 million, which was a 40.7% increase
($214.4 million) on 1999-2000. The number of first home buyers peaked in 2001-02,
with 2900 new home owners, before dropping to 2100 in 2006-07 (ABS, 2007).
2.5. Chapter Summary
The aim of this chapter was to provide a physical and a socioeconomic context for the
case studies. The chapter has examined the geographical features affecting the climate
of Tasmania with a focus on the City of Hobart, and provided an overview of the
35
climatic conditions that occurred during the study period. This chapter has also
examined the housing stock of Hobart, and the socio-economic factors that have
influenced the type and quality of residential buildings in Hobart.
Chapter 3 will examine the principles that can be implemented to improve
sustainability in residential buildings, focusing on passive design for improving thermal
efficiency and the heating of homes in the Tasmanian climate with passive solar
systems.
36
Chapter 3: Sustainable Housing Design
3.1. Introduction
While sustainability and the reduction of resource consumption are vitally important,
the need to minimise personal environmental impact has increased with events such as
ozone depletion, climate change, and a lack of available landfill areas (Crocombe, 2007,
Dallas, 2008, Dupont and Pearman, 2006, McKay and Bonnin, 2006, Mobbs, 2001).
The desire to live in an environmentally sustainable manner and with a smaller
ecological footprint has increased, and for the individual or family, the primary place
where lifestyle changes can be implemented is in the home (Crocombe, 2007). The
regulation of internal temperatures to ensure comfortable living takes up a large
proportion of household energy consumption. Therefore, the implementation of
passive design principles into both the design of new homes, and in retrofitting existing
homes, represents an appropriate method of reducing household environmental
impact (Martin and Verbeek, 2006, Mobbs, 2001).
With climate change it is imperative that developed countries such as Australia take the
lead in reducing carbon emissions (Crocombe, 2007, Dallas, 2008, Dupont and
Pearman, 2006, Frank, 2005, Henson, 2008, Koehler and Hecht, 2006). This, coupled
with the vast global growth rate in new buildings, means that without reducing energy
consumption and subsequent greenhouse gas emissions in the building sector, there is
little hope of effectively confronting the challenge of global climate change (Crocombe,
2007, Dallas, 2008, Henson, 2008).
This chapter examines design principles that can be implemented to improve the
sustainability of residential buildings, with a specific focus on the use of passive design
to improve thermal efficiency. The first section gives a brief background to
sustainability; the importance of sustainability in society; and the relationship between
sustainability and passive design. Secondly, the principles of passive solar design are
investigated. Differences between passive and active design will be examined, as well as
the benefits and importance of passive design in residential building. Passive solar
design, with specific focus on passively heating buildings in cool temperate climates
such as Tasmania are examined.

37
The external influences of climate and building site, through to specific features of
passively designed buildings such as materials, glazing and insulation are discussed. The
influence of climate on residential buildings, and the importance of designing a
building sensitive to local weather conditions is then presented. This section will focus
largely on cool temperate and temperate climates such as Tasmania, and will refer to
the sections on climate in Chapter 2 of this study. The importance of understanding
the site on which a new building is to be built, and the influence of external factors on
passive design, is then assessed.
This chapter examines how the shape and orientation are vital considerations in a
passively designed building, and can ensure: adequate solar gain; efficacy of appropriate
thermal mass; and resultant levels of thermal comfort. A synopsis of heat flows in
residential buildings is provided, including the nomenclature required to analyse flows,
and the laws of thermodynamics.
An overview of glazing, both as a source of solar gain, and of loss of energy, and
presents methods in which glazing can be used to improve both the thermal comfort
and amenity of residential buildings, including optimal glazing areas and novel
approaches to introducing insolation into the building envelope is provided.
This chapter explores the vital role that building materials play in storing thermal
energy, and how thermal mass can be used to regulate the temperatures of residential
buildings, helping to provide greater levels of thermal comfort. It then discusses
methods for insulating buildings to reduce transfer of heat across the building
envelope, and the benefits that such methods and materials provide. This includes the
insulating values of common building materials, as well as the placement of materials
specifically designed to prevent heat transfer. The concepts of R and U values in the
analysis of insulation value are also introduced.
Options for passively cooling that can be implemented in buildings in a range of
climates, including the use of shading, colouring, and thermal mass in passive cooling
and ventilation systems are briefly discuees. It then examines in detail optimal methods
for ventilation to reduce dependence on air conditioning systems, even in warmer
climates.
38
Landscaping and external modifications to buildings that can modify their thermal
performance are examined, including the creation of microclimates around buildings,
and the use of trees as a seasonal shading device.
Finally, this chapter draws from previous sections to present a number of passive
heating systems, conceptually and in practice, which can be implemented into new and
existing buildings, including: direct gain systems, attached sun space systems,
convection systems, thermal storage walls, and other specialist systems. Options for
retrofitting existing buildings to improve their thermal performance are introduced and
discussed.
3.2. Sustainability
3.2.1. Sustainability, sustainable development and urban sustainability
The Brundtland Commission (1987 p1), formerly known as the Report of the World
Commission on Environment and Development, defined sustainable development,
and sustainability as “meeting the needs of the present without compromising the
ability of future generations to meet their own needs”.
The Australia State of the Environment Report (1996) defines urban sustainability as
development that reduces resource inputs and waste outputs whilst simultaneously
improving livability. Australia State of the Environment Report (2006 p127) defines a
sustainable activity as “able to be carried out without damaging the long-term health
and integrity of natural and cultural environments”. Sustainability requires society to
function and exist within boundaries of Earth‟s capacity to function and provide
materials, and within its capacity to process or accept our waste products and pollution
(Halliday, 2008, Mobbs, 2001). Above all, sustainability gives us the message that
humankind must:
achieve more, using less, for longer;
reduce both our consumption of resources and our production of waste; and
disengage links between resource consumption and waste production, and quality of life and wealth (Newman, 1999).
39
In terms of sustainability, it is therefore the job of housing designers, environmental
practitioners, and planners alike to create urban and suburban environments that
employ and consume less energy, water, materials, and land, and similarly generate less
waste. CO2 is of particular concern and its production in Australia is directly linked to
energy use. These achievements must be made, while sustaining and improving the
quality of lifestyle, housing and communities (Mobbs, 2001, Newman, 1999).
Sustainability can be considered as a broad umbrella that covers the goals and
objectives of this research, as well as providing environmental, social and economic
motivators, benefits and rewards.
3.2.2. Social, economic and environmental aspects of sustainability
Newman (1999) argues that the environmental aspects of sustainability cannot be
considered separate from social and economic matters, and that urban sustainability
involves a juncture of economic energy/environmental and human concerns.
Sustainability provides environmental benefits, including `the reduction of resource
consumption, pollution, and waste production, and the minimisation of damage to
threatened species and habitats. Social benefits of sustainability, and mechanisms to
achieve sustainability, are interlinked with environmental gains, and include:
increased public participation and community engagement;
greater social amenity, wellbeing, and safety;
social equity and accessibility;
regional responsibility and leadership;
social and ethnic diversity; and
improved social infrastructure, services and facilities.
Consumption is costly, and sustainability through reduction of over-consumption can
provide economic benefits. Economic implementation of sustainability principles can
include: fostering and supporting sustainable industry; business and ecotourism;
funding sustainability research and development; environmental education; and
relevant to this study, the implementation of sustainable and passive design and
construction techniques.
40
3.2.3. Sustainability assessment
One frequently utilised method of sustainability assessment is the implementation of
indicators and establishment of clear goals. This can be undertaken at a local, state or
federal level, and is popular because it focuses on the consideration of resource
consumption, waste production and standard of living, and allows the production of
visual representations of sustainability performance. Indicators can be tailored to suit
the environmental, economic and social situation of specific locations (Newman,
1999).
Indicators can be broad ranging, examining waste, water, livability, amenity, health, air
quality, energy, material consumption, land use, biodiversity and transport. Indicators
relevant to this study would be:
reductions in per capita energy consumption;
reduction in per capita greenhouse gas emissions;
reduction in percentage of poor quality housing; and
reduction in per capita consumption of building materials (Newman, 1999).
3.2.4. Ecological footprint
Ecological Footprint (EF) has become a popular sustainability indicator since
introduced by Wackernagel and Rees (1996). This technique estimates the area of land
necessary to sustain the activities of a city or individual. This allows an estimate of the
demands that humans place on nature, by comparing consumption and utilisation of
natural resources with the earth‟s ability to renew these resources. EF calculation uses a
method similar to life cycle analysis, where the land area required for the production of
food and textiles, mineral extraction, construction of dwellings and other buildings, and
the processing of waste is appraised. Also to be considered is the area of land required
for the natural processing of carbon dioxide into biomass (Crocombe, 2007, Mobbs,
2001, Newman, 1999). Sustainability assessment allows the creation of a tangible unit
for determining if a city, household or individual is over consuming and functioning
unsustainably. Calculations of EF show that developed countries need to drastically
reduce consumption, waste production, and energy expenditure (Newman, 1999).
41
3.2.5. Sustainable design as an aspect of sustainability
The design, creation, functioning and eventual demolition of residences, and the
accompanying material use, energy consumption, and waste production, mean that the
built environment presents a particularly complex challenge in terms of improving
sustainability. Incorporating principles of sustainability into building design is
important in reducing this consumption and the resultant impacts(Argue et al., 1978,
Yudelson, 2007). Halliday (2008) identifies a range of criteria to which buildings should
be subject to improve sustainability:
enhance biodiversity and not using materials sourced from threatened species or taken from sensitive or threatened environments, and where possible improve natural ecosystems and habitats through appropriate planning and resource consumption;
support communities by identifying and meeting the essential requirements and needs, and the desires of communities, including stakeholder involvement in key decision making processes;
use resources effectively by not unnecessarily consuming resources during materials sourcing, construction, building function, and demolition, and by reducing energy, water and materials waste due to inefficiency, short product lifespan, poor construction and manufacturing processes;
minimise pollution by reducing dependence on materials, products, energy, transport, and management practices that produce waste or other pollutants;
create healthy environments that improve the living standards of residents, reduce exposure to physical risk, toxic material, and harmful organisms; and
manage the process through appropriate delivery of sustainable projects in both the ongoing and short term.
Information underpinning the principles of sustainable design is readily available, yet
criteria and standards are frequently not achieved in modern residential construction
projects. Failure to apply even the most basic principles of sustainable design will result
in dwellings that are more polluting and less energy and water efficient. (Halliday, 2008,
Mobbs, 2001).
The efficient use of energy and the effective use of building materials are clearly noted
in these criteria, and are highly important considerations in this research. They
underpin the principles of passive design and the successful use of thermal mass to
improve building thermal comfort.
42
Sustainable design, and its subset of passive design, are important aspects of the
broader framework of sustainability, and can contribute to environmental, social and
economic benefits. The environmental benefits of sustainable design include:
reductions in the consumption of building materials, water, and energy; and a reduced
ecological footprint. The social benefits of sustainable design include: improved living
spaces and conditions; better health of building residents; and more amenable
neighbourhoods (Argue et al., 1978, Reardon et al., 2005, Yudelson, 2007).
For the individual, the economic benefits of sustainable design stem largely from
reductions in costs associated with resource consumption such as expenditure on
energy, water and in some cases, building materials (Crocombe, 2007, Yudelson, 2007).
There are, however, broader economic benefits provided by sustainable design, such as
the opening of new markets for the production of new technologies and materials, and
the mitigation of potential costs associated with the emission of pollutants such as
greenhouse gases.
Sustainability is an important factor that underpins this research, and needs to be
considered in the design of thermally comfortable buildings that are appropriate to
climate. The uptake of even minor changes based on these principles will provide
benefits, making the incorporation of sustainable principles into the design of
residential buildings an important method of improving national and global
sustainability by reducing carbon emissions, materials wastage, and resource
consumption (Argue et al., 1978, Crocombe, 2007, Mobbs, 2001, Reardon et al., 2005,
Yudelson, 2007).
3.3. Passive Design
Passive design is the implementation of features into buildings that work in
collaboration with and utilise natural processes for heating, ventilation and lighting, for
the purposes of minimising energy consumption while providing comfortable living
conditions. Active design involves the implementation of features that require energy
input, such as electricity or gas.
Passive solar design is the use of solar energy to heat, cool, ventilate or light buildings,
without the need for electricity or mechanics (Beggs, 2007, Ewers, 1977, Yudelson,

43
2007). Smith (2009) states that passive solar is design that maximises the ability of the
building to gain energy from the sun and that building sites and design with solar
exposure are preferable.
Passive design has specific implementation in heating, where it involves the utilisation
of a building‟s structure to collect, store and transfer solar energy. This means the
prevention of the summer sun gaining access to the building; the exposure of key areas
of the building to the low hanging winter sun to capture and store solar energy; the
insulation of the building to prevent unwanted heat loss or gains; and the orientation of
the building to maximise solar exposure during the winter (Beggs, 2007, Ewers, 1977,
Reardon et al., 2005, Smith, 2009, Yudelson, 2007). In many cases a house
incorporating passive solar design principles does not look particularly different to
buildings that ignore these principles. The primary differences come in the efficiency,
running cost and levels of resident comfort (Crocombe, 2007, Reardon et al., 2005,
Smith, 2009). This chapter will focus primarily on passive solar heating rather than
passive cooling, as heating is considerably more relevant in temperate climates such as
that found in Hobart.
3.3.1. How do passive and active design differ?
Many buildings are designed and constructed with little consideration of their
surrounding climate, and create hostile internal environments that require considerable
mechanical effort and electrical expenditure to maintain a habitable condition year
round (Beggs, 2007). Active design in such a fashion is wasteful and represents an
environmental failure in the building design.
While active solar design utilises complex electrical and mechanical systems such as:
photovoltaic cells and water collector tanks with pumps; passive solar design utilises
the processes of conduction, convection and radiation to transport heat energy (Beggs,
2007, Gnauck, 1985, Gray, 1997, Smith, 2009, Smith and Pitts, 1997, Yudelson, 2007).
Passive design takes advantage of natural energy flows to ensure that a building
remains thermally comfortable for the inhabitants (Beggs, 2007, Reardon et al., 2005,
Smith, 2009).
Active solar design includes all heating systems where mechanical or electrical means
are required to transfer or transport energy once it has been collected (Smith, 2009).
44
This includes such systems as photovoltaic panels, as well as systems where heat is
collected in one area and pumped into another (Gray, 1997).
3.3.2. Importance of passive design – economic and social benefits
Many homes in Tasmania do not work in harmony with the local environment, rather
they work against the climatic conditions, making them require unnecessary active
heating to maintain adequate living conditions in colder months (Beggs, 2007, Gray,
1997, Reardon et al., 2005). Passive solar design can minimise the energy required to
maintain a comfortable thermal environment, and in doing so reduce the energy
expenditure and heating load of the building (Peterkin, 2008, Yudelson, 2007). Makaka
et al. (2008) argue that even low cost buildings can implement a wide range of passive
design features to improve thermal behaviour and ventilation efficiency.
Passive solar and energy-efficient features can be incorporated into buildings in
temperate climates with little to no extra costs (Al-Azzawi, 1991, Ewers, 1977, Smith,
2009). Investigation by Roach (1979) showed that as early as the late 1970s passive
solar designs could provide economic benefits. Schnieders and Hermelink (2004)
showed that with an extra building cost of 10%, passive houses could reduce space
heating demands by 15-20% and provide notable increases in thermal comfort. If
considered early in the design phase, substantial savings could be garnered, in many
cases, with no additional expenditure. This work also indicated a high level of user
satisfaction with buildings implementing passive design features. Yakubu (2004)
conducted a user satisfaction survey of people living in passive solar homes that also
examined motivations behind a homeowners decision to design or purchase a passive
designed home. The study determined that the primary motivating factor was the
desire for high levels of thermal comfort with very little expenditure, followed closely
by the desire for a house that was aesthetically appealing. The study also determined
that passive designed homes have a high level of occupant satisfaction. The end result
is that houses incorporating the principles of passive solar design yield significant
financial and health benefits for the inhabitants, as well as reducing the building‟s
impact on the environment.
3.3.3. Environmental benefits of passive design
The average Australian home produces over 15 tonnes of greenhouse gas per year.
With over seven million residences in Australia, this means that homes emit more than

45
20% of the Australia‟s greenhouse gas emissions (Reardon et al., 2005). Tasmania is
now part of the national electricty grid, and with 85% of Australian energy produced
by the coal fired power stations, reductions in electricity consumption mean significant
reductions in greenhouse gas emissions (Jordan, 2009). Passive solar design mitigates
the environmental impacts of the building by reducing the need for unnecessary
expenditure on electrical heating, gas consumption, and the use of wood fired heaters.
3.3.4. Possible negative impacts of passive design?
Nutt (1994) suggests that while there are many claimed benefits of passive design,
there are also several potential risks that must be considered and managed. These risks
include:
increased purchased energy consumption through inappropriate use;
seasonal overheating;
unacceptable temperature fluctuations;
poor air quality and condensation;
unacceptable lighting variation and glare;
temperature stratification;
thermal fatigue and fracture of materials; and
winter survival of plants.
While these risks are, potentially real, all of them can be mitigated or managed
effectively through intelligent and informed building design. As noted by Nutt (1994)
the correct education of occupants on the operation and performance of the building‟s
passive design features can mitigate these risks.
3.3.5. The purpose of the modern building
It is important to consider what functions a dwelling serves in the design process.This
is a concept that can be overlooked in the creation of ostentatious modern buildings
designed to garner attention and prestige with little consideration of their comfort or
environmental impact. The fundamental purpose of modern buildings is to protect the
occupant from elements of the environment outside which are deemed undesirable,
while allowing beneficial environmental access to the house, and maintaining an
46
environment that is not only comfortable but promotes the good health and wellbeing
of the occupants.
3.4. Climate
Tasmania features a cool temperate climate with four distinct seasons that frequently
present thermal conditions that are outside the range of human thermal comfort.
Hobart‟s latitude of 42.53°S means that it has a high diurnal range, with short days and
long nights in the winter that mean less insolation and considerably colder
temperatures. The majority of rainfall in Tasmania occurs in the winter, with hot and
dry summers. Chapter 2 discussed the temperate climate of Tasmania and its influence
on requirements for building for human thermal comfort.
Climatic conditions have a major impact on passive design, and the techniques
implemented to achieve a thermally comfortable dwelling. It is important to recognise
the impact of these conditions on the thermal performance of buildings, and
incorporate features to mitigate swings in internal temperatures. According to Hollo
(1995), passive design to maximise thermal comfort incorporates the five principles of:
orientation; glazing; thermal mass; insulation; and ventilation.
The principles and elements of passive design have been recognised for a decades, and
in 1978, Grimmer et al. (1979) listed these elements as: large equator facing glazing to
admit solar radiation; good thermal insulation; and large thermal storage capacity within
the insulation envelope.
While passive solar design can benefit the majority of climatic regions, climatic factors
influence how effective passive solar design can be in regulating temperature and
increasing thermal comfort. The Tasmanian climate means that it is imperative that
houses should incorporate principles of passive design. Chapter 2 examined the
Tasmanian climate, in particular the influence of local temperatures, humidity, and
rainfall.
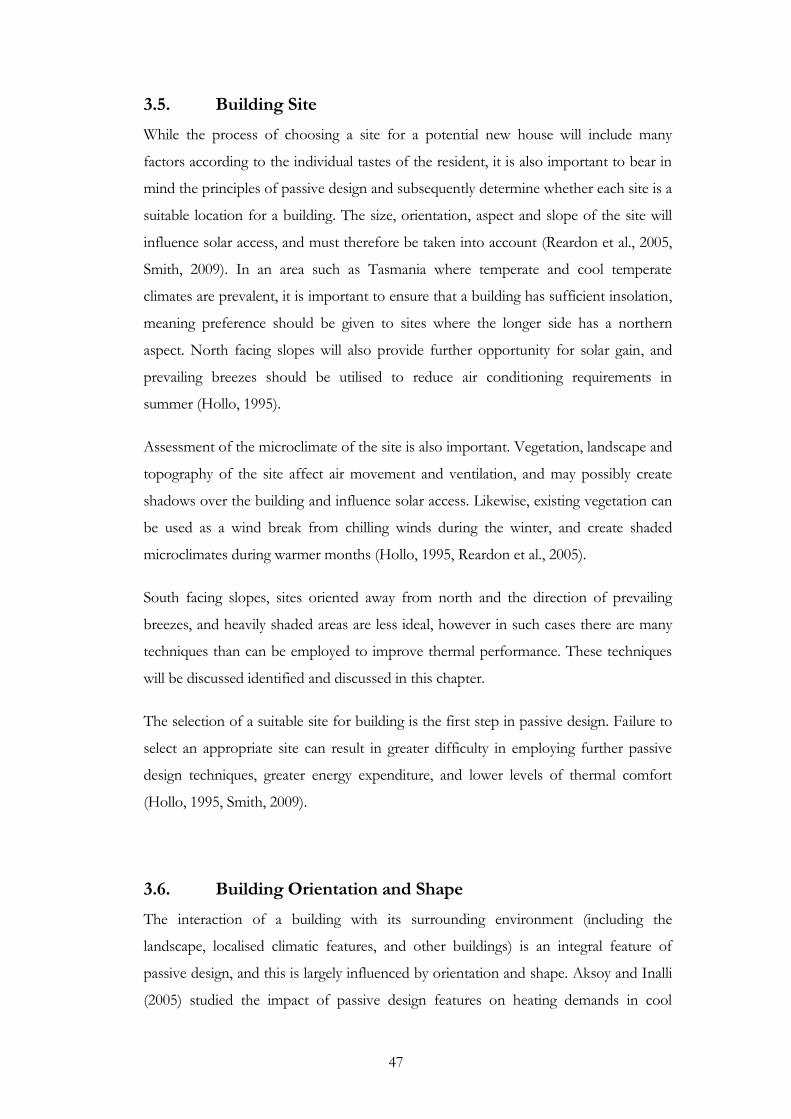
47
3.5. Building Site
While the process of choosing a site for a potential new house will include many
factors according to the individual tastes of the resident, it is also important to bear in
mind the principles of passive design and subsequently determine whether each site is a
suitable location for a building. The size, orientation, aspect and slope of the site will
influence solar access, and must therefore be taken into account (Reardon et al., 2005,
Smith, 2009). In an area such as Tasmania where temperate and cool temperate
climates are prevalent, it is important to ensure that a building has sufficient insolation,
meaning preference should be given to sites where the longer side has a northern
aspect. North facing slopes will also provide further opportunity for solar gain, and
prevailing breezes should be utilised to reduce air conditioning requirements in
summer (Hollo, 1995).
Assessment of the microclimate of the site is also important. Vegetation, landscape and
topography of the site affect air movement and ventilation, and may possibly create
shadows over the building and influence solar access. Likewise, existing vegetation can
be used as a wind break from chilling winds during the winter, and create shaded
microclimates during warmer months (Hollo, 1995, Reardon et al., 2005).
South facing slopes, sites oriented away from north and the direction of prevailing
breezes, and heavily shaded areas are less ideal, however in such cases there are many
techniques than can be employed to improve thermal performance. These techniques
will be discussed identified and discussed in this chapter.
The selection of a suitable site for building is the first step in passive design. Failure to
select an appropriate site can result in greater difficulty in employing further passive
design techniques, greater energy expenditure, and lower levels of thermal comfort
(Hollo, 1995, Smith, 2009).
3.6. Building Orientation and Shape
The interaction of a building with its surrounding environment (including the
landscape, localised climatic features, and other buildings) is an integral feature of
passive design, and this is largely influenced by orientation and shape. Aksoy and Inalli
(2005) studied the impact of passive design features on heating demands in cool
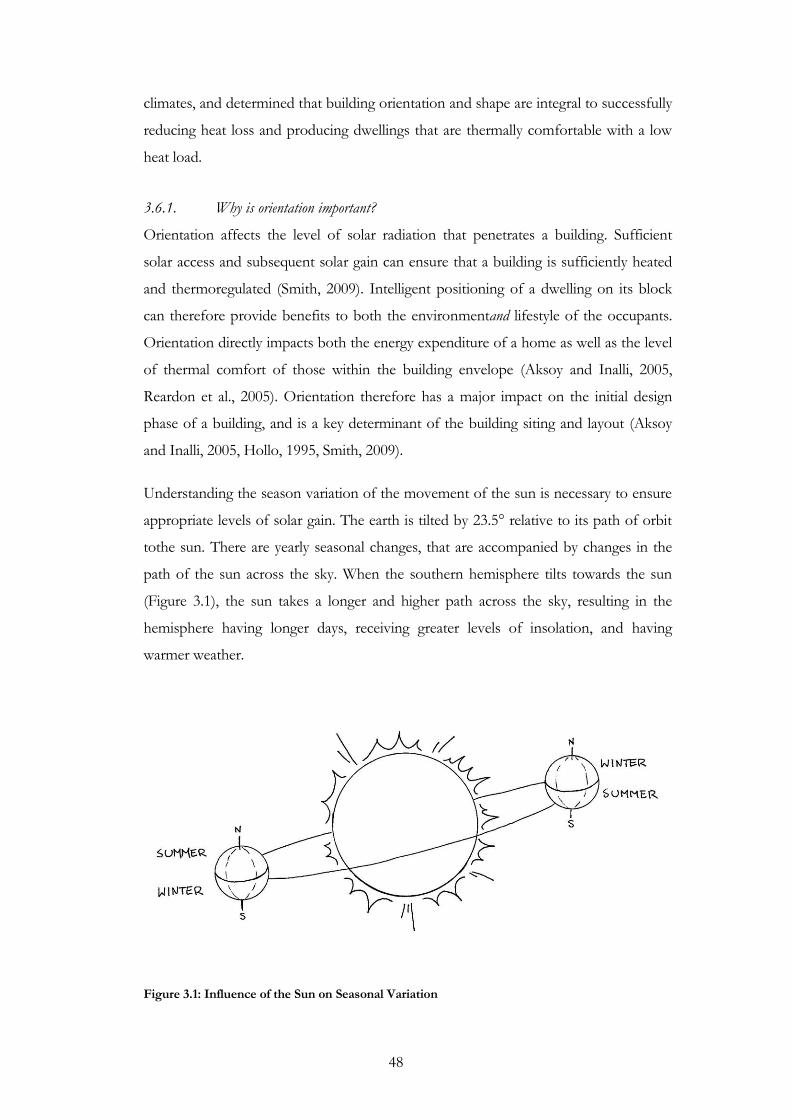
48
climates, and determined that building orientation and shape are integral to successfully
reducing heat loss and producing dwellings that are thermally comfortable with a low
heat load.
3.6.1. Why is orientation important?
Orientation affects the level of solar radiation that penetrates a building. Sufficient
solar access and subsequent solar gain can ensure that a building is sufficiently heated
and thermoregulated (Smith, 2009). Intelligent positioning of a dwelling on its block
can therefore provide benefits to both the environmentand lifestyle of the occupants.
Orientation directly impacts both the energy expenditure of a home as well as the level
of thermal comfort of those within the building envelope (Aksoy and Inalli, 2005,
Reardon et al., 2005). Orientation therefore has a major impact on the initial design
phase of a building, and is a key determinant of the building siting and layout (Aksoy
and Inalli, 2005, Hollo, 1995, Smith, 2009).
Understanding the season variation of the movement of the sun is necessary to ensure
appropriate levels of solar gain. The earth is tilted by 23.5° relative to its path of orbit
tothe sun. There are yearly seasonal changes, that are accompanied by changes in the
path of the sun across the sky. When the southern hemisphere tilts towards the sun
(Figure 3.1), the sun takes a longer and higher path across the sky, resulting in the
hemisphere having longer days, receiving greater levels of insolation, and having
warmer weather.
Figure 3.1: Influence of the Sun on Seasonal Variation

49
Another result of this tilt of the earth is that during the winter in the southern
hemisphere, the sun is lower in the sky, and comes largely from the north (Ballinger et
al., 1992). Summer solstice on 22 December is the day with the longest period of
daylight, when the sun rises at 5am in the southeast, has a maximum midday height of
79°, and sets in the southwest at 7pm – not counting the effects of daylight savings.
Autumn Equinox on 21 March and Spring Equinox on 23 September are the two
times in the year when the day and night are the exact same length. The sun rises in the
east and sets in the west. The angle of the midday sun can be calculated by removing
the value of the latitude from 90°. In Hobart, with a latitude of 42.53° S the sun would
therefore have a midday angle of 47.47°. Winter solstice on June 22 is the shortest? day
of the year. The sun rises in the north east, rises to an angle of 33° at midday, and sets
in the northwest. It is this lower angle that allows buildings to be designed to maximise
their winter solar gain. Figure 3.1 shows the horizontal angles at which the sun rises
and sets at the solstices, when diurnal variation is at its most extreme. The changing
direction of the sun means that housing and landscape design can maximise and
minimise solar gain by appropriately locating shading devices.
Figure 3.2: Seasonal Paths of the Sun
50
Figure 3.3 shows the vertical angles to which the sun rises during the seasons, including the
extremes of the solstices. This variation in angles shows that the incorporation of shading
devices, such as eaves, will produce positive results in the maintenance of comfortable
indoor temperatures (Smith and Pitts, 1997). This principle is fundamental to passive
design.
Figure 3.3: Seasonal Angles of the Sun
While the changing path of the sun creates varying weather and heat conditions in
temperate areas, it provides the opportunity to mitigate them. Appropriate orientation
of a building, and carefully placed shading devices are two of these mechanisms.
3.6.2. Solar access
There are varying degrees to which the sun may be may be allowed to penetrate a
building. Ballinger et al. (1992) categorised levels of solar access for a building as:
whole site access – the area of yard to the north of the building, as well as the north wall and rooftop are not shaded by other buildings or vegetation in midwinter.
51
north wall access – the absence of midwinter shadows of only the north façade, including the north roof and north wall.
rooftop access .– the rooftop has solar exposure, allowing the use of a solar collector
Whole site access may provide lifestyle benefits, but will not necessarily provide
additional thermal benefits. It is also difficult to achieve in high density housing, and
extra residential land use resulting from the widespread achievement of whole site
access solar gain would result in lower population density (with resultant effects of:
higher commuting distances; loss of arable farm land; and increased urban sprawl).
Whole of site access is appropriate in country areas, or where buildings are adjacent to
reserves and parklands. Rooftop access allows for higher population densities, as it
doesn‟t assume the presence of a yard or location on the southern side of a street,
however by its nature requires the use of active rather than passive solar design
(Ballinger et al., 1992).
It is a requirement of passive design in temperate climates that buildings have adequate
solar access, therefore it is evident that there must be consideration of passive design
from as early in the design process as the planning of subdivisions (Ballinger et al.,
1992, Crocombe, 2007, Smith, 2009). Orientation, layout, and the location of trees and
other external obstructions are all important in the retention of solar access (Smith,
2009).
3.6.3. What is appropriate orientation?
Appropriate orientation should facilitate building design that allows indoor areas to be
shaded during warm weather and allow solar access to living spaces during the colder
months (Ballinger et al., 1992, Hollo, 1995, Smith, 2009).To maximise solar access in
areas south of the tropic of Capricorn, buildings should be orientated north. During
the summer, the sun rises to the south of east, crosses overhead very high in the sky,
and sets to the south of west (Ballinger et al., 1992, Hollo, 1995). In the southern
hemisphere, this seasonal differentiation increases as proximity to the South Pole
increases.
This concept of solar access (see section 3.6.3) or northern solar access discussed by Hollo
(1995) can be considered the primary principle of passive solar heating in temperate
climates. A well designed and correctly oriented house will utilise this seasonal variation

52
to allow solar penetration when it is needed and take advantage of shade to prevent
overheating when necessary (Crocombe, 2007)(Hollo, 1995, Ballinger et al., 1992,
Smith, 2009, Reardon et al., 2005). The high angle of the summer sun allows the
application of shading mechanisms such as eaves that do not shade the lower winter
sun (Crocombe, 2007, Smith and Pitts, 1997).
There are many instances where appropriate equatorial exposure is insufficient to allow
adequate solar access. With land available for housing becoming increasingly scarse, it
is difficult to ensure solar gain simply through north facing glazing, particularly in high
density developments. Garcia-Hansen et al. (2002) present methods for introducing
extra levels of insolation into buildings for increased thermal, daylighting, and
ventilation performance. The study examined a variety of techniques including
skylights, roof monitors and clerestory roof windows and indicated that appropriate
application can be beneficial in improving temperatures, lighting and ventilation.
Littlefair (1999) presented methods for ensuring solar penetration into high density
developments and cities, through the mapping of shadows and solar pathways, and
intelligent planning and design. By analysing the interaction of the building with the
movement of the sun, new developments can be designed to ensure appropriate solar
access, and existing buildings can be ensured continual access to existing insolation.
3.6.4. Internal building layout
The location of rooms is important in ensuring that solar radiation penetrates into
suitable areas of a building, and effective air flows for ventilation can be created. As a
general rule in the southern hemisphere, general living spaces such as lounge rooms
and possibly kitchens should be located on the northern side of the building, while
bedrooms, bathrooms, and laundries should be located on the southern side (Al-
Azzawi, 1991). Bedrooms used primarily for sleeping generally require lower
temperatures, but should be located on the eastern side where possible to allow them
to benefit from morning sun. Figure 3.4 presents a basic home zoning, with general
ideas as to suitable locations for different living areas.
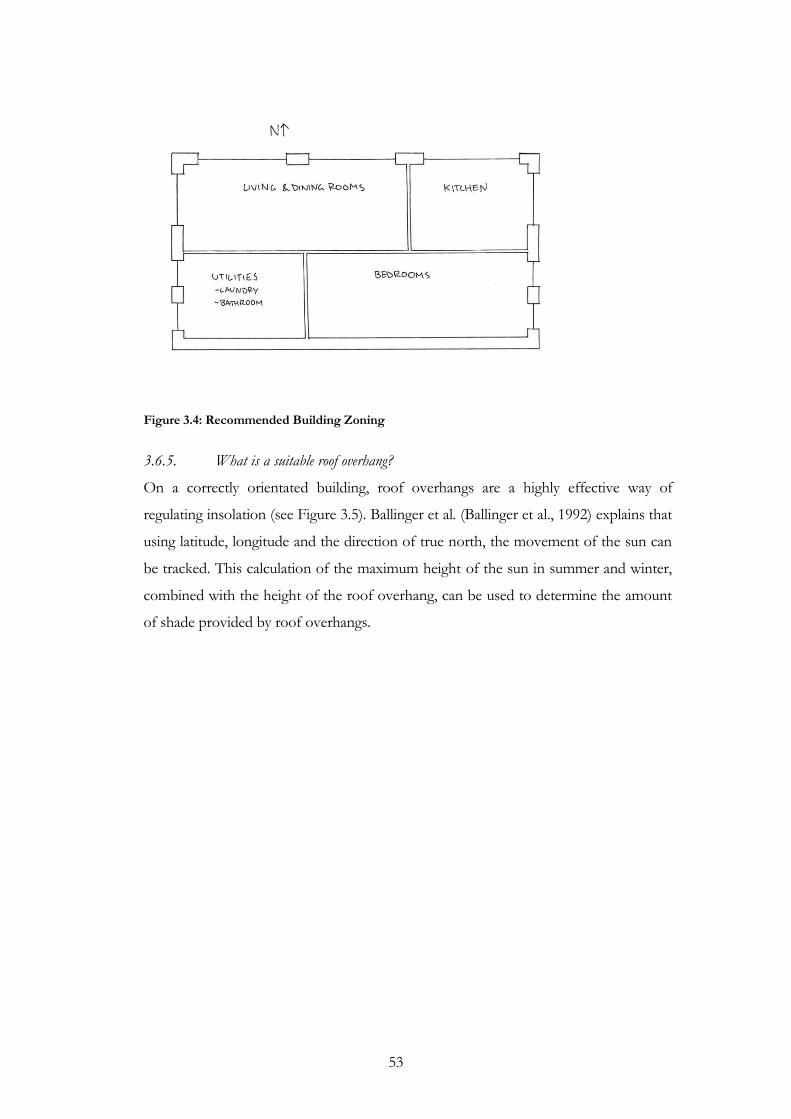
53
Figure 3.4: Recommended Building Zoning
3.6.5. What is a suitable roof overhang?
On a correctly orientated building, roof overhangs are a highly effective way of
regulating insolation (see Figure 3.5). Ballinger et al. (Ballinger et al., 1992) explains that
using latitude, longitude and the direction of true north, the movement of the sun can
be tracked. This calculation of the maximum height of the sun in summer and winter,
combined with the height of the roof overhang, can be used to determine the amount
of shade provided by roof overhangs.

54
Figure 3.5: Eaves as a Summer Shade
Seasonal variation in the angle of the sun increases with distance from the equator,
meaning that Hobart has substantially lower angled winter sun than other Australian
capital cities. Hollo (1995) suggests that in Hobart (latitude 42ºS) the angle of the
midday sun in mid winter is 24º, increasing to 70.5º in mid summer. This is significantly
different to Brisbane, at latitude 27ºS, where the angle of the midday sun is 39º in mid
winter and 80º in mid summer. This illustrates the need for varying shading devices
according to location as well as orientation. The size of roof overhangs and eaves (a
primary shading device) should be determined by calculating the length required to
prevent insolation during the summer when the sun is high in the sky, yet still allow the
lower winter sun to penetrate the building. There are a variety of computerised tools
available to perform this calculation to provide maximum benefit, however the
installation of standard eaves will generally increase thermal performance (Crocombe,
2007, Smith and Pitts, 1997).
55
3.7. Building Heat Flows
The flows of heat in a building are largely governed by two of the laws of
thermodynamics (Fermi, 1956, VanNess, 1983):
1. Conservation of Energy: the increase in the internal energy of a system is equal to the amount of energy added by heating the system, minus the amount lost as a result of the work done by the system on its surroundings; and
2. Entropy: the entropy of an isolated thermodynamic system that is not in equilibrium will increase over time, approaching a maximum value.
The first law is important in understanding the flow of energy in and out of a building.
Rate of heat flow is proportional to differences in temperature, and inversely
proportional to the resistance of the path of heat. In relation to heat loss in a building,
this means that the flow of heat from the building interior to the exterior is
proportional to the difference in temperature between the inside and outside, and the
insulating properties of the building. The second law explains the direction of energy
flow, stating that energy will always flow from a warmer to a cooler body. In this case
of colder temperatures, heat inside the building will flow out.
Ballinger et al. (1992) states that the properties of construction materials that define
their thermal characteristics are: density and specific heat; absorptivity and emissivity;
reflectance and absorptance; conductance and resistance; and transmittance.
3.7.1. Density & specific heat
Density and specific heat are intrinsic properties of building materials that do not
dependent on mass or volume, but rather allow the measure of the thermal
performance of various building materials. Density is a measure of mass per unit
volume. Thermal properties that are dependent upon mass are both influenced by the
density of materials and the volume of the those materials specified in building design
(Ballinger et al., 1992, Tiwari, 1991). Specific heat is the amount of energy necessary to
cause 1kg of a material to be raised by 1°C. Units for specific heat are Joules per
kilogram degree or J/kg. °C (Ballinger et al., 1992, Tiwari, 1991). Density and specific
heat allow the calculation of thermal capacity, which is the thermal storage ability of a
building, and measured in J/°C. Thermal capacity is a representation of the
thermoregulatory ability of a building. A building with higher thermal capacity will have
56
greater capacity to delay the effects of changing external temperatures on the internal
environment (Ballinger et al., 1992, Tiwari, 1991).
The difference in time for internal and external temperatures to reach a specific heat by
transfer of energy through a building material is called time delay, and is a measure of the
temperature delaying effects of the thermal mass of the building on the internal
environment. Time lag is measured in hours, but can be used to calculate admittance,
which is a measure of a material‟s impedance to heat flow. Admittance allows the
quantification of a building material‟s ability to store and release energy over a diurnal
cycle for a 1°C temperature change, and is expressed as watts per square meter of
temperature or W/m2 °C. Each individual building material has a unique time lag,
which in combination represent the time lag of the building (Ballinger et al., 1992).
3.7.2. Absorptivity & emissivity
Absorptivity (ά) is the colour dependent ratio of thermal radiation an area of building
material will absorb in comparison to a perfect absorber (black body). Emissivity (έ) is
the ability of the surface of a material to radiate heat. Ballinger et al. (1992) defines
emissivity as the ratio of thermal radiation emitted per unit area of a surface to the
thermal radiation emitted per unit area by a black body at the same temperature.
Emissivity is a measure of the ability of a material surface to give off heat, and unlike
absorptivity it is not colour dependent. A black body is an object that absorbs all
radiation striking its surface, does not transmit or reflect any energy, and is able to
radiate energy that it absorbs (Ballinger et al., 1992).
3.7.3. Reflectance & absorptance
Reflectance (r) is a ratio of the energy that a surface does not absorb or transmit, and like
absorptivity is a ratio without units. Reflectance, emissivity, and absorptivity are all
properties of the surfaces of materials that determine thermal performance (Ballinger
et al., 1992).
Absorptance (a) is a ratio of the energy that a surface absorbs, while transmittance (t) is a
ratio of the energy transmitted by the material. The first law of thermodynamics states
that energy cannot be lost in a system, but simply changes form, therefore the total
incident energy (I) is equal to the reflectance plus absorptance plus transmittance
(Ballinger et al., 1992).
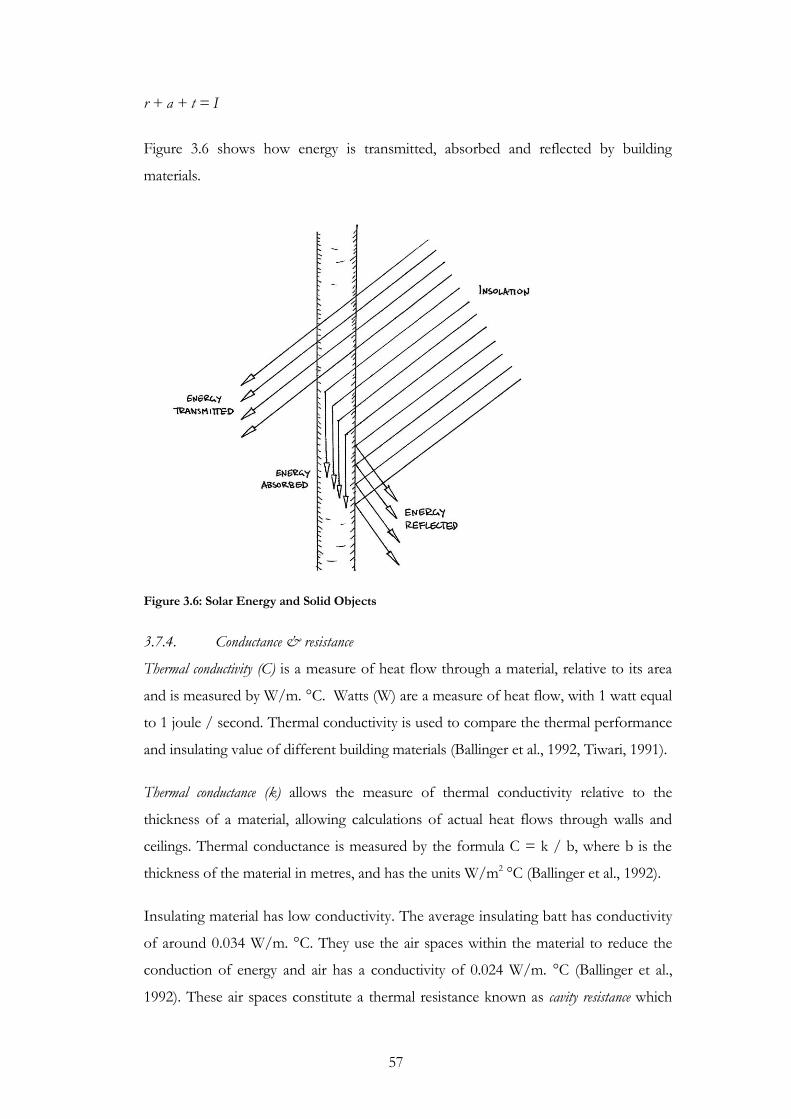
57
r + a + t = I
Figure 3.6 shows how energy is transmitted, absorbed and reflected by building
materials.
Figure 3.6: Solar Energy and Solid Objects
3.7.4. Conductance & resistance
Thermal conductivity (C) is a measure of heat flow through a material, relative to its area
and is measured by W/m. °C. Watts (W) are a measure of heat flow, with 1 watt equal
to 1 joule / second. Thermal conductivity is used to compare the thermal performance
and insulating value of different building materials (Ballinger et al., 1992, Tiwari, 1991).
Thermal conductance (k) allows the measure of thermal conductivity relative to the
thickness of a material, allowing calculations of actual heat flows through walls and
ceilings. Thermal conductance is measured by the formula C = k / b, where b is the
thickness of the material in metres, and has the units W/m2 °C (Ballinger et al., 1992).
Insulating material has low conductivity. The average insulating batt has conductivity
of around 0.034 W/m. °C. They use the air spaces within the material to reduce the
conduction of energy and air has a conductivity of 0.024 W/m. °C (Ballinger et al.,
1992). These air spaces constitute a thermal resistance known as cavity resistance which

58
accounts for the insulating properties of air spaces found not just within insulating
materials like batts, but also those spaces in pitched roofs and a large number of wall
types. Wood also has insulating properties, with a conductivity of 0.1 to 0.15 W/m. °C.
Insulation is discussed further in section 3.10.
Metals have a high conductivity (ranging from 40 to 400 W/m. °C), which is why they
feel cool to touch. Because of this high conductivity, metals can cause problems where
they perforate the insulating building envelope, resulting in heat loss by conduction.
While not as efficient conductors as metals, heavy materials such as masonry and
concrete have conductivities of 0.5 to 1.5 W/m. °C, which means they do not have
particularly good insulating properties, but this assists their ability to act as a source of
thermal mass (Ballinger et al., 1992, Tiwari, 1991).
Thermal resistance (R) is the opposite of thermal conductivity, and is a measure of a
material‟s ability to prevent the flow of energy. Thermal resistance is calculated by the
formula R = b / k and also has the unit W/m. °C. Thermal resistance allows the
calculation of the R value, used in classifying the insulating value of materials. R values
are defined as a measure of the ability of a thickness of material to resist the transfer of
energy, and are measured in m2.°C/W (Ballinger et al., 1992).
When examining transmission of heat energy from air on one side of a material to
another, it is important to consider surface resistance (1/f). This is a measure of a
material‟s resistance to the flow of energy from the air into the mass of the material,
and has the unit m2.°C/W. While it shares the same unit as the R value, it is a measure
purely of resistance to movement of energy past the surface, rather than through the
entire material. Surface conductance (f) has the unit of W/m2. °C (Ballinger et al., 1992).
Cavity resistance takes into account the insulating properties of air spaces that frequently
exist within buildings. Many wall and ceiling types contain air spaces, which provide
additional insulating value, as energy transfer across an air space is relative to the
temperature differences of the two surfaces within an air cavity. Ballinger et al. (1992)
note that thermal resistance of an air space is dependent upon:
surface emissivity – as radiation accounts for more than 60% of heat transfer as a result of the high emissivity of many building materials;
59
thickness of the cavity – particularly in tall, thin vertical air spaces, where resistance increases to a width of around 20mm, after which it remains constant;
heat flow direction – particularly in horizontal air spaces where resistance is higher to downward than upward convection, as a result of warmer air rising;
air space inclination – which has only a minor impact;
surface texture – roughness or corrugations will increase surface area, which will have minor effects on energy flows; and
ventilation – additional flows as a result of ventilation of the air space will reduce the resistance of the airspace to energy transfer.
3.7.5. Transmittance
Thermal transmittance (U) is commonly known as the U-value, and is a measure of the
total energy flow between internal and external air in a building. Transmittance is
measured in units W/m2. °C (Ballinger et al., 1992).
Transmittance can be calculated using the previously explained properties, and is defined by the following formula:
U = 1/(1/fo + b1/k1 + b2/k2 + bn/kn + 1/f1)
where:
1/fo = external surface resistance (m2.°C/W)
1/f1 = internal surface resistance (m2.°C/W)
b1,b2 & b3 = thickness of building materials that make up the structure (m)
k1,k2 & k3 = thickness of building materials that make up the structure (W/m. °C)
3.7.6. Material transparency
The penetration of solar energy (insolation) into buildings varies greatly according to
the opacity or transparency of buildings. As a result, the placement of transparent
materials in a building can greatly affect a thermal performance, and as such materials
are integral in passive design. Section 3.8 discusses in detail the use of glazing in
residential buildings.
When solar radiation strikes a transparent material such as glazing, some of this
radiation will be reflected or absorbed, however a significant amount of this radiation

60
will be transmitted through the material. The properties of the material, including its
colour, chemical structure and cleanliness will affect what proportion of radiation is
reflected, absorbed and transmitted.
Solar radiation is a considerably smaller wavelength than terrestrial radiation emited by
the earth and solid objects. The wavelength of solar radiation that strikes the earth
ranges from 0.2-2.5 microns, whereas terrestrial radiation ranges between 4 and 100
microns. According to Ballinger et al. (1992) standard window glass will transmit
radiation in the range of 0.3-3 microns, and is opaque to radiation outside that range.
Resultantly, glazing will not be transparent to energy radiated from objects within the
building envelope and can only be lost by conduction, convection, or penetration of
the building envelope. This is the principle by which garden greenhouses operate, and
is also exceptionally important in passive solar heating (Ballinger et al., 1992).
Figure 3.7: Re-Radiation and the Building's Greenhouse Effect
Shading coefficient is a rating applied to windows and compares a window‟s
transmission of energy to an average value. It is the ratio of solar heat gain to that of
3mm glass, subject to the same conditions (Ballinger et al., 1992).
While transparent materials allow the transmission of energy, opaque materials allow
heat exchange through the process of conduction. Energy will flow from an airspace
with higher temperature to that of a lower temperature, meaning that when cooler
outside heat will be lost through the building envelope. Likewise, conduction allows
the transfer of energy from outside the building envelope if it‟s warmer, or if solar

61
radiation warms the outer surface. Sunlight striking the roof or walls of a building will
have a warming effect by changing the effective temperature difference, dependent
upon the thermal transmittance of the building materials. Darker materials have a
higher absorptivity and lower emissivity, and will heat up more than lighter materials,
which have lower absorptivity and higher emissivity. Therefore, darker surfaced will
absorb more energy than lighter surfaced materials.
3.7.7. Building test boxes
A number of studies have been conducted using controlled test boxes that simulate
heat flows that occur in residential buildings, including a study by Fanger (1972) that
has largely informed the development of existing thermal comfort standards. While
such studies are of use in determining energy flows through building materials, their
actual application is widely debated. Grimmer et al. (1979) conducted tests on a series
of metre-sized passive solar test boxes, with each one incorporating different elements
of passive solar design. The performance of the boxes was able to be computer
modeled, however they did not accurately resemble a scaled model of a building.
3.8. Glazing
Glazing allows warming sun to penetrate the building envelope, making it an important
part of a passive building. Despite this benefit, the incorrect placement and type of
glazing can be very detrimental to thermal performance. Glass is transparent to short
wave radiation, yet it does not transmit long-wave thermal radiation. This means glass
allows solar access to the building while trapping heat inside, which is very important
when it is colder outside (Crocombe, 2007)(Reardon et al., 2005, Wrigley, 2005).
The location of glazing on a building is important for more than just visual and lifestyle
purposes. Glazing must be located to maximise sun during the winter, yet not allow
overheating during the summer (Al-Azzawi, 1991, Hollo, 1995). Wherever possible,
larger areas of glazing should be situated on the northern side of the building, and
glazing to the east, west and most importantly south should be minimised (Al-Azzawi,
1991, Crocombe, 2007, Reardon et al., 2005). Windows on the eastern and western
sides can also be effective at capturing morning and evening sun, however excessive
glazing on three sides of the building can result in insufficient levels of insulation and

62
unnecessary heat loss. Windows facing east and west can also expose the building
interior to excessive insolation in summer mornings and evenings when the sun is at a
lower angle, resulting in excessive heat and additional air conditioning requirements.
Shading of eastern and western glazing can help to mitigate this overheating.
Windows on the southern side of buildings should be kept to a minimum, however
they can be important in retaining suitable levels of amenity by allowing light into
darker areas, or providing access to attractive vistas. Intelligently placed smaller
windows; windows shaded from the sun at lower levels by foliage, louvers (see Figure
3.8), courtyards or other shading devices; or windows with coloured or shaded glass are
appropriate in such instances. Ideally, wherever glazing is on the northern side of the
building, the east, west and south facing glazing should be kept to a minimum (Al-
Azzawi, 1991, Hollo, 1995, Reardon et al., 2005, Smith and Pitts, 1997).
Figure 3.8: Louvres as a Seasonal Shading Device
63
Attitudes differ with regard to the area and placement of glazing. While it may seem
preferable to include glazed areas as large as possible in building design, and
calculations based on energy criteria alone show benefits in glazing areas of as much as
50% of floor area, this excess of solar gain can cause thermal discomfort during the
summer and on days with higher levels of solar radiation, as well as increasing other
problems in direct gain systems. The Building Code of Australia (BCA) Clause J2.3
specifies how much glazing can be used in buildings under a wide range of conditions,
and the Australian Building Codes Board (ABCB) provides online calculators to
determine if glazing meets the requirements set out in the code.
3.8.1. The importance of shading and insulating glazing
Glazed areas such as windows and skylights are areas of low insulation, making them a
source of heat loss (Crocombe, 2007, Lerner, 1998). This loss can be minimised by the
use of double-glazing, insulating curtains and pelmets. One of the best ways to
minimise heat loss due to glazing is to minimise the use of southern, eastern and
western glazing that does not provide solar gain, but rather acts as a location of heat
loss (Al-Azzawi, 1991).
Glazing can also result in overheating during the summer, and it is important to shade
windows to prevent this, even in temperate and cool temperate regions. External
devices such as external shutters, eaves, louvers, pergolas and blinds are effective
methods of shading, as is the planting of suitable trees (Lerner, 1998, Windust, 2003,
Wrigley, 2005). Solar pergolas and shutters are particular desirable as they can open and
close when required to provide valuable external reflection of insolation or alternatively
allow the penetration of warming sunlight (Hollo, 1995, Wrigley, 2005).
External shading is generally more effective, as it reflects energy before it enters the
building envelope. Unlike external shading, internal blinds will be warmed by sunlight,
and allow window frames and architraves to be similarly warmed (Reardon et al., 2005,
Wrigley, 2005). Despite this, they can be quite effective and frequently easier and more
cost effective to install (Reardon et al., 2005, Wrigley, 2005).
Intelligently selected and located plantings are another method of externally shading a
building. As a general rule, the northern side of a building should feature deciduous
trees, allowing the penetration of sun during the winter when the trees have shed their
leaves but providing shading of the roof and windows during summer when the foliage

64
is thick (Hollo, 1995, Reardon et al., 2005). Planting evergreen trees and tall bushes to
shade glazing on the eastern and western sides of a building can prevent direct sunlight
from penetrating to the glazing yet allow diffused light and retain amenity levels.
Appropriate plantings are illustrated in Figure 3.9.
Figure 3.9: Plantings for Appropriate Light & Shade
While glazing is an important source of insolation, it can also be the location of
unnecessary heat loss (Lerner, 1998). Glazing should be insulated wherever possible to
minimise this energy transfer, and windows should be oriented towards the north
(Lerner, 1998, Reardon et al., 2005). There are a variety of methods that can be
employed to prevent unnecessary heat loss through glazing. Heavy curtains are an
effective and relatively inexpensive method. The air space between the glazing and the
curtain works as an insulating barrier. Drapery is most effective when reaching down to
floor level and in combination with heavy pelmets. At the present time there is cultural
resistance to curtains, with many people preferring a modern curtain free look, in many
cases to the detriment of their thermal comfort or resulting in unnecessary energy
expenditure.
Another method of reducing heat loss through glazing, and a possible solution to
people‟s desire to not employ curtaining, is the installation of double-glazed windows.
Double-glazing is the practice of installing two parallel separate sheets of glass in a
window, separated by a space of 12-20mm. The thin air space reduces the likelihood of
65
convection currents, which move cold and warm air across the air space, increasing
undesired heat loss or gain. This space can be filled with air, or alternatively gases such
as argon, or a vacuum to further reduce the transfer of energy across the space.
Double-glazed windows require specially fitted frames and can present considerable
cost to home builders or retrofitters, but the finished product will generally look
identical to regular windows; provide increased thermal comfort and light; and in many
cases the resultant heating and energy savings can quickly offset the additional cost of
purchase and installation (Wrigley, 2005). Double-glazing is particularly effective in
colder climates, and when used in conjunction with heavy curtain insulation can almost
remove extra heat loss of glazed areas (Reardon et al., 2005).
The use of reflective films can also further reduce heat loss, to prevent excessive
insolation during summer, or to reduce glare (Hollo, 1995). Low e glazing is coated
with a film that reflects long wave radiation either back into or out of the building. In
this way it can help to keep heat either in or out of the building envelope. The film is
generally placed on the inside surface of double-glazed windows (Hollo, 1995, Reardon
et al., 2005). More information on the insulation of glazing is given in section 3.10 on
insulation.
Skylights allow natural light into dark areas that are inaccessible to conventional
windows (Crocombe, 2007, Lerner, 1998, Wrigley, 2005). If used inappropriately,
however, skylights can exacerbate problems in regulating the thermal environment.
Skylights can allow valuable insolation into a building, but if not properly shaded,
excess solar energy can cause overheating during warm months (Lerner, 1998, Reardon
et al., 2005). If not properly insulated, skylights can result in significant heat loss at
night and in colder months. Ideally a skylight should comprise insulating properties at
ceiling level, preventing heat from rising up into the roof cavity, and have mobile
external shading to prevent unnecessary sunlight from entering the building. A more
suitable alternative to skylights are clerestory windows. These are vertical windows
positioned between two roof planes, frequently on skillion roofs (Figure 3.10). Vertical
positioning allows the implementation of eaves to shade from summer sun, yet winter
sun is still allowed to penetrate. They can be insulated similarly to other windows, using
double-glazing or internal curtains and shutters (Hollo, 1995, Reardon et al., 2005,
Wrigley, 2005).
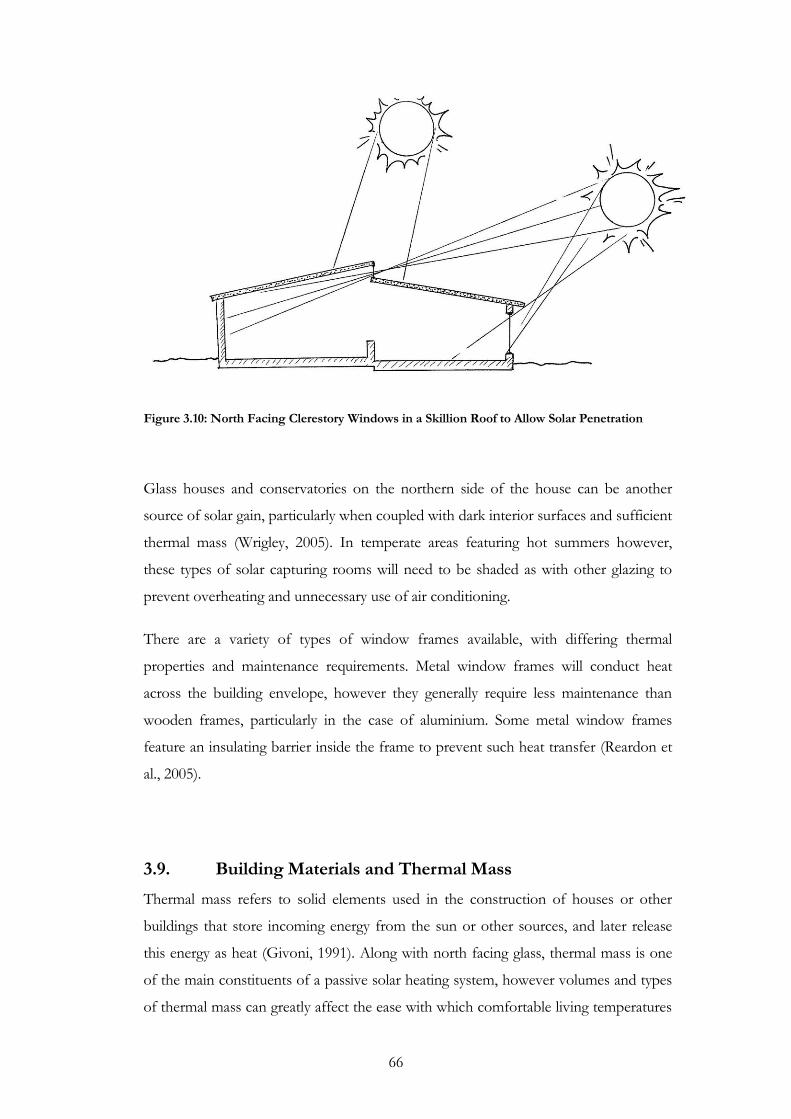
66
Figure 3.10: North Facing Clerestory Windows in a Skillion Roof to Allow Solar Penetration
Glass houses and conservatories on the northern side of the house can be another
source of solar gain, particularly when coupled with dark interior surfaces and sufficient
thermal mass (Wrigley, 2005). In temperate areas featuring hot summers however,
these types of solar capturing rooms will need to be shaded as with other glazing to
prevent overheating and unnecessary use of air conditioning.
There are a variety of types of window frames available, with differing thermal
properties and maintenance requirements. Metal window frames will conduct heat
across the building envelope, however they generally require less maintenance than
wooden frames, particularly in the case of aluminium. Some metal window frames
feature an insulating barrier inside the frame to prevent such heat transfer (Reardon et
al., 2005).
3.9. Building Materials and Thermal Mass
Thermal mass refers to solid elements used in the construction of houses or other
buildings that store incoming energy from the sun or other sources, and later release
this energy as heat (Givoni, 1991). Along with north facing glass, thermal mass is one
of the main constituents of a passive solar heating system, however volumes and types
of thermal mass can greatly affect the ease with which comfortable living temperatures
67
can be maintained in the majority of houses (Ewers, 1977, Kalogirou et al., 2002, Kosny
et al., 2001, Reardon et al., 2005, Smith, 2009, Yudelson, 2007).
The value and importance of thermal mass in both passive solar systems and houses in
general has been widely debated over time, and the concept of mass as a form of
thermal storage has been around longer than conventional houses. Native American
dwellings in the US and Mexico used thermal mass in the form of adobe brick or earth
to minimise wide temperature fluctuations throughout the day and night. Likewise,
masonry and brick fireplaces have long been used to store heat that is released slowly
throughout the night, long after the fire has died out (Anderson, 1980).
3.9.1. What is thermal mass?
There are a wide range of materials used in the construction of residential buildings,
which all have unique properties. Building materials are capable of reflecting, capturing,
and distributing energy, and an understanding of how different materials interact with
energy is important in passive design. Thermal mass refers to the elements of a
building that capture and store energy from the air or from insolation. This energy is
stored within the mass as thermal energy heat (Givoni, 1991, Kosny et al., 2001,
Reardon et al., 2005, Smith, 2009). Thermal mass is a vital constituent of a passive
solar system. Passive solar systems are discussed in detail in Section 3.3.
The type, placement, colour and density of thermal mass will impact effectiveness. This
section will examine in detail the benefits of thermal mass; various techniques for
introducing thermal mass into a home; and how thermal mass can be used with
maximum efficacy.
The primary role of thermal mass in residential buildings is the regulation of the air
temperature of the living space. Through the storage of heat for later release into the
air space, thermal mass can effectively minimise peaks in temperature, and mitigate or
relocate them these peaks to a time that is later than the temperature peaks of the
outside air (Hollo, 1995, Shaviv et al., 2001, Givoni, 1991, Tiwari, 1991, Smith, 2009,
Reardon et al., 2005). The result is that when the air temperature outside the home
drops, it remains comfortable inside, as it also does when temperature outside rises. If
installed incorrectly the problems of cold nights and hot days can be exacerbated, and
so guidelines need to be followed in the design and implementation of thermal mass in
the home (Givoni, 1991, Tiller and Creech, 1996).
68
Thermal mass can also act as a heat sink in warmer seasons and climates, helping to
offset excessive heat (Kosny et al., 2001). Thermal mass reduces peaks and troughs in
temperature, and has the effect of mitigating temperature swings, and as such is
potentially the most important feature of passive design (Kosny et al., 2001).
3.9.2. Implementation of thermal mass
Many materials commonly used in the construction of residential buildings are
excellent providers of thermal mass. In many cases it is not necessary to radically alter
plans when designing a house, or make drastic changes to a building structure when
retrofitting a building to include sufficient thermal mass to implement the principles of
passive solar heating (Ewers, 1977, Reardon et al., 2005, Smith, 2009, Yudelson, 2007).
While there are basic guidelines for the implementation of thermal mass in residential
buildings, with details on the volume, thickness, materials, location and orientation, the
exact specifications for installation are often debatable, generic or unclear. This section
will examine the existing information on installation and briefly examine the principles
involved in thermal mass.
Thermal mass is incorporated into two different kinds of passive solar heating systems.
Direct gain involves the positioning of thermal mass inside the living space, turning the
room into an all-in-one solar heater (Smith and Pitts, 1997). The thermal mass is
generally situated in the floor, as an interior wall, or as the inside part of an exterior
wall. Indirect gain systems involve the situation of thermal mass between the living space
and the sun, and heat stored is transported into the living space. Similar principles
apply to both thermal mass systems (Smith and Pitts, 1997)(Grimmer et al., 1979,
Hollo, 1995, Mazria, 1979, Reardon et al., 2005, Smith, 2009, Tiwari, 1991).
The temperature of thermal mass fluctuates with the surrounding temperature . In an
indirect system, the resultant effect is that as each layer of thermal mass heats it passes
excess thermal energy to the following layer, and if solar radiation is falling on the
outside of a building it will eventually be transferred into the living space (Anderson,
1980, Reardon et al., 2005). This process is generally less effective than direct systems.
In a direct gain system, the temperature change in the air adjacent to the thermal mass
results in a time lag where heat stored during the day is released as the air cools during
the night (Givoni, 1991, Smith and Pitts, 1997). This allows the thermal mass to
69
provide heating and cooling benefits and minimise temperature fluctuations both
during the day and the night, which can have significant health benefits to the occupant
(Grimmer et al., 1979, Hollo, 1995, Mazria, 1979). The utilisation of thermal mass can
be equally as important in houses that are not using a passive solar heating system, and
thermal energy from other sources such as electric heaters and fireplaces can be stored
for release as air temperature drops (Anderson, 1980, Reardon et al., 2005, Smith and
Pitts, 1997).
3.9.3. Types of thermal mass
There are a variety of different materials that are suitable for use as thermal mass
including: adobe, brick and other masonry; concrete; water; and phase change
materials. The most cost effective and common of these materials are concrete, water
and masonry, and they are generally the easiest to install. Masonry is generally in the
form of concrete, adobe, brick or stone, or a combination of these. Water is generally
contained in black plastic or metal containers. The thermal absorbance properties of
these materials have been studied comprehensively, and Mazria (1979) for instance,
determined that adobe has the lowest thermal conductivity and water has the highest,
with concrete and brick in between. The earth also can act as thermal mass, and some
researchers such as Hollo (1995) indicate that where possible the slab should rest on
the ground rather than be raised. This is particularly useful for mitigating temperature
swings in warmer climates however, and the excess amount of thermal mass available
as a result of slabs being in direct contact with the earth can result in desirable heat
being siphoned away. Smith (2009) suggested that with basements that had attached
sunrooms as a passive heating and cooling tool, slabs should be insulated to prevent
heat loss.
The solar house project conducted by the Tasmanian College of Advanced Education
in 1983 employed vertical solar walls that utilised 65% of the area of the north facing
wall of the house, using concrete walls in one house and water in another. Concrete,
which is a common and standard building material, was noted to have acceptable heat
storage, and to be economic to implement in most houses. Water on the other hand,
while less conventional and requiring more deliberation in implementation, has a
higher heat capacity and can thermocirculate, allowing a higher thermal conductivity
(Sutton and McGregor, 1983, Tiller and Creech, 1996).
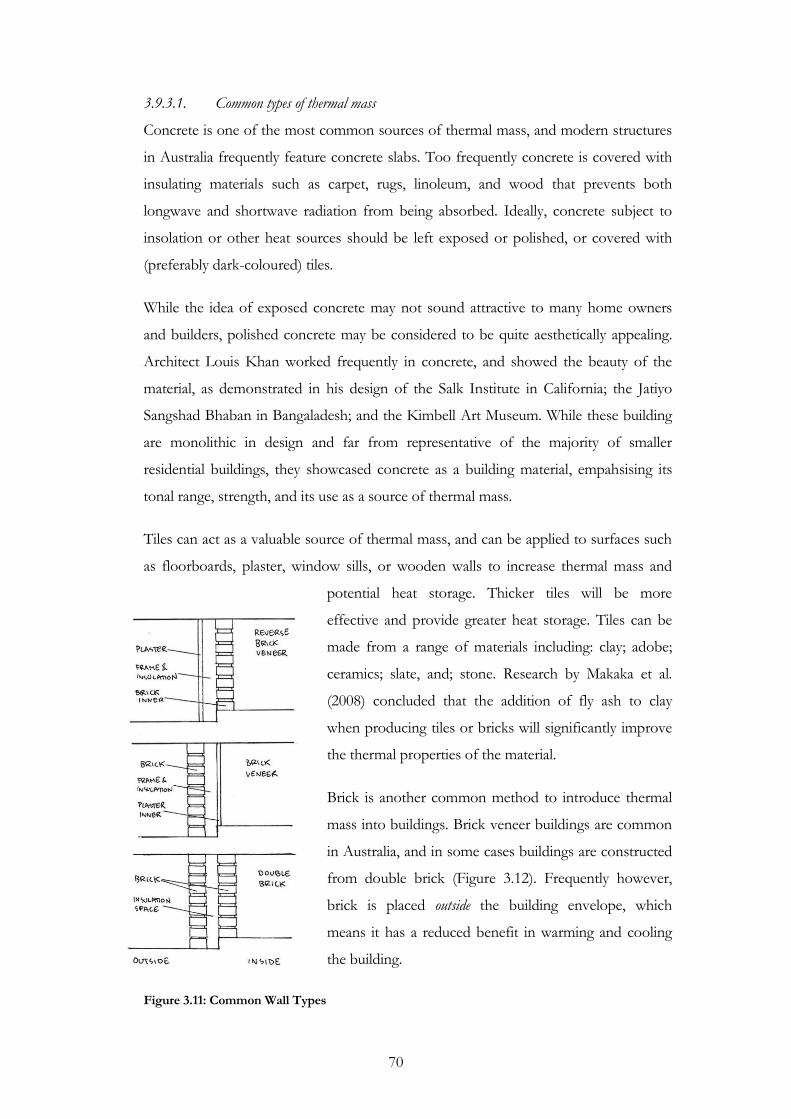
70
3.9.3.1. Common types of thermal mass
Concrete is one of the most common sources of thermal mass, and modern structures
in Australia frequently feature concrete slabs. Too frequently concrete is covered with
insulating materials such as carpet, rugs, linoleum, and wood that prevents both
longwave and shortwave radiation from being absorbed. Ideally, concrete subject to
insolation or other heat sources should be left exposed or polished, or covered with
(preferably dark-coloured) tiles.
While the idea of exposed concrete may not sound attractive to many home owners
and builders, polished concrete may be considered to be quite aesthetically appealing.
Architect Louis Khan worked frequently in concrete, and showed the beauty of the
material, as demonstrated in his design of the Salk Institute in California; the Jatiyo
Sangshad Bhaban in Bangaladesh; and the Kimbell Art Museum. While these building
are monolithic in design and far from representative of the majority of smaller
residential buildings, they showcased concrete as a building material, empahsising its
tonal range, strength, and its use as a source of thermal mass.
Tiles can act as a valuable source of thermal mass, and can be applied to surfaces such
as floorboards, plaster, window sills, or wooden walls to increase thermal mass and
potential heat storage. Thicker tiles will be more
effective and provide greater heat storage. Tiles can be
made from a range of materials including: clay; adobe;
ceramics; slate, and; stone. Research by Makaka et al.
(2008) concluded that the addition of fly ash to clay
when producing tiles or bricks will significantly improve
the thermal properties of the material.
Brick is another common method to introduce thermal
mass into buildings. Brick veneer buildings are common
in Australia, and in some cases buildings are constructed
from double brick (Figure 3.12). Frequently however,
brick is placed outside the building envelope, which
means it has a reduced benefit in warming and cooling
the building.
Figure 3.11: Common Wall Types
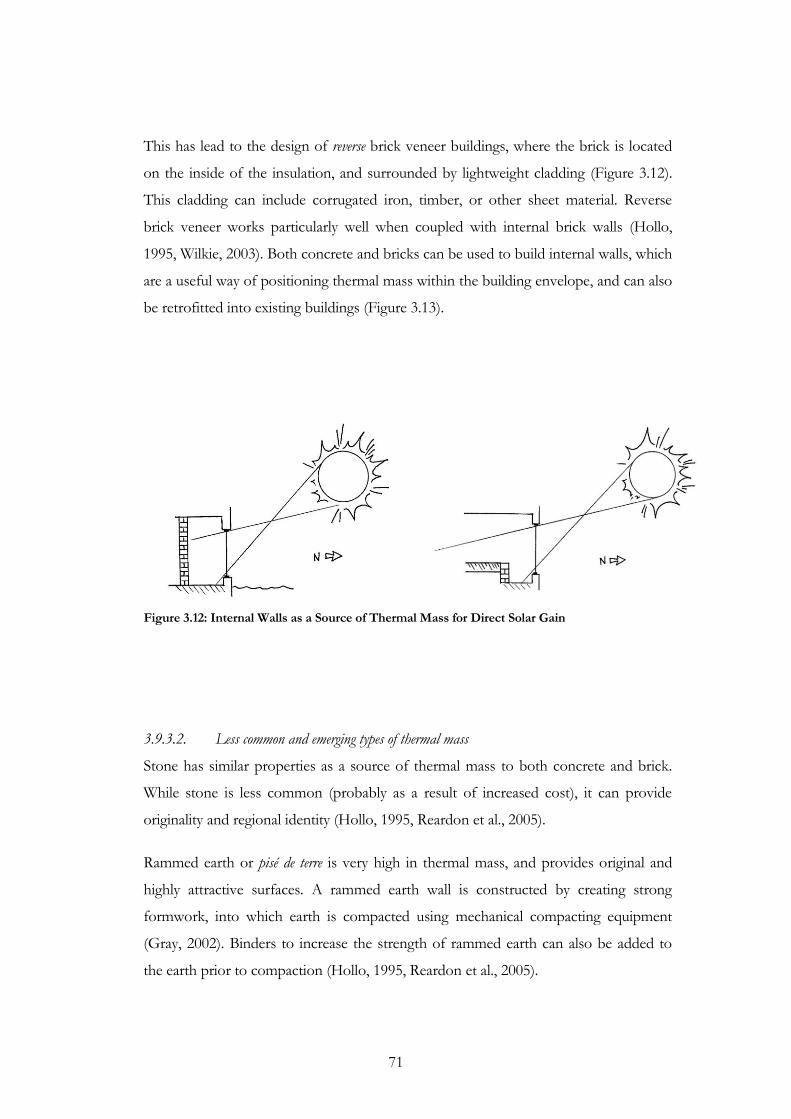
71
This has lead to the design of reverse brick veneer buildings, where the brick is located
on the inside of the insulation, and surrounded by lightweight cladding (Figure 3.12).
This cladding can include corrugated iron, timber, or other sheet material. Reverse
brick veneer works particularly well when coupled with internal brick walls (Hollo,
1995, Wilkie, 2003). Both concrete and bricks can be used to build internal walls, which
are a useful way of positioning thermal mass within the building envelope, and can also
be retrofitted into existing buildings (Figure 3.13).
Figure 3.12: Internal Walls as a Source of Thermal Mass for Direct Solar Gain
3.9.3.2. Less common and emerging types of thermal mass
Stone has similar properties as a source of thermal mass to both concrete and brick.
While stone is less common (probably as a result of increased cost), it can provide
originality and regional identity (Hollo, 1995, Reardon et al., 2005).
Rammed earth or pisé de terre is very high in thermal mass, and provides original and
highly attractive surfaces. A rammed earth wall is constructed by creating strong
formwork, into which earth is compacted using mechanical compacting equipment
(Gray, 2002). Binders to increase the strength of rammed earth can also be added to
the earth prior to compaction (Hollo, 1995, Reardon et al., 2005).

72
Straw bale and mud brick (adobe) provide both a mix of thermal mass and insulating
properties (Gray, 2002, Lerner, 1998, Steen et al., 1994). Clay soil is mixed with water
and straw and moulded into brick shapes. The earth gives the bricks thermal mass,
while the straw helps bind the clay together and adds insulating properties (Gray, 2002,
Lerner, 1998, Steen et al., 1994).
A combination of straw bale exterior walls and rammed earth internal walls can help
produce very thermally efficient houses. The thermal mass of the rammed earth stores
heat within the building, while the insulating properties of the straw bale exterior walls
keep this heat from leaving once it is released into the air space (Gray, 2002). In the
warmer months, the straw bale insulates the building interior from unwanted external
heat, while the interior thermal mass of the rammed earth will provide a heat sink if
inside air temperatures begin to rise (Gray, 2002, Steen et al., 1994). This warm air can
be flushed at night as the house is ventilated (Reardon et al., 2005).
The earth below a building can be used as a source of thermal mass, particularly in
warmer climates, where an abundance of thermal mass can cool a building (Gray,
2002). It can even be appropriate to locate buildings below (or partially below) the
surface of the earth. Being surrounded by such a large abundance of thermal mass can
help buildings in uncomfortably warm climates to avoid high peaks in internal
temperature, and this negates additional associated air conditioning costs (Gray, 2002).
Anselm (2007) examined the benefits of earth as a source of thermal mass, and how
sunken earth houses can support comfortable living conditions.
Water has been used as a source of thermal mass with varying degrees of success,
dependent on its application. Water is very high in thermal mass, and as it heats it
creates currents that move the heat around the water allowing it to more efficiently
store energy. The effective application of water as a source of thermal mass can be
difficult. Dark coloured tanks and drums are the most effective method, and can be
situated in areas of high solar gain (Figure 3.14). Water stored in a series of smaller
tanks can be easier to implement, but will be less effective, as it will not allow the
movement of water to effectively distribute the heat throughout the thermal mass.

73
Figure 3.13: Water as a Source of Thermal Mass
Tiwari (1991) presented the design of a non-airconditioned passive solar house that
was suitable for cold climates, such as Srinigar, India. Conventional sources of thermal
mass such as masonry and concrete are virtually absent in building practices in the
region. Houses consist primarily of timber, galvanised iron sheet, and glass and the
design uses water as source of thermal mass. Water is contained within a wall at the
rear of the house. Water drum walls operate in a similar fashion to thermal storage
walls (see section 3.14), and consist of two dark coloured metallic sheets on the side of
the house with the most solar exposure, filled with water containers to reduce the
possibility of leakage. To prevent longwave radiation escaping, the outer side of the
wall has a large sheet of glass covering it, with an air space in between. A similar
method suggested by Tiwari (1991) is known as a transwall, and consists of sheets of
thick toughened glass that create the outer layers of the wall, with a central sheet of
Perspex running through the centre of the wall to give it strength. Transwalls do not
face the corrosion problems of water drum walls, and have the added benefit of
allowing light into the living space. Transwalls were determined to have higher thermal
performance than other methods of using water as thermal mass in wall spaces (Tiwari,
1991). Pools and ponds are a less effective source of thermal mass, as they are difficult
to install internally, and traditionally feature lighter coloured surfaces beneath the water,
meaning that solar radiation is reflected away.
3.9.4. Thermal mass colour and surfaces
Appropriate surfaces must also be used if thermal mass is to be effective. Dark colours
and matte finishes reflect less and absorb more incoming solar radiation, with the
74
added bonus of glare reduction (Hollo, 1995, Tiller and Creech, 1996, Givoni, 1991,
Reardon et al., 2005). Masonry can be covered with drywall (such as plaster board), so
long as it is attached directly with no airspace in between (Tiller and Creech, 1996).
Floor areas should be made from masonry, concrete, or tiles, and should not be
carpeted or covered with mats in areas that receive insolation, as they reduce the
amount of incoming solar radiation that the thermal mass receives and absorbs
(Givoni, 1991, Hollo, 1995, Reardon et al., 2005, Tiller and Creech, 1996).
Tiled roofs are a common source of thermal mass, and are in many cases subject to
large amounts of insolation. In warmer climates or temperate climates that have
uncomfortably hot summers, darker colour roof tiles can result in unnecessary heating
of buildings, and should therefore be avoided.
3.9.5. How is thermal mass measured and tested?
The unit of “specific heat” can be used to measure heat capacity of materials. This is
the amount of heat per unit mass required to raise the temperature of the material by
1C. This can be expressed as the equation Q = c m T, where:
Q = the heat added to the material;
c = the specific heat of the material;
m = the mass of the material; and
T = the change in temperature of the material (Anderson, 1980).
Measuring the effectiveness of thermal mass in terms of its ability to regulate air space
temperature is significantly more complicated and must be done on a case-by-case
basis for each building. Environmental temperature is one method of measuring this
and is a combination of air temperature and radiant temperature.
The main properties that determine the effectiveness of thermal mass are: surface area;
thickness; heat capacity; and conductivity. Heat capacity is a function of specific heat
and mass. As the majority of common materials used as thermal mass have similar
specific heat, heat capacity is generally a function of volume and density of a material
(Givoni, 1991). Diurnal heat capacity is a measure of the capacity of a solar space to store
incoming solar radiation, and release this energy into the air as temperatures drop, and
is defined as: the energy stored in the material and returned to the indoor space in the

75
diurnal cycle, per unit surface area, for one degree diurnal swing in the surface
temperature of the storage element, in Wh/m2k” (Givoni, 1991).Increases in diurnal
heat capacity with an area of glazing will lead to improved thermal performance. As a
result diurnal heat capacity is related to solar penetration, and minimum heat storage is
related to the size of solar glazing (Givoni, 1991).
3.9.6. How much thermal mass should be used?
It is important when implementing thermal mass into a building structure that correct
types and volumes are used, dependent on solar access, orientation and mass type. Too
little thermal mass and a building will not be able to store enough energy to effectively
thermoregulate. Too much thermal mass and it will act like a heat sink, slowing down
the heating process and in many cases increasing thermal discomfort.
Guidelines for the implementation of thermal mass frequently contain varying or vague
specifications as to exactly how much thermal mass should be used in different
dwellings. Mazria (1979) examined a school in the northern hemisphere that used
concrete 18-25cm thick for the floors and roof, and 23cm thick brick for the interior of
the north wall and internal walls, with the south wall being predominantly double-
glazed glass to complete the passive solar system. The volume, thickness, location,
orientation and surface area of thermal mass all have an impact on its effectiveness in
regulating the temperature of air in residential living spaces.
Anderson (1980) suggested that generally the more thermal mass the better, as more
would provide greater exposure to thermal radiation, and greater storage of heat,
thereby minimising air temperature fluctuations. Too much thermal mass however can
also be a problem, because if there is insufficient incoming thermal radiation to
adequately heat the thermal mass, insufficient heat will be released as the air space
cools and temperature will not be regulated effectively.
Guidelines for the correct volume of thermal mass for optimum regulation of
temperature are not adequately developed. Anderson (1980) indicates that a rule of
thumb for volume of thermal mass receiving direct solar radiation is “each square foot
of glass requires enough mass to store 30 Btu for each degree F of change in
temperature”. A cubic foot of water can store 62.4 Btu and a cubic foot of concrete
can store 28 Btu. This equates to roughly enough mass to store 608.35 KJ per each
square metre of glass for each degree C change in temperature, which would require
76
roughly 0.02 cubic metres of concrete or 0.01 cubic metres of water. For thermal mass
that is not exposed to solar radiation and uses air heat, as much as four times this mass
is required (Anderson, 1980).
The thickness of thermal mass can also have an impact on its effectiveness. If walls are
too thin, then vital heat will be lost due to overheating, lowering the fraction of stored
useful heat. Alternatively if they are too thick, then surface temperature needs to be
higher to obtain a flow of heat back into the room, which can greatly lower efficiency,
particularly where thermal mass is in the form of a solar wall (Sutton and McGregor,
1983). Tiller and Creech (1996) suggest that thermal mass is more effective when
thinner and more widely spread, rather than concentrated into a small area, and that in
passive solar systems the area of thermal mass should be three to six times that of the
area of north facing windows.
Roaf et al. (2001) give rough guidelines on the appropriate thickness of thermal mass,
suggesting that a thickness of 10cm is appropriate for each exposed surface (i.e. double
thickness if both sides are exposed to the air space) with gains becoming negligible
with thicker mass, dependent on location and surface area, and thinner mass having
significant performance penalties. This would need to be varied however in climates
where outside air temperature changes are more extreme, to increase or decrease the
time lag of heat release.
3.9.7. Placement of thermal mass
Correct orientation of thermal mass in direct sunlight will allow heating of the mass
without surrounding air being heated at the same time (Reardon et al., 2005, Tiller and
Creech, 1996). This means the activity of the thermal mass is not limited by
temperature swings in the air space that may lead to thermal discomfort. Where
thermal mass does not receive solar heat directly, the surrounding air must first heat
and then transfer this heat to the thermal mass. This is a less desirable method of
utilising thermal mass as it is less effective both in storing temperature and at
minimising fluctuations in air temperature. Anderson (1980) and Tiller and Creech
(1996) suggest that heat transfer from the air generally requires around four times as
much mass to store the same amount of heat energy as thermal mass in direct sunlight.
Overall, locating thermal mass in direct sunlight is important in ensuring the
effectiveness of thermal mass.
77
Thermal mass is generally positioned either as the base of the house or alternatively
vertically as an internal or external wall. Vertically positioned thermal mass walls can be
located either in the centre of the room, as internal walls or fireplaces, or as the interior
of external walls insulated from the outside air (Anderson, 1980, Reardon et al., 2005,
Tiller and Creech, 1996).
3.9.8. Retrofitting for suitable thermal mass
There are a number of methods in which thermal mass can be introduced into existing
buildings, with varying levels of effort, change to the building, and expense. Frequently,
one of the quickest and easiest methods of improving levels of thermal mass is to
remove carpet from concrete floors exposed to significant insolation.
Installation of internal brick walls is one method that thermal mass can be introduced
into the building envelope. Section 3.9.3 examines types of thermal mass, including a
variety of wall types and materials. Reverse brick veneer (Figure 3.12) can be used to
locate thermal mass within the building envelope. Figure 3.13 shows other methods in
which internal walls, exposed to solar radiation by placement near windows, can locate
thermal mass within the building envelope. Such walls can be built from a variety of
materials, including brick, adobe or rammed earth, and can take the form of floor to
ceiling walls creating new internal spaces, or shorter structures such as those
supporting kitchen benches (Gray, 2002, Reardon et al., 2005).
3.9.9. Thermal mass vs lightweight construction
There are also situations where lightweight construction may be more appropriate than
those containing large volumes of thermal mass (Lerner, 1998). Lightweight buildings
can be quicker to heat, and if insulated heavily can provide appropriate living
conditions. Dependent on climate and occupant lifestyle, it may be more appropriate
to construct a dwelling that can be quickly heated, providing that there is sufficient
insulation to contain this heat and maintain thermal comfort levels (Hollo, 1995,
Lerner, 1998). Buildings that are occupied less of the time, and are without proper solar
access, may have difficulties in warming to adequate temperatures if cold excesses of
thermal mass are drawing this warmth from the air. Some occupants may prefer a
dwelling that is quick to be raised to comfortable temperatures where this heat is not
required to be maintained constantly. It may also be appropriate to build lightweight
buildings in warmer climates, where the ability to quickly ventilate is advantageous.

78
Such designs include the “Queenslander” which was developed as a result of the
warmer climates, and features lightweight design coupled with under floor ventilation,
extensive shading, and outdoor living spaces (Hollo, 1995).
3.9.10. FFurther Investigation
The principles of thermal mass have been well described in literature, and the benefits
of its correct application are widely recognised. Thermal mass in combination with
north facing sun exposure can be an effective way to thermoregulate the air in
residential living spaces, by absorbing incoming solar radiation or heat from the
surrounding air for release as external air temperatures drop.
While a moderate amount of literature on thermal mass has been written, more
comprehensive guidelines for its installation which cover: volume; area; exposure, and;
material type could be developed. Research to develop such guidelines could involve a
comparison of houses with varying amounts and types of thermal mass, and
assessment of the effectiveness of temperature regulation within the residential air
spaces.
3.10. Insulation
Insulation refers to materials that prevent or reduce the flow of heat across the building
envelope, reducing heat flow into the building in warmer periods and out of the
building in colder periods (Aksoy and Inalli, 2005, Hollo, 1995, Reardon et al., 2005).
All materials have a certain amount of value as an insulator, however materials
specifically designed to reduce heat flow in and out of the building envelope can be
utilised in combination with the naturally insulating properties of the structural building
materials (Reardon et al., 2005). Reflective and bulk insulation are the two primary
types of insulation that are installed into residential buildings. Reflective insulation is
placed in the form of single or double-sided foil that reflects thermal radiation back
into the living space of the house. This method of insulation is most effective when the
reflective side of the foil faces an air space, and is heavily dependent on the surface of
the insulation being free from dust and other dirt that will lower its albedo and
therefore its insulating value (Hollo, 1995, Reardon et al., 2005, Smith, 2009, Todd,
1994a). Reflective insulation commonly comes in three main types:

79
reflective foil laminate (RFL), which consists of aluminium foil on a stiff backing protected by a laminated covering;
reflective foil lining the inside of plasterboard or corrugated iron; or
reflective foil lining the inner surface of bulk insulation, known as composite insulation (Hollo, 1995).
Bulk insulation is made from materials that are thermally resistant and prevent the
transfer of heat energy from the living space of the house to the outside. These
commonly include: loose fill cellulose with fire retardant; wool batts; polystyrene
boards; polyester batts or blankets, and; rockwool batts, blankets or loose fill (McKay
and Bonnin, 2006)(Todd, 1994, Smith, 2009, Reardon et al., 2005). Wool and fiberglass
batts are commonly used in Tasmania. They rely on their ability to expand to provide
maximum insulation, as air spaces within the insulating material are what provide the
insulation. If constricted by roofing materials or by other items in the roof or wall
cavity, then the R-value will be reduced, meaning that it is important to allow insulation
sufficient rooms to expand.
Insulation performs two primary functions. The primary function of insulation is the
minimisation of heat transfer across the building envelope (Crocombe, 2007)(Aksoy
and Inalli, 2005, Wrigley, 2005, Reardon et al., 2005). The secondary function is the
prevention of moisture buildup within the building. In some cases insulation also
provides reduction in sound traveling in or out of a building, minimizing the impact of
outside sounds such as traffic or other disturbances, and reducing potentially loud
domestic sounds emanating from within a building.
3.10.1. How is insulation measured and classified?
The level of thermal resistance provided by insulating materials is called the R-value.
Greater R-values mean that a material provides better insulation. Fibreglass (130mm)
and rockwool (100mm) batts have an R-value of R2.5, which is slightly lower than
100mm thick loose fill cellulose fibre that has an R-value of R2.6. Polystyrene board of
50mm thickness has an R-value of R1.4 (Todd, 1994a). In terms of reflective
insulation, one-sided reflective foil in the ceiling space will provide R0.34, and in wall
cavity will provide R0.5 (Todd, 1994a).
R-values are also given to other building materials that are not specifically installed for
insulation purposes. The table below provides a list of R-values of building materials.
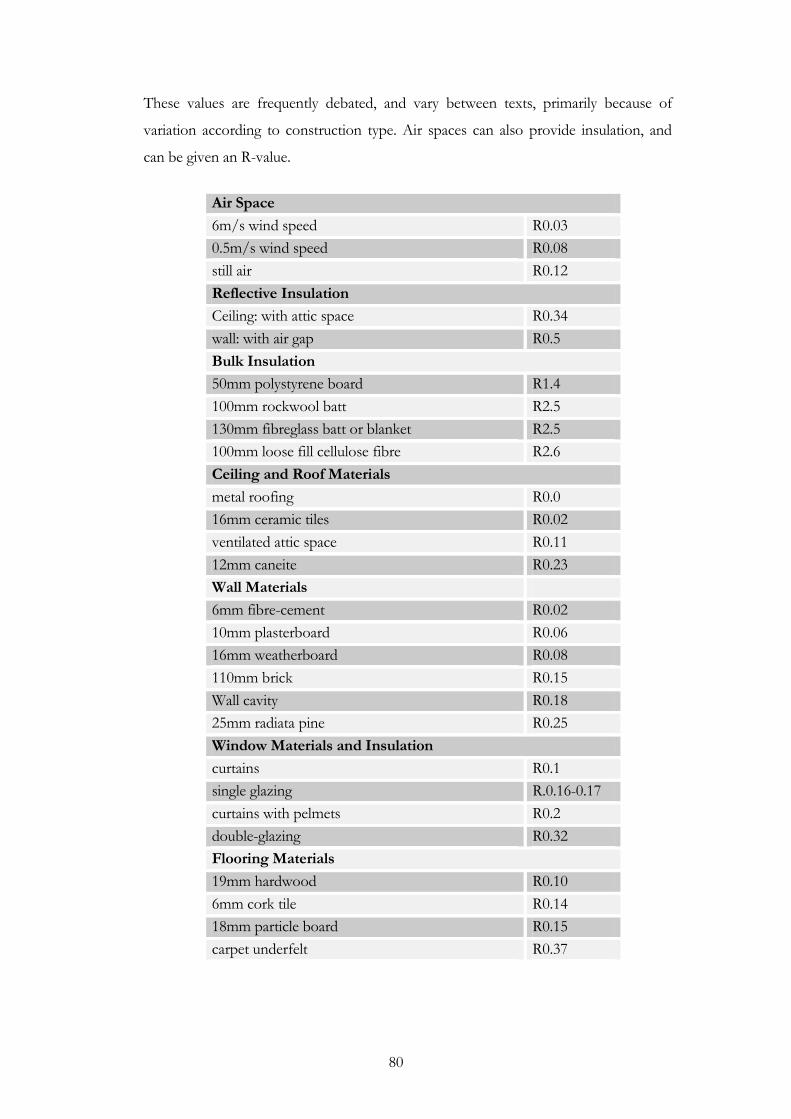
80
These values are frequently debated, and vary between texts, primarily because of
variation according to construction type. Air spaces can also provide insulation, and
can be given an R-value.
Air Space
6m/s wind speed R0.03
0.5m/s wind speed R0.08
still air R0.12
Reflective Insulation
Ceiling: with attic space R0.34
wall: with air gap R0.5
Bulk Insulation
50mm polystyrene board R1.4
100mm rockwool batt R2.5
130mm fibreglass batt or blanket R2.5
100mm loose fill cellulose fibre R2.6
Ceiling and Roof Materials
metal roofing R0.0
16mm ceramic tiles R0.02
ventilated attic space R0.11
12mm caneite R0.23
Wall Materials
6mm fibre-cement R0.02
10mm plasterboard R0.06
16mm weatherboard R0.08
110mm brick
R0.15
Wall cavity R0.18
25mm radiata pine R0.25
Window Materials and Insulation
curtains R0.1
single glazing R.0.16-0.17
curtains with pelmets R0.2
double-glazing R0.32
Flooring Materials
19mm hardwood R0.10
6mm cork tile R0.14
18mm particle board R0.15
carpet underfelt R0.37
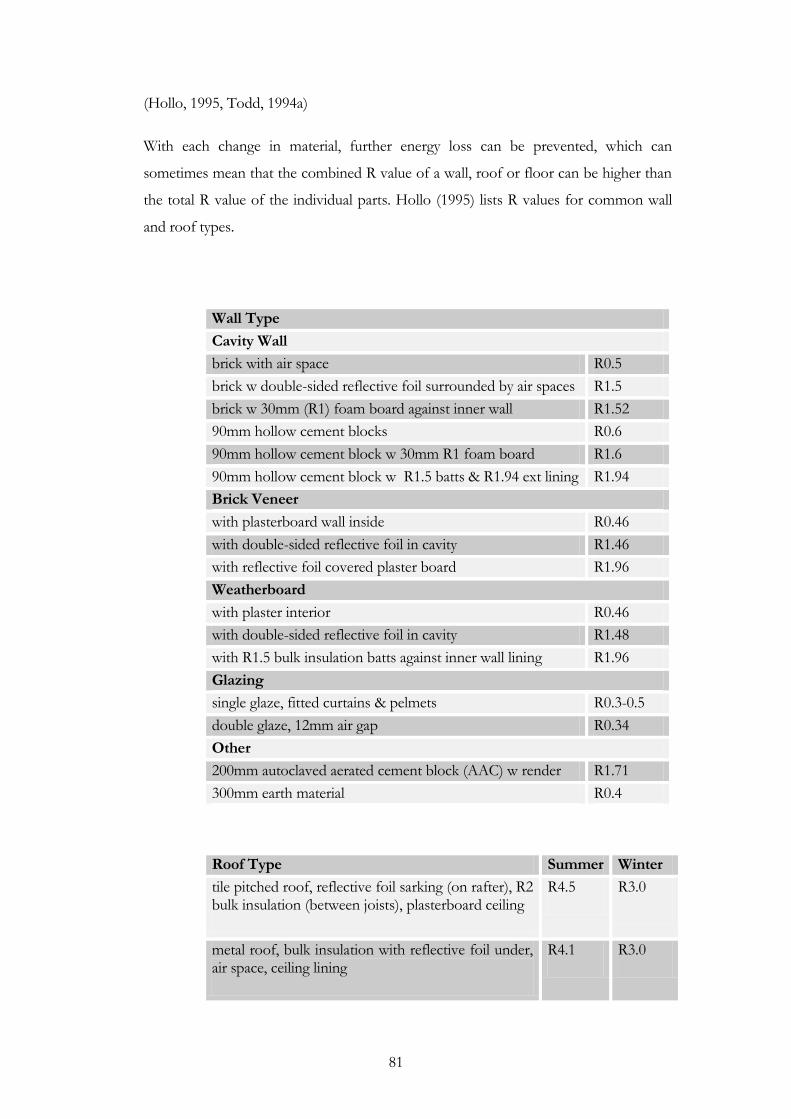
81
(Hollo, 1995, Todd, 1994a)
With each change in material, further energy loss can be prevented, which can
sometimes mean that the combined R value of a wall, roof or floor can be higher than
the total R value of the individual parts. Hollo (1995) lists R values for common wall
and roof types.
Wall Type
Cavity Wall
brick with air space R0.5
brick w double-sided reflective foil surrounded by air spaces
adjacent air spaces
R1.5
brick w 30mm (R1) foam board against inner wall R1.52
90mm hollow cement blocks R0.6
90mm hollow cement block w 30mm R1 foam board R1.6
90mm hollow cement block w R1.5 batts & R1.94 ext lining R1.94
Brick Veneer
with plasterboard wall inside R0.46
with double-sided reflective foil in cavity R1.46
with reflective foil covered plaster board R1.96
Weatherboard
with plaster interior R0.46
with double-sided reflective foil in cavity R1.48
with R1.5 bulk insulation batts against inner wall lining R1.96
Glazing
single glaze, fitted curtains & pelmets R0.3-0.5
double glaze, 12mm air gap R0.34
Other
200mm autoclaved aerated cement block (AAC) w render R1.71
300mm earth material R0.4
Roof Type Summer Winter
tile pitched roof, reflective foil sarking (on rafter), R2 bulk insulation (between joists), plasterboard ceiling
R4.5 R3.0
metal roof, bulk insulation with reflective foil under, air space, ceiling lining
R4.1 R3.0
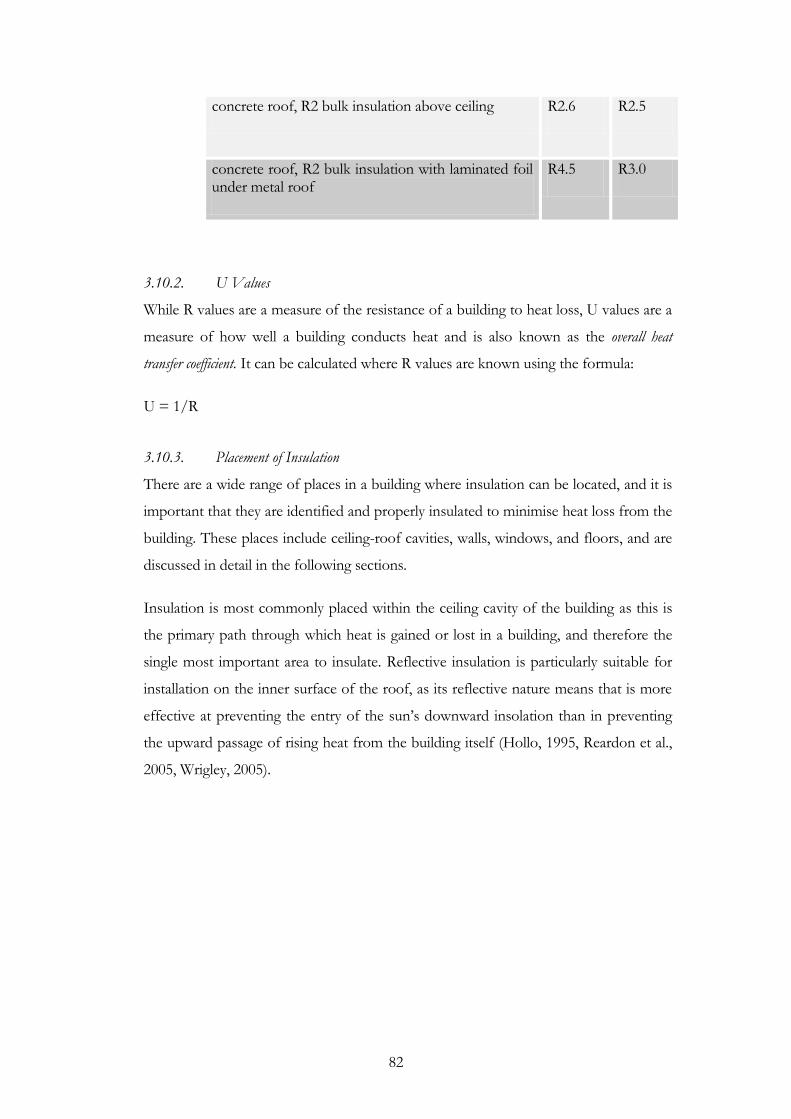
82
concrete roof, R2 bulk insulation above ceiling R2.6 R2.5
concrete roof, R2 bulk insulation with laminated foil under metal roof
R4.5 R3.0
3.10.2. U Values
While R values are a measure of the resistance of a building to heat loss, U values are a
measure of how well a building conducts heat and is also known as the overall heat
transfer coefficient. It can be calculated where R values are known using the formula:
U = 1/R
3.10.3. Placement of Insulation
There are a wide range of places in a building where insulation can be located, and it is
important that they are identified and properly insulated to minimise heat loss from the
building. These places include ceiling-roof cavities, walls, windows, and floors, and are
discussed in detail in the following sections.
Insulation is most commonly placed within the ceiling cavity of the building as this is
the primary path through which heat is gained or lost in a building, and therefore the
single most important area to insulate. Reflective insulation is particularly suitable for
installation on the inner surface of the roof, as its reflective nature means that is more
effective at preventing the entry of the sun‟s downward insolation than in preventing
the upward passage of rising heat from the building itself (Hollo, 1995, Reardon et al.,
2005, Wrigley, 2005).
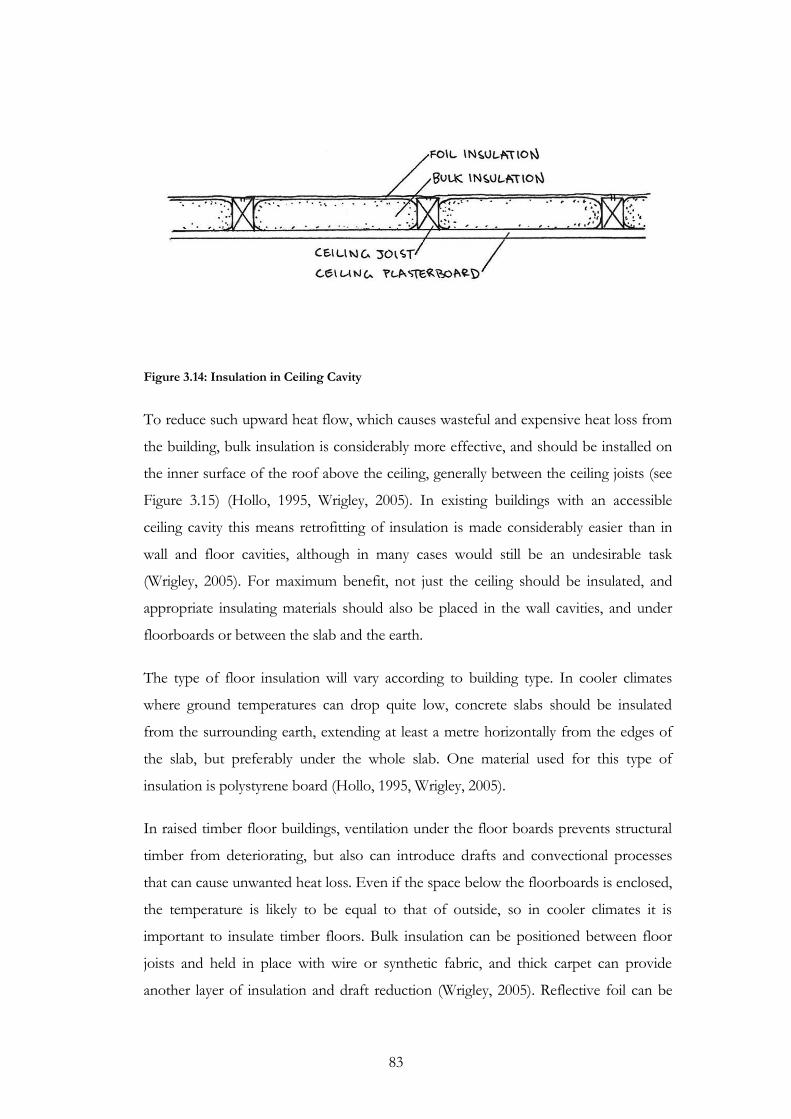
83
Figure 3.14: Insulation in Ceiling Cavity
To reduce such upward heat flow, which causes wasteful and expensive heat loss from
the building, bulk insulation is considerably more effective, and should be installed on
the inner surface of the roof above the ceiling, generally between the ceiling joists (see
Figure 3.15) (Hollo, 1995, Wrigley, 2005). In existing buildings with an accessible
ceiling cavity this means retrofitting of insulation is made considerably easier than in
wall and floor cavities, although in many cases would still be an undesirable task
(Wrigley, 2005). For maximum benefit, not just the ceiling should be insulated, and
appropriate insulating materials should also be placed in the wall cavities, and under
floorboards or between the slab and the earth.
The type of floor insulation will vary according to building type. In cooler climates
where ground temperatures can drop quite low, concrete slabs should be insulated
from the surrounding earth, extending at least a metre horizontally from the edges of
the slab, but preferably under the whole slab. One material used for this type of
insulation is polystyrene board (Hollo, 1995, Wrigley, 2005).
In raised timber floor buildings, ventilation under the floor boards prevents structural
timber from deteriorating, but also can introduce drafts and convectional processes
that can cause unwanted heat loss. Even if the space below the floorboards is enclosed,
the temperature is likely to be equal to that of outside, so in cooler climates it is
important to insulate timber floors. Bulk insulation can be positioned between floor
joists and held in place with wire or synthetic fabric, and thick carpet can provide
another layer of insulation and draft reduction (Wrigley, 2005). Reflective foil can be
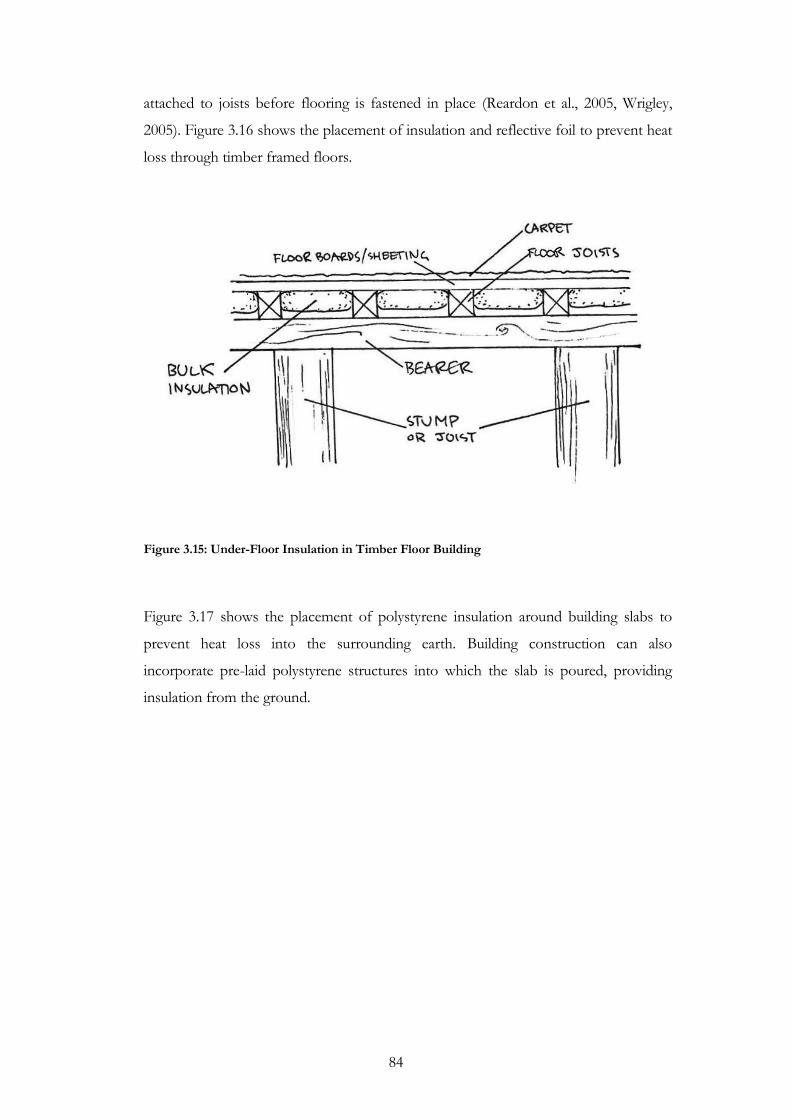
84
attached to joists before flooring is fastened in place (Reardon et al., 2005, Wrigley,
2005). Figure 3.16 shows the placement of insulation and reflective foil to prevent heat
loss through timber framed floors.
Figure 3.15: Under-Floor Insulation in Timber Floor Building
Figure 3.17 shows the placement of polystyrene insulation around building slabs to
prevent heat loss into the surrounding earth. Building construction can also
incorporate pre-laid polystyrene structures into which the slab is poured, providing
insulation from the ground.

85
Figure 3.16: Slab Insulation
The varying wall materials used in residential construction provide great variation in
available thermal mass, however they provide little variation in insulating properties.
Bricks, concrete blocks, and earthen construction materials have a high capacity to
store thermal energy, however they are not effective insulators, and still require bulk
insulation to prevent unwanted heat loss and gain (Hollo, 1995, Smith, 2009, Smith and
Pitts, 1997, Wrigley, 2005).
It is important in brick wall cavities that insulation does not provide a bridge for
moisture to cross between the inner surfaces, as brick is a porous material and moisture
cannot be allowed to penetrate the inner wall. This can be prevented by the installation
of polystyrene boards on the inner wall, injecting expanding polystyrene into the wall
cavity, or using reflective foil to retain an air space adjacent both inner surfaces (Hollo,
1995).
It is equally important to ensure that insulation does not facilitate moisture penetration
into the building envelope through framed walls. Reflective foil can be attached to
studs to ensure there is air space on both sides. Bulk insulation should be placed
between the studs and against the inner wall lining (Hollo, 1995, Wrigley, 2005,
Reardon et al., 2005, Wilkie, 2003). Metal framed buildings can also present a problem,
86
as they are thermally conductive, and can provide a bridge past insulation barriers,
particularly in areas where they (or the wall which they support) are exposed to
insolation. This bridge can, in many instances, be prevented with a covering of bulk
insulation (Hollo, 1995, Wilkie, 2003).
It is also important to be aware that warm air is capable of holding more moisture than
cold air because inner walls are often porous, allowing moisture to pass through into
the wall cavity. If the cavity air is cooler than air inside the building envelope (which is
likely in cooler weather) or outside the building (likely in warmer weather), then
condensation can form and wet the cavity wall surface and insulation. The
implementation of a vapour barrier on the warm side of the insulation, dependent on
the local climate can reduce this moisture buildup. In warmer climates, where air
conditioning is utilised, the vapour barrier should be on the outer lining and in cooler
climates the vapour barrier should be on the inner lining (Hollo, 1995).
In the majority of cases, the installation of insulation within wall cavities is a
considerably easier process during the construction of the building, and access to wall
cavities to retrofit insulation is generally a complex and costly task. Therefore, it is
advantageous to include the installation of insulation from the early design stage.
It is also important to ensure windows are properly insulated. Glass is highly heat
conductive, meaning that a potentially large amount of heat can be lost. Heavy
insulating curtains that run down to the floor, with a pelmet above, minimises the flow
of air between the room and the airspace between the window and curtain, and
reduces air loss via convection through the window (Wrigley, 2005). The installation of
double-glazed windows will also reduce heat loss by convection and conduction
(Wrigley, 2005).
Depending on the construction material window frames can conduct heat in and out
of the building. Metal frames, such as aluminium and steel are more conductive than
wooden frames. It is possible to include barriers to prevent heat flow between the
inner and outer frames, such as polystyrene sheets (Hollo, 1995, Wrigley, 2005).
Zaheer-Uddin (1987) examined how automated windows shutters can be used to
improve the thermal performance of passively designed residential buildings by
insulating windows during the night, and created a model to determine optimal
opening and closing times, based on a wide range of physical factors. The research
87
determined that automated windows are indeed an effective method of improving the
thermal performance of passively designed buildings. Because of their horizontal
nature, skylights present a greater potential loss of heat than vertical windows. When
installing skylights, the benefits of light and solar gain must be weighed against the
potential heat loss during colder months.
3.10.4. Draft exclusion
Unwanted air currents can have significant impact on the thermal comfort of residents,
as well as increasing the rate of air change within the building (Hollo, 1995, McKay and
Bonnin, 2006, Reardon et al., 2005). While air change for ventilation can be important
in ensuring high quality internal air, such air change should not be constant and
uncontrolled, and should be instigated by householders when appropriate. Unwanted
air currents in and out of the building envelope represent energy wastage, and should
be prevented (Crocombe, 2007, Smith and Pitts, 1997, Wrigley, 2005, Yudelson, 2007).
These air currents are frequently caused by windows, vents, doors, chimneys and
through floor boards, and can be a source of major unwanted heat loss or gain (Hollo,
1995, McKay and Bonnin, 2006, Wrigley, 2005). The exclusion of drafts is therefore an
important element of passive solar design as it decreases heat loss to the external
environment and increases thermal comfort of residents (Hollo, 1995, Reardon et al.,
2005, Wrigley, 2005). Wrigley (2005) details a range of methods for excluding existing
drafts, including: sealing strips around doors and windows; blocking vertical airflow
through disused fans or chimneys or installing self-closing fans; covering unnecessary
vents in older buildings; and using timber sealer in cracks and between floorboards or
the placement of carpet or rugs (Wrigley, 2005).
3.10.5. Retrofitting to improve insulation
There are a variety of techniques that can be employed to improve the insulation of an
existing house, with varying degrees of effectiveness, difficulty in installation and
commitment from the householder. Wrigley (2005) examines a range of techniques for
retrofitting windows to improve thermal efficiency. The installation of ceiling
insulation such as batts is often a first step, and can greatly reduce heat loss into the
ceiling space. Figure 3.13 shows other methods in which internal walls, exposed to
solar radiation by placement near windows can locate thermal mass within the building
envelope. Installation of heavy curtains and pelmets is an easier method of increasing
88
insulation of windows, and is generally less expensive than installing double-glazing.
Improving wall insulation can be difficult, and can require the removal of plasterboard
in the case of brick veneer buildings.
3.10.6. Alternative insulation methods
Fibreglass insulation has the potential to affect the health of building occupants, and so
a number of healthy and sustainable insulation materials have been developed,
including: batts made from wool; seaweed; polystyrene; polyester; and cellulose treated
with fire retardant (Reardon et al., 2005). There are a range of materials that can
provide intrinsic insulation. Timber is a very commonly used building material, and
because of its cellular structure has good insulating ability (Reardon et al., 2005). While
mud bricks are a very sustainable material, that can be returned to the earth at the end
of their life cycle, they are not particularly good insulators because of their high density,
and need to be used in conjunction with another insulator (Reardon et al., 2005). Straw
bale has excellent insulation properties, and compares by mass with fiberglass batts, but
like other heavy building materials can be generally only used to insulate walls and
floors (Gray, 2002, Smith and Pitts, 1997, Steen et al., 1994). Straw bales are too thick
and heavy to be suitable for ceiling insulation.
Autoclaved Aerated Concrete (AAC) is a material made from concrete with a multitude
of enclosed air pockets produced by adding a foaming agent to the concrete as it is
mixed and then cutting the concrete into blocks and autoclaving. The end result is
lightweight concrete blocks that are used much like bricks, laid in position and then
glued in place (Hollo, 1995). Because of the air pockets within the bricks it is quite light
and durable, and has a combination of the properties of high thermal mass materials as
well as insulating properties. A wall of AAC 200mm thick, will have an R-Value of 1.43
while also providing thermal mass properties, and can be used in combination with
other insulating materials to improve overall insulation (Reardon et al., 2005).
3.11. Passive Cooling
The majority of the focus of passive design in the Tasmanian context is on the heating
of buildings during cooler periods. The temperate nature of Tasmania and increasing
lack of tolerance and reluctance to acclimatise to local temperatures amongst its
89
inhabitants makes it necessary for cooling mechanisms to be examined. Passive cooling
is the reduction of excessive heat in buildings without the use of electricity. Passive
cooling is implemented primarily by two mechanisms:
the restriction of excessive thermal energy (solar or air) from penetrating the building during warm days; and
the use of passive ventilation to replace warm internal air with cooler external air during the night.
The use of passive processes in cooling buildings has been widely researched, and the
success of passive cooling systems recognised (Meier, 1999, Smith and Pitts, 1997).
Pfafferott et al. (2003) conducted long term monitoring of night time temperatures in
offices to compare cooling and ventilation efficiency, dependent on air change rate,
solar and internal heat gains. Pfafferott et al. (2004) examined passive night time
ventilation as a method of reducing dependence on air conditioners in office buildings
while retaining adequate levels of thermal comfort. This study monitored room
temperatures and air flow rates across twelve offices, and compared the results with the
electricity consumption. Both these analyses showed the effectiveness of passive
systems in providing night time ventilation.
Thiers and Peuportier (2008) quantified the benefits of passive design in ventilation by
monitoring and modelling French buildings with and without passive design, and
comparing thermal comfort levels. The study showed that levels of thermal discomfort
as a result of summer heat were significantly reduced by the implementation of passive
ventilation features and processes. Passive cooling has even proven to be effective in
warmer and tropical climates. Oliveira et al. (2009) examined passive cooling systems
across 14 cities in Brazil, and determined that passive design is an effective means of
cooling, particularly in semi-arid areas. It was found that the use of passive design
reduced building heat gain across all the varying climatic regions of Brazil. It is
therefore evident that with the implementation of passive cooling techniques, the need
for cooling devices in Tasmania, where summer temperatures are milder, could be
avoided.
Gavieta (1990/1991) examined the use of traditional building materials and designs in
creating passively cooled buildings in the tropical urban climate of the Philippines. Two
traditional styles of building were examined and it was determined that maximum
90
benefit from ventilation and sun shading was achieved when there was a
comprehensive knowledge of: wind direction and speed data; solar charts; and building
properties. It was also determined that it is possible to achieve thermally comfortable
buildings in such a climate using traditional materials, leading to the possibility that the
adoption of such materials had developed over time in an effort to create thermally
comfortable environments.
Nahar et al. (2002) compared the performance of a variety of passive techniques using
artificial concrete test cells. The following techniques were used on each test cell:
painting the roof with white cement;
thermal insulation batts on the roof;
nocturnal cooling - 100mm water under 40mm of movable thermal insulation;
evaporative cooling – water dripped on sacks covering the roof;
glazed white tiles covering the roof;
air void insulation – inverted 100mm diameter 125mm high pots applied to the roof; and
sania – a natural insulating material local to the study area.
The evaporative cooling method, utilising sacks and dripping water, was determined to
be most effective. It is however possibly untenable because of the large amount of
water that it requires - around 50L daily. The white tile pieces were subsequently found
to be the most appropriate passive cooling technique.
3.11.1. Shading
Shading a building from insolation, when temperatures are warm, is one of the first
methods of passive cooling (Smith and Pitts, 1997). There are a wide range of
techniques for providing such shading, including the use of other buildings, sail cloths,
and plantings. Using existing vegetation, when building in new areas, is a good method
of shading, so long as potential fire hazards are taken into consideration (Hollo, 1995).
3.11.2. Roof colour and shape
The colour of a material influences the amount of radiation it reflects, absorbs and
transmits. Lighter colours will be more effective in reflecting unwanted solar radiation,
91
and therefore a lighter coloured roof will help lower internal building temperatures.
Likewise, shiny and reflective surfaces with a high gloss will reflect more solar radiation
than matte surfaces. Nahar et al. (2002) suggested that putting white tiles on a roof
would be a highly effective passive cooling technique, more effective than a variety of
insulation types and other cooling techniques, and more functional than evaporative
cooling because of its lack of water use. While the insulating value of the tiles would
assist in preventing unnecessary heating, it is evident that roof colour and surface gloss
does have a major impact on internal temperature. Eaves are also an important feature
of passively designed buildings, as they prevent the high angled summer sun from
warming the walls of the building and penetrating through glazing.
3.11.3. Window shading
Section 3.8 explores the importance of insulating glazed areas, and discusses a range of
techniques that can be utilised in residential buildings. It is important that windows be
shaded from solar gain during warm periods, to ensure that the building does not
overheat (Lerner, 1998, Smith and Pitts, 1997). There are a variety of methods of
shading windows. Curtains and blinds are one of the most common methods of
window shading, are common in a wide range of houses, and can easily be utilised to
shut out the sun on warm days. Because they are inside the building envelope however,
they are less effective than external shading devices (Zaheer-Uddin, 1987).
The type of glazing used in a window will also impact the amount of solar penetration
the window allows, and low emissivity glass can be used to still allow light into a
building but reduce the amount of warming solar radiation. External shutters are an
excellent method of window shading, as they reflect incoming solar radiation before it
has a chance to reach the glass, and longwave thermal radiation reflected will not
remain inside the building envelope as it does with internal curtains and blinds.
Zaheer-Uddin‟s (1987) study into the effectiveness of automated window shutters in
improving the thermal performance of passive buildings examined them as an insulator
to keep heat within the building envelope and as a shading device to prevent unwanted
insolation, and showed that automated shutters were an effective method of window
shading.
92
Intelligently selected and placed trees can provide long term cooling benefits by
shading the building from summer sun, and helping to create a microclimate around
the building. The basic principles of tree planting for passive cooling are:
plant evergreen trees on the east and west side of the building to reduce summer morning and evening sun, but not block sun during the winter; and
plant deciduous trees on the north side of the building, to provide shade from daytime summer sun, yet with the shedding of leaves during winter allow sun to reach the building.
3.11.4. Thermal mass in passive cooling
As discussed in section 3.1, thermal mass can also be beneficial in passive cooling by
storing excessive thermal energy, which coupled with night-time ventilation processes
can provide effectively reduce internal air temperatures. Peterkin (2008) argues that in
reducing summertime air conditioning use, thermal mass plays a greater role than other
passive design strategies and techniques.
There have been a wide range of studies undertaken into the impact of building
materials, in particular thermal mass, in passive cooling. Capeluto et al. (2001a)
examined how thermal mass affects night ventilation processes in the hot humid
climate of Israel, and developed a design tool for determining appropriate applications
of thermal mass in buildings. The work of Gavieta (1990/1991) in examining low-cost
houses constructed from traditional materials in the tropical urban climate of the
Phillipines, focused largely on the capacity of these houses for cooling. It compared the
passive cooling performance of high and low thermal mass houses, and concluded that
while thermal mass is an important aspect of passive cooling, it must be intelligently
used with a knowledge of: wind speed and direction; solar gain and movements; and
the thermal flows in and out of the building, and is most beneficial when used in
conjunction with other passive cooling features (Gavieta, 1990/1991). Similarly, Kumar
et al. (1993) examined the use of traditional materials in cooling in hot warm climates in
India, and the concept that building designs and techniques constantly evolve in the
provision of better housing conditions.
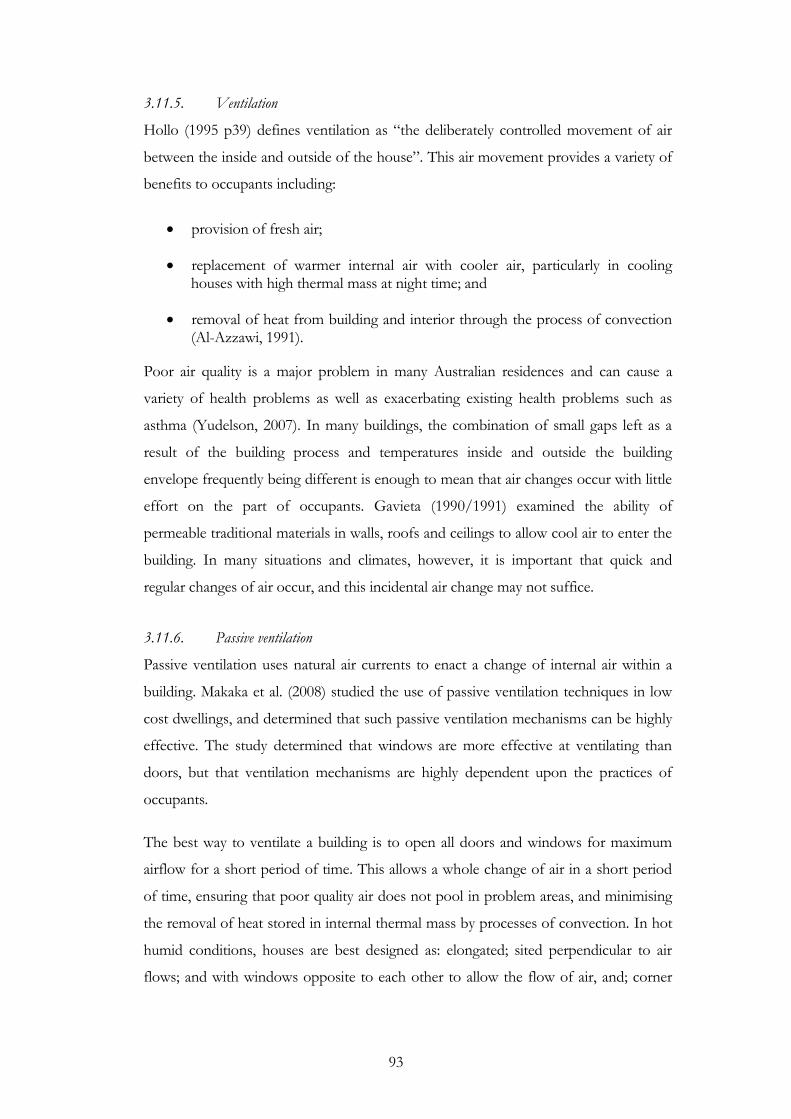
93
3.11.5. Ventilation
Hollo (1995 p39) defines ventilation as “the deliberately controlled movement of air
between the inside and outside of the house”. This air movement provides a variety of
benefits to occupants including:
provision of fresh air;
replacement of warmer internal air with cooler air, particularly in cooling houses with high thermal mass at night time; and
removal of heat from building and interior through the process of convection (Al-Azzawi, 1991).
Poor air quality is a major problem in many Australian residences and can cause a
variety of health problems as well as exacerbating existing health problems such as
asthma (Yudelson, 2007). In many buildings, the combination of small gaps left as a
result of the building process and temperatures inside and outside the building
envelope frequently being different is enough to mean that air changes occur with little
effort on the part of occupants. Gavieta (1990/1991) examined the ability of
permeable traditional materials in walls, roofs and ceilings to allow cool air to enter the
building. In many situations and climates, however, it is important that quick and
regular changes of air occur, and this incidental air change may not suffice.
3.11.6. Passive ventilation
Passive ventilation uses natural air currents to enact a change of internal air within a
building. Makaka et al. (2008) studied the use of passive ventilation techniques in low
cost dwellings, and determined that such passive ventilation mechanisms can be highly
effective. The study determined that windows are more effective at ventilating than
doors, but that ventilation mechanisms are highly dependent upon the practices of
occupants.
The best way to ventilate a building is to open all doors and windows for maximum
airflow for a short period of time. This allows a whole change of air in a short period
of time, ensuring that poor quality air does not pool in problem areas, and minimising
the removal of heat stored in internal thermal mass by processes of convection. In hot
humid conditions, houses are best designed as: elongated; sited perpendicular to air
flows; and with windows opposite to each other to allow the flow of air, and; corner
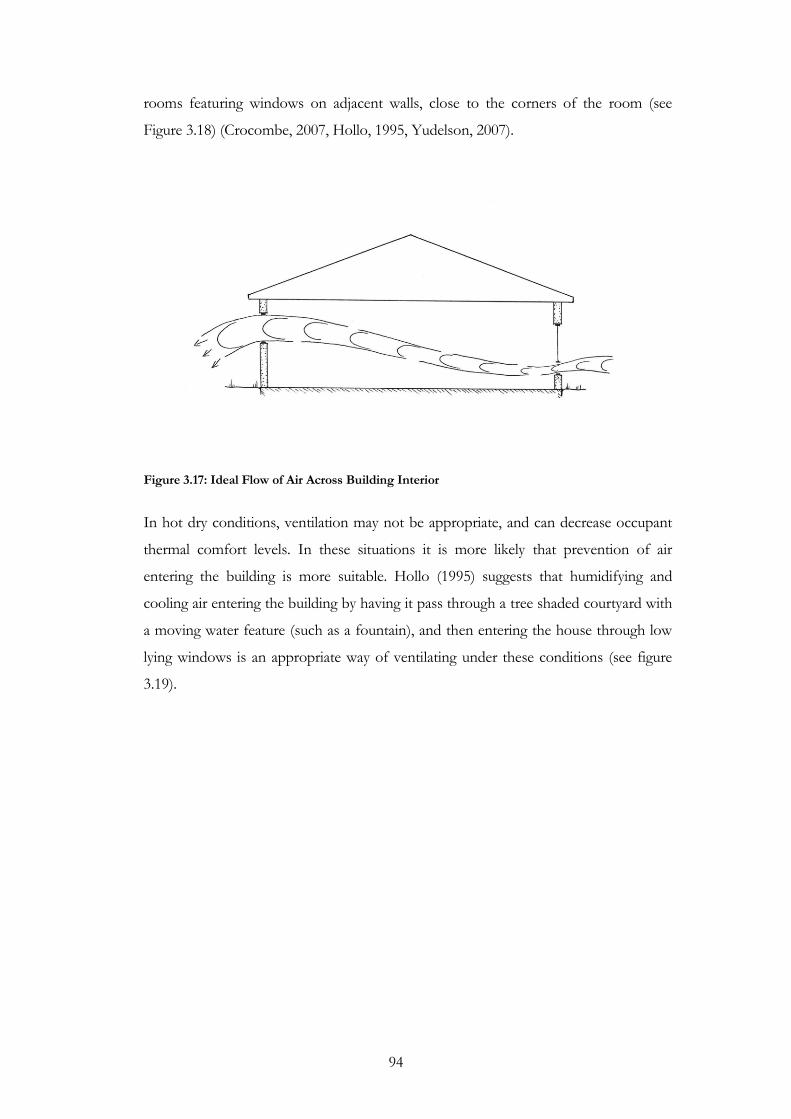
94
rooms featuring windows on adjacent walls, close to the corners of the room (see
Figure 3.18) (Crocombe, 2007, Hollo, 1995, Yudelson, 2007).
Figure 3.17: Ideal Flow of Air Across Building Interior
In hot dry conditions, ventilation may not be appropriate, and can decrease occupant
thermal comfort levels. In these situations it is more likely that prevention of air
entering the building is more suitable. Hollo (1995) suggests that humidifying and
cooling air entering the building by having it pass through a tree shaded courtyard with
a moving water feature (such as a fountain), and then entering the house through low
lying windows is an appropriate way of ventilating under these conditions (see figure
3.19).
95
Figure 3.18: Cooling Ventilation from Courtyard
Ventilation is an important function of the cooling process in passive design. In high
thermal mass buildings where the thermal mass is used as a heat sink to prevent the
building overheating during hot days, night time ventilation is used to flush out the
building, cooling the thermal mass to allow it to perform effectively when temperatures
increase the following day. Ideally, a building should provide the occupant with the
ability to control air flow, excluding air when required and allowing fast and regular air
changes when required.
The orientation of a site and the building on the site impacts on the ability of the
building to passively cool by changing the relationship of the building to incoming air
currents and solar radiation (Gavieta, 1990/1991). Building perpendicular to prevailing
winds is ideal for cooling, however angles as much as 45º can still utilise breezes and
can be deflected and funneled into buildings, so orienting the building according to
solar gain should take precedence over orientation for ventilation (Gavieta, 1990/1991,
Hollo, 1995). In situations where the house is at less than a 45º angle to the prevailing
winds there are methods of deflecting wind into the building:
vegetation such as hedges, medium height trees;
solid structures such as outhouses, building wings, walls; and
casement windows that deflect passing air into the building.

96
Patterns of airflow through a building rely primarily on the implementation and
location of windows and other openings that allow air in and out of the building
envelope (Crocombe, 2007, Gavieta, 1990/1991). To maximise the cooling ability and
velocity of incoming air, entry openings should be lower on the wall, and exit openings
higher. To maximise the speed of air entering the building, entry openings should be
smaller and exit openings wider.
3.11.7. Retrofitting to improve ventilation
The planting of trees to direct air flows into or away from buildings; the changing the
type of windows to draw air in; and the installation of fans to circulate air are initial
methods of improving circulation within existing building. More involved methods can
include the installation of new windows to capture existing airflow, although this is
generally more involved and expensive. The installation of air conditioning systems
represents design failure, and where possible should be avoided.
3.12. Landscaping
Incorrect orientation, glazing, choice of colour and siting can have significant negative
impacts on the thermal environment of a building. In some cases intelligent
landscaping can mitigate these effects. Alteration of a landscape surrounding a building
can in some cases be less difficult and time consuming than altering the building, and
can be an important part of retrofitting existing buildings for thermal efficiency.
Tree plantings can create microclimates around buildings that: mitigate temperature
variation; protect the building from extremes; and prevent unnecessary winds. They
also have the added effect of reducing garden water requirements (an increasingly
important benefit) and reducing glare. Correctly selected and located trees can provide
shade where needed, and allow insolation when temperatures are low (Lerner, 1998).
Section 3.8 examined appropriate locations for plantings. Locating tall deciduous trees
on the northern side of a building can provide important shade for the building during
the summer when foliage is thickest, and then shed leaves to allow the sun to heat the
building during the winter (Al-Azzawi, 1991). The planting of evergreen trees on the
east and west sides of a building can help prevent unwanted insolation during the
summer months near dawn and dusk. This can be of particular importance when there
97
is a requirement for glazing on these sides. Planting can also greatly alter wind and air
flow, protecting the building from unwanted wind, and as mentioned in section 3.8,
can also help improve building ventilation, by directing air flow into the building
(Hollo, 1995, Lerner, 1998). If solar photovoltaic or solar hot water systems are being
utilised, it is important to ensure that trees do not prevent adequate sunlight from
reaching panels on the rooftop.
3.13. Retrofitting
In order to reduce the energy consumption of buildings in heating, cooling, and
ventilation, it is important that passive design features are not restricted to the
construction of new buildings. While implementing passive design features into new
buildings from the design stage is considerably more cost effective, there are a range of
options for improving the thermal performance of existing buildings. Options for
retrofitting for insulation, ventilation, thermal mass, shading and solar gain have been
discussed in previous chapters.
There is a variety of literature with information on methods for retrofitting for thermal
efficiency. Wrigley (2005) published comprehensive information on retrofitting in the
Australian context, with particular focus on thermal heating in temperate climates.
Trianti et al. (1986) examined retrofitting historic buildings in Athens, Greece, and
Watson et al. (1998) examined the energy consumption data of a housing community
before and after retrofitting for thermal efficiency and determined that there were
significant reductions in energy consumption following retrofit.
Weaver (2004) conducted research into inexpensively improving energy efficiency
through retrofitting, and indicated that such retrofitting could yield significant
improvements in the comfort and health of building residents, particularly young
children.
Todd (1997) argued the importance of retrofitting in the Tasmanian context where
there is an existing housing stock that is particularly poor in terms of levels of
insulation and incorporation of other passive design features. Studies have also been
undertaken that have examined the retrofitting of commercial, institutional and
industrial buildings to improve thermal efficiency, such as the study by Meckler (1984).

98
3.14. Solar Heating Systems
This section will integrate the principles of passive design discussed in previous
chapters, and present a variety of passive solar heating systems.
3.14.1. Direct gain systems
Direct gain systems involve the capture of solar energy directly into the building
envelope (Figure 3.20). Insolation is allowed to penetrate directly into the inhabited
spaces of the building through standard glazing types such as windows, glass doors,
and skylights and is stored by the thermal mass of the building (Givoni, 1991, Grimmer
et al., 1979). Commonly this is achieved by the implementation of a concrete slab or
other thermal mass that is dark in colour or covered with dark tiles. It can also be in
the form of a masonry wall, or in some cases a dark coloured water tank.
In many buildings, not all inhabited rooms will have direct access to such insolation,
making it necessary to ensure that there are suitable currents for the transfer of warm
air to these spaces. In some solar systems it may be necessary to employ ducts,
sometimes with fan assisted circulation, to ensure that these areas are heated.
Givoni (1991) conducted a study of passive solar heating systems, including direct gain
systems, and determined that the main factors affecting the performance of direct gain
buildings are:
orientation and location of solar glazing;
size and type of solar glazing;
amount and design details of thermal mass;
arrangement of furniture;
heat loss coefficient of the building as a whole;
thermal coupling between solar and non-solar rooms; and
control options of heat gain and loss through glazing.
Direct gain systems are probably the most effective for the effort required in
implementation, and in general must be included from the design stage of the building
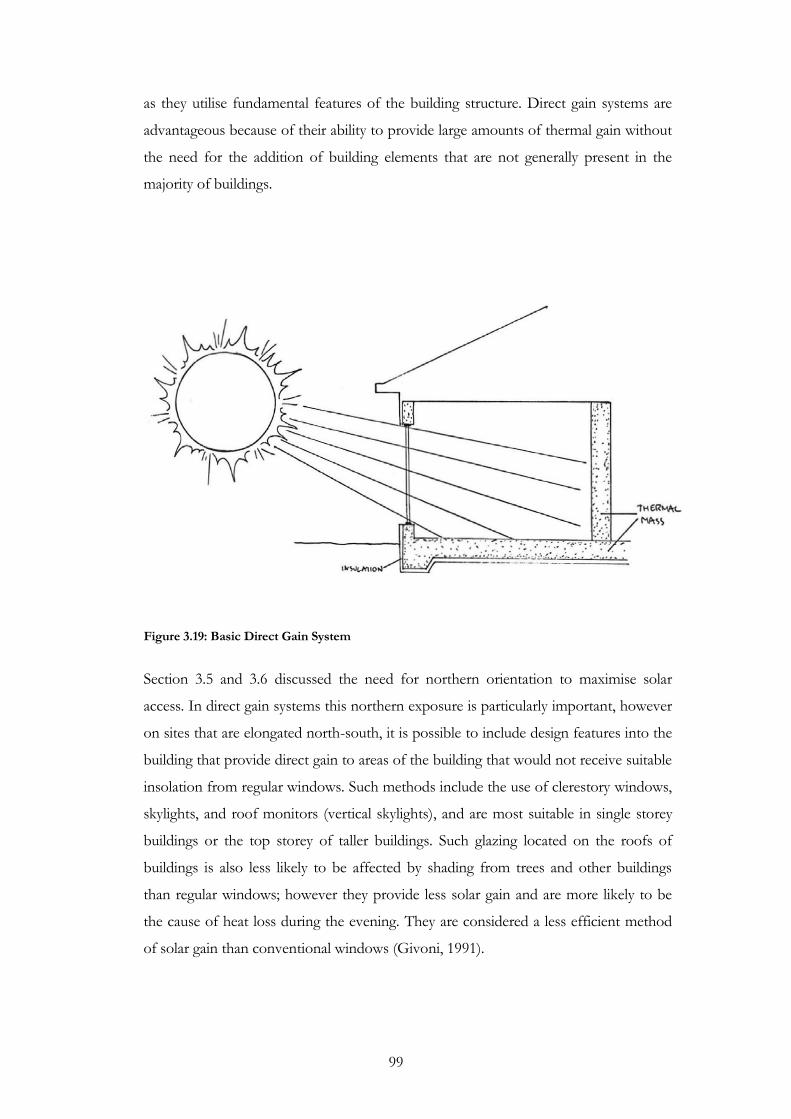
99
as they utilise fundamental features of the building structure. Direct gain systems are
advantageous because of their ability to provide large amounts of thermal gain without
the need for the addition of building elements that are not generally present in the
majority of buildings.
Figure 3.19: Basic Direct Gain System
Section 3.5 and 3.6 discussed the need for northern orientation to maximise solar
access. In direct gain systems this northern exposure is particularly important, however
on sites that are elongated north-south, it is possible to include design features into the
building that provide direct gain to areas of the building that would not receive suitable
insolation from regular windows. Such methods include the use of clerestory windows,
skylights, and roof monitors (vertical skylights), and are most suitable in single storey
buildings or the top storey of taller buildings. Such glazing located on the roofs of
buildings is also less likely to be affected by shading from trees and other buildings
than regular windows; however they provide less solar gain and are more likely to be
the cause of heat loss during the evening. They are considered a less efficient method
of solar gain than conventional windows (Givoni, 1991).
100
Section 3.8 discussed the implementation of glazing in passive design. In direct gain
systems it is important that glazing be of an appropriate size and type. While glazing
provides the benefits of insolation, it also can cause excessive heat loss at night, glare,
and excessive daytime temperatures, meaning that glazing must be appropriately
selected. For these reasons, it is not usually suitable to simply make glazing areas as
large as possible. Glazing in a direct solar gain system should be coupled with suitable
shading systems (eaves, blinds, trees, shutters) for warmer periods, and should be
insulated or double-glazed (or both) to reduce night time heat loss (Givoni, 1991).
Determining glazing size in a direct gain system does not generally involve a simple
mathematical calculation, but should be based on an assessment of the requirements of
occupants against required gains, heat losses, and the identification of other potential
problems.
Section 3.9 discussed thermal mass in passive design. In direct gain systems it is
important that thermal mass is appropriately sized and located to provide suitable
levels of heat storage. Most commonly the source of thermal mass in a direct gain
system is as exposed floor space or an internal wall constructed from concrete, stone,
brick, tiles or other masonry (Givoni, 1991, Hollo, 1995). The effectiveness of floors
and internal walls as the thermal storage element of a direct gain system, and the
diurnal heat capacity can be calculated to determine how effective a direct gain system
will be at thermoregulating a building. Commonly however, the benefits of floors as a
direct gain system are lost or reduced by the placement of furniture, rugs, and carpet
that prevent insolation reaching the thermal mass. Carpets and rugs will insulate the
floor from direct solar gain, greatly reducing the effectiveness of the system. Likewise,
light coloured and reflective surfaces on the floor will reduce thermal storage (Cheng et
al., 2005).
3.14.2. Sun spaces
This system involves the attachment of a room to the side of a building for the
purpose of improving solar heat gain (Smith and Pitts, 1997). They can be included
early in the design phase of a building, but also can be an effective method of
retrofitting to improve thermal efficiency. As a result of their separation from the
building and large amounts of glazing, they are subject to wider swings in temperatures
(Givoni, 1991). In many cases it is possible to insulate sun spaces from the building
envelope at night, often by a window or glass door with a curtain. This minimises heat
101
loss through the additional (and horizontal) glazing in the roof of the sunspace during
the night. It can however lower the thermoregulatory ability of the room as much of
the heat from the thermal mass is released at night as the air temperature cools (Hollo,
1995).
Givoni‟s (1991) examination of passive solar heating systems identifies three main ways
in which sun spaces contribute to the thermoregulation of the internal temperature of
the building and provide improvements to thermal comfort and amenity of occupants:
solar spaces buffer the main area of the dwelling from extremes of exposure, thus reducing the potential temperature fluctuation, glare, and the fading of fabrics and furniture that may result from excessive indoor sunlight;
they increase the heat collection potential of a given façade by allowing a larger glazing area than is practicable and desirable with direct gain; and
the sunspace area itself can constitute an additional living space in the winter and the transitional seasons. With appropriate provision for shading and ventilation in summer, such spaces may be pleasant environments year round in most climates.
Sunspaces provide more than just thermoregulation and reductions in energy
expenditure, and have wide ranging benefits to amenity. Sunspaces can also help
reduce energy loss from the building by convection and conduction. Even when
insolation is insufficient for them to provide heat gains they can be above outdoor
temperatures and so reduce the loss that would take place in their absence (Givoni,
1991).
Givoni (1991) defines two types of sunspaces: modified greenhouses; and sun porches.
Modified greenhouses, have a glazed roof and walls, where the roof is on an incline
(Figure 3.21). They allow maximum insolation, and provide a higher level of solar gain
during sunlight hours than modified greenhouses, but have a much greater potential
for heat loss during the winter through the glazed roof. Modified greenhouses are also
much more likely to overheat during the summer, and frequently function mostly as an
outdoor living area only in the daytimes of the cooler months.
Sun porches have floor to ceiling glazing, and a regular opaque ceiling and roof (Figure
3.20). They do not provide as much solar gain as modified greenhouses, but have lower
night time heat loss, as the glass can be curtained and the ceiling insulated. They are
also less likely to overheat during the summer. Givoni (1991) suggests that in areas with

102
hot summers, sun porches are a preferable, as they can also be used to provide shade
for the building if used in conjunction with appropriate ventilation.
Figure 3.20: Modified Greenhouse
The performance of a sunspace is also dependent on its relationship with the building
to which it is attached. The number of sides of the sun space that come into contact
with the building determines this relationship. If only one side of the sunspace comes
into contact with a building, it is known as an attached sunspace. Attached sunspaces have
the largest amount of glazing exposed to the outside, which means they have the
greatest solar gain, but have high levels of nocturnal heat loss in winter. They also allow
effective cross ventilation with the correct selection of glazing types. Attached
sunspaces allow for a wide range of design applications, and are very versatile.
Semi-enclosed sunspaces are those that have two or three sides in contact with the building
(Figure 3.22). They have the benefit of high levels of solar gain with reduced heat loss
from side windows that do not directly face the sun, making them a highly thermally
efficient system. In comparison to an attached sunspace, they have a higher level of
solar gain to area of glazing, and are more efficient in both heat collection and heat
transfer to inside the building envelope (Givoni, 1991).

103
Figure 3.21: Semi-Enclosed Sunspace
Fully enclosed sunspaces are atriums with all four sides closed in by the building, and
covered above by glazing. Atriums have the lowest level of solar gain, but can be very
effective in distributing that gain into the living spaces of the building (Givoni, 1991).
Atriums are a valuable method of both solar gain and lighting in buildings with a large
area. Openings in the glazing can allow air flow and catch wind currents, helping
ventilate the building and preventing overheating in summer (Givoni, 1991).
The method of connection of sunspaces to the internal space of the building will
impact greatly upon the heating ability of the sunspace. There are a variety of possible
connecting wall types, all of which have different impacts upon heat transference, and
internal temperatures and lighting. These methods include:
heavy mass, thermally conductive, masonry walls that are frequently part of the building structure, store energy in their mass, and conduct it to the building interior, or through openings in the wall. While they have capacity to store energy as thermal mass, at night this energy will also be radiated back out into the sunspace;
thermal storage walls (as detailed in 3.14.4), operate in a similar fashion, but the glazing prevents energy from being radiated back into the sunspace at night;
104
insulated walls featuring connecting spaces that allow a flow of warm air into the interior of the building. These connectors may be in the form of windows, doors or pipes, and are able to be shut off to prevent air flow back into the sunspace at night. The insulation also helps to prevent heat loss back into the sunspace; and
insulated walls with a layer of glazing covering them, allowing the collection of very warm air, that can be released into the building as required through pipes or other openings (Givoni, 1991).
As sunspaces can also provide extra living space, or provide an area for such activities
as growing plants, it can be necessary to ensure that they have some amount of
thermoregulation, or the diurnal changes in temperature can be severe. The provision
of thermal mass within the sunspace is a possible and common method of mitigating
such temperature swings, and frequently is implemented in the form of internal
masonry walls, tiles or a concrete slab.
3.14.3. Thermal storage walls
Thermal storage walls, or Trombe walls, are a system of collection of heat energy from
the exterior or a building and transporting it to the interior (see Figure 3.23). They
consist of a dark coloured wall with suitable solar exposure (i.e. preferably north
facing), covered by a layer of glazing, with an air space in between (Givoni, 1991).
Insolation warms the wall, and the glazing traps longwave thermal radiation within the
air space and the wall. The thermal conductivity and thickness of the wall determines
what proportion of this energy will be transmitted through to the interior of the
building, and the walls warm the internal surface will heat the air by convection and
emission of longwave radiation.
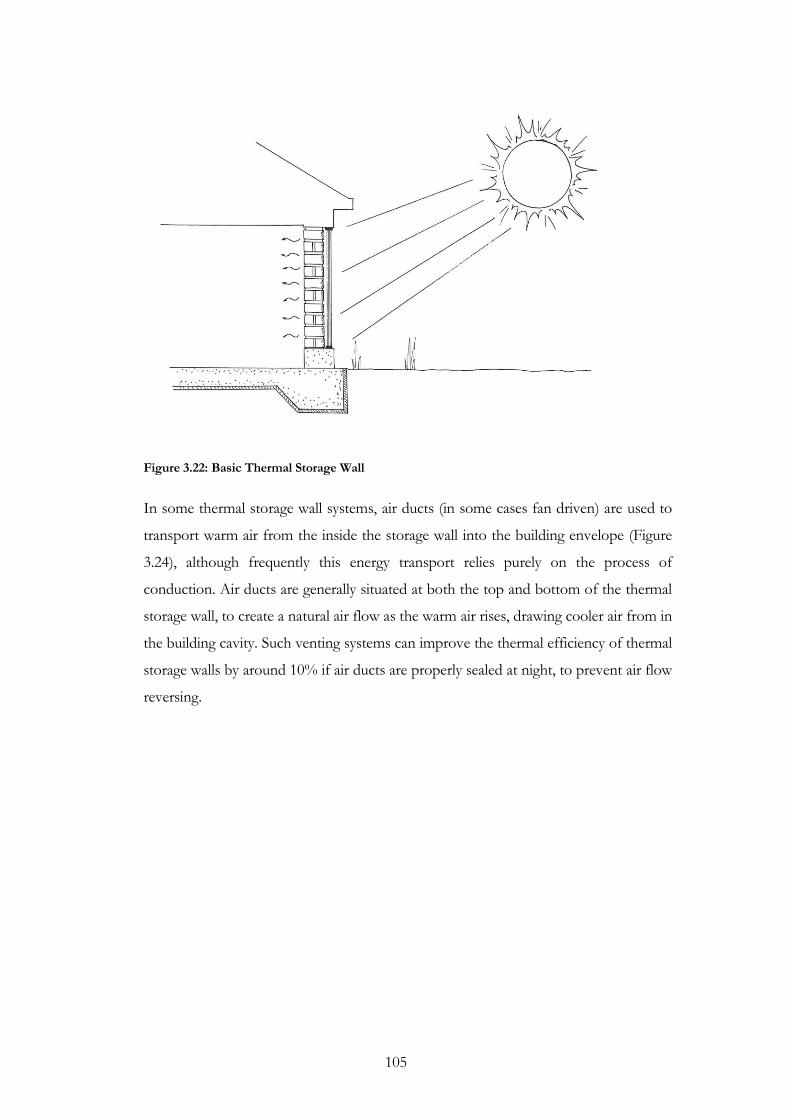
105
Figure 3.22: Basic Thermal Storage Wall
In some thermal storage wall systems, air ducts (in some cases fan driven) are used to
transport warm air from the inside the storage wall into the building envelope (Figure
3.24), although frequently this energy transport relies purely on the process of
conduction. Air ducts are generally situated at both the top and bottom of the thermal
storage wall, to create a natural air flow as the warm air rises, drawing cooler air from in
the building cavity. Such venting systems can improve the thermal efficiency of thermal
storage walls by around 10% if air ducts are properly sealed at night, to prevent air flow
reversing.
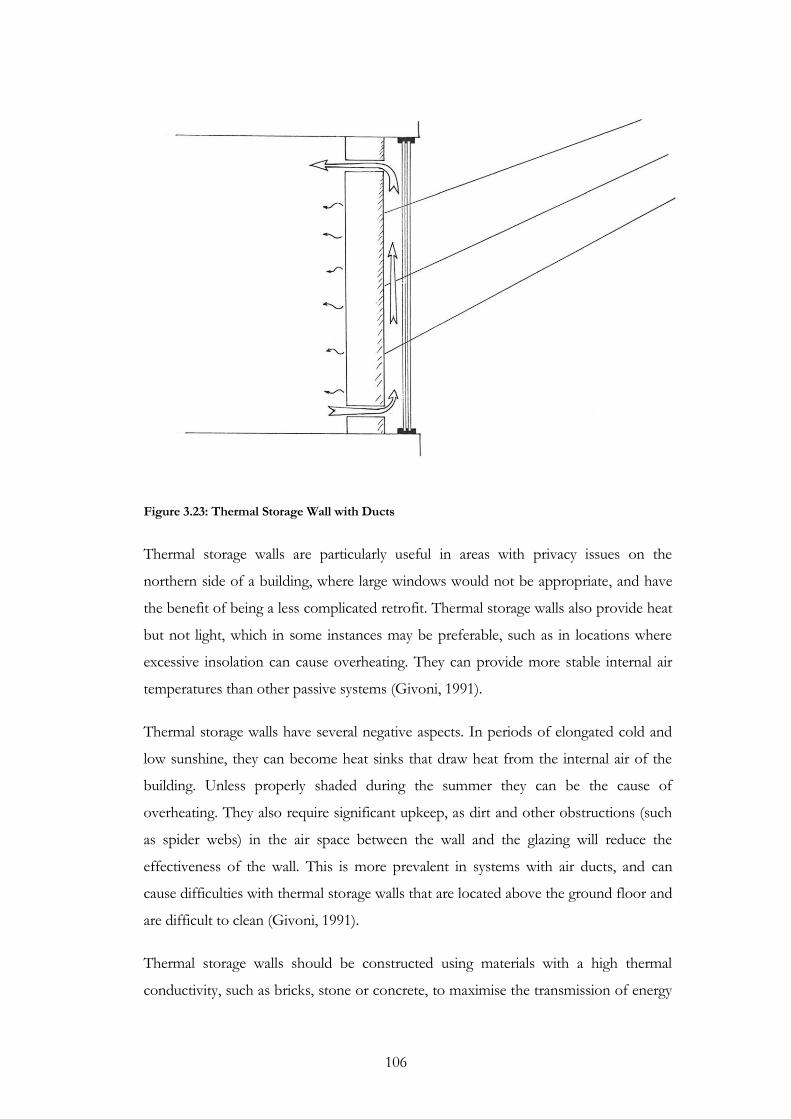
106
Figure 3.23: Thermal Storage Wall with Ducts
Thermal storage walls are particularly useful in areas with privacy issues on the
northern side of a building, where large windows would not be appropriate, and have
the benefit of being a less complicated retrofit. Thermal storage walls also provide heat
but not light, which in some instances may be preferable, such as in locations where
excessive insolation can cause overheating. They can provide more stable internal air
temperatures than other passive systems (Givoni, 1991).
Thermal storage walls have several negative aspects. In periods of elongated cold and
low sunshine, they can become heat sinks that draw heat from the internal air of the
building. Unless properly shaded during the summer they can be the cause of
overheating. They also require significant upkeep, as dirt and other obstructions (such
as spider webs) in the air space between the wall and the glazing will reduce the
effectiveness of the wall. This is more prevalent in systems with air ducts, and can
cause difficulties with thermal storage walls that are located above the ground floor and
are difficult to clean (Givoni, 1991).
Thermal storage walls should be constructed using materials with a high thermal
conductivity, such as bricks, stone or concrete, to maximise the transmission of energy
107
to the building interior. Adobe, lightweight concrete and other lower density materials
will reduce the efficiency of this transfer, and the effectiveness of the wall. Wall
thickness determines the time lag between when heat is collected on the outer surface,
and when it is radiated into the interior of the wall. Each 10cm of thickness will cause a
time lag of 2-2.5 hours, and increase the capacity of thermal storage of the wall. Givoni
(1991) suggests a wall thickness of between 300mm and 400mm to mitigate internal
temperature swings. As with all sources of thermal mass, surface colour will affect
absorptance, and darker coloured materials are preferable on the outer surface of
thermal storage walls. For this reason, bricks used in thermal storage walls are
frequently painted black to increase absorptance. As regular paints have a high
emissivity, and will reradiate long energy outward as longwave radiation, the use of
selective metallic films attached to the outer surface can be important, and will greatly
improve the performance of thermal storage walls.
Due to an increased temperature gradient, an unshaded thermal storage wall will
transmit significantly more thermal energy to the interior of the building in summer
than winter. As a result, thermal storage walls can cause overheating problems in
warmer months and need to be shaded appropriately. Even walls shaded from direct
radiation can still absorb enough diffused and reflected radiation to be a problem, so
complete and total covering of the wall externally is recommend in areas with hot
summers. Likewise, thermal storage walls can cause significant night time heat losses,
and it is recommended that suitable night time insulation be put in place to reduce this.
Double-glazing, the sealing of air ducts in the evening, and the use of exterior shutters
can help to improve insulation.
3.14.4. Barra systems
The Barra System discussed by Givoni (1991) is a solar system that features an
equatorial wall with a thermosyphonic solar collector and a concrete roof. Energy from
the solar collector is siphoned along pipes in the concrete, which provides thermal
mass to the system. While this thermal mass stores heat, a large amount of the energy is
siphoned to the southern end of the building, before the air travels back to the lower
end of the solar collector to be reheated. The Barra System is a method of using solar
energy to heat areas of the building where it is difficult to allow direct solar gain. This
distribution can help to ensure an even distribution of heat between rooms of the
building.
108
In Barra Systems, the thermosyphonic air flow results in high temperatures, even when
there is only low levels of insolation, and as solar radiation increases the rate of airflow
through the pipes increases. In comparison to thermal storage walls, when utilised in
conjunction with surrounding wall and ceiling insulation, Barra Systems will have
significantly lower heat losses in winter, and lower levels of unwanted heat gains in
summer (Givoni, 1991). Barra Systems are also more widely applicable than thermal
storage walls, and can be applied to multi-storey buildings. They can also be used to
heat living spaces that do not have any potential for direct solar gain, as the process of
convection can transfer warm air to wherever it is needed in the building (Givoni,
1991).
Barra Systems have several negative aspects, including their light blocking properties
similar to thermal storage walls, and their reliance on subtle convection currents that
require accurate engineering to ensure they function effectively. The high temperatures
required to create these currents also result in heat stress on the materials of the
system, as well it can be hot enough to melt certain materials, such as polystyrene
(Givoni, 1991). Barra Systems also have the potential to reverse air flow during the
evening, when the halt in insolation causes the air in the solar collector to become
cooler than inside the building. Reverse air flow can be prevented with a mechanism to
seal off the tubes at nightfall, or with a valve to prevent reverse air flow (Givoni, 1991).
3.15. Summary
This chapter has examined the principles that can be implemented to improve the
sustainability of residential buildings, with a specific focus on the use of passive design
to improve thermal efficiency and reduce energy consumption caused by heating and
air conditioning. The chapter examined the core principles of sustainability, with a
focus on the built environment, including how the concept of sustainability has driven
the development of passive design. Principles of passive design were examined, and the
importance of passive solar design as a means of reducing energy use and subsequent
carbon emissions was investigated. The influence of climate on residential buildings is
particularly strong, and it is important that passive design incorporate an understanding
of local conditions. Building site, shape, orientation and landscaping are also important
factors that have been examined in this chapter, as they contribute to the core
principles of passive design.

109
In examining passive design it is also important to understand the physical processes
taking place, such as heat flows and the laws of thermodynamics, and this chapter has
examined how such processes influence buildings. The influence of glazing and
insulation on such heat flows were detailed, as they greatly affect how energy passes in
and out of the building envelope. Thermal mass is of great importance to this research,
and this chapter examined in depth the role it plays in regulating building temperatures
by storing heat, and in doing so improving levels of thermal comfort within residential
buildings. While this research is primarily aimed at temperate and cool temperate
climates such as Tasmania, passive cooling and ventilation techniques were also
discussed, as they are vital for mitigating extreme heat events, and providing better air
quality for building residents. This chapter presented a number of passive heating
systems suitable for temperate climates and explored options for retrofitting existing
buildings to incorporate these systems or simply improve thermal performance.
As one of the primary objectives of passive design is the creation of a building
environment that is thermally comfortable, the following chapter examines the
principles that underpin such thermal comfort, and how thermal comfort analysis can
assist in the design and creation of thermally comfortable environments.

110
Chapter 4: Thermal Comfort
4.1. Introduction: What is Thermal Comfort, and why is it of
importance?
Thermal comfort is a psychological state where an individual is satisfied with the body‟s
thermal environment (de Dear et al., 1998, ISO, 2005). As a psychological state, it
includes a number of factors beyond a simple reaction to air temperature. Personality,
culture, and mood, along with other social and individual differences influence a
person‟s level of thermal comfort. Because of these factors and the relative difficulty in
comprehensively defining thermal comfort, methods of analysis of thermal comfort are
often quite involved and complex (de Dear, 1998).
Thermal comfort analysis can yield important information for the design of residential
buildings that are thermally efficient and incorporate the principles of thermally
efficient design presented in Chapter 3. This subsequently can assist in the generation
of suitable thermal comfort levels for the inhabitants (Tuohy et al., 2008). Likewise,
incorrect analysis of thermal comfort in the design of buildings can result in many
problems including the unnecessary installation of air conditioning and heating units, as
well as dissatisfaction with the thermal climate of the dwelling. With more
comprehensive knowledge of thermal comfort, buildings can be more effectively and
efficiently designed (de Dear et al., 1998, Ong, 1995, Tuohy et al., 2008). There are two
primary types of thermal comfort modelling: the traditional methods based on the
work of Fanger (1972), and the adaptive approach to thermal comfort modelling.
This chapter first examines methods used for modelling thermal comfort with
particular reference to standards that address residential dwellings, including those used
by, the American Society of Heating, Refrigerating and Air-Conditioning Engineers
(ASHRAE), and the International Organization for Standardization (ISO). This
chapter will then examine the adaptive approach to thermal comfort modelling with
respect to thermal comfort in existing dwellings, and a process for analysis of thermal
comfort using the adaptive modelling approach will be explained. Finally, the chapter
will examine how the design features examined in Chapter 3 can be applied to create
residential buildings with internal environments that maximise thermal comfort levels.
111
4.2. Modelling Thermal Comfort
Methods to predict thermal comfort in residential buildings can be generalised into two
main paradigms: modelling using physiological data gathered in the building; and
adaptive and behavioural data gathered by interviewing and observing the routine of
the inhabitants. Many models for analysis incorporate elements of both these methods
of analysis, although most favour one style.
4.2.1. Traditional methods of modelling thermal comfort
The American Society of Heating, Refrigerating and Air-Conditioning Engineers
(ASHRAE) and The International Organization for Standardization (ISO) have both
released standards for predicting the thermal comfort of individuals through the
analysis of a range of personal and environmental factors. These standards borrow
heavily from one another and are a continuation of research undertaken by Fanger
(ASHRAE, 2004, Fanger, 1972, ISO, 2005). These models include complex equations
that require the input of a range of data relating to the thermal environment, and are
discussed further in this chapter.
De Dear and Brager (2001) are critical of both the ASHRAE and ISO standards, and
the research on which they are modeled, saying that the standards are incorrect in
claiming that they are universally applicable across all climatic regions, building types,
occupancy types, and ventilation types. Other research has also challenged this claim of
applicability, with the argument that important contextual factors are ignored by the
ASHRAE and ISO standards, such as cultural, social, climatic, preference, and
adaptation differences between individuals, and that resultantly the need for use of air
conditioning systems is in many cases exaggerated (de Dear, 1998, de Dear and Brager,
2001, Forwood, 1995, Ong, 1995, Raja et al., 2001).
4.2.1.1. Fanger – analysis and application in environmental engineering
Analysis of the thermal comfort of college students was undertaken by Fanger (1972)
in the 1970s and this lead to the development of a range of thermal comfort standards.
Fanger developed an equation for the analysis of thermal comfort, which facilitates the
estimation of thermal discomfort as Predicted Mean Vote (PMV) and Predicted
Percentage Dissatisfied (PPD) (Nicol and Humphreys, 2005, Nicol and Humphreys,
2007, Fanger, 1972).
112
Fanger‟s thermal comfort equation is:
f(M, Icl, v, tr, ta, Pw) = 0
where:
M = metabolice rate (met)
Icl = clothing insulation (clo)
V = air velocity (ms-1)
tr, = mean radiant temperature (°C)
ta, = ambient air temperature (°C)
Pw = vapour pressure of water in ambient air (Pa)
The development of Fanger‟s comfort equation and the estimation of PPD relied
heavily on data obtained by climate chamber studies involving subject samples exposed
to regimented environmental conditions, with information recorded regarding sweat
production and skin temperature (de Dear and Brager, 2001, de Dear et al., 1998,
Fanger, 1972, Humphreys, 1995b). Climate chamber studies are not necessarily
applicable to everyday circumstances and Humphreys (1995b) asserts that for this
reason Fanger‟s comfort equation has been unable to consistently estimate appropriate
comfort temperatures in everyday living and frequently conditions can be greatly
different from those conditions under which Fanger‟s comfort equation was
undertaken. Humphreys (1995b) suggests that Fanger‟s comfort equation
underestimates human adaptability to indoor climates by about 50% when considered
on a global scale. Nicol and Humphreys (2005; 2007) comment that standards based
on Fanger‟s work are likely to be more prescriptive than standards based on studies in a
real setting, which can lead to the unnecessary inclusion of active heating or cooling
systems when applied to the analysis of residential buildings.
Ong (1995) recognises that it is broadly accepted that studies conducted with small
study groups are not usually applicable to large populations. It is also less often
considered that studies using large study groups may indeed not be applicable to these

113
smaller populations that in many cases show the most variation in how they adapt to
their thermal environment (Ong, 1995).
4.2.1.2. ASHRAE Standard 55 – Thermal Environmental Conditions for Human
Occupancy
ASHRAE Standard 55 was created for the Heating Ventilation and Air Conditioning
(HVAC) industry in designing and operating ventilation and air conditioning systems.
De Dear (2001) notes that many end-users of the standard have expressed concern
regarding its validity as it is based on the generalisation of laboratory studies involving
small samples of college students, yet is applied to design standards in much of the
developed world.
The standard recommends both a winter indoor temperature and a summer indoor
temperature, and allows for a buffer zone around each of these temperatures.
Humphreys (1995b) criticises this standard for a variety of reasons:
It implies that zones of thermal comfort are constant according to both time and location, which is incorrect as thermal comfort temperatures vary greatly according to geographic location and have varied throughout time; and
It applies uniform classifications of „summer‟ and „winter‟ to all geographic regions, yet these seasons are clearly different with changes in latitude, distance from the ocean, and other geographic variations.
De Dear and Brager (2001) are critical of the ASHRAE standards, claiming that the
standard does not apply to buildings that have been found to be thermally comfortable
because of their natural or hybrid ventilation systems. It also imposes restrictions that
are unnecessary or unfeasible and in doing so forces designers to utilise the “cool, still
air approach” to climate engineering, which is a reliance on the use of centrally
operated HVAC systems and results in unnecessary energy consumption. De Dear and
Brager (2001) conclude that the ASHRAE Standard 55, along with its counterpart ISO
7730, may indeed not be applicable to a vast range of climates around the globe. The
adaptive approach to thermal comfort assessment has been incorporated into the
standard, which may allow for its acceptance by European and international standards
(Nicol and Humphreys, 2005, Nicol and Humphreys, 2007, Raja et al., 2001).
114
4.2.1.3. ISO 7730 – Ergonomics of the Thermal Environment
The ISO Standard is more flexible than the ASHRAE standard and uses a standard
method as opposed to a standard environment. It also uses Fanger‟s „comfort equation‟
to measure heat exchange (Humphreys, 1995b). The ISO standard requires the
collection of a comprehensive range of data, including an estimation of clothing,
insulation and metabolic heat production (Humphreys, 1995b, Yigit, 1999). Calculating
metabolic rates requires the following assumptions to be made:
individual activities have a constant applicable metabolic rate, regardless of climate or season; and
clothing (clo) values are not subject to season or climate.
The ISO standards also rely on the correctness of Fanger‟s comfort equation, and how
accurately clothing and metabolic rates are calculated (Humphreys, 1995b, Yigit, 1999).
As with ASHRAE Standard 55, there is potential for unnecessary installation of air
conditioning and heating systems to ensure buildings can provide appropriate levels of
thermal comfort, and less thought into the implementation of passive design principles
into new and existing buildings (de Dear et al., 1998).
4.2.1.4. Problems with comfort standards in thermal design
Humphreys (2001) claims that the appropriate thermal design of buildings is hindered
by the rigid thermal design standards discussed above and identifies three main
associated problems. First, rigid maximum limits to summer temperatures can lead to
the installation and provision of unnecessary cooling systems. In many cases there are
other less costly and energy consuming methods such as appropriate Ventilation that
would have been possible and preferable.
Secondly, rigid limits inhibit traditional designs that have been found to be comfortable
by residents of certain geographical areas. It cannot be assumed that standards suitable
for areas such as Britain and the USA can be uniformly applied to other areas of the
globe. This assumption can lead to traditional designs being discontinued because they
do not conform to thermal comfort standards, yet they may have been used for
generations to create comfortable dwellings. There are many examples where people
live comfortably outside the ranges specified by the ASHRAE and ISO standards.
Therefore, it is important that comfort standards and guidelines are applied to specific

115
geographic locations, or allowances made for different environmental conditions as a
result of geographic location.
Thirdly, the need for intelligent thermal design according to climate and geographic
location becomes greatly reduced or overlooked once air conditioning has been
installed. With the implementation of air conditioning systems, inappropriate designs
become possible which provide excessive levels of cooling, and subsequently consume
excessive amounts of energy. De Dear and Brager (2001) note that in buildings that
have conventional centrally controlled HVAC systems, Sick Building Syndrome (SBS)
is much more prevalent and that naturally ventilated buildings are significantly less
likely to exhibit this problem.
De Dear et al. (1998) argue that these standards are too prescriptive and define a
narrow indoor temperature band that is applied uniformly through space and time.
This temperature band prescribes temperatures which are relatively constant except for
some minor accommodation of variation due to seasonal and clothing patterns. De
Dear and Brager (1998) also point out that these standards are based on a model of
thermal comfort that is static, and considers occupants to not be active participants but
passive recipients of thermal stimuli that is driven by the body‟s thermal balance with
the surrounding environment and autonomic physiological responses.
Many previous models and standards for thermal comfort are based on climate
chamber research conducted by Fanger (1972), when accepted notions of thermal
comfort were largely unchallenged. Research by Humphreys (1995b) Nicol and
Humphreys (2005; 2007), Bakker (1996), Schuler et al (2000) and Forwood (1995)
challenge the validity of these climate chamber studies. They advocate the adaptive
approach to thermal comfort analysis, and claim suggestions that these previously
unchallenged standards do not always work. For example Rowe (Rowe, 1995)
examined the complaints of hotel customers regarding thermal comfort, where thermal
environments conformed to recognised standards. Together with Forwood (1995)
Rowe suggested that limits of thermal acceptability should not be rigidly defined.
Instead they suggested that research should focus on determining the conditions under
which a particular air temperature is deemed comfortable. Simplistic and rigid
application of existing standard that disregard climatic, social and individual factors is a
major cause of problems with thermal design in residential buildings (Forwood, 1995,
Rowe, 1995).

116
Forwood (1995) and Ong (1995) suggest that a major failing of traditional thermal
comfort assessment and analysis stems from the misconception that it is the air in
building that should be heated rather than the occupants. This preoccupation with air
conditioning has lead to designers focusing on the building rather than the people
inside it, and the perception of these people as constraints to achieving thermal
comfort rather than as indicators, or indeed part of the solution. Many existing thermal
comfort standards were developed with this mindset, and are now being challenged.
Other problems with traditional modelling methods have also been identified. One
major problem is the scope for variation in the assessment of metabolic rate. The
impact of metabolic rate on thermal comfort is frequently downplayed, and analysis
requires certain assumptions to be made. These have been found to have certain
discrepancies. Ong (1995) proposes that ISO 7730 uses flawed techniques in analysing
metabolic rates as it does not take into consideration personality groups or space
typology. Each individual is likely to be significantly different from the next, and
individuals will display a diverse range of needs that are likely to vary over time (1995).
Ong (1995) suggests further development of the ISO model is required to understand
thermal comfort.
4.2.1.5. Is this method of modelling outdated?
Thermal discomfort can occur even where dwellings conform to recognised standards,
and traditional modelling methods of thermal comfort analysis are challenged by
advocates of adaptive and behavioural analysis. There has been a shift towards systems
where the individual regulates his/her own thermal environment, thus minimising the
requirement of mechanical means of regulation (Ong, 1995).
The assumed universality of these standards has been challenged since the late 1990s,
with researchers arguing that it is important to include climatic, cultural, social, and
contextual factors which are largely ignored by such rigid standards (de Dear and
Brager, 2001, Ong, 1995). Past designs prior to the development of modern thermal
comfort standards have provided thermally comfortable buildings, and Ong (1995)
argues that the development of such standards is potentially unnecessary. Humphrey
(1995) called for a revision of the standard and the philosophy underlying the
standards, and a shift to an approach that focuses on the comfort of the individual and
considers human adaptability.
117
De Dear and Brager (2001) called for revisions or supplements to ASHRAE Standard
55 to make it less climatically prescriptive and account for the variation of individuals
and adaptation to their thermal environment. Adaptive principles have since been
incorporated, which sets a precedent for the updating of other standards such as ISO
7730. Ong (1995) presents the methodology for a “radical reading of ISO 7730” that
includes a much more complex analysis of the individual, particularly with respect to
metabolic rate and personal preference.
4.3. An Adaptive Approach to Thermal Comfort Modelling and
Analysis
There has been an emergence of a new method of analysing and predicting thermal
comfort levels with many researchers challenging the validity of traditional thermal
comfort modelling (de Dear and Brager, 2001). These researchers point out that such
modelling does not account for many of the contextual effects that influence individual
thermal comfort levels. Tuohy et al. (2008) claim that adaptive analysis of thermal
comfort provides more insight than simulations undertaken in non-adaptive
approaches. As the study being undertaken relies principally on the adaptive method of
modelling in its method of thermal comfort analysis, this method will be explored in
more depth than traditional thermal comfort models.
Humphreys (1995b) claimed that thermal comfort guidelines could be developed from
field study data without the use of heat exchange theories or thermal physiology. De
Dear and Brager (1998) determined that an adaptive temperature standard should
incorporate more factors than simply the interactions of fundamental physics and
physiology with thermal perception. Humphreys suggested that thermal comfort
modelling should include information gained from the study of the behaviour of
occupants rather than using the prescriptive and often complex models of the time.
Humphreys (1995b) suggested that to determine under what conditions a person
would be thermally comfortable, a researcher simply needs to examine factors such as:
which rooms are most frequented; when individuals utilise controls such as doors and
windows or turning on heating systems, and; the type of clothing an individual chooses
to wear. This would involve interviewing individuals on how comfortable they perceive
their home. Researchers would then learn how to identify homes that are likely to be

118
thermally comfortable without having to resort to experimental routines or invasive
measurements, and without having to draw on knowledge of thermal physiology, or
thermal heat exchange.
Humphreys (Humphreys, 1995b) claimed that while this information would assist to
quantitatively explain thermal balance of an individual, and identify which
environments would potentially be dangerous, it is unnecessary for the provision of
thermally comfortable dwellings. This approach to thermal comfort modelling, which
recognizes that people will use a variety of different strategies to achieve thermal
comfort, and “are not inert recipients of the environment, but interact with it to
optimise their conditions” (Humphreys, 1995b p3) is what is known as the adaptive
approach. Many other studies have taken place into the effectiveness of the adaptive
approach in thermal comfort. Van der Linden et al. (2006) and Boerstra et al. (2005)
examined guidelines developed for the Netherlands based on adaptive research. Jamy
(1995) and Nicol (1995) examined thermal comfort requirements for buildings in
Pakistan, where people frequently feel comfortable at temperatures higher than the
existing requirements of the building code. Jokl (1995) studied the Czech Republic
temperature standards and presented a system for evaluating thermal comfort.
4.3.1. Classifications of adaptation
Humphreys (1995b) presents a list that can be used to categorise the methods in which
individuals adapt to a thermal environment. These range from the grand scale down to
specific tasks that altindividual thermal environment:
the choice of areas of the globe suitable for habitation;
the choice of the building site (for example, shelter from wind, shade from trees);
the choice of design and construction of the building (for example, shape, orientation, thermal capacity, glazed area, thermal insulation);
the choice of heating or cooling systems whether simple or sophisticated;
the use of controls (thermostats, switches, valves, operable ventilating windows, blinds, ceiling fans);
the choice of clothing suitable to the climate, season, indoor temperature and social needs; and
119
the operation of sometimes unconscious changes of posture and activity, and of any physiological acclimatization there may be to the season of the year (Humphreys, 1995b).
Similar to Humphreys‟ (1995b) methods in which individuals thermally adapt, de Dear
(1998) defines three categories of thermal adaptation: behavioural adjustment;
physiological; and psychological.
4.3.1.1. Behavioural adaptation
Behavioural adaptation is arguably the most significant in an individual‟s ability to achieve
and maintain thermal comfort and includes modifications that an individual makes that
alter the body‟s thermal balance (Critchfield, 1974, Humphreys, 1995b). Ong (1995)
argues that the ability to modify an individual‟s environment is more crucial to
achieving thermal comfort than the current environmental conditions, making
behavioural adjustment particularly important. These adjustments can be either
conscious or unconscious.
Personal adjustment includes the adjustment of physical position, clothing or levels of
physical activity, but not the adjustment of factors external to the body such as
windows and heating systems. De Dear and Brager (2001) note the primary and most
obvious method of behavioural adaptation is the adjustment and selection of clothing.
Clothing has been included in the modelling of thermal comfort since Fanger (1972)
introduced clo values and this was identified as one of the most effective means of
adjustment to thermal conditions, particularly in mediating the differences in thermal
requirements within the one thermal environment (Critchfield, 1974, De Dear et al.,
1998, Jokl, 1995). Seasonal changes in the temperature at which comfort is maintained
can largely be attributed to adjustments in clothing and that individuals tend to alter
clothing to be suitable to the outdoor climate rather than the indoor climate
(Critchfield, 1974, Fanger, 1972). When indoor temperatures are closer to outdoor
temperatures an individual is more likely to dress in a more climatologically suitable
manner. Above all, de Dear et al. (1998) states that behavioural adjustments and not
acclimatisation and habituation are probably the most important factors in adjusting to
indoor climate.
Technological adjustment includes the implementation of heating or cooling devices,
from the very advanced (such as air conditioning and heating systems) to the simple
opening or closing of windows and doors (Rijal et al., 2008, Tuohy et al., 2008).
120
Adjustment of ventilation (such as opening windows to increase air flow within a
naturally ventilated space) is an important type of behavioural adaptation that is used
particularly in warmer climates, and is unfortunately restricted in buildings with
centrally controlled heating systems (Baker and Standeven, 1996, De Dear and Brager,
2001, Forwood, 1995, Rijal et al., 2008, Tuohy et al., 2008, Umemiya and Nakamura,
1995). Rijal et al. (2007), Forwood (1995) and Tuohy et al. (2008) identify windows as
a primary means of occupant control of the thermal environment, and examine
potential reductions in energy consumption and increases in thermal comfort levels
that can occur as a result of appropriate utilisation of windows.
Cultural adjustments include activities such as siestas implemented by social groups to
assist in mitigating the impacts of temperature swings and providing suitable thermal
conditions. The closing down of businesses during the warmer hours of the day such
as siestas in Spain and Central America are good examples. There are also the seasonal
practice of staying indoors to avoid cold weather events in extremely cold climates
such as Scandinavia, Canada, and Eastern Europe (de Dear et al., 1998).
4.3.1.2. Physiological adaptation
Physiological responses to thermal environments will diminish with repeated exposure,
resulting in changes to the physiology of the individual. This adaptation can result in
genetic and intergenerational changes, or alternatively result in changes within the
lifetime of a specific subject. Both mental and physical activity can have an influence
on thermal sensation by altering metabolic rates (Gagge et al., 2004, Kaynakli and Kilic,
2005). Rowe (1995) indicates that as mental and physical activity increases, people will
favour temperatures as much as 3C lower than at a state of rest.
An individual exposed to a climate that is marginally outside their area of comfort will
eventually become acclimatised (Critchfield, 1974, Jamy, 1995). Upon returning to a
more ideal climate, the individual may initially feel thermally uncomfortable. For
example, when arriving home from a cold and wet night, the warmth and dry
conditions within the building can initially feel quite uncomfortable. This is not purely
because of the heavier clothing that may have been worn to compensate for the colder
climate, but also because the individual has temporarily acclimatised to the colder
outside temperature. In many cases, an individual will soon return to experiencing a

121
comfortable level, however, and it can take long-term repeated exposure to a new
temperature range to acclimatise fully in the long term (Critchfield, 1974).
4.3.1.3. Psychological adaptation
Psychological adaptation occurs when the subject‟s perception of and reaction to
thermal stimulation changes over time. Repeated stimuli can result in a diminished
response and regular exposure to a temperature outside an individual‟s comfort range
can change their psychological perception of the temperature in addition to the
processes of physiological acclimatisation (Critchfield, 1974, de Dear et al., 1998,
Humphreys, 1995b). De Dear et al. (1998) suggests that context and contextual factors
that alter an individual‟s perception and expectation will, therefore, alter their thermal
comfort levels, and therefore alter their response to thermal stimuli.
De Dear et al. (1998) suggest that an ideal temperature standard would be based on “an
alternative to traditional comfort theory – termed the adaptive model for comfort, in
which factors beyond fundamental physics and physiology interact with thermal
perception” (de Dear et al., 1998 p2). Occupants cannot be regarded as inert, passive
subjects of their environment. Instead they actively implement their own thermal
preferences (de Dear et al., 1998). While many researchers argue that the traditional and
adaptive methods of thermal comfort modelling and analysis are exclusive and cannot
be used in conjunction, de Dear et al. (1998) suggest that the adaptive approach should
be used to compliment and balance the traditional methods, and that both methods
can and should be used in unison.
4.4. Thermal Comfort Analysis Using Adaptive Principles
Actual thermal comfort arises from matching thermal conditions with the thermal
preferences and expectations of the subject, and models for thermal comfort should be
based upon this principle (de Dear et al., 1998). Using the principles developed by
researchers of the adaptive approach to modelling thermal comfort, it is possible to
accurately assess and rate the thermal comfort levels of occupants in dwellings. The
adaptive principles of thermal comfort modelling show that the best method to
determine the thermal comfort of an individual is simply to ask them, while observing
and noting the measures and techniques they use to modify their personal thermal
122
environment. To analyse thermal comfort using the adaptive approach should involve
examining and measuring criteria that have largely gone unexamined or underestimated
in traditional models for the analysis of thermal comfort.
4.4.1. How is thermal comfort expressed in adaptive assessment?
There are a range of ways in which levels of thermal comfort can be quantified or
expressed in studies using the adaptive approach. Baker and Standeven (1995) express
the availability of occupants to adapt to thermal conditions as adaptive opportunity, or the
opportunity available within a building for occupants to make themselves comfortable.
A higher adaptive opportunity can mean a wider range of temperatures are possible in
an environment for occupants to remain thermally comfortable. Thermal neutrality and
preferred temperatures can be used to determine a range within which an occupant is
comfortable (Nicol and Humphreys, 2005).
4.4.1.1. Thermal neutrality and preferred temperatures
Thermal neutrality is a state experienced when an individual feels neither warm nor
cool sensations. Similarly, preferred temperature is the temperature range within which
an individual will identify as being comfortable. Humphreys (1995b) states that while
human neutral temperatures broadly range from 17˚C to 33˚C, it is possible to more
accurately predict neutral temperatures by examining outdoor mean temperatures.
Outdoor mean temperatures in inhabited areas around the globe range from -24˚C to
33˚C, meaning that indoor mean temperatures span the range of only 30% of outdoor
temperatures, and that buildings effectively reduce temperature variability by 70%.
Humphreys (1995b) also suggests that the optimal range of outdoor temperatures that
will minimise the need for indoor temperature adjustment is 20˚C to 23˚C and that the
further outdoor temperatures stray from this temperature zone the higher the
probability of occupants turning on their air conditioning systems or other heating and
cooling devices.
De Dear and Brager (2001) and Forwood (1995) determined that in examining thermal
neutrality levels in environments where behavioural modification is possible, thermal
comfort levels will be higher, and that this is particularly the case where buildings are
naturally ventilated. In naturally ventilated buildings, preferred temperatures within the
building will rise by approximately one degree for each rise of three degrees in
temperature outside the building (de Dear and Brager, 2001, Raja et al., 2001). If
123
humans are using the methods discussed in Chapter 3, then to successfully adjust their
environment, clothing and person to make themselves thermally comfortable, it can be
expected that on average they will create thermal environments that are within their
preferred temperature range (Forwood, 1995, Humphreys, 1995b, Raja et al., 2001).
On average, humans prefer thermal temperatures around 2˚C below the indoor means
when not implementing energy consuming cooling or heating devices, and half a
degree below indoor means in the absence of such devices (Humphreys, 1995b). While
mean temperatures are not always the same as preferred temperatures, they can be
considered a decent approximation.
Indoor neutral temperatures are also subject to changes and variations in outdoor
temperatures. De Dear and Brager (2001) found that in warmer climates, the neutral
temperatures indoors will rise to reflect outdoor temperatures. Likewise preferred
temperatures were found to track the temperatures directly outside the building.
4.4.1.2. Neutral and optimal zones
There is no distinct boundary between comfort and discomfort, and no temperature
where all people will be comfortable, or have a desire for warmer or cooler
temperatures. In the majority of buildings, thermal discomfort is likely to result at some
point, and it is suggested that thermal comfort should be defined as a zone rather than
a specific temperature (Nicol and Humphreys, 2005). Broad zones for acceptable
temperatures were set for offices in the temperate climate of the UK and indicated a
range of between 13°C and 30°C, dependent on levels of physical activity (HSE, 1999).
Jokl (1995) suggests that an optimal microclimate will yield a neutral zone and that the
onset of sweating or shivering indicates deviation from neutrality. However, differences
can exist between what an individual perceives as thermally neutral and what an
individual perceives as thermally comfortable or acceptable. If an individual is asked how
he/she feels thermally, a response of “warm” or “cool” will not indicate thermal
neutrality, but might indicate thermal comfort, as under given circumstances feeling
warm or cool might be thermally acceptable or even preferred. To assume that an
individual prefers thermally neutral zones ignores human desire for sensation and
stimuli. Therefore the temperature range or zone in which an individual is thermally
neutral can differ from the zone that an individual finds thermally optimal.

124
Nicol and Humphreys (2005; 2007) calculated a comfort temperature based on the
running mean of outdoor temperature, and determined that thermal discomfort levels
were a function of the difference between the internal temperature of the building, and
this comfort temperature. Methods of mitigating the impacts of thermal comfort are
discussed in Section 4.5.1
4.4.2. Climate and thermal comfort
Climate impacts upon human health and comfort to a greater degree than any other
aspect of the physical environment, and it largely dictates selection and adjustments in
clothing and traditional building design. Compared to other species, humans are highly
capable of acclimatisation to atmospheric variations, and exhibit a wide range of
optimal thermal comfort levels as a result (Critchfield, 1974). Preferred temperatures
differ geographically, with occupants of cooler climates preferring above average
indoor temperatures and a much greater temperature difference between indoors and
outdoors (Nicol and Humphreys, 2005). Resultantly, physical connection between the
internal environment and the outdoors will generally be detrimental to thermal
comfort. Temperate climates feature significant portions of the year where outdoor
living is possible, as thermal comfort can be achieved outside, facilitating a smaller
difference and recognisable link between outdoor and indoor temperatures. Warmer
climates mirror colder climates, with indoor temperature being significantly cooler than
average. For example, in warmer climates the thermostats in air conditioned buildings
are often set much cooler than what would actually be comfortable during the winter.
It is not uncommon to find thermostats set to 17˚C during the summer, when
temperatures that low in the winter would prompt the occupants to use heaters.
Nicol and Humphreys (2005) determined that the temperatures that people find
comfortable are directly influenced by the outdoor temperatures, and during even short
periods of warmer temperature occupants will accept warmer indoor temperatures.
Resultantly, it is possible to predict preferred thermal temperatures according to the
climate and local conditions in which the building is located. It is also important to
consider the impact of climate when assessing thermal comfort levels.
4.4.3. Human self regulation
The adaptive approach to thermal comfort modelling recognises that an individual will
use available potential adjustment and selection to make themselves thermally

125
comfortable and that thermal discomfort arises from the lack of availability or
restriction of these methods of adaptation (Humphreys, 1995b). Humans are far better
at regulating the temperature for their own comfort than any artificial system simply
because they know what they want, and an artificial system fails to recognise that humans
operate within a thin range of thermal conditions that vary from individual to
individual (Ong, 1995). Desires for different temperatures and conditions mean that
while it is possible for thermostats and air conditioning systems to create an
environment that complies with certain regulations, it is virtually impossible for such
machines to know exactly what conditions occupants desire (Jokl, 1995).
Humphreys (1995b p3-4) asserts that thermal comfort should not be seen primarily in
terms of the physiology of heat regulation and clothing but as a “wide-ranging and
intelligent behavioural response to climate”. Subsequently temperatures at which
comfort is achieved cannot be fixed but are subject to a variety of factors listed in
Section 4.4.2 of this chapter.
4.4.4. Thermal controls and tolerance
Since the air conditioning “revolution” of the 1980s, when HVAC systems were
routinely installed in homes and offices, naturally ventilated buildings were becoming
less common. They were replaced by automated air conditioning and heating systems
frequently controlled by a thermostat that operates from a set air temperature
(Forwood, 1995, Raja et al., 2001). There are many problems associated with increased
reliance on the installation of centrally controlled buildings, including a narrowing of
the optimal zone for thermal comfort and increased levels of thermal discomfort
resulting from even minor changes in temperature.
De Dear and Brager (2001) note that the primary difference between naturally
ventilated buildings and their centrally controlled HVAC counterparts is that in
centrally controlled buildings the occupants relinquish their operational control over
the building‟s thermal operation, and subsequently their thermal environment. In
naturally ventilated buildings it is frequent that occupants, even in the worst case of
poorly designed buildings, will have access to windows to modify their thermal
environment (Baker and Standeven, 1996, de Dear et al., 1998, Raja et al., 2001,
Wrigley, 2005).
126
Increasingly, adaptive methods of thermal comfort modelling and analysis are finding
that there is a desire for individual control over the occupant‟s environment, and that
this desire is both psychological and physiological (Humphreys, 1995b). Ong (1995)
suggest that this is because humans function within a particularly small range of
thermal conditions to which they are physiologically sensitive.
A wide range of literature indicates that it is important that individuals retain the ability
to exert influence over their thermal environment, as individuals with a greater level of
control will be able to comfortably withstand greater temperature swings in the
environment (Baker and Standeven, 1996, de Dear et al., 1998, Raja et al., 2001).
Natural ventilation is one way in which an individual can regulate and control his or her
thermal environment. It is of particular importance during the warmer months, where
air flow can have considerable impact in mitigating thermal discomfort due to
excessive heat (Critchfield, 1974, Forwood, 1995, Raja et al., 2001, Umemiya and
Nakamura, 1995).
4.5. Design for Thermal Comfort
The thermal success of building design should be determined by how satisfactory the
occupants judge the thermal environment. This will be based on a variety of
physiological, psychological and social factors making it in many instances difficult to
realise (Critchfield, 1974, de Dear et al., 1998, Ong, 1995). Adaptive methods of
thermal comfort modelling also recognise that humans exist in a variety of different
climates and areas around the earth and that in these different climates, housing stock
has evolved and adapted to provide the most effective shelter and thermal comfort
conditions for the inhabitants of that region (Ong, 1995). The design of modern
buildings should involve an integrated approach, bearing in min the potential heating
systems, rather than post design consideration of thermal comfort.
4.5.1. Mitigation of the causes of thermal discomfort
Section 4.4.1.1 identified methods of identification of methods of thermal discomfort,
and noted that this is likely to occur at some point in the majority of buildings. A wide
range of methods are available for preventing thermal discomfort, and studies into
these techniques have been undertaken by Nicol and Humphreys (2005; 2007) within

127
an adaptive context in both passive free running buildings and buildings actively heated
and cooled. A potential range of acceptable thermal comforts has been established.
Methods for the mitigation of thermal discomfort have been discussed in Chapter 3 on
sustainable design. However, what follows is a brief synopsis of the main causes of
thermal comfort, with reference to how they can be avoided or mitigated.
Ensuring appropriate levels of solar penetration into the building envelope is important
in passively helping to reduce thermal discomfort due to both the heat and the cold.
Appropriately located windows and skylights can allow sunlight into a building. This
can be captured in the winter to heat the internal environment; however, excessive
insolation can result in overheating in winter (Halliday, 2008, Reardon et al., 2005,
Smith, 2009, Tuohy et al., 2008, Wilkie, 2003, Wrigley, 2005). North facing windows
with correctly sized eaves, and appropriate tree planting can help to ensure appropriate
planting (Halliday, 2008, Hollo, 1995, Reardon et al., 2005, Wrigley, 2005). Thermal
mass is an appropriate medium for storing solar energy and other heat energy, and can
have both a warming and cooling function depending on internal and external
temperatures (Halliday, 2008, Hollo, 1995, Kalogirou et al., 2002, Reardon et al., 2005,
Smith, 2009, Tuohy et al., 2008, Wilkie, 2003).
Correctly installed bulk and reflective insulation in the roofs, walls, under floorboards,
and around slabs will reduce heat loss in the winter and help to prevent thermal
discomfort due to overheating in the summer. Rijal et al. (2007) identified the impact
of windows in altering the thermal environment of a building, and their potential for
positively impacting upon thermal comfort levels. Incorrectly operated, installed or
selected windows can also negatively impact on the internal environment of a building,
and potentially cause thermal discomfort (Halliday, 2008, Hollo, 1995, Reardon et al.,
2005, Smith, 2009, Wrigley, 2005). Windows, doors, and skylights, can all be a cause of
drafts if they are not properly sealed. Such drafts can result in thermal discomfort and
should be blocked or sealed where possible. De Dear and Brager (2001) note that even
though studies into thermal comfort have been more broadly studied in warm
environments, with focus on reducing the need for cooling air conditioning, it is the
cooler climates that have the greatest level of thermal discomfort due to drafts.
Humidity can also be a cause of thermal discomfort, and is more difficult to modify
(Fountain et al., 1999). Behavioural alterations, such as choosing to not use certain
128
humidity increasing devices, can be an effective means of preventing thermal
discomfort, as can the implementation of devices such as extractor fans, and the
installation of reflective insulation and moisture guards (Fountain et al., 1999, Halliday,
2008, Hollo, 1995, Reardon et al., 2005).
The adjustment of clothing is a simple yet effective method of preventing thermal
discomfort caused by temperature or drafts, and is generally cheaper and easier than
many retrofitting procedures (Critchfield, 1974, Humphreys, 1995b, Ong, 1995, Yigit,
1999). With the implementation of techniques for improving thermal comfort
mentioned here and discussed in detail in Chapter 3, it is possible for the majority of
dwellings to have infrequent occurrences of thermal discomfort and be largely within
preferred temperature ranges (Humphreys, 1995a).
4.6. Chapter Summary
Thermal comfort analysis can provide information for building designers and residents
to create thermal environments within buildings conducive to high levels of thermal
comfort. Failure to correctly analyse and predict thermal comfort levels can result in
poor thermal performance of buildings, low levels of thermal comfort for occupants,
and the unnecessary installation of heating and cooling devices. Accurate assessment of
thermal comfort can reduce the risk of these problems occurring, and provide
economic, environmental, health, and comfort benefits. In studying the effectiveness
of passive design principles in residential buildings, such as those identified and
discussed in Chapter 3, it is important to include an analysis of the thermal comfort of
the residents. This study recognises that humans are not inert subjects of their
surrounding environment, and uses the adaptive approach to thermal comfort analysis.
Chapter 5 discusses in detail the methodology used for this study, with reference to
other studies of a similar nature.
129
Chapter 5: Case Study Method
5.1. Introduction
This chapter presents the method used in the design and development of a series of case
studies that examined thermal comfort levels in residential buildings in Hobart. The primary
aims of these case studies were to determine the thermoregulatory effect of thermal mass of
buildings in residential buildings, and the extent that thermal mass influences the thermal
comfort of building occupants. This chapter will detail:
previous case studies and qualitative and quantitative research techniques relevant to this project;
the research design of a series of case studies;
the administration of pilot studies to ensure the study would function correctly;
details of the qualitative and quantitative data gathering process for the study; and
the process of evaluating the study data.
Because it accepts the adaptive approach to the analysis of thermal comfort discussed in
Chapter 4, the study involved analysis of the thermal comfort of residents in their own
homes, under normal domestic circumstances, as opposed to a regulated environment akin
to climate chamber studies previously used to assess thermal comfort levels (Brager and de
Dear, 1998, deDear et al., 1998, Fanger, 1972). The study required the gathering of:
observational information regarding the actions of the occupants; survey questions regarding
their thermal comfort levels; and physical data from the building.
Because such a variety of data were required, mixed method procedures were identified as
the most appropriate, with an emphasis on qualitative research methods. Concurrent mixed
methods involve the converging of quantitative and qualitative data to provide a more
comprehensive analysis of the subjects, with data collected concurrently and then integrated
during the interpretation phase using Thematic Analysis (Booth et al., 2008, Creswell, 2009,
McGuirk and O'Neill, 2005).
Qualitative research involves the use of new and emerging questions and procedures. Data
are: typically collected in the participants‟ domestic setting; includes an analysis of data to
build general themes; and allows the researcher to make interpretations regarding the
meaning of the data (Creswell, 2009, Hay, 2005). McGuirck and Oneill (2005) argue that
130
qualitative research “seeks to understand the ways people experience the same events, places
and processes differently as part of a fluid reality; a reality constructed through multiple
interpretations and filtered through multiple frames of reference and systems of meaning-
making‟. Thermal comfort is the experience and process this study seeks to understand, with
case studies of a variety of individuals presenting multiple interpretations and frames of
reference. Qualitative research does not necessarily try to measure and quantify its subjects of
study, but rather seeks to interpret complexities, context and significance of these subjects,
and as such is an ideal research method in the adaptive approach to examining thermal
comfort (Eyles and Smith, 1988, Hay, 2005, McGuirk and O'Neill, 2005).
Case studies are a qualitative technique that involves the in-depth inquiry into an event,
activity, process, individual or group of individuals and use a range of data collection
techniques and procedures over a period of time (Stake, 1995). They are not appropriate for
large numbers of subjects, and instead allow the comprehensive study of a restricted cohort
of subjects (in this case eight). Case studies were identified as a suitable research technique
because they allow the in-depth analysis of each building and its occupants, and are suitable
for a mixed method approach as they can be used to gather both quantitative and qualitative
data (Creswell, 2009).
5.2. Techniques for Designing the Case Studies
To understand how the complex concept of thermal comfort is influenced by building
construction type a wide range of data needs to be collected and analysed to fully understand
each building and its occupants. These data include:
the levels of thermal comfort experienced by occupants during different external weather events and conditions;
microclimatic conditions within the building envelope; and
the range of structural features of the building.
Therefore, the use of case studies is an appropriate research technique. Each case study was
comprised of a single building, with the Walford Terraces combining three case studies into a
single larger case study. Each building and its adult occupants were subjected to an intensive
study including: the placement of temperature data loggers within the building envelope;
examination of physical and structural properties of the building; and night-time studies to
examine occupant thermal comfort and adaptation, and thermal properties of the building.

131
A case study involves the study of the complexity and unique nature of a single case, in order
to gain an understanding of activity in relation to specific and important circumstances. With
a series of case studies, each study is unique to the others, giving rise to individual ideas and
opportunities for the development of new knowledge. Stake (1995) gives comprehensive
instructions on the purpose, design, execution and analysis of case studies.. A case can be
defined as an integrated system, and should be considered an object rather than a process. Stake
(1995) defines three types of case study, based largely on the motivations behind the study,
which help to determine the methods employed:
intrinsic case study – where there is an intrinsic interest in the case and a study may provide information which is needed specifically about that particular case. The study is not undertaken to provide information and learning on other cases or to solve a general problem;
instrumental case study – where there is a research question or a problem that needs solving, and understanding can be attained through the study of a particular case. The study of the case is conducted to provide information that can be applied to more than just that specific case; and
collective case study – where the study of one case is considered insufficient, and the combined learning from a range of instrumental case studies will yield more rigid results.
This study adopted the collective case study approach, however, individually the cases can be
considered instrumental as there is a focus on attaining information that can be applied
generally and not specifically to the individual case. Subsequently, the issue at the heart of the
study is considered more important in determining research processes than the individual
cases (Creswell, 2009, Stake, 1995).
5.3. Selection of Participants
Case study research is not sampling research, and as such the cases do not necessarily have to
be representative of an entire population. Stake (1995) notes that in case study research the
need to produce generalist information to allow wide ranging understanding of other cases is
secondary to the primary obligation to understand the individual case. In selecting a case for
study, a case that is typical of a population can be effective, however the use of an unusual
case can often provide information on or an illustration of issues that are often overlooked in
more obvious cases (Creswell, 2009, Stake, 1995).
132
In selecting cases, the primary criteria should be the potential for learning that each case will
deliver (Stake, 1995). Cases that allow the greatest understanding of the research material and
present potential generalisations are preferential. It is also important that cases are easily
accessible and open to enquiry. To locate suitable buildings and occupants for study, a letter
calling for participants was distributed using a variety of distribution sources. This
distribution was primarily the mailing lists of: Australia and New Zealand Solar Energy
Society; Sustainable Living Tasmania; and the Environment Institute of Australia and New
Zealand. The letter included a telephone number, email and mailing address for participants
wanting to be involved in the study. Participation was voluntary, and participants were
informed that they could withdraw at any time without prejudice. The audience to which the
letter was distributed, and the voluntary nature of the study helped ensure that participants
would be willing and cooperative during the study process.
Identifying potential case studies in this manner has potential to bias the results of data
obtained. Because of the voluntary nature of the study however, it was a necessary process to
ensure sufficient case studies and reduce the likelihood of withdrawal from the study by
participants. Also, as stated, the primary criteria in selection of studies is the knowledge
obtainable from each individual case, and that cases and their participants are accessible
(Stake, 1995). As a result, this deemed an appropriate method attracting participants. The
results of each case are presented separately, and potential bias was taken into account in the
analysis of results and discussion.
An initial examination was carried out on each building and its occupants, after which
participants were selected. It was important to ensure a diverse range of buildings and
occupants. As a result building size, occupant age and gender were all important factors in
participant selection (Creswell, 2009, Stake, 1995). While the number of cases is fewer than in
past thermal comfort studies, the dual nature of this study in examining both thermal
comfort and the physical properties of each building placed restrictions on the number of
cases possible. It was therefore important to ensure that each case selected that was unique
and able to provide information valuable to the study, and that each study included a number
of comparative repetitions.
The final selection of buildings and occupants included:
Case 1 – a large architect-designed, open-plan home occupied by a family of four;
Case 2 – a medium sized bungalow occupied by a middle-aged couple;
133
Case 3 – large brick two storey 1950s house occupied by a family of four;
Case 4 – a small timber house on a north facing valley side occupied part time by a male and female;
Case 5 – a small brick house in a valley floor occupied part-time occupied by a male and a female;
Case 6 – a modern first storey apartment occupied by an elderly female;
Case 7 – a modern three storey house occupied by a single male;
Case 8 – three apartments from the Walford terraces, a modern architect-designed public housing estate, incorporating environmental principles into the building design:
- Case 9a – a lower storey double brick apartment occupied by a wheelchair bound female;
- Case 9b – a top storey brick veneer apartment occupied by middle aged female and teenage male; and
- Case 9c – a two storey apartment occupied by a middle aged male.
While the presence of children as building occupants in several cases was noted, they were
not included as study participants.
5.4. Occupant Background Information
Gathering background information on each study participant was important in determining
factors that could potentially affect their levels of acclimatisation to both the Tasmanian
conditions and their dwelling. Acclimatisation can affect thermal comfort levels and influence
the suitability of dwellings in the provision of thermally comfortable internal environments.
At the commencement of each case study, adult occupants were subjected to a questionnaire
and short interview to gather appropriate background information. Interviews are a useful
tool for investigating complex behaviour, motivations, opinions, knowledge gaps, and
understanding how meanings differ amongst groups of people (Dunn, 2005). Dunn (2005)
states that there are four main reasons why interviews are used:
to fill a gap in knowledge that other methods, such as observation or the use of census data, are unable to bridge efficaciously;
to investigate complex behaviour and motivations;
134
to collect a diversity of meaning, opinion, and experiences. Interviews provide insights into the differing opinions or debates within a group, but they can also reveal consensus on some issues; and
when a method is required that shows respect for and empowers those people who provide the data. In an interview the informant‟s view of the world and experiences should be valued and the opportunity provided to find out more about the research project than if they were simply observed or completed a questionnaire (Dunn, 2005).
This study utilised interviews to fill a knowledge gap in the data. This was obtained by the
night-time studies and ongoing data gathered by the temperature data loggers, and garnered
the opinions and views of subjects regarding their current dwellings. These interviews
allowed a profile to be developed for each occupant on their level of acclimatisation.
Information recorded included:
how long the occupant has lived in Tasmania;
prior locations the occupant has lived;
how long the occupant has lived in the current building; and
how thermally comfortable the occupants perceive their current home.
Dunn (2005) divides interviews into three types: structured interviews; semi-structured
interviews; and unstructured interviews. Structured interviews involve a set list of pre-
determined and standardised questions to which the interviewer strictly adheres. Questions
are asked in the same method and order at each interview. Unstructured interviews are more
free form and do not have such rigorous prescriptions. Interviews in this study were semi-
structured, sitting between structured and unstructured with a predetermined order of
questions, but the flexibility to move away from them where necessary (Dunn, 2005). The
questionnaire was used to guide the interview and ensure that necessary information was
obtained. The survey data sheet used to record this information is included in Appendix 1.
5.5. Building Profile Information
A range of data was collected on each building to comprehensively understand the thermal
process. Schuler et al. (2000) presents a comprehensive method of building analysis in
specific reference to space heating, from which a building classification survey was
developed. The building analysis data collection sheet is found in Appendix 2.
135
Initial information was gathered regarding each building, including its: vintage; number of
dwellings within the building (as this can affect heat transmission and loss by altering the
surface area to volume ration of the building); size of the building; connection to other
buildings; number of storeys; ownership status of the occupants; available installed heating
systems; location of water boilers; locale and surrounding environment; external door
location, and; weather stripping and window seals. From this, buildings were classified into
the categories of: low thermal mass; medium thermal mass; and high thermal mass. Low
thermal mass buildings include: weatherboard buildings with floorboards with no additional
thermal mass; and brick veneer buildings with floorboards or equivalent. Medium thermal
mass buildings include: brick veneer buildings with a concrete slab; mud brick buildings on a
concrete slab; or equivalent. High thermal mass buildings include: double brick buildings;
reverse brick veneer with a concrete slab; rammed earth buildings on a slab; or equivalent.
Plans of each building were made, with each room numbered, and the surfaces measured
within each room clearly marked. Where possible, building plans were used, particularly with
the newer buildings, however in many cases it was necessary for measurements to be taken to
develop accurate plans of each building.
Information specific to each room was also gathered. Data on floors, ceilings, external walls,
internal walls, ceilings and roof spaces, windows, and skylights were taken. This included
information on location, materials used, insulating properties, coverings, areas, thicknesses,
and shading devices. Information was also noted on cross-flow ventilation, chimneys,
wall/ceiling vents, exhaust fans, vented downlights, vented skylights, doors to utility rooms,
external doors, and un-flued gas heaters. Where possible, energy expenditure data were
obtained for each dwelling.
5.6. Building Temperature Data
Temperature data loggers were placed in the central living areas of the buildings, where a
temperature reading appropriate to the main area occupied in the night-time could be
obtained. In the Walford Terraces, data loggers were also placed in other rooms of the
buildings, including the bathrooms and bedrooms. These loggers took air temperature
readings at 15 minute intervals throughout the day and night, and ran for three months
periods.

136
The data loggers were LogTag TRIX-8 Temperature Recorders and took measurements
between -40°C and +80°C. In the operating temperatures of the study they operate at
±0.5°C. Being capable of taking a large number of readings over an extended period of time,
they were considered appropriate for the study. The only unforeseen problem was that they
were not rechargeable and once batteries became flat data was irretrievable. Care was taken
to ensure that data was regularly collected from each unit.
Data loggers were placed according to ASHRAE standard for air conditioner thermostat
height, at 180cm above floor height, out of direct sunlight, and discernable air currents. To
minimise interference with the householders, where possible data loggers were placed out of
the vision of householders and the blinking light on each logger was obscured (particularly in
bedrooms). Householders were briefed as to the purpose of each logger to mitigate any
concerns they may have regarding what information it was recording and potential emissions
from the logger.
5.7. Building Night-Time Surveys
There have been a number of climate chamber studies that examined how people respond to
highly controlled climates, with a view to determining optimal conditions for building
occupancy. The nature of climate chambers means that they do not represent the conditions
within a building, and consider building occupants inert subjects of their environment and
unable to alter their surroundings (de Dear and Brager, 2002, Humphreys, 1995b).
Occupants and buildings alter and impact upon each other to the point where a relationship
is formed and this must be considered when examining thermal comfort.
Surveys were conducted to gain information across different seasons, and to allow a
comparison of how the building performed in different climatic conditions. The studies
occurred over the period of a year at three month seasonal intervals. Study nights were
organised around the routine of the householders, to ensure that their regular activities were
not overly disrupted and that all participants could be present. Each study involved a start
time of as close to 6pm as possible and ended when the householders indicated that they
wished to retire to bed. While there was some variation between cases, each case was subject
two four night time studies. Each night time study involved the gathering of physical
information (including air and surface temperature data), the observation of occupant
interations with the thermal environment, and the surveying of the occupants on their
thermal comfort levels.
137
A LogTag TRIX-8 Temperature Recorder was placed in an undercover and sheltered
position outside the building to record temperatures at 15 minute intervals throughout the
evening. This outside logger was placed to allow a comparison of indoor and outdoor
temperatures.
5.7.1. Adaptive thermal comfort surveying
Chapter 4 examined the range of previous studies of thermal comfort that have been
undertaken, and the techniques available for thermal comfort surveying. These studies were
instrumental in the development of a thermal comfort surveying system suitable for this
study. A thermal comfort analysis method and accompanying form was developed to assess
occupants at regular intervals. This form drew from information in Appendix E of the
ASHRAE Standard 55-2004: Thermal Comfort Standards for Human Occupancy
(ASHRAE, 2004), as well as a previous studies into adaptive analysis of thermal comfort,
such as Baker and Standeven (1996), Boestra (2005), de Dear and Brager (2002), de Dear et
al. (1998), Humphreys (1995b), Nicol and Pagliano (2007), Olesen and Brager (2004), Rowe
(1995) and Van Der Linden (2006).
Baker and Standeven (1996) developed adaptive comfort criteria that were suitable for free
running buildings and those not controlled by automated HVAC systems, where conditions
such as temperature are subject to greater variance. Nicol and Pagliano (2007) and Baker and
Standeven (1996) examined how conventional thermal comfort modelling is inappropriate
for buildings with the environmental change of a free running building, and developed
criteria that should be considered when using an adaptive approach to thermal comfort
analysis. In doing so, comfort monitoring surveys were undertaken that provided thermal
information room by room, and made subjective surveys of occupants.
Boestra et al. (2005) and Van Der Linden et al. (2006) assessed and simplified methods of
thermal comfort analysis for design, and developed a new thermal comfort guideline suitable
for the Netherlands. This included the formulation of new methods to predict and analyse
building thermal comfort within an adaptive framework, examining degrees of occupant
control and levels of adaptation by occupants.
In examining thermal comfort in naturally ventilated buildings, de Dear and Brager (2002)
compiled a wide range of raw data from existing field studies in 160 buildings in a range of
climatic zones. Their work examined the potential energy savings of incorporating the
adaptive approach to research and in informing building design and operation.
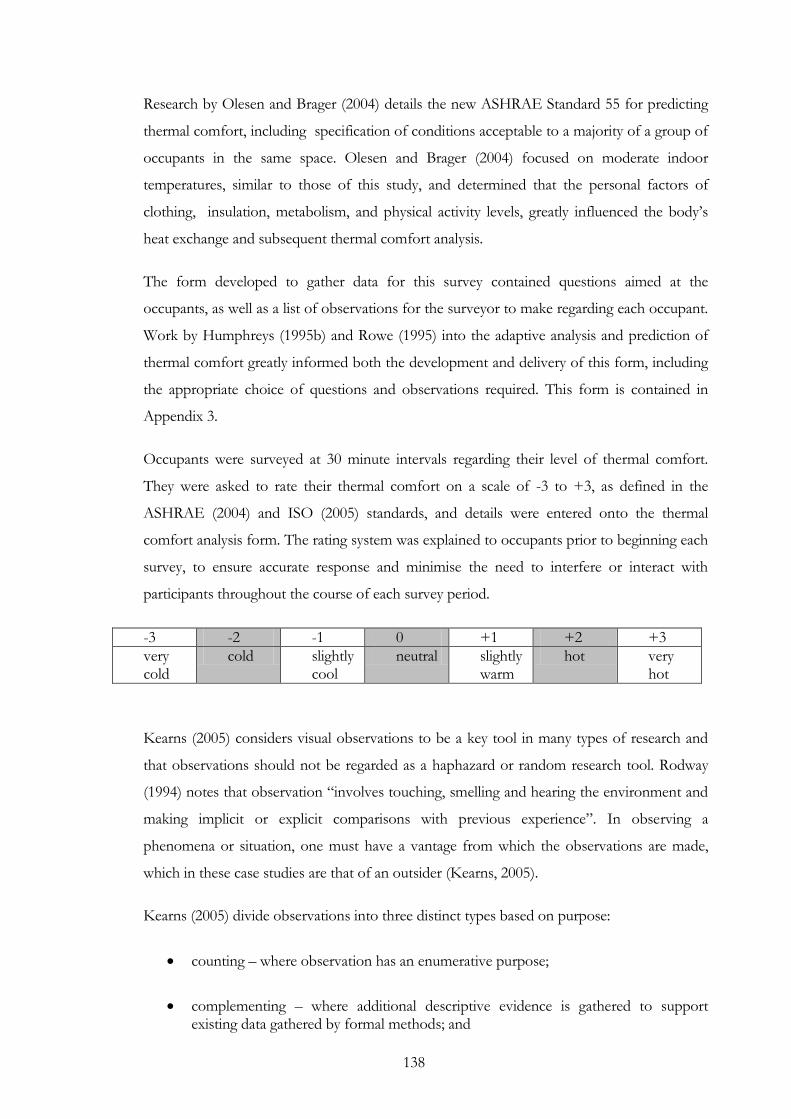
138
Research by Olesen and Brager (2004) details the new ASHRAE Standard 55 for predicting
thermal comfort, including specification of conditions acceptable to a majority of a group of
occupants in the same space. Olesen and Brager (2004) focused on moderate indoor
temperatures, similar to those of this study, and determined that the personal factors of
clothing, insulation, metabolism, and physical activity levels, greatly influenced the body‟s
heat exchange and subsequent thermal comfort analysis.
The form developed to gather data for this survey contained questions aimed at the
occupants, as well as a list of observations for the surveyor to make regarding each occupant.
Work by Humphreys (1995b) and Rowe (1995) into the adaptive analysis and prediction of
thermal comfort greatly informed both the development and delivery of this form, including
the appropriate choice of questions and observations required. This form is contained in
Appendix 3.
Occupants were surveyed at 30 minute intervals regarding their level of thermal comfort.
They were asked to rate their thermal comfort on a scale of -3 to +3, as defined in the
ASHRAE (2004) and ISO (2005) standards, and details were entered onto the thermal
comfort analysis form. The rating system was explained to occupants prior to beginning each
survey, to ensure accurate response and minimise the need to interfere or interact with
participants throughout the course of each survey period.
-3 -2 -1 0 +1 +2 +3
very cold
cold slightly cool
neutral slightly warm
hot very hot
Kearns (2005) considers visual observations to be a key tool in many types of research and
that observations should not be regarded as a haphazard or random research tool. Rodway
(1994) notes that observation “involves touching, smelling and hearing the environment and
making implicit or explicit comparisons with previous experience”. In observing a
phenomena or situation, one must have a vantage from which the observations are made,
which in these case studies are that of an outsider (Kearns, 2005).
Kearns (2005) divide observations into three distinct types based on purpose:
counting – where observation has an enumerative purpose;
complementing – where additional descriptive evidence is gathered to support existing data gathered by formal methods; and
139
contextualising – where in-depth interpretation of a phenomenon is achieved.
The observations made predominantly involved the first two of these study types.
Observational data were gathered to complement data made from surveys and obtained by
the data loggers and building measurements. Likewise, each series of observations was taken
to help understand the thermal processes at a specific time and place for each case study.
Observations were made regarding actions or conditions that would impact on thermal
comfort levels. Previous work by Humphreys (1995b), Rowe (1995) and Humphreys and
Nicol (1998) has indicated that predictions and analyses of thermal comfort can be made by
observing clothing choices, activity levels, and other adaptive mechanisms employed by
subjects.
Occupant clothing levels were recorded to allow a clo rating to be assigned to each, and
changes in clothing levels were recorded. Clo values are a measure of the intrinsic thermal
insulation of a subject, and factor in both clothing and furniture. De Dear et al. (1998) and
Yigit (1999) examined the insulating value of clothing, identify adjustments in clothing as an
indicator of behavioural adaptation and determined that clo values are a good indicator of
occupant behavioural adaptation to thermal environment. De Dear et al. (1998) recorded a
decrease of 0.1 clo units is expected for every temperature increase of 2°C in indoor mean
temperature, while studies by Fanger (Fanger, 1972) indicated a change of over 0.2 clo units
per increase of 2°C in indoor mean temperature.
The effects of metabolism and physical activity on thermal comfort have been documented.
Rowe (1995) identified that as physical activity increases, occupants will favour a lower
temperature. Occupant activity level was also recorded, on a scale ranging from reclining
through to high activity, and notes were made regarding any activities that may have influenced
thermal comfort levels, such as eating, drinking, opening or closing windows, movements
into cooler or warmer areas, and adjusting thermostats. This information facilitated a
quantification of data by allowing an estimation of metabolic rate (met). De Dear et al. (1998)
identify metabolic rate as a behavioral parameter that should be investigated because of its
relationship with indoor temperature in both air conditioned and naturally ventilated
buildings.
5.7.2. Temperature, Humidity and Air Speed Analysis
Olesen and Brager (2004) determined that the environmental parameters of radiant
temperature, air temperature, wind speed, and humidity are crucial in assessing thermal
140
comfort. Chamra et al. (2002) examined thermal comfort at sedentary and moderate activity
levels, and determined that temperature is seven times more important than relative humidity
in thermal comfort sensation in males, and nine times more important in females.
Air temperature and humidity readings were taken in the centre of each room, with multiple
recording locations in larger rooms or open plan areas. These recordings were taken at 15
minute intervals, to allow profiles to be developed for each room, and comparison with
thermal comfort surveys.
Chamra et al. (2002), Parsons (1995) and Rowe (1995) determine that air velocity and
resultant drafts have a profound impact on thermal comfort levels in offsetting increases in
temperature and in reducing comfort in colder temperatures. The ASHRAE (2004) and ISO
(2005) standards both include draft in identifying and predicting thermally comfortable
environments. Where air movements or drafts were noticeable or identified by the subjects
as a cause of thermal discomfort, mean indoor air speed analysis was undertaken to
determine the magnitude of those movements. De Dear et al. (1998) has previously used the
measurement of mean indoor air speeds simultaneous to thermal comfort questionnaires as
an indication of occupant‟s behavioural adjustment to indoor temperatures. De Dear (1998)
indicated that building occupants are likely to create higher air speeds as a means to adapt to
increases in temperatures, and that this is more likely to occur in naturally ventilated buildings
and is much less common an adjustment technique in air conditioned buildings. All spot
measurements of temperature, humidity and wind speed were taken with a Kestrel 3000
Pocket Weather Meter. This device measures air movements of 0.4-40.0ms-1, temperatures of
-45°C to 125°C, and relative humidity of 0% to 100% with negligible calibration drift.
5.7.3. Surface Temperatures
Olesen and Brager (2004) determined that radiant temperature is an important factor in
assessing thermal comfort. Radiant temperatures of the internal surfaces of the building were
taken, including the walls, ceiling and floors of all rooms. These measurements were taken to
allow an analysis of the thermal storage properties of the building and to assess the impact of
surrounding surfaces on the thermal comfort of building occupants. Proximity to surfaces
with temperatures that are particularly different to body temperature or room temperature
can impact on thermal comfort levels. An example of this is the stuffiness experienced by
individuals in a warm room, but who are in close proximity to a cold surface.
141
Surface temperatures were taken using a Raytek infrared thermometer. It featured an infra-
red pointer to allow accurate readings of the same specific point on each wall, ceiling or floor
space.
5.8. Study Limitations
The qualification of thermal mass allows the categorisation of buildings according to levels of
thermal mass (i.e. low, medium, or high), but does not allow for the quantification of
volumes of thermal mass. While this does not prevent the study from addressing the
proposed hypotheses, it does place limitations on how the study can be compared with other
work where thermal mass is quantified, and prevents the investigation of quantitative
relationships between thermal mass and thermal comfort data. As such, quantitative data in
this study is used to support themes drawn out of the qualitative data.
Because of the available equipment for measuring air movements, air velocity data was only
gathered where thermal discomfort is identified by the subjects and noticeable drafts
determined to be a cause of this discomfort. In some instances this may mean that the
impact of air velocity on thermal comfort is understated.
5.9. Ethics Approval
As the study involved the survey of human subjects, prior to the commencement of
contacting study participants, ethics approval was obtained from the Tasmania Social
Sciences Human Research Ethics Committee. This included submission of an application
form detailing the methodology of the study including survey questions, and copies of
information sheets and consent forms for study participants.
At the commencement of each study, participants signed a consent form (see Appendix 4)
and were given an information sheet containing information on the study procedure,
confidentiality, their freedom to withdraw from the study at any time, and contact details for
more information (see Appendix 5).
142
5.10. Pilot Studies
Prior to the execution of the major study, pilot studies were conducted to:
ensure that research questions were worded correctly;
provide appropriate practice in surveying and data measuring; and
ensure that the study would have the greatest probability to attaining suitable results.
The first pilot study focused on the use of technical equipment, including data loggers to take
long term temperature measurements, and the gathering of physical data taken in night-time
studies. The building was a two bedroom, double brick house, with floor boards. The high
levels of thermal mass and excellent insulation made it a good pilot study.
The second pilot study was conducted in a dwelling converted from what was previously a
large barbeque shelter, and had been converted into a house consisting of a main living and
bedroom area, with a small kitchen / laundry / bathroom attached. This building featured a
large amount of glazing on the north western side, and was positioned on a slope leading
down to a stream. This study took the format of a night-time survey, and was a test for the
process of physical data collection, occupant observation, and occupant design.
These pilot studies were conducted prior to gaining ethics approval for the study, and as such
the results are not included in the study results, however they were an important step in
checking the study process and making minor alterations where necessary.
5.11. Conclusion
This chapter has presented the methodology utilised for developing and undertaking a series
of case studies to examine thermal comfort in residential buildings, and the gather
information on the thermal performance of those buildings. The chapter also examined
existing case study techniques for gathering a mix of qualitative and quantitative data; the
administration of pilot studies; and the process of data evaluation. The following Chapter
presents the results of these case studies, and draws themes from each.
143
Chapter 6: Case Study Results
This chapter presents the results of eight case studies conducted on residential dwellings and
their occupants in Hobart from 2006 until 2008. Data are a mix of qualitative and
quantitative, including long term temperature data recorded by data loggers, temperature and
humidity data by room, observations of the behaviour building occupants, and surveying of
the occupants regarding their thermal comfort levels and acclimatisation. At the conclusion
of the presentation of results, themes are drawn from each case study.
6.1. Case Study 1 – A Large Open Plan Home Designed by an
Architect
6.1.1. Introduction
This building sits on the south eastern fringe of Hobart in undulating terrain thick with
native eucalypts. The building is at a latitude of -42.90 and is approximately 250m above sea
level. The slope the building sits on is south facing, however because of the road on the
northern side, it has limited solar access. Because of the slope, the building is subject to
katabatic winds during the evening, but its height above the valley floor means it is not
affected by the pooling of cold air.
Construction of this architect designed building was finished in early 2006, and the study
began five months after it was occupied. During the study period there had been little
landscaping undertaken around the building, and the driveway was only sealed towards the
end of the study period. The building has been zoned in accordance with passive design
principles: with the living spaces located on the northern side; utilities on the southern side;
and the master bedroom on the east to gain morning sun. The building is large, being
approximately 152m2, excluding the garage. There are: three bedrooms; an open planned
central living space and a kitchen area, semi divided by a central wall; two bathrooms; a
laundry; and a workshop that is used as a commercial kitchen, on the south-eastern side.
Figure 6.1.1 presents the layout of the building, including the location of windows, doors,
and wall types.

144
The building is of lightweight timber construction, and is supported by posts in concrete
piers. The flooring, frame and cladding are all timber, and internal walls are plaster board.
The house has no thermal mass. The building is well insulated however, with R3.5 wool batts
in the ceiling, walls and under the polished hardwood floorboards. The northern side has
solar access, with large double-glazed, timber framed windows, with concertina blinds that
are used for privacy. There are long thin windows for privacy on the eastern side, and a small
number of windows on the southern side to capture the view. These windows have an
insulation rating of R0.32-0.34, and the external walls have an insulation value of R1.96
(Hollo, 1995, Todd, 1994b). In addition to heat from insolation, there are a series of electric
panel heaters low down on the walls in most rooms of the building, and a wall mounted
electric heater and air conditioner in the central living space.
The downlights in the majority of rooms, consume between 20 Watts and 50 Watts each.
These also contribute to considerable energy loss, as each down light has a hole in both the
plaster and the insulation. The combined ceiling and roof have an insulation value of R4.5 in
summer and R3.0 in winter (Hollo, 1995). The building is modern: in excellent condition;
well insulated; and is free from unwanted drafts, but the low thermal mass means that it has
little means of storing solar energy except within the airspace of the building.

145
Figure 6.1.1: Case Study 1 - Building Layout

146
The building is occupied by two middle-aged adults and two children. They had lived
in Hobart for 4.5 years prior to the study. Previously they lived in the warmer parts of
Australia, including Adelaide and Sydney, and then Melbourne and Brisbane most
recently. While they previously acclimatised to a warmer environment, living in
Melbourne prior to moving to Hobart, meant that they were likely to be acclimatised to
the cool temperatures of their current location.
The occupants experienced cold days in April 2006 prior to the beginning of the study,
and resorted to using the electric heater, which they set to between 15°C and 20°C.
They noted that they refrained from having the heating system set on a timer as it is
capable of quickly heating the house, which is most probably a result of the well sealed
building envelope and high levels of insulation.
During the winter the occupants shut off bedrooms and peripheral rooms, and focused
on maintaining heat in their central living spaces. The building is occupied the majority
of the time, with at least one resident home for most of each day, and with few days
throughout the year when all residents are away. Sundays are the only time when the
building has any considerable period of time unoccupied.
6.1.2. Data
6.1.2.1. Spring 2006
Spring 2006 featured a very hot day on 12 October, with temperatures peaking around
the time the children arrived home from school and started to leave doors and
windows open. The occupants reported that they used the heating unit on only a small
number or particularly cold nights during this period, which is supported by their low
energy expenditure. Curtains were mostly kept open during this period and windows
were kept shut. While the blinds have little insulating benefit, the windows are double-
glazed, reducing heat loss.
A LogTag data logger was placed in the central living space of the building from 5
September, 2006 until 28 November, 2006, taking air temperature measurements at 15
minute intervals. This data logger recorded indoor temperatures ranging from 10.7°C
to 31.3°C, with an average air temperature of 18.2°C. Maximum temperatures occurred
147
on the afternoon of the 12 October, and minimum temperatures occurred in the early
morning of the 16 October. The house features daily air temperature swings of around
10°C, which is predictable because of its low levels of thermal mass available to
thermoregulate internal temperatures.
The Spring night time study took place on the evening of the 5 September, 2006,
when the two children were absent from the house, running from 5pm until after 9pm
when the occupants went to bed. The data logger recorded temperatures ranging from
17.7°C to 19.3°C (see Figure 6.1.2). Outdoor temperatures were cool, peaking at
16.5°C during the day, dropping to 12°C at 5pm when the study began, and to 8.4°C
by 9pm (see Figure 6.1.3). The building was also subject to south westerly winds up to
32km/h.
Occupant thermal comfort levels ranged between 0 and 1, and a satisfactory level of
thermal comfort was maintained. Occupants spent most of their time in the central
living space. The clothing of the female occupant remained at 0.94clo, the male ranged
from 0.93-0.58clo, and their activity consisted primarily of light activity and reclining.
The central living space was kept warmer and closed off to the peripheral areas, and
ranged between 18.1°C and 20.1°C (see Figure 6.1.4). The lowest temperatures in the
central living space were recorded in the entry area near the front door and stairs to the
west wing of the house, due to cold air coming from these two areas. Peripheral areas
were not heated, and dry bulb temperatures dropped to temperatures of one or two
degrees lower. Despite this small drop in air temperature, wall and ceiling temperatures
dropped. Surface temperatures on the inside of external walls had slightly greater drops
in temperature than on internal walls. The dramatic and rapid changes in surface
temperature indicates that these rooms are not high in thermal mass and are incapable
of storing large amounts of energy. The lack of major change in the air temperature
indicates that the walls, ceiling and floor are well insulated and prevent major heat loss
from the air space.
Dry bulb temperatures in Room F – Workshop, were consistently lower than in other
rooms, and did not exceed 18°C (see Figure 6.1.4). The central living spaces rose
slightly in temperature across the course of the evening, indicating that as the occupant
activity levels decreased and they became more sedentary, they increased heating to
maintain thermal comfort levels.
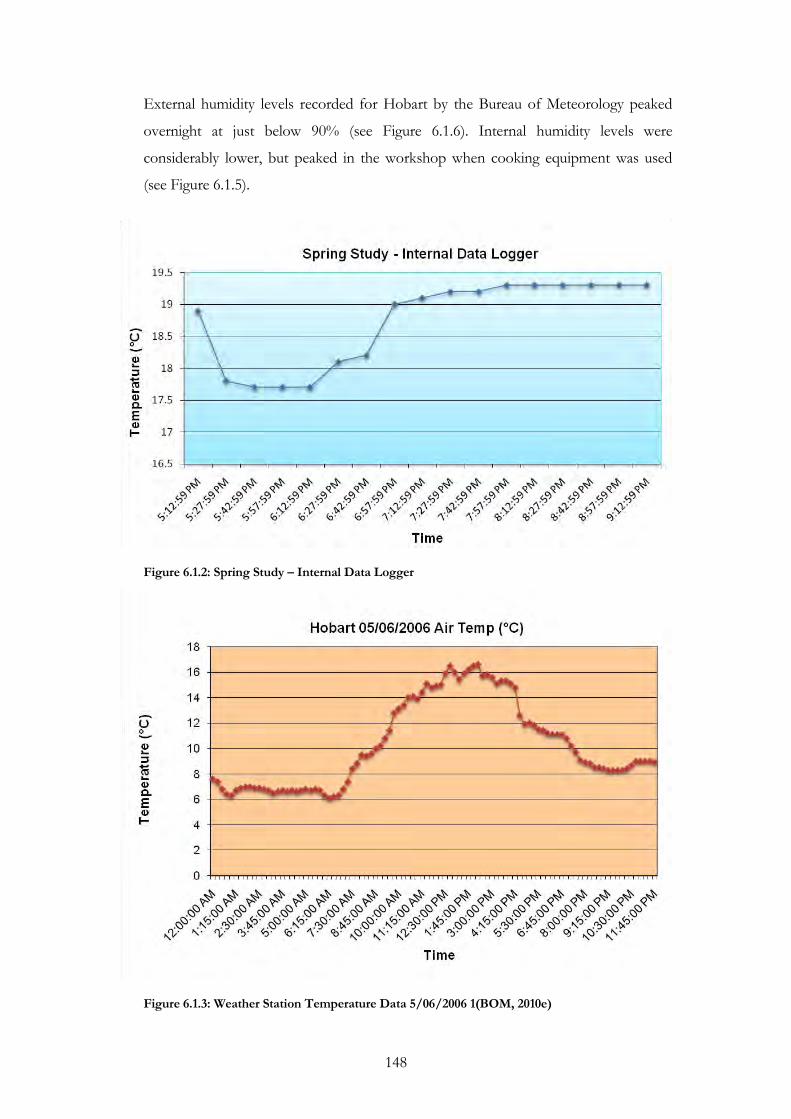
148
External humidity levels recorded for Hobart by the Bureau of Meteorology peaked
overnight at just below 90% (see Figure 6.1.6). Internal humidity levels were
considerably lower, but peaked in the workshop when cooking equipment was used
(see Figure 6.1.5).
Figure 6.1.2: Spring Study – Internal Data Logger
Figure 6.1.3: Weather Station Temperature Data 5/06/2006 1(BOM, 2010e)
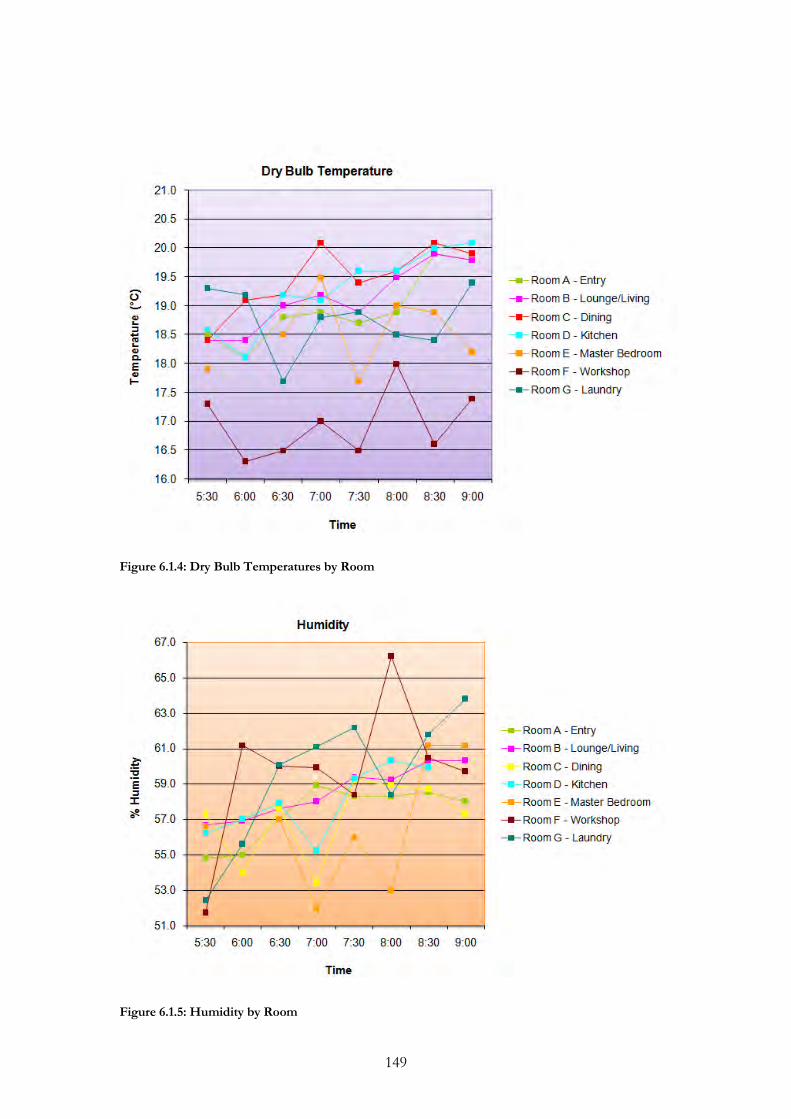
149
Figure 6.1.4: Dry Bulb Temperatures by Room
Figure 6.1.5: Humidity by Room
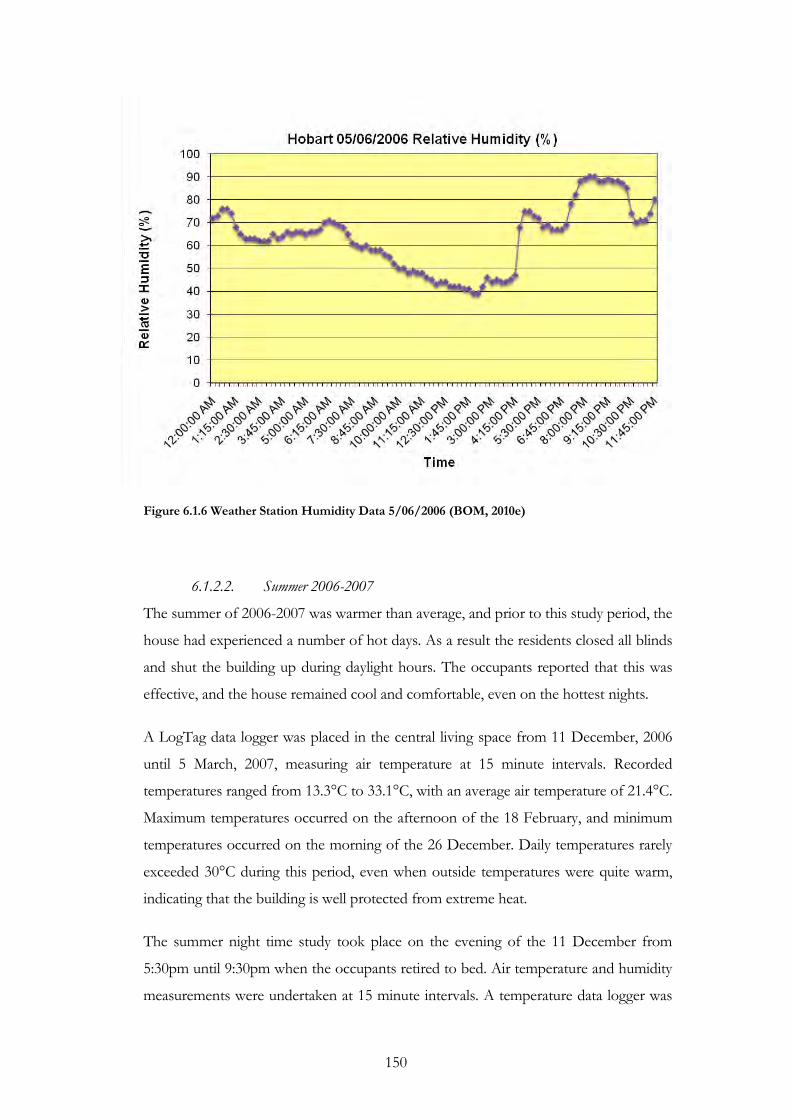
150
Figure 6.1.6 Weather Station Humidity Data 5/06/2006 (BOM, 2010e)
6.1.2.2. Summer 2006-2007
The summer of 2006-2007 was warmer than average, and prior to this study period, the
house had experienced a number of hot days. As a result the residents closed all blinds
and shut the building up during daylight hours. The occupants reported that this was
effective, and the house remained cool and comfortable, even on the hottest nights.
A LogTag data logger was placed in the central living space from 11 December, 2006
until 5 March, 2007, measuring air temperature at 15 minute intervals. Recorded
temperatures ranged from 13.3°C to 33.1°C, with an average air temperature of 21.4°C.
Maximum temperatures occurred on the afternoon of the 18 February, and minimum
temperatures occurred on the morning of the 26 December. Daily temperatures rarely
exceeded 30°C during this period, even when outside temperatures were quite warm,
indicating that the building is well protected from extreme heat.
The summer night time study took place on the evening of the 11 December from
5:30pm until 9:30pm when the occupants retired to bed. Air temperature and humidity
measurements were undertaken at 15 minute intervals. A temperature data logger was
151
also placed in a sheltered position outside the building envelope to record external
temperatures.
Occupants dressed moderately (with clothing insulation values of 0.58clo for the male
and 0.59clo for the female all evening), were either sedentary or undertaking light
activities throughout the evening. They reported generally neutral thermal comfort
levels, with slightly cool but comfortable thermal comfort levels later in the evening.
The small changes in air temperature across this time period coupled with a decrease in
estimated metabolic activity from 1.2met to 0.8met indicates that this thermal
discomfort was due to reductions in activity by occupants, not a decrease in
temperature.
The female experienced uncomfortably cool arms at 7:00pm while wearing a short
sleeved polo top (and a total clothing insulation value of 0.59clo all evening), seated in
an office chair with an estimated metabolic rate of 1.2met. By 7:30pm neutral thermal
comfort levels had been achieved without clothing adjustments, and with a lower
metabolic rate. The consumption of a warm meal is one explanation for this
improvement in thermal comfort level.
Internal air temperatures and surface temperatures both declined steadily over the
evening, indicating that the building can passively cool during evenings to maintain
temperatures appropriate to thermal comfort. Figure 6.1.7 shows a steady decline in
temperature from 24.7°C to 21°C as the internal environment of the building cools.
External temperatures also decreased steadily, dropping sharply from 12.9°C at 5:31pm
to 9.1°C at 9:41pm, then slowly decreasing to 6.2 at 9:51pm (see Figure 6.1.8). Internal
temperatures closely reflected external temperatures, moderated by the building
envelope. The plateaus seen in the external temperatures indicate that the heavy
insulation of the building is effective in reducing steady heat loss to the exterior and
penetration of cold air into the building. External temperatures in Hobart, recorded by
the Bureau of Meteorology recorded a maximum daytime temperature of 19.5°C at
11:30am and again at 12:30pm, and temperatures dropped quickly, reaching 6.5°C at
9:15pm (see Figure 6.1.9). Both sets of external temperatures showed similar patterns
of steady temperature before sudden declines.
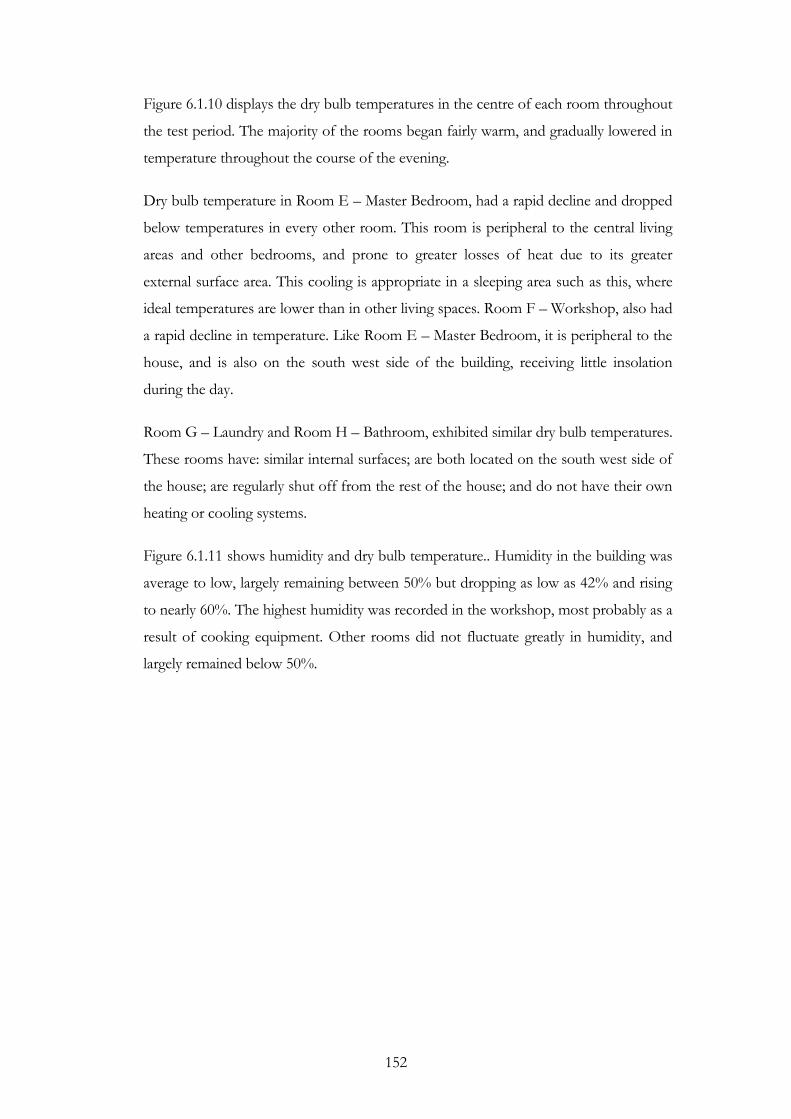
152
Figure 6.1.10 displays the dry bulb temperatures in the centre of each room throughout
the test period. The majority of the rooms began fairly warm, and gradually lowered in
temperature throughout the course of the evening.
Dry bulb temperature in Room E – Master Bedroom, had a rapid decline and dropped
below temperatures in every other room. This room is peripheral to the central living
areas and other bedrooms, and prone to greater losses of heat due to its greater
external surface area. This cooling is appropriate in a sleeping area such as this, where
ideal temperatures are lower than in other living spaces. Room F – Workshop, also had
a rapid decline in temperature. Like Room E – Master Bedroom, it is peripheral to the
house, and is also on the south west side of the building, receiving little insolation
during the day.
Room G – Laundry and Room H – Bathroom, exhibited similar dry bulb temperatures.
These rooms have: similar internal surfaces; are both located on the south west side of
the house; are regularly shut off from the rest of the house; and do not have their own
heating or cooling systems.
Figure 6.1.11 shows humidity and dry bulb temperature.. Humidity in the building was
average to low, largely remaining between 50% but dropping as low as 42% and rising
to nearly 60%. The highest humidity was recorded in the workshop, most probably as a
result of cooking equipment. Other rooms did not fluctuate greatly in humidity, and
largely remained below 50%.
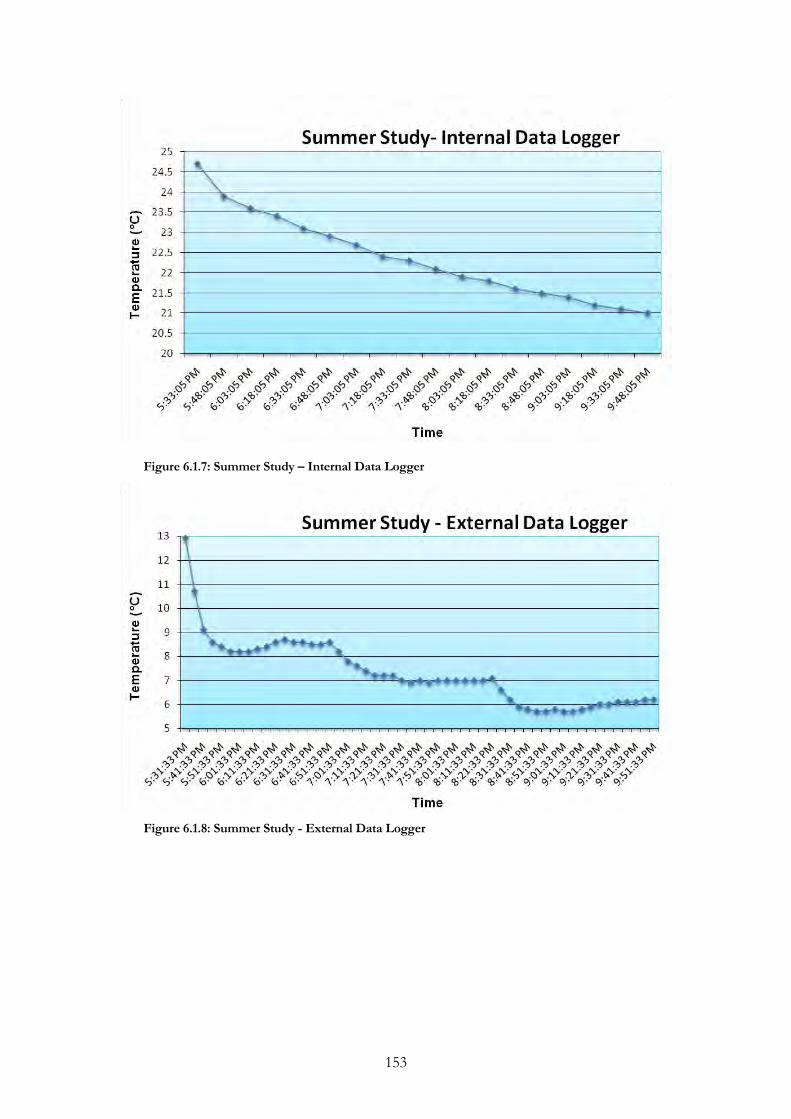
153
Figure 6.1.7: Summer Study – Internal Data Logger
Figure 6.1.8: Summer Study - External Data Logger
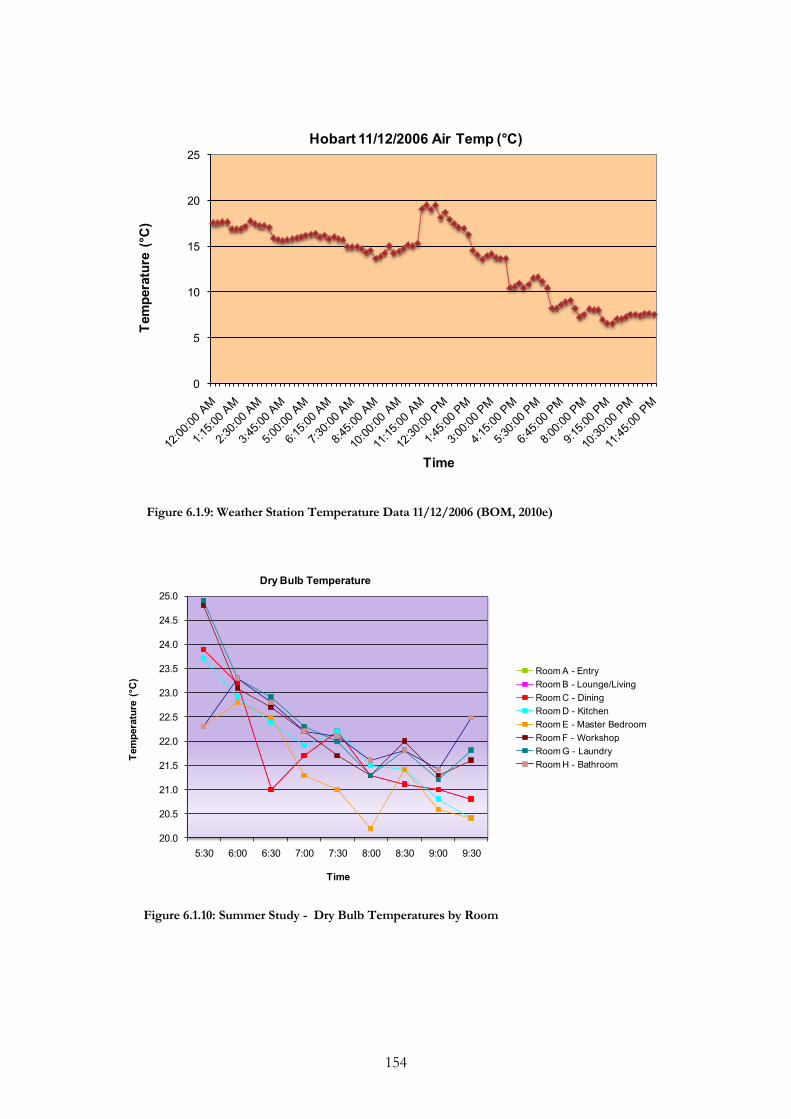
154
0
5
10
15
20
25Te
mpe
ratu
re (
°C)
Time
Hobart 11/12/2006 Air Temp (°C)
Figure 6.1.9: Weather Station Temperature Data 11/12/2006 (BOM, 2010e)
20.0
20.5
21.0
21.5
22.0
22.5
23.0
23.5
24.0
24.5
25.0
5:30 6:00 6:30 7:00 7:30 8:00 8:30 9:00 9:30
Tem
pera
ture
(°C
)
Time
Dry Bulb Temperature
Room A - EntryRoom B - Lounge/LivingRoom C - DiningRoom D - KitchenRoom E - Master BedroomRoom F - WorkshopRoom G - LaundryRoom H - Bathroom
Figure 6.1.10: Summer Study - Dry Bulb Temperatures by Room
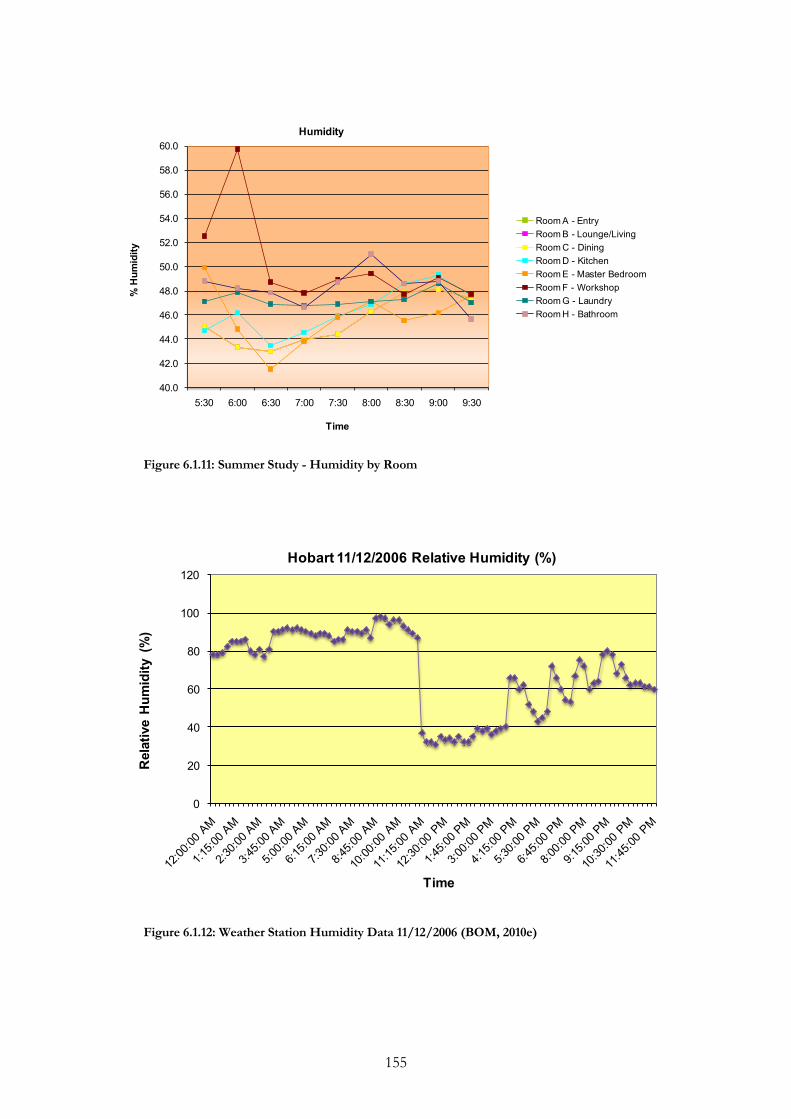
155
40.0
42.0
44.0
46.0
48.0
50.0
52.0
54.0
56.0
58.0
60.0
5:30 6:00 6:30 7:00 7:30 8:00 8:30 9:00 9:30
% H
umid
ity
Time
Humidity
Room A - EntryRoom B - Lounge/LivingRoom C - DiningRoom D - KitchenRoom E - Master BedroomRoom F - WorkshopRoom G - LaundryRoom H - Bathroom
Figure 6.1.11: Summer Study - Humidity by Room
0
20
40
60
80
100
120
Rel
ativ
e H
umid
ity (
%)
Time
Hobart 11/12/2006 Relative Humidity (%)
Figure 6.1.12: Weather Station Humidity Data 11/12/2006 (BOM, 2010e)
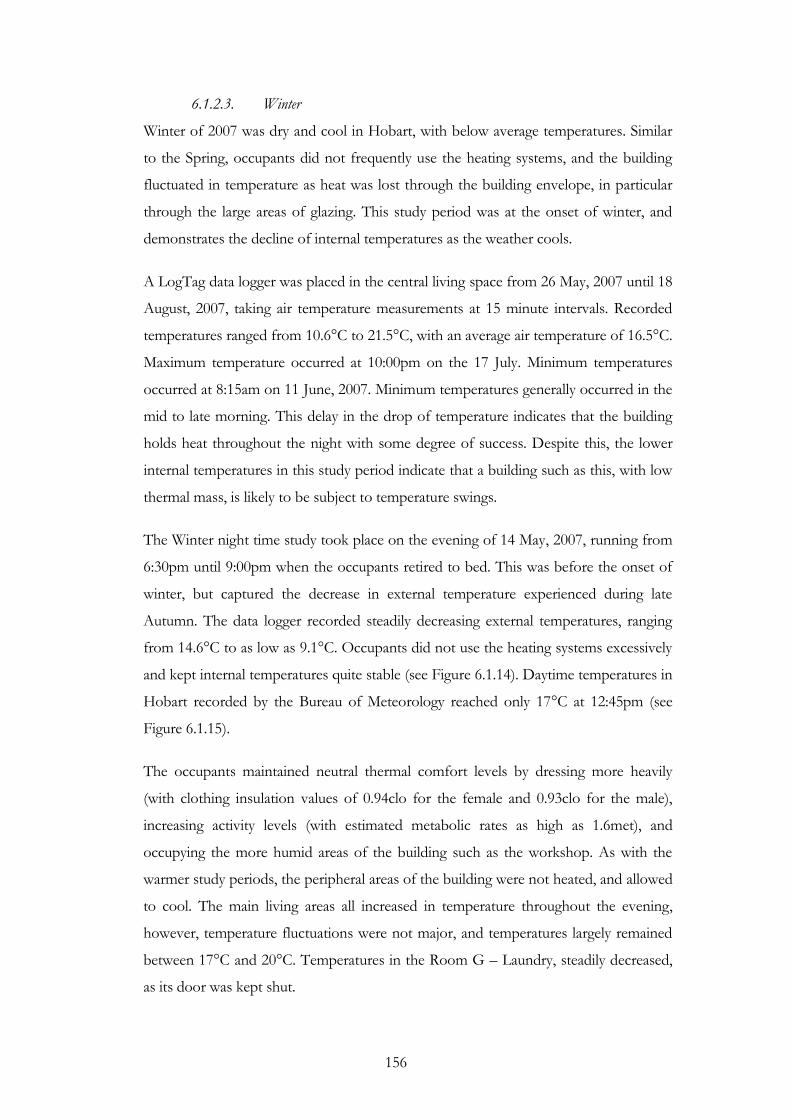
156
6.1.2.3. Winter
Winter of 2007 was dry and cool in Hobart, with below average temperatures. Similar
to the Spring, occupants did not frequently use the heating systems, and the building
fluctuated in temperature as heat was lost through the building envelope, in particular
through the large areas of glazing. This study period was at the onset of winter, and
demonstrates the decline of internal temperatures as the weather cools.
A LogTag data logger was placed in the central living space from 26 May, 2007 until 18
August, 2007, taking air temperature measurements at 15 minute intervals. Recorded
temperatures ranged from 10.6°C to 21.5°C, with an average air temperature of 16.5°C.
Maximum temperature occurred at 10:00pm on the 17 July. Minimum temperatures
occurred at 8:15am on 11 June, 2007. Minimum temperatures generally occurred in the
mid to late morning. This delay in the drop of temperature indicates that the building
holds heat throughout the night with some degree of success. Despite this, the lower
internal temperatures in this study period indicate that a building such as this, with low
thermal mass, is likely to be subject to temperature swings.
The Winter night time study took place on the evening of 14 May, 2007, running from
6:30pm until 9:00pm when the occupants retired to bed. This was before the onset of
winter, but captured the decrease in external temperature experienced during late
Autumn. The data logger recorded steadily decreasing external temperatures, ranging
from 14.6°C to as low as 9.1°C. Occupants did not use the heating systems excessively
and kept internal temperatures quite stable (see Figure 6.1.14). Daytime temperatures in
Hobart recorded by the Bureau of Meteorology reached only 17°C at 12:45pm (see
Figure 6.1.15).
The occupants maintained neutral thermal comfort levels by dressing more heavily
(with clothing insulation values of 0.94clo for the female and 0.93clo for the male),
increasing activity levels (with estimated metabolic rates as high as 1.6met), and
occupying the more humid areas of the building such as the workshop. As with the
warmer study periods, the peripheral areas of the building were not heated, and allowed
to cool. The main living areas all increased in temperature throughout the evening,
however, temperature fluctuations were not major, and temperatures largely remained
between 17°C and 20°C. Temperatures in the Room G – Laundry, steadily decreased,
as its door was kept shut.
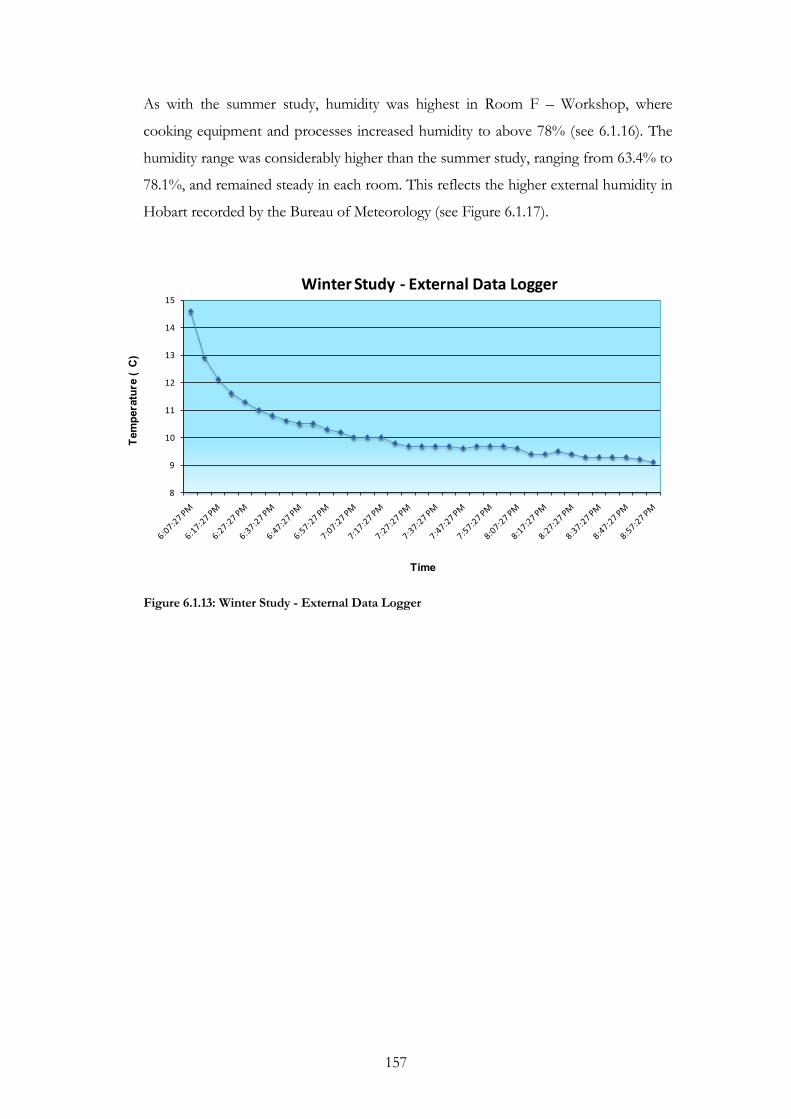
157
As with the summer study, humidity was highest in Room F – Workshop, where
cooking equipment and processes increased humidity to above 78% (see 6.1.16). The
humidity range was considerably higher than the summer study, ranging from 63.4% to
78.1%, and remained steady in each room. This reflects the higher external humidity in
Hobart recorded by the Bureau of Meteorology (see Figure 6.1.17).
8
9
10
11
12
13
14
15
Tem
pera
ture
( C
)
Time
Winter Study - External Data Logger
Figure 6.1.13: Winter Study - External Data Logger
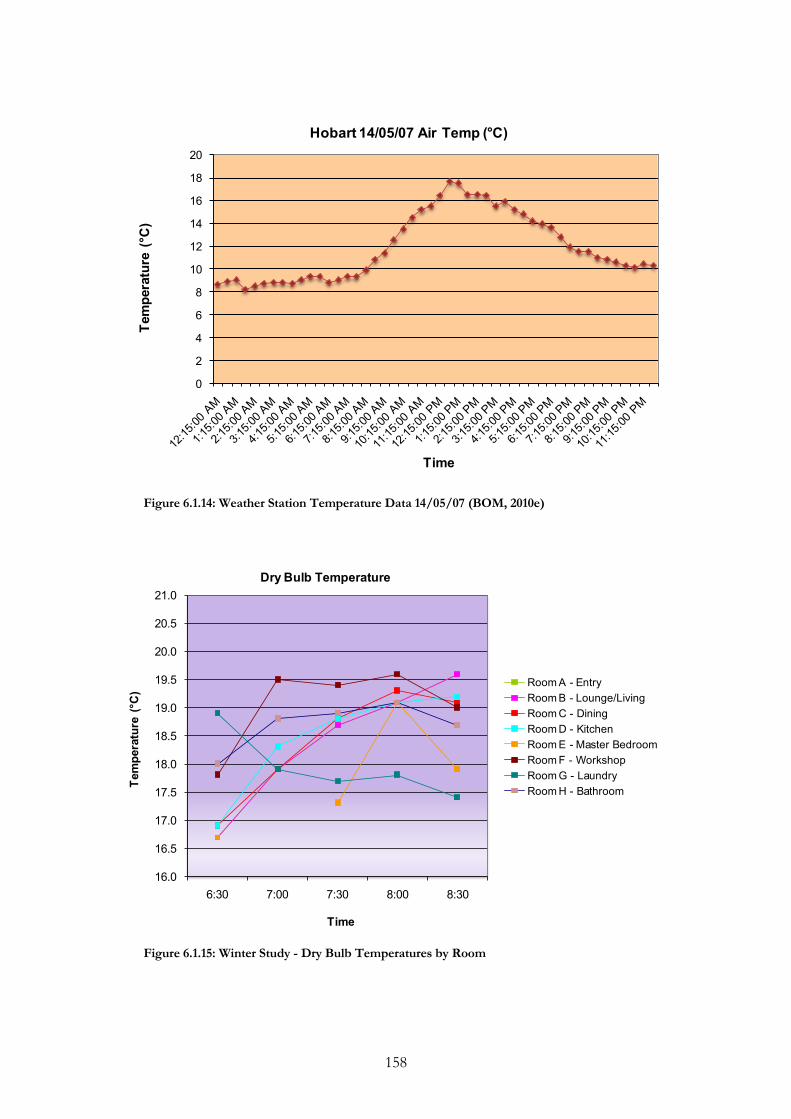
158
0
2
4
6
8
10
12
14
16
18
20Te
mpe
ratu
re (
°C)
Time
Hobart 14/05/07 Air Temp (°C)
Figure 6.1.14: Weather Station Temperature Data 14/05/07 (BOM, 2010e)
16.0
16.5
17.0
17.5
18.0
18.5
19.0
19.5
20.0
20.5
21.0
6:30 7:00 7:30 8:00 8:30
Tem
pera
ture
(°C
)
Time
Dry Bulb Temperature
Room A - EntryRoom B - Lounge/LivingRoom C - DiningRoom D - KitchenRoom E - Master BedroomRoom F - WorkshopRoom G - LaundryRoom H - Bathroom
Figure 6.1.15: Winter Study - Dry Bulb Temperatures by Room
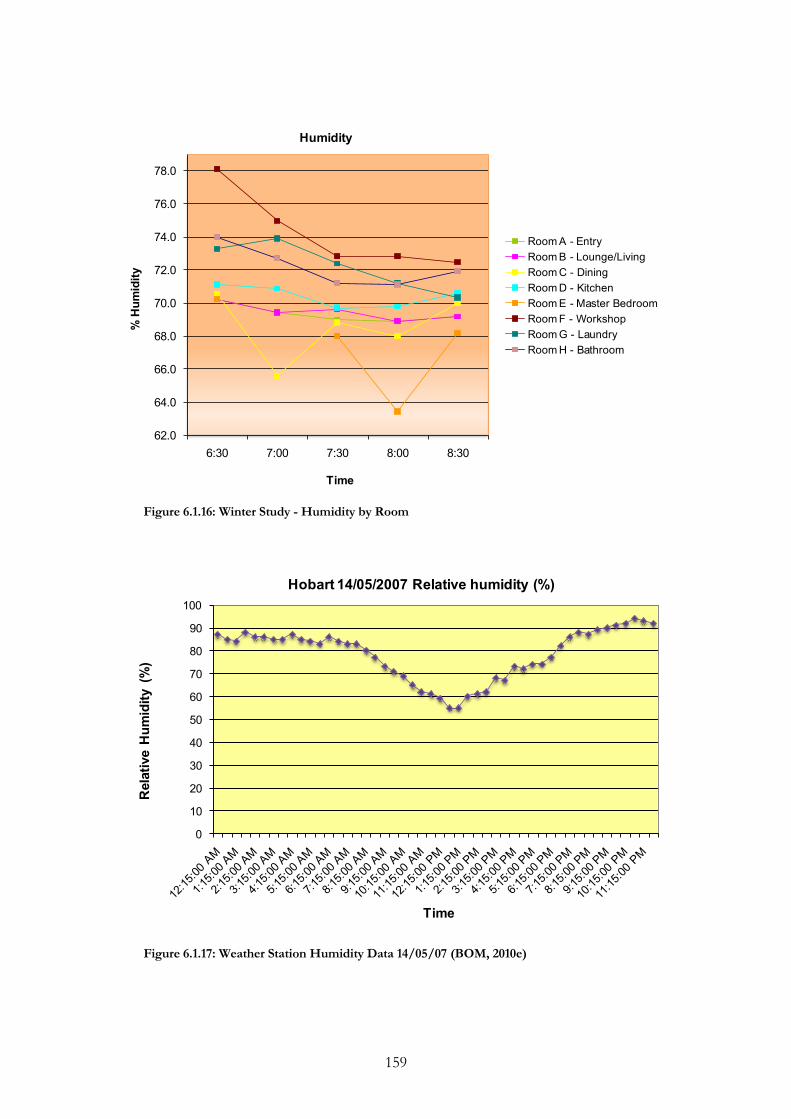
159
62.0
64.0
66.0
68.0
70.0
72.0
74.0
76.0
78.0
6:30 7:00 7:30 8:00 8:30
% H
umid
ity
Time
Humidity
Room A - EntryRoom B - Lounge/LivingRoom C - DiningRoom D - KitchenRoom E - Master BedroomRoom F - WorkshopRoom G - LaundryRoom H - Bathroom
Figure 6.1.16: Winter Study - Humidity by Room
0
10
20
30
40
50
60
70
80
90
100
Rel
ativ
e H
umid
ity (
%)
Time
Hobart 14/05/2007 Relative humidity (%)
Figure 6.1.17: Weather Station Humidity Data 14/05/07 (BOM, 2010e)

160
6.1.3. Overall
The occupants maintain a high level of thermal comfort in their house, and are seldom
uncomfortable. When uncomfortable, it is generally only minor, and the occupants are
more likely to adjust their clothing to increase comfort levels than to alter the
thermostat on the heating and air conditioning unit.
6.1.4. Themes
Low thermal mass buildings heat faster and can provide high levels of control
for occupants who have irregular schedules. Internal air temperatures fluctuate
considerably, but the building doesn‟t face severe slumps or peaks until outside
temperatures are extreme because of its insulation. Closing up the building
during periods of extreme temperature is a suitable way of minimising large
temperature swings, but the home generally requires artificial heating when
temperatures outside are cooler.
Peripheral areas of the building should be closed up and the focus should be
on keeping the central living area warm. Sleep areas do not need as much heat
as the central living areas.
Lightweight buildings can be suitable living environments in warm
temperatures, particularly if properly shaded from the sun.
Occupant activity, metabolic rate, and food consumption greatly influence
thermal comfort levels. As occupant activity levels decrease and they become
more sedentary, temperatures required to maintain thermal comfort increase.

161
6.2. Case Study 2 – A Medium Sized Weatherboard Cottage
6.2.1. Introduction
The building sits in the hills to the north east of Hobart on the lower side of a north
facing slope. Despite this northern aspect, a hill to the north reduces daytime insolation
levels in winter. The slope and proximity to the lowest point between two hills means
the building is also subject to mild katabatic winds and cold air drainage. The building
is approximately 50m above sea level and has a latitude of -42.88.
This National Trust registered building is a timber framed, weatherboard clad cottage
with corrugated iron sheet roof. There has been a modern addition on the northern
side that was completed in 1988, and the older part of the building has a small
downstairs area below. The building is medium sized, being approximately 105m2 on
the upstairs section alone. The building is appropriately zoned, with living spaces on
the northern side, and bedrooms and utilities to the south. The northern side features
large double-glazed windows and sliding doors that improve insolation into the
building envelope. The kitchen dining area opens through an archway into the living
area, and can be separated from the rest of the building by doors. A hallway bisects the
older part of the building, and contains a stairway down to the rooms below. Figure
6.2.1 presents the layout of the building, including the location of windows, doors, and
wall types.
Because of its lightweight timber construction and sheet roof, the building has very
little thermal mass. Fireplaces in Room B – Lounge/Living and between Room E –
Study and Room F – Bedroom are a source of thermal mass, but are not exposed to
insolation. Only the fireplace in Room B – Lounge/Living is used for burning wood as
a heat source. Ceilings are insulated with fiberglass batts (R4.1 in summer and R4.5 in
winter); external walls in the 1988 extension have fiberglass batts (R1.96); but external
walls in the old section are not (R1.46). Small windows utilise blinds, however large
glazed areas are heavily curtained but have no pelmets (R1.16). The floors of rooms in
the older section of the building have a thin carpet covering (R0.47), and Room C –
Hallway and Room F - Bedroom have polished floorboards (R0.10). Room A –
Kitchen/Dining has a cork board floor covering (R0.24). In addition to the fireplace in

162
Room B – Lounge/Living, Room A – Kitchen/Dining features a heat pump mounted
on the east wall, which is a primary source of active heating for the building.
Figure 6.2.1: Case Study 2 - Building Layout
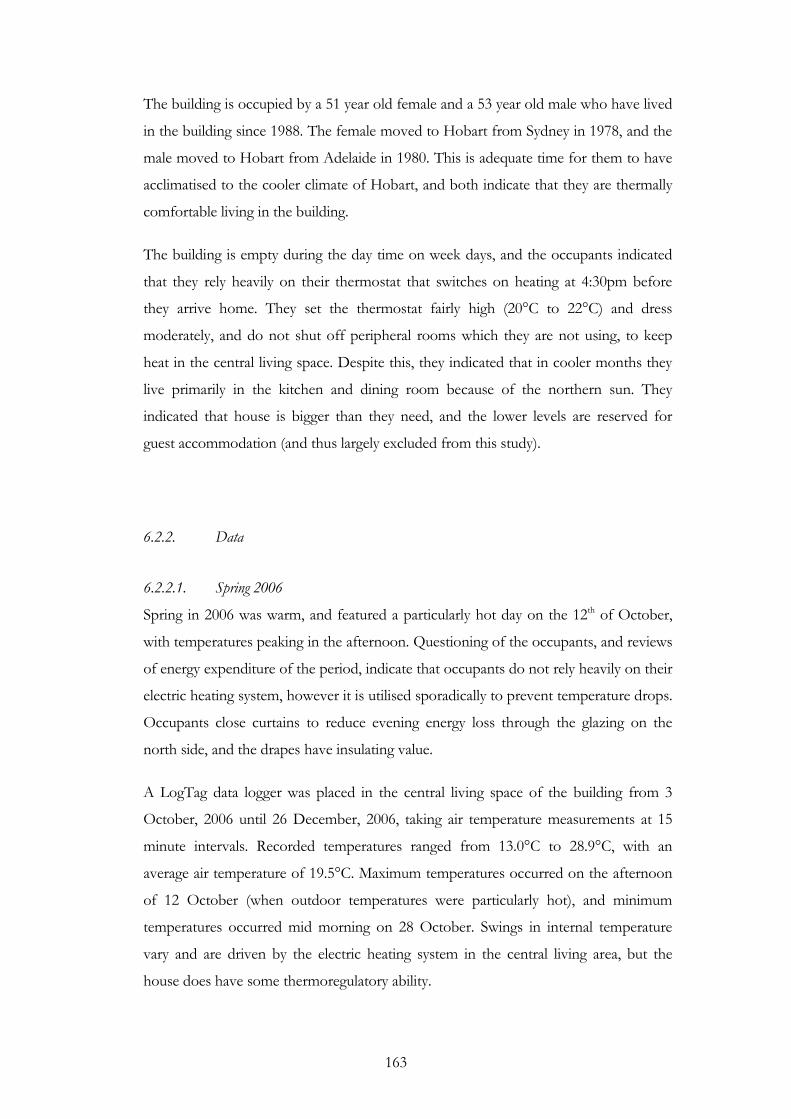
163
The building is occupied by a 51 year old female and a 53 year old male who have lived
in the building since 1988. The female moved to Hobart from Sydney in 1978, and the
male moved to Hobart from Adelaide in 1980. This is adequate time for them to have
acclimatised to the cooler climate of Hobart, and both indicate that they are thermally
comfortable living in the building.
The building is empty during the day time on week days, and the occupants indicated
that they rely heavily on their thermostat that switches on heating at 4:30pm before
they arrive home. They set the thermostat fairly high (20°C to 22°C) and dress
moderately, and do not shut off peripheral rooms which they are not using, to keep
heat in the central living space. Despite this, they indicated that in cooler months they
live primarily in the kitchen and dining room because of the northern sun. They
indicated that house is bigger than they need, and the lower levels are reserved for
guest accommodation (and thus largely excluded from this study).
6.2.2. Data
6.2.2.1. Spring 2006
Spring in 2006 was warm, and featured a particularly hot day on the 12th of October,
with temperatures peaking in the afternoon. Questioning of the occupants, and reviews
of energy expenditure of the period, indicate that occupants do not rely heavily on their
electric heating system, however it is utilised sporadically to prevent temperature drops.
Occupants close curtains to reduce evening energy loss through the glazing on the
north side, and the drapes have insulating value.
A LogTag data logger was placed in the central living space of the building from 3
October, 2006 until 26 December, 2006, taking air temperature measurements at 15
minute intervals. Recorded temperatures ranged from 13.0°C to 28.9°C, with an
average air temperature of 19.5°C. Maximum temperatures occurred on the afternoon
of 12 October (when outdoor temperatures were particularly hot), and minimum
temperatures occurred mid morning on 28 October. Swings in internal temperature
vary and are driven by the electric heating system in the central living area, but the
house does have some thermoregulatory ability.

164
The Spring night time study of this house took place on the evening of 3 October,
running from 7:00pm until 10:00pm when the occupants went to bed. The internal
data logger recorded steady but slightly declining temperatures ranging from 23.6°C to
21.8°C (see Figure 6.2.2). Outdoor temperatures recorded by an external data logger
began at 15°C and steadily dropped to 7°C by 10:00pm (see Figure 6.2.3). Data
obtained from the Bureau of Meteorology showed that daytime temperature peaked at
1:30pm at 16.4°C, and dropped to 8.3°C at 6:00am (see Figure 6.2.5).
Occupant thermal comfort levels ranged between 0 and 1, and a high level of thermal
comfort was maintained. Occupants spent most of the evening in the central living
space. The male occupant kept a constant clo value of 0.66, while the female occupant
had a higher clo value of 0.73 and raised it throughout the evening as temperatures
cooled, adding an extra jumper to raise to 1.01clo at 8:30pm, and raising to 1.21clo at
9:00pm by sitting in an armchair.
Activity was largely confined to the central living area, which receives the greatest
amount of daytime insolation. The building maintained similar temperatures between
rooms, and dry bulb temperatures stayed between 21°C and 24.8°C throughout the
building. Internal wall surfaces were cooler than air temperatures, which is consistent
with walls of low thermal mass. Floor temperatures in the Room B - Lounge/Living
room were higher than wall and air temperatures, despite the low thermal mass of the
floor boards. Concurrently floor temperatures in Room A – Kitchen/Dining did not
feature higher temperatures, as this area of the building is raised and does not feature
lower storey.
Internal humidity levels were considerably lower, with Room F - Bedroom on the
south side of the building having the highest recorded humidity of 53.9%. Rooms not
directly affected by the electric heating system, such as Room D – Bathroom, and
Room E - Study also featured higher humidity readings, peaking at 52.0% and 50.6%
respectively (see Figure 6.2.6). External humidity levels recorded for Hobart by the
Bureau of Meteorology rose to 91% overnight (see Figure 6.2.7).
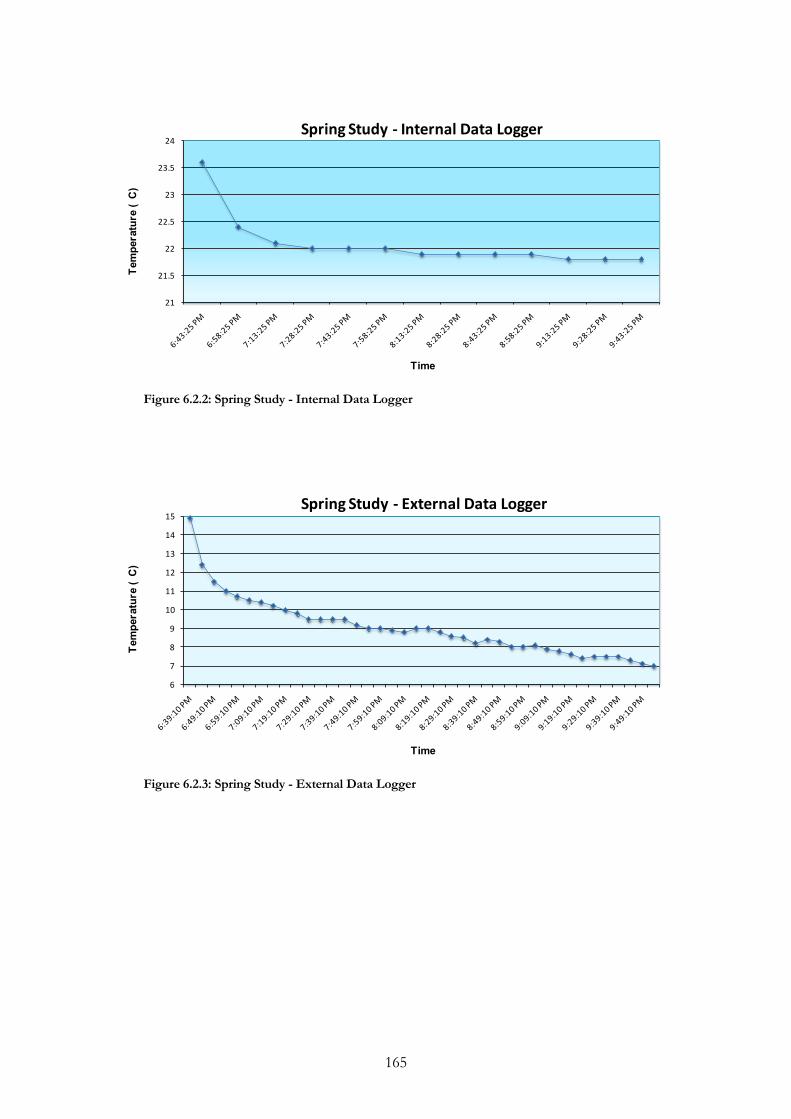
165
21
21.5
22
22.5
23
23.5
24Te
mpe
ratu
re (
C)
Time
Spring Study - Internal Data Logger
Figure 6.2.2: Spring Study - Internal Data Logger
6
7
8
9
10
11
12
13
14
15
Tem
pera
ture
( C
)
Time
Spring Study - External Data Logger
Figure 6.2.3: Spring Study - External Data Logger
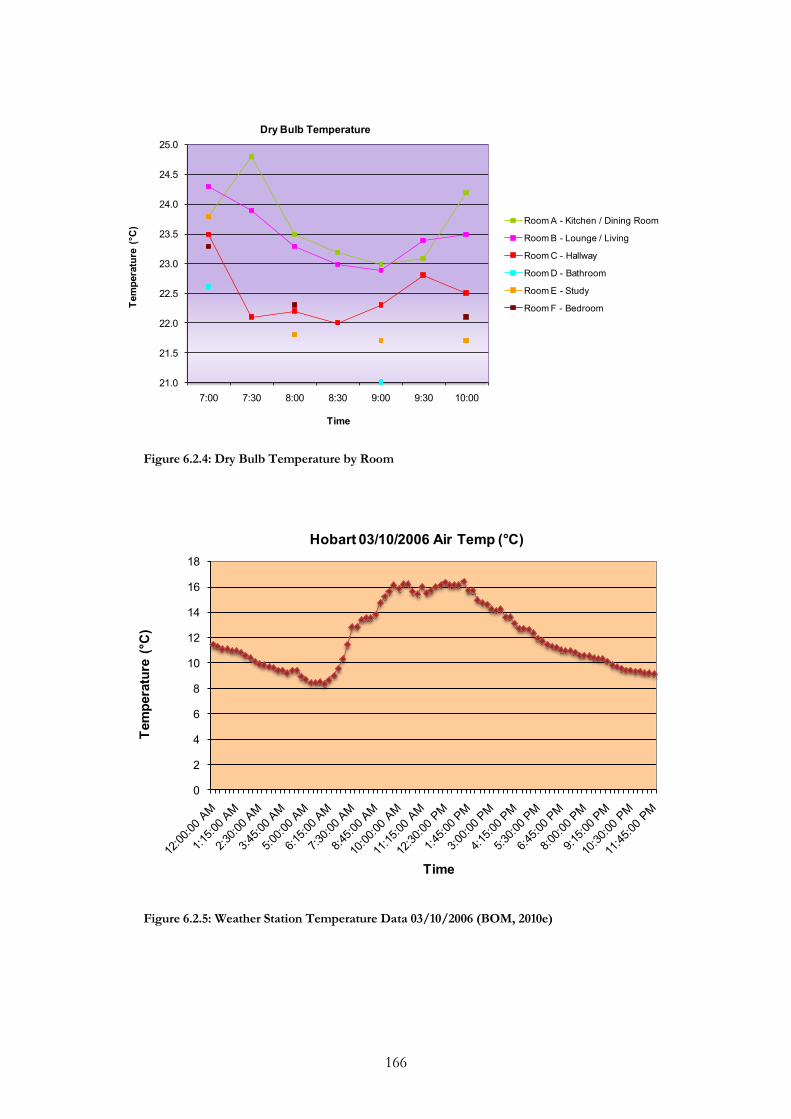
166
21.0
21.5
22.0
22.5
23.0
23.5
24.0
24.5
25.0
7:00 7:30 8:00 8:30 9:00 9:30 10:00
Tem
pera
ture
(°C
)
Time
Dry Bulb Temperature
Room A - Kitchen / Dining Room
Room B - Lounge / Living
Room C - Hallway
Room D - Bathroom
Room E - Study
Room F - Bedroom
Figure 6.2.4: Dry Bulb Temperature by Room
0
2
4
6
8
10
12
14
16
18
Tem
pera
ture
(°C
)
Time
Hobart 03/10/2006 Air Temp (°C)
Figure 6.2.5: Weather Station Temperature Data 03/10/2006 (BOM, 2010e)

167
41.0
43.0
45.0
47.0
49.0
51.0
53.0
55.0
7:00 7:30 8:00 8:30 9:00 9:30 10:00
% H
umid
ity
Time
Humidity
Room A - Kitchen / Dining Room
Room B - Lounge / Living
Room C - Hallway
Room D - Bathroom
Room E - Study
Room F - Bedroom
Figure 6.2.6: Humidity by Room
0
10
20
30
40
50
60
70
80
90
100
Rel
ativ
e H
umid
ity (
%)
Time
Hobart 03/10/2006 Relative Humidity (%)
Figure 6.2.7: Weather Station Humidity Data 03/10/2006 (BOM, 2010e)
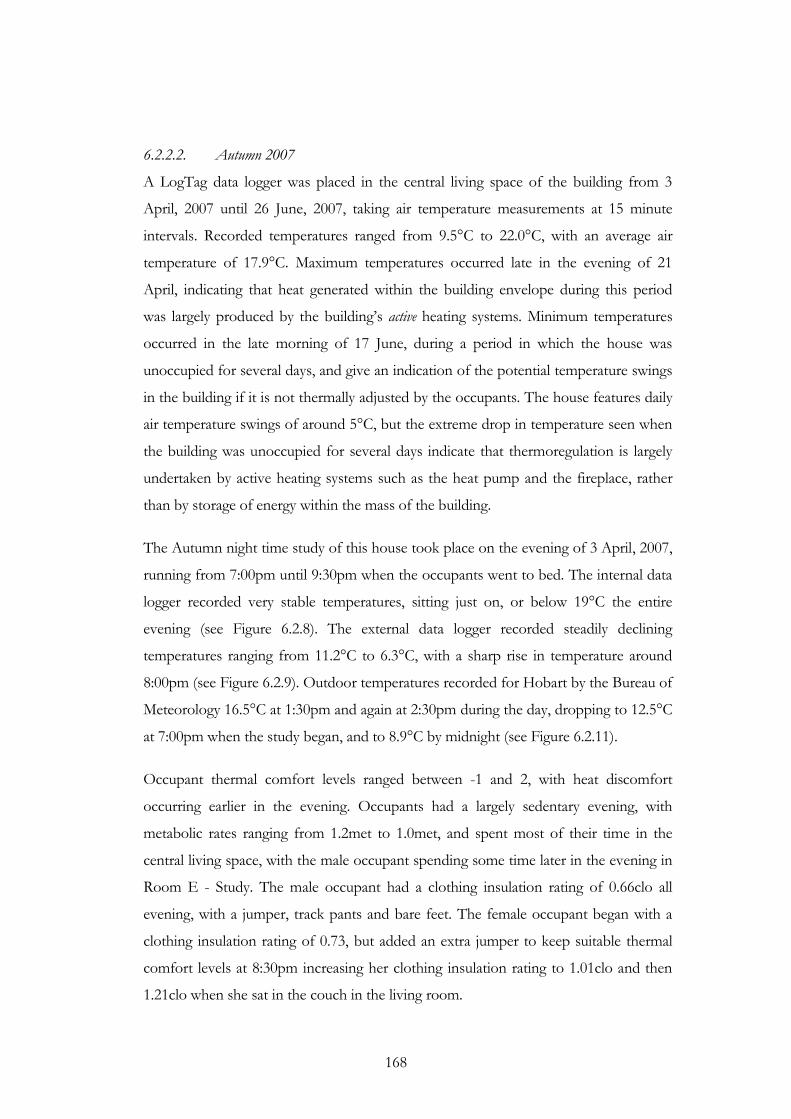
168
6.2.2.2. Autumn 2007
A LogTag data logger was placed in the central living space of the building from 3
April, 2007 until 26 June, 2007, taking air temperature measurements at 15 minute
intervals. Recorded temperatures ranged from 9.5°C to 22.0°C, with an average air
temperature of 17.9°C. Maximum temperatures occurred late in the evening of 21
April, indicating that heat generated within the building envelope during this period
was largely produced by the building‟s active heating systems. Minimum temperatures
occurred in the late morning of 17 June, during a period in which the house was
unoccupied for several days, and give an indication of the potential temperature swings
in the building if it is not thermally adjusted by the occupants. The house features daily
air temperature swings of around 5°C, but the extreme drop in temperature seen when
the building was unoccupied for several days indicate that thermoregulation is largely
undertaken by active heating systems such as the heat pump and the fireplace, rather
than by storage of energy within the mass of the building.
The Autumn night time study of this house took place on the evening of 3 April, 2007,
running from 7:00pm until 9:30pm when the occupants went to bed. The internal data
logger recorded very stable temperatures, sitting just on, or below 19°C the entire
evening (see Figure 6.2.8). The external data logger recorded steadily declining
temperatures ranging from 11.2°C to 6.3°C, with a sharp rise in temperature around
8:00pm (see Figure 6.2.9). Outdoor temperatures recorded for Hobart by the Bureau of
Meteorology 16.5°C at 1:30pm and again at 2:30pm during the day, dropping to 12.5°C
at 7:00pm when the study began, and to 8.9°C by midnight (see Figure 6.2.11).
Occupant thermal comfort levels ranged between -1 and 2, with heat discomfort
occurring earlier in the evening. Occupants had a largely sedentary evening, with
metabolic rates ranging from 1.2met to 1.0met, and spent most of their time in the
central living space, with the male occupant spending some time later in the evening in
Room E - Study. The male occupant had a clothing insulation rating of 0.66clo all
evening, with a jumper, track pants and bare feet. The female occupant began with a
clothing insulation rating of 0.73, but added an extra jumper to keep suitable thermal
comfort levels at 8:30pm increasing her clothing insulation rating to 1.01clo and then
1.21clo when she sat in the couch in the living room.

169
The central living space consisting of Room A – Kitchen/Dining and Room B –
Lounge/Living had notably warmer temperatures than other rooms, as the fireplace
and electric heat pump are located in these rooms, and they receive the greatest amount
of daytime insolation (see Figure 6.2.10).
Dry bulb temperatures in Room B – Lounge/Living were identifiably higher than wall
temperatures, indicating that the while the air heats, the walls do not have suitable
thermal mass in which to store the heat produced by the fireplace.
Humidity data recorded by for Hobart by the Bureau of Meteorology indicated that
diurnal swings in humidity were 33%, with late morning humidity reaching 77% but
dropping to 44% during the middle of the day, before climbing again in the evening
(see Figure 6.2.13). Internal humidity readings did not reach the highs recorded
externally, with only Room D – Bathroom and Room F – Bedroom getting above 50%
throughout the evening (see Figure 6.2.12).
18
18.5
19
19.5
20
20.5
21
Tem
pera
ture
( C
)
Time
Autumn Study - Internal Data Logger
Figure 6.2.8: Autumn Study - Internal Data Logger
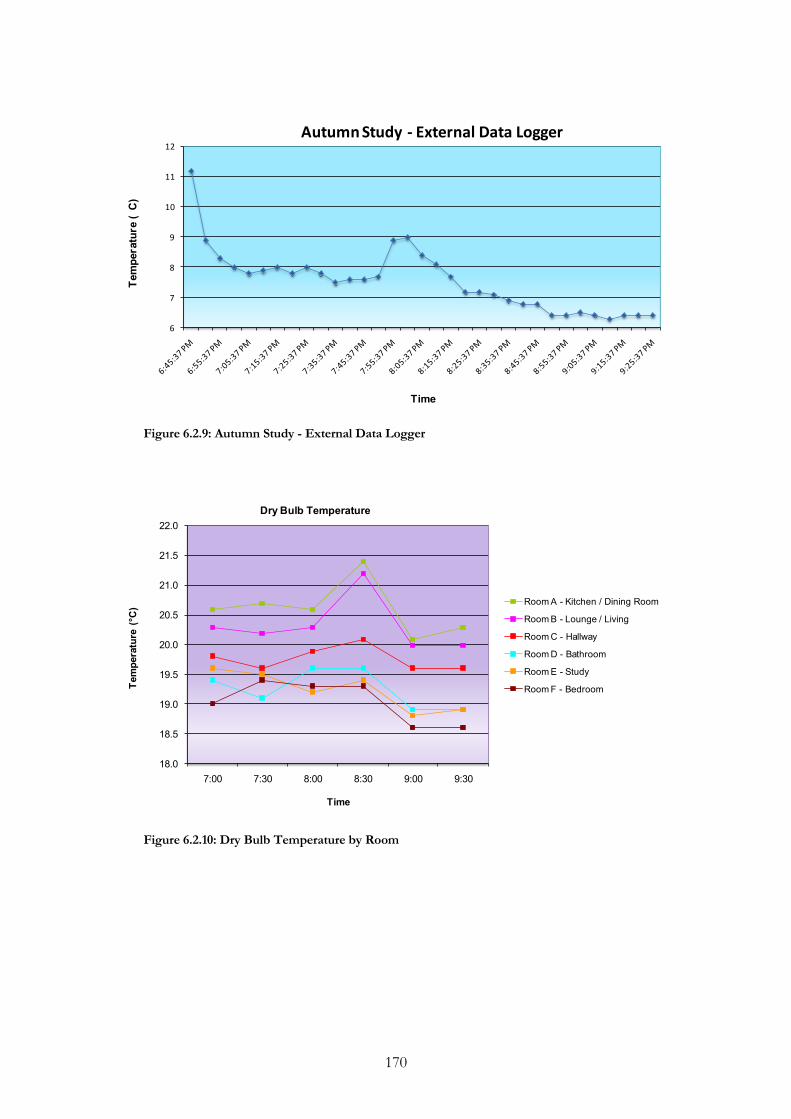
170
6
7
8
9
10
11
12
Tem
pera
ture
( C
)
Time
Autumn Study - External Data Logger
Figure 6.2.9: Autumn Study - External Data Logger
18.0
18.5
19.0
19.5
20.0
20.5
21.0
21.5
22.0
7:00 7:30 8:00 8:30 9:00 9:30
Tem
pera
ture
(°C
)
Time
Dry Bulb Temperature
Room A - Kitchen / Dining Room
Room B - Lounge / Living
Room C - Hallway
Room D - Bathroom
Room E - Study
Room F - Bedroom
Figure 6.2.10: Dry Bulb Temperature by Room

171
Hobart 03/04/10 Air Temp (°C)
0
2
4
6
8
10
12
14
16
18
12:00
:00 AM
1:15:0
0 AM
2:30:0
0 AM
3:45:0
0 AM
5:00:0
0 AM
6:15:0
0 AM
7:30:0
0 AM
8:45:0
0 AM
10:00
:00 AM
11:15
:00 AM
12:30
:00 PM
1:45:0
0 PM
3:00:0
0 PM
4:15:0
0 PM
5:30:0
0 PM
6:45:0
0 PM
8:00:0
0 PM
9:15:0
0 PM
10:30
:00 PM
11:45
:00 PM
Time
Tem
pera
ture
(°C)
Figure 6.2.11: Weather Station Temperature Data 03/04/2010 (BOM, 2010e)
41.0
43.0
45.0
47.0
49.0
51.0
53.0
55.0
57.0
7:00 7:30 8:00 8:30 9:00 9:30
% H
umid
ity
Time
Humidity
Room A - Kitchen / Dining Room
Room B - Lounge / Living
Room C - Hallway
Room D - Bathroom
Room E - Study
Room F - Bedroom
Figure 6.2.12: Humidity by Room

172
0
10
20
30
40
50
60
70
80
90R
elat
ive
Hum
idity
(%
)
Title
Hobart 03/04/07 Relative Humidity (%)
Figure 6.2.13: Weather Station Humidity 03/04/2007 (BOM, 2010e)
6.2.2.3. Winters 2006 and 2007
A LogTag data logger was placed in the central living space of the building from 3 July,
2006 until 26 August, 2006, taking air temperature measurements at 15 minute
intervals. Recorded temperatures ranged from 9.1°C to 21.0°C, with an average air
temperature of 16.7°C. Maximum temperatures occurred late in the evening of 9 July,
and minimum temperatures occurred in the late morning of 23 July when the house
had not been occupied for several days. The house features daily air temperature
swings of around 5°C, but when unoccupied will drop to much lower temperatures.
When occupied the house dropped to a minimum of 13.0°C overnight.
A night time study was not undertaken until the following winter. The Winter night
time study of this house took place on the evening of 2 August, 2007, running from
7:00pm until 9:30pm when the occupants went to bed. Outdoor temperatures recorded
for Hobart by the Bureau of Meteorology remained around 16°C during the middle of
the day, peaking at 16.4 °C at 1:30pm before steadily dropping to 10.9°C, when the
study began at 7:00pm, and below 10°C by 9:30pm (see Figure 6.2.17). The external
data logger recorded steady temperatures ranging from 5.2°C to 17.5°C, with an

173
average temperature of 6.8°C (see Figure 6.2.15). The internal data logger recorded
steadily rising temperatures between 17.3°C and 18.1°C, with an average of 18.1°C (see
Figure 6.2.16).
Occupant thermal comfort levels ranged between -1 and 2, and varied across the
evening. When warm comfort levels of 2 were experienced by the female occupant she
reported it to be very comfortable. These thermal comfort levels were experienced
shortly after the consumption of hot food and alcohol. Occupants spent most of their
time in the central living space.
The female occupant increased clothing levels throughout the evening, beginning at
0.73clo and increasing to improve thermal comfort levels until clothing insulation was
1.21clo. The male occupant achieved similar levels of thermal comfort without an
increase in clothing insulation, which remained at 0.72clo the whole evening.
Humidity data recorded by for Hobart by the Bureau of Meteorology indicated that
humidity largely sat between 60% and 80%, decreasing throughout the day, with a
temporary increase at 9:00pm, with late morning humidity reaching 77% (see Figure
6.2.19). Internal humidity readings were considerably lower, ranging from a lowest of
41.4% in the Room B – Lounge/Living at 8:30pm to a highest point of 59.0% in
Room A – Kitchen/Dining. The use of the wood fire in Room B – Lounge/Living
would account for the dryer air, particularly later in the evening, and corresponding
with warm thermal comfort levels of both occupants. The high humidity in Room A –
Kitchen/Dining can be attributed to the use of the stove for food preparation.

174
17
17.2
17.4
17.6
17.8
18
18.2
18.4
18.6
18.8
19Te
mpe
ratu
re (
C)
Time
Winter Study - Internal Data Logger
Figure 6.2.14: Winter Study - Internal Data Logger
5
5.5
6
6.5
7
7.5
8
8.5
9
9.5
Tem
pera
ture
( C
)
Time
Winter Study - External Data Logger
Figure 6.2.15: Winter Study - External Data Logger

175
16.0
16.5
17.0
17.5
18.0
18.5
19.0
19.5
20.0
20.5
21.0
7:00 7:30 8:00 8:30 9:00 9:30
Tem
pera
ture
(°C
)
Time
Dry Bulb Temperature
Room A - Kitchen / Dining Room
Room B - Lounge / Living
Room C - Hallway
Room D - Bathroom
Room E - Study
Room F - Bedroom
Figure 6.2.16: Dry Bulb Temperature by Room
0
2
4
6
8
10
12
14
Tem
pera
ture
(°C
)
Time
Hobart 02/08/07 Air Temp (°C)
Figure 6.2.17: Weather Station Temperature Data 02/08/2007 (BOM, 2010e)
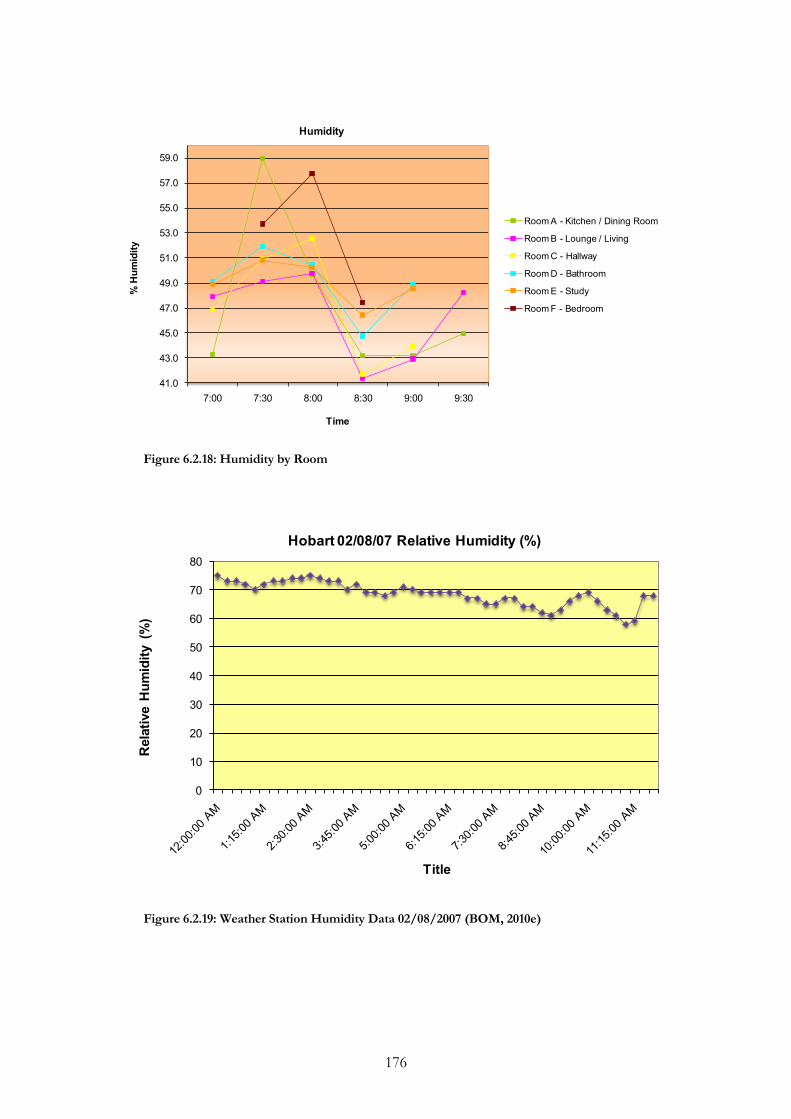
176
41.0
43.0
45.0
47.0
49.0
51.0
53.0
55.0
57.0
59.0
7:00 7:30 8:00 8:30 9:00 9:30
% H
umid
ity
Time
Humidity
Room A - Kitchen / Dining Room
Room B - Lounge / Living
Room C - Hallway
Room D - Bathroom
Room E - Study
Room F - Bedroom
Figure 6.2.18: Humidity by Room
0
10
20
30
40
50
60
70
80
Rel
ativ
e H
umid
ity (
%)
Title
Hobart 02/08/07 Relative Humidity (%)
Figure 6.2.19: Weather Station Humidity Data 02/08/2007 (BOM, 2010e)
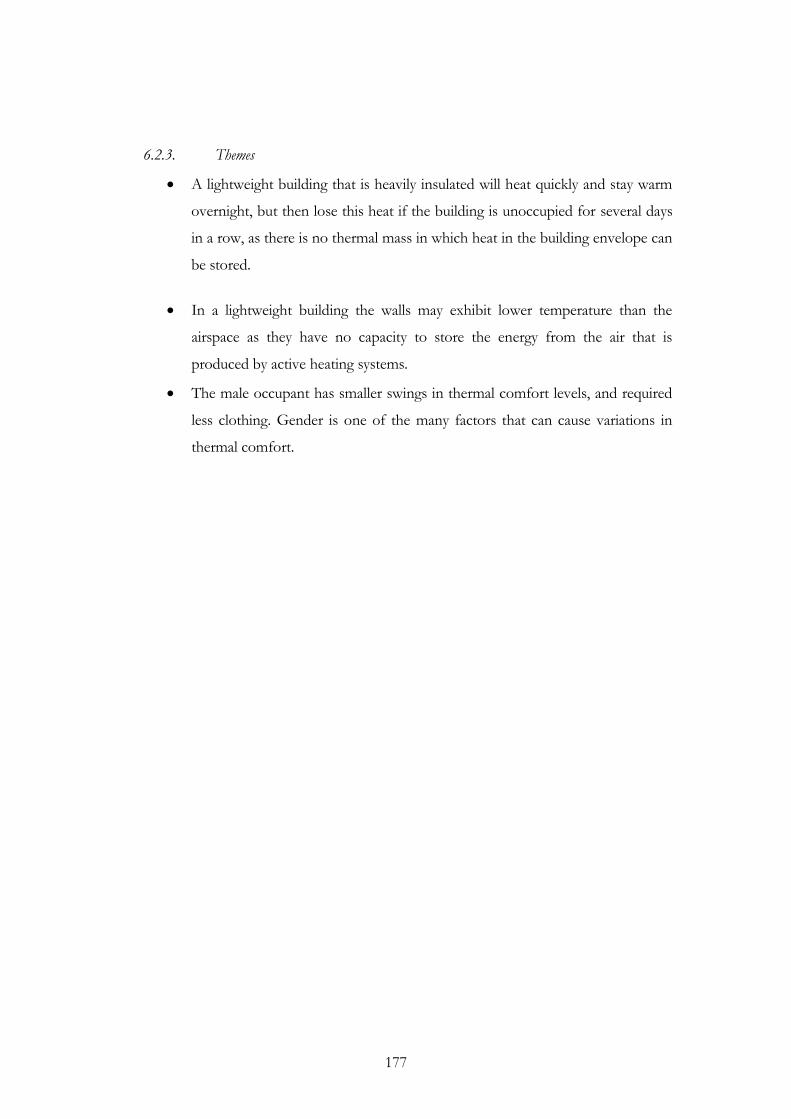
177
6.2.3. Themes
A lightweight building that is heavily insulated will heat quickly and stay warm
overnight, but then lose this heat if the building is unoccupied for several days
in a row, as there is no thermal mass in which heat in the building envelope can
be stored.
In a lightweight building the walls may exhibit lower temperature than the
airspace as they have no capacity to store the energy from the air that is
produced by active heating systems.
The male occupant has smaller swings in thermal comfort levels, and required
less clothing. Gender is one of the many factors that can cause variations in
thermal comfort.

178
6.3. Case Study 3 – A Medium Sized Two Storey Double Brick
Home
6.3.1. Introduction
The building sits in the elevated areas at the northern fringe of Hobart, in a low density
suburban area. The building has a latitude of -42.88 and is approximately 100m above
sea level. Despite its elevation, the building sits on a flat site, with suitable northern
aspect and access to insolation.
The building is a 1960s double brick, with white external bricks, a brick interior, and
floorboard underfoot. The building is medium sized, with a lower floor that is
approximately 100m2. The lower floor of the building is appropriately zoned, with
living spaces and large areas of glazing on the northern side, however there are a
number of windows on the southern side (see Figure 6.3.1). Room B – Dining/Living,
Room C – Kitchen, and Room E – Bedroom all have eastern aspect, and utilities like
the toilet and Room G – Bathroom are located on the western side of the building.
The upstairs features two bedrooms that were excluded from the scope of the study.
The external double brick walls have a total insulation value of R0.48. Windows are
single glazed and aluminium framed, with wooden pelmets and medium weight
curtains that flow to the floor where possible, giving them an insulation rating of R.37.
The large area of glazing in Room A – Lounge/Living is double-glazed, with no
curtains, and an insulation value of R0.32. While the roof has insulation batts, there is
no insulation between storeys, and heat from living areas is lost to the upper floors.
The double brick increases the thermal mass of the building; however this thermal
mass is not exposed to insolation inside the building envelope and the floors are
wooden and carpeted.
The building features an electric central heating system that is at least two decades old,
and frequently did not function during the study period. Smaller radiators are utilised
where necessary to improve thermal comfort levels.
The building is occupied by two adults and a teenager. They have lived in the current
address for 20 years, and prior to that lived in inner urban Hobart, and have had
appropriate time to acclimatise to the local climate. They indicated that they find the
building to be thermally comfortable, and set the thermostat in the northwest corner of
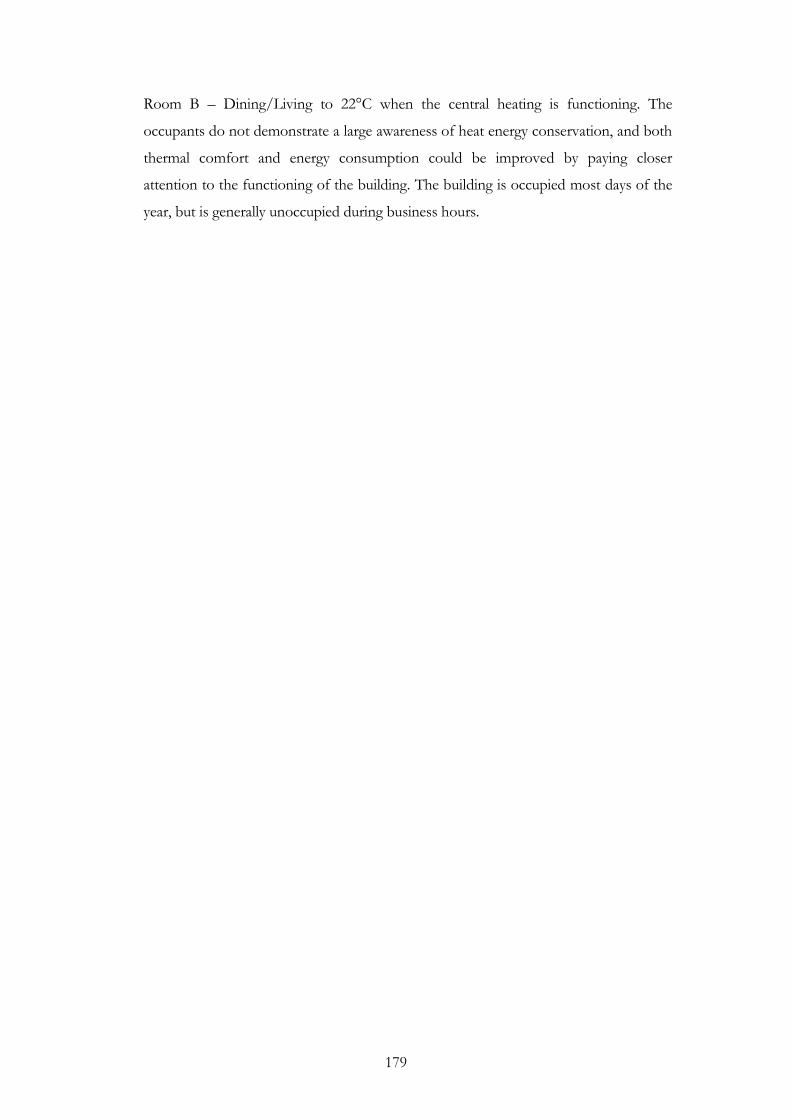
179
Room B – Dining/Living to 22°C when the central heating is functioning. The
occupants do not demonstrate a large awareness of heat energy conservation, and both
thermal comfort and energy consumption could be improved by paying closer
attention to the functioning of the building. The building is occupied most days of the
year, but is generally unoccupied during business hours.

180
Figure 6.3.1 Case Study 3 - Building Layout
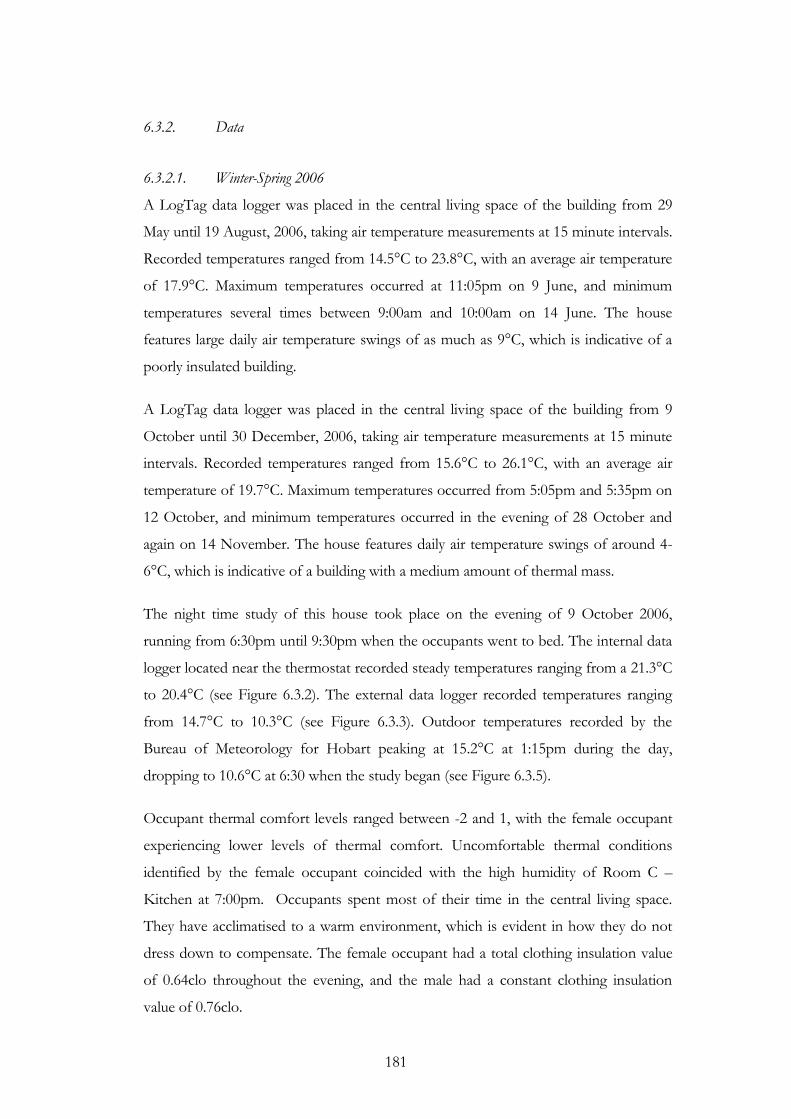
181
6.3.2. Data
6.3.2.1. Winter-Spring 2006
A LogTag data logger was placed in the central living space of the building from 29
May until 19 August, 2006, taking air temperature measurements at 15 minute intervals.
Recorded temperatures ranged from 14.5°C to 23.8°C, with an average air temperature
of 17.9°C. Maximum temperatures occurred at 11:05pm on 9 June, and minimum
temperatures several times between 9:00am and 10:00am on 14 June. The house
features large daily air temperature swings of as much as 9°C, which is indicative of a
poorly insulated building.
A LogTag data logger was placed in the central living space of the building from 9
October until 30 December, 2006, taking air temperature measurements at 15 minute
intervals. Recorded temperatures ranged from 15.6°C to 26.1°C, with an average air
temperature of 19.7°C. Maximum temperatures occurred from 5:05pm and 5:35pm on
12 October, and minimum temperatures occurred in the evening of 28 October and
again on 14 November. The house features daily air temperature swings of around 4-
6°C, which is indicative of a building with a medium amount of thermal mass.
The night time study of this house took place on the evening of 9 October 2006,
running from 6:30pm until 9:30pm when the occupants went to bed. The internal data
logger located near the thermostat recorded steady temperatures ranging from a 21.3°C
to 20.4°C (see Figure 6.3.2). The external data logger recorded temperatures ranging
from 14.7°C to 10.3°C (see Figure 6.3.3). Outdoor temperatures recorded by the
Bureau of Meteorology for Hobart peaking at 15.2°C at 1:15pm during the day,
dropping to 10.6°C at 6:30 when the study began (see Figure 6.3.5).
Occupant thermal comfort levels ranged between -2 and 1, with the female occupant
experiencing lower levels of thermal comfort. Uncomfortable thermal conditions
identified by the female occupant coincided with the high humidity of Room C –
Kitchen at 7:00pm. Occupants spent most of their time in the central living space.
They have acclimatised to a warm environment, which is evident in how they do not
dress down to compensate. The female occupant had a total clothing insulation value
of 0.64clo throughout the evening, and the male had a constant clothing insulation
value of 0.76clo.
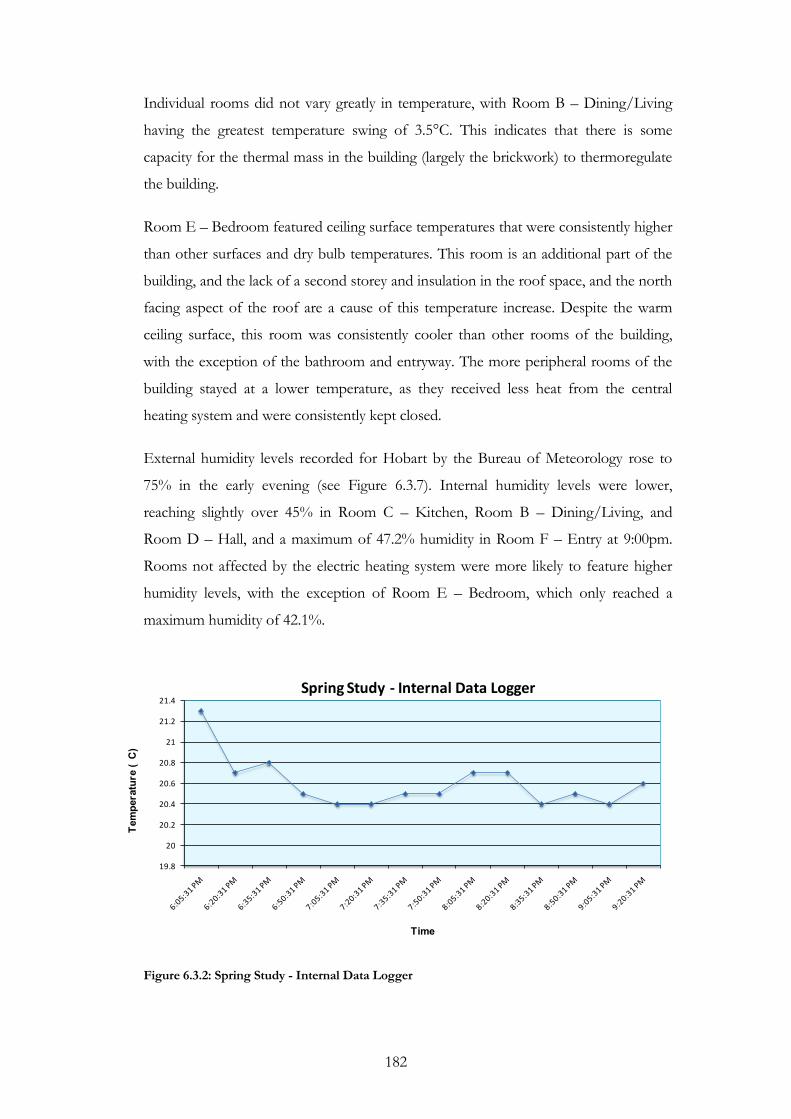
182
Individual rooms did not vary greatly in temperature, with Room B – Dining/Living
having the greatest temperature swing of 3.5°C. This indicates that there is some
capacity for the thermal mass in the building (largely the brickwork) to thermoregulate
the building.
Room E – Bedroom featured ceiling surface temperatures that were consistently higher
than other surfaces and dry bulb temperatures. This room is an additional part of the
building, and the lack of a second storey and insulation in the roof space, and the north
facing aspect of the roof are a cause of this temperature increase. Despite the warm
ceiling surface, this room was consistently cooler than other rooms of the building,
with the exception of the bathroom and entryway. The more peripheral rooms of the
building stayed at a lower temperature, as they received less heat from the central
heating system and were consistently kept closed.
External humidity levels recorded for Hobart by the Bureau of Meteorology rose to
75% in the early evening (see Figure 6.3.7). Internal humidity levels were lower,
reaching slightly over 45% in Room C – Kitchen, Room B – Dining/Living, and
Room D – Hall, and a maximum of 47.2% humidity in Room F – Entry at 9:00pm.
Rooms not affected by the electric heating system were more likely to feature higher
humidity levels, with the exception of Room E – Bedroom, which only reached a
maximum humidity of 42.1%.
19.8
20
20.2
20.4
20.6
20.8
21
21.2
21.4
Tem
pera
ture
( C
)
Time
Spring Study - Internal Data Logger
Figure 6.3.2: Spring Study - Internal Data Logger
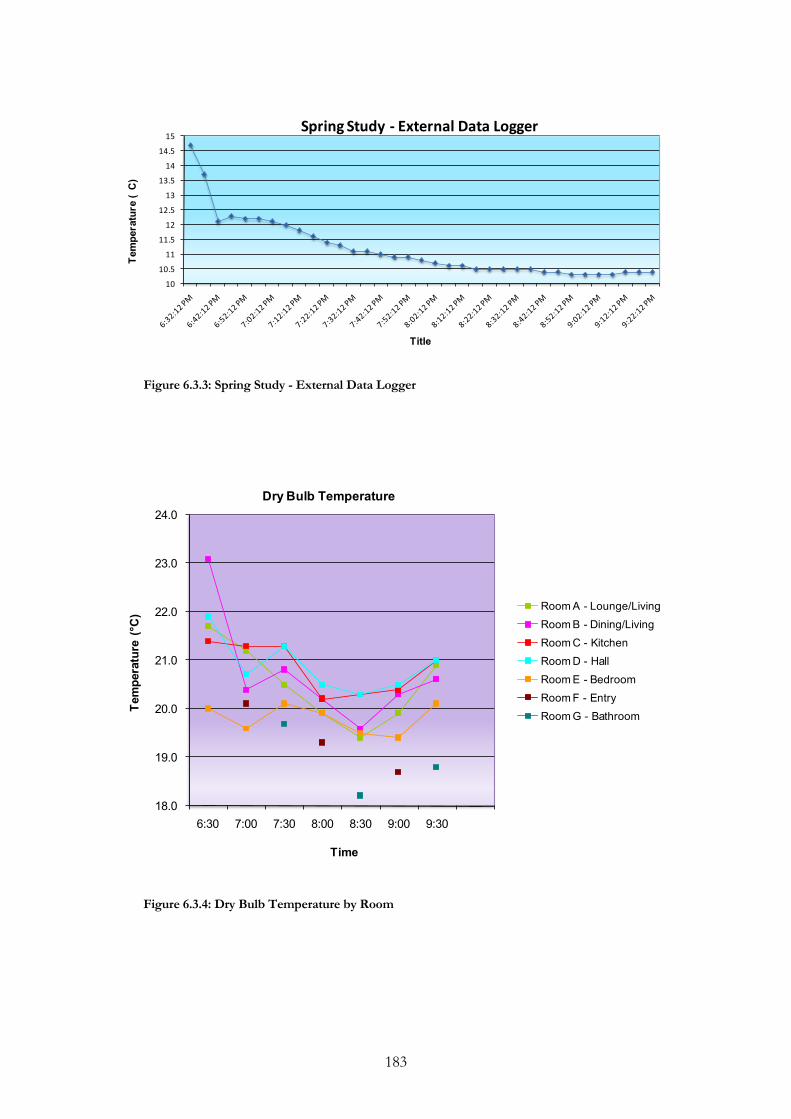
183
10
10.5
11
11.5
12
12.5
13
13.5
14
14.5
15Te
mpe
ratu
re (
C)
Title
Spring Study - External Data Logger
Figure 6.3.3: Spring Study - External Data Logger
18.0
19.0
20.0
21.0
22.0
23.0
24.0
6:30 7:00 7:30 8:00 8:30 9:00 9:30
Tem
pera
ture
(°C
)
Time
Dry Bulb Temperature
Room A - Lounge/LivingRoom B - Dining/LivingRoom C - KitchenRoom D - HallRoom E - BedroomRoom F - EntryRoom G - Bathroom
Figure 6.3.4: Dry Bulb Temperature by Room

184
0
2
4
6
8
10
12
14
16Te
mpe
ratu
re (
°C)
Time
Hobart 09/10/2006 Air Temp (°C)
Figure 6.3.5: Weather Station Temperature Data 09/10/2006 (BOM, 2010e)
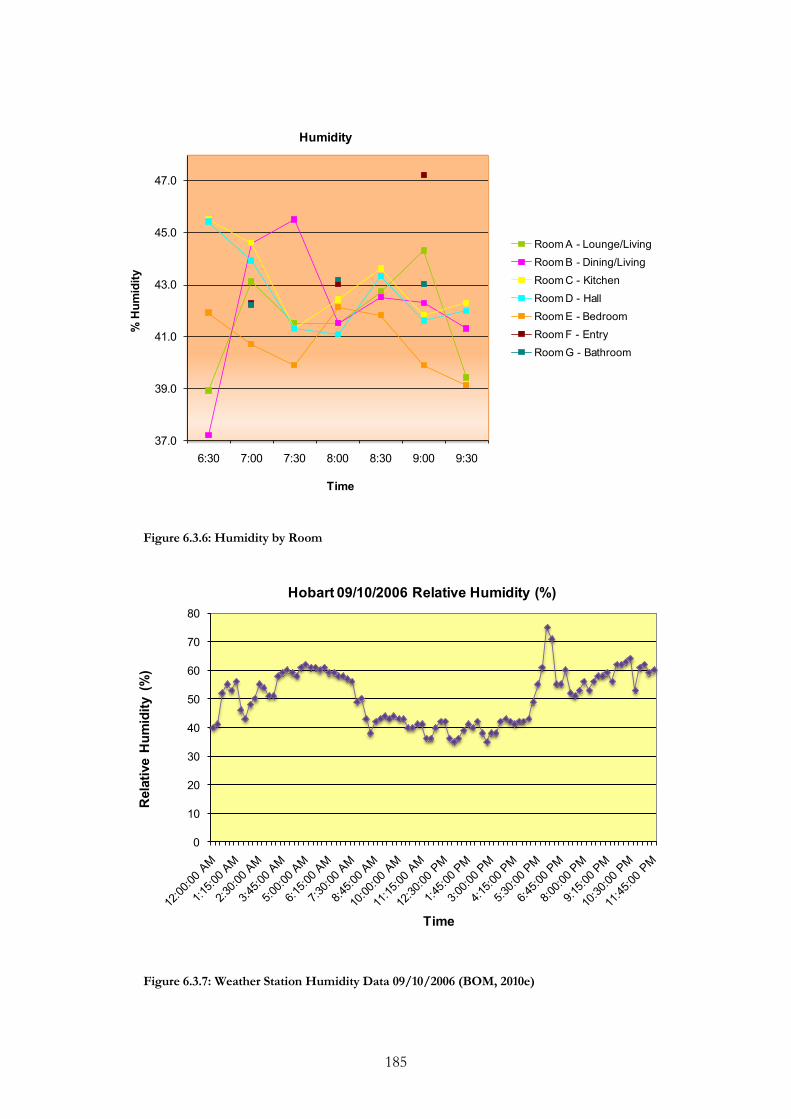
185
37.0
39.0
41.0
43.0
45.0
47.0
6:30 7:00 7:30 8:00 8:30 9:00 9:30
% H
umid
ity
Time
Humidity
Room A - Lounge/LivingRoom B - Dining/LivingRoom C - KitchenRoom D - HallRoom E - BedroomRoom F - EntryRoom G - Bathroom
Figure 6.3.6: Humidity by Room
0
10
20
30
40
50
60
70
80
Rel
ativ
e H
umid
ity (
%)
Time
Hobart 09/10/2006 Relative Humidity (%)
Figure 6.3.7: Weather Station Humidity Data 09/10/2006 (BOM, 2010e)
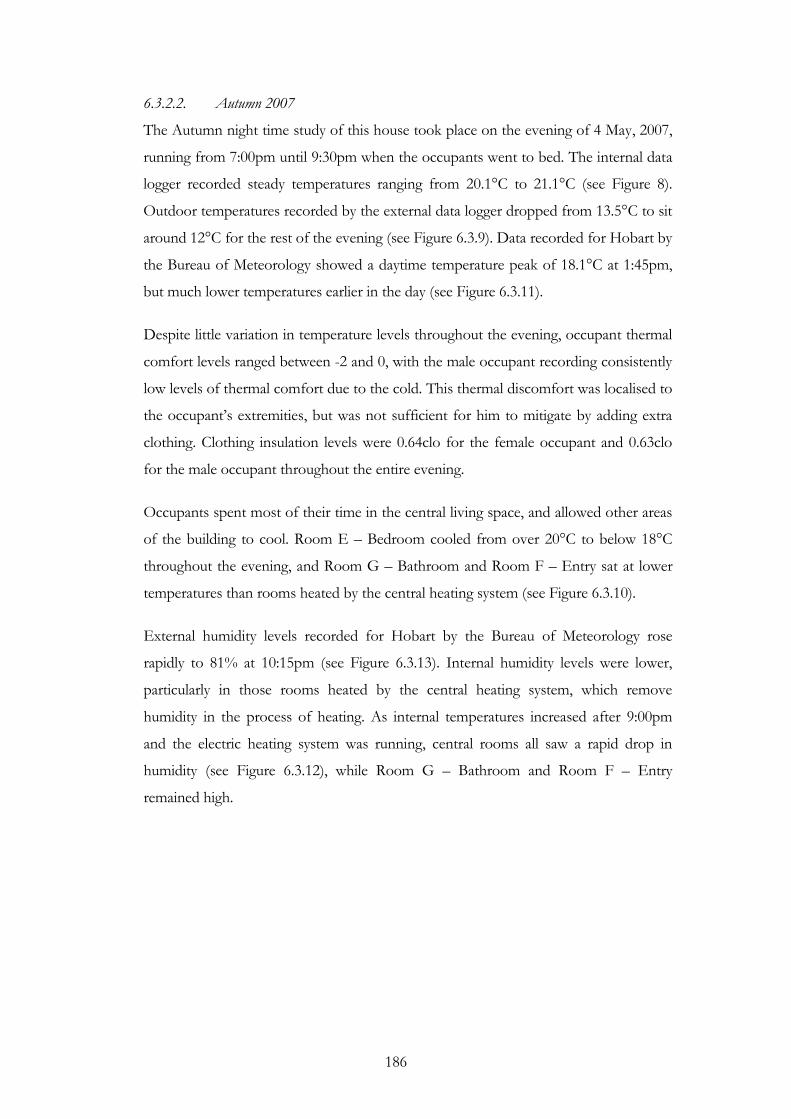
186
6.3.2.2. Autumn 2007
The Autumn night time study of this house took place on the evening of 4 May, 2007,
running from 7:00pm until 9:30pm when the occupants went to bed. The internal data
logger recorded steady temperatures ranging from 20.1°C to 21.1°C (see Figure 8).
Outdoor temperatures recorded by the external data logger dropped from 13.5°C to sit
around 12°C for the rest of the evening (see Figure 6.3.9). Data recorded for Hobart by
the Bureau of Meteorology showed a daytime temperature peak of 18.1°C at 1:45pm,
but much lower temperatures earlier in the day (see Figure 6.3.11).
Despite little variation in temperature levels throughout the evening, occupant thermal
comfort levels ranged between -2 and 0, with the male occupant recording consistently
low levels of thermal comfort due to the cold. This thermal discomfort was localised to
the occupant‟s extremities, but was not sufficient for him to mitigate by adding extra
clothing. Clothing insulation levels were 0.64clo for the female occupant and 0.63clo
for the male occupant throughout the entire evening.
Occupants spent most of their time in the central living space, and allowed other areas
of the building to cool. Room E – Bedroom cooled from over 20°C to below 18°C
throughout the evening, and Room G – Bathroom and Room F – Entry sat at lower
temperatures than rooms heated by the central heating system (see Figure 6.3.10).
External humidity levels recorded for Hobart by the Bureau of Meteorology rose
rapidly to 81% at 10:15pm (see Figure 6.3.13). Internal humidity levels were lower,
particularly in those rooms heated by the central heating system, which remove
humidity in the process of heating. As internal temperatures increased after 9:00pm
and the electric heating system was running, central rooms all saw a rapid drop in
humidity (see Figure 6.3.12), while Room G – Bathroom and Room F – Entry
remained high.
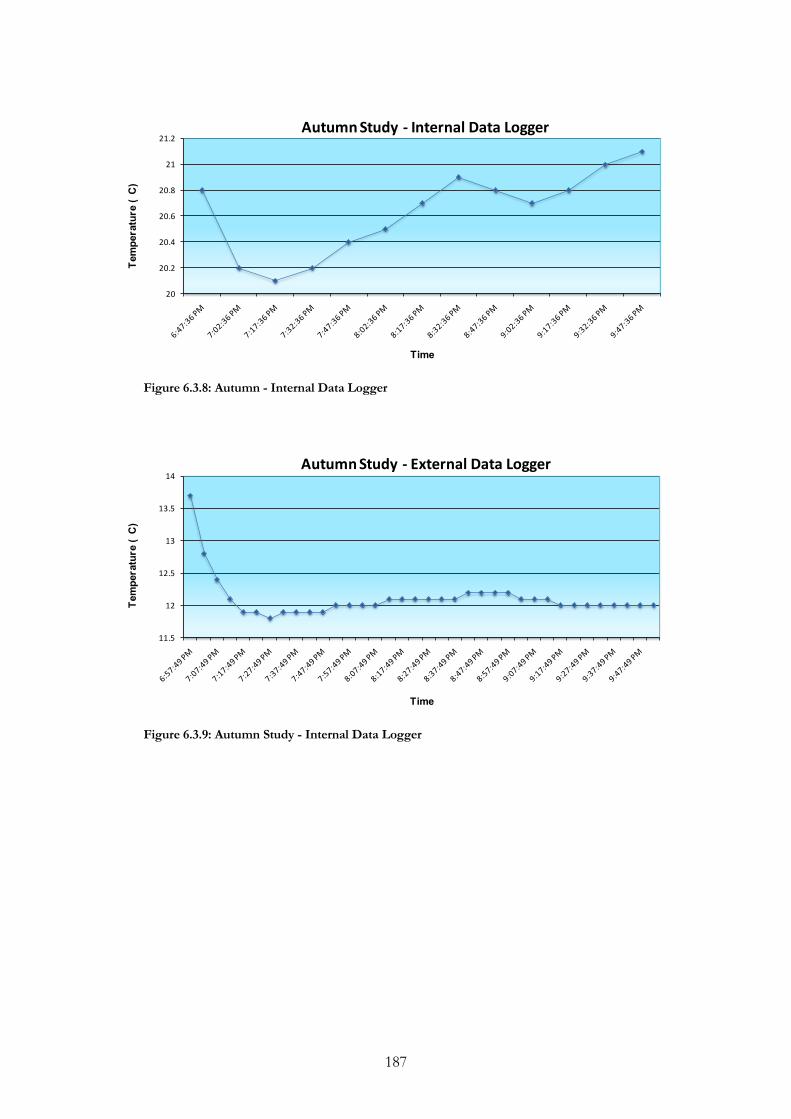
187
20
20.2
20.4
20.6
20.8
21
21.2Te
mpe
ratu
re (
C)
Time
Autumn Study - Internal Data Logger
Figure 6.3.8: Autumn - Internal Data Logger
11.5
12
12.5
13
13.5
14
Tem
pera
ture
( C
)
Time
Autumn Study - External Data Logger
Figure 6.3.9: Autumn Study - Internal Data Logger
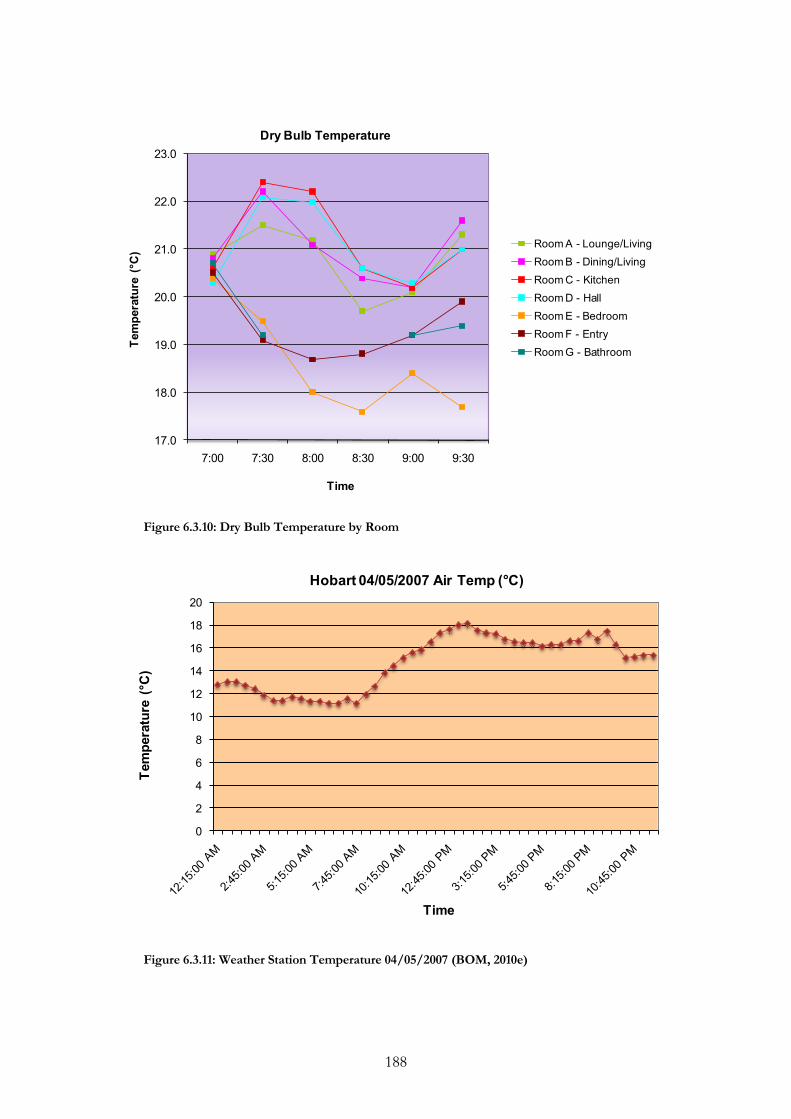
188
17.0
18.0
19.0
20.0
21.0
22.0
23.0
7:00 7:30 8:00 8:30 9:00 9:30
Tem
pera
ture
(°C
)
Time
Dry Bulb Temperature
Room A - Lounge/LivingRoom B - Dining/LivingRoom C - KitchenRoom D - HallRoom E - BedroomRoom F - EntryRoom G - Bathroom
Figure 6.3.10: Dry Bulb Temperature by Room
0
2
4
6
8
10
12
14
16
18
20
Tem
pera
ture
(°C
)
Time
Hobart 04/05/2007 Air Temp (°C)
Figure 6.3.11: Weather Station Temperature 04/05/2007 (BOM, 2010e)
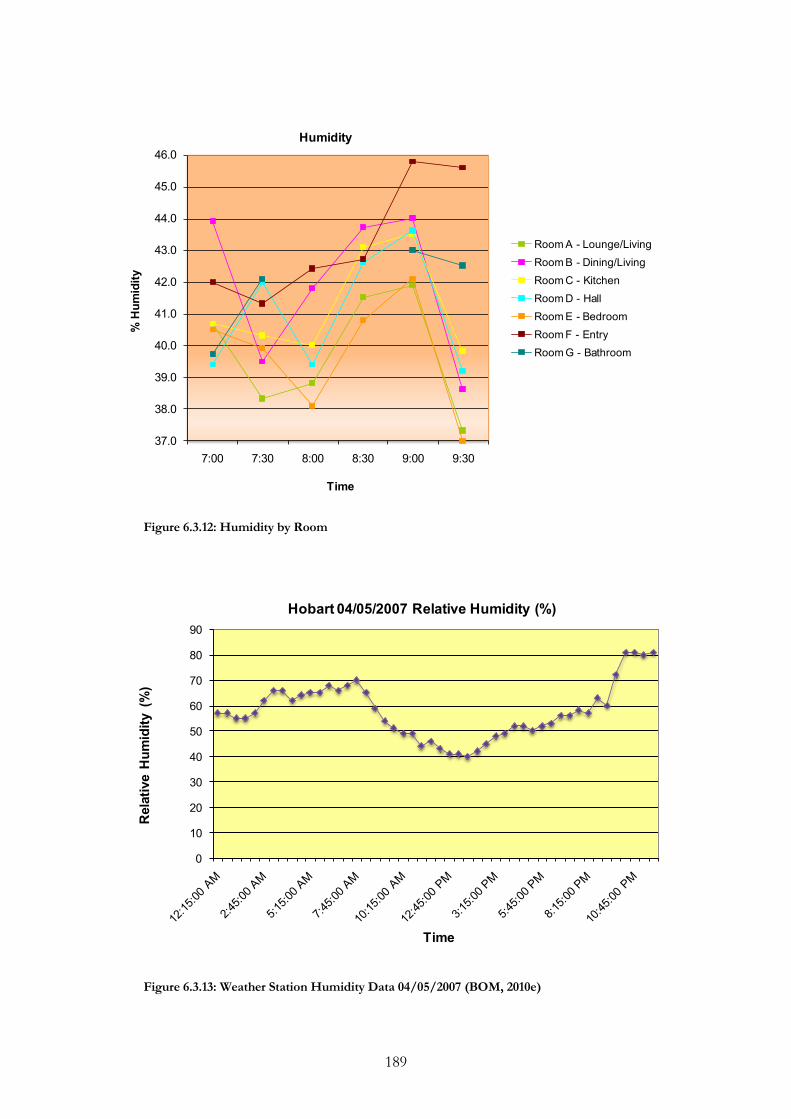
189
37.0
38.0
39.0
40.0
41.0
42.0
43.0
44.0
45.0
46.0
7:00 7:30 8:00 8:30 9:00 9:30
% H
umid
ity
Time
Humidity
Room A - Lounge/LivingRoom B - Dining/LivingRoom C - KitchenRoom D - HallRoom E - BedroomRoom F - EntryRoom G - Bathroom
Figure 6.3.12: Humidity by Room
0
10
20
30
40
50
60
70
80
90
Rel
ativ
e H
umid
ity (
%)
Time
Hobart 04/05/2007 Relative Humidity (%)
Figure 6.3.13: Weather Station Humidity Data 04/05/2007 (BOM, 2010e)
190
6.3.3. Themes
This building featured low insulation levels, but higher thermal mass.
Thermoregulation occurs, but is not as successful as it potentially could be if
sufficient insulation ensured the air stayed warm.
The highly regulated internal environment has made occupants susceptible to
even small changes in humidity and temperature, and they are likely to become
uncomfortable more easily.

191
6.4. Case Study 4 – A Small Brick Veneer House with Attached
Sun Room on a North Facing Slope
6.4.1. Introduction
This building sits in the hills to the south west of Hobart, on a north facing slope, and
has a latitude of -42.89. Because of its altitude of approximately 100m it is not subject
to the cold air drainage at the valley floor or katabatic winds, but its north side is
exposed to other air movements dependent on climatic conditions.
The building is small in size, with an area of approximately 77m2. The building is
timber framed brick veneer, with plasterboard interior walls. The floors are polished
wood, with rugs in many areas. The zoning of the building is in some ways appropriate
but not ideal. There is one bedroom on the eastern side, but another inappropriately
located on the south west side. The northern side has a sun room that can be isolated
from the rest of the building during the evening, and is linked to the adjacent Room E
– Small Bedroom and Room F – Bathroom with vents. These rooms, Room B –
Kitchen, Room H – Back Hall, and the pantry are on the northern side of the building
(see Figure 6.4.1).
Apart from the sunroom, the building has little northern glazing, and prior to the
sunroom being enclosed, the building would have had only two small windows on the
northern side. The building is not high in thermal mass, with a timber frame,
plasterboard internal walls, and floorboards. While it is brick veneer, this brick is
external to the building envelope. There are two brick fireplaces, one in Room C –
Spare Bedroom and one in Room B – Kitchen.
The occupant has actively sealed as many gaps in the building envelope as possible,
minimising drafts and air exchange with the external environment. The external walls
are not insulated (R0.46). The ceiling is insulated with fiberglass batts (R4.1 in summer
and R4.5 in winter). Large windows are covered with curtains that flow to the floor but
have no pelmets, giving them an insulation rating of R1.16. Smaller windows in the
bathroom and kitchen, and the large glazing in the sunroom, is single glazed and not
curtained, and has an insulation value of R0.16. The floorboards are not insulated and
192
have a rating of R0.10. Room C – Spare Room, Room D – Master Bedroom and
Room E – Small Bedroom are carpeted, with an insulation value of R0.47.
The central kitchen and living room area are heated by a 2kW electric heater, and have
a ceiling fan in the central living space for cooling in the summer. The occupant
commented that the electric heater is almost sufficient to maintain thermal comfort
levels in winter. Heat is also gathered by the sun room, and drawn into the house
through the fans in the vents leading to Room E – Small Bedroom and Room F –
Bathroom, or through the open door to the kitchen.
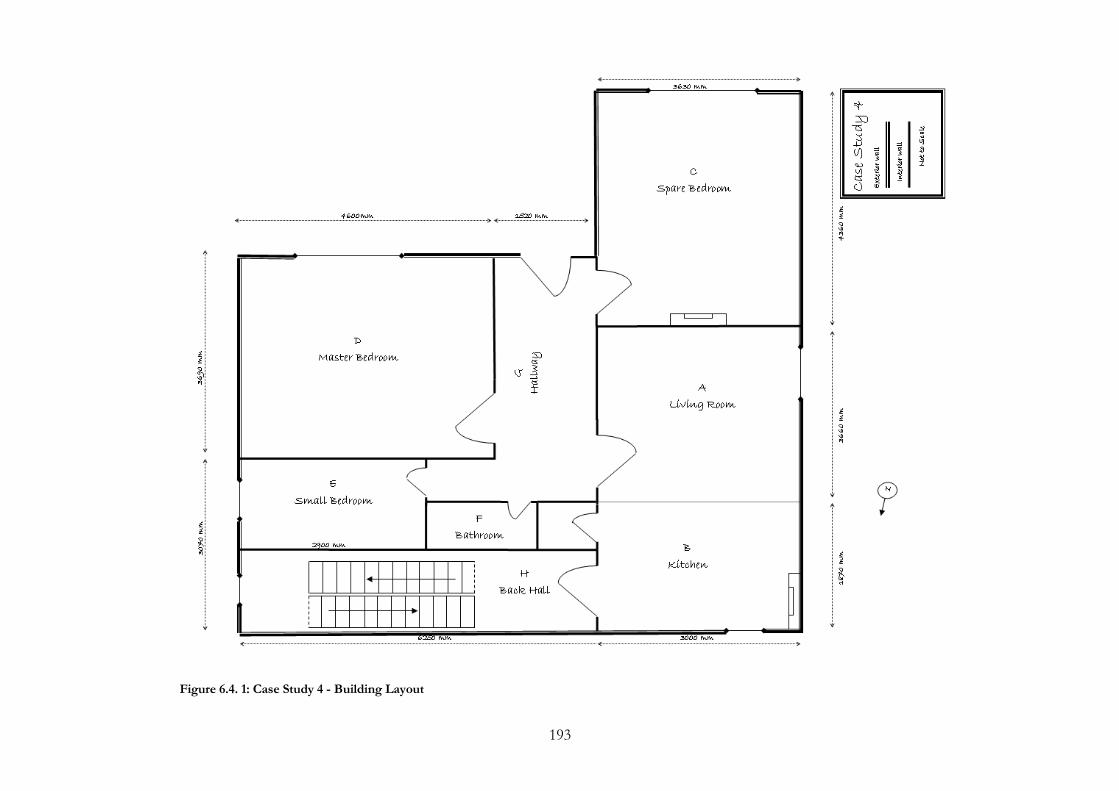
193
Figure 6.4. 1: Case Study 4 - Building Layout
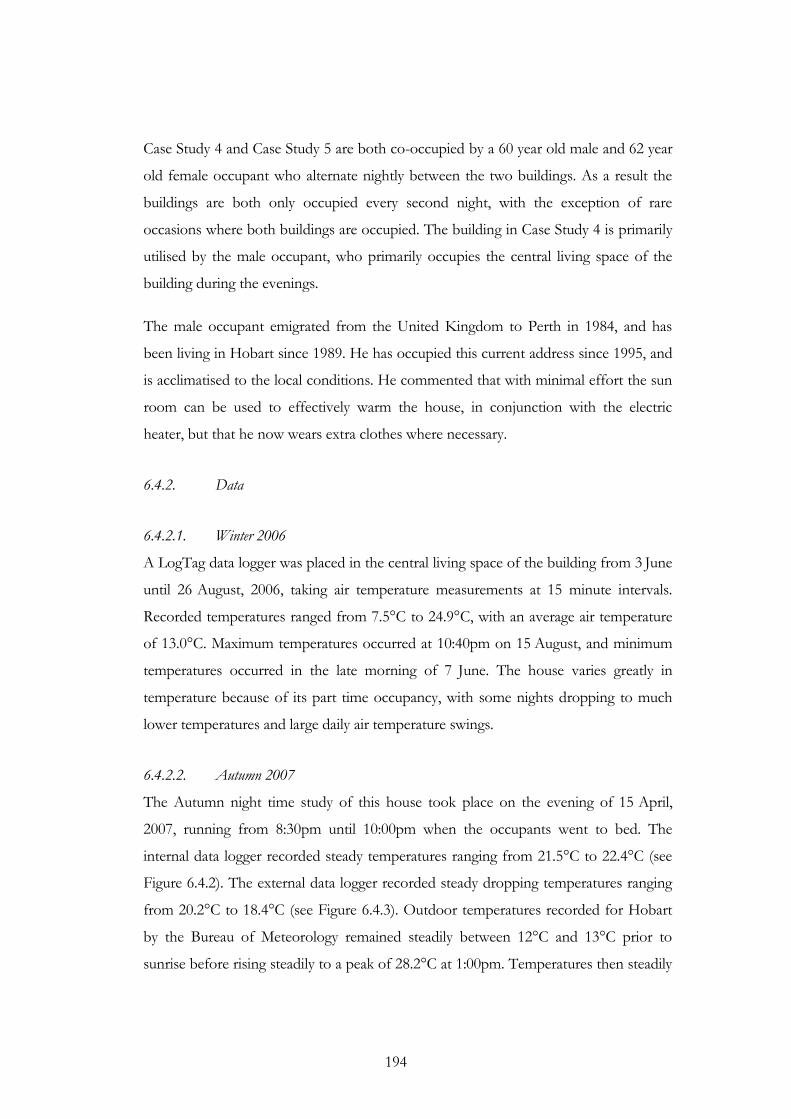
194
Case Study 4 and Case Study 5 are both co-occupied by a 60 year old male and 62 year
old female occupant who alternate nightly between the two buildings. As a result the
buildings are both only occupied every second night, with the exception of rare
occasions where both buildings are occupied. The building in Case Study 4 is primarily
utilised by the male occupant, who primarily occupies the central living space of the
building during the evenings.
The male occupant emigrated from the United Kingdom to Perth in 1984, and has
been living in Hobart since 1989. He has occupied this current address since 1995, and
is acclimatised to the local conditions. He commented that with minimal effort the sun
room can be used to effectively warm the house, in conjunction with the electric
heater, but that he now wears extra clothes where necessary.
6.4.2. Data
6.4.2.1. Winter 2006
A LogTag data logger was placed in the central living space of the building from 3 June
until 26 August, 2006, taking air temperature measurements at 15 minute intervals.
Recorded temperatures ranged from 7.5°C to 24.9°C, with an average air temperature
of 13.0°C. Maximum temperatures occurred at 10:40pm on 15 August, and minimum
temperatures occurred in the late morning of 7 June. The house varies greatly in
temperature because of its part time occupancy, with some nights dropping to much
lower temperatures and large daily air temperature swings.
6.4.2.2. Autumn 2007
The Autumn night time study of this house took place on the evening of 15 April,
2007, running from 8:30pm until 10:00pm when the occupants went to bed. The
internal data logger recorded steady temperatures ranging from 21.5°C to 22.4°C (see
Figure 6.4.2). The external data logger recorded steady dropping temperatures ranging
from 20.2°C to 18.4°C (see Figure 6.4.3). Outdoor temperatures recorded for Hobart
by the Bureau of Meteorology remained steadily between 12°C and 13°C prior to
sunrise before rising steadily to a peak of 28.2°C at 1:00pm. Temperatures then steadily

195
dropped to 18.8°C by 4:30pm and remained steadily between 19°C and 16°C for the
rest of the evening (See Figure 6.4.5).
Male occupant thermal comfort levels were neutral throughout the evening, and a high
level of thermal comfort was maintained. The occupant spent most of his time in the
central living space, seated with a metabolism of 1-1.2met, and a clothing insulation
value of 0.76clo. The female occupant recorded a -1 on the thermal comfort scale at
8:00pm before leaving the building.
Rooms maintained a temperature of between 21.5°C and 23.0°C, except for Room C –
Spare Bedroom, which reached 23.8°C at 10pm (see Figure 6.4.4). These temperatures
are conducive to high levels of thermal comfort. Temperatures in all rooms except for
Room B – Kitchen dropped slightly at 9:30 before rising again. Room B – Kitchen had
the steadiest temperatures throughout the study.
Floor temperatures were notably cold in all rooms compared to wall temperatures.
Floors are wooden and do not have insulation. Dry bulb temperatures in Room A –
Living, Room B – Kitchen, Room C – Spare Room, Room D – Master Bedroom and
Room E – Small Bedroom were all higher than ceiling, floor and wall surface
temperatures. This indicates a low thermal mass building that stores heat energy in the
air space. Globe temperatures recorded in Room A – Living and Room B – Kitchen
were lower than dry bulb temperatures, and were between 21.0°C and 23.0°C.
External humidity levels recorded for Hobart by the Bureau of Meteorology rose
above 90% the morning of the 15th, and dropped quickly to a low of 24 at 12:45pm.
Humidity rose to above 80% in the evening (see Figure 6.4.7). Internal humidity levels
were lowest in Room H – Back Hall and Stairs, which is north facing and receives the
most sun during the day.
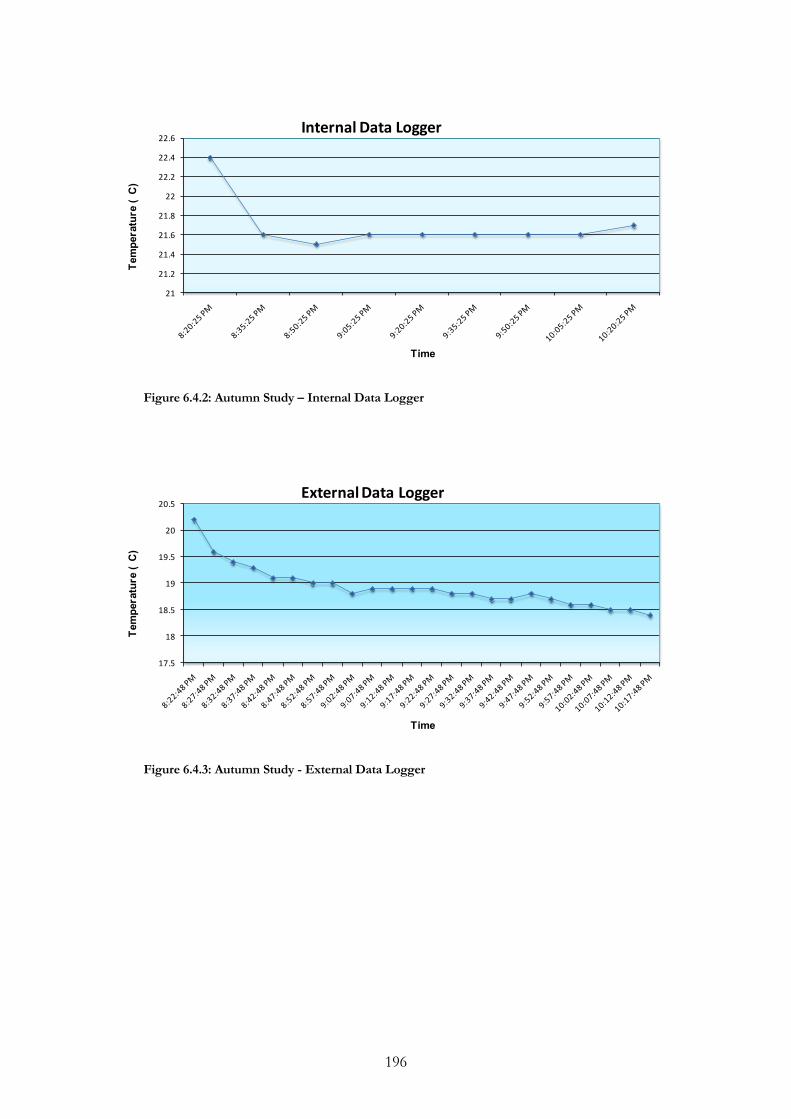
196
21
21.2
21.4
21.6
21.8
22
22.2
22.4
22.6Te
mpe
ratu
re (
C)
Time
Internal Data Logger
Figure 6.4.2: Autumn Study – Internal Data Logger
17.5
18
18.5
19
19.5
20
20.5
Tem
pera
ture
( C
)
Time
External Data Logger
Figure 6.4.3: Autumn Study - External Data Logger
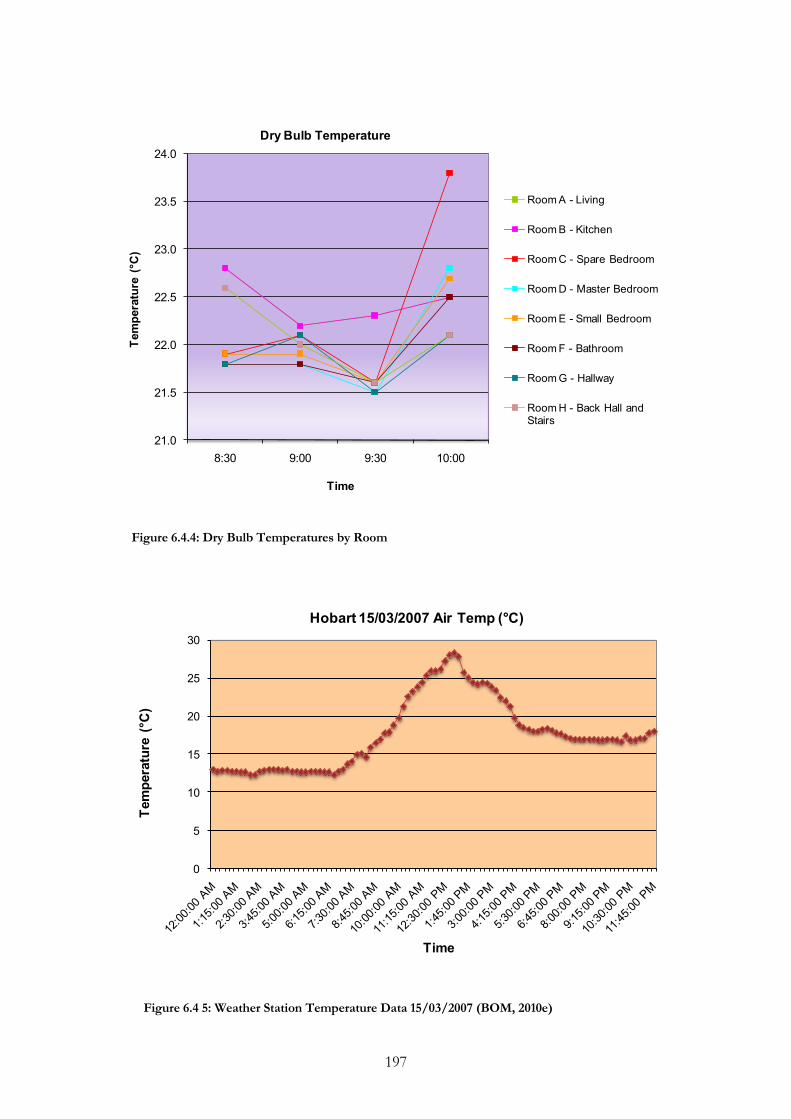
197
21.0
21.5
22.0
22.5
23.0
23.5
24.0
8:30 9:00 9:30 10:00
Tem
pera
ture
(°C
)
Time
Dry Bulb Temperature
Room A - Living
Room B - Kitchen
Room C - Spare Bedroom
Room D - Master Bedroom
Room E - Small Bedroom
Room F - Bathroom
Room G - Hallway
Room H - Back Hall and Stairs
Figure 6.4.4: Dry Bulb Temperatures by Room
0
5
10
15
20
25
30
Tem
pera
ture
(°C
)
Time
Hobart 15/03/2007 Air Temp (°C)
Figure 6.4 5: Weather Station Temperature Data 15/03/2007 (BOM, 2010e)

198
55.0
56.0
57.0
58.0
59.0
60.0
61.0
62.0
63.0
64.0
8:30 9:00 9:30 10:00
% H
umid
ity
Time
Humidity
Room A - Living
Room B - Kitchen
Room C - Spare Bedroom
Room D - Master Bedroom
Room E - Small Bedroom
Room F - Bathroom
Room G - Hallway
Room H - Back Hall and Stairs
Figure 6.4.6: Humidity by Room
0
10
20
30
40
50
60
70
80
90
100
Rel
ativ
e H
umid
ity (
%)
Time
Hobart 15/03/2007 Relative Humidity (%)
Figure 6.4.7: Weather Station Humidity Data 15/03/07 (BOM, 2010e)
199
6.4.3. Themes
The low thermal mass of this building means that energy is stored in the air
space. Resultantly the building has large swings in internal air temperature
overnight.
Despite drafts being excluded and air flows to the outside environment being
prevented or removed, air is still lost to the outside because of the building‟s
low levels of insulation.
200
6.5. Case Study 5 – A Small Double Brick House with Attached Sun
Room in an East-West Running Valley
6.5.1. Introduction
This building constructed in the early 1900s sits in the south west of Hobart, at the
bottom of the north facing slope discussed in Case Study 4. It has an altitude of
approximately 75m and is at a latitude of -42.89. The valley runs east-west, sloping to
the east, and is subject to cold air drainage and katabatic winds.
The building is a small double brick, tiled roof cottage, with an approximate area of
90m2. It is appropriately orientated, but is in the shadow of the hills on its northern
side, which have a greater influence in blocking winter light, when the sun is lower in
the sky. A number of evergreen trees surround the building, further blocking solar
access. In addition to the low solar energy reaching the building, it only has a small
amount of glazing, further reducing insolation into the building envelope. The addition
of a sun room on the northern side improves solar access, but as with Case Study 4
there is no active method of transporting this heat into the building envelope. There
are no windows on the east and west sides of the building.
Because of its double brick construction, including two unused fireplaces, the building
features large volumes of thermal mass. The dark mat red brick of the building means
that it reflects less solar energy than a shiny or light surface. Because of the poor solar
access of the building however, there is potential for this thermal mass to act as a heat
sink, drawing heat energy from the internal air and storing it in the bricks and
negatively affecting the thermal environment during cooler months. Bricks on the
internal northern wall inside the sunspace are an exception to this, and are directly
exposed to available solar radiation, while remaining inside the thermal environment.
With no insulation between the brick layers of the walls, the walls have an insulation
value of R0.5. The roof cavity has reflective foil sarking and bulk insulation between
the joists, giving it a summer insulation value of R4.5 and a winter insulation value of
R3.0. There is no underfloor insulation, however the floor boards are in good
condition, and drafts between are not detectable. While most of the house has polished
floorboards, the bedrooms and Room H – Meditation Room are carpeted, increasing
201
insulation. The window in Room E – Kitchen has a thin curtain with an insulation
rating of R0.26. The large glazed area in Room G – Back Pantry is not curtained, with a
rating of R0.16, but the door to this area is kept closed. The front window into the
sunroom and the window into Room C – Master Bedroom are both curtained, with no
pelmets, with an insulation rating of R0.26. The sunroom has single glazing with an
insulation rating of R0.16. There is no central or installed heating system, and the
occupants rely on portable electric oil heaters and radiant heaters.

202
Figure 6.5.1: Case Study 5 - Building Layout
203
Case Study 4 and Case Study 5 are both co-occupied by a 60 year old male and 62 year
old female occupant who alternate nightly between the two buildings. As a result the
buildings are both only occupied every second night, with the exception of rare
occasions when both buildings are occupied. The building in Case Study 5 is primarily
utilised by the female occupant, who primarily occupies Room B – Lounge/Living
during the evenings.
The female occupant has lived in the building for 11 years, and lived previously in
Perth. She has had sufficient time to acclimatise to local climate. The occupants both
consider the building to be thermally uncomfortable, with temperatures being
consistently too low or high to maintain appropriate thermal comfort levels. They have
developed techniques for adapting to the low levels of thermal comfort that the
building delivers, such as the addition of extra clothing, and the confinement to a single
room.
6.5.2. Data
6.5.2.1. Winter 2006
A LogTag data logger was placed in the central living space of the building from 3 June,
2006 until 26 August, 2006, taking air temperature measurements at 15 minute
intervals. Recorded temperatures ranged from 8.0°C to 19.7°C, with an average air
temperature of 11.9°C. Maximum temperatures occurred at 9:15pm on 24 August.
Internal air temperatures during the day were lower than the evening, indicating that
temperature increases are as a result of electric heating rather than insolation. This is
supported by the fact that minimum temperatures occurred during a period of ten days
where the building was not occupied, where daytime temperatures did not rise above
10°C and dropped below 8.5°C each evening. When occupied, the house features large
daily air temperature swings of as much as 8°C, which is indicative of a poorly insulated
building, with either low or inappropriately located thermal mass. When unoccupied,
the building features smaller swings in temperature, as temperatures are largely
controlled actively by electric heaters.
204
6.5.2.2. Spring 2006
A LogTag data logger was placed in the central living space of the building from 2
October, 2006 until 25 December, 2006, taking air temperature measurements at 15
minute intervals. Recorded temperatures ranged from 12.1°C to 23.6°C, with an
average air temperature of 17.0°C. Maximum temperatures occurred on the evening of
22 of December, and temperatures reached 23.4°C on 12 October. Minimum
temperatures occurred in the morning of 16 November. The house featured daily air
temperature swings of around 4°C during this period, which is smaller than
temperatures swings during the winter.
The spring night time study of this house took place on the evening of 2 October 2006,
running from 6:30pm until 10:00pm when the occupants went to bed. The data logger
recorded steady temperatures ranging from 18.2°C to 19.1°C (see Figure 6.5.3).
Outdoor temperatures recorded for Hobart by the Bureau of Meteorology for this
period ranged from 10.0°C to 17.0°C peaking at 1:30pm during the day, and steadily
declined to 11.5°C by midnight (see Figure 6.5.5).
Occupant thermal comfort levels ranged between -2 and 1, with only one instance of
notable thermal discomfort due to the cold. Occupants spent most of their time in
Room B – Lounge/Living. Both occupants maintained a constant level of clothing
insulation, with an increased period of insulation between 7:30 and 8:00 due to the
couch. The female occupant dressed heavily, including wearing a woolen jumper, and
had a clothing insulation value of 0.82clo, while the male had a clothing insulation
value of 0.83clo.
Room A – External Sun Room, Room C – Master Bedroom, and Room D – Hallway
both experienced spikes in dry bulb temperature at 8:30pm. A similar spike occurred in
Room B – Lounge/Living Room at 9:00pm (see Figure 6.5.3). Because of insolation,
Room A – External Sun Room featured higher surface temperatures than dry bulb
temperature prior to sundown. After sundown, surface temperatures dropped at a
faster rate than dry bulb temperature as the thermal mass of the brick wall loses its
stored energy to the air inside the sunroom (see Figure 6.5.4).
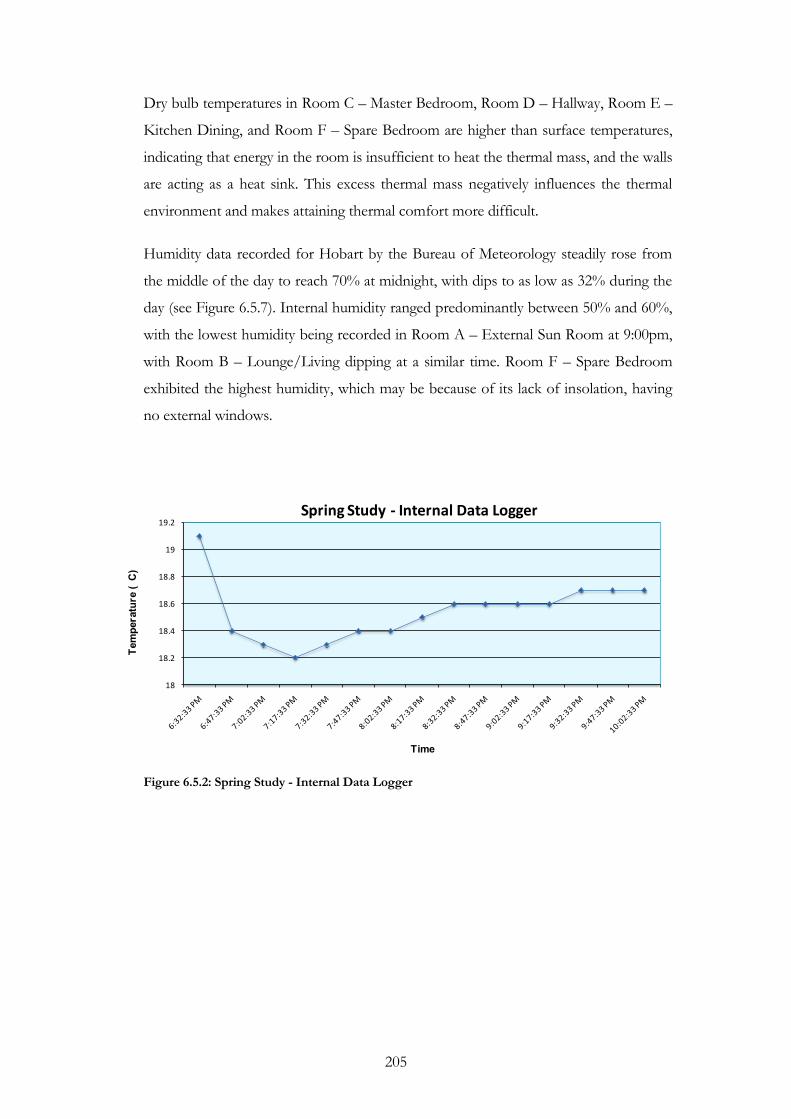
205
Dry bulb temperatures in Room C – Master Bedroom, Room D – Hallway, Room E –
Kitchen Dining, and Room F – Spare Bedroom are higher than surface temperatures,
indicating that energy in the room is insufficient to heat the thermal mass, and the walls
are acting as a heat sink. This excess thermal mass negatively influences the thermal
environment and makes attaining thermal comfort more difficult.
Humidity data recorded for Hobart by the Bureau of Meteorology steadily rose from
the middle of the day to reach 70% at midnight, with dips to as low as 32% during the
day (see Figure 6.5.7). Internal humidity ranged predominantly between 50% and 60%,
with the lowest humidity being recorded in Room A – External Sun Room at 9:00pm,
with Room B – Lounge/Living dipping at a similar time. Room F – Spare Bedroom
exhibited the highest humidity, which may be because of its lack of insolation, having
no external windows.
18
18.2
18.4
18.6
18.8
19
19.2
Tem
pera
ture
( C
)
Time
Spring Study - Internal Data Logger
Figure 6.5.2: Spring Study - Internal Data Logger
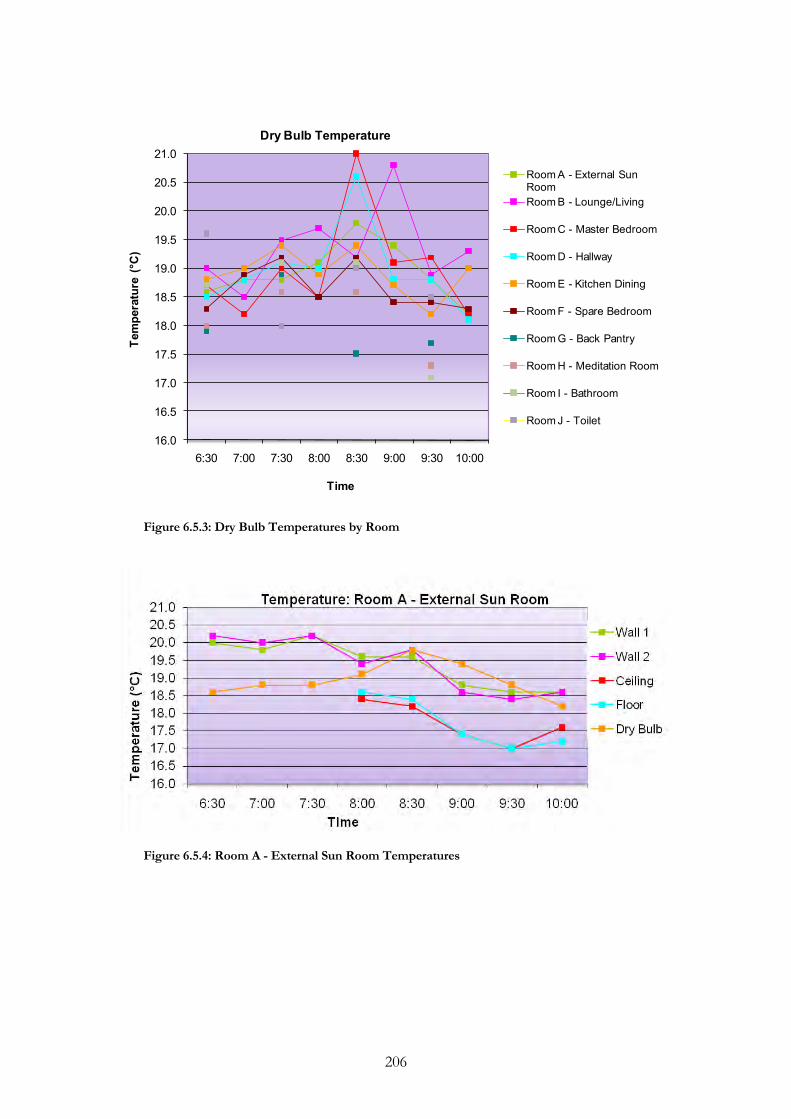
206
16.0
16.5
17.0
17.5
18.0
18.5
19.0
19.5
20.0
20.5
21.0
6:30 7:00 7:30 8:00 8:30 9:00 9:30 10:00
Tem
pera
ture
(°C
)
Time
Dry Bulb Temperature
Room A - External Sun RoomRoom B - Lounge/Living
Room C - Master Bedroom
Room D - Hallway
Room E - Kitchen Dining
Room F - Spare Bedroom
Room G - Back Pantry
Room H - Meditation Room
Room I - Bathroom
Room J - Toilet
Figure 6.5.3: Dry Bulb Temperatures by Room
Figure 6.5.4: Room A - External Sun Room Temperatures
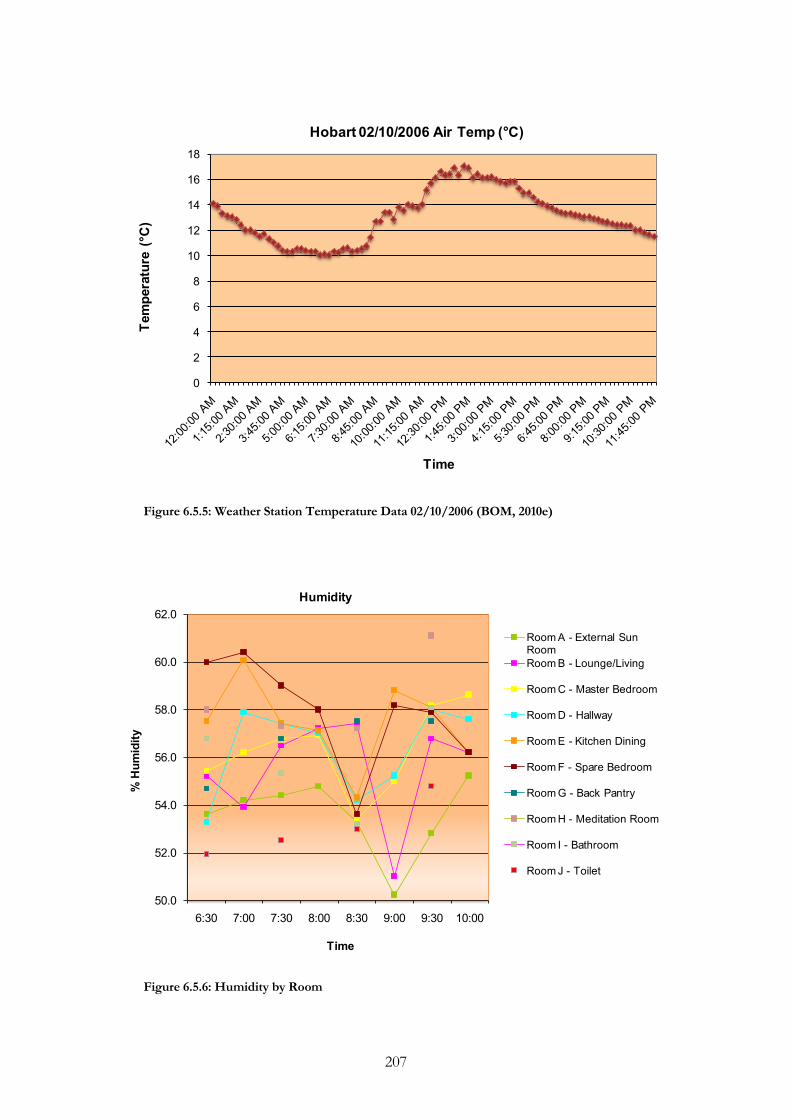
207
0
2
4
6
8
10
12
14
16
18Te
mpe
ratu
re (
°C)
Time
Hobart 02/10/2006 Air Temp (°C)
Figure 6.5.5: Weather Station Temperature Data 02/10/2006 (BOM, 2010e)
50.0
52.0
54.0
56.0
58.0
60.0
62.0
6:30 7:00 7:30 8:00 8:30 9:00 9:30 10:00
% H
umid
ity
Time
Humidity
Room A - External Sun RoomRoom B - Lounge/Living
Room C - Master Bedroom
Room D - Hallway
Room E - Kitchen Dining
Room F - Spare Bedroom
Room G - Back Pantry
Room H - Meditation Room
Room I - Bathroom
Room J - Toilet
Figure 6.5.6: Humidity by Room
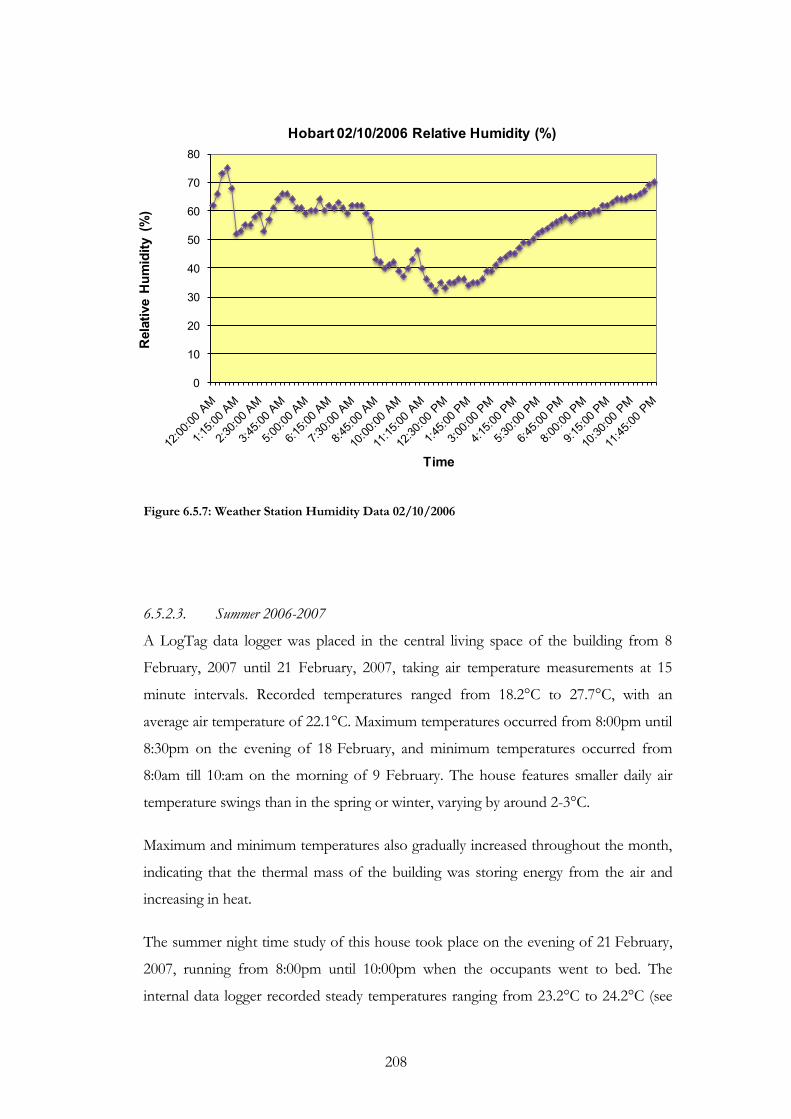
208
0
10
20
30
40
50
60
70
80R
elat
ive
Hum
idity
(%
)
Time
Hobart 02/10/2006 Relative Humidity (%)
Figure 6.5.7: Weather Station Humidity Data 02/10/2006
6.5.2.3. Summer 2006-2007
A LogTag data logger was placed in the central living space of the building from 8
February, 2007 until 21 February, 2007, taking air temperature measurements at 15
minute intervals. Recorded temperatures ranged from 18.2°C to 27.7°C, with an
average air temperature of 22.1°C. Maximum temperatures occurred from 8:00pm until
8:30pm on the evening of 18 February, and minimum temperatures occurred from
8:0am till 10:am on the morning of 9 February. The house features smaller daily air
temperature swings than in the spring or winter, varying by around 2-3°C.
Maximum and minimum temperatures also gradually increased throughout the month,
indicating that the thermal mass of the building was storing energy from the air and
increasing in heat.
The summer night time study of this house took place on the evening of 21 February,
2007, running from 8:00pm until 10:00pm when the occupants went to bed. The
internal data logger recorded steady temperatures ranging from 23.2°C to 24.2°C (see
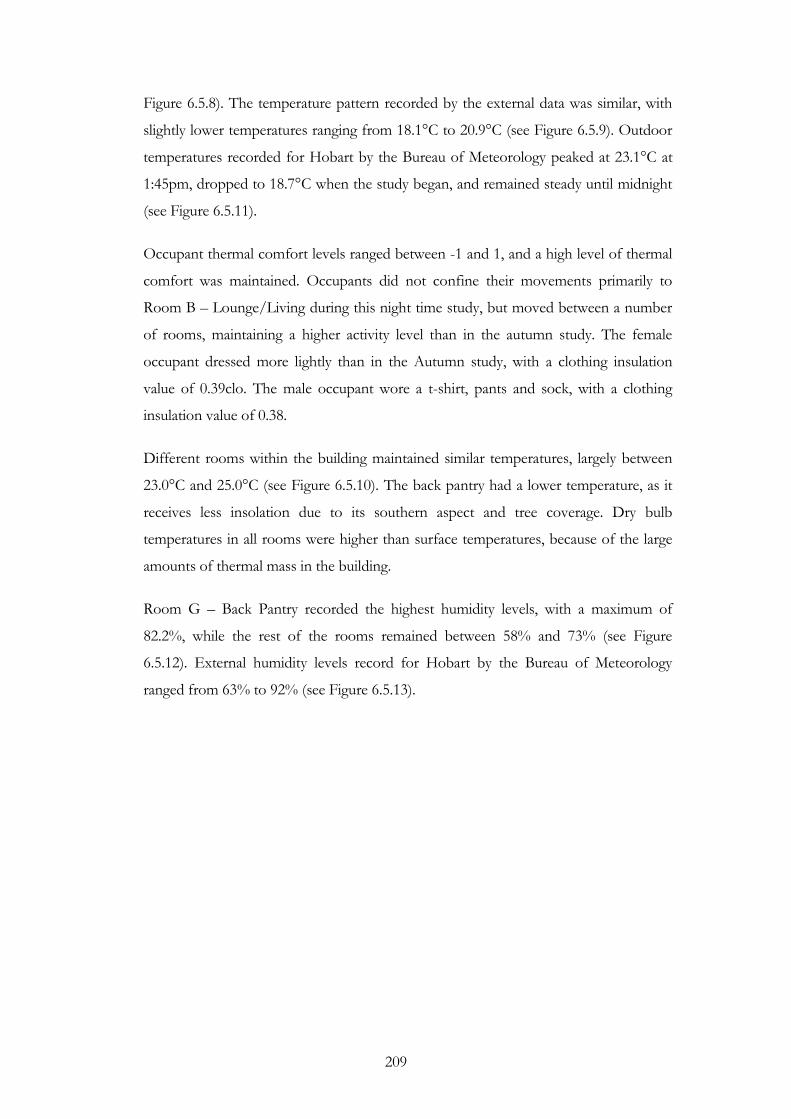
209
Figure 6.5.8). The temperature pattern recorded by the external data was similar, with
slightly lower temperatures ranging from 18.1°C to 20.9°C (see Figure 6.5.9). Outdoor
temperatures recorded for Hobart by the Bureau of Meteorology peaked at 23.1°C at
1:45pm, dropped to 18.7°C when the study began, and remained steady until midnight
(see Figure 6.5.11).
Occupant thermal comfort levels ranged between -1 and 1, and a high level of thermal
comfort was maintained. Occupants did not confine their movements primarily to
Room B – Lounge/Living during this night time study, but moved between a number
of rooms, maintaining a higher activity level than in the autumn study. The female
occupant dressed more lightly than in the Autumn study, with a clothing insulation
value of 0.39clo. The male occupant wore a t-shirt, pants and sock, with a clothing
insulation value of 0.38.
Different rooms within the building maintained similar temperatures, largely between
23.0°C and 25.0°C (see Figure 6.5.10). The back pantry had a lower temperature, as it
receives less insolation due to its southern aspect and tree coverage. Dry bulb
temperatures in all rooms were higher than surface temperatures, because of the large
amounts of thermal mass in the building.
Room G – Back Pantry recorded the highest humidity levels, with a maximum of
82.2%, while the rest of the rooms remained between 58% and 73% (see Figure
6.5.12). External humidity levels record for Hobart by the Bureau of Meteorology
ranged from 63% to 92% (see Figure 6.5.13).
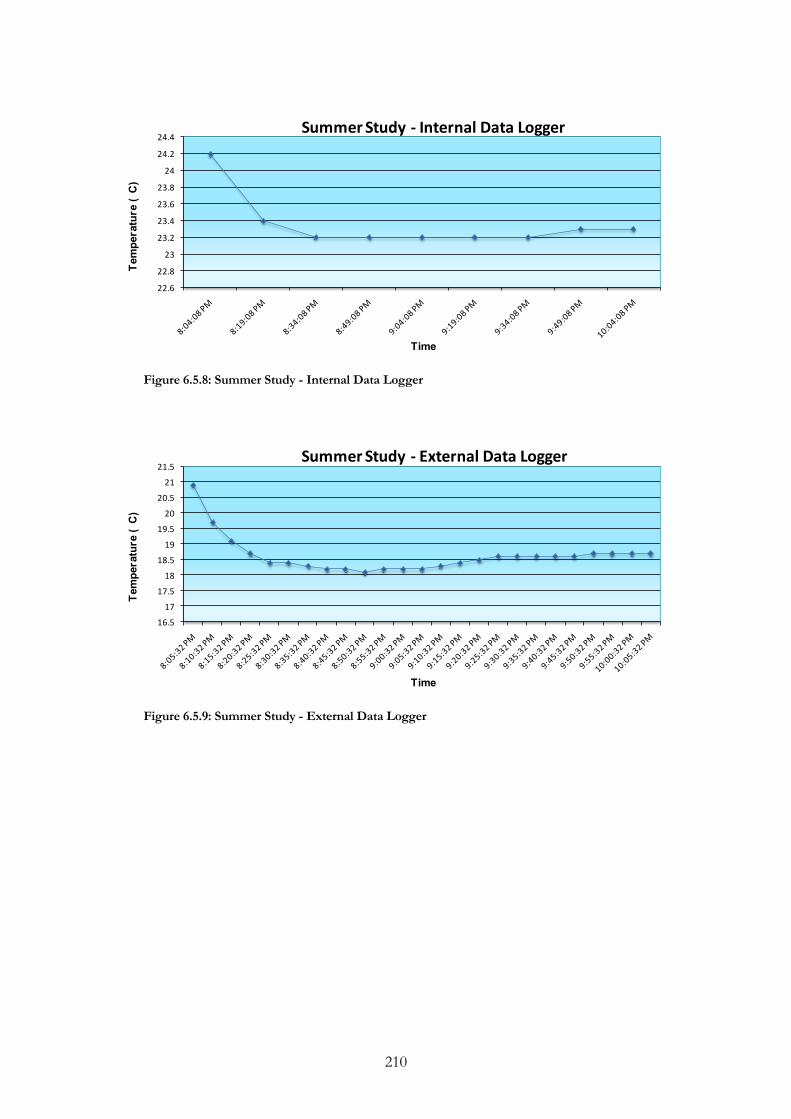
210
22.6
22.8
23
23.2
23.4
23.6
23.8
24
24.2
24.4Te
mpe
ratu
re (
C)
Time
Summer Study - Internal Data Logger
Figure 6.5.8: Summer Study - Internal Data Logger
16.5
17
17.5
18
18.5
19
19.5
20
20.5
21
21.5
Tem
pera
ture
( C
)
Time
Summer Study - External Data Logger
Figure 6.5.9: Summer Study - External Data Logger

211
21.0
21.5
22.0
22.5
23.0
23.5
24.0
24.5
25.0
8:00 8:30 9:00 9:30 10:00
Tem
pera
ture
(°C
)
Time
Dry Bulb Temperature
Room A - External Sun Room
Room B - Lounge/Living
Room C - Master Bedroom
Room D - Hallway
Room E - Kitchen Dining
Room F - Spare Bedroom
Room G - Back Pantry
Figure 6.5.10: Dry Bulb Temperatures by Room
0
5
10
15
20
25
Tem
pera
ture
(°C
)
Time
Hobart 21/02/2007 Air Temp (°C)
Figure 6.5.11: Weather Station Temperature Data 21/02/2007 (BOM, 2010e)
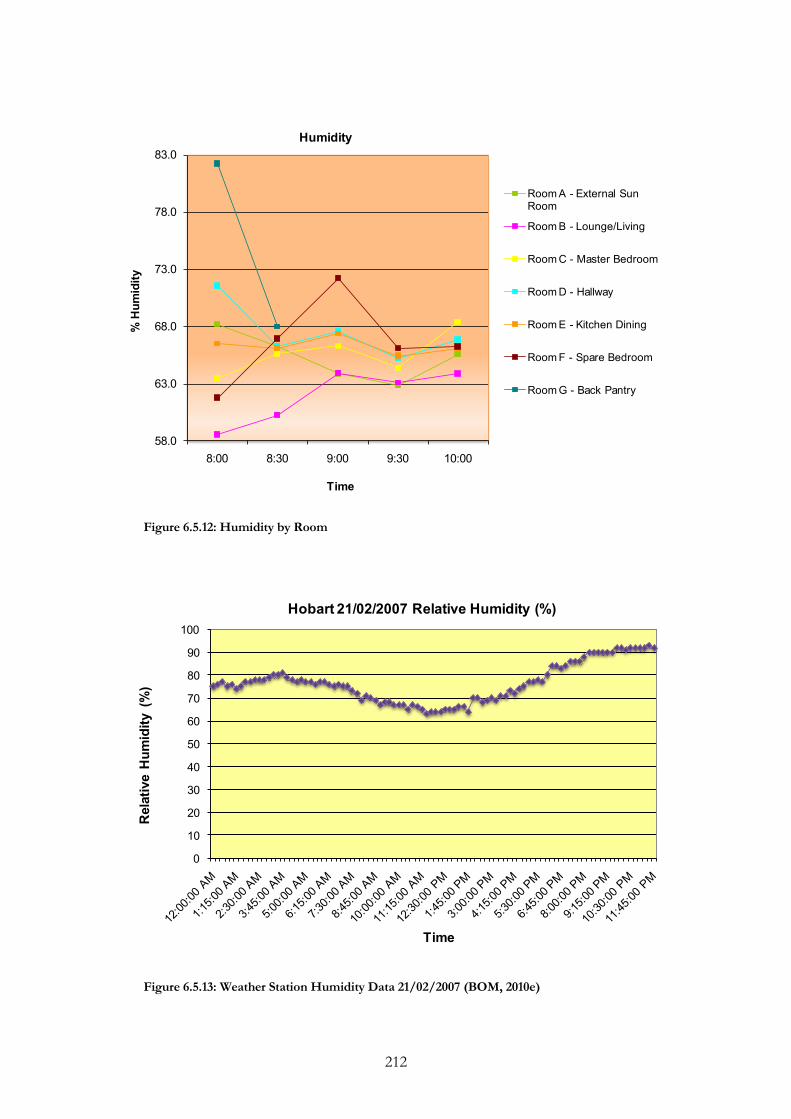
212
58.0
63.0
68.0
73.0
78.0
83.0
8:00 8:30 9:00 9:30 10:00
% H
umid
ity
Time
Humidity
Room A - External Sun Room
Room B - Lounge/Living
Room C - Master Bedroom
Room D - Hallway
Room E - Kitchen Dining
Room F - Spare Bedroom
Room G - Back Pantry
Figure 6.5.12: Humidity by Room
0
10
20
30
40
50
60
70
80
90
100
Rel
ativ
e H
umid
ity (
%)
Time
Hobart 21/02/2007 Relative Humidity (%)
Figure 6.5.13: Weather Station Humidity Data 21/02/2007 (BOM, 2010e)
213
6.5.3. Themes
This is a thermally uncomfortable building; however the occupants can achieve
a higher thermal comfort level through adaptive techniques, such as limiting
activity to a single room and the addition of clothing.
This building has high thermal mass, but insufficient insolation. The thermal
mass acts as a heat sink, and draws energy out of the air into the walls. This
results in poor thermal performance and low levels of thermal comfort.
214
6.6. Case Study 6 – A Modern Top-Storey Unit
6.6.1. Introduction
This dwelling is situated on the southern side of the Hobart CBD, with an altitude of
approximately 50m and a latitude of -42.89. The dwelling is the top unit of a series of
two modern, conjoined dwellings constructed in 2001. The dwelling features a large
open-planned central living space, with a number of adjoining rooms, and has an
approximate area of 90m2, making it fairly small. These adjoining rooms are located on
the west side of the dwelling, with the central living space on the east (see Figure 6.6.1).
Because the dwelling is joined to the adjacent building on the northern side, it is not
possible for large amounts of glazing, and the majority of glazing is to the east or west.
A small amount of glazing on the south side of the building faces the street. At night
time the building is lit by halogen downlights, which while energy efficient, reduce the
insulation value of the ceiling/roof, as they create a hole through the plasterboard and
because of fire-hazard minimisation do not have insulation packed tightly around them.
The building is brick veneer, with bulk insulation and foil insulation between brick and
the plasterboard interior. This gives the walls an insulation rating of R7.1, which is
slightly reduced in areas where there are downlights. The building has a flat sheet roof,
with plasterboard ceiling and bulk insulation between, giving it an insulation value of
R4.1 in the summer and R3.0 in the winter. All windows are double-glazed and have
insulated concertina blinds, giving an estimated insulation value of R0.47.
The dwelling sits on a concrete slab separating it from the apartment below, and all
non wet areas are carpeted. The bathroom, toilet and the kitchen area to the south of
the central living space are tiled. The brick veneer and floor slab mean that this
dwelling is high in thermal mass, with suitable amounts of this mass inside the building
envelope. The thermal mass of the floor is not exposed to insolation and is insulated
from the air by carpet, reducing its effectiveness as a thermoregulator. While the tiled
areas have greater potential for absorbing insolation, they are shiny and white, which
increases their reflectance.
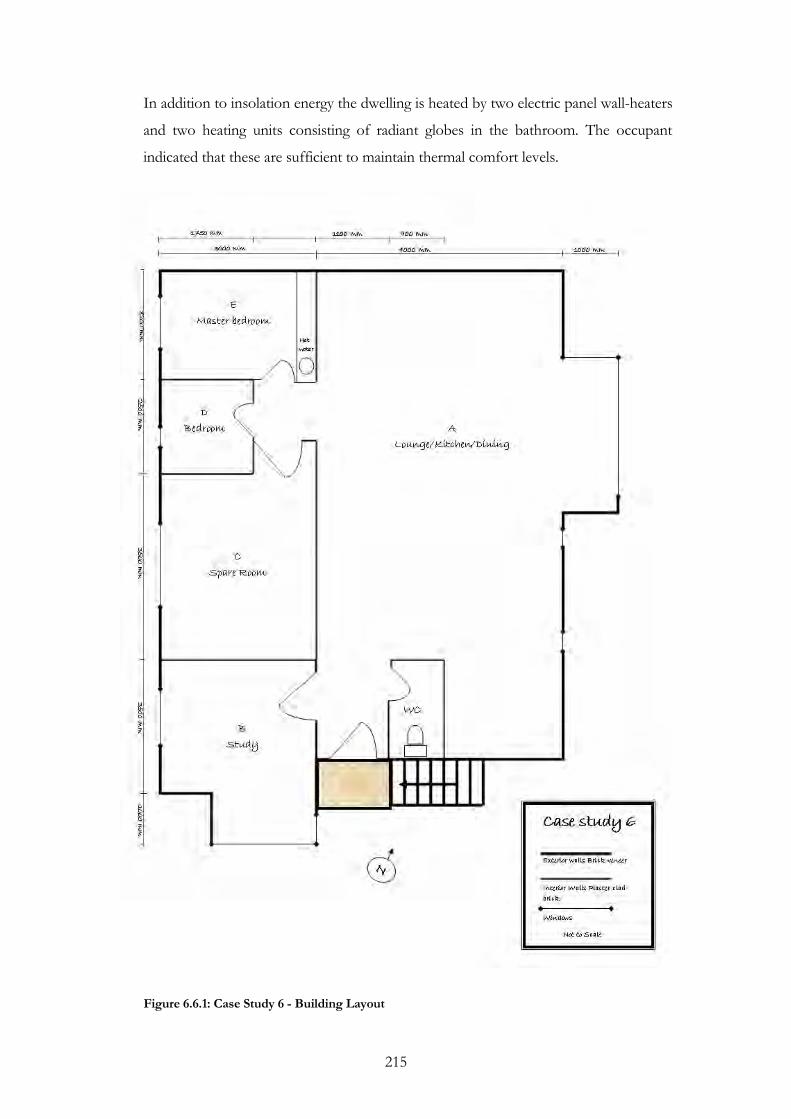
215
In addition to insolation energy the dwelling is heated by two electric panel wall-heaters
and two heating units consisting of radiant globes in the bathroom. The occupant
indicated that these are sufficient to maintain thermal comfort levels.
Figure 6.6.1: Case Study 6 - Building Layout
216
The dwelling is occupied by a female in her mid 60s who as lived in the building since
2004 and has been living previously in Hobart for over 10 years. She has had suitable
time to acclimatise to Hobart. The occupant indicated that she is thermally comfortable
in the building, and that she prefers to dress heavily to achieve comfort during cooler
periods rather than turning up the electric heaters.
The building is unoccupied during the day time on week days. Observation of the
occupant and her behavior within the building indicated that she predominantly keeps
all internal doors closed, and mostly uses the central living space of the building.
6.6.2. Data
6.6.2.1. Spring 2006
A LogTag data logger was placed in the central living space of the building from 12
October, 2006 until 4 January, 2007, taking air temperature measurements at 15 minute
intervals. Recorded temperatures ranged from 12.3 °C to 29.9°C, with an average air
temperature of 20.6°C. Temperatures peaked above 26.5°C on three occasions, and
maximum temperatures occurred on the afternoon of 10 December, and minimum
temperatures occurred in the late morning of 16 November. There is variation in the
range of daily air temperature swings inside the dwelling, ranging from 1°C to as much
as 5°C. This indicates that the internal environment of the building is either largely
determined by occupant control or dependent on the external environment. As this
building contains appropriate thermoregulating thermal mass and is well insulated, it is
evident that the occupant utilises heating and cooling devices to alter the thermal
environment of the building.
The spring night-time study of this house took place on the evening of 12 October,
2006, running from 7:00pm until 9:30pm when the occupant went to bed. The internal
data logger recorded temperatures reflected external temperatures, starting at 29.9°C
and steadily declining to 25.8°C (see Figure 6.6.2). The external data logger recorded
steadily declining temperature starting at 28.5°C to 23.0°C (see Figure 6.6.3). Outdoor
temperatures recorded for Hobart by the Bureau of Meteorology remained above 20°C
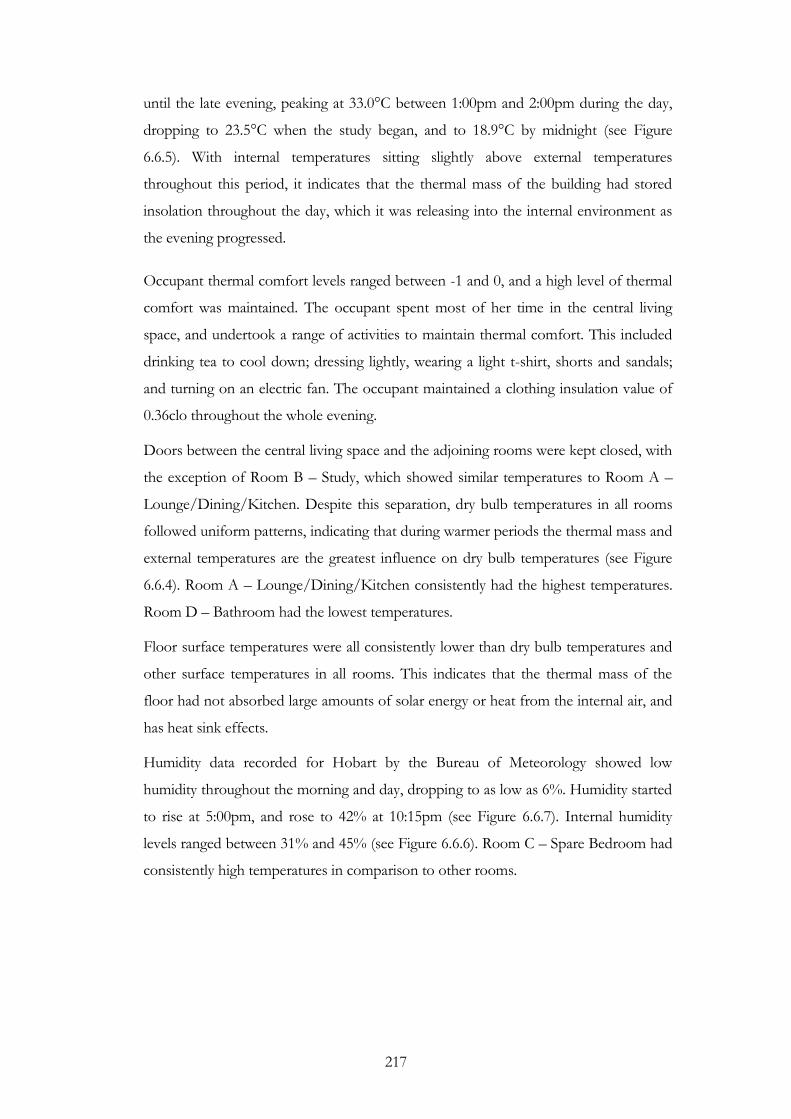
217
until the late evening, peaking at 33.0°C between 1:00pm and 2:00pm during the day,
dropping to 23.5°C when the study began, and to 18.9°C by midnight (see Figure
6.6.5). With internal temperatures sitting slightly above external temperatures
throughout this period, it indicates that the thermal mass of the building had stored
insolation throughout the day, which it was releasing into the internal environment as
the evening progressed.
Occupant thermal comfort levels ranged between -1 and 0, and a high level of thermal
comfort was maintained. The occupant spent most of her time in the central living
space, and undertook a range of activities to maintain thermal comfort. This included
drinking tea to cool down; dressing lightly, wearing a light t-shirt, shorts and sandals;
and turning on an electric fan. The occupant maintained a clothing insulation value of
0.36clo throughout the whole evening.
Doors between the central living space and the adjoining rooms were kept closed, with
the exception of Room B – Study, which showed similar temperatures to Room A –
Lounge/Dining/Kitchen. Despite this separation, dry bulb temperatures in all rooms
followed uniform patterns, indicating that during warmer periods the thermal mass and
external temperatures are the greatest influence on dry bulb temperatures (see Figure
6.6.4). Room A – Lounge/Dining/Kitchen consistently had the highest temperatures.
Room D – Bathroom had the lowest temperatures.
Floor surface temperatures were all consistently lower than dry bulb temperatures and
other surface temperatures in all rooms. This indicates that the thermal mass of the
floor had not absorbed large amounts of solar energy or heat from the internal air, and
has heat sink effects.
Humidity data recorded for Hobart by the Bureau of Meteorology showed low
humidity throughout the morning and day, dropping to as low as 6%. Humidity started
to rise at 5:00pm, and rose to 42% at 10:15pm (see Figure 6.6.7). Internal humidity
levels ranged between 31% and 45% (see Figure 6.6.6). Room C – Spare Bedroom had
consistently high temperatures in comparison to other rooms.

218
23
24
25
26
27
28
29
30
31Te
mpe
ratu
re (
C)
Time
Spring Study - Internal Data Logger
Figure 6.6.2: Spring Study - Internal Data Logger
20
21
22
23
24
25
26
27
28
29
Tem
pera
ture
( C
)
Time
Spring Study - External Data Logger
Figure 6.6.3: Spring Study - External Data Logger

219
26.0
26.5
27.0
27.5
28.0
28.5
29.0
29.5
30.0
7:00 7:30 8:00 8:30 9:00 9:30
Tem
pera
ture
(°C
)
Time
Dry Bulb Temperature
Room A -Lounge/Dining/KitchenRoom B - Study
Room C - Spare Bedroom
Room D - Bathroom
Room E - Master Bedroom
Figure 6.6.4: Dry Bulb Temperatures by Room
0
5
10
15
20
25
30
35
Tem
pera
ture
(°C)
Time
Hobart 12/10/2006 Air Temp (°C)
Figure 6.6.5: Weather Station Temperature Data 12/10/2006 (BOM, 2010e)
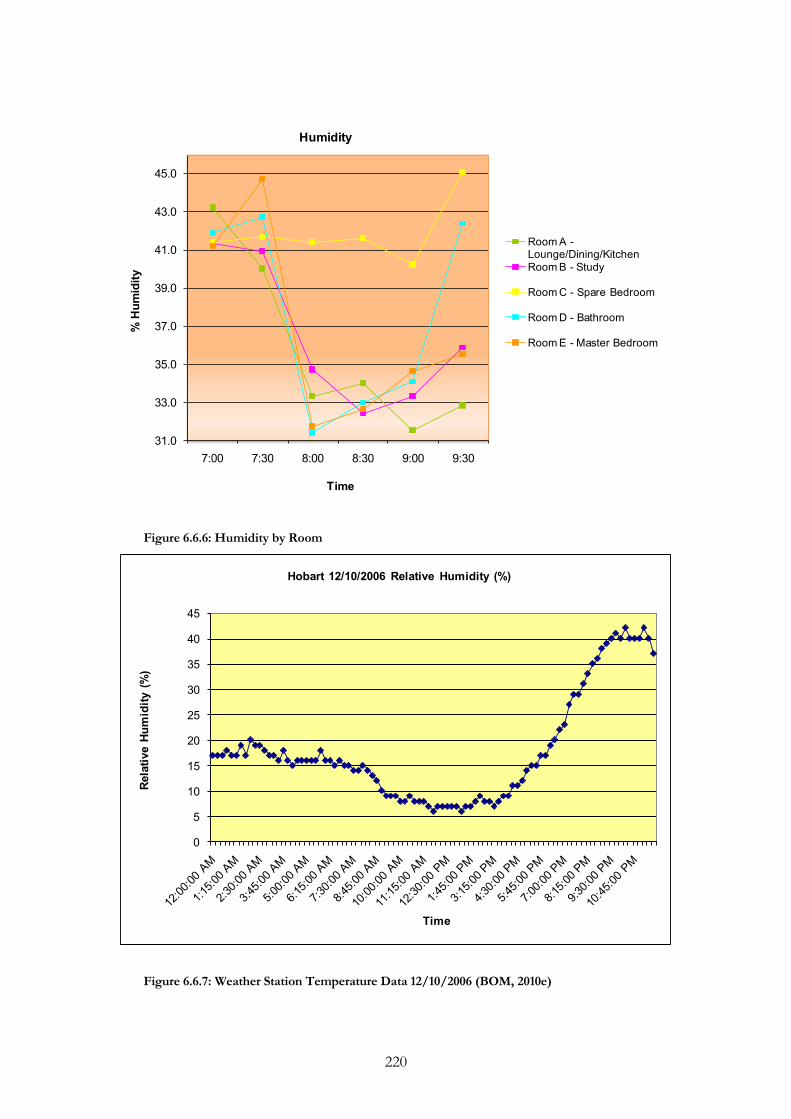
220
31.0
33.0
35.0
37.0
39.0
41.0
43.0
45.0
7:00 7:30 8:00 8:30 9:00 9:30
% H
umid
ity
Time
Humidity
Room A -Lounge/Dining/KitchenRoom B - Study
Room C - Spare Bedroom
Room D - Bathroom
Room E - Master Bedroom
Figure 6.6.6: Humidity by Room
0
5
10
15
20
25
30
35
40
45
Rela
tive
Hum
idity
(%)
Time
Hobart 12/10/2006 Relative Humidity (%)
Figure 6.6.7: Weather Station Temperature Data 12/10/2006 (BOM, 2010e)

221
6.6.2.2. Winter 2007
A LogTag data logger was placed in the central living space of the building from 27
May, 2006 until 19 August, 2006, taking air temperature measurements at 15 minute
intervals. Recorded temperatures ranged from 14.7°C to 25.2°C, with an average air
temperature of 18.3 °C. Maximum temperatures occurred in the late evening of 28 July.
Minimum temperatures occurred during a period when the building was unoccupied
from 14 until 17 July. Night and day time temperatures were lower during this period,
indicating that temperature gains during this period were as a result of the electric
heaters and not insolation.
The house features large daily air temperature swings of as much as 10°C, which is
indicative of a building that is unoccupied during the day and requires significant
energy input in the evening.
6.6.2.3. Autumn 2007
The autumn night time study of this house took place on the evening of 27 March,
running from 8:00pm until 10:00pm when the occupants went to bed. The internal
data logger recorded a high of 22.3°C and a low of 22.0°C, but sat on 22.1°C for most
of the evening, indicating stable internal temperatures (see Figure 6.6.8). The external
data logger recorded steadily declining temperatures ranging from 17.7°C to 15.8°C
(see Figure 6.6.9). Outdoor temperatures recorded for Hobart by the Bureau of
Meteorology recorded temperatures dropping below 10°C in the morning but rising to
peak at 20.3°C during the day. Temperatures dropped to 15.6°C when the study began,
and to 14.3°C by midnight (see Figure 6.6.11).
Occupant thermal comfort levels ranged between -1 and 1, and thermal comfort was
maintained throughout the evening. The occupant noted that the environment was
warm earlier in the evening, but always remained thermally comfortable. The occupant
spent most of her time in the central living space. Clothing insulation was light with a
rating of 0.44clo, and was not adjusted during the evening.
Room A – Lounge/Dining/Kitchen – the central living space – maintained the highest
temperatures during this period, and Room D – Bathroom remained consistently cool.
Dry bulb temperatures were consistently higher than surface temperatures, and floor
surface temperatures were consistently the lowest surface temperature in all rooms.
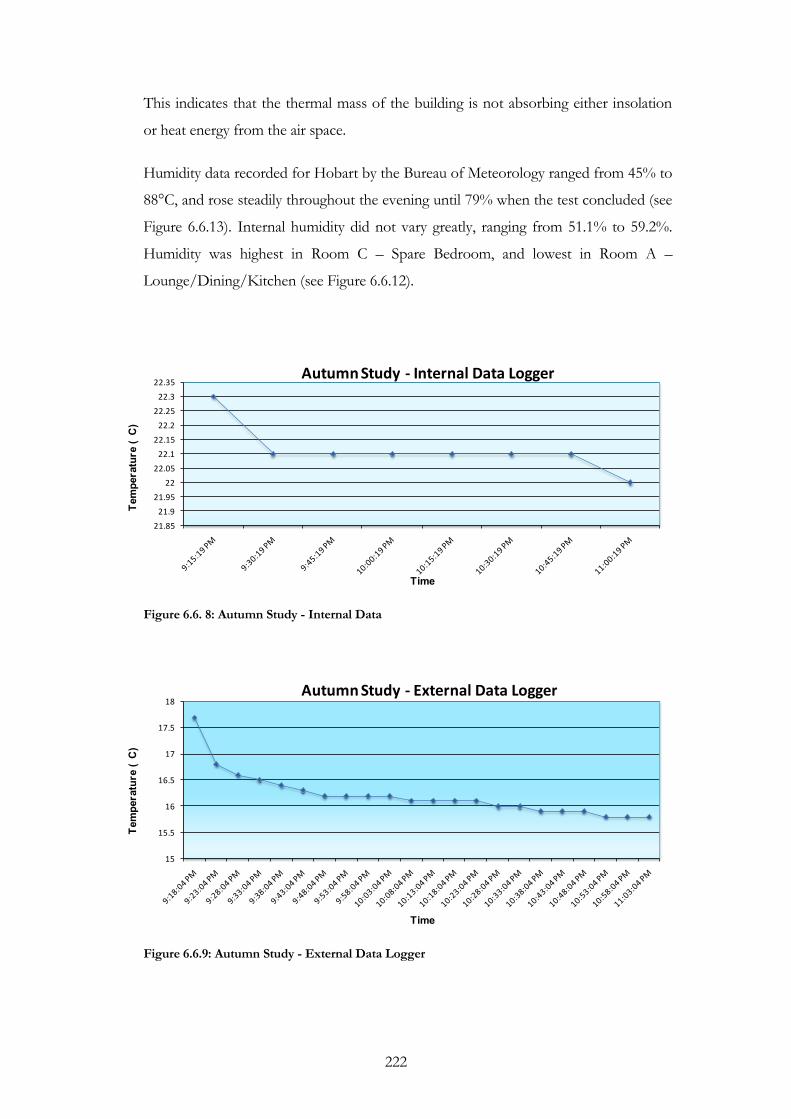
222
This indicates that the thermal mass of the building is not absorbing either insolation
or heat energy from the air space.
Humidity data recorded for Hobart by the Bureau of Meteorology ranged from 45% to
88°C, and rose steadily throughout the evening until 79% when the test concluded (see
Figure 6.6.13). Internal humidity did not vary greatly, ranging from 51.1% to 59.2%.
Humidity was highest in Room C – Spare Bedroom, and lowest in Room A –
Lounge/Dining/Kitchen (see Figure 6.6.12).
21.85
21.9
21.95
22
22.05
22.1
22.15
22.2
22.25
22.3
22.35
Tem
pera
ture
( C
)
Time
Autumn Study - Internal Data Logger
Figure 6.6. 8: Autumn Study - Internal Data
15
15.5
16
16.5
17
17.5
18
Tem
pera
ture
( C
)
Time
Autumn Study - External Data Logger
Figure 6.6.9: Autumn Study - External Data Logger
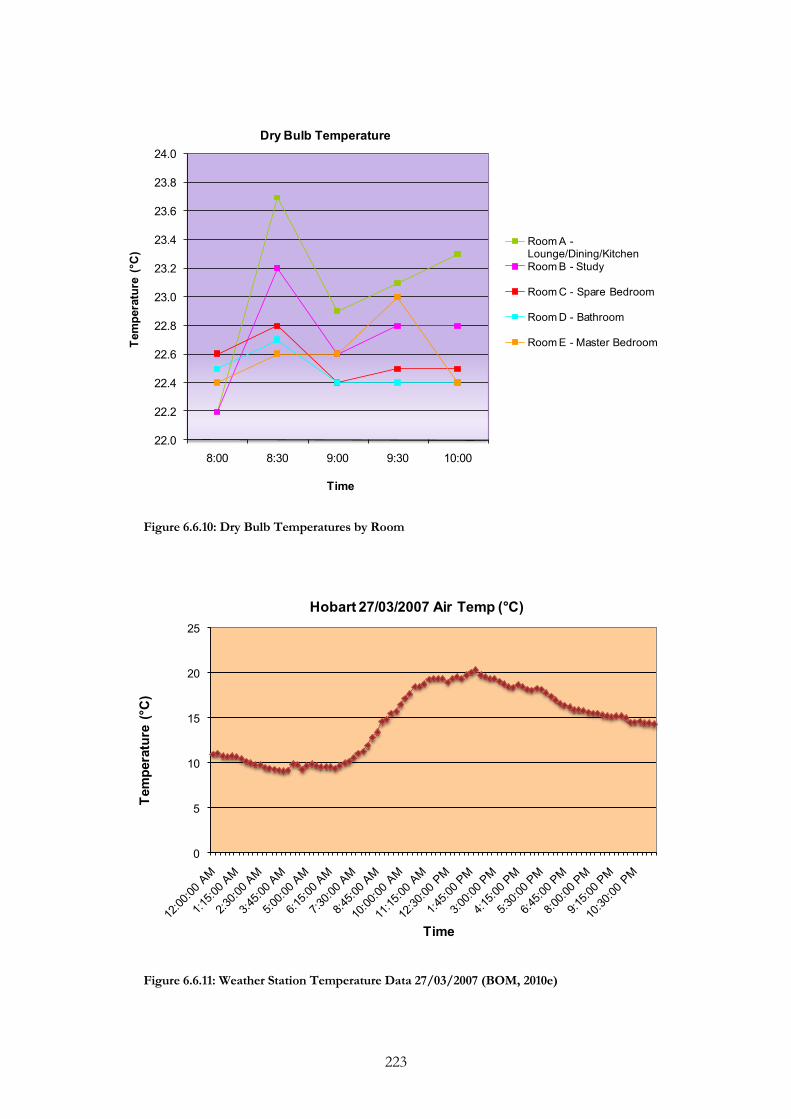
223
22.0
22.2
22.4
22.6
22.8
23.0
23.2
23.4
23.6
23.8
24.0
8:00 8:30 9:00 9:30 10:00
Tem
pera
ture
(°C
)
Time
Dry Bulb Temperature
Room A -Lounge/Dining/KitchenRoom B - Study
Room C - Spare Bedroom
Room D - Bathroom
Room E - Master Bedroom
Figure 6.6.10: Dry Bulb Temperatures by Room
0
5
10
15
20
25
Tem
pera
ture
(°C
)
Time
Hobart 27/03/2007 Air Temp (°C)
Figure 6.6.11: Weather Station Temperature Data 27/03/2007 (BOM, 2010e)
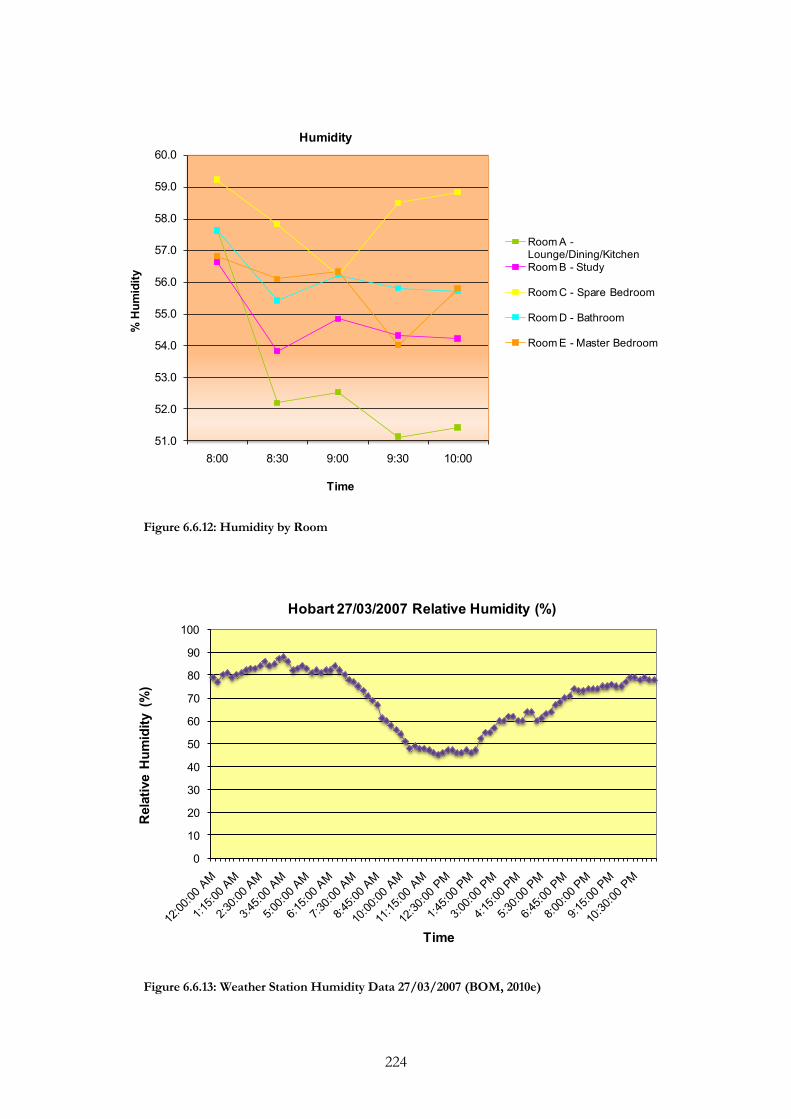
224
51.0
52.0
53.0
54.0
55.0
56.0
57.0
58.0
59.0
60.0
8:00 8:30 9:00 9:30 10:00
% H
umid
ity
Time
Humidity
Room A -Lounge/Dining/KitchenRoom B - Study
Room C - Spare Bedroom
Room D - Bathroom
Room E - Master Bedroom
Figure 6.6.12: Humidity by Room
0
10
20
30
40
50
60
70
80
90
100
Rel
ativ
e H
umid
ity (
%)
Time
Hobart 27/03/2007 Relative Humidity (%)
Figure 6.6.13: Weather Station Humidity Data 27/03/2007 (BOM, 2010e)
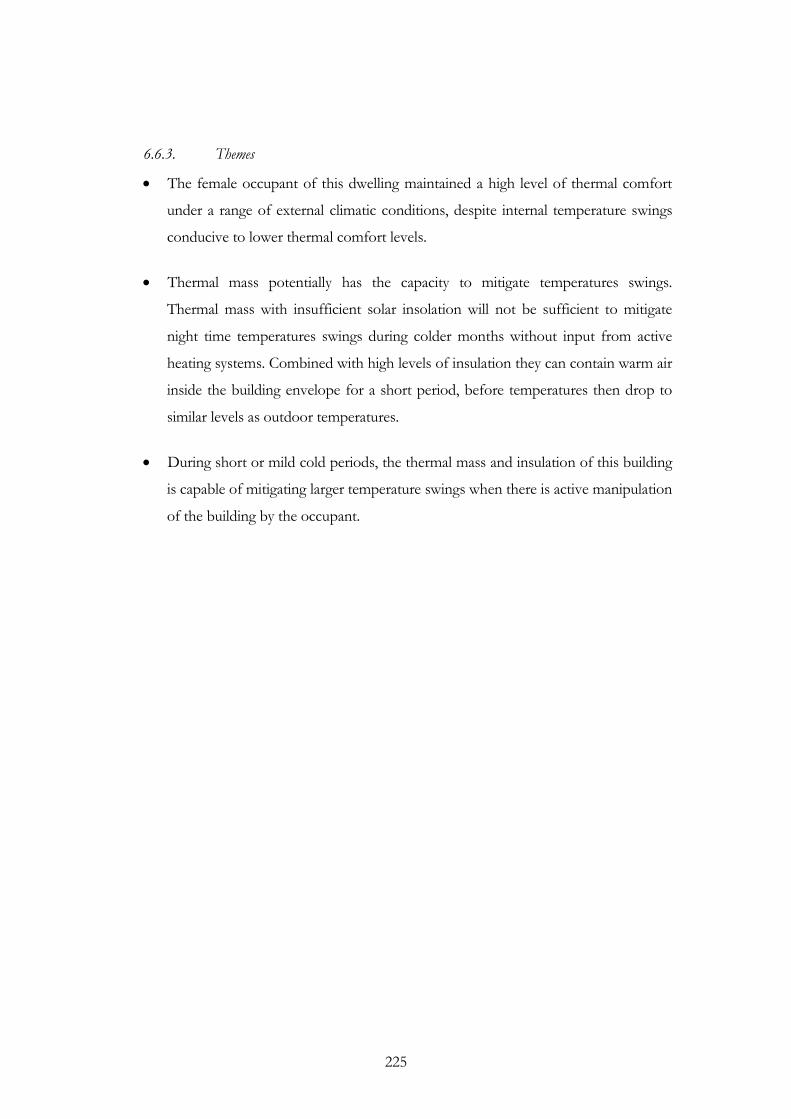
225
6.6.3. Themes
The female occupant of this dwelling maintained a high level of thermal comfort
under a range of external climatic conditions, despite internal temperature swings
conducive to lower thermal comfort levels.
Thermal mass potentially has the capacity to mitigate temperatures swings.
Thermal mass with insufficient solar insolation will not be sufficient to mitigate
night time temperatures swings during colder months without input from active
heating systems. Combined with high levels of insulation they can contain warm air
inside the building envelope for a short period, before temperatures then drop to
similar levels as outdoor temperatures.
During short or mild cold periods, the thermal mass and insulation of this building
is capable of mitigating larger temperature swings when there is active manipulation
of the building by the occupant.

226
6.7. Case Study 7 – A Medium Sized Modern Three Storey Concrete
Block Dwelling
6.7.1. Introduction
This building sits on the lower slopes of Mount Wellington to the west of Hobart, on
an east facing slope, at a latitude of -42.90. Its elevated location of approximately 125m
and exposed location mean that it is potentially exposed to increased weather events,
rainfall, and wind.
The building is a detached three storey modern dwelling with an eastern aspect looking
over Hobart. The building is medium sized, with top two storeys each having an area
of approximately 45m2, and the bottom storey having an area of approximately 25m2.
The building is insulated concrete block, with plaster lined interior on the top two
storeys and painted brick interior on the lower storey, with a sloping sheet roof. The
slope of the mountain is such that the street that services the building is level with the
roof, yet the entrance to building is on the middle storey. The top storey of the
building has sleeping and an ablution area, the middle storey has a central living area,
and the lower storey has an open planned study, gym and recreation room.
Internal walls are brick and have a thickness of 12cm, and the floors on the middle and
top stories are concrete pads with 15mm wood on the surface. As a result, the building
has a high volume of thermal mass inside the building envelope, particularly in
comparison to brick veneer or timber framed buildings. This internal thermal mass is
not directly exposed to insolation or the internal air space, as it is insulated by plaster or
wood, reducing its effectiveness as a thermoregulator.
The middle storey features an open planned central living space with a kitchen and
living area (see Figure 6.7.1). Large windows give views to the south and east, and a
window over the kitchen sink opens to the hillside. A stairway to the upper and lower
stories runs along the north side of the building, and there are no windows on this side
except for a small window in the toilet, which reduces insolation. The main door to the
house opens from the street side on the west, and there is a balcony on the eastern side
of the building, overlooking the city.
227
The top storey features two bedrooms and a bathroom (see Figure 6.7.2). The master
bedroom has eastern views, is semi-open to the stairwell with no door, and has a
wooden covering over the concrete floor. The secondary bedroom is on the south east
corner of the building. Unlike the master bedroom it is separated from the stairwell by
a door that is mostly kept closed, and is carpeted. The bathroom is tiled and has a
skylight. The lower storey is a single multipurpose room with glass sliding doors on the
eastern side at ground level. The floor is an insulated concrete slab with carpet and the
internal walls are covered with plasterboard.

228
Figure 6.7.1: Case Study 7 – Middle Storey

229
Figure 6.7.2: Case Study 7 - Top Storey
230
All larger windows are double-glazed and have full length curtains with no pelmets.
These windows have an insulation value of R0.42. Small windows are double-glazed
with no curtains and have an insulation value of R0.32. External walls have an
insulation rating of R1.6. The metal sheet roof with bulk insulation and reflective foil
has an insulation rating of R4.1 in summer and R3.0 in winter. The skylight in the
bathroom has an insulation value of R0.16. The primary heating system is a wood fire
in the central living space on the middle storey. Small portable electric bar heaters are
located on the upper and lower storeys.
The building is occupied by a male in his mid 50s who frequently works from home
during business hours, meaning the building is generally occupied. He has lived in
Hobart for over 15 years, and has occupied this building for two years prior to the
commencement of the study. He considers the building to be thermally comfortable,
and utilises the wood fire only during winter months. He dresses moderately, altering
his clothing to adjust to the thermal environment rather than increasing internal
temperatures. During the summer he indicated that he closes curtains to reduce
insolation on hot days, and the building remains thermally comfortable.
Thermoregulation by the internal bricks would assist in maintaining suitable
temperatures during these periods. The occupant occupies different levels of the
building as a method of adjusting to the thermal environment. The lower level is
cooler, and suitable for occupancy on hot days. Likewise heat collects in the master
bedroom that sits near the stairwell on the top storey, and the occupant utlisises this
room more frequently during cooler months.
6.7.2. Data
LogTag data loggers were placed in the central living space on the middle storey of the
building from 11 June, 2008 until 1 September, 2008, taking air temperature
measurements at 15 minute intervals. Recorded temperatures ranged from 7.9°C to
22.7°C, with an average air temperature of 13.9°C. Maximum temperatures occurred
on the evening of 2 July, and minimum temperatures occurred in mid morning on 22
July. The middle storey features large daily air temperature swings of as much as 14°C
which is potentially due to energy losses to the upper storey.

231
6.7.3. Themes
Thermal mass insulated from the internal environment by materials such as
plaster board or carpet is less effective at thermoregulating temperature swings
in the building.
Thermal mass not exposed to insolation can be storage for heat from internal
heat sources, and is particularly effective in storing heat from wood fires and
other radiant heaters.
Thermal mass not exposed to insolation can still be effective in
thermoregulation to increase thermal comfort during warmer periods, drawing
excess energy from the internal environment of the building.
Clothing adjustment is a highly effective method of adaptation to a thermal
environment.
Variation in temperature between rooms can allow occupants to resided in
different rooms as external environments vary.
Large areas of glazing are an identifiable method of energy loss from the
building, even if they are double-glazed.

232
6.8. Case Study 8 – Government Housing Estate Incorporating
Sustainability Principles into its Design
6.8.1. Introduction
The Walford Terraces are an architect designed government housing estate
incorporating principles of sustainability including: passive design; water sensitive
urban design; solar electricity generation, and; environmentally sustainable building
materials. They were developed as an educational tool to assist in promoting
sustainable building design in government buildings and within the private sector, and
have since been utilised by government and industry as a teaching tool through guided
tours. Relevant to the thermal efficiency focus of this study, the buildings were
designed:
to maximise insolation through north facing orientation;
utilise natural ventilation for cooling and air changing;
with high levels of insulation to reduce heat transfer across the building envelope;
with appropriately located thermal mass in the form of concrete slabs and coloured masonry walls; and
to include Trombe Walls, to further increase insolation, and allow control of the release of collected heat into the building envelope;
The Walford terraces are located on the northern side of the Hobart central business
district, on a north east facing slope. The have a latitude of -42.88 and an elevation of
approximately 25m. The area is urban and features a mix of low and medium density
housing and some businesses. The buildings all face north east, and have access to
suitable insolation levels.
A range of building types are included in the Walford terraces, including two storey
semi-detached units, and multi storey complexes where each unit occupies a single
storey. Three units were selected for this study:
Building A - a unit on the lower storey of a two storey complex;
233
Building B – a unit on the upper storey of a two storey complex; and
Building C – a two storey semi-detached unit.
6.8.2. Building A – Lower Storey Building
Building A is on the lower storey of a two storey building. It is semi-detached, and
joins to the adjacent building on the south east side. External walls are double brick,
and internal colours are selected to increase solar gain. The floor is an insulated
concrete slab, however the living room is carpeted, reducing solar gain.
The dwelling features an open plan central living space on the north east side, including
a kitchen, dining room area and living room. This space opens out onto a patio area
through glass doors. A hallway from the central living space leads to two bedrooms on
the eastern side, and a bathroom and laundry on the western side. The building is
appropriately zoned, with bedrooms on the east, service areas on the south west, and
tiled living areas to the north. The kitchen area features dark tiles that increase solar
gain. The living room is carpeted, which reduces solar gain, however there are Trombe
walls in the window boxes below each window. These Trombe walls have dark bricks
to absorb insolation behind double-glazing, and lids on the window boxes to allow the
occupant to release this energy into the building envelope.
External walls are double brick with batts and reflective insulation, and have an
insulation value of R1.6. All windows are double-glazed, with an insulation value of
R0.34. The windows in the living room are insulated with thin curtains, and have an
insulation value of R0.36.
The dwelling is high in thermal mass, located in the floor slab, the walls, and overhead
in the slab of the building above. The slab is carpeted in the living room, hallway, and
both bedrooms, but tiled in the bathroom and kitchen/dining area. In addition to
heating through solar gain, the occupant uses electric panel heaters to achieve
temperatures appropriate for thermal comfort.
The occupant made detailed notes on her thermal operation of the building, including
the use of heating and ventilation systems. The occupant also has a high tolerance for
low temperatures, and gives higher priority to ventilation. Resultantly, the occupant
generally leaves the bathroom window open, frequently has the door to the patio open,
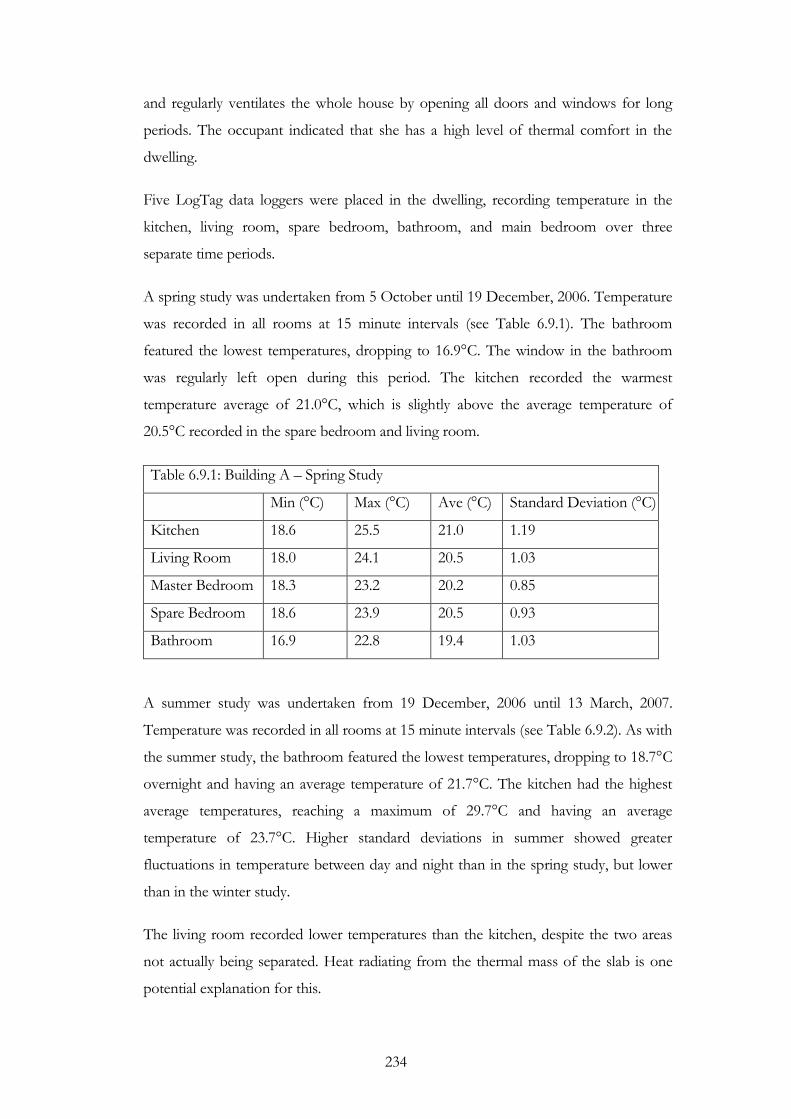
234
and regularly ventilates the whole house by opening all doors and windows for long
periods. The occupant indicated that she has a high level of thermal comfort in the
dwelling.
Five LogTag data loggers were placed in the dwelling, recording temperature in the
kitchen, living room, spare bedroom, bathroom, and main bedroom over three
separate time periods.
A spring study was undertaken from 5 October until 19 December, 2006. Temperature
was recorded in all rooms at 15 minute intervals (see Table 6.9.1). The bathroom
featured the lowest temperatures, dropping to 16.9°C. The window in the bathroom
was regularly left open during this period. The kitchen recorded the warmest
temperature average of 21.0°C, which is slightly above the average temperature of
20.5°C recorded in the spare bedroom and living room.
Table 6.9.1: Building A – Spring Study
Min (°C) Max (°C) Ave (°C) Standard Deviation (°C)
Kitchen 18.6 25.5 21.0 1.19
Living Room 18.0 24.1 20.5 1.03
Master Bedroom 18.3 23.2 20.2 0.85
Spare Bedroom 18.6 23.9 20.5 0.93
Bathroom 16.9 22.8 19.4 1.03
A summer study was undertaken from 19 December, 2006 until 13 March, 2007.
Temperature was recorded in all rooms at 15 minute intervals (see Table 6.9.2). As with
the summer study, the bathroom featured the lowest temperatures, dropping to 18.7°C
overnight and having an average temperature of 21.7°C. The kitchen had the highest
average temperatures, reaching a maximum of 29.7°C and having an average
temperature of 23.7°C. Higher standard deviations in summer showed greater
fluctuations in temperature between day and night than in the spring study, but lower
than in the winter study.
The living room recorded lower temperatures than the kitchen, despite the two areas
not actually being separated. Heat radiating from the thermal mass of the slab is one
potential explanation for this.

235
Table 6.9.2: Building A – Summer Study
Min (°C) Max (°C) Ave (°C) Standard Deviation (°C)
Kitchen 20.9 29.7 23.7 1.37
Living Room 19.4 27.5 22.5 1.29
Master Bedroom 19.6 26.5 22.0 1.20
Spare Bedroom 19.8 27.2 22.3 1.22
Bathroom 18.7 26.2 21.7 1.30
A winter study was undertaken from 21 June until 13 September, 2007. Temperature
was recorded in four rooms at 15 minute intervals (see table 6.9.3). The bathroom once
again featured the lowest maximum, minimum, and average temperatures. The
bathroom also had the lowest standard deviation, indicating smaller fluctuations in
temperature and that it was the most affected by external temperatures.
Maximum temperatures in all rooms except the bathroom exceeded 25°C. This
indicates that the electric heating systems were employed during this period. High
standard deviations indicate that the building is less suited to mitigating the effects of
cold outdoor temperatures than hot outdoor temperatures. Outdoor winter
temperatures are however further from thermal comfort temperatures than summer.
Table 6.9.3: Building A – Winter Study
Min (°C) Max (°C) Ave (°C) Standard Deviation (°C)
Living Room 16.7 26.1 20.5 1.68
Master Bedroom 16.7 25.9 19.9 1.47
Spare Bedroom 17.0 25.2 20.4 1.50
Bathroom 16.0 22.5 18.5 1.21
The kitchen showed the highest temperature peaks, highest minimum temperature and
average temperature levels. This area of the dwelling has the highest insolation levels,
and the most accessible thermal mass, due to the dark coloured tiles over the slab.
Resultantly it can be determined that this thermal mass exposed to insolation and
coloured to effectively capture this incoming solar radiation can:
thermoregulate to mitigate temperature troughs during cooler periods and help to create a more thermally comfortable environment; and
236
create immediate increases in temperature.
The kitchen did however feature higher standard deviations than other rooms,
indicating that thermal mass did not store thermal energy for long periods, heating the
room immediately, rather than storing energy for when the room cools.
6.8.3. Building B
Building B sits directly above Building A, making it the top storey of a two storey
building. It is semi-detached, and joins to the adjacent building on the south east side.
External walls are brick veneer, and the floor is a concrete slab. The majority of the
house is carpeted, reducing solar gain.
The dwelling features an open-planned kitchen and living area on the north east side.
The kitchen opens to a small balcony on the north side. A hallway from the central
living space runs along the south west side of the building, leading to two bedrooms, a
bathroom, and the entranceway. The building is appropriately zoned, with bedrooms
on the east, the bathroom on the south, and living spaces on the north and northeast.
Trombe walls in the window boxes of the central living space help to increase solar
gain, as the living room is carpeted. These Trombe walls have dark bricks to absorb
insolation behind double-glazing, and lids on the window boxes to allow the occupant
to release this energy into the building envelope.
External walls are brick veneer, with plasterboard interior, batts and reflective
insulation, and have an insulation value of R2.46. All windows are double-glazed, with
an insulation value of R0.34. The windows in the living room are insulated with thin
curtains, and have an insulation value of R0.36.
The dwelling has a medium amount of thermal mass, located in the floor slab, and the
external walls. The slab is carpeted in the living room, hallway, and both bedrooms, but
is tiled in the bathroom and kitchen/dining area. In addition to heating through solar
gain, the dwelling features electric panel heaters to help achieve temperatures
appropriate for thermal comfort.
The occupant of this dwelling is a female in her 50s with limited mobility. She has lived
in Hobart long enough to acclimatise to local climatic conditions. Lower levels of
physical activity can impact upon thermal comfort levels, and the occupant alters
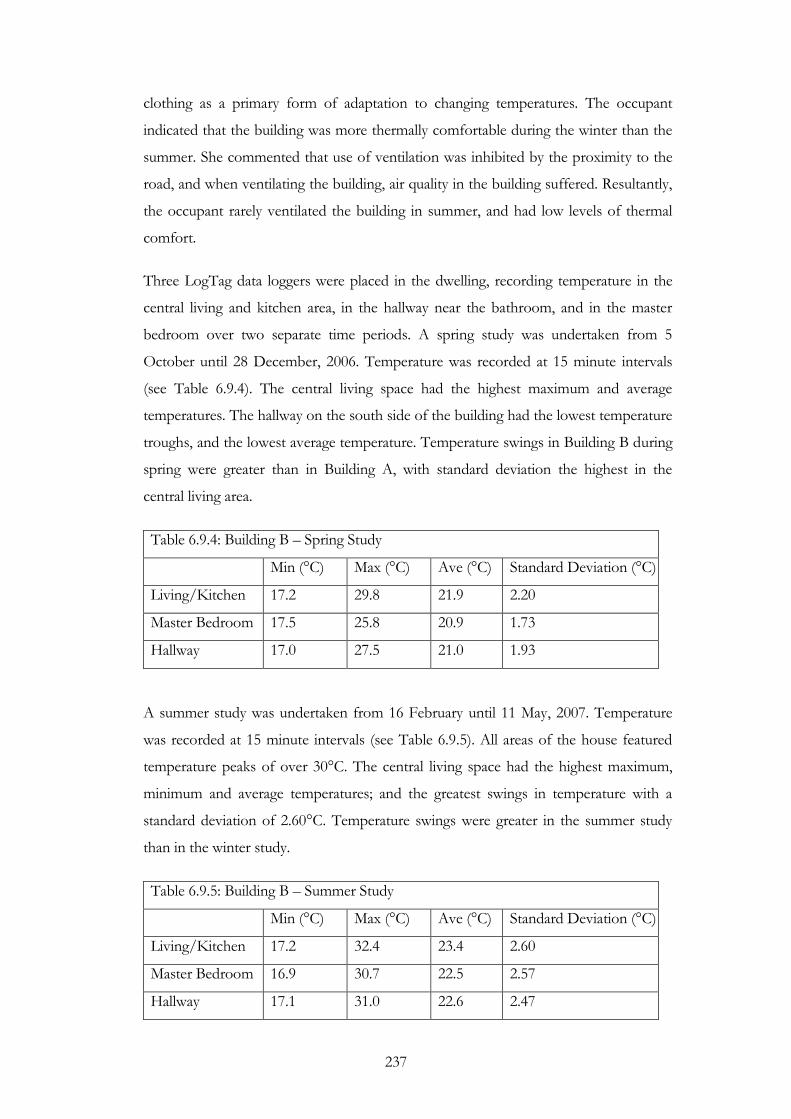
237
clothing as a primary form of adaptation to changing temperatures. The occupant
indicated that the building was more thermally comfortable during the winter than the
summer. She commented that use of ventilation was inhibited by the proximity to the
road, and when ventilating the building, air quality in the building suffered. Resultantly,
the occupant rarely ventilated the building in summer, and had low levels of thermal
comfort.
Three LogTag data loggers were placed in the dwelling, recording temperature in the
central living and kitchen area, in the hallway near the bathroom, and in the master
bedroom over two separate time periods. A spring study was undertaken from 5
October until 28 December, 2006. Temperature was recorded at 15 minute intervals
(see Table 6.9.4). The central living space had the highest maximum and average
temperatures. The hallway on the south side of the building had the lowest temperature
troughs, and the lowest average temperature. Temperature swings in Building B during
spring were greater than in Building A, with standard deviation the highest in the
central living area.
Table 6.9.4: Building B – Spring Study
Min (°C) Max (°C) Ave (°C) Standard Deviation (°C)
Living/Kitchen 17.2 29.8 21.9 2.20
Master Bedroom 17.5 25.8 20.9 1.73
Hallway 17.0 27.5 21.0 1.93
A summer study was undertaken from 16 February until 11 May, 2007. Temperature
was recorded at 15 minute intervals (see Table 6.9.5). All areas of the house featured
temperature peaks of over 30°C. The central living space had the highest maximum,
minimum and average temperatures; and the greatest swings in temperature with a
standard deviation of 2.60°C. Temperature swings were greater in the summer study
than in the winter study.
Table 6.9.5: Building B – Summer Study
Min (°C) Max (°C) Ave (°C) Standard Deviation (°C)
Living/Kitchen 17.2 32.4 23.4 2.60
Master Bedroom 16.9 30.7 22.5 2.57
Hallway 17.1 31.0 22.6 2.47
238
As with Building A, overall the central living area showed: the highest temperature
peaks; highest minimum temperatures, and; average temperatures indicating that
insolation is an important tool for warming buildings during cooler months but also
needs to be prevented from providing unnecessary warmth during warmer months.
6.8.4. Building C
Building C is a two storey building that sits on the southern side of the site, giving it a
slightly higher altitude. It is semi-detached, and joins to the adjacent building on the
north west side. External walls are double brick on the lower half of the building, and
brick veneer on the upper half. The building sits on a concrete slab, and another slab
separates the two storeys. All areas of the building except for the kitchen and bathroom
are carpeted, reducing solar gain.
The lower storey features an open planned central living space with a kitchen and a
living area. The living area runs along the north eastern side, and the kitchen sits on the
north west corner of the building. A stairwell rising to the top storey of the building is
on the south western corner of the building. Trombe walls in the window boxes of the
living area help to increase solar gain, as the living room is carpeted. These Trombe
walls have dark bricks to absorb insolation behind double-glazing, and lids on the
window boxes to allow the occupant to release this energy into the building envelope.
The occupant indicated however that he has never opened the lids on the Trombe
walls to allow the heat to enter the living space. The upper storey has two bedrooms on
the north eastern side, and a bathroom on the western side of the building.
External walls on the lower storey are double brick with batts and reflective insulation,
and have an insulation value of R1.6. External walls on the upper storey are brick
veneer, with plasterboard interior, batts and reflective insulation, and have an insulation
value of R2.46. All windows are double-glazed, with an insulation value of R0.34. The
windows in the living room are insulated with thin curtains, and have an insulation
value of R0.36.
The dwelling is high in thermal mass, located in the floor slabs, and the walls (in
particular the internal walls on the lower level). The slabs are carpeted in the living
room and bedrooms, but tiled in the bathroom and kitchen area. In addition to heating
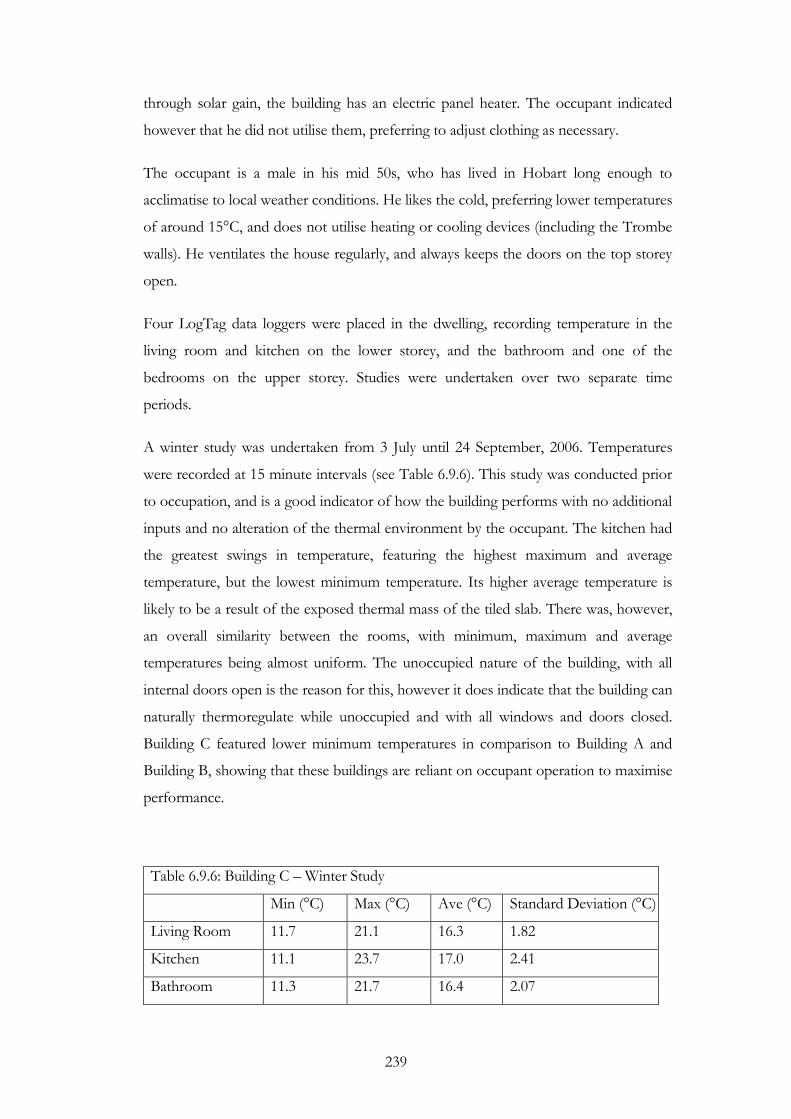
239
through solar gain, the building has an electric panel heater. The occupant indicated
however that he did not utilise them, preferring to adjust clothing as necessary.
The occupant is a male in his mid 50s, who has lived in Hobart long enough to
acclimatise to local weather conditions. He likes the cold, preferring lower temperatures
of around 15°C, and does not utilise heating or cooling devices (including the Trombe
walls). He ventilates the house regularly, and always keeps the doors on the top storey
open.
Four LogTag data loggers were placed in the dwelling, recording temperature in the
living room and kitchen on the lower storey, and the bathroom and one of the
bedrooms on the upper storey. Studies were undertaken over two separate time
periods.
A winter study was undertaken from 3 July until 24 September, 2006. Temperatures
were recorded at 15 minute intervals (see Table 6.9.6). This study was conducted prior
to occupation, and is a good indicator of how the building performs with no additional
inputs and no alteration of the thermal environment by the occupant. The kitchen had
the greatest swings in temperature, featuring the highest maximum and average
temperature, but the lowest minimum temperature. Its higher average temperature is
likely to be a result of the exposed thermal mass of the tiled slab. There was, however,
an overall similarity between the rooms, with minimum, maximum and average
temperatures being almost uniform. The unoccupied nature of the building, with all
internal doors open is the reason for this, however it does indicate that the building can
naturally thermoregulate while unoccupied and with all windows and doors closed.
Building C featured lower minimum temperatures in comparison to Building A and
Building B, showing that these buildings are reliant on occupant operation to maximise
performance.
Table 6.9.6: Building C – Winter Study
Min (°C) Max (°C) Ave (°C) Standard Deviation (°C)
Living Room 11.7 21.1 16.3 1.82
Kitchen 11.1 23.7 17.0 2.41
Bathroom 11.3 21.7 16.4 2.07
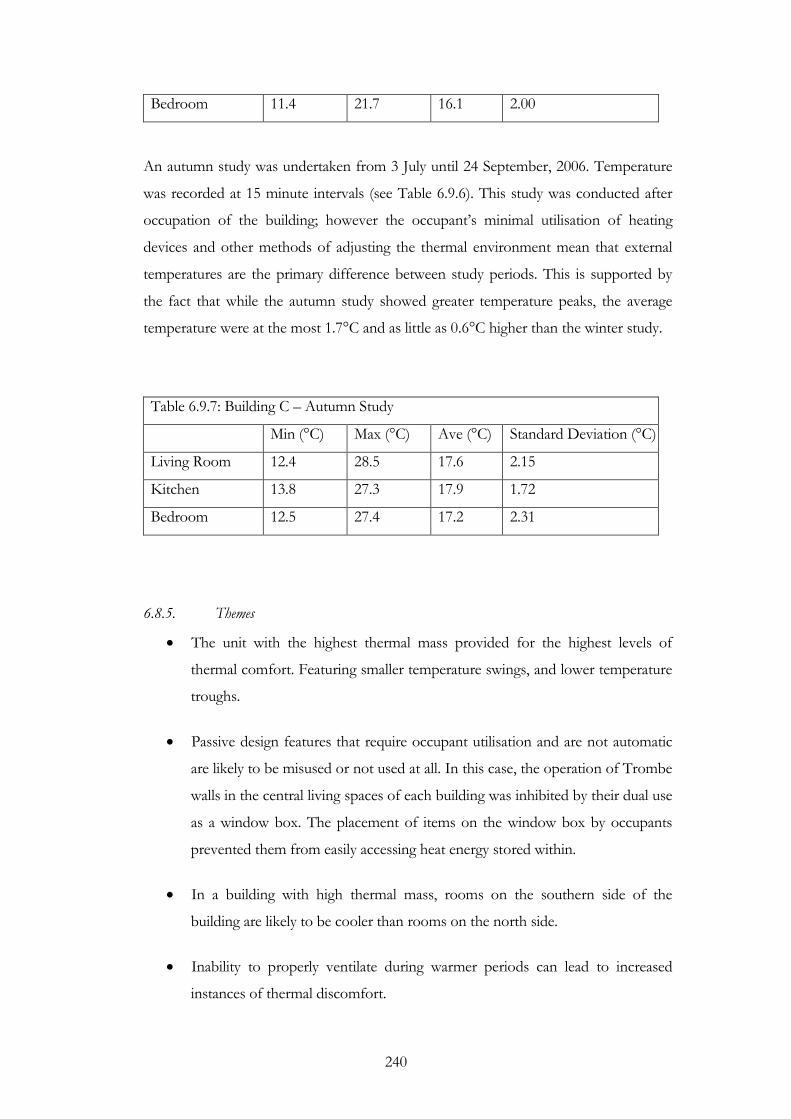
240
Bedroom 11.4 21.7 16.1 2.00
An autumn study was undertaken from 3 July until 24 September, 2006. Temperature
was recorded at 15 minute intervals (see Table 6.9.6). This study was conducted after
occupation of the building; however the occupant‟s minimal utilisation of heating
devices and other methods of adjusting the thermal environment mean that external
temperatures are the primary difference between study periods. This is supported by
the fact that while the autumn study showed greater temperature peaks, the average
temperature were at the most 1.7°C and as little as 0.6°C higher than the winter study.
Table 6.9.7: Building C – Autumn Study
Min (°C) Max (°C) Ave (°C) Standard Deviation (°C)
Living Room 12.4 28.5 17.6 2.15
Kitchen 13.8 27.3 17.9 1.72
Bedroom 12.5 27.4 17.2 2.31
6.8.5. Themes
The unit with the highest thermal mass provided for the highest levels of
thermal comfort. Featuring smaller temperature swings, and lower temperature
troughs.
Passive design features that require occupant utilisation and are not automatic
are likely to be misused or not used at all. In this case, the operation of Trombe
walls in the central living spaces of each building was inhibited by their dual use
as a window box. The placement of items on the window box by occupants
prevented them from easily accessing heat energy stored within.
In a building with high thermal mass, rooms on the southern side of the
building are likely to be cooler than rooms on the north side.
Inability to properly ventilate during warmer periods can lead to increased
instances of thermal discomfort.

241
Insufficient thermal mass can lead to thermal discomfort due to excessive heat
during the summer.
Thermal performance is maximised by appropriate occupant operation of
building passive design features.
6.9. Chapter Summary
This Chapter has presented the results of case studies conducted on residential
buildings and their occupants, examining thermal comfort levels and the
thermoregulatory capacity of the buildings in each study. From the results of each of
these studies were drawn a series of themes. The following chapter will draw together
these themes and use them to address the hypotheses proposed by this thesis.

242
Chapter 7: Discussion and Conclusion
7.1. Research aims and objectives
The first aim of this study was to examine thermoregulation in residential buildings in
relation to thermal mass. The second aim was to examine the impact of thermal mass
on thermal comfort. A number of objectives were undertaken to fulfill these aims
including: comparing the performance of thermal mass across different types of houses
in Tasmania: examining the habits and activities of occupants with regard to thermal
comfort; and determining guidelines for the implementation, placement and type of
thermal mass recommended by architects and housing designers.
Chapter 6 presented the results of a series of case studies examining thermal comfort
levels in residential buildings, and the thermoregulatory properties of their associated
thermal mass. From these studies a series of themes have been formulated. This
chapter will use these themes to address the aims and objectives of the thesis, and then
to accept or reject the hypotheses presented in Chapter 1.
7.2. Research Themes
To fulfill the aims and objectives the case studies gathered detailed information on the
thermoregulatory performance of a range of buildings, thermal comfort levels were
observed, and occupant interaction with the thermal environment and temperature
control was noted. Thematic Analysis allowed the identification of a number of themes
that were applicable to one or more of the case studies. These were amalgamated to
form eleven overarching themes, which can be used in assessing the four hypotheses
posed by this thesis.
7.2.1. Theme 1 – In well insulated buildings, increased volumes of thermal mass will result in
higher thermal comfort levels.
High volumes of thermal mass and comprehensive insulation of a building were
discussed in Chapter 3. This was identified as ideal for producing a thermal
environment conducive to high levels of thermal comfort. The Walford Terraces

243
examined in Case Study 8 (CS 8) had varying levels of thermal mass in well insulated
buildings, within the same large public housing estate. The unit with the most thermal
mass provided: the highest levels of thermal comfort; the smallest temperatures swings,
and; reduced temperature troughs.
Thermal mass has been identified as a building material that is capable of storing
insolation or long-wave radiation, and releasing this energy as air temperatures drop
(Hollo, 1995, Reardon et al., 2005, Reddy et al., 1991, Shaviv et al., 2001b, Tiwari,
1991). Direct gain systems such as thermal storage walls are examples of how thermal
mass coupled with high levels of insulation are effective in improving thermal comfort
levels by thermoregulation. Both of these systems are utilised in CS8. In a direct gain
system insolation penetrating through areas of glazing directly into the inhabited spaces
of the building is stored in thermal mass (Reardon et al., 2005, Smith, 2009). Givoni
(1991) determined that direct gain systems were an effective method of
thermoregulation for thermal comfort, and thermal mass was a main factor affecting
the performance of passive solar heating systems.
7.2.2. Theme 2 – Buildings low in thermal mass heat faster, but are subject to greater
temperature swings
CS 1 and 2 revealed that buildings that are low in thermal mass can heat faster, allowing
greater occupant control over the thermal environment. This is suitable for occupants
who have irregular schedules and need to quickly heat or cool a building to a
temperature suitable for achieving thermal comfort. This type of building, however,
can create lower levels of thermal comfort after periods when the building is not
occupied.
CS 1 also identified that a building with low thermal mass that is also highly insulated
can be effective at achieving high levels of thermal comfort for occupants by reducing
heat exchange across the building envelope. CS 4 showed that a building that is low in
thermal mass and insufficiently insulated will face greater temperature swings,
particularly overnight. Lightweight buildings with low volumes of thermal mass (see CS
1) are suitable for warmer periods if appropriate shading devices are utilised. In
contrast, CS 4 showed lower levels of thermal comfort as thermal mass levels were
lower. This indicated that in order for a building with low thermal mass to perform it
must be coupled with appropriate shading and ventilation mechanisms (Hollo, 1995,
244
Kosny et al., 2001, Reardon et al., 2005, Roaf et al., 2001). CS 2 identified that internal
surfaces such as walls, floors, and ceilings were likely to have lower temperatures than
the airspace in buildings with lower volumes of thermal mass. This is because these
buildings have a diminished capacity to store energy from active heating systems or
insolation, which can lead to reduced thermal comfort levels (Shaviv et al., 2001b,
Tiwari, 1991).
7.2.3. Theme 3 – Insufficient insulation in high thermal mass buildings will reduce thermal
comfort levels
Buildings with high levels of thermal mass, but with insufficient insulation to store
energy within the building envelope, will have a lower thermal performance than
appropriately insulated buildings (Aksoy and Inalli, 2005, Kosny et al., 2001,
Papadopoulos, 2005, Reardon et al., 2005, Schuler et al., 2000, Smith, 2009). In
buildings with insufficient insulation for the internal airspace to contain warm air, and
the internal environment cools too rapidly, the thermal mass will respond by: releasing
stored thermal energy earlier than in a highly insulated building; or will not have
sufficient mass to effectively thermoregulate the internal temperature of the building
(Papadopoulos, 2005, Reddy et al., 1991, Schuler et al., 2000).
CS 3 and CS 5 examined buildings with high volumes of thermal mass but poor
insulation. Thermoregulation occurred (CS 3), but not as successfully as would have
occurred if the building were properly insulated. The thermal mass in CS 5 acted as a
heat sink, drawing energy from the air into the thermal mass of the walls, leaving the air
inside cool (Balaras, 1996, Kosny et al., 2001). As a result, both these buildings featured
low overnight temperatures and cool morning temperatures.
7.2.4. Theme 4 – Even if the passage of air between the internal and external environments
is removed, the processes of convection and conduction will still reduce thermal comfort
levels if insulation is insufficient.
In a low thermal mass building (CS 4) considerable effort had been made to reduce air
flow between the atmosphere inside the building envelope and the outside. Despite this
effort to reduce energy loss, the building lost energy to the outside through processes
of conduction and convection, because of insufficient insulation levels in walls and
ceiling (Ahmed, 1995, Amelar, 2006, Houghton, 1998, Kosny et al., 2001, Reardon et
al., 2005). The installation of more comprehensive and effective insulation either

245
during building construction or as a retrofit will reduce this energy loss and improve
thermal comfort levels (Wrigley, 2005). Chapter 2 identified that Tasmanian houses are
poorly insulated, with as little as 10% of houses having insulation, and in many cases
reflective foil insulation being the only insulation present (Weaver, 2004). Resultantly,
the improvement of the quality and frequency of insulation in homes would be an
appropriate first step in improving the thermal efficiency of many residences in
Tasmania.
Glazing was a cause of energy loss by processes of conduction and convection, even if
windows were double glazed (CS 7). As a result, consideration of the size and
placement of glazing during building design, and insulating curtains and glazing types
should be utilised where possible (Al-Azzawi, 1991). Glazing should be minimised in
areas that are not north facing, where it is not necessary for solar gain, and the use of
skylights should be avoided in favour of other lighting methods where possible (Al-
Azzawi, 1991, Hollo, 1995, Reardon et al., 2005).
7.2.5. Theme 5 – Insufficient insolation with high levels of thermal mass can lead to reduced
thermoregulation and lower temperatures in cooler periods.
To passively heat a building incoming solar energy must be allowed to penetrate the
building envelope during cooler periods. Maximising solar gain was discussed in detail
in Chapter 3 and showed the need for suitable building sites, north facing glazing, and
appropriately located tree plantings. Anderson (1980) identified that thermal mass not
exposed to solar radiation will store around a quarter of the energy of thermal mass
exposed to insolation. Sutton and McGregor (1983) and Roaf et al. (Roaf et al., 2001)
identify that thermal mass not exposed to insolation will be less effective in
thermoregulating the internal environment
CS 6 showed that thermal mass has the capability to mitigate temperature swings.
However, if there is insufficient insolation to heat the thermal mass it can act as an
unwanted heat sink thus removing heat energy from the air and resulting in cooler
temperatures and lower levels of thermal comfort. Energy produced by active heating
systems can heat thermal mass, but in cases with insufficient insolation the thermal
mass will then slow the process of heating the building and reduce thermal comfort
levels (Hollo, 1995, Roaf et al., 2001). CS 8 indicates that during cooler periods,
246
buildings with a high thermal mass are likely to be warmer on the northern side if there
is appropriate exposure of thermal mass to insolation (Hollo, 1995).
7.2.6. Theme 6 – Thermal mass must be appropriately located and utilised within a building
space to maximise thermoregulatory capability.
Correctly locating and implementing thermal mass in a building is important for
ensuring conditions are ideal for high thermal comfort levels. Incorrect placement of
thermal mass can reduce its effectiveness as a thermoregulator (Anderson, 1980, Hollo,
1995, Mazria, 1979, Sutton and McGregor, 1983, Tiller and Creech, 1996, Wrigley,
2005). CS 7 identified that thermal mass insulated from the internal environment is less
efficient in absorbing energy from insolation or the air space. This reduces the capacity
of the thermal mass to thermoregulate temperature swings. To increase the
thermoregulatory capacity of thermal mass it should not be covered by plaster,
carpeting, rugs, veneer or other materials with insulating properties (Tiller and Creech,
1996). CS 7 also noted that thermal mass not exposed directly to solar radiation can be
effective at storing energy from active heat sources such as radiant heaters, stoves, and
wood fires.
CS 8 showed that in buildings with high thermal mass, rooms on the southern side of a
building will be cooler than rooms on the northern side. For this reason, it is
appropriate to locate bedrooms and service rooms such as laundries on the southern
side of buildings (Al-Azzawi, 1991). Sleeping requires lower temperatures to achieve
thermal comfort, and bedrooms can be maintained at cooler temperatures than central
living areas (Humphreys, 1995a, Weaver, 2004). Locating thermal mass appropriately
within the building envelope can ensure it is exposed to appropriate levels of insolation
(Anderson, 1980, Hollo, 1995, Reardon et al., 2005, Tiller and Creech, 1996).
7.2.7. Theme 7 – Thermal mass can act as a positive heat sink during hot periods, drawing
warm air from the internal air of the building.
The thermoregulatory properties of thermal mass can improve internal temperatures
during periods of excessive heat, helping to improve summertime thermal comfort
levels with reduced air conditioning use (Peterkin, 2008). Thermal mass can draw
energy from the internal environment, storing it to be released when temperatures cool
during the night and building ventilation is appropriate (Gavieta, 1990/1991, Shaviv et
al., 2001b).
247
CS 7 showed that thermal mass can be used as a positive heat sink to improve the
thermal environment. Thermal mass that is not exposed to insolation can still be useful
in warmer periods for drawing excess energy from the internal airspace of the building.
This cooling process is dependent on the thermal mass not being exposed to insolation
during warmer periods. Resultantly, the implementation of shading mechanisms that
are seasonal (such as eaves, louvres, deciduous trees, and removable shades) can mean
thermal mass can thermoregulate to improve thermal comfort in the both the warm
and cool periods of temperate zones such as Tasmania (Gavieta, 1990/1991, Hollo,
1995, Shaviv et al., 2001b, Wrigley, 2005).
7.2.8. Theme 8 – Ventilation is important in a passive building to allow the removal of
unwanted warm air and the cooling of thermal mass.
Ventilation is an important process for improving air quality and temperature in a
building, as explained in Chapter 3. During warmer periods, night time ventilation can
be used to remove warm air from the building envelope and allow the thermal mass to
cool. This cooling can allow the thermal mass to operate as a sink for unwanted heat
once temperatures rise (Gavieta, 1990/1991, Hollo, 1995, Makaka et al., 2008, Malin,
2000, Peterkin, 2008, Shaviv et al., 2001b). CS 8 showed that occupants of a building
with the inability to properly ventilate during warmer periods had increased thermal
discomfort levels. Passive ventilation using natural air currents, such as the opening of
windows, is an effective and low cost means of changing the air in a building (Makaka
et al., 2008, Malin, 2000).
Al-Azzawi (1991) examines the benefits of ventilation, including improvements to air
quality, the replacement of warm internal air with cooler external air, and the cooling of
the thermal mass of a building by the process of convection. While permeable materials
such as those examined by Gavieta (1990/1991) can provide incidental air changes, it is
more effective for ventilation to be undertaken quickly and exchanging large volumes
of air. Ventilation should also be occupant controlled, allowing it to be a process that
occurs only at appropriate times and as necessary (Al-Azzawi, 1991, Hollo, 1995,
Malin, 2000). In the maritime climate of Hobart, where summer rarely features
extended periods of warmth and where night time temperatures during summer are
often very cool, effective ventilation can reduce or remove the need for air
conditioning.
248
7.2.9. Theme 9 – Personal attributes of occupants will influence their levels of thermal
comfort and acclimatisation.
CS 1, 2 and 6 identified that personal attributes of occupants impact upon their ability
to achieve suitable thermal comfort levels. CS 1 showed that metabolic rate influenced
by physical activity and the consumption of food is one such influence, and that as
activity levels decrease, temperatures required to maintain thermal comfort increase.
Rowe (1995) identifies the influence of physical activity on thermal comfort levels,
indicating that as physical activity increases an individual‟s ideal temperature for
thermal comfort will drop by as much as 3°C. Humphreys (1995b) and de Dear (1998)
both identify physiological factors as a influences on how an individual adapts to the
thermal environment. Repeated exposure of an individual to a temperature outside of
his or her thermal comfort range will increase the tolerance of an individual to that
environment, and the individual will begin to adapt to that temperature.
There is potential for gender to influence thermal comfort levels, and Karjalainen
(2007) identified that females are: less satisfied with room temperatures; more likely to
feel uncomfortably hot or cold, and; prefer higher temperatures than males. CS 2 and
CS 6 were inconclusive, presenting opposing results on the affect of gender on thermal
comfort levels.
7.2.10. Theme 10 – Occupants have an active role in influencing their thermal environment
Five case studies noted that occupants can have an influence on their thermal
environment and use a range of mechanisms to adjust themselves or the environment
to achieve thermal comfort. This supports the adaptive approach to the analysis of
thermal comfort, which recognises that individuals are not inert subjects of their
thermal environment (de Dear and Brager, 2001, Humphreys, 1995b). Humphreys
(Humphreys, 1995b) identified the use of controls such as thermostats, windows,
blinds, and fans, and the choice or modification of clothing levels as categories of
thermal adaptation. Behavioural modification is potentially the most significant
adaptive technique in an individual‟s ability to achieve acceptable thermal comfort
levels (Critchfield, 1974, de Dear, 1998, Humphreys, 1995b). Ong (1995) considers
behavioural modification to be more important than the individual‟s surrounding
environment.

249
CS 5 and 7 support work by Humphreys (1995b) and de Dear (1998) indicating that
the adjustment of clothing is an important and effective method of thermal adaptation.
Active manipulation of the building by an occupant can include using internal doors and
windows, and curtains and blinds (Critchfield, 1974, Humphreys, 1995b). This can
mitigate larger swings in temperature than would be the case if simply relying on the
thermal mass and insulation of the building (CS 6).
CS 1 identified that occupants are likely to close peripheral areas to only heat a central
space, and will allow sleeping areas to cool. CS 5 showed how occupants of a thermally
uncomfortable building used this method to improve thermal comfort levels. This type
of thermal control by separating a building into multiple thermal environments can be
appropriate, as a thermal environment for sleeping can be different to one for activities
while awake (Lin and Deng, 2008). Rooms that differ in temperature can be isolated
and occupied at appropriate times (CS 7) and this practice can include using cooler
basement rooms in the summer, and warmer upstairs rooms in the winter.
CS 9 examined how some passive design features require operation for maximum
efficacy. The inclusion of such systems does not necessarily ensure they will be
appropriately utilised. In all three buildings examined (CS 9), none of the occupants
indicated that they properly utilised the Trombe walls. It is therefore important to
ensure that when such features are included in a building, the occupants are made
aware of the effective and correct operation. This may not always be achievable, as a
building may often be home to a number of occupants throughout its lifespan, and so
it is preferable to, where possible, implement passive design features that require as
little as possible operation by occupants to achieve maximum efficiency.
7.2.11. Theme 11 – An overregulated thermal environment can lead to reduced tolerance to
temperatures swings and lower thermal comfort levels.
There was a highly regulated internal environment in CS 3. Resultantly, the occupants
were less tolerant of changes in temperature and humidity, and experienced frequent
thermal discomfort. This concurs with Chapter 4, and the work of de Dear and Brager
(2001) which discusses how individuals in a thermoregulated environment were likely
to experience a narrower thermal comfort temperature range than individuals who are
free to exercise (or choose to exercise) control over their thermal environment. This
can include the adjustment of temperature settings on heating and cooling devices, and
250
the adjustment of windows and curtains, which will be available in the majority of
residential buildings (Baker and Standeven, 1995, de Dear and Brager, 2001, Raja et al.,
2001).
Humphreys (1995b) indicates that there is both a psychological and physiological desire
to exercise control over an individual‟s thermal environment, and this control is
frequently removed by the presence of centrally controlled HVAC systems. In the
Tasmanian context, the need for air conditioning is lesser than in warmer climates,
meaning that there is potential for designers and builders to ensure that occupants
retain this control over their internal thermal environment.
7.3. Hypotheses
This section uses the Thematic Analysis of the case studies to reject or accept the four
hypotheses that were developed for the research project (see Chapter 1). Rather than
quantifying the qualitative data in each theme, relationships are identified between the
overarching themes and these hypotheses. It is then determined whether each theme
linking to each hypothesis supports its acceptance. Subsequently, each hypothesis is
either accepted or rejected based on links to relevant themes.
7.3.1. Hypothesis 1 – In cool climates, increased volumes of appropriately applied thermal
mass will lead to increased radiative emissions that will enhance thermal comfort by
thermoregulation.
Themes 1, 3, 6, 5 and 10 are directly linked to this hypothesis. Themes 1 and 3 showed
that buildings with greater thermal mass will produce internal thermal environments
that are more conducive to higher thermal comfort levels, so long as the building is
properly insulated. Theme 3 concurred that high thermal mass buildings with
insufficient insulation will have reduced thermal comfort levels. Theme 10 identified
that occupants have an active role in influencing thermal environment. This active role
can impact on the effectiveness of thermal mass and improve or reduce the
thermoregulatory ability of a building.
Likewise it is important that thermal mass be properly located and utilised within a
building (Theme 6). The importance of exposing thermal mass to suitable levels of
insolation was discussed in Theme 5. In cool climates the primary purpose of thermal

251
mass is to absorb and store heat from insolation to ensure that swings can be mitigated
to allow occupants to maintain thermal comfort levels. This means that thermal mass
should be located inside the building envelope, and exposed to suitable amounts of
solar energy during winter. It should also be of sufficient volume to store this solar
energy; be dark coloured and of matte finish to maximise absorption, and; be shaded
from unwanted insolation during summer.
Given that themes 1 and 3 clearly indicate that increased thermal mass will lead to
increased thermal comfort levels, if the thermal mass is appropriately located and
exposed to insolation, this hypothesis is accepted.
7.3.2. Hypothesis 2 – Insufficient thermal mass and solar access results in increased use of
active heating systems and reduced acclimatising to local temperatures.
Increasing thermal mass in a building will improve thermal environments through the
process of thermoregulation (Themes 1 and 3). This directly reduces the requirements
of active heating systems and devices. The need for thermal mass must be properly
located and utilised to gain the full benefits of reducing the use of active heating
(Themes 5 and 6). Theme 5 supported the need for insolation in buildings with high
volumes of thermal mass to allow effective thermoregulation during cooler periods.
Theme 11 related to the acclimatisation of building occupants and determined that a
thermal environment that was overregulated could reduce the tolerance of occupants
to temperature swings and thus lower thermal comfort levels. Unlike active systems,
where temperatures are likely to be rigidly controlled, the small temperature variations
produced by a passive system will be more likely to allow occupants to acclimatise to
local thermal conditions. As identified in Themes 9 and 10, the attributes of occupants
will impact on levels of thermal comfort and acclimatisation to the local climate.
Overall, the study clearly shows, using the adaptive approach to the analysis of thermal
comfort, that buildings with less thermal mass and insolation will require greater input
from active heating. There is also evidence that through reduction in heating
expenditure and with the freedom to manipulate thermal environments in a passive
system (including ventilation, solar gain, and shading systems), occupants will more
likely acclimatise to their local thermal environment. Resultantly, the hypothesis is
accepted.
252
7.3.3. Hypothesis 3 – Low volumes of thermal mass and solar access result in lower levels of
thermal comfort.
Theme 1 was drawn from case studies with buildings having high or low levels of
thermal mass. In buildings with high levels of occupancy, such as the Walford Terrace,
levels of thermal comfort were lower in those buildings with less thermal mass. Lower
levels of thermal mass do not necessarily lead to lower levels of thermal comfort. Theme
2 showed that low thermal mass buildings can produce high levels of thermal comfort
if properly insulated and operated by occupants. These buildings will be less effective at
containing thermal energy for thermoregulation than properly insulated high thermal
mass buildings because energy is stored in the air space of the building rather than in
building materials. Because there is no thermal mass to act as a heat sink the airspace
can be quickly heated or cooled as necessary. This makes low thermal mass buildings
potentially suitable for occupants with certain lifestyles as they can quickly heat or cool
the building through active processes. This can include for instance those who have
irregular or sporadic occupancy. As a result, low thermal mass buildings may also be
suitable for certain locations, such as those in cool climates with low levels of
insolation.
For such a building to operate effectively however, it will be required to have suitable
insulation and active heating systems to ensure a thermal environment suitable for high
levels of thermal comfort. Themes 5 and 6 identified that low levels of solar access
coupled with low levels of thermal mass will result in lower thermal comfort levels in
cool periods than if the building had greater levels of solar access. While the mass of
the building may not be suitable for long term storage of the solar energy, some energy
can be stored within the internal air space where there is sufficient solar radiation.
Themes 5 and 6 also identified factors that can reduce thermal comfort levels in
buildings with high levels of thermal mass. This includes examining insufficient solar
access and the location and use of thermal mass within the building envelope. In a high
thermal mass building, low insolation levels, without large input from active heating
systems, are likely to reduce thermal comfort levels. Even if buildings have access to
solar radiation, the incorrect use of thermal mass in the building can include placement
outside the building envelope, insulation by carpet, rugs, plaster or other materials, or
incorrect choice of colour or finish. This can result in reduced effectiveness of the
thermal mass and reduced thermal comfort levels in the building.
253
The hypothesis is accepted, and solar access was shown to be a primary influence on
thermal comfort levels, particularly during cool periods. Low levels of thermal mass do
not necessarily result in reductions in thermal comfort levels and are dependent on the
lifestyle and activities of the occupant.
7.3.4. Hypothesis 4 – Excessive thermal mass and insufficient solar access results in lower
levels of thermal comfort.
This hypothesis is directly linked to themes 5, 6, and 7. Thermal mass can act as a heat
sink, drawing energy from the airspace of the building, making it difficult to heat with
active systems and devices. It is important that buildings that are high in thermal mass
have sufficient incoming solar energy to allow them to effectively heat during cool
periods. Theme 7 showed that thermal mass can act as a positive heat sink during
warm periods by drawing heat from the air space. Themes 5 and 6 identified the proper
implementation of thermal mass within the building envelope, which included: using
appropriate volumes of thermal mass; ensuring thermal mass is not insulated from the
internal environment; and locating thermal mass in a location where it is exposed to
insolation, and can release thermal energy into appropriate rooms.
Theme 5 identified the need for thermal mass to be exposed to sufficient insolation to
allow thermoregulation during cooler periods. Insufficient insolation being stored by
thermal mass will result in failure of the mass to effectively thermoregulate without
input from active heating systems, and potentially draw thermal energy from the
internal environment of the building. This will produce thermally uncomfortable
environments, and resultantly, this hypothesis is accepted.
7.4. The Role of Thermal Mass in Improving Thermal
Comfort in Tasmania’s Housing Stock
The housing stock of Hobart features a diverse range of buildings incorporating the
principles of passive design to varying degrees. The low levels of insulation in
Tasmania do however indicate that the uptake of passive design principles is low, with
little thought into correctly implementing thermal mass to improve thermal comfort
levels. Given its cool to temperate climate, the implementation of principles of passive
design, particularly the usage of thermal mass, could be beneficially introduced into
254
Hobart‟s housing stock. The difficult task of retrofitting existing housing stock is
outside the scope of this study. It is clear however, that houses designed with higher
levels of thermal mass than the common brick veneer and timber clad designs
common to Hobart will require less input from active heating systems. Therefore, it is
important that the future design and planning for residential development in Hobart
support: the implementation of thermal mass for thermoregulation; access to
insolation; and insulation sufficient to prevent unnecessary heat loss.
7.4.1. Guidelines for implementing thermal mass
Using the adaptive approach to thermal comfort analysis, this study has developed a
number of guidelines for implementing thermal mass in cool climate buildings to create
thermal environments that will allow occupants to be thermally comfortable. The
following five guidelines will assist in the implementation of thermal mass into the
design of Hobart‟s building stock, but may be applicable to other regions with similar
climate.
7.4.1.1. Guideline 1 – thermal mass should be of a suitable volume.
Thermal mass should be of such volumes as to allow the absorption of sufficient solar
energy to mitigate temperature swings overnight or on cooler days. Likewise thermal
mass should not be of such quantity that it becomes an unwanted heat sink. There is a
possibility that it could draw warmth from the internal environment, leading to lower
thermal comfort levels. Ideally, the volume of thermal mass should be dependent on
levels of insolation available on the building site. In locations with low levels of
insolation it may be more appropriate to build a low thermal mass building, while on a
site with northern aspect or unblocked northern sun, a high thermal mass building
would be better appropriate.
The correct implementation of thermal mass varies and is dependent on the levels of
insolation to which the building site is subject. In cool climates it is important that
thermal mass within a building space be exposed to solar radiation, to ensure effective
thermoregulation of the internal environment of the building. In locations or buildings
with low insolation, high volumes of thermal mass can act as a heat sink and produce
lower thermal comfort levels. Therefore, in locations with poor solar access it is more
appropriate to build lightweight buildings that are heavily insulated. This can allow
effective heating by active heating systems and devices, as necessary, and contain such

255
heat in the internal airspace, with minimum energy input. This is particularly important
in Hobart, where the undulating nature of the landscape results in a variety of building
sites. Resultantly, sufficient solar access will not always be available, and a low thermal
mass building may be more appropriate.
7.4.1.2. Guideline 2 – thermal mass should be appropriately located
Thermal mass should be located inside the building envelope or in a position where
solar energy can be collected and stored in the thermal mass. This could be introduced
inside the building envelope through processes of conduction or active transport.
Direct gain systems are the most appropriate method of placing thermal mass as it sits
within the building envelope allowing long wave thermal emissions to directly heat the
internal environment, yet the mass is also exposed to insolation through glazing.
It is also important to ensure that while thermal mass has appropriate access to
insolation during cooler periods, it is shaded from such insolation during the summer.
Shade to the east and west, and the inclusion of eaves on the northern side of the
building to block the high summer sun, are primary methods.
In Hobart, where sites and houses often face south, locating thermal mass in an area
with sufficient solar gain can require the use of innovative or novel approaches, such as
solar reflectors, clerestory windows, or the orientation of buildings unconventionally to
face the sun.
7.4.1.3. Guideline 3 – thermal mass should be appropriately finished.
In areas of thermal mass exposed to insolation in cool environments such as Hobart,
retaining heat is important to minimise temperature troughs. Thermal mass should be
dark coloured to maximise the absorptance and absorptivity. Likewise, thermal mass
should be matte finished to lower reflectance. Higher absorptance and lower
reflectance will mean that the thermal mass can more effectively capture and store
incoming solar energy. Thermal mass which is light coloured or has a glossy finish will
be less effective at absorbing insolation. This can reduce the ability of the thermal mass
to thermoregulate when temperature cools and lead to immediate unwanted increases
in air temperature.
256
7.4.1.4. Guideline 4 – thermal mass should be appropriately insulated.
No insulating barriers should be placed between the thermal mass and either the
internal environment of the building or the solar gain. Coverings such as carpet, rugs,
plasterboard, and other insulating materials prevent thermal mass from releasing long
wave radiation into the building envelope. Thermal mass with an insulated surface will
have a lower emissivity. This reduces the ability of the thermal mass to radiate heat
back into the airspace. In turn this inhibits the ability of thermal mass to
thermoregulate and will lead to lower thermal comfort levels of occupants in cool
climates such as Hobart. Likewise, such insulating barriers can prevent incoming
insolation from coming into contact with the thermal mass. This change in surface
absorptance can affect the ability of the thermal mass to effectively absorb solar
radiation and thermoregulate temperature troughs. It can also potentially cause
unwanted immediate rises in temperature as reflected energy heats the internal
environment.
7.4.1.5. Guideline 5 – building occupants should be educated on the correct operation of passive
design features.
The role of building occupants in modifying their thermal environment is paramount.
This includes more complicated tasks such as the operation of the Trombe walls, as
well as the use of more basic devices such as windows for ventilation and curtains for
shading. Occupants also have the ability to reduce the effectiveness of thermal mass as
a thermoregulatory device, by reducing exposure to insolation, or preventing it from
radiating energy back into the building envelope. It is therefore important to ensure
that building occupants understand the thermal nature of their building and the passive
design features used to thermoregulate the thermal environment. Alternatively, it may
be possible in many cases to use passive design features that do not require occupant
operation to achieve the same thermoregulatory effect.
The education of building occupants on the operation of their buildings to improve
thermal comfort is a task that falls to a number of organisations. Previous work by
Weaver (2004), in conjunction with Sustainable Living Tasmania, has raised awareness
of thermal efficiency in the home. Effective dissemination of information should be
delivered by an alliance of local and state government working with: industry
organisations such as the Australian Institute of Building; the Master Builders
257
Association; the Housing Industry Association, and; community organisations such as
Sustainable Living Tasmania.
7.5. New Knowledge, Limitations and Opportunities for
Further Research
This study has taken a new approach of analysing the impact of thermal mass on the
thermal comfort of residents of small scale residential buildings, utilising the adaptive
approach to thermal comfort. This approach not only utilised a distinctive and
emerging method of thermal comfort analysis to support existing work on the analysis
of building thermal mass, but has also developed guidelines for the implementation of
thermal mass into residential buildings.
This study has established links between thermal mass and thermal comfort, while
recognising both the qualitative and quantitative nature of thermal comfort studies.
Using this approach, the guidelines above were developed to inform how thermal mass
could be used to improve the housing stock of Hobart, Tasmania, addressing: volume,
location, type, and insulation of thermal mass; and the need to educate building
occupants on the operation and utilisation of passive design features.
This research has presented guidelines for the implementation of thermal mass in
residential buildings for the purpose of improving the thermal comfort of building
occupants. These guidelines include: the appropriate location and volume of thermal
mass; finishes that improve the thermoregulatory performance of thermal mass; how
thermal mass should be appropriately insulated; and the need for occupants to be
educated on the correct operation of thermal mass and other passive design features.
As noted in Chapter 5, the lack of quantification of thermal mass mean that the
comparison between thermal mass and thermal comfort is undertaken qualitatively.
This limits how the knowledge developed by this study can be compared to other
studies of thermal mass.
There are many opportunities for future research into the implementation of thermal
mass as a passive design feature and the assessment of thermal comfort in residential
buildings. This could include examining: retrofitting to increase thermal mass (where
appropriate); the introduction of passive design features to existing housing stock in

258
Hobart; and the impact of passive designed buildings on occupant acclimatisation to
local climatic conditions.
7.6. Conclusion
The work of Fanger (1972) provided a comfort equation from which many modern
standards for thermal comfort arise, and was a useful starting point for thermal
comfort research. It has however been criticised as too prescriptive with the potential
to result in dwellings that may be thermally inappropriate for its occupants (de Dear
and Brager, 2001, Humphreys, 1995b). The adaptive approach to examining and
assessing thermal comfort has merit in that it recognises that building occupants are
not inert subjects of their thermal environment, and can actively alter or adapt to the
internal environment of their dwellings. This research uses the more comprehensive
adaptive approach to the assessment of thermal comfort, in the analysis of the
thermoregulatory performance of ten buildings in Hobart.
The improvement of the housing stock of Hobart is a task that faces many challenges,
and requires long term vision. This means addressing both the need for the
improvement of existing housing stock and ensuring that future residential building
design incorporates passive design features. This can reduce unnecessary expenditure
and energy consumption by active heating and cooling systems and produce internal
thermal environments that improve thermal comfort levels of occupants.
259
REFERENCES
(1996) Australia State of the Environment. Department of the Environment Sport and Territories.
(2006) Australia State of the Environment 2006. Australian Government Department of Environment and Heritage.
(2009) State of the Environment Report. Tasmanian Planning Commission. ABC (2003) The real estate boom in Tasmania. Hobart. ABS (2002) Aurora Energy customers. Australian Bureau of Stastics. ABS (2006a) Climate Overview. Australian Bureau of Statistics. ABS (2006b) Climate: droughts. Australian Bureau of Meteorology. ABS (2006c) Climate: evaporation. Australian Bureau of Statistics. ABS (2006d) Climate: Hobart's climate: other weather conditions. Australian Bureau of
Statistics. ABS (2006e) Climate: Hobart's climate: Rainfall. Australian Bureau of Statistics. ABS (2006f) Climate: Hobart's climate: sunshine and cloud. Australian Bureau of Statistics. ABS (2006g) Climate: Hobart's Climate: Temperature. Australian Bureau of Statistics. ABS (2006h) Climate: humidity. Australian Bureau of Statistics. ABS (2006i) Climate: rainfall. Australian Bureau of Statistics. ABS (2006j) Climate: snow. Australian Bureau of Statistics. ABS (2006k) Climate: temperature. Australian Bureau of Statistics. ABS (2006l) Climate: thunderstorms and hail. Australian Bureau of Statistics. ABS (2006m) House Building. Australian Bureau of Statistics. ABS (2006n) House price indexes. Australian Bureau of Statistics. ABS (2006o) Housing and Construction: number of dwelling units approved. Australian
Bureau of Statistics. ABS (2006p) Housing characteristics: number of bedrooms. Australian Bureau of Statistics. ABS (2006q) Property Sales: Residential. Australian Bureau of Statistics. ABS (2006r) Value of building construction work done: residential. Australian Bureau of
Statistics. ABS (2007) Tasmanian Housing Indicators. Australian Bureau of Statistics. ABS (2008a) Community Housing Program. Australian Bureau of Statistics. ABS (2008b) House Building. Australian Bureau of Statistics. ABS (2008c) House Price Indexes. Australian Bureau of Statistics. ABS (2009a) Regional Population Growth Australia 2008-09. Australian Bureau of
Statistics. ABS (2009b) Year Book 2009-2010. Australian Bureau of Statistics. AHMED, Z. N. (1995) Temperature Standards for the Tropics? IN NICOL, F.,
HUMPHREYS, M., SYKES, O. & ROAF, S. (Eds.) Standards for Thermal Comfort: Indoor Air Temperature Standards for the 21st Century. Chapman & Hall.
AKSOY, U. T. & INALLI, M. (2005) Impacts of some building passive design parameters on heating demand for a cold region. Building and Environment, 41, 1742-1754.
AL-AZZAWI, S. (1991) Energy-conscious design of low-cost housing−passive solar design of a new-built block of flats in London. Renewable Energy, 1, 389/402.
AMELAR, S. (2006) For its Manhattan debut, Foster and Partners creates the new Hearst Tower with a glass-and-steel shaft hovering atop a vintage low-rise. Architectural Record, 194, 74.
ANDERSON, B. (1980) Passive Solar Design Handbook, Solar Energy Information Services (SEIS), California.

260
ANSELM, A. J. (2007) Passive annual heat storage principles in earth sheltered housing, a supplementary energy saving system in residential housing Energy and Buildings, 40, 1214-1219.
ARGUE, R., EMANUEL, B. & GRAHAM, S. (1978) The Sun Builders: A People's Guide to Solar, Wind and Wood Energy in Canada, Toronto, Canada, Renewable Energy in Canada.
ASHRAE (2004) ASHRAE Standard: Thermal Environmental Conditions for Human Occupancy. American Society of Heating Refrigerating and Air-Conditioning Engineers, Atlanta.
BAILY, M. N. & ELLIOTT, D. J. (2009) The US Financial and Economic Crisis: Where Does it Stand and Where do we Go From Here? Initiative on Business and Public Policy. Brookings.
BAKER, N. & STANDEVEN, M. (1995) A behavioural approach to thermal comfort assessment in naturally ventilated buildings. CIBSE National Conference. Eastbourne, London, Chartered Institution of Building Services Engineers.
BAKER, N. & STANDEVEN, M. (1996) Thermal comfort for free-running buildings. Energy and Buildings, 23, 175-182.
BALARAS, C. A. (1996) The role of thermal mass on the cooling load of buildings. An overview of computational methods. Energy and Buildings, 24, 1-10.
BALLINGER, J. A., PRASAD, D. K. & RUDDER, D. (1992) Energy Efficient Australian Housing, Canberra, Australian Government Publishing Service.
BARNES-KEOGHAN, I. (2006) Tasmania in spring 2006: Still very dry with some extreme days. Bureau of Meteorology.
BARNES-KEOGHAN, I. (2007a) Tasmania in autumn 2007: A very warm season. Bureau of Meteorology.
BARNES-KEOGHAN, I. (2007b) Tasmania in spring 2007: dry in the east. Bureau of Meteorology.
BARNES-KEOGHAN, I. (2007c) Tasmania in summer 2006-07: Drier and warmer than normal. Bureau of Meteorology.
BARNES-KEOGHAN, I. (2007d) Tasmania in winter 2007: Mostly drier and cooler than average. Bureau of Meteorology.
BARNES-KEOGHAN, I. (2008a) Tasmania in 2007: Very warm and rather dry. Bureau of Meteorology.
BARNES-KEOGHAN, I. (2008b) Tasmania in 2008: another warm, dry year - but with local frosts and heavy rain. Australian Bureau of Meteorology.
BARNES-KEOGHAN, I. (2008c) Tasmania in summer 2007-08: wet in some areas, dry in others, warm overall. Bureau of Meteorology.
BEGGS, C. (2007) Passive solar and low energy building design. Energy Management and Conservation, 243-270.
BOESTRA, A. C., RAUE, A. K., KURVERS, S. R., LINDEN, A. C. V. D. & HOGELING, J. J. N. M. (2005) A new Dutch adaptive thermal comfort guideline. International Conference on EPBD Energy Performance of Buildings Directive. Brussels.
BOM (2010a) 36 Monthly Mean Daily Maximum Temperature Totals for Tasmania. Australian Bureau of Meteorology.
BOM (2010b) 36 Monthly Mean Daily Minimum Temperature Totals for Tasmania. Australian Bureau of Meteorology.
BOM (2010c) 36 Monthly Rainfall Totals for Tasmania. Australian Bureau of Meteorology. BOM (2010d) Climate Statistics for Australian Locations. Australian Bureau of
Meteorology. BOM (2010e) Ellerslie Rd Temperature and Humidity Data HD01D_Data_094029_999999995979068. Bureau of Meteorology.
261
BOOTH, W. C., COLOMB, G. G. & WILLIAMS, J. M. (2008) The Craft of Research, University of Chicago Press.
BRAGER, G. S. & DE DEAR, R. J. (1998) Thermal adaptation in the built environment: a literature review. Energy and Buildings.
CALDER, N. (2002) Significant Tasmanian Architecture of the 20th Century. Tasmanian Year Book. Hobart.
CHAMRA, L. M., HUYNH, K. & HODGE, B. K. (2002) Thermal Comfort for Sedentary and Moderate Activity Levels. ASHRAE Transactions, 108, 428.
CHENG, V., NG, E. & GIVONI, B. (2005) Effect of envelope colour and thermal mass on indoor temperatures in hot humid climate. Solar Energy, 78, 528-534.
COMMISSION, B. (1987) Our Common Future. CRESWELL, J. W. (2009) Research Design: Qualitative, Quantitative, and Mixed Method
Approaches, Sage. CRITCHFIELD, H. J. (1974) General Climatology, Prentice Hall Inc. CROCOMBE, A. (2007) A Lighter Foot Print: A Practical Guide to Minimising Your Impact on
the Planet, Carlton, Victoria, Scribe Publications Pty Ltd. DALLAS, N. (2008) Climate Change Basics, North Ryde, NSW, McGraw-Hill Australia Pty
Ltd. DE DEAR, R. J. (1998) A global database of thermal comfort field experiments.
ASHRAE Transactions, 104, 1141. DE DEAR, R. J. & BRAGER, G. S. (2001) The adaptive model of thermal comfort and
energy conservation in the built environment. International Journal of Biometeorology, 45, 100-108.
DE DEAR, R. J. & BRAGER, G. S. (2002) Thermal comfort in naturally ventilated buildings: revisions to ASHRAE Standard 55. Energy and Buildings.
DE DEAR, R. J., BRAGER, G. S., REARDON, J. & NICOL, F. (1998) Developing an Adaptive Model of Thermal Comfort and Preference. ASHRAE Transactions, 104, 145.
DEDEAR, R. & BRAGER, G. S. (2001) The adaptive model of thermal comfort and energy conservation in the built environment. International Journal of Biometeorology, 45, 100-108.
DEDEAR, R. J. (1998) A global database of thermal comfort field experiments. ASHRAE Transactions, 104, 1141.
DEDEAR, R. J. & BRAGER, G. S. (2002) Thermal comfort in naturally ventilated buildings: revisions to ASHRAE Standard 55. Energy and Buildings.
DEDEAR, R. J., BRAGER, G. S., REARDON, J. & NICOL, F. (1998) Developing an Adaptive Model of Thermal Comfort and Preference. ASHRAE Transactions, 104, 145.
DELFATTI, T. & BARNES-KEOGHAN, I. (2007) Record dry caps off a year in extremes - Tasmania in 2006. Bureau of Meteorology.
DIER (2010) Greater Hobart Area. Hobart, Department of Infrastructure, Energy and Resources.
DPL (2001) 1901: A Socio-Economic Profile of Australia at Federation. Department of the Parliamentary Library, Information and Research Services.
DUNN, K. (2005) Interviewing. IN HAY, I. (Ed.) Qualitative Research Methods in Human Geography. Melbourne, Oxford University Press.
DUPONT, A. & PEARMAN, G. (2006) Heating Up the Planet: Climate Change and Security, Double Bay, NSW, Lowy Institute for International Policy.
DURMAYAZ, A., KADIOGLU, M. & SEN, Z. (2000) An application of the degree-hours method to estimate the residential heating energy requirement and fuel consumption in Istanbul. Energy, 25, 1245-1256.

262
EWERS, W. (1977) Solar Energy: A Biased Guide, Australia and New Zealand Book Company.
EYLES, J. & SMITH, D. M. (1988) Qualitative Methods in Human Geography, Cambridge, Policy Press.
FANGER, P. O. (1972) Thermal Comfort: Analysis and Applications in Environmental Engineering, Columbus, McGraw-Hill Book Company.
FERMI, E. (1956) Thermodynamics, Mineola, Dover Publications Inc. FORWOOD, B. (1995) What is Thermal Comfort in a Naturally Ventilated Building. IN
NICHOL, F., HUMPHREYS, M., SYKES, O. & ROAF, S. (Eds.) Standards for Thermal Comfort: Indoor Air Temperature Standards for the 21st Century. London, Chapman & Hall.
FOUNTAIN, M. E., ARENS, E., XU, T., BAUMAN, F. S. & OGURU, M. (1999) An investigation of thermal comfort at high humidities. ASHRAE Transactions, 105, 94.
FRANK, T. (2005) Climate change impacts on building heating and cooling energy demand in Switzerland. Energy and Buildings, 37, 1175-1185.
GAGGE, A. P., STOLWIJK, J. A. J. & SALTIN, B. (2004) Comfort and thermal sensations and associated physiological responses during exercise at various ambient temperatures. Environmental Research.
GARCIA-HANSEN, V., ESTEVES, A. & PATTINI, A. (2002) Passive solar systems for heating, daylighting and ventilation for rooms without an equator-facing facade. Renewable Energy, 26, 91-111.
GAVIETA, R. C. (1990/1991) Mass Housing Based on Traditional Design and Indigenous Materials for Passive Cooling in the Tropical Urban Climate of the Phillipines. Energy and Buildings, 15-16, 925-932.
GIVONI, B. (1991) Characteristics, design implications, and applicability of passive solar heating systems for buildings Solar Energy, 47, 425-435.
GIVONI, B. (1998) Effectiveness of mass and night ventilation in lowering the indoor daytime temperatures. Part I: 1993 experimental periods. Energy and Buildings, 28, 25-32.
GNAUCK, D. (1985) The Assessment of Ten Passive Solar Buildings in Tasmania. Centre for Environmental Studies. Hobart, University of Tasmania.
GRAY, A. T. (1997) The Earth Garden Book of Alternative Energy, Port Melbourne, Lothian Books.
GRAY, A. T. (2002) Green House Plans, Trentham, Earth Garden Books. GRIMMER, D. P., MCFARLAND, R. D. & BALCOMB, J. D. (1978) Initial experimental
tests on the use of small passive-solar test-boxes to model the thermal performance of passively solar-heated building designs. Solar Energy, 22, 351-354.
GRIMMER, D. P., MCFARLAND, R. D. & BALCOMB, J. D. (1979) Initial experimental tests on the use of small passive-solar test-boxes to model the thermal performance of passively solar-heated building designs. Solar Energy, 22, 351-354.
HALLIDAY, S. (2008) Sustainable Construction, Sydney, Butterworth-Heinemann. HAY, I. (2005) Qualitative Research Methods in Human Geography, South Melbourne, Oxford
University Press. HENSON, R. (2008) The Rough Guide to Climate Change, Camberwell, Penguin Books. HENZE, G. P., FELSMANN, C. & KNABE, G. (2004) Evaluation of optimal control for
active and passive building thermal storage. International Journal of Thermal Sciences, 43, 173-183.
HOLLO, N. (1995) Warm House Cool House, Choice Books.

263
HOUGHTON, D. (1998) Building Comfort with Less HVAC; Architects and Engineers Must Work Together to Reduce a Building's Thermal Load and Downsize the Heating and Cooling Plant. Architectural Record, 131.
HSE (1999) Thermal comfort in the workplace guidance for employers. HUMPHREYS, M. (1995a) An Adaptive Guideline for UK Office Temperatures. IN
NICHOL, F., HUMPHREYS, M., SYKES, O. & ROAF, S. (Eds.) Standards for Thermal Comfort: Indoor Air Temperature Standards for the 21st Century. London, Chapman & Hall.
HUMPHREYS, M. (1995b) Thermal Comfort Temperatures and the Habits of Hobbits. IN NICHOL, F., HUMPHREYS, M., SYKES, O. & ROAF, S. (Eds.) Standards for Thermal Comfort: Indoor Air Temperature Standards for the 21st Century. London, Chapman & Hall.
HUMPHREYS, M. A. & NICOL, J. F. (1998) Understanding the adaptive approach to thermal comfort. ASHRAE Transactions, 104, 991.
ISO (2005) Ergonomics of the thermal environment - Analytical determination and interpretation of thermal comfort using calculation of the PMV and PPD indices and local thermal comfort criteria. ISO, Switzerland.
JAMY, G. (1995) Towards New Indoor Comfort Temperatures for Pakistani Buildings: Indoor Comfort Temperatures for Pakistan. IN NICOL, F., HUMPHREYS, M., SYKES, O. & ROAF, S. (Eds.) Standards for Thermal Comfort: Indoor Air Temperature Standards for the 21st Century. Chapman & Hall.
JOKL, M. V. (1995) New Thermal Comfort Standards of the Czech Republic. IN NICOL, F., HUMPHREYS, M., SYKES, O. & ROAF, S. (Eds.) Standards for Thermal Comfort: Indoor Air Temperature Standards for the 21st Century. Chapman & Hall.
JORDAN, B. (2009) Coal in the Modern World. Gladstone Centre for Clean Coal. KALOGIROU, S. A., FLORIDES, G. & TASSOU, S. (2002) Energy analysis of buildings
employing thermal mass in Cyprus. Renewable Energy, 27, 353-368. KARJALAINEN, S. (2007) Gender differences in thermal comfort and use of thermostats
in everyday thermal environments. Building and Environment, 42, 1594-1603. KAYNAKLI, O. & KILIC, M. (2005) Investigation of indoor thermal comfort under
transient conditions. Building and Environment, 40, 165-174. KEARNS, R. A. (2005) Knowing Seeing? Undertaking Observational Research. IN HAY,
I. (Ed.) Qualitative Research Methods in Human Geography. Melbourne, Oxford University Press.
KOEHLER, D. A. & HECHT, A. D. (2006) Sustainability, well being, and environmental protection: perspectives and recommendations from an Environmental Protection Agency Forum. Sustainability: Science, Practice, & Policy.
KOSNY, J., PETRIE, T., GAWIN, D., CHILDS, P., DESJARLAIS, A. & CHRISTIAN, J. (2001) Thermal Mass - Energy Savings Potential in Residential Buildings. Oak Ridge, Oak Ridge national Laboratory.
KUMAR, S., TIWARI, G. N. & BHAGAT, N. C. (1993) Amalgamation of traditional and modern cooling techniques in a passive solar house: a design analysis.
LAHMEYER, J. (2006) Population Statistics. LERNER, S. (1998) Eco-Pioneers: Practical Visionaries Solving Today's Environmental Problems,
MIT Press. LEWIS, M. (2002) A History of Housing Assistance in Tasmania. Tasmanian Year Book.
Hobart. LIN, Z. & DENG, S. (2008) A study on the thermal comfort in sleeping environments in
the subtropics: Developing a thermal comfort model for sleeping environments. Building and Environment, 43, 70-81.

264
LITTLEFAIR, P. (1999) Passive solar urban design: ensuring the penetration of solar energy into the city. Renewable and Sustainable Energy Reviews, 2, 303-326.
MAKAKA, G., MEYER, E. L. & MCPHERSON, M. (2008) Thermal behaviour and ventilation efficiency of a low-cost passive solar energy efficient house Renewable Energy, 33, 1959=1973.
MALIN, N. (2000) What? No Air Conditioning in this Building?; Taking Advantage of Natural Ventilation Requires Some Desidn Compromises as Well as Building Owners and Occupants Willing to Tolerate Temperature Fluctuations. Architectural Record, 188, 281.
MARTIN, P. & VERBEEK, M. (2006) Strategy and Sustainability. Sustainability Strategy. Sydney, Federation Press.
MAZRIA, E. (1979) The Passive Solar Energy Book, Emmaus, Rodale Press. MCGUIRK, P. M. & O'NEILL, P. (2005) Using Questionnaires in Qualitative Human
Geography. IN HAY, I. (Ed.) Qualitative Research Methods in Human Geography. Melbourne, Oxford University Press.
MCKAY, K. & BONNIN, J. (2006) True Green, Sydney, ABC Books. MECKLER, M. (1984) Retrofitting of Commercial, Institutional, and Industrial Buildings for Energy
Conservation, Van Nostrand Reinhold Company. MEIER, R. (1999) Architect, New York, Monacelli Press. METEOROLOGY, A. B. O. (2010). Australian Bureau of Meteorology. MOBBS (2001) Sustainable House, Marrickville, CHOICE Books. NAHAR, N. M., SHARMA, P. & PUROHIT, M. M. (2002) Performance of different
passive techniques for cooling of buildings in arid regions. Building and Environment, 38, 109-116.
NEWMAN, P. (1999) Sustainability and Australian Cities. Australian Planner, 36. NICOL, F. & HUMPHREYS, M. (2005) Maximum temperatures in buildings to avoid
heat discomfort. International Conference "Passive and Low Energy Cooling for the Built Environment". Santori, Greece.
NICOL, F. & HUMPHREYS, M. (2007) Maximum temperatures in European office buildings to avoid heat discomfort. Solar Energy, 81, 295-304.
NICOL, F. & PAGLIANO, L. (2007) Allowing for thermal comfort in free-running buildings in the new standard prEN15251.
NICOL, J. F. (1995) Thermal Comfort and Temperature Standards in Pakistan. IN NICOL, F., HUMPHREYS, M., SYKES, O. & ROAF, S. (Eds.) Standards for Thermal Comfort: Indoor air temperatures for the 21st Century.
NUTT, B. B. (1994) The use and management of passive solar environments. Renewable Energy, 5, 1009-1014.
OLESEN, B. W. & BRAGER, G. S. (2004) A Better Way to Predict Comfort. ASHRAE Journal, 46, 20-28.
OLIVEIRA, J. T., HAGISHIMA, A. & TANIMOTO, J. (2009) Estimation of passive cooling efficiency for environmental design in Brazil Energy and Buildings, 41, 809-813.
ONG, B. L. (1995) Designing for the Individual: A Radical Reading of ISO 7730. IN NICHOL, F., HUMPHREYS, M., SYKES, O. & ROAF, S. (Eds.) Standards for Thermal Comfort: Indoor Air Temperature Standards for the 21st Century. London, Chapman & Hall.
PAPADOPOULOS, A. M. (2005) State of the art in thermal insulation materials and aims for future developments. Energy and Buildings, 37, 77-86.
PARSONS, K. C. (1995) ISO Standards and Thermal Comfort: Recent Developments. IN NICHOL, F., HUMPHREYS, M., SYKES, O. & ROAF, S. (Eds.) Standards for Thermal Comfort: Indoor Air Temperature Standards for the 21st Century. Chapman & Hall.

265
PETERKIN, N. (2008) Rewards for passive solar design in the Building Code of Australia. Renewable Energy, 34, 440-443.
PFAFFEROTT, J., HERKEL, S. & JASCHKE, M. (2003) Design of passive cooling by night ventilation: evaluation of a parametric model and building simulation with measurements. Energy and Buildings, 35, 1129=1143.
PFAFFEROTT, J., HERKEL, S. & WAMBSGANß, M. (2004) Design, monitoring and evaluation of a low energy office building with passive cooling by night ventilation. Energy and Buildings, 36, 455-465.
RAJA, I. A., NICOL, J. F., MCCARTNEY, K. J. & HUMPHREYS, M. A. (2001) Thermal comfort: use of controls in naturally ventilated buildings. Energy and Buildings, 33, 235-244.
REARDON, C., MCGEE, C., SHACKEL, S., SLAPP, B. & WHITE, S. (2005) Your Home: Design for Lifestyle and the Future, Technical Manual V3, Canberra, Sustainable Futures.
REDDY, T. A., NORFORD, L. K. & KEMPTON, W. (1991) Shaving residential air-conditioner electricity peaks by intelligent use of the building thermal mass. Energy, 16, 1001-1010.
RIJAL, H. B., TUOHY, P., HUMPHREYS, M. A., NICOL, J. F., SAMUEL, A. & CLARKE, J. (2007) Using results from field surveys to predict the effect of open windows on thermal comfort and energy use in buildings. Solar Energy, 81, 295-304.
RIJAL, H. B., TUOHY, P., NICOL, F., HUMPHREYS, M. A., SAMUEL, A. & CLARKE, J. (2008) Development of an adaptive window-opening algorithm to predict the thermal comfort, energy use and overheating in buildings. Journal of Building Performance Simulation, 1, 17-30.
ROACH, F., NOLL, S. & BEN-DAVID, S. (1979) Passive and Active Residential Solar heating: A Comparative Economic Analysis of Select Designs. Energy and Buildings, 4, 623-644.
ROAF, S., FUENTES, M. & THOMAS, S. (2001) Ecohouse: A Design Guide, Architectural Press.
RODAWAY, P. (1994) Sensuous Geographies: Body, Sense, Place, London, Routledge. ROWE, A. (1995) Comfort Standards from Field Surveys in the Leisure Industry. IN
NICHOL, F., HUMPHREYS, M., SYKES, O. & ROAF, S. (Eds.) Standards for Thermal Comfort: Indoor Air Temperature Standards for the 21st Century. London, Chapman & Hall.
SCHNIEDERS, J. & HERMELINK, A. (2004) CEPHEUS results: measurements and occupants‟ satisfaction provide evidence for Passive Houses being an option for sustainable building. Energy Policy, 34, 151-171.
SCHULER, A., WEBER, C. & FAHL, U. (2000) Energy consumption for space heating of West-German households: empirical evidence, scenario projections and policy implications. Energy Policy, 28, 877-894.
SCOTT, P. (1959) Building Materials in Greater Hobart. The Australian Geographer, 7, 149-163.
SHAVIV, E., YEZIORO, A. & CAPELUTO, I. G. (2001a) Thermal mass and night ventilation as passive cooling design strategy. Renewable energy 24, 445-452.
SHAVIV, E., YEZIORO, A. & CAPELUTO, I. G. (2001b) Thermal mass and night ventilation as passive cooling design strategy. Renewable Energy, 24, 445-452.
SMITH, A. (2009) Building Today's Green Home, Cincinnati, Ohio, Betterway Home. SMITH, P. & PITTS, A. C. (1997) Concepts in practice: energy, London, B.T. Batsford Ltd. STAKE, R. E. (1995) The Art of Case Study, SAGE Publications, Inc. STEEN, A. S., STEEN, B. & BAINBRIDGE, D. (1994) The Straw Bale House, Vermont,
Chelsea Green Publishing Company.
266
SUTTON, R. G. & MCGREGOR, R. J. (1983) Solarwall. Tasmanian College of Advanced Education.
TASMANIA, B. (2009) Facts About Tasmania. Brand Tasmania. THIERS, S. & PEUPORTIER, B. (2008) Thermal and environmental assessment of a
passive building equipped with an earth-to-air heat exchanger in France. Solar Energy, 82, 820-831.
TILLER, J. S. & CREECH, D. B. (1996) Builder's Guide to Energy Efficient Homes in Georgia, Atlanta, Georgia, Georgia Environmental Facilities Authority (GEFA), Division of Energy Resources.
TIWARI, G. N. (1991) Design of a Non-airconditioned Passive Solar House for the Cold Climate of Srinigar. Building and Environment, 26, 371-380.
TODD, J. (1994a) Calculating the Thermal Performance of a House. Hobart, Australian and New Zealand Solar Energy Society.
TODD, J. (1994b) Insulation. Australian and New Zealand Solar Energy Society. TODD, J. J. (1997) Passive Solar Design for Tasmania: the Value of Sunspaces. TRIANTI, E. S., SANTAMOURIS, M. I. & VALLINDRAS, M. (1986) Passive solar
strategies in retrofitting design. The case of a historic building in Athens, Greece. Solar & Wind Technology, 3, 1-11.
TUOHY, P., RIJAL, H. B., HUMPHREYS, M. A., NICOL, J. F., SAMUEL, A. & CLARKE, J. (2008) Comfort driven adaptive window opening behavior and the influence of building design. Glasgow, Energy Systems Research Unit, University of Strathclyde.
UMEMIYA, N. & NAKAMURA, Y. (1995) Comfort and Air Movement in a Naturally Ventilated Room. IN NICHOL, F., HUMPHREYS, M., SYKES, O. & ROAF, S. (Eds.) Standards for Thermal Comfort: Indoor Air Temperature Standards for the 21st Century. London, Chapman and Hall.
VAN DER LINDEN, A. C., BOERSTRA, A. C., RAUE, A. K., KURVERS, S. R. & DE DEAR, R. J. (2006) Adaptive temperature limits: A new guideline in The Netherlands: A new approach for the assessment of building performance with respect to thermal indoor climate. Energy and Buildings, 38, 8-17.
VANNESS, H. (1983) Understanding Thermodynamics, Mineola, Dover. WATSON, R. D., CHAPMAN, K. S. & DEGREEF, J. M. (1998) Case study: seven-
system analysis of thermal comfort and energy use for a fast-acting radiant heating system. ASHRAE Transactions, 104, 1106.
WEAVER, A. (2004) Retrofitting Conventional Houses Inexpensively to Improve Energy Efficiency. School of Geography and Environmental Studies. Hobart, University of Tasmania.
WEBB, M. (2008) Tasmania in autumn 2008: Mostly settled weather, very little rain. Bureau of Meteorology.
WILKIE, G. (2003) Building Your Own Home, Sydney, New Holland. WINDUST, A. (2003) Waterwise House and Garden: A Guide for Sustainable Living,
Collingwood, Landlinks Press. WRIGLEY, D. (2005) Making Your Home Sustainable: A Guide to Retrofitting, Melbourne,
Scribe. YAKUBU, G. S. (2004) The reality of living in passive solar homes : A user-experience
study. Renewable Energy, 8, 177-181. YIGIT, A. (1999) Combining Thermal Comfort Models. ASHRAE Transactions, 105, 149. YUDELSON, J. (2007) Green Building A to Z: Understanding the Language of Green Building.,
Gabriola Island, Canada, New Society Publishers.

267
ZAHEER-UDDIN, M. (1987) The Influence of Automated Window Shutters on the Design and Performance of a Passive Solar House. Building and Environment, 22, 67-75.
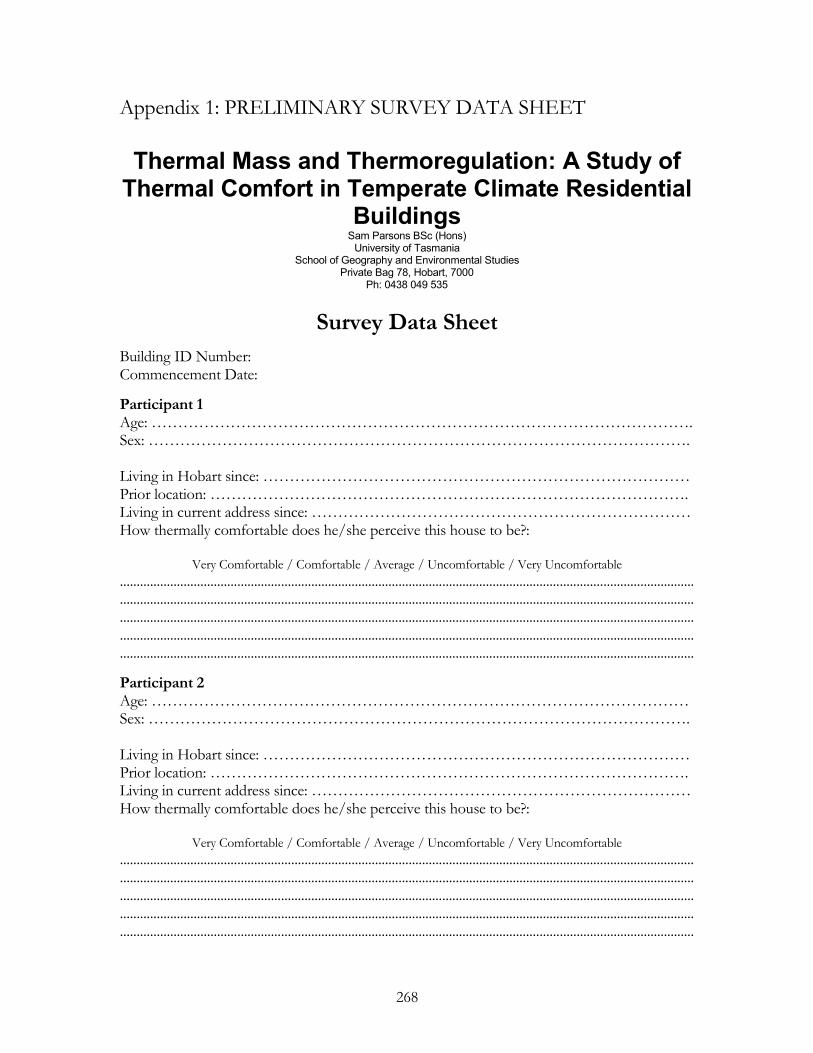
268
Appendix 1: PRELIMINARY SURVEY DATA SHEET
Thermal Mass and Thermoregulation: A Study of
Thermal Comfort in Temperate Climate Residential Buildings
Sam Parsons BSc (Hons) University of Tasmania
School of Geography and Environmental Studies Private Bag 78, Hobart, 7000
Ph: 0438 049 535
Survey Data Sheet
Building ID Number: Commencement Date:
Participant 1 Age: …………………………………………………………………………………………. Sex: …………………………………………………………………………………………. Living in Hobart since: ……………………………………………………………………… Prior location: ………………………………………………………………………………. Living in current address since: ……………………………………………………………… How thermally comfortable does he/she perceive this house to be?:
Very Comfortable / Comfortable / Average / Uncomfortable / Very Uncomfortable
...........................................................................................................................................................................
...........................................................................................................................................................................
...........................................................................................................................................................................
...........................................................................................................................................................................
...........................................................................................................................................................................
Participant 2 Age: ………………………………………………………………………………………… Sex: …………………………………………………………………………………………. Living in Hobart since: ……………………………………………………………………… Prior location: ………………………………………………………………………………. Living in current address since: ……………………………………………………………… How thermally comfortable does he/she perceive this house to be?:
Very Comfortable / Comfortable / Average / Uncomfortable / Very Uncomfortable
...........................................................................................................................................................................
...........................................................................................................................................................................
...........................................................................................................................................................................
...........................................................................................................................................................................
...........................................................................................................................................................................
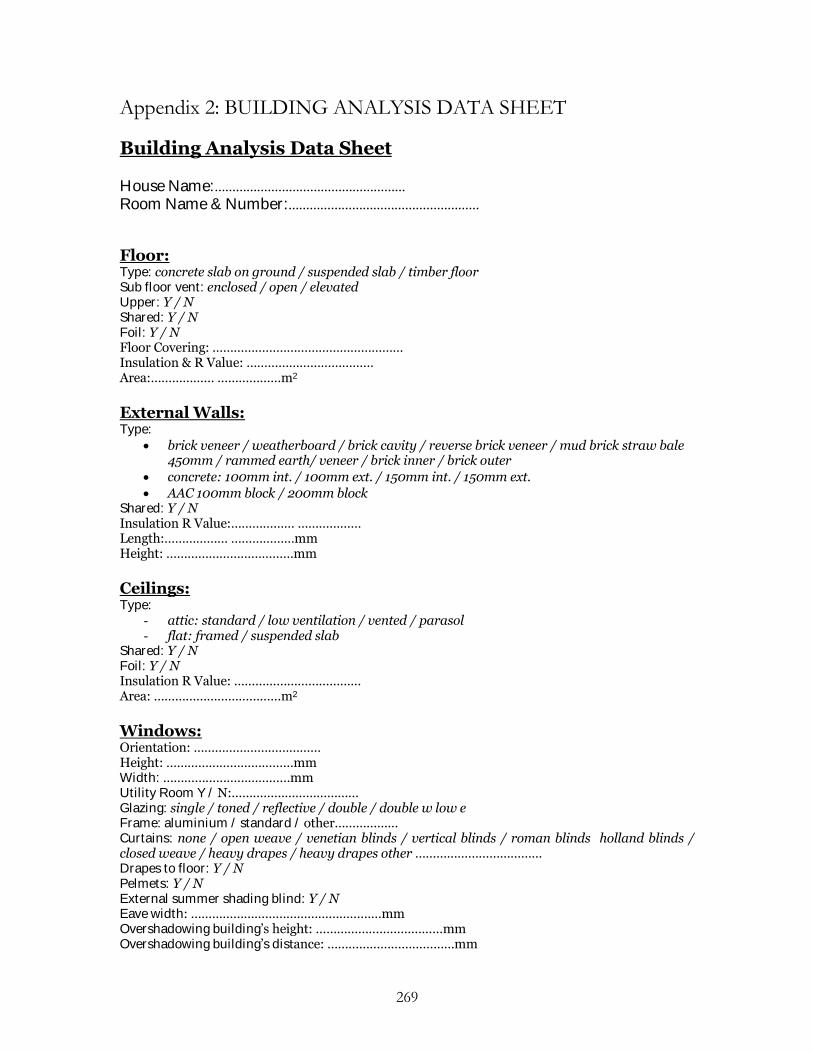
269
Appendix 2: BUILDING ANALYSIS DATA SHEET
Building Analysis Data Sheet House Name:………………………………………………
Room Name & Number:………………………………………………
Floor: Type: concrete slab on ground / suspended slab / timber floor Sub floor vent: enclosed / open / elevated Upper: Y / N Shared: Y / N Foil: Y / N Floor Covering: ……………………………………………… Insulation & R Value: ……………………………… Area:……………… ………………m2
External Walls: Type:
brick veneer / weatherboard / brick cavity / reverse brick veneer / mud brick straw bale 450mm / rammed earth/ veneer / brick inner / brick outer
concrete: 100mm int. / 100mm ext. / 150mm int. / 150mm ext.
AAC 100mm block / 200mm block Shared: Y / N Insulation R Value:……………… ……………… Length:……………… ………………mm Height: ………………………………mm
Ceilings: Type:
- attic: standard / low ventilation / vented / parasol - flat: framed / suspended slab
Shared: Y / N Foil: Y / N Insulation R Value: ……………………………… Area: ………………………………m2
Windows: Orientation: ……………………………… Height: ………………………………mm Width: ………………………………mm Utility Room Y / N:……………………………… Glazing: single / toned / reflective / double / double w low e Frame: aluminium / standard / other……………… Curtains: none / open weave / venetian blinds / vertical blinds / roman blinds holland blinds / closed weave / heavy drapes / heavy drapes other ……………………………… Drapes to floor: Y / N Pelmets: Y / N External summer shading blind: Y / N Eave width: ………………………………………………mm Overshadowing building’s height: ………………………………mm Overshadowing building’s distance: ………………………………mm
270
Skylights: Direction:……………… ……………… Tilt:……………… ………………° Type: single clear / single opal / double clear / double opal Summer shading: Y / N Utility room: Y / N Width: ………………………………mm Length………………………………mm
Other Features: Cross flow ventilation: -2, -1, 0, +1, +2 Heavy weight internal walls: ………………………………
- height: ………………………………mm - weight: ………………………………mm
Air Leakage & Draughts: (note sealed or unsealed) Chimneys: ……………………………………………………………… Wall/ceiling vents: ……………………………………………………………… Exhaust fans: ……………………………………………………………… Vented downlights: ……………………………………………………………… Vented skylights: ……………………………………………………………… Doors to utility rooms: ……………………………………………………………… External doors: ……………………………………………………………… Unflued gasheaters: ………………………………………………………………
General Information: House location: coastal / cliff top / rural / suburban / peri-urban / inner city Number of stories:……………………………… Door to stairways: Y / N………………………………
External Doors: Open to living area: Y/N Weather stripped: Y / N Gap size: ………………………………mm
Windows: Percentage sealed: ………………………………%
Draught Proofing: Gaps & cracks sealed: Y/N

271
Appendix 3: NIGHT STUDY SURVEY SHEETS
Occupant Observation and Survey Sheet
Occupant Name:
Date:
Time:
Time:
Clothing:
Clo:
Activity Level:
Met:
Notable Environmental Conditions:
(Detail nearby equipment, heat sources etc)
Thermal Comfort Level:
(Use questions below. Note response and rate using thermal comfort scale of -3 to +3, and note any discomfort)
Occupant Observations:
Questions for Occupants:
Please rate your level of thermal comfort on a scale of -3 to +3 on the following scale
-3 -2 -1 0 +1 +2 +3
very cold
cold slightly cool
neutral slightly warm
hot very hot
Would you describe your current state as thermally uncomfortable? If the occupant responds in the affirmative ask:
Is this discomfort discomfort experienced generally or localised to an area of the body? If the occupant responds in the affirmative ask:
Which area of the body?

272
Observations checklist (each occupant):
Did the occupant go outside at any time over the last half hour?
Did the occupant open or close windows or doors to modify their environment?
Did the occupant increase or decrease the heat output of their heating/cooling device? Make notes on time and location:
What room did the occupant spend the majority of their time in over the half hour period? Briefly note their movements if necessary:
Did the occupant consume alcohol during the half hour period? Note type and quantity to calculate standard drinks.
Did the occupant consume food during the half hour period?
Did the occupant consume tea during the half hour period?
Did the occupant consume other hot drinks during the half hour period?
Did the occupant change/add/remove clothing during the half hour period?
Did the occupant utilise any other adaptive strategies to achieve thermal comfort?
Was the occupant seated during the half hour period? Note seat type for clo calc.
Household Physical Measurements Data Sheet Building:
Time:
Rooms A B C D E F G H I J K L M N
Surface 1
Surface 2
Surface 3
Surface 4
Surface 5
Surface 6
Surface 7
Surface 8
Surface 9
Surface 10
Ceiling 1
Ceiling 2
Floor 1
Floor 2
Dry Bulb T
Wet Bulb T
Humidity
Wind Speed
Globe T
Radiation
273
Appendix 4: CONSENT FORM
Thermal Mass and Thermoregulation: A Study of Thermal Comfort in Temperate Climate Residential Buildings
1. I have read and understood the “Information Sheet” for this study.
2. The nature and possible effects of the study have been explained to me.
3. I have understood that the study involves the following procedures:
Placement of data loggers in the living space of my home Bi-monthly in depth analysis in the home Gathering of structural information on the home Gathering of information on thermal expenditure
4. I understand that the following risks are involved:
No foreseeable risks
5. I understand that all research data will be securely stored on the University of Tasmania
premises for a period of five years. The data will be destroyed at the end of this period.
6. Any questions that I have asked have been answered to my satisfaction
7. I agree that research data gathered for the study may be published provided that I cannot
be identified as a subject
8. I agree to participate in this investigation and understand that I may withdraw at any time
without prejudice.
Name of participant: _____________________________________________________________ Signature of participant: _____________________________________Date: ________________
9. I have explained this project and the implications of participation to this volunteer and I believe that the consent is informed and that he/she understands the implications of participation
Name of investigator: ____________________________________________________________ Signature of investigator: ____________________________________Date: ________________
274
Appendix 5: INFORMATION SHEET
Thermal Mass and Thermoregulation: A Study of Thermal Comfort in Temperate Climate Residential Buildings
Procedure: I am a PhD candidate at the School of Environmental Studies, University of Tasmania undertaking a study of thermal comfort in residential buildings. I would like to canvas the possibility of your participation. The research will take place over a year and will involve the study of eighteen (18) houses and their occupants. This study will involve the placement of temperature data loggers that are small, harmless, credit card sized devices, in the living space of your home. The study will also involve a more in depth analysis of the thermal processes in your home on a seasonal basis, a total of up to 4 times. This in-depth analysis will take place over the space of a single evening, will not require you to alter your daily routine, and involves taking physical measurements of your house as well as a short series of questions regarding your thermal comfort at home. The study will also involve the gathering of structural data on your home, as well as obtaining a small amount of information on your heating expenditure. Purpose of Study: The purpose of this study is to examine the effectiveness of thermal mass in regulating the thermal environment of residential buildings. Space heating accounts for as much as 40% of the energy consumed in the home, compared to 3% for lighting and 10% for cooking. That makes it the largest cause of energy expenditure in Australian houses. This study will yield important information that will help architects and builders to design and create homes that are more thermally efficient, helping to reduce the energy required to maintain a comfortable thermal environment for householders. The study will also yield information on the thermal efficiency of your home that can help to both lower expenditure on heating and increase overall thermal comfort. Freedom to Refuse or Withdraw and Confidentiality: Participation in this study is on an entirely voluntary basis. If you agree to participate as a case study you may withdraw at any time without prejudice. The information obtained during the course of this study is treated as highly confidential, will be coded to maintain your anonymity, and any material published regarding the study will contain no names. All files containing information obtained will be stored securely on university campus for a period of five years, after which they will be deleted. Questions: This project has been approved by the University of Tasmania Ethics Committee. Any concerns of an ethical nature regarding this study should be directed to the Chair or Executive Officer of the University Ethics Committee: If you have any questions regarding the project or have any other concerns please contact: Dr Lorne Kriwoken: (03) 6226 2458 Sam Parsons: 0438 049 535
Centre for Environmental Studies School of Geography and Environmental Studies University of Tasmania Private Bag 78 Hobart, Tasmania, 7001 Australia