THERMAL HYDROLSIS AT DAVYHULME WwTW ONE YEAR ON...The solution was the installation of a thermal...
17
19 th European Biosolids & Organic Resources Conference & Exhibition www.european-biosolids.com Organised by Aqua Enviro THERMAL HYDROLSIS AT DAVYHULME WwTW – ONE YEAR ON Edgington R M 1 , Belshaw D 1 , Lancaster L 1 and Jolly M 2 1 United Utilities, 2 Black & Veatch Corresponding Author: Rachel Edgington Tel. 01925 237000 Email [email protected] Abstract Davyhulme’s sludge treatment facility, using CAMBI thermal hydrolysis, is designed to treat an average 91000tds per annum, arising from 50% of the population served by United Utilities. All sludge from Davyhulme (Manchester) and seven other large works is treated. Raw sludge is imported as 25%DS cake from these outlying works. The facility was designed to increase United Utilities’ renewable energy generation and has 12MW of installed generating capacity. It was also designed to ensure flexibility in sludge treatment and recycling throughout the North West region. The digested sludge is either dewatered to a cake for recycling to land or pumped, as liquid, to Mersey Valley Processing Centre for incineration. The plant was commissioned during 2013 with performance tests being undertaken during this period. Since then, the plant has been optimised to reduce chemical costs, maximise biogas usage and energy generation. This has been achieved by the operational staff using key performance indicators. The plant has also produced an enhanced quality sludge product that has been successfully marketed and used by farmers, whom had not previously used sludge on their agricultural land. Keywords Thermal hydrolysis, digestion pre-treatment, advanced digestion, optimisation, combined heat and power. Project Background The North West of England has a predominance of grass land over 83% with the remaining 17% being arable. A recent land bank report concluded that of the 83% grass land in the North West only 20% would be suitable for United Utilities (UU) to utilise. UU require at least 18000Ha of land to manage its sludge every year. UU sludge recycling operations have historically focussed on the small arable land bank, producing a conventionally treated dewatered product suitable for surface application. This strategy was being implemented against a backdrop of increasing sludge production and more stringent regulations in regard to sludge application. Therefore to maintain and enhance UU’s recycling operations required a change in focus.
Transcript of THERMAL HYDROLSIS AT DAVYHULME WwTW ONE YEAR ON...The solution was the installation of a thermal...

19th European Biosolids & Organic Resources Conference & Exhibition
www.european-biosolids.com
Organised by Aqua Enviro
THERMAL HYDROLSIS AT DAVYHULME WwTW – ONE YEAR ON
Edgington R M1, Belshaw D1, Lancaster L1 and Jolly M2 1United Utilities, 2 Black & Veatch
Corresponding Author: Rachel Edgington Tel. 01925 237000 Email
Abstract
Davyhulme’s sludge treatment facility, using CAMBI thermal hydrolysis, is designed to
treat an average 91000tds per annum, arising from 50% of the population served by
United Utilities. All sludge from Davyhulme (Manchester) and seven other large works
is treated. Raw sludge is imported as 25%DS cake from these outlying works. The
facility was designed to increase United Utilities’ renewable energy generation and
has 12MW of installed generating capacity. It was also designed to ensure flexibility in
sludge treatment and recycling throughout the North West region. The digested
sludge is either dewatered to a cake for recycling to land or pumped, as liquid, to
Mersey Valley Processing Centre for incineration.
The plant was commissioned during 2013 with performance tests being undertaken
during this period. Since then, the plant has been optimised to reduce chemical
costs, maximise biogas usage and energy generation. This has been achieved by the
operational staff using key performance indicators.
The plant has also produced an enhanced quality sludge product that has been
successfully marketed and used by farmers, whom had not previously used sludge on
their agricultural land.
Keywords
Thermal hydrolysis, digestion pre-treatment, advanced digestion, optimisation,
combined heat and power.
Project Background
The North West of England has a predominance of grass land over 83% with the
remaining 17% being arable. A recent land bank report concluded that of the 83%
grass land in the North West only 20% would be suitable for United Utilities (UU) to
utilise. UU require at least 18000Ha of land to manage its sludge every year.
UU sludge recycling operations have historically focussed on the small arable land
bank, producing a conventionally treated dewatered product suitable for surface
application. This strategy was being implemented against a backdrop of increasing
sludge production and more stringent regulations in regard to sludge application.
Therefore to maintain and enhance UU’s recycling operations required a change in
focus.

19th European Biosolids & Organic Resources Conference & Exhibition
www.european-biosolids.com
Organised by Aqua Enviro
UU sludge strategy had focussed on a balance of recycling and disposal due to the
land bank constraints; more recently (over the last few AMPs) this focus has shifted
towards provision of an enhanced treated sludge. The significant shift towards the
enhanced treated product quality standard has been driven by the land bank
constraints, more stringent environmental regulations and competition.
The focus of this change in strategy is the central belt of the North West, incorporating
Manchester, Liverpool and a number of large cities and towns in Lancashire, as the
greatest impact was being felt in this area. UU needed to provide a sustainable outlet
for sludge in this part of the region, reduce costs and its operational carbon footprint.
This strategy to recover the valuable resource in sludge was developed in late AMP3
(Asset Management Plan) and identified the key drivers as:
To reduce the land bank risk.
To produce a sludge cake that obtained enhanced quality status for
recycling to agriculture.
To minimise the digested sludge quantities by greater solids destruction.
To obtain an improvement in dewaterability of the digested sludge, hence
reducing the quantity of wet mass for recycling.
To maximise energy generation.
To fully utilise, where possible, existing assets at Davyhulme.
To replace the ageing lime facilities at seven sites.
To reduce the Company’s carbon dioxide emissions by 21%.
The solution was the installation of a thermal hydrolysis (TH) plant at Davyhulme which
was designed to treat an average of 91000tdspa (peak of 121000tdspa) which arises
from 50% of the population of UU.
The central treatment facility at Davyhulme was designed to ensure flexibility in
sludge treatment and recycling throughout the North West Region. Seven feeder sites
with a design capacity of 52000tdspa produce raw sludge cake that is imported into
Davyhulme. The seven sites are shown (in red) in Figure 1.
Figure 1: The Feeder Sites – Raw Sludge Cake Imports

19th European Biosolids & Organic Resources Conference & Exhibition
www.european-biosolids.com
Organised by Aqua Enviro
The final digested sludge, produced at Davyhulme, can either be dewatered to a
cake for recycling to land or the liquid sludge pumped to Mersey Valley Sludge
Processing Centre (MVSPC), (shown as Shell Green in Figure 1) for dewatering and
incineration. Historically, Davyhulme’s digested sludge had always been incinerated
following the ban on sea disposal in 1998; hence an important factor of the project
was to open up a land-bank for the receipt of this enhanced quality sludge cake. This
is discussed later.
Process Description
Of the average design throughput of 91000tdspa, 39000tdspa is the indigenous
sludge arising at Davyhulme itself, sludge pumped from works close to Davyhulme
and other liquid sludges from smaller wastewater treatments works; the remainder is
from the seven feeder sites.
The process flow diagram for the Davyhulme sludge treatment centre is shown in
Figure 2 which shows the dewatering of the liquid raw sludges to a 27%DS cake
followed by storage in silos. These dewatering centrifuges are normally called
thickening centrifuges to differentiate them from the dewatering of digested sludge.
The imported raw cake is stored in separate sludge silos at about 25%DS. These cakes
are re-liquefied to 16.5%DS using heated final effluent before passing forward to the
four TH streams. Each TH stream consists of a pulper, five reactors and a flash tank.
Following the flash tanks, the hot sludge is cooled, using air blast coolers and then the
use of cold water to give a sludge feed of 40OC and 11%DS to the eight existing
digesters (two per stream). The eight digesters have a total capacity of 60000m3.
Figure 2: Process Flow Diagram
Following digestion, the sludge passes through a degasing tank where air is blown
through to inhibit methanogenesis from where it is transferred to storage tanks. From

19th European Biosolids & Organic Resources Conference & Exhibition
www.european-biosolids.com
Organised by Aqua Enviro
here, up to 32000tdspa is dewatered to in excess of 30%DS by two dedicated
centrifuges, followed by storage in silos, in readiness for recycling to agriculture. The
remainder of the sludge is pumped down the Mersey Valley Sludge Pipeline (shown in
blue in Figure 1) for incineration at the MVSPC
The biogas produced is stored into two 9000m3 double membrane gas holders.
Following removal of siloxanes and other contaminants, the biogas is used to feed
five combined heat and power units (CHP) and three combination boilers. The boilers
are capable of raising stream for the TH plant using a combination of exhaust waste
heat (from the CHPs) and biogas in the fired section of the boilers. The total CHP
capacity is 12MW, compared to the 7.2 MW installed prior to the TH plant; of this
7.2MW, about 3.7MW of electricity was generated at Davyhulme prior to the project.
These three old engines, each of 2.4MW, were re-utilised in the scheme and were
moved from the old engine house to the new plant building.
Commissioning
The new advanced digestion project was designed, constructed and installed
between 2009 and 2012. Commissioning commenced in autumn 2012 on a section
by section basis with take-over tests at the end of the commissioning of each section.
Belshaw et al (2013) gives further detail on the sectional completion timescales and
the results of the take-over tests; while Jolly et al (2013) describes the actual
commissioning process used for digesters, initially using seed sludge from another site,
then using TH sludges from Davyhulme to seed the later commissioned digesters.
Operational Framework
Production Planning and Operation
During the design stage, Davyhulme was envisaged to generate about 60% of the
Company’s electrical generation with the remainder produced at the smaller
digestion and CHP plants within the region. By introducing a facility of this scale to an
organisation built and budgeted on geographical areas, it became apparent that a
significant change in the way UU viewed its treatment works and sludge facilities was
needed. The Company no longer has a waste product in need of disposal, it now has
a large sustainable raw material, sludge, which can be fed through the energy
factory, producing higher levels of biogas per tDS and generating more electricity. As
with any factory and production line, each part of the chain is important to maximise
productivity, so with this in mind real emphasis has been placed on seeing the whole
region as one large production line with a common goal, to produce a fit for purpose
product for outlet, whilst maximising the amount of electricity generated in the most
economical way possible.
In order for the Company to make this vital transition and effectively manage the
system, UU needed to plan for and understand what the ideal operating state would
look like, how to divide the system up creating envelopes of operation, establish
ownership and accountability for each stage of the production line and determine
the best method of communication between those stages.
19th European Biosolids & Organic Resources Conference & Exhibition
www.european-biosolids.com
Organised by Aqua Enviro
Once these were established a number of important measures and “rules” were
developed to give the owner of each section clarity of what they were expected to
undertake to ensure that the production line operates efficiently.
Typical rules included:
To ensure at the feeder sites that raw sludge is removed from site quickly to
maintain high organic and volatile matter content.
Logistics having the correct number of vehicles available at the required time.
Having enough storage capacity at Davyhulme to receive the ideal volume
needed for TH plant.
Having enough dewatering liquor treatment capacity for indigenous sludge.
CHP availability.
Setting the correct volume requirements to keep the incineration plant auto-
thermic.
The final step to link all these activities together was the introduction of a Sludge
Production Planning (SPP) team. By installing extra in-line monitoring instruments at site
level, combined with accurate sample analysis data, the central SPP team were able
to view information for all of UU’s sludge facilities, giving them a holistic view of key
performance indicators across the region. By having information such as the quantity
and quality of sludge in the region, the quantity and quality of biogas generated, the
performance of each digestion plant, CHP efficiency and energy generated at the
click of a button, resulted in informed decision making much easier.
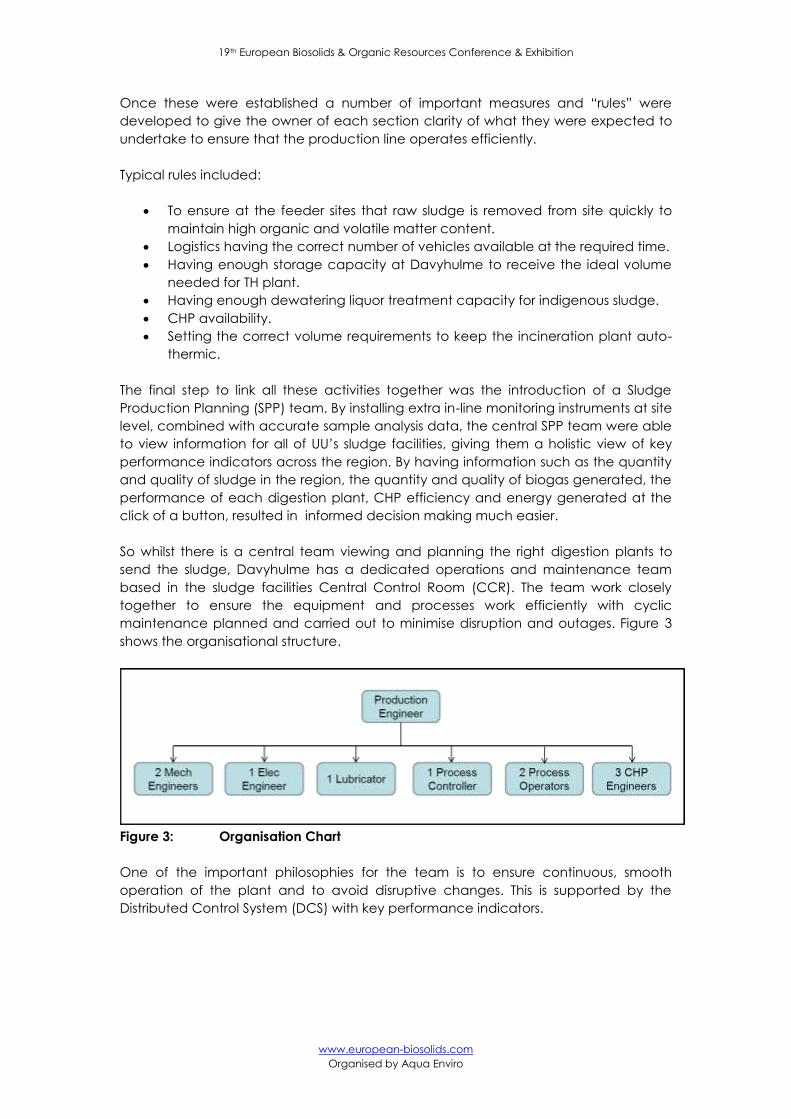
So whilst there is a central team viewing and planning the right digestion plants to
send the sludge, Davyhulme has a dedicated operations and maintenance team
based in the sludge facilities Central Control Room (CCR). The team work closely
together to ensure the equipment and processes work efficiently with cyclic
maintenance planned and carried out to minimise disruption and outages. Figure 3
shows the organisational structure.
Figure 3: Organisation Chart
One of the important philosophies for the team is to ensure continuous, smooth
operation of the plant and to avoid disruptive changes. This is supported by the
Distributed Control System (DCS) with key performance indicators.

19th European Biosolids & Organic Resources Conference & Exhibition
www.european-biosolids.com
Organised by Aqua Enviro
Distributed Control System
The sludge treatment facility, from import reception to the export of enhanced
quality compliant sludge is controlled using a sophisticated and complex central
DCS. The DCS integrates each individual asset and process in the field allowing
automation and process control throughout the sludge train in fine detail. The system
uses sound logic to control each stage of the process from simple management of
sludge import tankers and tank levels to complex processes of accurately diluting
sludge to the specified %DS, automating batch processes on TH reactors and
managing engine efficiencies to maximise generation. As mentioned previously,
Davyhulme WwTW and MVSPC are intrinsically linked, so the DCS can be monitored
at both sites giving accurate real time data, invaluable for decision making. As well
as automated control, the system also serves as a central database where further
optimisation can be realised. The DCS has been engineered to suit the needs of UU in
many ways to enhance efficiency and production. Some key areas are listed in Table
1.
Table 1: Key Functions of the DCS
Item Objective Control System Requirements
1 Manage and minimise OPEX
costs
Collection of data and reporting of
information to enable the most cost effective
operation through optimisation
Monitoring of energy, chemical and utilities
consumption with respect to production,
down to individual asset level to highlight poor
performance
2 Maximise availability of
critical equipment
Provide critical equipment condition
monitoring instrumentation to allow collection
of data and reporting of information to enable
early detection of deterioration of asset
condition and performance and allow
anticipation of maintenance needs.
3 Optimise operation Extensive automation and centralised control
of Sludge Treatment and Handling process
plant from within Central Control Room (CCR).
4 Enable objective
assessments to repair
upgrade or replace
equipment or infrastructure
Collection and archiving of performance data
and reports
5 Plan maintenance DCS System prompts users to raise preventive
maintenance work order requests in external
asset management system in response to
certain plant equipment failures or condition
alerts.
6 Provide enterprise level
management
DCS System will report local key performance
data into UU corporate system for
performance reporting using standard
communication protocols
7 Manage critical spares
purchasing
Inclusion & development of a Davyhulme
WwTW spares management database.

19th European Biosolids & Organic Resources Conference & Exhibition
www.european-biosolids.com
Organised by Aqua Enviro
8 Train the workforce on using
new technologies and
management tools
Systems training through simplified plant
operation simulation
9 Integrated, intuitive
electronic storage and
retrieval O&M Manuals,
Documents and Drawings &
H&S File information.
Inclusion & development of a system based on
the use of a Windows Folder structure.
Figure 4 gives an example of one of the screens displayed in the CCR. Data recorded
on a daily basis can be plotted to give trends which allows deterioration in
performance of the plant to be monitored and corrected where necessary to give
optimal performance.
Figure 4: Example of Optimisation Screen
Key Performance Indicators
The plant at Davyhulme has been fully operational since July 2013. The optimisation
phase of the project commenced and focused on maximising electricity generation,
minimising electricity usage and reducing chemical consumption; using the
information generated by the DCS.
The system is set up to display key performance indicators (seen in Figure 4) which are
monitored by the operational personnel on site and indicate how efficiently the plant
is operating. Each of the parameters has a cost implication. The parameters are
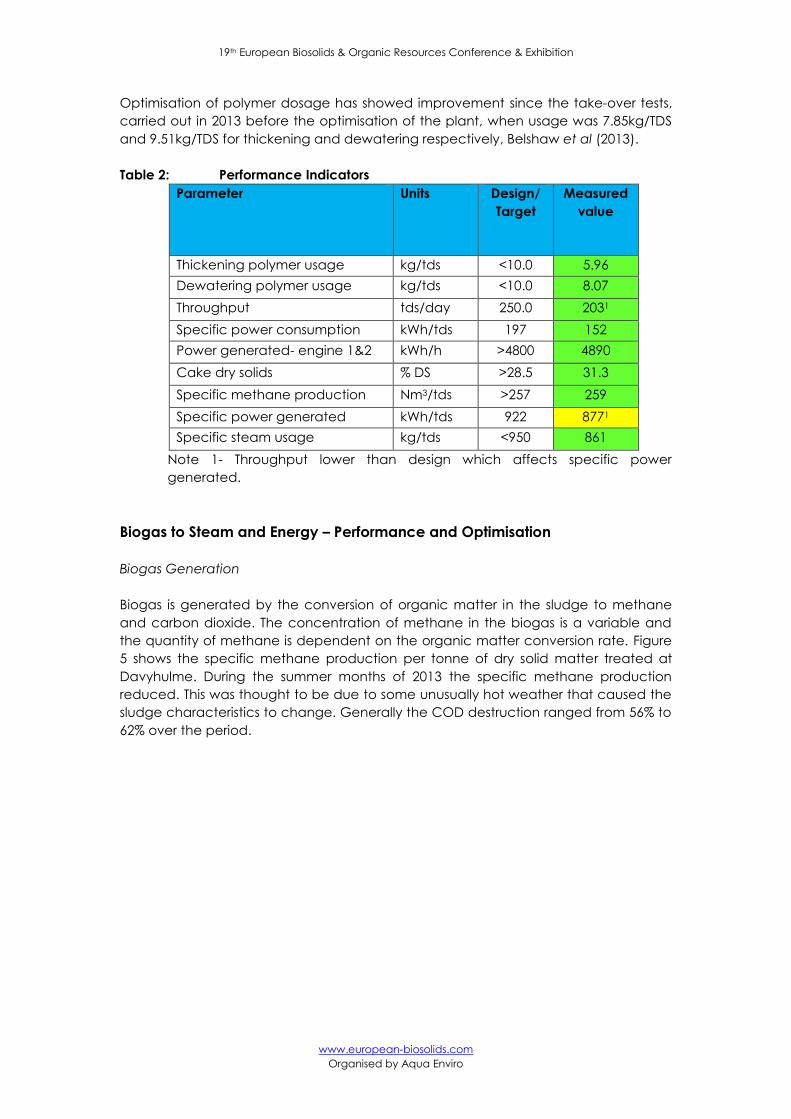
updated daily and reported monthly. Table 2 shows the average values recorded for
28 day Performance Test ending in March 2014. These results show that many of the
design parameters out-perform their design values, due to the optimisation that has
taken place.
19th European Biosolids & Organic Resources Conference & Exhibition
www.european-biosolids.com
Organised by Aqua Enviro
Optimisation of polymer dosage has showed improvement since the take-over tests,
carried out in 2013 before the optimisation of the plant, when usage was 7.85kg/TDS
and 9.51kg/TDS for thickening and dewatering respectively, Belshaw et al (2013).
Table 2: Performance Indicators
Parameter Units Design/
Target
Measured
value
Thickening polymer usage kg/tds <10.0 5.96
Dewatering polymer usage kg/tds <10.0 8.07
Throughput tds/day 250.0 2031
Specific power consumption kWh/tds 197 152
Power generated- engine 1&2 kWh/h >4800 4890
Cake dry solids % DS >28.5 31.3
Specific methane production Nm3/tds >257 259
Specific power generated kWh/tds 922 8771
Specific steam usage kg/tds <950 861
Note 1- Throughput lower than design which affects specific power
generated.
Biogas to Steam and Energy – Performance and Optimisation
Biogas Generation
Biogas is generated by the conversion of organic matter in the sludge to methane
and carbon dioxide. The concentration of methane in the biogas is a variable and
the quantity of methane is dependent on the organic matter conversion rate. Figure
5 shows the specific methane production per tonne of dry solid matter treated at
Davyhulme. During the summer months of 2013 the specific methane production
reduced. This was thought to be due to some unusually hot weather that caused the
sludge characteristics to change. Generally the COD destruction ranged from 56% to
62% over the period.

19th European Biosolids & Organic Resources Conference & Exhibition
www.european-biosolids.com
Organised by Aqua Enviro
150
170
190
210
230
250
270
290
310
330
350
30/06/2013
21/07/2013
11/08/2013
01/09/2013
22/09/2013
13/10/2013
03/11/2013
24/11/2013
15/12/2013
05/01/2014
26/01/2014
16/02/2014
09/03/2014
30/03/2014
20/04/2014
11/05/2014
01/06/2014
22/06/2014
13/07/2014
03/08/2014
24/08/2014
Spe
cifi
c m
eth
ane
ge
ne
rati
on
(N
m3
/td
s)
Davyhulme specific methane production
Target 257Nm3/tds methane
Figure 5: Specific Methane Production
Biogas Usage and Optimisation
Biogas is used by CHP engines, boilers, vent air burner and flare stack. Figure 6 shows
the percentage usage by each of the four users, while Table 3 shows the average
values for 2014 compared with the design values.
70
75
80
85
90
95
10030/06/2013
21/07/2013
11/08/2013
01/09/2013
22/09/2013
13/10/2013
03/11/2013
24/11/2013
15/12/2013
05/01/2014
26/01/2014
16/02/2014
09/03/2014
30/03/2014
20/04/2014
11/05/2014
01/06/2014
22/06/2014
13/07/2014
03/08/2014
24/08/2014
Pe
rce
nta
ge
Davyhulme biogas usage
Percentage biogas usage on CHP engines Percentage biogas usage on flare
Biogas usage on VAB Percentage biogas usage on boilers
Figure 6: Biogas usage

19th European Biosolids & Organic Resources Conference & Exhibition
www.european-biosolids.com
Organised by Aqua Enviro
Table 3: Gas production and Usage
Parameter Units Average
2014
Design
Specific methane production Nm3/tds 252 257
Throughput tds/day 192 250
Vent air burner biogas usage % 0.4 0.4
Flare biogas usage % 1.2 0
Boiler biogas usage % 4.1 8.0
CHP biogas usage % 94.3 91.2
The instantaneous steam requirement for the TH process is supplied by the steam
boilers. These are combination boilers that take heat from the engine exhaust and
then top up the steam required by firing a burner which burns biogas. When the boiler
burner operates biogas is diverted away from the engines and less electricity is
generated. Ideally no top up steam would be required but this is very difficult to
achieve as the steam requirement from the batching of the reactors causes peaks
and troughs of steam demand.
Figure 6 shows the significant reduction in the biogas usage by the boilers. The usage
has dropped from around 12% in 2013 of the total biogas to around 4% over the
optimisation period. This is due to careful optimisation of the steam system by
reducing the maximum opening position of the TH plant reactor steam valves and
putting as many reactors as available in service.
The percentage of biogas sent to the flare is also shown on Figure 6. The percentage
of biogas sent to the flare over the period has also reduced as the operation of the
engines and boilers was optimised. At the design point (250tds/day) the plant is
designed so that four engines run at 100% output. The sludge throughput over the
optimisation period has been less than the design value of 250tds/d and it was found
that if the engines are set to run at less than 100% output this allows continuous
running and minimises trips. However by running at less than 100% load the efficiency
of conversion to electricity is reduced and the exhaust temperature increases. This in
fact allows greater exhaust heat energy for steam raising.
Steam Generation and Optimisation
Figures 7 and 8 below show the boiler steam output before and after optimisation.

19th European Biosolids & Organic Resources Conference & Exhibition
www.european-biosolids.com
Organised by Aqua Enviro
Figure 7: Steam Usage before Optimisation
Figure 8: Steam Usage after Optimisation
Table 4 summarises the operation of the boilers before and after optimisation. It can
be seen from the two figures and Table 4 that although the average steam usage in
Period 2 (after optimisation) is slightly greater than in Period 1 (before optimisation)
the fluctuation in demand is lower (peak demand is reduced from 22t/h to 12t/h).
There is also a consistent base demand of over 6t/h.

19th European Biosolids & Organic Resources Conference & Exhibition
www.european-biosolids.com
Organised by Aqua Enviro
When the steam demand decreases below the steam raising capacity available
from the CHP engines, a bypass valve opens in the exhaust line and exhaust heat
exits to atmosphere without any heat recovery. Thus if steam demand matched
steam raising capacity of the exhaust heat from the CHP engines, the engine exhaust
can be used consistently to raise steam rather than operating on bypass wasting heat
energy to atmosphere. When the steam demand is greater than provided by the
CHP exhaust then biogas is diverted to the boilers to fire the boilers. An ideal situation
would allow no biogas usage on the boilers however due to the fluctuating steam
demand from the TH reactors, this is very difficult to achieve.
Table 4: Steam Demand
Parameter Maximum
steam demand
(kg/h)
Average
steam demand
(kg/h)
Standard
deviation
(kg/h)
Period 1 22 988 6 893 4 829
Period 2 12 691 7 259 1 862
CHP average exhaust
heat (2014)
7 350
CHP optimisation
Data has been collected on the operation and performance of the CHP installation
from July 2013. The reliable running of the engines over this period was gradually
improved. The electricity output from the site has increased from around 3000kW to
above 7500kW over the time period and the specific electricity production has
increased from around 600kW/tds to above 900kW/tds, a significant improvement.
The specific electricity production in December 2013 was above the design point of
922kW/tds.
Figure 9 shows the specific power consumption increasing up to December 2013 with
a slight decline in 2014 to around 850kW/tds. The actual power output has decreased
over the summer of 2014 due to a decrease in sludge load available for processing
but the specific power output has remained fairly consistent.

19th European Biosolids & Organic Resources Conference & Exhibition
www.european-biosolids.com
Organised by Aqua Enviro
400
500
600
700
800
900
1000
3000
4000
5000
6000
7000
8000
9000
30
/06
/20
13
21
/07
/20
13
11
/08
/20
13
01
/09
/20
13
22
/09
/20
13
13
/10
/20
13
03
/11
/20
13
24
/11
/20
13
15
/12
/20
13
05
/01
/20
14
26
/01
/20
14
16
/02
/20
14
09
/03
/20
14
30
/03
/20
14
20
/04
/20
14
11
/05
/20
14
01
/06
/20
14
22
/06
/20
14
13
/07
/20
14
03
/08
/20
14
24
/08
/20
14
Spe
cifi
c p
ow
er
ou
tpu
t (K
w/t
ds)
Tota
l po
we
r ge
ne
rate
d (
kW)
Davyhulme energy generation
Total power output Specific power output
4 per. Mov. Avg. (Total power output) 4 per. Mov. Avg. (Specific power output)
Figure 9: Power Generation and Specific Power Generation
Table 5 gives a comparison between the power output figures and the design figures.
Table 5: Power Produced
Parameter Units Average
2014
Design
Specific electricity production kW/tds 856 922
Total power output kW 6814 9714
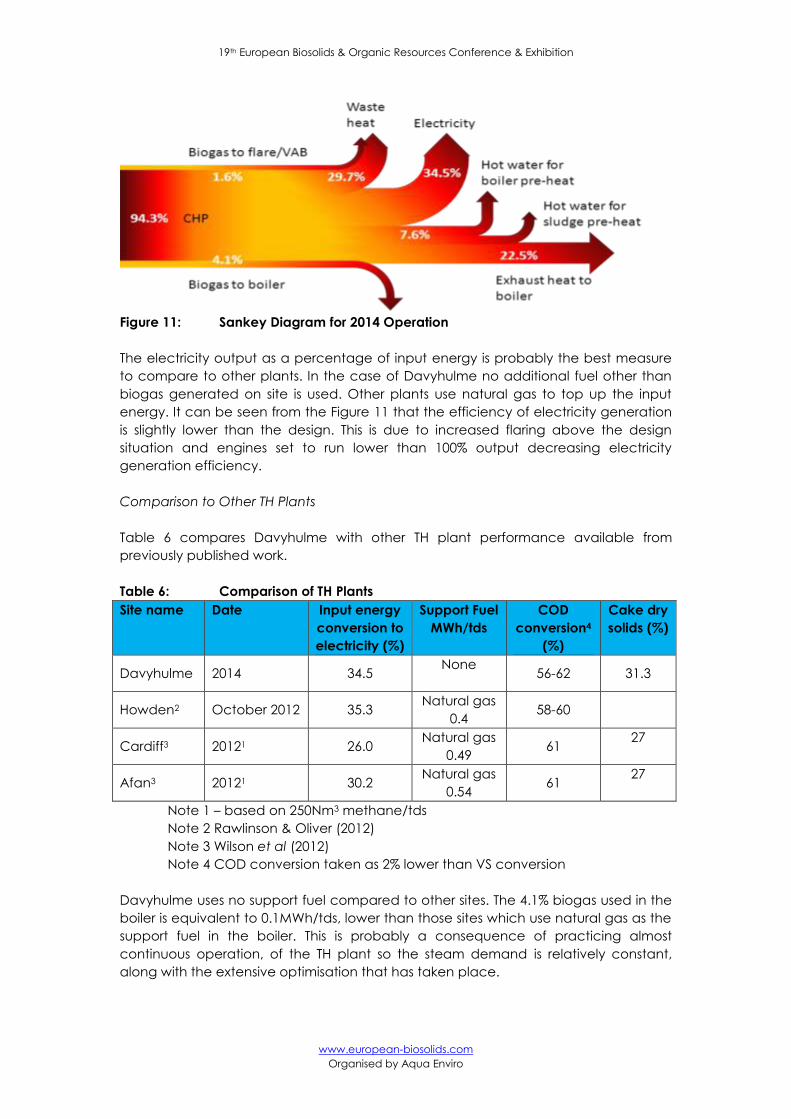
Sankey Diagrams
The Sankey diagrams summarise the performance of the plant in terms of energy
input, electricity generation and energy usage. Figure 10 shows the Sankey diagram
for the design while Figure 11 shows the Sankey diagram for the operation of the
plant during 2014.
Figure 10: Sankey Diagram for Design
19th European Biosolids & Organic Resources Conference & Exhibition
www.european-biosolids.com
Organised by Aqua Enviro
Figure 11: Sankey Diagram for 2014 Operation
The electricity output as a percentage of input energy is probably the best measure
to compare to other plants. In the case of Davyhulme no additional fuel other than
biogas generated on site is used. Other plants use natural gas to top up the input
energy. It can be seen from the Figure 11 that the efficiency of electricity generation
is slightly lower than the design. This is due to increased flaring above the design
situation and engines set to run lower than 100% output decreasing electricity
generation efficiency.
Comparison to Other TH Plants
Table 6 compares Davyhulme with other TH plant performance available from
previously published work.
Table 6: Comparison of TH Plants
Site name Date Input energy
conversion to
electricity (%)
Support Fuel
MWh/tds
COD
conversion4
(%)
Cake dry
solids (%)
Davyhulme 2014 34.5 None
56-62 31.3
Howden2 October 2012 35.3 Natural gas
0.4 58-60
Cardiff3 20121 26.0 Natural gas
0.49 61
27
Afan3 20121 30.2 Natural gas
0.54 61
27
Note 1 – based on 250Nm3 methane/tds
Note 2 Rawlinson & Oliver (2012)
Note 3 Wilson et al (2012)
Note 4 COD conversion taken as 2% lower than VS conversion
Davyhulme uses no support fuel compared to other sites. The 4.1% biogas used in the
boiler is equivalent to 0.1MWh/tds, lower than those sites which use natural gas as the
support fuel in the boiler. This is probably a consequence of practicing almost
continuous operation, of the TH plant so the steam demand is relatively constant,
along with the extensive optimisation that has taken place.

19th European Biosolids & Organic Resources Conference & Exhibition
www.european-biosolids.com
Organised by Aqua Enviro
First Maintenance Inspections
As the reactors inside the TH plant are pressurised vessels, there is a statutory
requirement to inspect each vessel annually. At Davyhulme this was carried out in
early 2014 after one year in service. Due to the flexibility of the design it is possible to
take one stream out of service whist feeding the associated digesters from the
remaining three streams. Furthermore, there is sufficient capacity in those three
streams to maintain the design throughput of 91000tDS/a. So by staggering the
inspections of each stream there is no impact on productivity at any stage.
After consultation with the supplier, the preferred method of emptying the vessels was
to run the reactor batches as normal, using heated final effluent instead of sludge, for
a short period of time. The introduction of steam is maintained to break up any
hardened solids deposited on the side walls of the vessels to aid cleaning. The
recirculation system was also allowed to continue to flush through the pumps and
lines whilst allowing mixing in the pulper tank. Once this is complete, the reactors are
then depressurised and drained down using UU vactor tankers. After they were
drained the vessels were then pressure washed internally ready for inspection.
Once the stream was out of service and the integrity of the vessels had been
inspected, the site field service engineers carried out detailed maintenance activities
of the ancillary equipment. This process initially took 10 to12 days on the first stream,
however due to lessons learnt and experience this now takes 5 to 7 days. Table 7
details issues found and actions taken during the first inspections.
Table 7: Details of First Inspections
Issue Actions taken
Small amount of debris in pulper tank
(stones, metal etc)
Cleaned out and debris issue communicated
to feeder sites
Steam lance tips eroded in pulper tank.
Lance tips in pulper reformed. Lances in
reactor vessels modified from angled to
square so will not erode in same manner.
Inlet steam valves seals perished and
some valves showing signs of erosion.
Replaced eroded valves where necessary
and new seals throughout.
Some sludge inlet valves showing signs of
wear allowing small amount of steam to
pass
Replaced worn valves where necessary.
Flash tank wear plates worn (as design) Replaced all wear plates and extended by
100mm to help maintain internal wall integrity.
Small amount of residue lining internal
pipework in sludge coolers heat
exchanger
Flushed clear lines
On the whole the vessels and equipment were in good condition given the
environment they are working in. All replacements and modifications carried out
were minor in terms of cost and were generally consumable items. Now the first
19th European Biosolids & Organic Resources Conference & Exhibition
www.european-biosolids.com
Organised by Aqua Enviro
inspections and maintenance have been carried out, it allows the site team to build
a business as usual plan for future shutdowns and confidence that outages will be
kept to a minimum.
Experience of Sludge Recycling
Although energy production was one of the key drivers, the other main driver has
been the production of an enhanced treated digested sludge cake that was suitable
for recycling to agriculture.
During the detailed design of Davyhulme sludge treatment centre, the following
challenges were identified by UU’s sludge recycling team:
• To recycle sewage sludge to agriculture from Davyhulme for the first time.
• To introduce new farmers to the use of sewage sludge as an alternative to
inorganic fertilisers.
• To maintain commitment from the farmers using sludge during the
development of the project.
The recycling team engaged with local farmers just prior to commissioning, inviting
them to Davyhulme and introducing them to other farmers who already used
sewage sludge from digestion facilities elsewhere in the North West region. During the
project commissioning phase UU took the opportunity to engage with the farming
community again and allow them to see and test the product for real. This proved
very successful.
UU managed to open an entirely new land bank of suitable size to manage sludge
production at the facility within one year, 70% of the land bank had never previously
been used by UU or any other Water Company
“The farmers love it” a quote from Mansfield (2014) the recycling Manager for the
Southern part of the Company’s region. Examples and quotes from two of the farmers
UU now service are given below:
Fred Pilling (2014) an up-land farmer – “for the first time ever I have managed
to get two silage cuts from the fields which received cake”. This meant two
options for Fred; he could either sell the excess silage or use his extra silage to
increase his stock housing period. Both options helped Fred.
Ken Holden (2014) used TH cake on 15ha of his land. He would normally
achieve a yield of 280 bales of silage, after the cake application he obtained
390 bales, a 40% yield increase.
UU continue to market the sludge we produce from Davyhulme and now receive a
very high demand for the product.

19th European Biosolids & Organic Resources Conference & Exhibition
www.european-biosolids.com
Organised by Aqua Enviro
Conclusions
The sludge treatment centre at Davyhulme has been successfully optimised, in
reducing Opex costs and maximising income from energy generation.
The operation of the plant, supported by the DCS system and operational staff
has met the design/target values for the key performance indicators.
Results from the first maintenance inspection revealed no major issues.
The enhanced quality sludge cake has been marketed and supplied to
farmers within the North West region with positive benefits.
New land bank has been opened up within the North West region for sludge
recycling.
References
Belshaw, D., Edgington, R. and Jolly, M. (2014) Commissioning of United Utilities
Thermal Hydrolysis Digestion Plant at Davyhulme Wastewater Treatment Works.
18th European Biosolids and Organic Resources Conference
Holden, K. (2014) Personal Communication
Jolly, M., Belshaw, D. and Telfer, J. (2014) The Biochemical Relationship in
Anaerobic Digestion after Thermal Hydrolysis at Davyhulme. 18th European
Biosolids and Organic Resources Conference
Mansfield, H. (2014) Personal Communication
Pilling, F. (2014) Personal Communication
Rawlinson, D. and Oliver, B. (2012) New Thermal Advanced Digestion Plant at
Northumbrian Water’s Howden Works. 17th European Biosolids and Organic
Resources Conference
Wilson, S., Brown, R., Oliver. B. and Merry, J. (2012) Operational Experience with
Thermal Advanced digestion in Dwr Cymru Welsh Water. 17th European
Biosolids and Organic Resources Conference