Thermal Expansion, Thermal Conductivity, And Heat Capacity Measurements at Yucca Mountain,
15
To cite this paper: Int. J. Rock Mech. & Min. Sci. 34:3-4, paper No. 040. Published by Elsevier Science Ltd 1997 Copyright © 1997 Elsevier Science Ltd Int. J. Rock Mech. & Min. Sci. Vol. 34, No. 3-4, 1997 ISSN 0148-9062 To cite this paper: Int. J. RockMech. &Min. Sci. 34:3-4, Paper No. 040 THERMAL EXPANSION, THERMAL CONDUCTIVITY, AND HEAT CAPACITY MEASUREMENTS AT YUCCA MOUNTAIN, NEVADA Nancy S. Brodskyl; Michael Rigginsl; James Connolly 2 1 Sandia National Laboratories, Albuquerque, NM 87185, USA 2 Department of Geology and Meteoritics, University of New Mexico, Albuquerque, NM 87131, USA ABSTRACT A very extensive database for thermal properties of Yucca Mountain tufts has been collected to characterize the Yucca Mountain, NV site. Cores from boreholes UE25 NRG-4, UE25 NRG-5, USW NRG-6, and USW NRG-7/7A, all drilled near the North Ramp of the Exploratory Studies Facility, were tested to determine thermal conductivity, thermal expansion, and specific heat. Specimens were tested from four thermal-mechanical units (TCw, PTn, TSwl, and TSw2) that included welded devitrified (TCw, TSwl, TSw2) and nonwelded vitric (PTn) tuff. The effects of moisture content, temperature, and composition were assessed. Petrologic data were obtained from 97 samples, all from USW NRG-6, to assess relationships between measured thermal properties and composition. Copyright © 1997 Elsevier Science Ltd KEYWORDS Temperature effects • thermal expansion • thermal conductivity • specific heat • tuff • Yucca Mountain • x-ray diffraction • laboratory tests • radioactive waste • rock properties • mineralogy • petrology INTRODUCTION The U.S. Department of Energy (DOE) is investigating Yucca Mountain, Nevada as a potential site for the disposal of high-level nuclear waste. The site is located near the southwest corner of the Nevada Test Site in southern Nye County, Nevada. The engineering design for the high-level nuclear waste repository is unique because large quantities of heat will be generated by the waste packages. Thus it is essential that heat transfer properties such as thermal conductivity, thermal expansion, and heat capacity be measured so that repository performance can be assessed. Thermal properties are largely a function of mineralogy, and so a phenomenological understanding of these properties requires that mineralogy be determined. Test specimens were taken from four boreholes drilled along the North Ramp of the Exploratory Studies Facility (ESF): boreholes UE25 NRG-4, UE25 NRG-5, USW NRG-6, and USW NRG-7/7A. These borehole designations will be abbreviated as NRG-4, NRG-5, NRG-6, and NRG-7, respectively. Rocks were from four thermal-mechanical (T/M) units (TCw, PTn, TSw 1, and TSw2) that included welded devitrified (TCw, TSwl, TSw2) and nonwelded vitric (PTn) tuff. A total of 143 thermal conductivity tests, 132 thermal expansion tests, and 10 specific heat tests were conducted. There were more tests than test specimens because many specimens were tested at multiple saturation states. Only 95 ISSN 0148-9062
-
Upload
zulfani-aziz -
Category
Documents
-
view
24 -
download
2
description
Thermal Expansion, Thermal Conductivity, And Heat Capacity Measurements at Yucca Mountain,
Transcript of Thermal Expansion, Thermal Conductivity, And Heat Capacity Measurements at Yucca Mountain,

To cite this paper: Int. J. Rock Mech. & Min. Sci. 34:3-4, paper No. 040. Published by Elsevier Science Ltd 1997
Copyright © 1997 Elsevier Science Ltd
Int. J. Rock Mech. & Min. Sci. Vol. 34, No. 3-4, 1997 ISSN 0148-9062
To cite this paper: Int. J. RockMech. &Min. Sci. 34:3-4, Paper No. 040
THERMAL EXPANSION, THERMAL CONDUCTIVITY, AND HEAT CAPACITY MEASUREMENTS AT YUCCA MOUNTAIN,
NEVADA
N a n c y S. B r o d s k y l ; M i c h a e l R i g g i n s l ; J a m e s C o n n o l l y 2
1 Sandia National Laboratories, Albuquerque, NM 87185, USA
2 Department of Geology and Meteoritics, University of New Mexico, Albuquerque, NM 87131, USA
A B S T R A C T
A very extensive database for thermal properties of Yucca Mountain tufts has been collected to characterize the Yucca Mountain, NV site. Cores from boreholes UE25 NRG-4, UE25 NRG-5, USW NRG-6, and USW NRG-7/7A, all drilled near the North Ramp of the Exploratory Studies Facility, were tested to determine thermal conductivity, thermal expansion, and specific heat. Specimens were tested from four thermal-mechanical units (TCw, PTn, TSwl, and TSw2) that included welded devitrified (TCw, TSwl, TSw2) and nonwelded vitric (PTn) tuff. The effects of moisture content, temperature, and composition were assessed. Petrologic data were obtained from 97 samples, all from USW NRG-6, to assess relationships between measured thermal properties and composition.
Copyright © 1997 Elsevier Science Ltd
K E Y W O R D S
T e m p e r a t u r e effects • t h e r m a l e x p a n s i o n • t h e r m a l c o n d u c t i v i t y • specif ic heat • tu f f • Yucca M o u n t a i n • x - ray d i f fract ion • l a b o r a t o r y tests • rad ioac t ive was te • rock propert i e s • m i n e r a l o g y • p e t r o l o g y
I N T R O D U C T I O N
The U.S. Department of Energy (DOE) is investigating Yucca Mountain, Nevada as a potential site for the disposal of high-level nuclear waste. The site is located near the southwest corner of the Nevada Test Site in southern Nye County, Nevada. The engineering design for the high-level nuclear waste repository is unique because large quantities of heat will be generated by the waste packages. Thus it is essential that heat transfer properties such as thermal conductivity, thermal expansion, and heat capacity be measured so that repository performance can be assessed. Thermal properties are largely a function of mineralogy, and so a phenomenological understanding of these properties requires that mineralogy be determined. Test specimens were taken from four boreholes drilled along the North Ramp of the Exploratory Studies Facility (ESF): boreholes UE25 NRG-4, UE25 NRG-5, USW NRG-6, and USW NRG-7/7A. These borehole designations will be abbreviated as NRG-4, NRG-5, NRG-6, and NRG-7, respectively. Rocks were from four thermal-mechanical (T/M) units (TCw, PTn, TSw 1, and TSw2) that included welded devitrified (TCw, TSwl, TSw2) and nonwelded vitric (PTn) tuff. A total of 143 thermal conductivity tests, 132 thermal expansion tests, and 10 specific heat tests were conducted. There were more tests than test specimens because many specimens were tested at multiple saturation states. Only 95
ISSN 0148-9062

To cite this paper: Int. J. Rock Mech. & Min. Sci. 34:3-4, paper No. 040. Published by Elsevier Science Ltd 1997
specimens were tested for thermal conductivity, 120 specimens were tested for thermal expansion, and 10 specimens were tested for specific heat. For thermal conductivity measurements, four saturation levels were used: vacuum saturated, partially saturated, air dried (no effort was made to preserve or alter the moisture content), and oven dried. Thermal expansion test specimens were either air dried, oven dried, or vacuum saturated. All specific heat measurements were made on air dried specimens. Tests were conducted at room pressure and at temperatures between 25°C and 300°C. Although petrologic data were obtained for 97 samples from borehole NRG-6, only data from samples taken in proximity to thermal test specimens will be discussed here. Additional information is given in Brodsky et al. 1997.
Test specimens were prepared by New England Research, Inc. (NER) of White River Junction, VT. All specimens were ground, right circular cylinders with nominal specimen dimensions as given in Table 1.
TEST M E T H O D S
Brodsky et al. 1997 detail the thermal conductivity, thermal expansion, specific heat, and petrologic determinations. The thermal properties were measured by the Testing Services Division of Holometrix, Inc. (unconfined tests) and NER (confined tests); petrologic determinations, including x-ray diffraction (XRD) measurements, were conducted at the University of New Mexico. The methods are discussed briefly here.
Thermal conductivity measurements were made using the guarded heat flow meter (GHFM). The test specimen was located between two heater plates controlled at different temperatures, producing heat flow through the specimen. The heat flow was measured by a heat flux transducer (HFT) located between the specimen and one heater plate. Specimens containing moisture were tested at temperatures below 100°C by placing them in moisture containment cells. Measurement error was +4% of reading.
All the thermal expansion data were obtained using push-rod dilatometers. The specimen was placed in a receptacle at the end of a tube made of fused silica, which slid into a cylindrical furnace. As the temperature of the specimen changed, its length changed; this motion was transmitted by a push rod to a linear variable differential transformer (LVDT) located outside the heated area. Wet specimens were maintained in a high-humidity environment. Temperatures were ramped at a constant rate of 1 °C per minute. The mean coefficient of thermal expansion (a or MCTE) is the linear thermal expansion per unit change in temperature. It was calculated over 25°C intervals. Measurement error was 1 x 10⁻⁶ °C-1 for dry samples and 2x 10 -6 °C -1 when the environmental tube with humidity control was used.
The specific heat data reported here were obtained using an adiabatic pulse calorimeter. This instrument applies a known quantity of electrical energy to a specimen and measures the resulting rise in specimen temperature. Specific heat was measured every five degrees Celsius from 25 °C to 300°C. These raw data were smoothed using a two-segment, least-squares polynomial curve-fit. The equations for the polynomial fit were then used to determine specific heat (Cp) at 25°C intervals. The specific heat of a
substance is the amount of heat required to change one unit of mass by one degree Kelvin. Thermal capacitance (p.Cp) will be defined as the amount of heat required to change one unit of volume by one
degree Kelvin. Measurement error was within +2.5 % of reading.
Petrologic data were obtained from 97 samples from borehole NRG-6. For 32 samples, detailed data were obtained. Methods used to obtain these detailed data include microscopic examination of thin sections (to identify visible mineral and petrographic constituents, estimate the modal or volumetric
ISSN 0148-9062

To cite this paper: Int. J. Rock Mech. & Min. Sci. 34:3-4, paper No. 040. Published by Elsevier Science Ltd 1997
proportions of those constituents, and describe their textural and spatial arrangement); XRD analysis (to identify minerals too finely crystalline to identify optically, which are generally the majority of mineral components in these samples, and estimate their proportions); and major-element chemical analysis (to identify bulk rock chemistry and water content). Of these 32 samples, 13 were taken in proximity to a thermal expansion specimen.
RESULTS
Thermal Conductivity
The thermal conductivity data are summarized in Tables 2 and 3. Data are consistent with previous values reported in Nimick 1989. Thermal conductivities measured on saturated specimens exceeded those measured on dried specimens. This effect is illustrated by a plot of thermal conductivity versus temperature, shown in Figure 1. For dried specimens, conductivity is essentially constant. For saturated specimens, conductivities sometimes increased and sometimes decreased with increasing temperature. Decreases in thermal conductivity in specimens containing moisture may be affected by specimen dehydration. There were no consistent differences in thermal conductivities among the boreholes, so the data were averaged together. PTn consistently shows the lowest conductivities, while the TCw and TSw2 units have the highest conductivity values. TSwl specimens span a larger range of thermal conductivity and are intermediate in value. These data show that there is no substantial temperature dependence.
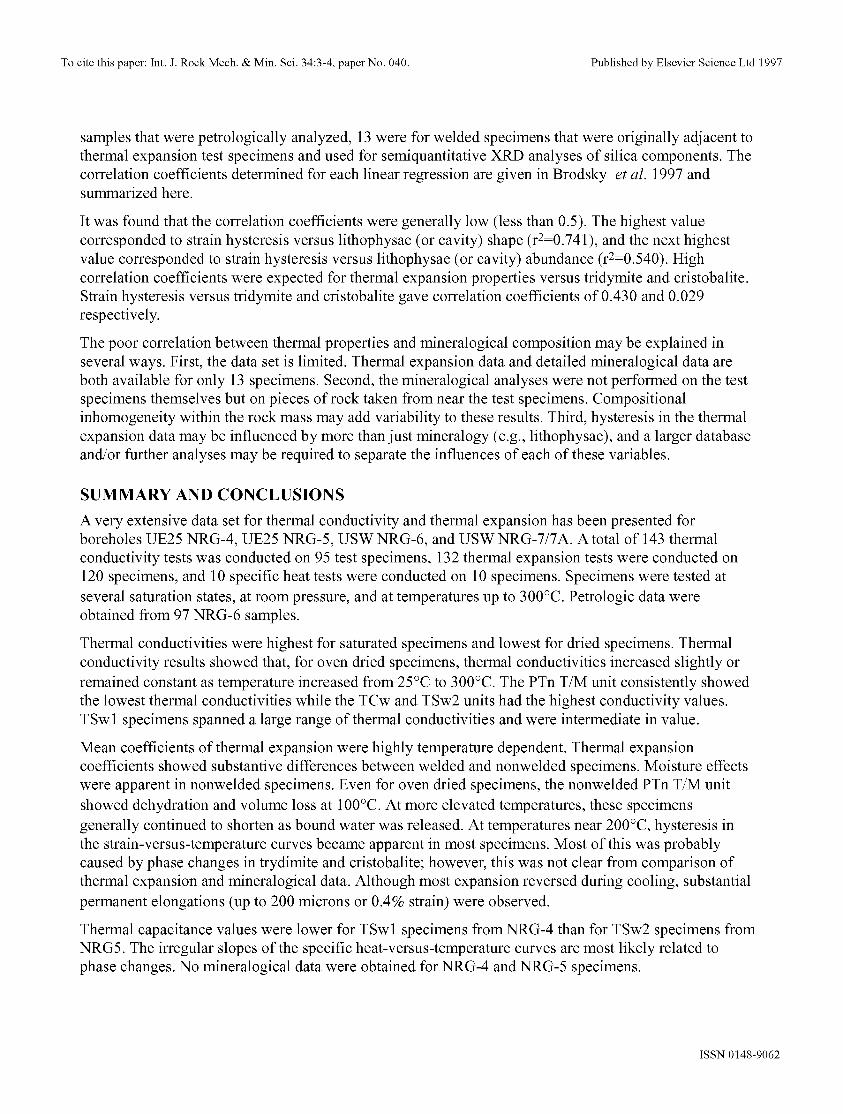
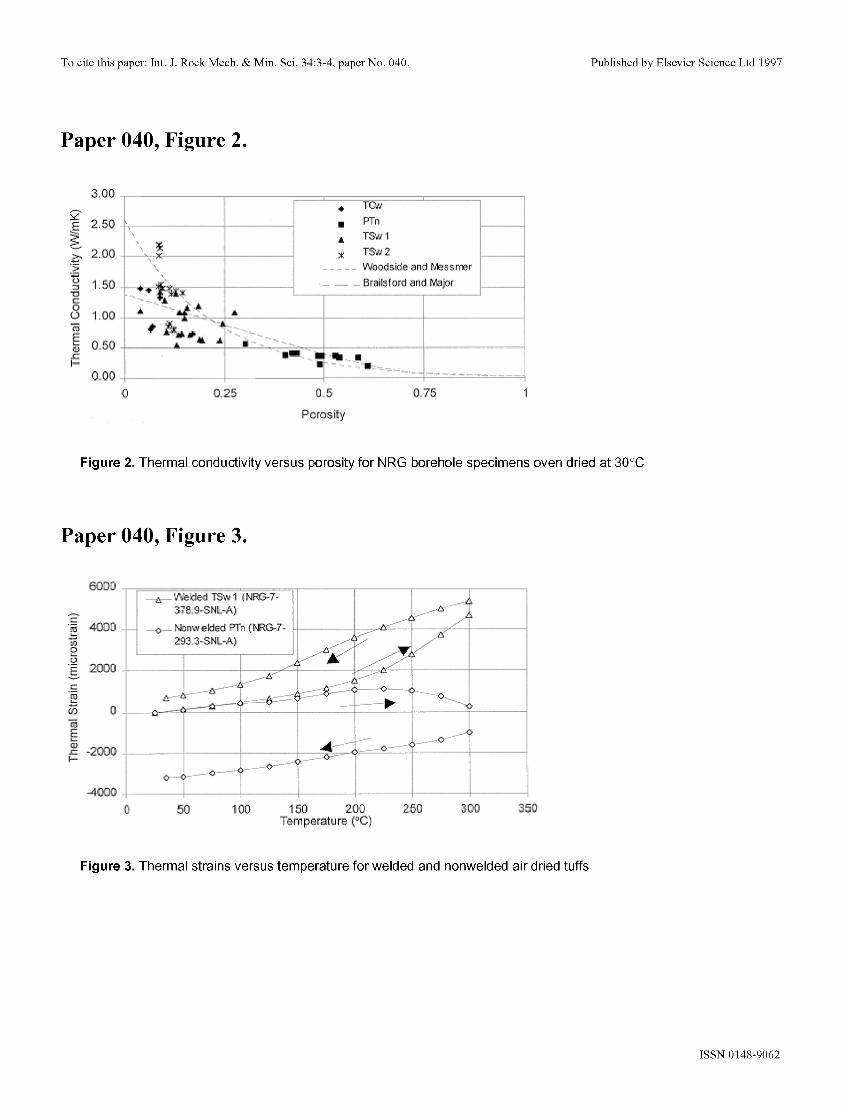
Attempts have been made to correlate thermal conductivity with an easily measured physical property such as porosity. Figure 2 shows thermal conductivities, obtained at 30°C on oven dried specimens, plotted versus porosity. Both the Woodside, Messmer 1961 and the Brailsford, Major 1964 equations that predict this relationship are shown. The models were fitted to the data as follows: Based on the measured saturation and porosity of each specimen, the matrix conductivity (i.e., conductivity at zero porosity) for each specimen was calculated for each model. These matrix conductivities were then averaged for each model to obtain the conductivity at zero porosity. The change in conductivity with increasing porosity was then calculated directly from each model. Unfortunately, lithologies also change with increasing porosity, so it is difficult to isolate the effect of changing one variable. The TSw2 data appear to cluster into three groups. The high and low thermal conductivity groups are both from NRG-5 and include the Tptpmn lithostratigraphic unit (Buesch et al. 1995). The intermediate thermal conductivity group is from NRG-6 and includes both the Tptpmn and Tptpln lithostratigraphic units.
Coefficient of Thermal Expansion MCTEs are summarized in Tables 4 and 5 for heating and cooling, respectively. Within each table, the information is grouped according to T/M unit and moisture content. As Tables 4 and 5 show, MCTEs are highly temperature-dependent. Strains for typical specimens of welded and nonwelded tuff are shown in Figure 3. The strains increase (expansion is positive) for both tufts until a "transition temperature" of approximately 150 ° to 225 °C is reached. In both cases, the strain-versus-temperature curves then become more highly nonlinear; however, the slope increases for the welded specimen while it decreases for the nonwelded specimen.
The increase in thermal strains between 150°C and 225 °C observed for many of the welded devitrified specimens is likely the result of phase transitions in the constituent minerals of tridymite and cristobalite. These minerals occur, with or without quartz, as primary devitrification products in many samples of Yucca Mountain welded tuffs. Phase transitions in synthetic tridymite occur at approximately 117 °C and
ISSN 0148-9062

To cite this paper: Int. J. Rock Mech. & Min. Sci. 34:3-4, paper No. 040. Published by Elsevier Science Ltd 1997
163°C; they occur in synthetic cristobalite at approximately 272°C (Papike, Cameron 1976) and involve notable changes in volume. Phase transition temperatures have been shown to vary significantly because of lattice variations found in natural occurrences of these minerals, which are usually mixed-phase material (Thompson, Wennemer 1979). Previous and current work on the mineralogy of welded tuff from TCw, TSwl, TSw2, and TSw3 suggest that these mixed-phase assemblages are dominant. Hysteresis is associated with the phase changes because the phases invert at higher temperature during heating than during cooling. The irreversible expansion may be a consequence of incomplete phase inversion on cooling.
For the nonwelded specimens, some of the strain decrease (near 100°C) is attributable to loss of pore water, but most of the irreversible strain is probably a consequence of dehydration of perlitic volcanic glass and clay minerals at elevated temperatures, which results in a permanent volume decrease.
Some specimens that displayed sensitivity to transition temperature were analyzed to assess the role of the maximum test temperature. Adjacent specimens were tested to different temperatures. The results showed that as long as the maximum test temperature remained below the transition temperature, the specimens did not permanently change dimension (i.e., no hysteresis was evident). These tests indicated that the transition temperatures probably caused physical changes in tuff that altered the expansion characteristics. The maximum temperature to which the specimens were exposed affected the magnitude of the hysteresis in the strain-versus-temperature curves.
It should be noted that although the behavior shown in Figure 3 is typical of many test specimens, not all welded and nonwelded specimens showed this type of behavior. The transition temperature effects varied slightly among the T/M units and the boreholes. Several T/M units showed no temperature transition effects while other specimens and T/M units showed not only large hysteresis but thermal expansion data characteristic of a phase change. Figure 4 shows data for TSwl specimen NRG-7-625.7-SNL-A. The strain increases until a transition temperature of approximately 250°C is reached. The slope then increases steeply but levels again above 300°C, presumably after the phase change is completed. During cooling, the phase change inverts between 250 ° and 200°C. Analysis of mineralogical and petrologic data on the tested specimens will be necessary to understand fully the cause of the behavior and its variations.
All the thermal expansion data presented in Tables 4 and 5 were obtained at ambient pressure. Mineralogical phase changes are pressure sensitive, and the temperatures at which these transitions occur increase with pressure. Additionally, pressure will suppress volume expansion within fractures and voids. Thus a suite of thermal expansion tests was conducted under confining pressure to determine if strain hysteresis and transition temperature effects would be suppressed by elevated pressures. These tests are discussed in detail in Martin et al. 1997 and summarized here. Specimens for confined tests were taken from the TSw2 T/M unit and from drill-hole SD-12 at the Yucca Mountain site. Qualitative mineralogical analyses were performed on specimens from selected depths within SD-12; the five specimens that had the highest amounts of tridymite and cristobalite were chosen for testing. Each specimen was tested at four to five confining pressures between 1 and 30 MPa. At each confining pressure two complete thermal cycles were performed up to a nominal temperature of 250°C.
Confined test results are compared with ambient pressure test results in Figure 5. Only five specimens are represented by the confined data, whereas 26 specimens were tested unconfined. Martin et al. 1997 concluded that pressure effects for specimens tested between 1 and 30 MPa were very small, so data from these pressures were averaged together. Figure 5 shows that at low temperatures (below -150 °C), MCTE is slightly lower for unconfined tests than for confined tests. At higher temperatures (150-250°C) the
ISSN 0148-9062

To cite this paper: Int. J. Rock Mech. & Min. Sci. 34:3-4, paper No. 040. Published by Elsevier Science Ltd 1997
mean values approach one another, and the scatter among the unconfined tests encompasses the results for the confined tests. Over the higher temperature range it appears that confining pressure has no effect on thermal expansion for these TSw2 specimens, despite the fact that the two suites (confined and unconfined) were from different boreholes.
Specific Heat
Thermal capacitance data are summarized in Table 6 and plotted in Figure 6. All specimens show a localized peak in thermal capacitance at 150-170°C. In general, thermal capacitance increases monotonically until this temperature range is reached. For all TSwl specimens and some TSw2 specimens, thermal capacitance then decreases slightly with increasing temperature. Above 150-170°C, other TSw2 specimens show initial decreases in thermal capacitance followed by nearly constant values.
Heat supplied to the specimen either causes its temperature to rise or is used to convert specimen material from one physical state to another. A phase change that absorbs heat will cause the measured value of heat capacity (effective heat capacity) to rise. When the phase change is completed, the effective heat capacity will return to its baseline value. Nimick, Connolly 1991 calculated theoretical values of effective specific heat based on mineralogical data for tufts from Yucca Mountain, and these calculations are also shown in Figure 6. The tridymite and crystobalite phase transformations were centered at 163°C (436 K) and 225°C (498 K), respectively. As noted previously, phase transitions in synthetic tridymite also occur at 117°C and at approximately 272°C in synthetic crystobalite.
The peaks in specific heat shown in Figure 6 and Table 6 appear to be related to phase changes; however, the data presented here are insufficient to correlate these peaks more specifically with mineralogy. It is worth noting that the peaks in specific heat at 150-170°C occur at a temperature range associated with the phase change in tridymite (163°C). It is also evident that there were no significant changes in measured values of specific heat for these air dried specimens at 100°C, indicating that dehydration effects were minor. The calculated values show a decrease at 100 °C corresponding to the vaporization of water. Figure 6 shows that for both the theoretical and experimental data values for TSw2 are higher than for TSwl. The two sets of data roughly coincide, which is very encouraging considering the many assumptions inherent in Nimick and Connolly's work.
Petrographic and Mineralogical Characterization
Mineralogies were examined to determine if correlations exist between thermal expansion and the presence of certain minerals. The thermal expansion test results showed temperatures over which MCTEs increased steeply and hysteresis was observed. These characteristics of the thermal expansion curves were discussed in light of phase changes expected in tridymite and cristobalite. Two characteristics of the thermal expansion curves are examined here. First, net strain hysteresis (the difference in measured strains between the initial value at 25°C and the final value at 35°C) was tabulated for oven dried specimens that had been cycled to 310-320°C. Second, the MCTEs determined at 300°C during the heating cycle were tabulated for these same oven dried specimens. A linear least-squares regression was performed to correlate each of these thermal expansion characteristics with each of a list of standard petrologic characteristics, including color and welding characteristics, lithophysae characteristics, lithics, modal percentages of minerals, major components, porosity, silica-phase components, and water content. The resulting correlation coefficient (r 2) indicates the proportion of variability in a thermal expansion characteristic that can be explained by a linear relationship with a petrologic characteristic. Of the 97
ISSN 0148-9062
To cite this paper: Int. J. Rock Mech. & Min. Sci. 34:3-4, paper No. 040. Published by Elsevier Science Ltd 1997
samples that were petrologically analyzed, 13 were for welded specimens that were originally adjacent to thermal expansion test specimens and used for semiquantitative XRD analyses of silica components. The correlation coefficients determined for each linear regression are given in Brodsky et al. 1997 and summarized here.
It was found that the correlation coefficients were generally low (less than 0.5). The highest value corresponded to strain hysteresis versus lithophysae (or cavity) shape (r2=0.741), and the next highest value corresponded to strain hysteresis versus lithophysae (or cavity) abundance (r2=0.540). High correlation coefficients were expected for thermal expansion properties versus tridymite and cristobalite. Strain hysteresis versus tridymite and cristobalite gave correlation coefficients of 0.430 and 0.029 respectively.
The poor correlation between thermal properties and mineralogical composition may be explained in several ways. First, the data set is limited. Thermal expansion data and detailed mineralogical data are both available for only 13 specimens. Second, the mineralogical analyses were not performed on the test specimens themselves but on pieces of rock taken from near the test specimens. Compositional inhomogeneity within the rock mass may add variability to these results. Third, hysteresis in the thermal expansion data may be influenced by more than just mineralogy (e.g., lithophysae), and a larger database and/or further analyses may be required to separate the influences of each of these variables.
S U M M A R Y AND C O N C L U S I O N S
A very extensive data set for thermal conductivity and thermal expansion has been presented for boreholes UE25 NRG-4, UE25 NRG-5, USW NRG-6, and USW NRG-7/7A. A total of 143 thermal conductivity tests was conducted on 95 test specimens, 132 thermal expansion tests were conducted on 120 specimens, and 10 specific heat tests were conducted on 10 specimens. Specimens were tested at several saturation states, at room pressure, and at temperatures up to 300°C. Petrologic data were obtained from 97 NRG-6 samples.
Thermal conductivities were highest for saturated specimens and lowest for dried specimens. Thermal conductivity results showed that, for oven dried specimens, thermal conductivities increased slightly or remained constant as temperature increased from 25°C to 300°C. The PTn T/M unit consistently showed the lowest thermal conductivities while the TCw and TSw2 units had the highest conductivity values. TSwl specimens spanned a large range of thermal conductivities and were intermediate in value.
Mean coefficients of thermal expansion were highly temperature dependent. Thermal expansion coefficients showed substantive differences between welded and nonwelded specimens. Moisture effects were apparent in nonwelded specimens. Even for oven dried specimens, the nonwelded PTn T/M unit showed dehydration and volume loss at 100°C. At more elevated temperatures, these specimens generally continued to shorten as bound water was released. At temperatures near 200°C, hysteresis in the strain-versus-temperature curves became apparent in most specimens. Most of this was probably caused by phase changes in trydimite and cristobalite; however, this was not clear from comparison of thermal expansion and mineralogical data. Although most expansion reversed during cooling, substantial permanent elongations (up to 200 microns or 0.4% strain) were observed.
Thermal capacitance values were lower for TSwl specimens from NRG-4 than for TSw2 specimens from NRG5. The irregular slopes of the specific heat-versus-temperature curves are most likely related to phase changes. No mineralogical data were obtained for NRG-4 and NRG-5 specimens.
ISSN 0148-9062

To cite this paper: Int. J. Rock Mech. & Min. Sci. 34:3-4, paper No. 040. Publ i shed by Elsevier Science Ltd 1997
The data presented here suggest relationships between measured thermal properties and composition; however, the relationships are not well understood. Additional data and correlation analyses between composition (including presence and amounts of tridymite, cristobalite, clay, zeolites, tightly and loosely bound H20, and textural arrangement of these components) and the thermal behavior of the samples
should lead to a more systemic understanding of the observed variations. This should be particularly helpful in understanding the source of the hysteresis and permanent deformations in the thermal expansion data and the source of peaks in the thermal capacitance curves.
This work was supported by the US Dept. of Energy under contract DE-AC04-94AL85000. Sandia National Laboratories is a multiprogram laboratory operated by Sandia Corporation, a Lockheed Martin company, for the United States Department of Energy. The data and results discussed in this report were generated as part of the Yucca Mountain Site Characterization Project. However, this report should not be used as a source of qualified data. Refer to the original Technical Data Information Forms for qualified data.
FIGURES
Paper 040, Figure 1.
5
v
E 2.5
c2-
• ~ 2 .>__
'- 1.5 "- • O Cl
P 1
= C.5 ,'~ ...
TC'~ C,~e- Dei~.d Q TO¢, Vec_u .n £atura!.Gd ~. P~,-~ (..~url [_h-i~--'cl • P/, n V~c:uum ~ . b , ra-eJ A TS'h 1 C'¢,:.n ~ec~ ,L T8v, 1 V a c m , m Sab,rate,"J
TSv, :~ Oven O ~ec ~ "l'S'o 2-~'acuulll Satar , - ,~ '
I" - ~
{ t- { { C
O 103 lernper~_~ule {:'C) 203 300
F i g u r e 1. T h e r m a l conduc t i v i t i es as a func t ion o f t e m p e r a t u r e fo r f ou r T /M units
ISSN 0148-9062
To cite this paper: Int. J. Rock Mech. & Min. Sci. 34:3-4, paper No. 040. Published by Elsevier Science Ltd 1997
Paper 040, Figure 2.
~Z
2..
"6
E
3 .00
2 . 5 0
2 . 0 0 - x
1 . 5 0 ~,~ $~,~'~;: .
1 . 0 0 " . . . , ,~
0.50 ,L m • " N q .
, I O , , ' ,
• pin .,,. l~a, ' I
FS".'.,' 2
~r0oq~5.i:'~ and P,I~ ~ s n~ r
Brail.~[erd and IV~.or
• = •
0.00
0 0.25 0.5 0 75 1
Porosity
Figure 2. Thermal conductivity versus porosity for NRG borehole specimens oven dried at 30°C
Paper 040, Figure 3.
6033
. .--.~
,~ 40C.3
23 £
~= 2 0 0 0
c ' :
r a
,.n g 7~ E # -~c00 F-
4 0 3 0
,,, ',r.,'ede~ l S w 1 ~NI~G-7- /, 37~ 9-SN[ -A) r,
,c, Nr)n~ [~H~.d ="lq ( r , , , [ , o , ~ - 7 1 . A .
293 3-$NL -A) ~
,,. A . . 2~
A
o. "\ ~ ~ @ @ o . . - , ~
o
.4 (2
O @
<3 o @ o
0 ,50 tOO "50 202' Z50 3C0 35'3 Temperature ~'C ~,
Figure 3. Thermal strains versus temperature for welded and nonwelded air dried tufts
ISSN 0148-9062

To cite this paper: Int. J. Rock Mech. & Min. Sci. 34:3-4, paper No. 040. Published by Elsevier Science Ltd 1997
Paper 040, Figure 4.
( . ,0
,E t -
I - - ,
6,00E-03
/ , 4 0oe-~3 /
/
2. DOE-,33
O.OOE+O0 --.-----
0 100 200 330 400
Temperature (=C)
Figure 4. Thermal expansion data for welded TSwl specimen NRG-7-625.7-SNL-A showing a probable phase change
Paper 040, Figure 5.
. . - - .
O
LU I , - - ~j
25
23
;5
13 I
Unco-~fined
~r ! [ a_
!
• 1~ . . -
C' 50 1 CO 150 2 O0 250 l'emperat.ure {~C)
Figure 5. Mean coefficients of thermal expansion for confined and unconfined tests on air dried TSw2 specimens (error bars represent +1 standard deviation)
ISSN 0148-9062

To cite this paper: Int. J. Rock Mech. & Min. Sci. 34:3-4, paper No. 040. Published by Elsevier Science Ltd 1997
Paper 040, Figure 6.
2 75
e 2 .5 ¢..t. [ ."
• '- Z 25 u
8 £ 2
E 8 1 7 5
t - 1.5 c -
1.25
1
t
& i i i , .
- ~_ ~, o - ~ .5 [ S w l - l d e a s u r e d
'~ o r s w 2 - M e a s u r e d
A r s v . , 1 - C a l c u ; s t e d
Er,or Bars for t,.,loo:..-S.lf,S,': Vo'. le5 • rs,,t,,2 - C;~lcu' ,ole(t Repre~er'!. One Standard Do',,iaUcn
0 100 200 3O0 T e m p e r a t u r e ~'°C', ,
Figure 6. Mean thermal capacitances and standard deviations for three TSwl specimens and seven TSw2 specimens, showing values by Nimick, Connolly 1991 for TSwl and TSw2
TABLES
Paper 040, TABLE 1.
Test Specimen Specific Heat (a)
T A B L E I N O M I N A L D I M E N S I O N S OF T E S T S P E C I M E N S
The~-mal Conductivity Thermal Expansion
0.0127 0.0508 0.0508 0.0254
Ley.gth (m) " 0.057 Diameter (m) 0.051
(a)Each specimen contained a 0.0105-m hole drilled along the specimen axis to accommodate the electrical energy source.
ISSN 0148-9062

To cite this paper: Int. J. Rock Mech. & Min. Sci. 34:3-4, paper No. 040. Published by Elsevier Science Ltd 1997
Paper 040, TABLE 2.
T A B L E 2
LOW TEMPERATURE (<100°C) ROCK THERMAL CONDUCTIVITIES
Thermal/ Mechanical
Unit TCw
PTn TSw 1 TSw2
" Thermal Conduciivity (W/mK)
Saturated Partially Saturated Air Dried ' ' Dry Sample Sample Sample Sample Sample Sample Sample Sample Sample Sample Sample Sample Mean Standard Count Mean Standard Count Mean Standard Count Mean Standard Count
<'~ Deviation Deviation Deviation Deviation
1.89 0.12 18 1.39 0.56 18 1.58 0.16 9 1.17 0.35 18 0.92 0.13 42 0.57 0.12 33 0.35 0.13 12' '- 0.38 0.10 49 !.70 0.19 50 1.23 0.46 11 1.21 0.12 30 0.98 0.26 59 2.29 0.42 51 ND c~ 'ND ND 1.66 0.10 24 1.50 0.44 48
(at "Sample" refers to the number o f test measurements, not the number o f specimens tested. Measurements were made during both heating and cooling for some specimens. (bl ND: No Data.
Paper 040, TABLE 3.
T A B L E 3
HIGH TEMPERATURE (> 1 0 0 ° C ) ROCK THERMAL CONDUCTIVITIES
Thermal/Mechanical Unit
TCw
PTn
TSwl
TSw2
Sample Mean N
Thermal Conductivity (W/mK) (Dry)
Sample Standard Deviation
1.53 0.I7
0.42 ' "' 0.14 ..... . , . . .
1.15 0.15
1.59 0.10
Samt~i'e Count
57
102
173
125
(a) "Sample" refers to the number o f test measurements , not the number o f spec imens tested. Measurements
were made during both heating and cooling for some specimens.
ISSN 0148-9062

To cite this paper: Int. J. Rock Mech. & Mm. Sci. 34:3-4, paper No. 040. Published by Elsevier Science Ltd 1997
Paper 040, TABLE 4.
T/M Saturation Unit State
Saturated
TCw
Saturated
PTn Dry
Saturated
TSwl Dry
Saturated'"
TSw2 Dry
T A B L E 4
MEAN COEFFICIENT OF THERMAL EXPANSION DURING HEAT-UP
Statistics (a)
M e a n
Std, Dev. Count M e a n
Std. Dev. Count
M e a n
Std. Dev. Count
Mean Std. Dev.
Count
M e a n
Std. Dev. Count M e a n
Std. Dev. Count
M e a n
Std. Dev. Count
M e a n
Std. Dev, Count
Mean CTE on Heat-up (10"6/°C) (MCTEs) 25- 50- 75- 100- 125- 150- 175- 200- 225- 250- 275-
50"C 75°C 100°C 125°C 1500C 175*C 200°C 225°C 250"C 275°C 300°C 7'.0"9 7.62 8.08 10.34 13.17 15.20 16.99 18.99 21,38 27,42 42.99 0.43 0.15 0.50 1.52 1.23 1.57 1.41 0.96 1.23 1.94 37.35
4 4 4 4 4 4 4 3 3 3 3
6.60 8.29 9.62 i0'1'53 12.69 14.90 17.03 20.68 29.64 36.49 49.15 1.49 0.99 !.06 1.60 1.55 1.91 2.31 5.41 21.88 16.97 34.24 10 10 10 7 7 7 7 7 7 7 7
4.46 4.28 '-1'.~i5-30.42 5.54 4.47 t j164 -4.65 - 9 , 7 9 - 1 3 . 4 6 - 1 2 . 9 6 0.38 1.61 3.63 21.47 0.41 0.79 1.03 4.05 7.85 11.12 12,90
4 4 4 4 3 3 3 2 2 2 2
4.55 '" 4.24 3.36 -4.78 6/i6' 5.69 3.61 0.56 '-2.98 -5.81 -7.25 0.74 1.46 2.40 11.12 0.98 1.41 2.58 5.81 9.12 11.36 10.80
12 I2 12 10 10 10 I0 10 10 I0 10
6.56 7.32 6.83" 6.92 10.72 14.28 20.98 36.82 41.64 42.76 'zi318I 1.16 0.60 1.60 3.28 1.74 3.26 7.01 20.49 17.35 13.19 13.65 10 10 10 10 10 9 9 8 8 8 8
6.29 7.60 8.39 8.96 10,37 i'5.51 23.67 34.24 3£i.00 36.07 38.74 1.22 1.02 0.89 1.20 1.38 4.53 11.07 20.30 13.70 13.23 t3.78 33 33 33 28 28 27 26 25 25 25 25
7.14 '7.47 7.46 9.07' 9.98 11.74 "1'3.09 15.47 19,03 25.28 37.19 0.65 1.51 1.21 2.41 0.77 1.28 1.40 1.75 3.09 6,87 14.27
19 t9 19 19 19 19 19 16 16 16 16
6.67 8,31 "8.87 9.37 10,10 10,9'6 12.22 14.52 '20.79 25.I3 35.13"'
1.20 0.42 0.40 0.55 0.88 40 40 40 40 40
1.16 1.50 2.57 17.03 10.07 14.56 38 38 35 35 35 35
(8) Std. Dev. is the standard deviation.
ISSN 0148-9062

To cite this paper: Int. J. Rock Mech. & Mm. Sci. 34:3-4, paper No. 040. Published by Elsevier Science Ltd 1997
Paper 040, TABLE 5.
T/M Saturation Unit State
Saturated
TCw Dry
Saturated
PTn
Dry
Saturated
TSw i Dry
Saturated
TSw2 t
Dry
T A B L E 5
MEAN COEFFICIENT OF THERMAL EXPANSION DURING COOL-DOWN
Statistics O)
fiean Std. Dev.
Count
Mean Std. Dev.
Count
M e a n
Std. Dev. Count
M e a n
Std. Dev. Count
Mean Std. Dev.
Count
Mean Std. Dev.
Count
M e a n
Std. Dev. Count
Mean Std. Dev.
Count
,Mean CTE on Cool-down (lO-6fC.) (MCTEs)
300- 275- 250- 225' 200- 175- 150- 125- 100- 75- 50- 275°C 250"C 225"C 200Oc 175°C 150°C 125"C 100Oc 750C 50Oc 35"C
14.72 2t.97 33.53 37.01 23.81 18.48 15.72 13.51 12.09 10.78 10.85 3.76 6.79 16.44 26.18 10.01 3.25 !.96 1.48 1.28 1.36 1.96
3 3 3 3 4 4 4 4 4 4 4
17.46 26.34 36.95 33.72 22.86 17.58 13.89 I1.77 10.21 9.35 6.59 3.70 6.88 I1.50 14.2I 3.16 2.00 2.39 2.22 1.56 1.I5 2.20
7 7 7 7 7 7 7 7 9 9 9
15.58 9.12 7.20 6.39 6.98 6.29 5.93 5.36 5.12 4.33 1.94 1.04 0.84 0.29 0.17 1.51
2 2 2 2 3
11.22 7.91 6.78 6.45 '6~47
0.78 0.47 0.36 0.34 0.84 2.93 3 3 4 4 4 4
6.53 6.11 5 ' . 8 0 5.52 4.82 2.41" 2.46 1.00 0.81 0.90 1.14 1.35 1.30 1.16 0.89 0.84 0.86
10 10 10 10 10 10 10 10 12 12 12
15.07 19.87 24.05 26.15 27.57 26.66 28.19 19.89 11.46 9.92 9.35 4.68 7.82 9.85 7.37 8.36 9.9t I8.04 8.05 2,01 1.54 1.06
8 8 8 8 9 9 10 10 10 10 10
16.68 "20.71 24.16 23.26 26.74 25.34 25.55 17.78 10.53 9.22 6.95 4.13 7.78 10 .61 7.29 9.32 9.35 14.94 8.53 2.15 1.51 2.49 25 25 25 25 26 27 28 28 33 33 33
21.89 '27.83 26.55 21.38 t7.31 14.06 12.49 tl .52 10.27 9.48 8.81 6.16 10.36 10.01 5.70 3.07 1.38 1.32 2.00 0.62 0.63 0.62
16 16 16 16 19 19 19 19 19 19 19
20.57 24.31 24.20 21.16 '18.45 14.34 11.74 I0.51 9.54 8.87 7.48
4,88 7.55 35 35
8.08 6.24 9.36 4.23 3.03 2.26 1.79 1.56 1.99 35 35 38 38 40 40 40 40 40
(a) Std. Dev. is the standard deviation.
ISSN 0148-9062

To cite this paper: Int. J. Rock Mech. & Min. Sci. 34:3-4, paper No. 040. Published by Elsevier Science Ltd 1997
Paper 040, TABLE 6.
TABLE 6 THERMAL CAPACITANCE (p.C ~) OF TOPOPAH SPRING TUFF
TSw 1 Standard
TSw2
Temper- "' Mean p.C~ No. of Tests ' J'emper- Mean p.C. Standard No. of Tests' ature (J.em'3-K "t ) Deviation ature (J.cm3oK "f) Deviation (°C) (j.em-3,K-t) (°C) (J.cm'3"K "t)
25 1.58 0.05 3 25 1.79 0. t 1 7
50 1.68 0.05 3 50 1.88 0.11 7
75 1.80 0.05 3 75 1.97 0. I 1 7
100 1.91 0.05 3 100 2.16 0.11 7
125 2.03 0.06 3 125 2.32 0.11 7
150 2.14 0.11 3 150 2.45 0.13 7
I75 2.13 '" 0.10 3 I75 2.43 0.18 7
200 2.09 0.07 3 200 2.40 0.16 7
225 2.07 0.06 3 225 2.39 0.17 7
250 2.05 0.05 3 250 2.39 0.19 7
275 2~03 " 0.05 3 275 2.39 0.22 7 , ~ , , ,
300 2.03 0.06 3 300 0.26 7 2.43
References
References
Buesch D. C., Spengler A.W., Mayer T.C., Geslin J.K. 1995. "Revised Stratigraphic Nomenclature and Macroscopic Identification of Lithostratigraphic Units of the Paintbrush Tufts Group Exposed at Yucca Mountain, Nevada." U.S. Geologic Survey Open-File Report 94-469.
Brailsford A. D., Major K. G. 1964. The thermal conductivity of aggregates of several phases, including porous materials. British Journal of Applied Physics, 15:313-319.
Brodsky N. S., Riggins M., Connolly J., Ricci P. 1997. Thermal Expansion, Thermal Conductivity and Heat Capacity Measurements for Boreholes UE25 NRG-4, UE25 NRG-5, USW NRG-6, and USW NRG-7/TA. SAND95-1955 (in preparation), Sandia National Laboratories, Albuquerque, NM.
Nimick F. B. 1989. Thermal-Conductivity Data for TufJA~ from the Unsaturated Zone at Yucca Mountain, Nevada. SAND88-0624, Sandia National Laboratories, Albuquerque, NM.
Nimick F. B., Connolly J. R. 1991. Calculation of Heat Capacities for Tuffaceous Units from the Unsaturated Zone at Yucca Mountain, Nevada. SAND88-3050, Sandia National Laboratories, Albuquerque, NM.
Martin R. J.III, Noel J. S., Riggins M., Boyd P. J., Price R. H. 1997. ThermalExpansion of the Paintbrush Tuff Recovered from Borehole USW SD-12 at Pressures to 30 MPa: Data Report. SAND95-1904 (in
ISSN 0148-9062
To cite this paper: Int. J. Rock Mech. & Min. Sci. 34:3-4, paper No. 040. Published by Elsevier Science Ltd 1997
preparation), Sandia National Laboratories, Albuquerque, NM.
Papike J. J., Cameron M. 1976. Crystal chemistry of silicate minerals of geophysical interest. Reviews of Geophysics and Space Physics, 14: 1, 37-80.
Thompson A. B., Wennemer M. 1979. Heat capacities and inversions in tridymite, cristobalite, and tridymite-cristobalite mixed phases. American Mineralogist, 64: 1018-1026.
Woodside W., Messmer J. H. 1961. Thermal conductivity of porous media, I: Unconsolidated sands. Journal of Applied Physics, 32: 9, 1688-1699.
ISSN 0148-9062