Thermal Efficiency of Natural Gas-Fired Generation in...
32
DOCKETED Docket Number: 17 - IEPR - 02 Project Title: Electricity Resource/ Supply Plans TN #: 222115 Document Title: Thermal Efficiency of Natural Gas - Fired Generation in California 2017 Update - Staff Paper Description: N/A Filer: Harinder Kaur Organization: California Energy Commission Submitter Role: Commission Staff Submission Date: 1/8/2018 4:28:50 PM Docketed Date: 1/8/2018
Transcript of Thermal Efficiency of Natural Gas-Fired Generation in...

DOCKETED
Docket Number: 17-IEPR-02
Project Title: Electricity Resource/ Supply Plans
TN #: 222115
Document Title: Thermal Efficiency of Natural Gas-Fired Generation in California 2017 Update - Staff Paper
Description: N/A
Filer: Harinder Kaur
Organization: California Energy Commission
Submitter Role: Commission Staff
Submission Date:
1/8/2018 4:28:50 PM
Docketed Date: 1/8/2018
STAFF PAPER
Thermal Efficiency of Natural Gas-Fired Generation in California: 2017 Update Michael Nyberg Supply Analysis Office Energy Assessments Division California Energy Commission
California Energy Commission Edmund G. Brown Jr., Governor
January 2018 CEC-200-2018-001
DISCLAIMER
Staff members of the California Energy Commission prepared this report. As such, it does not necessarily represent the views of the Energy Commission, its employees, or the State of California. The Energy Commission, the State of California, its employees, contractors and subcontractors make no warrant, express or implied, and assume no legal liability for the information in this report; nor does any party represent that the uses of this information will not infringe upon privately owned rights. This report has not been approved or disapproved by the Energy Commission nor has the Commission passed upon the accuracy or adequacy of the information in this report.
i
ABSTRACT
Senate Bill 1389 (Bowen and Sher, Chapter 568, Statutes of 2002) directed the California Energy Commission to adopt an Integrated Energy Policy Report (IEPR) every two years. This staff paper supports the IEPR technical analyses by describing general trends in the average thermal efficiency of natural gas-fired generation in California from 2001 through 2016. Over this 16-year period, California’s systemwide thermal efficiency improved by 23 percent due to the successful development of new combined-cycle power plants. A leveling off of gains in thermal efficiency in recent years is due to the impact from the large growth in wind and solar generation combined with the return of significant hydroelectric generation after a four-year drought displaced total output from gas-fired generation. In 2016, California’s non-GHG emitting electric generation accounted for 50 percent of total in-state generation, compared to 40 percent in 2015.
Keywords: Combined-cycle, heat rate, gas-fired generation, thermal efficiency
Nyberg, Michael. 2017. Thermal Efficiency of Natural Gas-Fired Generation in California: 2017 Update. California Energy Commission. CEC-200-2018-001.

ii

iii
TABLE OF CONTENTS Page
ABSTRACT ....................................................................................................................... i
CHAPTER 1: Thermal Efficiency ......................................................................................1
Data Collection ......................................................................................................................................... 1
Trends in Heat Rates and Capacity Factors ............................................................................................ 2
CHAPTER 2: Natural Gas-Fired Power Plant Types ........................................................ 6
CHAPTER 3: Natural Gas-Fired Generation ................................................................... 9
California’s Total System Electric Generation ...................................................................................... 13
CHAPTER 4: Changes in Hourly Generation .................................................................16
CHAPTER 5: Conclusion ............................................................................................... 24
Key Findings ........................................................................................................................................... 24
ACRONYMS .................................................................................................................. 25
LIST OF FIGURES Page
Figure 1: Statewide Average Natural Gas-Fired Heat Rate, 2001-2016 .................................................... 3 Figure 2: Annual Natural Gas-Fired Capacity by Plant Category, 2001-2016 .......................................... 8 Figure 3: Natural Gas-Fired Electric Generation in California, 2001-2016 .............................................. 9 Figure 4: Combined-Cycle Heat Rate Compared to Statewide Average, 2001-2016 .............................. 10 Figure 5: Share of Total Natural Gas-Fired Generation by Plant Type, 2001-2016 ................................ 11 Figure 6: California’s Total System Electric Generation, 2001-2016 ...................................................... 13 Figure 7: California ISO Hourly System Load During September 6–12, 2015 ........................................ 18 Figure 8: California ISO Hourly System Load During July 24–30, 2016 ............................................... 18 Figure 9: Average Weekday Hourly Loads for March and April 2015 .................................................... 20 Figure 10: Average Weekday Hourly Loads for March and April 2016 .................................................. 20 Figure 11: Average Weekday Hourly Loads for July and August 2015 .................................................... 21 Figure 12: Average Weekday Hourly Loads for July and August 2016 .................................................... 21 Figure 13: Average Weekday Hourly Loads for November and December 2015 .................................... 22 Figure 14: Average Weekday Hourly Loads for November and December 2016 .................................... 22 Figure 15: Time of California ISO System Peak, 1998-2016 .................................................................... 23

iv
LIST OF TABLES Page
Table 1: California Natural Gas-Fired Heat Rates for 2001–2016 (Btu/kWh) ......................................... 5 Table 2: California Natural Gas-Fired Power Plant Capacity Factors for 2001–2016 ............................. 5 Table 3: California Natural Gas-Fired Power Plant Summary Statistics for 2016 .................................... 8 Table 4: Generation From California’s Natural Gas-Fired Power Plants 2001–2016 (GWh)................ 12 Table 5: Natural Gas Usage for California’s Power Plants 2001–2016 (Thousand MMBtu) ................. 12 Table 6: California’s Total System Electric Generation for 2016 ............................................................. 14 Table 7: California ISO Average Hourly Natural Gas-Fired Generation Summary, 2015-2016 ............ 16
1
CHAPTER 1: Thermal Efficiency
Data Collection Senate Bill 1389 (Bowen and Sher, Chapter 568, Statutes of 2002) directed the California Energy Commission to adopt an Integrated Energy Policy Report (IEPR) every two years. This staff paper, the sixth in a series, supports technical analyses performed for the IEPR by describing general trends in the average thermal efficiency of natural gas-fired generation in California from 2001 through 2016. The paper incorporates power generation and fuel use data collected by the Energy Commission under the authority of the California Code of Regulations, Title 20, Division 2, Chapter 3, Section 1304(a) (1)-(2).1
Owners of power plants with a nameplate capacity of 1 megawatt (MW) or more directly serving California end users must report their respective generation, fuel, and water usage for each calendar year to the Energy Commission, using the CEC-1304 Power Plant Owner Reporting Form. Nameplate capacity is defined as the maximum rated output of a generator under specific conditions as designated by the manufacturer, and may change over time. The CEC-1304 report also applies to a small number of out-of-state power plants that are electrically within a California balancing authority’s control area and are considered to be directly serving California end users.2 A balancing authority is responsible for controlling the generation and transmission within its control area and between neighboring authorities to match electricity demand. The Energy Commission compiles and posts the CEC-1304 data publicly on its website.3
Data have been compiled based on attributes of the natural gas-fired generating units within each power plant and assigned to one of five categories. All data categories are mutually exclusive, and no unit is double-counted. As an example, the Rockwood Gas Turbine Plant in Brawley consists of two 24.95 megawatt (MW) combustion turbines (CT). The first unit is a dual-fuel gas turbine, with the primary fuel being natural gas and diesel fuel used as a backup or secondary fuel. The second unit is operated exclusively with diesel fuel.4 In this paper, only the dual-fuel turbine is included in the statistics.
1 The reporting requirement became effective on February 23, 2001, following California’s major electricity restructuring in 1996.
2 Balancing authorities operating in California include the Balancing Authority of Northern California, Bonneville Power Administration-Transmission, California Independent System Operator, Imperial Irrigation District, Los Angeles Department of Water & Power, Nevada Power Company, PacifiCorp West, Turlock Irrigation District, and Western Area Lower Colorado.
3 California Energy Commission website. QFER CEC-1304 Power Plant Owner Reporting Database. Accessed October 2017. See http://www.energy.ca.gov/almanac/electricity_data/web_qfer/.
4 Permit No. V, Imperial County Air Pollution Control District. Major Facility Permit Review. September 29, 2009. See https://yosemite.epa.gov/r9/air/epss.nsf/735056a63c1390e08825657e0075d180/5efd2adb8878924c8825766a006c755f/$FILE/V-1365%20IID%20Rockwood%20-%20Renewal%20Engineer%20Review%20(09-29-09).docx.
2
Trends in Heat Rates and Capacity Factors The thermal efficiency of a natural gas-fired electric generation plant is typically described by measuring the heat rate. The heat rate of a power plant expresses how much fuel is necessary (measured in British thermal units [Btu]) to produce one unit of energy (measured in kilowatt-hours [kWh]). The heat rates used throughout this paper are calculated in higher heating value terms. Heating value is a measure of heat from the complete combustion of fuel. The reference to higher heating value in the determination of the heat rate includes the latent heat of vaporization of the water in the combustion of natural gas. Heat rates can also be expressed in terms of a lower heating value, and this measurement would not include the latent heat from the vaporization of the water. The lower heating value is generally used when comparing different fuel types such as coal, gasoline, and natural gas, where the presence of water vapor in the combustion of the fuel is significantly different.
The heat rate of California’s natural gas-fired generation fleet is obtained by the ratio of total annual fuel use to total annual electrical energy generated. A lower heat rate indicates a more efficient system; however, there are practical limits to the state’s achievable systemwide heat rate. Limiting factors include the location, elevation, and ambient weather conditions at each of the state’s thermal power plant sites and the resulting impact on achievable fuel efficiency. Locational factors may also include emissions limits by air quality management districts, localized noise limits, and limits on hours of operation.5 Power plants located in higher elevations experience reduced air density; lower air density decreases power generated by the gas turbine. Ambient weather has a significant impact on thermal efficiency as well. Similar to high altitude locations, power plants located in areas with high average temperatures also experience reduced air density with a consequential loss in power generation efficiency.
Figure 1 displays California’s systemwide average heat rate over the past 16 years, excluding cogeneration. From 2001 there is an almost steady reduction of the average heat rate through 2010 that coincides with the development of large, combined-cycle (CC) power plants in the state. The increased heat rate observed in 2011 was due to the large gains in available hydroelectric generation that year. In wet years, natural gas-fired generation is displaced (reduced) by low-cost hydroelectric generation. The magnitude of available hydroelectric generation in 2011 resulted in CC power plants running at lower capacity factors, causing them to operate less efficiently.6 Over the past four years, California has maintained an average heat rate of about 7,700 Btu/kWh, providing a thermal efficiency improvement averaging 23 percent when compared to 2001.7
California entered the first year of what was to be a four-year drought in 2012. In January of that year, the 2,254 MW San Onofre Nuclear Generating Station (San Onofre) shut down operation due to leaking steam generator tubes. These two events resulted in natural gas-fired power plants resuming
5 South Coast Air Quality Management District , Rule 2012 – Requirements for Monitoring, Reporting, and Recordkeeping for Oxides of Nitrogen (NOx) Emissions. http://www.aqmd.gov/docs/default-source/rule-book/reg-xx/rule-2012.pdf.
6 The capacity factor is the ratio (expressed as a percentage) of the actual output of a power plant over a given period, to the related maximum potential output over the same period.
7 2016 Average Heat Rate = 7,761 British thermal units per kilowatt-hour (Btu/kWh). 2001 Average Heat Rate = 10,040 Btu/kWh. Percentage Change in Heat Rate = (10,040 – 7,761)/10,040 = 22.70 percent.

3
higher levels of generation, with significant thermal efficiency improvement observable by 2013. The increased thermal efficiency resulted from natural gas-fired power plants running at higher operating levels that maximize fuel-burn efficiency. The modest increases observed in the systemwide average heat rate for 2014 through 2016 were the result of natural gas-fired power plants adjusting the power output to accommodate fluctuations in available renewable generation within California’s grid. This adjusting of power output on a daily and hourly basis is referred to as ramping or cycling.
Figure 1: Statewide Average Natural Gas-Fired Heat Rate, 2001-2016
Source: QFER CEC-1304 Power Plant Data Reporting
Ramping natural gas-fired power generation is necessary to balance the natural variation in the availability of wind and solar generation over specific hours of the day to meet system load. Ramping causes a degradation in the average heat rate of a natural gas-fired power plant, a result of the large temperature changes that take place in plant equipment during multiple shutdowns and restarts. For a plant type that is designed to operate most efficiently at constant output levels, more ramping can lead to greater wear and tear on the equipment and a lowering of the lifespan of the plant, along with reduced thermal efficiency.
In 2016, the small increase in the statewide annual average heat rate from 7,755 Btu/kWh to 7,761 Btu/kWh reinforces the recent trend of using natural gas generation to manage fluctuations in available solar and wind energy. Despite this slight loss in efficiency, overall, California continues to benefit from the retirement of less-efficient once-through-cooling (OTC) power plants8. Power generation from aging power plants was down 40 percent from 2015 and 94 percent from 2001.
8 On May 4, 2010, the State Water Resources Control Board adopted a policy on the use of coastal and estuarine waters for power plant cooling to reduce the harmful effects on marine life. As a result, OTC power plants are opting to retire to comply with the Board’s policy.
4
Table 1 details the average heat rates since 2001 for all categories of natural gas-fired power plants in California. Each category has maintained a relatively consistent heat rate over the 16-year period, while the overall statewide average has fluctuated based on the annual power mix of the system. Chapter 2 describes each category of natural gas-fired power plants.
The capacity factors shown in Table 2 give an overview of how often California’s fleet of natural gas-fired power plants operated each year. For the initial year of commercial operation, capacity factors were calculated using a prorated nameplate capacity based on the number of hours the unit was available. For example, the 860 MW Delta Energy Center in Contra Costa County had an effective annual nameplate capacity of 577 MW for the first year of operation as it began operating on May 1, 2002. The statewide average capacity factor dropped to 25.6 percent in 2016 from 44.9 percent in 2001 due to the slow retirement of aging facilities combined with the growth in CC power plants over this period. In short, while the new CC plants have effectively replaced the contribution of energy from aging power plants, the fact that the aging plants are still operational accounts for the dramatic decrease in the overall capacity factor.
In 2016 California’s CC plants operated at an average capacity factor just slightly above 40 percent, very similar to their operation during 2011, with the associated abundant hydroelectric generation displacing CC operation. Aging plants operated at the lowest level in 16 years at a 3.9 percent capacity factor. Peaking gas plants operated at the typical average capacity factor of about 5 percent. This difference is to be expected due to efforts to minimize fuel costs by operating California’s more efficient CC plants, leaving the inefficient aging plants and simple-cycle peaking plants for local reliability and peak-load handling needs.9 The Miscellaneous category comprises 17 power plants that are primarily internal combustion generators or repurposed CC plants that are not as efficient as the modern purpose-built CC plants. In 2016 total capacity was 828 MW, and variations in capacity factor are due to the small sample size.
California’s cogeneration plants operated at a 48.7 percent capacity factor in 2016, down 3.7 percent from 2015. These plants are generally expected to run at relatively high and consistent capacity factors due to the unique aspect of delivering both useful steam and electricity. Over the past 16 years, the heat rate of these cogeneration plants averaged 11,299 Btu/kWh. Given that these plants are producing thermal energy along with electrical energy, however, it is evident that a heat rate calculation that also accounted for the thermal output would result in a substantially lower effective heat rate than the simple calculation of fuel input versus electricity output indicates. The difficulty in assessing the efficiency gains related to the output of steam and useful heat is beyond the scope of this paper. For this reason, the cogeneration data are not included in the average heat rate calculations depicted in Figure 1. This treatment is consistent with industry standards as exemplified in the United States Energy Information Administration’s Form EIA-860, Annual Electric Generator Report.10
9 Aging Power Plant Workshop, May 18, 2004. http://www.energy.ca.gov/2003publications/2004_policy_update/documents/2004-05-18_workshop/2004-05-19_AGING_PPS.PDF.
10 U.S. EIA, Table 8.2. Average Tested Heat Rates by Prime Mover and Energy Source, 2007 – 2013. http://www.eia.gov/electricity/annual/html/epa_08_02.html.

5
Table 1: California Natural Gas-Fired Heat Rates for 2001–2016 (Btu/kWh)
2001 2002 2003 2004 2005 2006 2007 2008 2009 2010 2011 2012 2013 2014 2015 2016
Combined-Cycle 6,973 7,147 7,209 7,177 7,230 7,229 7,190 7,147 7,196 7,181 7,270 7,205 7,205 7,270 7,304 7,338
Aging 10,125 10,531 10,837 10,917 11,279 11,282 11,033 11,133 11,594 11,681 12,299 11,709 11,413 11,777 11,683 12,312
Cogeneration 11,120 11,101 11,050 11,307 11,383 11,313 11,237 11,479 11,378 11,182 11,224 11,259 11,459 11,454 11,435 11,627
Peaking 11,227 10,790 10,713 10,817 10,816 10,751 10,881 10,588 10,821 11,011 10,739 10,838 10,321 10,307 10,214 10,269
Miscellaneous 10,137 9,528 10,338 9,952 9,936 9,979 9,980 10,066 10,397 9,924 9,601 9,527 9,485 9,298 9,422 9,296
State Average 10,391 10,302 9,903 9,706 9,507 9,131 8,856 8,870 8,819 8,652 8,979 8,611 8,538 8,532 8,538 8,680
State Average w/o Cogeneration 10,040 9,672 9,086 8,751 8,376 8,121 7,899 7,915 7,868 7,647 7,894 7,818 7,674 7,712 7,755 7,761
Source: QFER CEC-1304 Power Plant Data Reporting.
Table 2: California Natural Gas-Fired Power Plant Capacity Factors for 2001–2016 2001 2002 2003 2004 2005 2006 2007 2008 2009 2010 2011 2012 2013 2014 2015 2016
Combined-Cycle 54.3% 65.8% 53.6% 58.6% 53.7% 53.8% 62.6% 62.4% 58.2% 51.9% 37.3% 55.1% 52.7% 51.9% 50.5% 40.5%
Aging 41.9% 21.0% 15.4% 16.1% 9.9% 9.6% 9.0% 10.4% 7.6% 4.3% 4.1% 7.5% 5.8% 5.4% 5.9% 3.9%
Cogeneration 68.0% 73.4% 71.3% 71.9% 66.3% 62.9% 64.4% 63.1% 61.2% 60.1% 59.1% 57.2% 56.6% 55.0% 52.5% 48.7%
Peaking 12.5% 5.6% 3.9% 4.6% 4.1% 3.9% 4.3% 4.5% 4.1% 3.1% 3.6% 5.2% 5.3% 5.9% 6.0% 5.0%
Miscellaneous 10.0% 9.9% 14.6% 15.1% 17.3% 16.2% 18.6% 19.5% 15.3% 17.5% 22.3% 21.6% 23.5% 23.0% 23.7% 23.3%
State Average 44.9% 32.8% 30.3% 33.3% 30.0% 31.0% 34.3% 34.7% 32.2% 29.1% 24.1% 32.2% 30.8% 30.8% 30.6% 25.6%
Source: QFER CEC-1304 Power Plant Data Reporting.
6
CHAPTER 2: Natural Gas-Fired Power Plant Types
The natural gas-fired power plants examined in this paper are grouped into five categories based on a combination of duty cycles, vintage of the generators, and technology type. The five categories are Cogeneration, CC, Aging, Peaker, and Miscellaneous. A detailed listing of the complete 16 years of power plant data is published on the Energy Commission’s website.11
The Cogeneration category consists of a mix of CTs, CCs, and steam turbines (STs). These plants, commonly referred to as combined heat and power (CHP), produce heat for an onsite or nearby dedicated thermal host, such as a petroleum refinery or college campus, and electricity for onsite industrial use or wholesale supply to the electrical grid. Cogeneration plants may also be qualifying facilities (QFs) under the Code of Federal Regulations Public Utility Regulatory Policies Act of 1978 (PURPA).
Under PURPA, a QF receives special electricity rates and regulatory treatment. Cogeneration plants with QF status are guaranteed by a regulatory must-take provision that the local utility will take all of the power generated while providing heat or steam to the thermal host. PURPA regulations resulted in cogeneration QFs operating at high capacity factors for consistent thermal production with the guarantee that the local utility would take the electric power generation at favorable rates. The number of cogeneration plants reporting is relatively consistent from 2001 through 2016. There were 151 in January 2001 and 130 plants at the end of 2016. Total capacity for cogeneration plants in 2016 is 5,836 MW, down 506 MW from 2001. The majority of cogeneration plants in California are less than 50 MW in size, often in the 1 MW to 10 MW range.
CC power plants comprise the next category. A CC power plant has a generation block consisting of at least one CT, a heat recovery steam generator, and an ST. The higher fuel efficiency results from the ability of the heat recovery steam generator to capture exhaust gas from the CTs to produce steam for the ST, often augmented with duct burning of natural gas in the heat recovery steam generator. For this report, CC power plants consist of those natural gas-fired generating blocks constructed in the 2000s with a total plant capacity of 100 MW or more.
In 2001, the 550 MW Sutter Energy Center in Yuba City and the 594 MW Los Medanos Energy Center in Pittsburg were the only CC power plants with this new technology; by 2016, California had 35 large CC plants totaling more than 20,000 MW in nameplate capacity. These newer plants produce electricity with better heat rates than either stand-alone CTs or STs. Historically, these plants have been used as baseload power. However, with the increasing use of variable renewable generation along with the inherent regulatory must-take generation from CHP facilities and QFs, CC plants are increasingly being tasked for flexible, load-balancing requirements that involve more frequent starts, ramping, and load-following ancillary services.
11 California Energy Commission website. QFER CEC-1304 Power Plant Owner Reporting Database. Accessed October 2017. See http://www.energy.ca.gov/almanac/electricity_data/web_qfer/.

7
Load-following ancillary services are reserved electric generating capacity that can be increased or decreased through automated systems to allow continuous balance between generating resources and electricity demand. Load following is understood as the difference in generation requirements between the hour-ahead energy forecast and the five-minute ahead forecast within a balancing authority, such as the California Independent System Operator (California ISO).12 Deficiencies between the hour-ahead and five-minute-ahead forecasts are met by adjusting the output of power plants via load following to ease sudden changes within the grid, such as the integration of variable solar and wind renewable energy.
The Aging category includes plants built and operational before 1980. Almost all are natural gas-fired STs that use OTC technology. Due to ongoing environmental concerns, a statewide OTC policy was adopted in 2010 requiring all owners of OTC plants to implement a best available control technology to achieve water quality goals, specifically, a closed-cycle evaporative cooling system. Two compliance tracks were established to meet the new OTC policy, which involved reducing intake flows to levels that can use closed-cycle evaporative cooling. Alternatively, a plant can comply by shutting down.13 The majority of plants have a compliance date of December 31, 2020, while a few have compliances dates of December 31, 2024 and 2029.
In 2001, prior to implementation of the OTC policy, there were 27 aging natural gas-fired power plants with an operational nameplate capacity of almost 20,000 MW. Of these plants, 17 were considered OTC plants with 15,134 MW of capacity. By 2016, some six years after the OTC policy went into effect, there remained 12 aging natural gas-fired power plants operating as of January, 1, 2017, with a combined nameplate capacity of 8,636 MW. Of these remaining facilities, 8 power plants are considered to still be using OTC with a total capacity of 7,541 MW.
The Peaking category consists solely of simple-cycle generating units. These units have a peaking duty cycle role—specifically, they are called upon to meet peak demand loads for a few hours on short notice, often in the 15-minute or 5-minute-ahead real-time market. This group includes newer, dry-cooling plants such as the Haynes Generating Station Repowering Project in Los Angeles County that came on-line in June 2013 to replace two existing aging OTC generating units. The Haynes Repowering Project uses fast start simple-cycle generators that allow the facility to ramp up to 600 MW within 10 minutes and ramp down to as low as 50 MW to respond to system fluctuations. By comparison, CC plants cannot ramp as quickly as peaking units and face significant limits in the associated minimum operating levels. In 2001, there were 29 peaking plants in California; by 2016, the number grew to 78 facilities.
All remaining natural gas-fired power plants are included in the Miscellaneous category. These include technologies such as fuel cell and reciprocating engine applications, turbine testing facilities, as well as older generating units built before the 2000s that are not considered to be cogeneration, peaking, or aging. This category also includes CC plants composed of repurposed older CTs and STs.
12 Makarov, Yuri V., Clyde Loutan, Jian Ma, and Phillip de Mello. 2009. Operational Impacts of Wind Generation on California Power Systems. See http://www.caiso.com/Documents/OperationalImpacts-WindGenerationonCaliforniaPowerSystems.pdf.
13 California Energy Commission. Tracking Progress. Once-Through Cooling Phase Out. http://www.energy.ca.gov/renewables/tracking_progress/documents/once_through_cooling.pdf.

8
Table 3 summarizes in-state natural gas-fired electric generation in 2016, with breakouts for the five categories of natural gas-fired generation. Heat rates are averages and cannot be added together.
Table 3: California Natural Gas-Fired Power Plant Summary Statistics for 2016
Category Capacity (MW)
Share of Capacity
Energy (GWh)
Share of Energy
Capacity Factor
Heat Rate (Btu/KWh)
State Total (All Types) 44,224 100.0% 105,820 100.0% 25.4% 8,680 State Total (w/o Cogeneration) 38,388 N/A 80,659 N/A 22.3% 7,761
Combined-Cycle 20,026 45.3% 71,172 67.2% 40.5% 7,338
Aging 8,636 19.5% 3,892 3.7% 3.9% 12,312
Peaking 8,898 20.1% 3,898 3.7% 5.0% 10,269
Cogeneration 5,836 13.2% 25,161 23.8% 48.7% 11,627
Miscellaneous 828 1.9% 1,697 1.6% 23.3% 9,296
Source: QFER CEC-1304 Power Plant Data Reporting.
The total annual operational capacity of each category is shown Figure 2. Over the past 16 years, peaking and CC categories have expanded in capacity, aging plants have slowly but steadily retired, and the cogeneration category has lost 500 MW of power. Cumulatively, by the close of 2016, more than 13,500 MW of natural gas-fired generation had been retired since 2001, as shown in Figure 2 by the blue area under the stacked-area graph.
Figure 2: Annual Natural Gas-Fired Capacity by Plant Category, 2001-2016
Source: QFER CEC-1304 Power Plant Data Reporting.

9
CHAPTER 3: Natural Gas-Fired Generation
Figure 3 illustrates the annual mix of electric generation from five categories of natural gas-fired power plants directly serving California end users over the past 16 years and highlights the steadily declining role of aging plants, along with the tremendous growth in energy from CC plants. The steep drop in output observed in 2011 stems from a wet hydrological year; an abundance of hydroelectric energy displaced natural gas-fired generation. The drought years of 2012 through 2015 saw a return to natural gas-fired generation serving 43 percent, about 126,000 gigawatt-hours (GWh), of California’s total system electric generation. Most recently, a return to average precipitation conditions in 2016 saw hydroelectric energy doubling from 2015 levels and once again pushing down the overall contribution from natural gas-fired power plants to 36 percent (105,820 GWh) of total generation.
Figure 3: Natural Gas-Fired Electric Generation in California, 2001-2016
Source: QFER CEC-1304 Power Plant Data Reporting
California’s aging power plants accounted for less than 4 percent (3,892 GWh) of natural gas-fired electric generation in 2016 and hold 19.5 percent of the state’s natural gas-fired generation capacity, nominally rated at 8,636 MW, down from 19,890 MW in 2001. With an average heat rate of 12,312 Btu/kWh, California’s aging plants continue to carry the distinction of having the poorest heat rates. The low capacity factors suggest the primary value of this group of power plants is in providing capacity support for local reliability that may include voltage control, frequency control, and other
10
ancillary services.14 Control of voltage and frequency within a power system are essential to maintaining the balance between generation and load.
Voltage control in an alternating current power system is defined as the ability to adjust for changes in reactive power. Reactive power supports the magnetic and electric fields required for alternating current power systems to function. Frequency control is defined as the ability to dispatch generation due to decreases in supply or increases in load within a power system.
Statewide capacity of the newest group of natural gas-fired plants, CCs, is 20,026 MW. These plants account for 45 percent of California’s total natural gas-fired generation capacity. In 2016, they provided 67 percent (71,172 GWh) of the total energy from natural gas-fired generation categories. Also, CC plants operated at an average capacity factor of 40.5 percent and had an average heat rate of 7,338 Btu/kWh. The impact from the large growth in CC plants has been to reduce reliance upon the state’s fleet of aging power plants, now operating at a minimal 4 percent capacity factor.
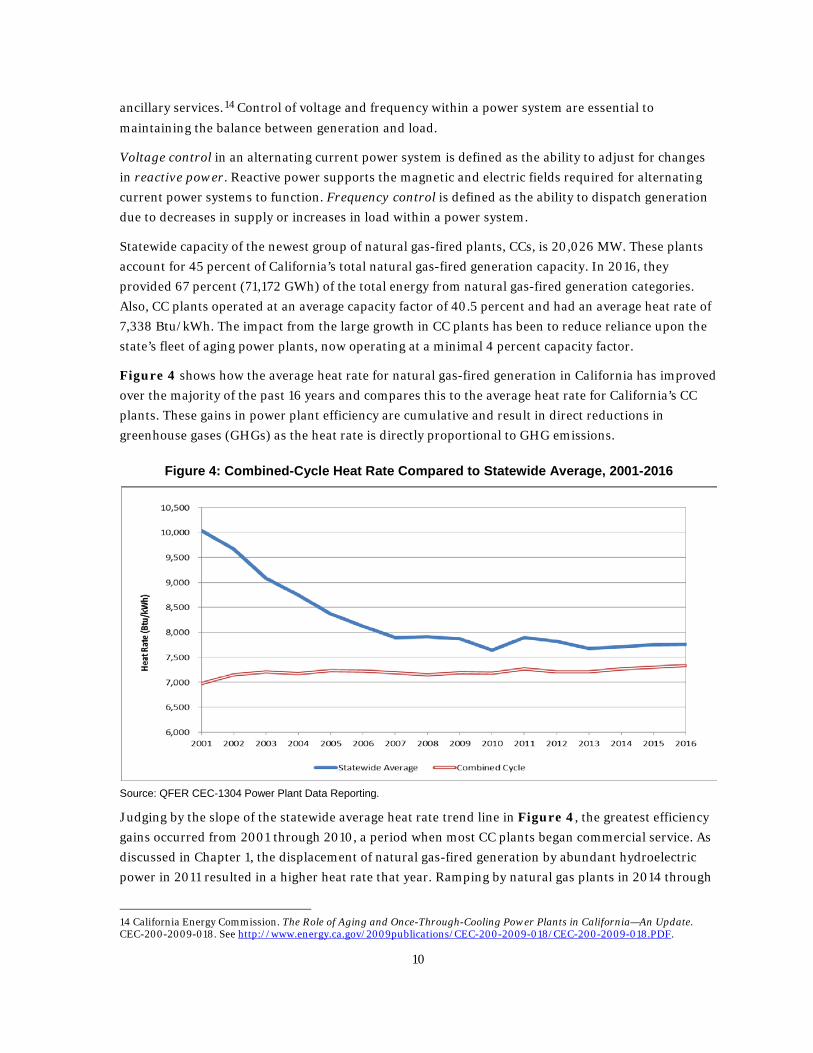
Figure 4 shows how the average heat rate for natural gas-fired generation in California has improved over the majority of the past 16 years and compares this to the average heat rate for California’s CC plants. These gains in power plant efficiency are cumulative and result in direct reductions in greenhouse gases (GHGs) as the heat rate is directly proportional to GHG emissions.
Figure 4: Combined-Cycle Heat Rate Compared to Statewide Average, 2001-2016
Source: QFER CEC-1304 Power Plant Data Reporting.
Judging by the slope of the statewide average heat rate trend line in Figure 4, the greatest efficiency gains occurred from 2001 through 2010, a period when most CC plants began commercial service. As discussed in Chapter 1, the displacement of natural gas-fired generation by abundant hydroelectric power in 2011 resulted in a higher heat rate that year. Ramping by natural gas plants in 2014 through
14 California Energy Commission. The Role of Aging and Once-Through-Cooling Power Plants in California—An Update. CEC-200-2009-018. See http://www.energy.ca.gov/2009publications/CEC-200-2009-018/CEC-200-2009-018.PDF.
11
2016 to accommodate newly developed solar and wind generation facilities has caused the most recent increases in the systemwide average heat rate. Hydroelectric generation doubled in 2016 as well, further reducing output from CC power plants, which directly impacts overall thermal efficiency as they are forced to operate at reduced output levels. However, the state as a whole has benefited from large reductions in GHG emissions as hydroelectric, solar, and wind generation have zero GHG emissions compared to even the most efficient natural gas-fired power plant. Indeed, 2016 was the first year since the closure of San Onofre that in-state non-GHG emitting power generation surpassed 50 percent of total in-state electricity supply.
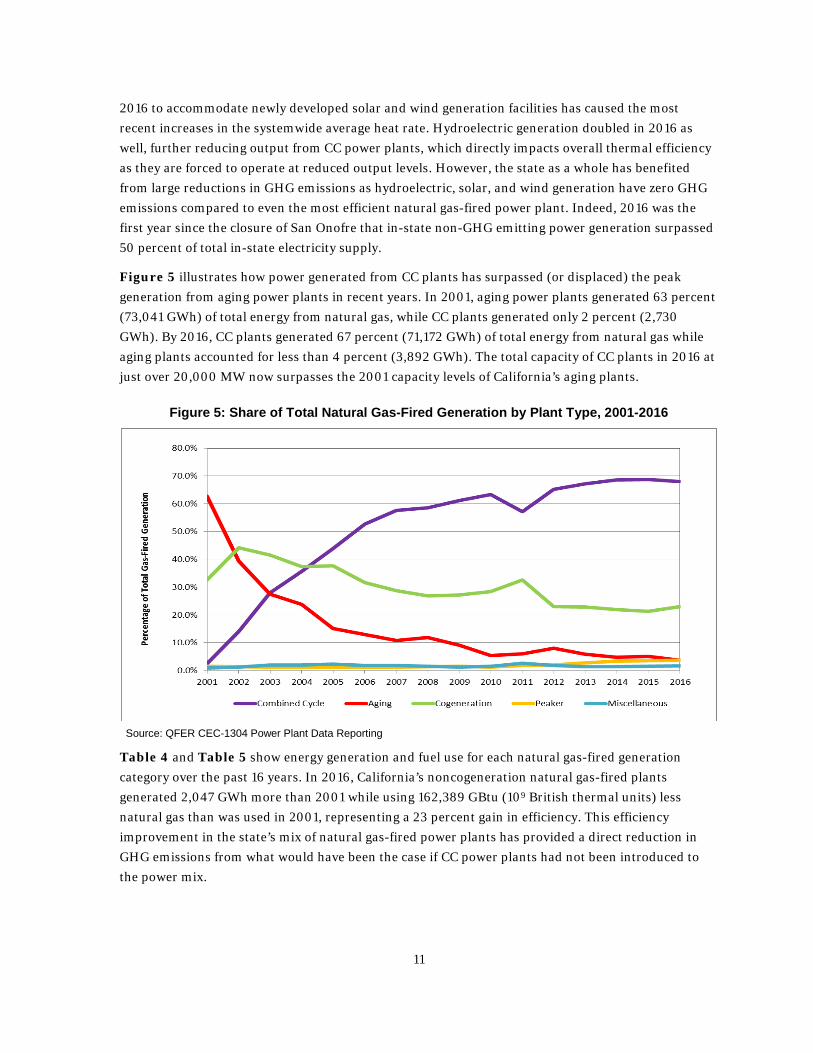
Figure 5 illustrates how power generated from CC plants has surpassed (or displaced) the peak generation from aging power plants in recent years. In 2001, aging power plants generated 63 percent (73,041 GWh) of total energy from natural gas, while CC plants generated only 2 percent (2,730 GWh). By 2016, CC plants generated 67 percent (71,172 GWh) of total energy from natural gas while aging plants accounted for less than 4 percent (3,892 GWh). The total capacity of CC plants in 2016 at just over 20,000 MW now surpasses the 2001 capacity levels of California’s aging plants.
Figure 5: Share of Total Natural Gas-Fired Generation by Plant Type, 2001-2016
Source: QFER CEC-1304 Power Plant Data Reporting
Table 4 and Table 5 show energy generation and fuel use for each natural gas-fired generation category over the past 16 years. In 2016, California’s noncogeneration natural gas-fired plants generated 2,047 GWh more than 2001 while using 162,389 GBtu (109 British thermal units) less natural gas than was used in 2001, representing a 23 percent gain in efficiency. This efficiency improvement in the state’s mix of natural gas-fired power plants has provided a direct reduction in GHG emissions from what would have been the case if CC power plants had not been introduced to the power mix.

12
Table 4: Generation From California’s Natural Gas-Fired Power Plants 2001–2016 (GWh)
Source: QFER CEC-1304 Power Plant Data Reporting
Table 5: Natural Gas Usage for California’s Power Plants 2001–2016 (Thousand MMBtu)
Source: QFER CEC-1304 Power Plant Data Reporting
2001 2002 2003 2004 2005 2006 2007 2008 2009 2010 2011 2012 2013 2014 2015 2016
Combined- Cycle 2,730 12,954 26,335 37,605 42,576 57,481 71,357 75,936 75,706 72,649 54,878 85,397 87,361 89,411 87,181 71,172
Aging 73,037 36,535 25,886 24,937 14,641 14,136 13,342 15,304 11,198 6,218 5,680 10,424 7,588 6,221 6,452 3,892
Cogeneration 37,882 40,910 39,307 39,340 36,536 34,529 35,472 34,803 33,516 32,614 31,294 30,145 29,671 28,595 27,011 25,161
Peaking 1,715 1,308 1,056 1,280 1,176 1,181 1,421 1,780 1,768 1,405 1,743 2,569 3,513 4,363 4,425 3,898
Miscellaneous 1,040 1,029 1,911 2,107 2,195 1,890 2,173 1,997 1,551 1,762 2,504 2,366 1,828 1,792 1,850 1,697
State Total 116,404 92,736 94,495 105,269 97,124 109,217 123,765 129,820 123,739 114,648 96,099 130,901 129,961 130,382 126,919 105,820
2001 2002 2003 2004 2005 2006 2007 2008 2009 2010 2011 2012 2013 2014 2015 2016
Combined- Cycle 19,036 92,581 189,850 269,908 307,828 415,525 513,084 542,740 544,781 521,691 398,968 615,296 629,434 650,038 636,741 522,255
Aging 739,532 384,761 280,520 272,229 165,139 159,487 147,207 170,374 129,825 72,632 69,859 122,057 86,600 73,267 75,379 47,919
Cogeneration 421,238 454,126 434,340 444,807 415,895 390,640 398,585 399,492 381,338 364,689 351,244 339,388 340,004 327,523 308,871 292,540
Peaking 19,255 14,114 11,313 13,845 12,720 12,697 15,462 18,846 19,132 15,471 18,717 27,843 36,257 44,698 45,194 40,027
Miscellaneous 10,543 9,805 19,755 20,968 21,809 18,860 21,687 20,101 16,126 17,486 24,041 22,541 17,338 16,662 17,435 15,775
State Total 1,209,604 955,387 935,778 1,021,757 923,391 997,209 1,096,025 1,151,553 1,091,202 991,969 862,829 1,127,125 1,109,633 1,112,458 1,083,620 918,516

13
California’s Total System Electric Generation Total system electric generation is a method of accounting for the complete fuel source profile of electric generation serving California. Figure 6 summarizes the energy contribution from each of the five natural gas-fired power plant categories from 2001 through 2016, together with all other fuel types serving California, to provide the context for natural gas-fired generation within the total system electric generation mix. In this figure, the displacement of natural gas-fired generation by hydroelectric generation in wet hydrological years becomes apparent. Moreover, the loss of zero-GHG energy from the closure of San Onofre in 2012 has been completely replaced by renewable generation in 2016.
Figure 6: California’s Total System Electric Generation, 2001-2016
Source: QFER CEC-1304 Power Plant Data Reporting
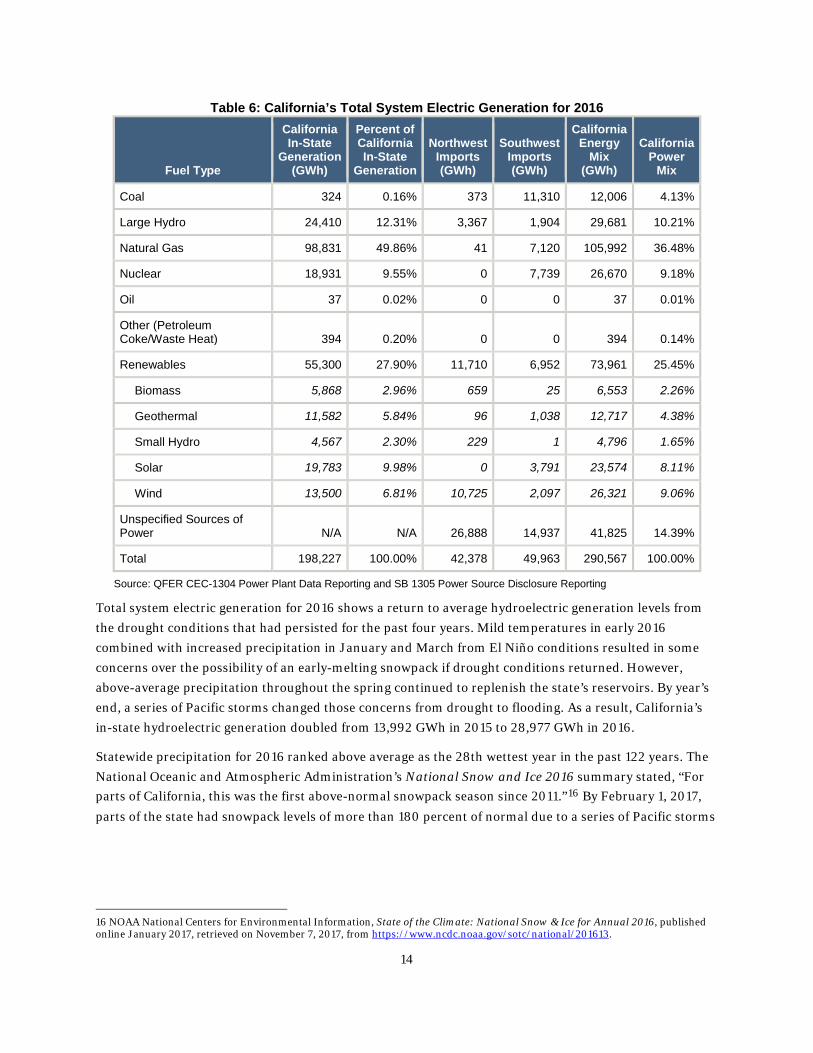
Table 6 details the accounting of California’s total system electric generation in 2016. Total generation was 290,567 GWh, down 1.6 percent from 295,405 GWh in 2015. California’s non-carbon dioxide (CO2) emitting electric generation categories (nuclear, large hydroelectric, and renewable generation) accounted for 50 percent of total in-state generation for 2016, compared to 40 percent in 2015. While California's in-state electric generation was up by 1.0 percent at 198,227 GWh compared to 196,195 GWh in 2015, net imports were down by 6,869 GWh to 92,341 GWh leading to an overall decrease in total generation for the year. This decline is consistent with the recently published California Energy Demand Updated Forecast, 2017-2027.15
15 California Energy Demand Updated Forecast, 2017-2027, Page 13, January 2017 CEC-200-2016-016-CMF, http://docketpublic.energy.ca.gov/PublicDocuments/16-IEPR-05/TN215745_20170202T125433_FINAL_California_Energy_Demand_Updated_Forecast_20172027.pdf
14
Table 6: California’s Total System Electric Generation for 2016
Fuel Type
California In-State
Generation (GWh)
Percent of California In-State
Generation
Northwest Imports (GWh)
Southwest Imports (GWh)
California Energy
Mix (GWh)
California Power
Mix
Coal 324 0.16% 373 11,310 12,006 4.13%
Large Hydro 24,410 12.31% 3,367 1,904 29,681 10.21%
Natural Gas 98,831 49.86% 41 7,120 105,992 36.48%
Nuclear 18,931 9.55% 0 7,739 26,670 9.18%
Oil 37 0.02% 0 0 37 0.01%
Other (Petroleum Coke/Waste Heat) 394 0.20% 0 0 394 0.14%
Renewables 55,300 27.90% 11,710 6,952 73,961 25.45%
Biomass 5,868 2.96% 659 25 6,553 2.26%
Geothermal 11,582 5.84% 96 1,038 12,717 4.38%
Small Hydro 4,567 2.30% 229 1 4,796 1.65%
Solar 19,783 9.98% 0 3,791 23,574 8.11%
Wind 13,500 6.81% 10,725 2,097 26,321 9.06%
Unspecified Sources of Power N/A N/A 26,888 14,937 41,825 14.39%
Total 198,227 100.00% 42,378 49,963 290,567 100.00%
Source: QFER CEC-1304 Power Plant Data Reporting and SB 1305 Power Source Disclosure Reporting
Total system electric generation for 2016 shows a return to average hydroelectric generation levels from the drought conditions that had persisted for the past four years. Mild temperatures in early 2016 combined with increased precipitation in January and March from El Niño conditions resulted in some concerns over the possibility of an early-melting snowpack if drought conditions returned. However, above-average precipitation throughout the spring continued to replenish the state’s reservoirs. By year’s end, a series of Pacific storms changed those concerns from drought to flooding. As a result, California’s in-state hydroelectric generation doubled from 13,992 GWh in 2015 to 28,977 GWh in 2016.
Statewide precipitation for 2016 ranked above average as the 28th wettest year in the past 122 years. The National Oceanic and Atmospheric Administration’s National Snow and Ice 2016 summary stated, “For parts of California, this was the first above-normal snowpack season since 2011.”16 By February 1, 2017, parts of the state had snowpack levels of more than 180 percent of normal due to a series of Pacific storms
16 NOAA National Centers for Environmental Information, State of the Climate: National Snow & Ice for Annual 2016, published online January 2017, retrieved on November 7, 2017, from https://www.ncdc.noaa.gov/sotc/national/201613.

15
bringing heavy snowfall to the higher elevations.17 Accordingly, on April 7, 2017, Governor Edmund G. Brown Jr. declared an official end to California’s four-year drought.18
Net energy imports from the Northwest and Southwest decreased by 6.9 percent from 2015 levels based on reported imports and exports by California balancing authorities. Balancing authorities control power flowing across transmission ties between different regions within the Western Electricity Coordinating Council.19 Net energy imports were 92,341 GWh in 2016, down 6,869 GWh from 2015.
California obtains roughly two-thirds of its power (about 200,000 GWh) from power plants within the state while importing the remaining one-third of its power (nearly 100,000 GWh) from surrounding states within the Western Electricity Coordinating Council. Imported energy plays a large role in shaping the state’s overall efficiency. Part of this imported energy is composed of long-term contracts by California utilities with out-of-state renewable and nonrenewable power plants, referred to as specific claims by utilities. The remainder of the imported energy category is from short-term, spot-market purchases that can also be considered specific claims if a power plant is identified or, if the original power plant is not able to be identified, unspecified power. Unspecified power is energy that cannot be directly traced back to the originating power plant. It makes up about 15 percent of total system power.
Generally, the unspecified power category would consist of short-term market purchases from those power plants that do not have a contract with a California utility. Much of the Northwest spot market purchases would probably be served by surplus large hydroelectric generators rated at more than 30 MW in nameplate capacity and CC power plants as marginal supply to California. Hydroelectric facilities rated less than 30 MW are generally considered to be eligible as renewable energy and would typically be contracted by a California utility to meet the state’s Renewables Portfolio Standard. Spot market purchases from the Southwest would most likely be energy from CC and coal-fired power plants. Large solar renewable projects are already contracted under long-term specified contracts with California utilities to meet renewable energy mandates.
Finally, there is the issue of null power. Null power refers to power that was originally renewable power but from which the renewable energy certificates have been unbundled from the energy and sold, and ultimately retired, separately. Renewable energy certificates do not have to be used in the same year as the associated energy procured. Accordingly, null power is, by definition, not attributable to any technology or fuel type and may make up some portion of unspecified power in any given year.
17 NOAA National Centers for Environmental Information, State of the Climate: National Snow & Ice for January 2017, published online February 2017, retrieved on November 28, 2017, from https://www.ncdc.noaa.gov/sotc/snow/201701.
18 Executive Order B-40-17, State of California, retrieved on November 7, 2017, from https://www.gov.ca.gov/docs/4.7.17_Exec_Order_B-40-17.pdf.
19 Western Electricity Coordinating Council is a nonprofit corporation that exists to assure a reliable electric system in the western United States, western Canada, and northern Baja California, Mexico.
16
CHAPTER 4: Changes in Hourly Generation
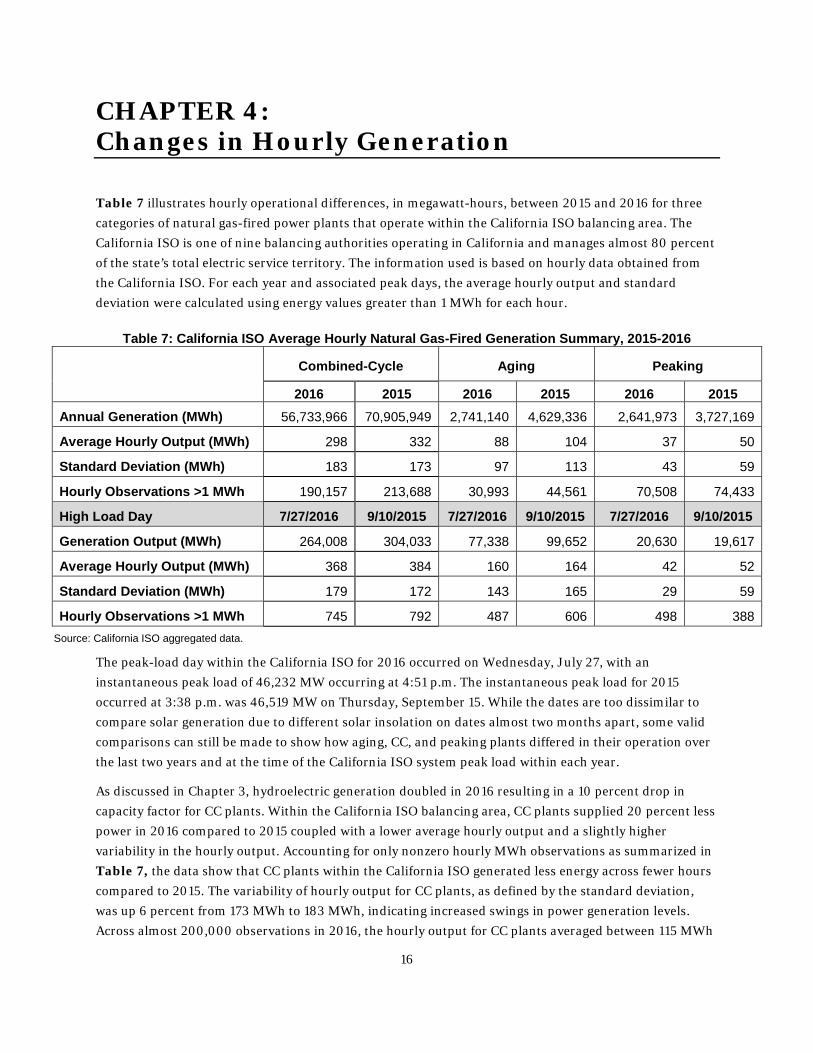
Table 7 illustrates hourly operational differences, in megawatt-hours, between 2015 and 2016 for three categories of natural gas-fired power plants that operate within the California ISO balancing area. The California ISO is one of nine balancing authorities operating in California and manages almost 80 percent of the state’s total electric service territory. The information used is based on hourly data obtained from the California ISO. For each year and associated peak days, the average hourly output and standard deviation were calculated using energy values greater than 1 MWh for each hour.
Table 7: California ISO Average Hourly Natural Gas-Fired Generation Summary, 2015-2016
Combined-Cycle Aging Peaking
2016 2015 2016 2015 2016 2015 Annual Generation (MWh) 56,733,966 70,905,949 2,741,140 4,629,336 2,641,973 3,727,169
Average Hourly Output (MWh) 298 332 88 104 37 50
Standard Deviation (MWh) 183 173 97 113 43 59
Hourly Observations >1 MWh 190,157 213,688 30,993 44,561 70,508 74,433
High Load Day 7/27/2016 9/10/2015 7/27/2016 9/10/2015 7/27/2016 9/10/2015
Generation Output (MWh) 264,008 304,033 77,338 99,652 20,630 19,617
Average Hourly Output (MWh) 368 384 160 164 42 52
Standard Deviation (MWh) 179 172 143 165 29 59
Hourly Observations >1 MWh 745 792 487 606 498 388 Source: California ISO aggregated data.
The peak-load day within the California ISO for 2016 occurred on Wednesday, July 27, with an instantaneous peak load of 46,232 MW occurring at 4:51 p.m. The instantaneous peak load for 2015 occurred at 3:38 p.m. was 46,519 MW on Thursday, September 15. While the dates are too dissimilar to compare solar generation due to different solar insolation on dates almost two months apart, some valid comparisons can still be made to show how aging, CC, and peaking plants differed in their operation over the last two years and at the time of the California ISO system peak load within each year.
As discussed in Chapter 3, hydroelectric generation doubled in 2016 resulting in a 10 percent drop in capacity factor for CC plants. Within the California ISO balancing area, CC plants supplied 20 percent less power in 2016 compared to 2015 coupled with a lower average hourly output and a slightly higher variability in the hourly output. Accounting for only nonzero hourly MWh observations as summarized in Table 7, the data show that CC plants within the California ISO generated less energy across fewer hours compared to 2015. The variability of hourly output for CC plants, as defined by the standard deviation, was up 6 percent from 173 MWh to 183 MWh, indicating increased swings in power generation levels. Across almost 200,000 observations in 2016, the hourly output for CC plants averaged between 115 MWh

17
and 481 MWh 68 percent of the time. Compared to 2015, where the range of operation within one standard deviation was 159 MWh to 505 MWh, the range in average output in 2016 was greater, albeit at lower levels. The implication is that in 2016 CC plants were being ramped up and down more frequently at lower average levels of output to integrate hydroelectric generation and renewable generation.
Aging plants within the California ISO generated 40 percent less energy (3,892 GWh) in 2016 with a lower average hourly output of 88 MWh and reduced variability across fewer hours than in 2015. Now delivering less than 4 percent of the state’s total natural gas-fired energy in 2016, roughly 3,700 MW of aging and OTC capacity has retired since December 2015. Those that still remain will continue to be used for system and local reliability and for providing flexible capacity support in the event of transmission outage or a major equipment failure at a nearby power plant.
Peaking plants also saw a drop in average hourly output in 2016 to 37 MWh from 50 MW while operating 5 percent fewer hours. With most plants sized at 49.9 MW in nameplate capacity, the data show that peaking plants continue to be used as intended, either completely on or off as the associated standard deviation is 43 MWh. Peaking plants had 27 percent less variability in 2016, suggesting that system electric loads may have been less variable compared to loads in 2015.
Figure 7 and Figure 8 show the contribution of CC, aging, and peaking generation to the hourly loads across the week on which the peak-load day occurred within the California ISO balancing area for 2015 and 2016. Solar, wind, and hydroelectric generation are included separately along with a category that groups biomass, geothermal, nuclear, refinery waste-heat turbines, petroleum coke, and cogeneration into a single Other category. Imports are classified separately and are not distinguished by fuel type.
While it is apparent there is modest ramping of the Other category during peak hours of the day, both charts show significant ramping of the CC, hydroelectric, peaking, aging, and import categories. However, where hydroelectric generation was in short supply in 2015, abundant precipitation in 2016 allowed it to displace both aging and CC generation, particularly during the off-peak hours. Solar facilities maximize power output at noon each day when solar irradiance, the rate at which solar energy falls onto the Earth, is at its peak; this typically occurs a few hours before California’s peak demand for electricity. Wind, on the other hand, typically generates maximum output during off-peak hours, thereby also missing the state’s daily peak demand period.
Both wind and solar technologies are considered to be participating intermittent resources by the California ISO. As participating intermittent resources, they are able to schedule energy into the real-time market without incurring imbalance charges when the delivered energy deviates from the scheduled amount.20 They are energy resources that are not operated in a traditional sense but may also be curtailed during periods of overgeneration on the system. Other fossil and hydroelectric generators are ramped up or down to accommodate the natural daily fluctuations in renewable energy output. It is this ramping for natural gas-fired plants that negatively impacts the overall heat rate but still achieves fuel savings for hours not operated due to hydroelectric and renewable energy availability.
20 California ISO Participating Intermittent Resources, https://www.caiso.com/Pages/documentsbygroup.aspx?GroupID=38318ED0-1E40-494A-8539-7BB8A54ECEEF.

18
Figure 7: California ISO Hourly System Load During September 6–12, 2015
Source: California ISO aggregated data
Figure 8: California ISO Hourly System Load During July 24–30, 2016
Source: California ISO aggregated data

19
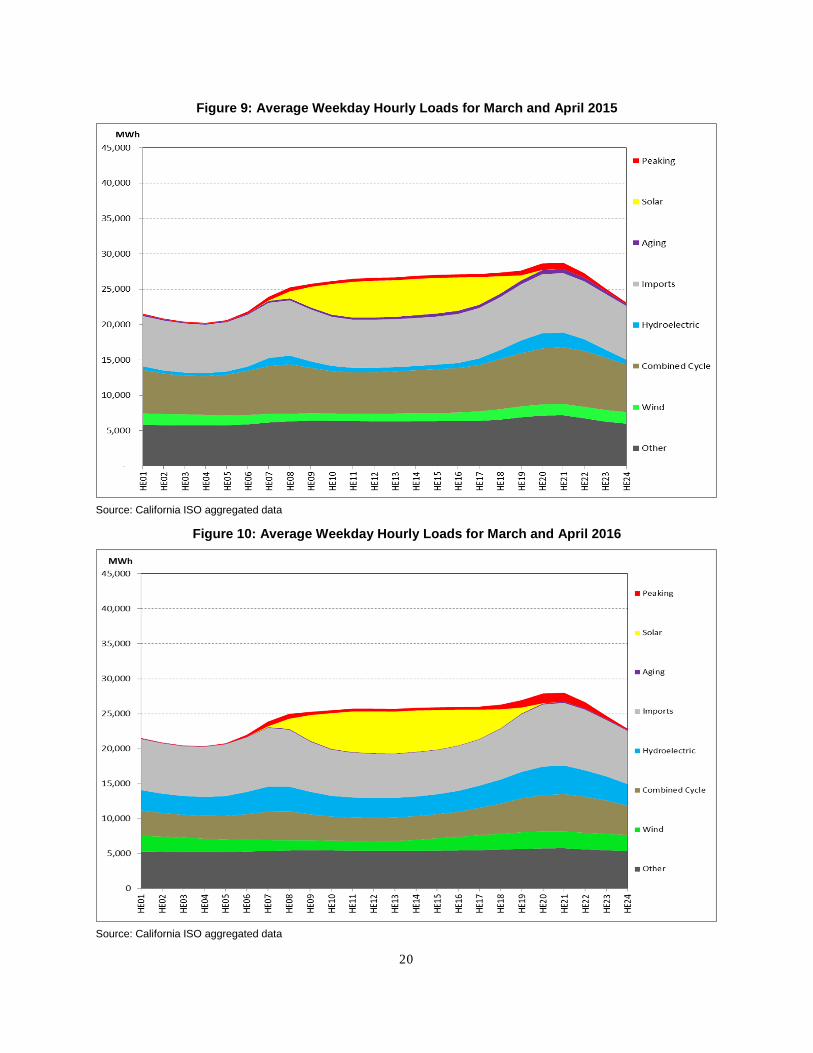
The following six charts, Figure 9 through Figure 14, compare the average weekday generation during three pairs of months: March and April, July and August, and November and December of 2015 and 2016. Federal holidays were excluded from the calculation of the weekday average as energy usage on holidays is more similar to weekend loads as opposed to weekday loads. These pairs of months were chosen as they tend to represent the extremes of the availability of spring runoff for hydroelectric generation, summertime peak temperatures, and low winter loads during the shortest days of the year.
Common to all six figures is the impact of hydroelectric generation on the hourly mix of fuel types. As previously stated, the drought through 2015 limited hydroelectric generation, with this deficit made up with aging and CC generation. As observed in Figure 9, the limited hydroelectric generation dispatch coincided with the morning peak loads just prior to solar availability and again during the early evening hours as solar generation rolls off. The return of plentiful hydroelectric generation in 2016 due to early January and March storms from El Nino conditions not only helped with the ramping of solar generation in the morning and evening hours but also pushed down more expensive natural gas-fired generation during all other hours of the day, as observed in Figure 10. The availability of hydroelectric generation coupled with the growth in solar generation resulted in a significant scaling back of generation from CC and aging plants in 2016.
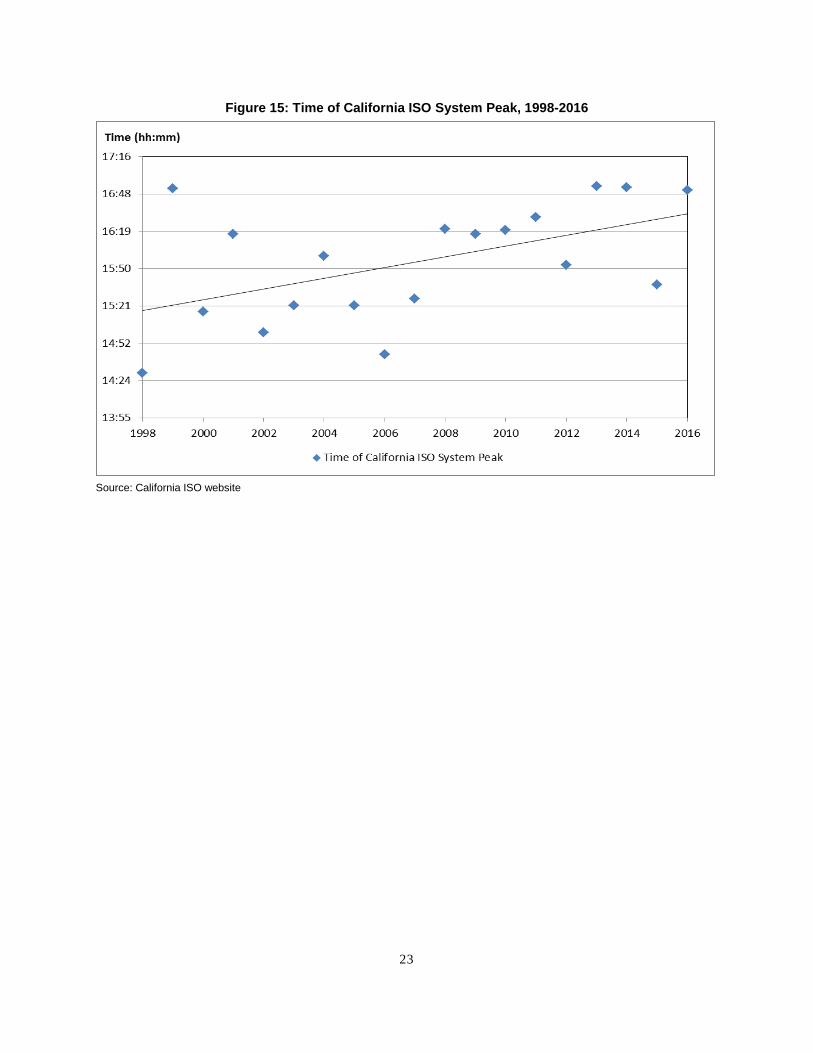
In addition to the changes in thermal generation, as utility-scale solar generation grows in 2016, the ramping of nonsolar generation in the early evening hours becomes more pronounced. Figure 9 and Figure 10 show the California ISO system peak occurs between hour-ending (HE) 20:00 hours (HE20) and HE21 as solar energy tapers off quickly after HE17. With the tremendous growth of behind-the-meter rooftop solar photovoltaic systems on homes, California’s utility-served peak power appears to be shifting to later hours during the summer months as shown in Figure 11 and Figure 12. The 2016 California ISO annual system peak period of HE17 is occurring a full two hours later than during the late 1990s and early 2000s, when the peak load typically occurred during HE15 and HE16. Figure 13 and Figure 14 highlight the California ISO system peak in winter occurring well after sunset during the evening hours of HE18 and HE19.
Figure 15 plots the times of the California ISO system peak load for 1998 through 2016.21 Also shown in Figure 15 is a trend line highlighting the movement of the system peak to a later hour of the day over the past 18 years.
21 California ISO website. Accessed November 22, 2017. https://www.caiso.com/Documents/CaliforniaISOPeakLoadHistory.pdf.
20
Figure 9: Average Weekday Hourly Loads for March and April 2015
Source: California ISO aggregated data
Figure 10: Average Weekday Hourly Loads for March and April 2016
Source: California ISO aggregated data

21
Figure 11: Average Weekday Hourly Loads for July and August 2015
Source: California ISO aggregated data
Figure 12: Average Weekday Hourly Loads for July and August 2016
Source: California ISO aggregated data

22
Figure 13: Average Weekday Hourly Loads for November and December 2015
Source: California ISO aggregated data
Figure 14: Average Weekday Hourly Loads for November and December 2016
Source: California ISO aggregated data
23
Figure 15: Time of California ISO System Peak, 1998-2016
Source: California ISO website

24
CHAPTER 5: Conclusion
California has experienced a significant improvement in the systemwide thermal efficiency of its natural gas-fired power plant fleet over the last 16 years. From 2001 to 2016, the systemwide thermal efficiency has improved by 23 percent. This improvement in efficiency, which has stayed at same level for the past four years, is due primarily to the increased reliance upon new CC power plants and the phaseout of aging and OTC power plants.
The improvement in thermal efficiency has resulted in GHG emission reductions, although the closure of San Onofre in 2012 and the drought temporarily dampened this effect. The growth in renewable generation over the years leading up to the early retirement of San Onofre set the stage for California to weather the loss of a major zero-GHG power plant. By 2016, after a four-year drought, California had large reductions in GHG emissions as hydroelectric, solar, and wind generation offset even the most efficient natural gas-fired power plants with zero-GHG energy. By the end of 2016, the capacity factor for CC power plants dropped by 10 percent to 40.5 percent. Continued development of wind and solar projects coupled with above-average precipitation that refilled the state’s reservoirs resulted in 2016 being the first year since the closure of San Onofre that in-state non-GHG emitting power generation surpassed 50 percent of total in-state electricity supply.
Key Findings • Modern CC plants have effectively replaced aging steam turbine power plants for both operational
capacity and energy output in 2016. • Statewide average thermal efficiency has improved by 23 percent since 2001 due to the use of CC
plants instead of aging plants. • Thermal efficiency gains have remained at 23 percent over the past four years due to ramping of
thermal generation to meet the large growth in wind and solar renewable generation. • Hydroelectric generation returned to average predrought levels, doubling from 2015, displacing
aging and CC generation. • Average hourly generation of CC plants within the California ISO control area dropped 10 percent
and had 6 percent more variability in the associated average hourly output compared to 2015, indicating increased swings in power generation levels.
• California’s non-GHG emitting electric generation accounted for 50 percent of total in-state generation in 2016.
25
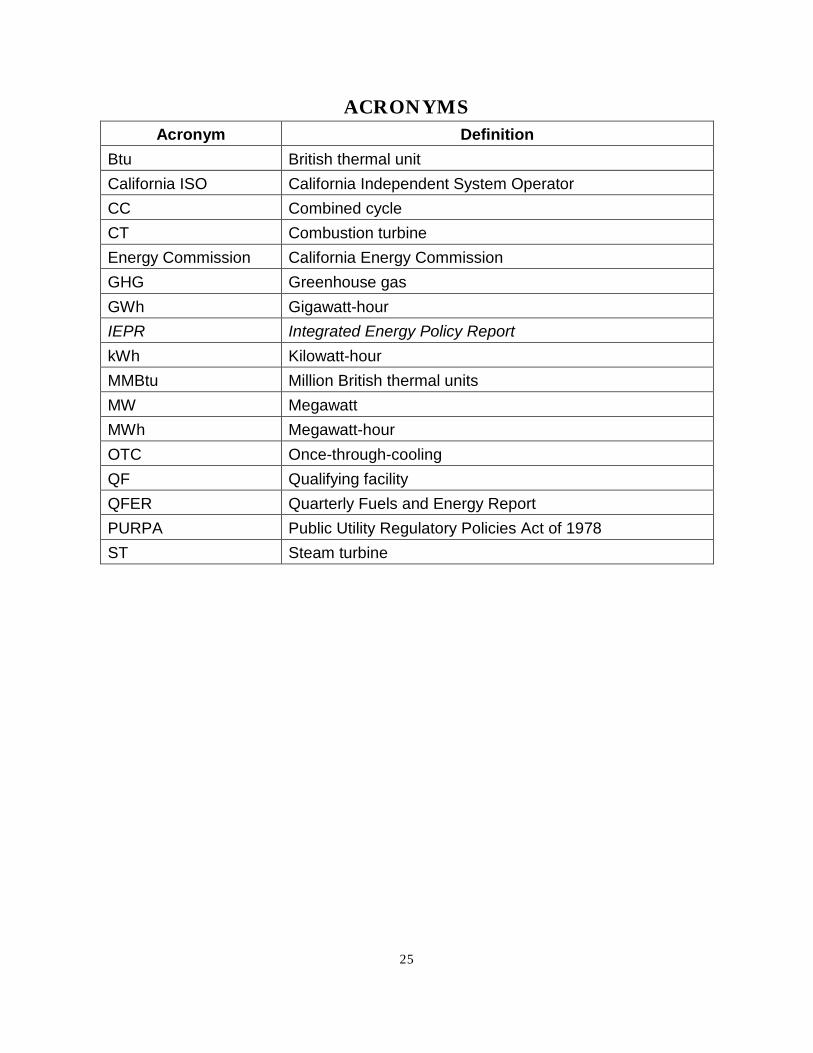
ACRONYMS Acronym Definition
Btu British thermal unit California ISO California Independent System Operator CC Combined cycle CT Combustion turbine Energy Commission California Energy Commission GHG Greenhouse gas GWh Gigawatt-hour IEPR Integrated Energy Policy Report kWh Kilowatt-hour MMBtu Million British thermal units MW Megawatt MWh Megawatt-hour OTC Once-through-cooling QF Qualifying facility QFER Quarterly Fuels and Energy Report PURPA Public Utility Regulatory Policies Act of 1978 ST Steam turbine