Numerical Investigation of Broadband Slat Noise Attenuation with Acoustic liner Treatment

Thermal Conductivity andNoise Attenuation inAluminium Foams
Saira AmjadWolfson College
University of Cambridge
A dissertation submitted for the degree of Master ofPhilosophy in Materials Modelling at the University of
Cambridge
October 2001

Preface
This dissertation is submitted for the degree of Master of Philosophy in Materials
Modelling at the University of Cambridge. The research described was conducted
under the supervision of Prof. H. K. D. H. Bhadeshia in the Department of Materials
Science and Metallurgy, Cambridge between July 2001 and October 2001. This
dissertation contains less than 15,000 words.
Expect where acknowledgement and reference is made to previous work, this work is
to the best of my knowledge. Neither this, nor any substantially similar dissertation
has been, or is been, submitted for any other degree, diploma or qualification at any
other university.

ACKNOWLEDGEMENTS
I would like to thank my supervisor Prof. H.K.D.H Bhadeshia for his constant support
and encouragement throughout the project. I would also like to thank the members of
the Phase Transformation and Complex Properties research group for their assistance
when required.
Finally, I would like to thank those who have contributed to the MPhil course in either
organising the course in its first year or by lecturing.

ContentsPreface
Acknowledgements
Nomenclature
Objective i
1. METALLIC FOAMS
1.1 CHARACTERISING THE PROPERTIES OF METALLIC FOAMS 1
1.2 PRODUCTION OF FOAMS
1.2.1 From Melts 2
1.2.2 Powders 5
1.2.3 Deposition 6
1.3 APPLICATION OF METALLIC FOAMS
1.3.1 Structural 7
1.3.2 Heat Exchangers 8
1.3.3 Impact 8
1.3.4 Corrosion-resistant and high-temperature filters 9
1.3.5 Acoustic Applications 9
2. THERMAL CONDUCTIVITY
2.1 THERMAL RESISTANCE
2.1.1 Thermal Conductors in Series 12
2.1.2 Thermal conductors in parallel 13
2.2 THERMAL CONDUCTIVITY IN FOAMS
2.2.1 Conduction in solid phases 14
2.2.2 Conduction in gas phase 14
2.2.3 Convection 14
2.2.4 Radiation 15
2.2.5 Combination of mechanisms 15

2.3 PREVIOUS MODELS OF THERMAL CONDUCTIVITY
2.3.1 Calmidi and Mahajan Model 16
2.3.2 Tetrakiadechedron Model 18
3. MODEL DEVELOPED FOR THERMAL CONDUCTIVITY
3.1 The Cube Models 21
3.2 The Sphere Model 23
4. RESULTS AND DISCUSSION 25
5. ATTENUATION OF SOUND
5.1 NATURE OF SOUND WAVE 29
5.2 MEASURING SOUND WAVES 29
5.3 MECHANISM OF SOUND 30
5.3.1 Sound absorption 31
5.3.1.1 Porous absorbers 31
5.3.1.2 Panel Absorbers 31
5.3.1.3 Resonators 32
5.3.2 Insulation 32
5.3.3 Isolation 32
5.4 SOUND ABSORPTION MEASUREMENTS 32
5.6 SOUND ABSORPTION IN METAL FOAMS 33
6. MODEL DEVELOPED FOR SOUND ATTENUATION 37
7. RESULTS AND DISCUSSION 39
8. SUMMARY AND FUTURE WORK 41
9. REFERENCES 43
10. APPENDIX

NOMENCLATURE
E Young’s modulus
TiH2 Titanium hydride
Ni (CO) 4 Nickel carbonyl
CVD Chemical Vapour Deposition
K Thermal conductivity
Q Heat flow in unit time
I Current
V Potentional difference
RTH Thermal resistance of conductor
σsb Stefan’s constant
T4 Temperature difference
K* Total thermal conductivity
Ke Effective thermal conductivity
Am Area of cross section of foam
Lm Height of foam
ε Porosity
K1 Thermal conductivity of material 1
K2 Thermal conductivity of material 2
Q1 Heat flow in material 1
Q Heat flow in material 2
V1 Volume fraction of material 1
V2 Volume fraction of material 2
L1 Height of material 1
L2 Height of material 2
r length of cubical nodes
L length of ligament
a radius of cross section of ligament
P pressure
γ Surface energy
Cvm molar heat capacity at constant volume
λm Mean free path
f frequency

λ wavelength
SIL Sound intensity level
SPL Sound power level
α Sound absorption coefficient
ρ0 air density
ω Angular frequency
ω1 undamped frequency
X amplitude
x displacement of base
y deflection of mass
m1 mass per unit area

OBJECTIVE
Metallic foams have now been researched for many decades. However, the Defence
Evaluation and Research Agency is interested in very thin metallic foams containing
closed-cell pores. The fraction of porosity in these sheets of foams is at the moment
about 0.5 but the intention is to increase the fraction to 0.8 or higher. A number of
questions arose during research on these foams:
1) How does the thermal conductivity and noise attenuation vary as a function of
porosity for these thin sheets of foams?
2) Is there any pore size dependence of these properties?
A search of the literature revealed considerable work on the modelling of thermal
conductivity and noise attenuation but not specifically for the fraction of interest nor
anything about pore size dependence. A solution to this problem was the aim of this
research.
The research begins with an introduction of the many ways of manufacturing metallic
foams containing large fractions of porosity and their applications. Such materials in
principle combine good mechanical properties with a reduction in weight.
It then explains the thermal conductivity of metallic foams, and summarizes previous
models and their shortcomings. To overcome the shortcomings a new, simple-cube
model was created and the thermal conductivity was calculated as a function of
porosity. It showed that the thermal conductivities could be estimated for any level of
porosity. The size dependency was also investigated using two smaller cubes within
the cube model. A sphere model was also developed to see if shape could affect
thermal conductivity, but the thermal conductivity could then only be calculated for
small fractions due to stereological effects. The effect of gas pressure in the spheres
on thermal conductivity was also investigated but it showed that the pressure is
independent of thermal conductivity. The work confirmed no effect of pore size on
thermal conductivity.

Finally the nature of sound, its properties and different mechanisms of sound
attenuation were briefly described. Previous models for measuring sound absorption
were summarized and a model was applied to study sound absorption as a function of
frequency.

1. METALLIC FOAMS
Metal foams are similar to any other foam (i.e. bath foam, aero chocolate) but recently
there has been considerable interest in their properties. Typically about 80-90% of the
structure of a modern metallic foam is made of pores, which can be connected
together giving an open cell foam or isolated giving closed cell foam made of separate
cells which trap gas inside the metal Figure 1. Aluminium foams are important due to
their high strength and stiffness for a given weight.
Fig 1a Fig 1b
Figure 1(a) Scanning electron micrograph (SEM) of an open-cell aluminium foam
from DOUCEL (b) X-ray tomography of a closed-cell aluminium produced by a
continuous process of gas injection to a viscous melt [1].
1.1 CHARACTERISING THE PROPERTIES OF METALLIC FOAMS
High porosity metallic foams are characterised by the morphology of the porous cells
(cell geometry, open or closed), cell topology, relative density, cell size, cell shape,
properties of the cell wall and the degree of anisotropy.
The mechanical properties of open and closed cell foams differ significantly. The
linear elastic response in an open-cell foam is due to the bending of the cell walls. In a
closed-cell foam the cell walls stretch and the air or other gas within the cell is
compressed.

The expressions for modulus, elastic, plastic and brittle collapse stresses, the fracture
toughness and the strain at which densification occurs can be derived by examining
the way in which cell edges respond to stresses. This gives a good description of the
behaviour of open cell foams. For closed cell foams the deformation of the cell faces
as well as the cell edges and the response of the fluid (usually gas) within the cells
must be included to give a complete description of the foam [2].
1.2 PRODUCTION OF FOAMS
There are a number of processing routes available for the manufacture of metal foams,
including bubbling gas through molten alloys, stirring a foaming agent through the
melt, consolidation of metal powders with a particulate foaming agent, and pressure
infiltration of the molten metal into a wax or polymer-foam precursor.
Each method can be used to create a porous material with a limited range of relative
densities and cell sizes. Each production method has its own structure, densities and
imperfections. These imperfections can be variations in cell-walls thickness or non-
uniform cell shape. The structures can be characterised using optical microscopy, X-
ray tomography, and scanning electron microscopy.
1.2.1 From Melts
Metallic melts can be foamed in one of three ways: by injecting gas into the liquid
metal from an external source, by causing in-situ gas formation in the liquid using
gas-releasing agents, or by causing the precipitation of gas which was previously
dissolved in the liquid.
The simplest method is to bubble air into the bottom of a vat of molten aluminium and
cool the bubbles that form at the top [3]. The metal needs fine ceramic particles in it
to make it viscous or the air would just escape at the top of the surface without
foaming bubbles. This can create closed-cell foams 1 m wide to 0.2 m thick slabs with
diameters between 5 and 20 mm. ALCAN in Canada supply foamed aluminium using
this process. The relative densities of the foam are between 0.03-0.1. The process is
shown in Figure 2.
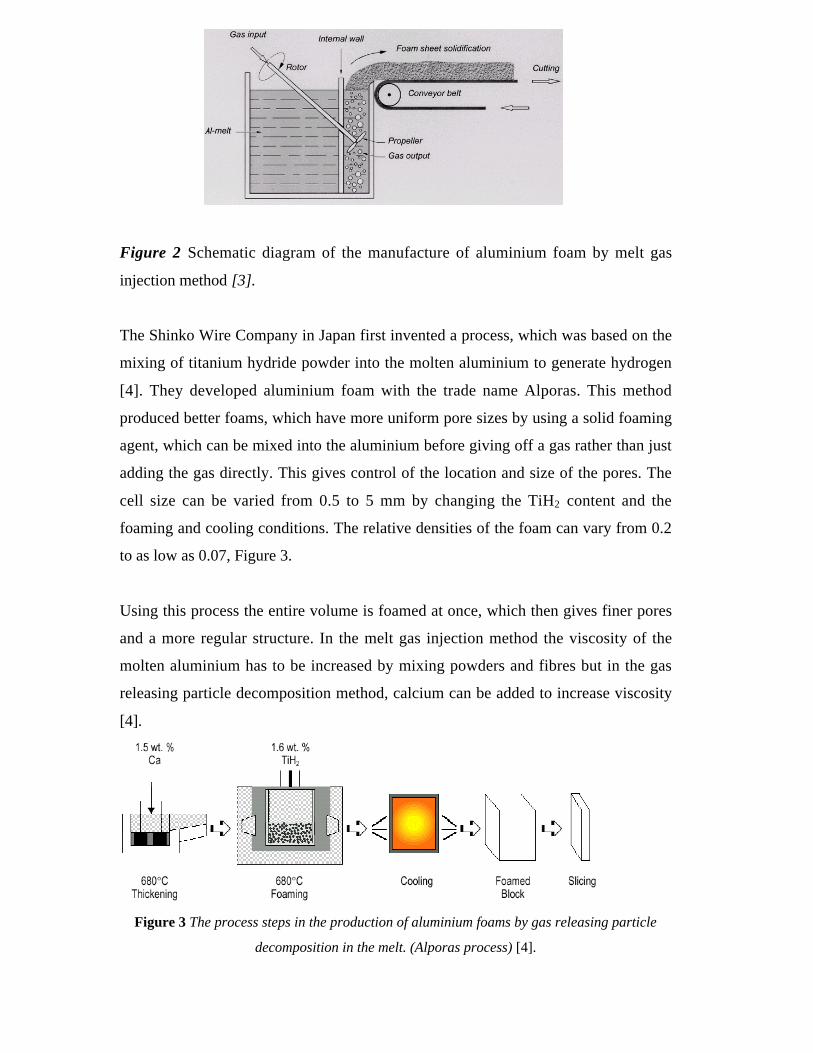
Figure 2 Schematic diagram of the manufacture of aluminium foam by melt gas
injection method [3].
The Shinko Wire Company in Japan first invented a process, which was based on the
mixing of titanium hydride powder into the molten aluminium to generate hydrogen
[4]. They developed aluminium foam with the trade name Alporas. This method
produced better foams, which have more uniform pore sizes by using a solid foaming
agent, which can be mixed into the aluminium before giving off a gas rather than just
adding the gas directly. This gives control of the location and size of the pores. The
cell size can be varied from 0.5 to 5 mm by changing the TiH2 content and the
foaming and cooling conditions. The relative densities of the foam can vary from 0.2
to as low as 0.07, Figure 3.
Using this process the entire volume is foamed at once, which then gives finer pores
and a more regular structure. In the melt gas injection method the viscosity of the
molten aluminium has to be increased by mixing powders and fibres but in the gas
releasing particle decomposition method, calcium can be added to increase viscosity
[4].
Figure 3 The process steps in the production of aluminium foams by gas releasing particle
decomposition in the melt. (Alporas process) [4].

An alternative way to form metallic melts is from a casting technique for foam open-
cell foams. It is thought that ERG manufactures DUOCELL in this way [5]. A wide
range of sizes of great uniformity can be obtained. This method is called infiltration,
where some sort of solid mould of pore shapes is made and then molten metal is
poured followed by removal of the mould. For example, an open cell polymer
template with the desired cell size and relative density is used. This is then coated
with a mould casting slurry (ceramic powder), which is then dried and embedded in
sand. The mould is then baked to harden the casting material and to decompose the
polymer template. Subsequently the mould is filled with a metal alloy and allowed to
cool. After cooling the mould materials are removed leaving the metal foam
equivalent to the original polymer foam, Figure 4. There are other mould materials,
which can be used, for example, plaster or plastics foam. This gives highly uniform
open cell foam structures, but the disadvantage is that the procedure is expensive and
complicated.
Figure 4 Investment casting method to manufacture open cell foams (DUOCEL
process)[5].

1.2.2 POWDERS
Metal foams can be made from the metal powders (Al and its alloys) and foaming
agents (TiH2,ZrH). The metal and foaming agents are blended and cold-compacted.
Compaction methods include uniaxial compression, extrusion or powder rolling. The
foaming agent is distributed uniformly in the metal matrix, Figure 5 [6].
Figure 5 The sequence of powder metallurgy steps to form foams by gas releasing
particles in semi-solids [6].
Extrusion can be used to produce a bar or plate and also helps to break the oxide films
at the surfaces of the metal powders, thereby facilitating consolidation. The product is
a precursor material not fully dense and after chopping into small pieces, is placed
inside a sealed split-mould. This can then get converted into foam by heating at a
temperature at which the alloy is partially liquid, with evolving gas converting the
assembly into foam. For example, titanium hydride when used as the foaming agent,
decomposes creating voids containing hydrogen at high pressure. These expand by
semi-solid flow and create foam that fills the mould. The relative densities achieved
from this process can be 0.08 and the shape depends on that of the mould. The foam
has a closed-cell structure with pore diameters in the range 1-5 mm. This process is
called baking, Figure 5 [6].

1.2.3 DEPOSITION
In this process, an open-cell polymer foam is used on to which metals are deposited
by chemical vapour deposition (CVD), by evaporation or by electro-deposition. For
example, nickel is deposited by the decomposition of nickel carbonyl Ni(CO4). The
polymer foam is placed in a CVD reactor where nickel carbonyl is introduced. This
decomposes into nickel and carbon dioxide when heated to 100°C and coats all the
heated surfaces of the polymer foam. After all the metal has been deposited on to the
polymer foam, the metal-coated polymer is removed from the CVD reactor and the
polymer burnt out by heating in the air, to leave a cellular structure with hollow
ligaments. A sintering step can be used to densify the ligaments. The pore size can be
varied over a wide range. It is possible to produce pore sizes of 100-300 µm diameter
range. The lowest densities available are 0.02-0.05 Figure 6 [7].
Figure 6 Schematic steps of CVD process used to create open-cell nickel foams [7].
1.3 APPLICATION OF METAL FOAMS
The process described can be used to create porous materials with a range of densities
and cell sizes. The structures formed can contain either open or closed-cells. Closed
cell foam structures are used mainly for energy absorption applications whilst the
open-cell foams are often used for thermal management.
No single property of metallic foam is particularly exceptional - individual material
properties of metal foams are available in numerous other materials. Metal foams in
general, and aluminium foam in particular, do however, possess a unique combination

of properties not shown by any other material - notably high strength, low density,
high melting point, good acoustic absorption, and the ability to absorb large amounts
of energy at a low stress when compressed in any compressed in any direction.
1.3.1 Structural
Foams basically combine relatively high stiffness with a lower density than their
parent material. It is important to note that, if only the strength is considered, foams
often have a similar or slightly worse performance than solid material of the same
weight. The advantage of foams becomes apparent when bending stresses are
considered as a function of weight. The mass distribution of cellular structures
increases the overall moment of inertia of the material, giving a far higher specific
bending stiffness and strength than for the corresponding weight of bulk metal. This
makes foams useful as high-strength, low-density load-bearing components in
automotive and aerospace applications. This could be in the form of direct load-
bearing components, but most use are in bonded composites, where foam is used as a
central element encased in an outer metal sheet. Compared with conventional
honeycomb materials, these are easier to mass-produce, and have increased resistance
to shear due to the isotropic nature of foams [8].
Some of the production methods allow the filling of irregular moulds or shapes with
foam - for example to make complex shapes, or to fill beams or pipe structures with
foam, to provide increased rigidity without significantly increasing the weight.
Compared with solid metal components, structures produced using foam cores have
been shown to be significantly lighter, while offering notably increased structural
rigidity [8].

Figure 7 Metal foam of high stiffness and low-density ideal for sandwich construction
[9].
1.3.2 Heat Exchangers
The corrosion resistance, combined with large surface area and a cell wall material
with high thermal conductivity, makes open cell foams ideal for use as heat
exchanging materials. Closed cells have a much lower thermal conductivity, which
makes them good for thermal shielding [10].
1.3.3 Impact
Another category of applications centres on the energy-absorbing properties of metal
foams. When compressed, foams show only a small elastic deformation before the
start of plastic collapse. In most foams, this collapse involves extensive plastic
deformation of the cell walls in a localised band of failed cells, which gradually
propagates throughout the material at a low (and almost constant) stress. Dislocation
movement in the metal means that a large amount of energy can be absorbed without
the stress exceeding a critical value. Because of the isotropic structure of the foam,
uniform deformation and energy absorption is possible for any direction of
compression. This opens up applications such as a light, cheap, shock-absorbing
material in the front body of cars or trains, to protect the occupants in the event of a
collision. Figure 8 shows a good compact absorber for automobile bumpers [11].

Metal foams are thus attractive in terms of the amount of plastic deformation they can
undergo per unit mass, since the cell walls are relatively unconstrained. In practice,
premature structural failure may prevent this potential from being realised. Foams,
which exhibit sufficiently ductile local collapse, can be used as energy absorbing
blocks to protect the occupants of cars during impact, as a blast protection material, or
as temperature-resistant packaging for materials [11].
Figure 8 Good impact absorbers good for automobile bumpers [9].
1.3.4 Corrosion-resistant and high-temperature filters
Aluminium has good resistance to oxidation and many forms of chemical attack.
Open-cell foams with small pore sizes can thus be used as high-temperature or
chemically resistant filter materials. Liquid fuel containers could be part-filled with
open-cell foams, so that in the event of breakage, flammable materials would at worst
seep out gradually and burn on the surface of a block, rather than spilling over a large
area before catching fire.
Metal foams are excellent in arresting flames in environments like long pipes and
ventilating enclosures. They are both fire proof and highly permeable. They can also
be used in blast protection applications [12].
1.3.5 Acoustic Applications
The frequency of resonance depends on the ratio of elastic modulus to density as these
can be varied independently, foams can be used to eliminate certain frequencies. The
damping capacity of foamed aluminium has been shown to be an order of magnitude
higher than that of the bulk metal. Foams have also been used as sound proofing

materials. Within porous structures, sound is attenuated by vibration and friction
losses as gas flows between cells during propagation repeated reflections within the
cell structure gives rise to long paths were full absorption is possible. The acoustic
properties of the metal foams can be used where sound absorption is vital i.e. sides of
roads to reduce traffic noise [13].
2. THERMAL CONDUCTIVITY
Thermal conductivity can be considered using a bar with one end of the bar at
temperature T1 and the other end at a lower constant temperature T2. Heat is

conducted from the hotter to the colder end at a steady rate as the sides are completely
insulated. The heat energy passing through any position is the same within the bar
[14], Figure 9.
T1 heat flow T2
L
Figure 9 Heat flow along a uniform insulated bar [14]
The temperature gradient at any position can be defined as the change of temperature
per unit distance along the bar:
T1 –T2/L (2)
The heat flow along an insulated bar depends on (1) the temperature gradient of the
bar, (2) the area of cross section of the bar, (3) material of the bar.
As heat flow is proportional to the temperature gradient and the area of cross section,
the equation for heat flow in terms of a constant proportionality K is called thermal
conductivity of the material, is [14]
Q =K A (T1 –T2)/L (2.1)
where Q is the heat flux (the amount of heat flowing per unit time)
The thermal conductivity K can also be defined as: The heat flux Q (the amount of
heat flowing across a unit area per unit time), induced by the temperature gradient
dT/dx. For one-dimensional heat flow it is defined as:
Q/A = K dT /dx (2.2)
The units of thermal conductivity are J m-1 s-1 K-1. As J s-1 = Watt (W) so the units can
also be W m-1 K-1 [14].
2.1 THERMAL RESISTANCE
The equation for K is similar to I=V/R in electrical conduction where I is the current,
R is the resistance and V is the voltage. Heat flow requires a temperature difference
whereas electric current requires a potentional difference. To calculate heat flow we

use Q =KA (T1 –T2)/L. Q and I are both flow quantities produced by (T1 –T2) and V
respectively. So the quantity KA/L is the thermal equivalent of 1/R. The thermal
resistance of a conductor can be defined by [15]:
RTH = L/KA (2.3)
where L conductor length, A = Area of cross-section, K= thermal conductivity.
2.1.1 Thermal Conductors In Series
A series circuit is one in which resistors are arranged in a chain, so the current has
only one path to take. The current is the same through each resistor. The total
resistance of the circuit is found by simply adding up the resistance values of the
individual resistors by, [15] Figure 10
Equivalent resistance of resistors in series: R = R1 + R2 + R3 (2.4)
Figure 10 Equivalent resistances of resistors in series R1 + R2 + R3, currents I and
voltage V [15].
When two or more materials are in series contact so heat energy passes through one
and then through the next. The energy flux passing through them is the same. Using
thermal resistances we can treat thermal conductors in series just as we treat electrical
conductors in series. This is the thermal resistance series law, which can be used to
determine the effective thermal conductivity in porous materials. (see appendix 2.3.1
for the derivation of thermal conductors in series ).
2.1.2 Thermal conductors in parallel
A parallel circuit is a circuit in which the resistors are arranged with their heads
connected together, and their tails connected together. The current in a parallel circuit

breaks up, with some flowing along each parallel branch and re-combines when the
branches meet again. The voltage across each resistor in parallel is the same [15].
The total resistance of a set of resistors in parallel is found by adding up the
reciprocals of the resistance values, and then taking the reciprocal of the total, [15]
Figure 11.
Equivalent resistance of resistors in parallel: 1/R = 1/R1 + 1/R2 + 1/R3 (2.5)
Figure 11 Equivalent resistances of resistors in parallel R1 + R2 + R3, currents I1 + I2
+ I 3 and voltage V [15].
When two or more materials, are in contact so that, they are parallel to each other.
The temperature gradient is identical for all paths of heat flow. Thermal conductors in
parallel can be treated just as we treat electrical conductors in parallel (see appendix
(2.3.2) for the derivation of thermal conductors in parallel).
2.2 Thermal conductivity in Foams
The thermal conductivity of foam can be considered as having four contributions (1)
conduction through the solid (2) conduction through gas (3) convection within the
cells (4) radiation through the cell walls and across the cell voids. Each contribution
is explained in detail below.
2.2.1 Conduction in solid phases
Conduction is the flow of heat through a body in response to a temperature gradient.
In a porous material, heat transported by this mechanism is reduced due to the
introduction of thermal resistances. Where the cross sectional area of the solid is
reduced the heat flow will encounter resistance. Thus the heat transported by

conduction in the solid maybe reduced by decreasing the volume fraction of the solid
present. Further reductions can be possible if the cells have tortuous shapes [16].
2.2.2 Conduction in gas phase
Heat transfer in stagnant (non-convecting) gas is usually very slow. However, in low-
density thermal insulation materials, where other heat transport mechanisms are
suppressed it can be a significant factor.
Many high performance insulation materials are evacuated, and others use the low
conductivity of gases to fill pores; although these methods reduce heat flow they are
only worthwhile at low temperatures where radiation does not play a significant part
[16].
2.2.3 Convection
Convection occurs because of hot fluid rising to displace cold fluid. Convection is
produced when any fluid is heated because hot fluid has a lower density than cold
fluid, due to thermal expansion. So hot fluid is pushed upwards by the surrounding
cold fluid causing convection currents. There are two types of convection currents,
which can occur, free and forced convection.
In free-convection, this motion is commonly caused by local density differences
(which could rise from temperature differences) resulting in buoyancy forces due to
gravity. Forced convection is possible where an external agent induces the motion of
the gas [17]. This occurs in metallic foams used as heat exchanger but not in
insulating foam. Skochdopole [18] determined the effect of free convection in
polymer foams by experimental investigations that measured heat transport through
the foam as a function of cell size, initially with foam heated on the upper surface and
then on the underside. The measured conductivity of top and bottom heating was
found to converge for cells below 4 m m diameter, so convection was negligible in
foams with size cells below 4 m m [18].
2.2.4 Radiation

Heat is also transferred by of electromagnetic radiation. Stefan’s Law describes the
heat flux passing by radiation from one surface to one at lower temperature with
vacuum in between them, [19].
Q = σsb T4 (2.6)
Where σsb is Stefan’s constant and T is the temperature difference.
2.2.5 Combination of mechanisms
The overall conduction can be determined by combining the thermal transport
mechanisms by simple addition,
K* = Ks + Kg + Kc + Kr (2.7)
where Ks is the contribution of thermal conductivity from conduction through the
solid, Kg is that from the gas, Kc is the thermal conductivity due to convective
processes and Kr is the contribution from radiation [20].
The total thermal conductivity changes with density. For closed-cell foams at
minimum relative density of 0.03 and 0.07 the conductivity is little larger than air
contained in the cells. The way to reduce it further is by replacing air with a gas of
lower thermal conductivity such as trichlorofluoromethane CCl3F. The heats transfer
through the cells happens with half through the gas and half through the solid and
radiation [20].
Heat transfer increases with cell size. This is because radiation is reflected less often
in foam with large cells and partly because for cells more than 10 mm or so in
diameter then cell starts to convect [20].
Other factors like the fraction of open cells, affect heat transfer too but to a lesser
extent. Temperature is another factor, which can affect thermal conductivity. Thermal
conductivity through solids and gases decrease, as the temperature decreases.

Radiation also becomes less effective at low temperatures. Thus the heat transfer in
foams decreases steeply with decreasing temperature [20].
2.3 PREVIOUS MODELS OF THERMAL CONDUCTIVITY
2.3.1 Calmidi and Mahajan Model
Calmidi and Mahajan investigated the effective thermal conductivity Ke of high
porosity fibrous metal foams experimentally and derived an empirical correlation
[21].
The experiment used an open cell structure with dodecahedron like cells, which had
12- 14 pentagonal or hexagonal faces. The edges of the cells were composed of fibers.
The matrix was aluminum alloy T-6201, which had a thermal conductivity of
2 1 8 W m 1 K - 1 . The metal foam was brazed with two aluminum plates. Thermocouples
were attached at different distances. The surfaces were insulated by using Styrofoam.
The bottom was cooled using a tank with cool flowing water. The direction of heat
flow was from the top to the bottom and all the sides were insulated so the heat
flowed in one direction [21].
If Q was the net heat flux through the top,
Q = Ke Am∆T/Lm (2.8)
where Ke is the effective thermal conductivity, Am was the area of cross section of the
foam and Lm was the height of the foam. The experiments involved using air and
water as the fluid phases. There were a few sources of error in the measurements of
the thermal conductivity mainly due to the heat loss in thermocouples and the
insulating Styrofoam [21].
Based on the experimental data, an empirical correlation was developed, [21].
Ke / Kf = Ks (1-ε) nA / Kf + ε (2.9)
where ε is the porosity and Ks and Kf are the thermal conductivities of the solids and
fluid respectively. The best fit was when n = 0.793 with the value of A being 0.181

for air and 0.195 for water. The maximum errors were found to be 6.9 and 7.5 percent
respectively.
In order to develop a theory, Calamidi and Mahajan assumed two-dimensional foam
consisting of an array of hexagons, Figure 12 [21]. The hexagons were intended to
represent the metal ‘shell’ of the foam and the nodes within the hexagonal network
were represented as squares. In this honeycomb shape, the thickness and length of the
ligaments joining the nodes and the length of the edge of the square node was
adjustable. As the structure was periodic, a unit cell could be defined on which the
analysis could be focused. Heat flow was assumed to be one direction-dimensional.
Uni t cell
Figure 12 The hexagonal structure of the metal foam matrix [21].
To achieve effective thermal conductivity Ke they needed to:
(1) Identify the unit cell in the structure, the repetition of which generates within the
whole foam.
(2) Divide each unit cell into convenient layers 1, 2 and 3, Figure 13.

Figure 13 Unit cell representation of the hexagonal structure [21].
(3) Needed to calculate the thermal conductivity of each layer 1, 2 and 3 in the unit
cell, using the parallel law of thermal resistance which correspond to KL1, KL2 and
KL3. (see appendix 2.3.1 for derivation for thermal conductors in parallel), giving:
KL1 = K1V1+ K2V2 (2.10)
where K1 and K2 were thermal conductivities and V1 and V2 were the volume
fraction of materials 1 and 2 (i.e. solid and fluid) respectively.
(4) Needed to sum the conductivities in each of the layers using series law of thermal
resistance, (see appendix 2.3.2 for derivation for thermal conductors in series)
giving :
Ke = (L1+ L2) / L1/ KL1+ L2/ KL2 (2.11) where L1 and L2 are the lengths of materials 1 and 2 (i.e. solid and fluid).
2.3.2 Tetrakiadechedron Model
The Calamidi and Mahajan model of calculating the effective thermal conductivity is
simple but very powerful and has been shown to give good results. To make the
method more sophisticated Boomsma and Poulikakos determined the thermal
conductivity in a three-dimensional foam structure assuming a tetrakiadechedron
shape, Figure 14.

Figure 14 The tetrakaidecahedron modelled by cubical nodes and cylindrical
ligaments with the unit cell as a solid block [22].
This model consisted of cubical nodes and cylindrical ligaments. The labelled cubical
nodes (1-4) in Figure 14 are represented in Figure 15. The length of each cubical
node was r while the length L defined the cylindrical ligament of radius a, Figure 15.
L
2L
LA
LD=r/2
= a
1
2 3
4
Figure 15 (a)The components of the foam network of the tetrakaidecahedron
represented geometrically by cubical nodes and cylindrical ligaments(b)This shows
the unit cell of the tetratkaidecahedron [22].
The unit cell given in Figure 15 was divided into convenient layers LA, LB, LC and
LD of lengths a, r/2 –a, 0.707L –r and r/2 respectively. From the lengths of LA, LB,
LC and LD the total volume of each section VA, VB, VC and VD was calculated by
multiplying with the unit cells area (2L2) giving

VA = 2aL2 VC = 2(1/2L√2 – r) L2
VB = (r - 2a) L2 VD = r L2
Then the volume occupied by the solid for each layer was to calculated giving
VAS = ar2 VBS= r 3/2 - ar2
VCS= L√2/2πa2 - rπa2 VDS= r 3/4
From the volume fractions of each section, the effective thermal conductivity could be
calculated for each layer using the parallel law of thermal conductors giving [15]
KA = (K1 VAS+ K2 (VA- VAS))/VA (2.12)
where K1 and K2 are the thermal conductivities for two different materials in this case
its Aluminium (K1= 2 1 8 W m - 1 K - 1 ) used as the solid and air is used as the fluid
(K2= 0 . 0 2 6 5 W m - 1 K - 1 ) .
The total thermal conductivity for the representative section can be calculated from
the law of thermal conductors in series, giving [15]
Keff= LA+LB+LC+LD/(LA/KA+LB/KB+LC/KC+LD/KD) (2.13)

3. MODEL DEVELOPMENTS FOR THERMAL CONDUCTIVITY
The tetrakaidecahedron model was not a very good model as it could only calculate
the thermal conductivity for high porosity media (porosities greater than 0.9), and it
had no facility for the pore size dependency. There was also a geometrical limit to the
lengths of the ligaments at r =0.35 after which the results become invalid. Apart from
this it had a complicated structure.
3.1 The Cube Models
Due to the downfalls of the tetrakiadecahedron model, it was decided to create a new
model assuming a cuboidal pore in a cube. The method used was similar to the
tetrakaidecahedron model but with a cube was instead of the tetrakaidecahedron,
Figure 16.
1
1
1
RR
R
LA
LB
LC
Figure 16 The cube model containing a smaller cube representing a pore size with
edge R.
Initially a large cube was used with dimensions 1x 1x1 metre as shown in Figure 16.
The large cube of unit dimensions contained a smaller cube of length R to represent
the pore. The large cube was then defined in three layers A, B and C of heights as LA,
LB and LC respectively. It is easy to show that LA, LB and LC are 1-R/2, R and 1-R/2
respectively. The volume of each section was VA, VB and VC was given by 1-R/2, R
and 1-R/2 respectively. The corresponding volume fractions, VAS, VBS, and VCS were
therefore 1-R/2, R – R3 and 1-R/2 respectively.
Similar to previous models, the thermal conductivity (KA, KB , KC ) of each layer (A,
B and C) respectively could be calculated using the law of parallel thermal conductors

KA = (K1 VAS+ K2 (VA- VAS))/VA (3.1)
where K1 and K2 are the thermal conductivities for two different materials in this case
was Aluminuim (K1= 2 1 8 W m - 1 K - 1 ) used as the solid and air is used as the fluid
(K2= 0 . 0 2 6 5 W m - 1 K - 1 ) [ 2 1 ] .
The effective thermal conductivity was obtained from the law of series thermal
conductors [21]
Keff= LA+LB+LC/(LA/KA+LB/KB+LC/KC) (3.2)
In order to determine whether the pore size has an effect on thermal conductivity, the
single cuboidal pore was replaced with two smaller cubes with the same total volume
as the single cube. Each of the smaller cubes had an edge length 0.7937R where R is
the edge length of the single cube pore, (0.7937 is derived by dividing the volume of
the larger cube R by 2 as there were two equivalent volumes of smaller cubes and
then calculating the edge length).
1
1
1
LA
LB
LC0.793 7R0.793 7R
Figure 17 The cube model containing two smaller cubes representing pore sizes with
edge 0.7937R
2.3.2 The Sphere Model
An alternative approach was using a sphere in a cube model. This was to determine if
the shape of pore has any effect on thermal conductivity, and also wanted to
determine what effect gas pressure would have on thermal conductivity. The

calculations were similar to those described above using the volume of a sphere (4/3
πR3), Figure 14. The cube was then defined in three sections A, B and C. The height
of each section was calculated, as section LA=1-2R/2, LB=2R and LC=1-2R/2. The
volume of each section was therefore VA= 1-2R/2, VB =2R and VC=1-2R/2 and the
corresponding volume fractions of solid are 1-2R/2, 2R–4/3 πR3 and 1-2R/2
respectively.
Similar to previous models, the thermal conductivity of each layer (KA, KB, KC) was
calculated using the law of thermal conductors in parallel giving (see appendix 2.3.1
for derivation)
KA = (K1 VAS+ K2 (VA- VAS))/VA (3.1)
where K1 and K2 are the thermal conductivities for two different materials in this case
its Aluminuim (K1= 2 1 8 W m - 1 K - 1 ) used as the solid and air is used as the fluid
(K2= 0 . 0 2 6 5 W m - 1 K - 1 ) .
The effective thermal conductivity (Keff) was obtained from the law of thermal
conductor in series (see appendix 2.3.1 for derivation)
Keff= LA+LB+LC/(LA/KA+LB/KB+LC/KC) (3.2)
1
1
1
LA
LB
LC
2R
Figure 18 The sphere model of a unit cube sphere of diameter 2R inside.

4. RESULTS AND DISCUSSION.
FORTRAN programs were written for the thermal conductivity of the
tetrakaidecahedron, cube models and sphere models (see appendix for details of the
FORTRAN programs tetramodel.f, cube1.f, cube2.f, sphere1.f and sphere2.f).
The tetrakaidecahedron model was not a very good model as it could only calculate
the thermal conductivity for high porosity media (porosities greater than 0.9), and it
had no facility for the pore size dependency. Apart from this it also has a complicated
structure. There was a geometrical limit to the length of the ligaments at r>0.35 after
which the results became invalid.
Due to the downfalls of the tetrakiadecahedron model, a simple 3-dimensional cube
model was developed and the thermal conductivity was calculated. The theory behind
the model was similar to the tetrakaidecahedron model but with a cube as the unit cell.
By varying the edge length R of the cuboidal pore, the thermal conductivity could be
measured for all values of porosity. The values of thermal conductivity thus obtained
were plotted as a function of porosity. Similarly for the cube with two smaller cubes
(cube 2) the values of thermal conductivity obtained were plotted as a function of
porosity, Figure 19.
Figure 19 Thermal conductivity of the cube 1 and cube 2 where cube 1 is the
cube model with one small cube and cube 2 is the cube with two smaller cubes
as a function of porosity
The two plots didn’t show any important differences indicating that the effect of pore
size at low porositieshas no significant effect on thermal conductivity but for cube 2

there was a limit when R = 0.8 (porosity = 0.61) at which both the pores start to
overlap and a invalid value is obtained, Figure 19.
However, when the tetrakiadecahedron model and cube models were compared, it
was found that the tetrakiadecaherdron model offers no advantage over the simple
cube model, Figure 20. Therefore, the cube models could be used instead of the
tetrakiadecahedron model and the thermal conductivity could be calculated for all
porosities.
Figure 20 Comparison of the thermal conductivity of the tetrakiadecahedron and cube model
as a function of porosity
From the sphere model it was intended to determine how shape could affect thermal
conductivity. The sphere model showed, it also had a limit for which the thermal
conductivity could be calculated and that was when R = 0.5, otherwise the values
become invalid because then the sphere then exceeds the bounds of the cube.
The effect of pore size dependency was also considered using two small spheres of
radius R (sphere 2) and the thermal conductivity was measured. It showed that when
R > 0.43 the spheres start to overlap.

Figure 21 Thermal conductivity of the sphere 1 and sphere 2 where sphere 1
is the sphere model with one small sphere and sphere 2 is the sphere with two
smaller spheres as a function of porosity
The cube and sphere models were also compared and showed that the effect of shape
does not have much effect on the thermal conductivity. The limits for the sphere cube
are much less as compared to the cube model. So cube model is the best option to
measure thermal conductivity.
Figure 22 Comparison of the thermal conductivity of the sphere 1 and cube 1 model
as a function of porosity

Now from the sphere model we could also determine what effect gas would have
when put in the spheres.
Initially, this can be determined by focusing on the influence of the effect of pressure
with pore size. The pressure of the sphere depends on the pressure (P) inside the
sphere and the pressure outside the sphere, which is the surface energy (γ) and can be
given by
πR2P = 2πRγ (4.1)
P = 2γ/R (4.2)
where R is the radius of the sphere. The above equation shows that pressure is
inversely proportional to the pore size. Thus, the smaller the sphere the higher the
pressure.
From [23] it showed that thermal conductivity was independent of pressure. The
thermal conductivity of a perfect gas is given
K = 1/3 λcCV,m[A] (4.3)
where CV, m is the molar heat capacity at constant volume, the molar concentration
[A] and λ is the mean free path.
Because each molecule carries an average energy because λ is inversely proportional
to the pressure and hence inversely proportional to the molar concentration of the gas,
it shows that thermal conductivity is independent of pressure. The physical reason for
this independence is that thermal conductivity can be expected to be large when many
molecules are allowed to transport the energy but the presence of so many molecules
limits their mean free path. So the energy cannot carry the energy over a great
distance, and thus the effects balance [23]. Therefore, this effect confirms that sphere
pore size has no effect on thermal conductivity.