
THERMAL COMFORT IN A ROOM HEATED BY DIFFERENT METHODS et al 1980... · No. 2556 THERMAL COMFORT IN...
15
No. 2556 THERMAL COMFORT IN A ROOM HEATED BY DIFFERENT METHODS DR. B.W. OLESEN Associate Member ASHRAf INTRODUCTION E. MORTENSEN J. THORSHAUGE B. BERG·MUNCH The present paper deals with an experimental study of thermal comfort in a room heated by different methods. These experiments were part of a large research project dealing with the comparison of thermal comfort and energy consumption in a room heated by different methods. The comparison of energy consumption and the experiments with human subjects have been reported elsewhere (21,22). A similar study was recently finished at Institut de Thermodynamique, Universite de Liege (6,9,10). The prediction of thermal comfort inside a room is often difficult because it is not possible to estimate accurately the distribution of air temperature and air velocity. This distribution will be influenced by the choice of heating method. The number of outside walls, the sizes of windows, the amount of insula- tion, the dimensions of the room, the air infiltration and the outside tempera- ture will also influence the temperature and air-velocity distribution in heated rooms. When the influence of the heating method is being investigated·, it is important to control all these factors and keep them at the same level through- out the comparison. The present experiments were performed as laboratory tests under well de- fined conditions. A new test room was built in the laboratory simulating a space in a dwelling or a small office. This test room was equipped with facilities to simulate a steady-state temperature down to -5°C outside on one wall. This wall (the frontage) included a window, and air infiltration was simulated around the window. The internal walls, floor and ceiling were highly insulated. Installa- tions were made making it possible to heat this room by nine different heating methods comprising radiators, warm air, floor heating, and ceiling heating. A comfort meter (11), which measures the combined effect of the thermal parameters, was used as a reference, Simulating a seated subject near the fron- tage. For each heating system, the heat input was adjusted so that this comfort meter showed a value predicting thermal neutrality. During steady-state condi- tions, air temperature, air velocities and surface temperatures were measured at several points to describe the thermal climate in the occupied zone. THERMAL COMFORT Thermal comfort is here defined as that condition of mind which expresses satis- faction with the thermal A first requirement for thermal comfort is that a person feels thermally neutral for the body as a whole, i.e., that he does not know whether he would prefer a higher or lower ambient temperature level. Man's thermal neutrality depends on his clothing and activity, as well as the following environmental factors: B.W. Olesen; E. Mortensen, J. Thorshauge, B. Berg-Munch, Laboratory of Heating & Air Conditioning, Technical University of Denmark. 34 ©ASHRAE. All rights reserved. Courtesy copy for SSPC 55 Committee to exclusively use for standards development. May not be distributed, reproduced nor placed on the internet.
Transcript of THERMAL COMFORT IN A ROOM HEATED BY DIFFERENT METHODS et al 1980... · No. 2556 THERMAL COMFORT IN...

No. 2556
THERMAL COMFORT IN A ROOM HEATED BY
DIFFERENT METHODS
DR. B.W. OLESEN Associate Member ASHRAf
INTRODUCTION
E. MORTENSEN J. THORSHAUGE B. BERG·MUNCH
The present paper deals with an experimental study of thermal comfort in a room heated by different methods. These experiments were part of a large research project dealing with the comparison of thermal comfort and energy consumption in a room heated by different methods. The comparison of energy consumption and the experiments with human subjects have been reported elsewhere (21,22). A similar study was recently finished at Institut de Thermodynamique, Universite de Liege (6,9,10).
The prediction of thermal comfort inside a room is often difficult because it is not possible to estimate accurately the distribution of air temperature and air velocity. This distribution will be influenced by the choice of heating method. The number of outside walls, the sizes of windows, the amount of insulation, the dimensions of the room, the air infiltration and the outside temperature will also influence the temperature and air-velocity distribution in heated rooms. When the influence of the heating method is being investigated·, it is important to control all these factors and keep them at the same level throughout the comparison.
The present experiments were performed as laboratory tests under well defined conditions. A new test room was built in the laboratory simulating a space in a dwelling or a small office. This test room was equipped with facilities to simulate a steady-state temperature down to -5°C outside on one wall. This wall (the frontage) included a window, and air infiltration was simulated around the window. The internal walls, floor and ceiling were highly insulated. Installations were made making it possible to heat this room by nine different heating methods comprising radiators, warm air, floor heating, and ceiling heating.
A comfort meter (11), which measures the combined effect of the thermal parameters, was used as a reference, Simulating a seated subject near the frontage. For each heating system, the heat input was adjusted so that this comfort meter showed a value predicting thermal neutrality. During steady-state conditions, air temperature, air velocities and surface temperatures were measured at several points to describe the thermal climate in the occupied zone.
THERMAL COMFORT
Thermal comfort is here defined as that condition of mind which expresses satisfaction with the thermal enviror~ent. A first requirement for thermal comfort is that a person feels thermally neutral for the body as a whole, i.e., that he does not know whether he would prefer a higher or lower ambient temperature level. Man's thermal neutrality depends on his clothing and activity, as well as the following environmental factors:
B.W. Olesen; E. Mortensen, J. Thorshauge, B. Berg-Munch, Laboratory of Heating & Air Conditioning, Technical University of Denmark.
34
©ASHRAE. All rights reserved. Courtesy copy for SSPC 55 Committee to exclusively use for standards development. May not be distributed, reproduced nor placed on the internet.

1) Mean air temperature around the human body; 2) Mean radiant temperature in relation to the body; 3) Mean air velocity around the human body; 4) Water vapor pressure in the ambient air.
All combinations of these parameters which will provide thermal neutrality can be predicted from Fanger's comfort equation and the corresponding diagrams (4).
The deviation from thermal neutrality may be described by the PMV-index (Eredicted Mean yote) where PMV = 0 corresponds to neutrality, or by the PPDindex (Eredicted Eercentage of Qissatisfied) which estimates the percentage of people being dissatisfied in a given thermal environment. But thermal neutrality as predicted by the comfort equation is not the only condition for thermal comfort. A person may feel thermally neutral for the body as a whole, but he might not be comfortable if one part of the body were warm and another cold. It is therefore a further requirement for thermal comfort that no local warm or cold discomfort exist at any part of the human body. Such local discomfort may be caused by:
1) An asymmetric radiant field; 2) Local convective cooling (draft); 3) Vertical air temperature difference; 4) Contact with a warm or cold floor.
Several studies on local discomfort are reported in the literature (2,3,4,5,7, 13-20,24,25).
EXPERIMENTAL FACILITIES
This section describes the experimental facilities comprising the test room, the heating systems, and the measuring equipment.
Test Room
The test room (Fig. 1) is a full scale mQdel of a small office or study room with one outside wall (4.8 x 2.4 x 2.7 mj
). The room was placed inside an air-conditioned lab with close control of air temperature. The room was built according to the insulation standards in Denmark (1). The floor, ceiling and internal walls (e2cept the frontage) of the test room were highly insulated (Ufl 0 'V 0.20 W/m K , U 11'V U . . 'V 0.2.5 W/m2K). The outside temperature was simu~ated on this front¥[~e by ge~~~E-~al designed cooling box. The frontage included a double-glazed window (Fig. 1) with approx. 12 mm air space. The heat transmission coefficient from the internal window surface to the outside (cooling box) was measured in a pre-test to be 3.8 W/m2K. This value includes the insulation of the window frame. The rest of the frontage was well insulated (U 'V 0.35 W/m2K).
Air infiltration was simulated around the window (Fig. 1). A separate drying/cooling system conditioned the air used for infiltration. The air was by a fan induced through small outlets (diam. 0.4 cm) in a tube around the periphery of the window (Fig. 1). The distance between the outlets was 15 cm and the air was induced perpendicular to the window. As the infiltration air entering through cracks and openings in practice normally will be slightly heated (by heat transfer from walls etc.) before it enters the room, the temperature of the simulated infiltration air was conditioned to a higher temperature than the outside temperature. The exhaust opening was placed in the opposite wall above the door (Fig. 1).
Heating Systems
The following 9 heating systems were used (Fig. 1): Radiator 1.1, single panel radiator beneath the window covering most of the lower wall (L x H = 2.00 x 0.55 m2 ). Supply water temperature 37-48°C. Convector 1.2, three panel convectors beneath the window (L x H = 1.20 x 0.20 m2). Supply water temperature 39-530 C. Radiator 1.3, single panel radiator at the back wall (L x H = 1.20 x 0.55 m2 ). Supply water 46-63°C. Ceiling 2.1, aluminium plates with water-filled coils, supply along the frontage and return at the back w~ll. Supply water temperature 34-42oC.
35
©ASHRAE. All rights reserved. Courtesy copy for SSPC 55 Committee to exclusively use for standards development. May not be distributed, reproduced nor placed on the internet.

Floor 3.1, heated by an electrical heating foil covered by a 2 rnm thick aluminium plate. The heating effect was uniformly distributed over the entire floor. Floor 3.2, as above but the effect on a 0.6 m strip along the frontage was higher. This 0.6 m was kept at a surface temperature around 290 C. Warm air 4.1, outlet in the back wall near the ceiling, 4 air changes/h and outlet velocity 1.2 m/s (1 x H = 0.80 x 0.55 m2 ). Outlet air temperature 34-43 0 C. Warm air 4.2, two outlets in the floor beneath
2the window, 4 air changes/h and
outlet velocity 1.2 m/s (1 x H = 0.40 x 0.05 m ). Outlet air temperature 34-430 C. Skirting board 5.1, small electrical heated panels (W x H = 0.02 x 0.20 m2 ) along the periphery of the room. The effect was highest along the frontage.
Measuring Equipment
To assess the thermal environment in the test room it is necessary to know the distribution of air temperature, radiant temperature and air velocity. The humidity is of minor importance and was approx. the same in all tests.
Air temperatures were measured at five levels, 0.1, 0.6, 1.2, 1.8 and 2.6 m above the floor. The sensors (thermistors) were placed on a light movable column. The movement of the column was controlled from the outside. Fig. 2 shows the measuring points. Point 20 to 24 were used only when a radiator was placed at the back wall (radiator 1.3).
Air velocity was measured at four levels, 0.1, 1.2, 1.8 and 2.6 m above the floor. The sensors were 4 omnidirectional thin-film probes (23,24) also placed on the movable column.
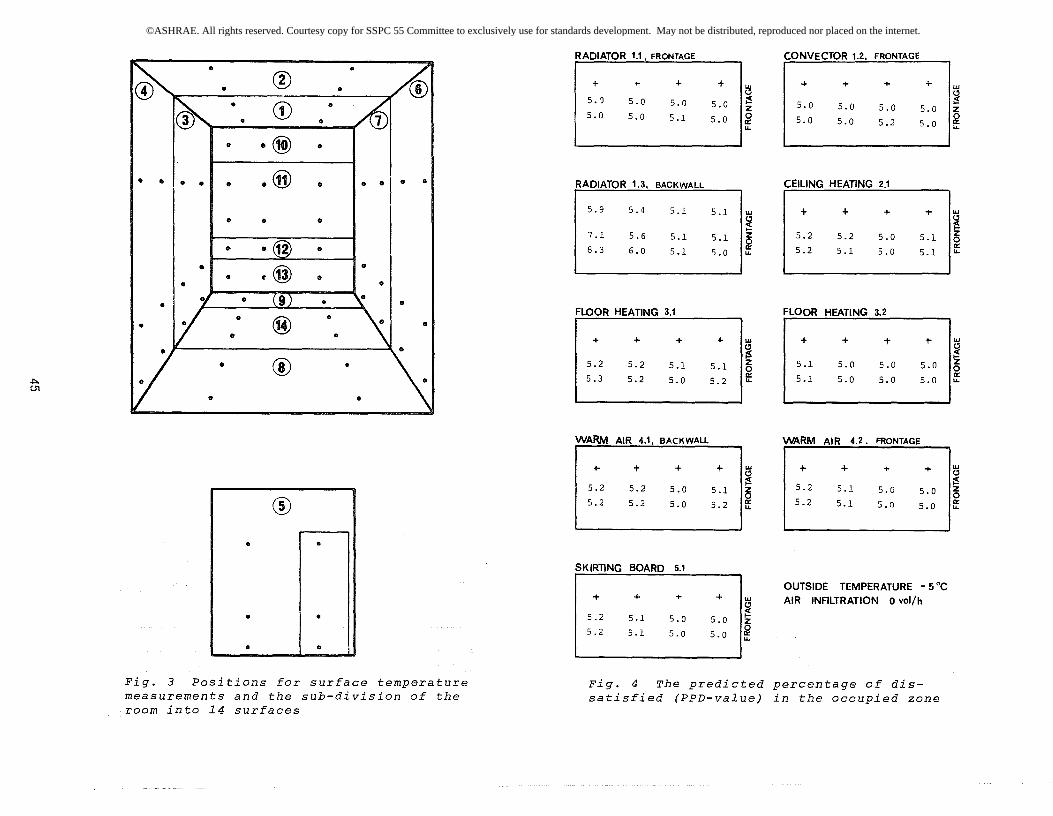
The surface temperature was measured (thermistors) at 63 points (Fig. 3) and also at the surface of the heating appliances. To calculate the mean radiant temperature the walls, floor and ceiling were split up into 14 surfaces (Fig. 3). The mean temperature of each surface was calculated by weighting the single surface temperature measurement according to the area.
A comfort meter (11), placed 0.6 m above the floor, 1.0 m from the frontage at position 27 (Fig. 2), was used as "thermostat", simulating a sitting person. The comfort meter has a heated ellipsoid-shaped sensor which simulates the human body. The estimated clothing (clo), and activity of the occupants, as well as the humidity are set on the instrument. The sensor then integrates the thermal effect of the air temperature, mean radiant temperature, and air velocity in approx. the same way as the human body does; the electronic instrument calculates the PMV- and PPD-values and shows it directly on a meter. In the present experiments the clo-value was set to 1.0 clo and the activity to 1.2 met (70 W/m2) , simulating a person in normal indoor winter clothing occupied with light sedentary work. The water vapor pressure in the room, which is of minor influence, was set to 1 kPa (10 mbar). Fanger's comfort equation predicts an optimal operative temperature equal to 220 C if the relative air velocity is < 0.10 mise
METHOD
Experimental Conditions
Four tests were made with each heating method. At an "outside" temperature of -5°C, three levels of air infiltration (0, 0.4 and 0.8 air-changes/h) were studied. At an "outside" temperature of +4°c, only one infiltration rate (0.4 air-changes/h) was studied. During all tests the temperature in the air-conditioned space around the test room was kept at 22±loC.
Experimental Procedure
The heat input from the heating system was adjusted until the comfort meter showed a PMV-value equal to O. When steady-state conditions had been established for at least 2 hr all surface temperatures were measured. The measuring column was first placed in position 2 (Fig. 2) and each air temperature and air velocity was measured simultaneously every 5 sec during a period of 2 min. The column was then moved to the next position, 3, and after approx. 3 min. all measurements were repeated- at the new position. The column was placed in 15 positions, 2 to 6, 8 to 12, and 14 to 18. With a radiator at the back wall (radiator 1.3), it was also placed in positions 20 to 24. In addition, the air velocities 0.1 and 1.2 m above the floor in position 16 and 17 (Fig. 2) were
36
©ASHRAE. All rights reserved. Courtesy copy for SSPC 55 Committee to exclusively use for standards development. May not be distributed, reproduced nor placed on the internet.
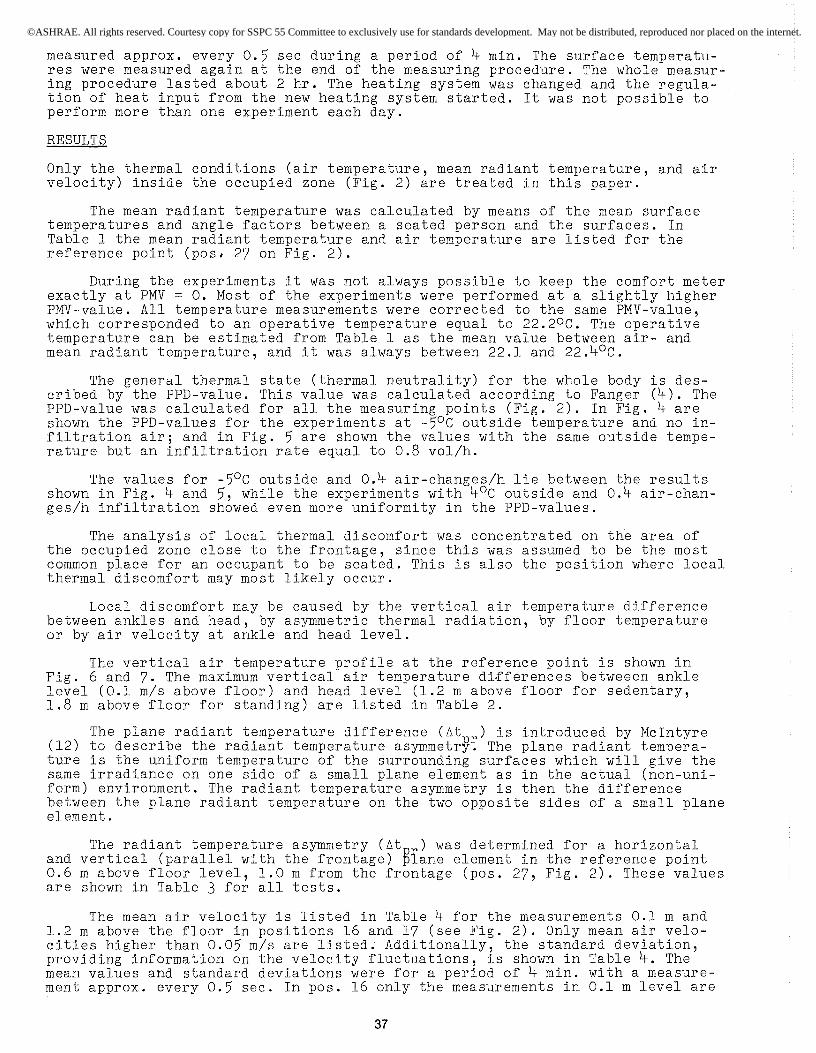
measured approx. every 0.5 sec during a period of 4 min. The surface temperatures were measured again at the end of the measuring procedure. The whole measuring procedure lasted about 2 hr. The heating system was changed and the regulation of heat input from the new heating system started. It was not possible to perform more than one experiment each day.
RESULTS
Only the thermal conditions (air temperature, mean radiant temperature, and air velocity) inside the occupied zone (Fig. 2) are treated in this paper.
The mean radiant temperature was calculated by means of the mean surface temperatures and angle factors between a seated person and the surfaces. In Table 1 the mean radiant temperature and air temperature are listed for the reference point (pos. 27 on Fig. 2).
During the experiments it was not always possible to keep the comfort meter exactly at PMV = O. Most of the experiments were performed at a slightly higher PMV-value. All temperature measurements were corrected to the same PMV-value, which corresponded to an operative temperature equal to 22.20C. The operative temperature can be estimated from Table 1 as the mean value between air- and mean radiant temperature, and it was always between 22.1 and 22.4°c.
The general thermal state (thermal neutrality) for the whole body is described by the PPD-value. This value was calculated according to Fanger (4). The PPD-value was calculated for all the measuring points (Fig. 2). In Fig. 4 are shown the PPD-values for the experiments at ,-5°C outside temperature and no infiltration air; and in Fig. 5 are shown the values with the same outside temperature but an infiltration rate equal to 0.8 vol/h.
The values for -5°c outside and 0.4 air-changes/h lie between the results shown in Fig. 4 and 5, while the experiments with 4°c outside and 0.4 air-changes/h infiltration showed even more uniformity in the PPD-values.
The analysis of local thermal discomfort was concentrated on the area of the occupied zone close to the frontage, since this was assumed to be the most common place for an occupant to be seated. This is also the position where local thermal discomfort may most likely occur.
Local discomfort may be caused by the vertical air temperature difference between ankles and head, by asymmetric thermal radiation, by floor temperature or by air velocity at ankle and head level.
The vertical air temperature profile at the reference point is shown in Fig. 6 and 7. The maximum vertical air temperature di~ferences betweeen ankle level (0.1 m/s above floor) and head level (1.2 m above floor for sedentary, 1.8 m above floor for standing) are listed in Table 2.
The plane radiant temperature difference (~t ) is introduced by McIntyre (12) to describe the radiant temperature asymmetr~: The plane radiant temperature is the uniform temperature of the surrounding surfaces which will give the same irradiance on one side of a small plane element as in the actual (non-uniform) environment. The radiant temperature asymmetry is then the difference between the plane radiant temperature on the two opposite sides of a small plane element.
The radiant temperature asymmetry (~t ) was determined for a horizontal and vertical (parallel with the frontage) Blane element in the reference point 0.6 m above floor level, 1.0 m from the frontage (pos. 27, Fig. 2). These values are shown in Table 3 for all tests.
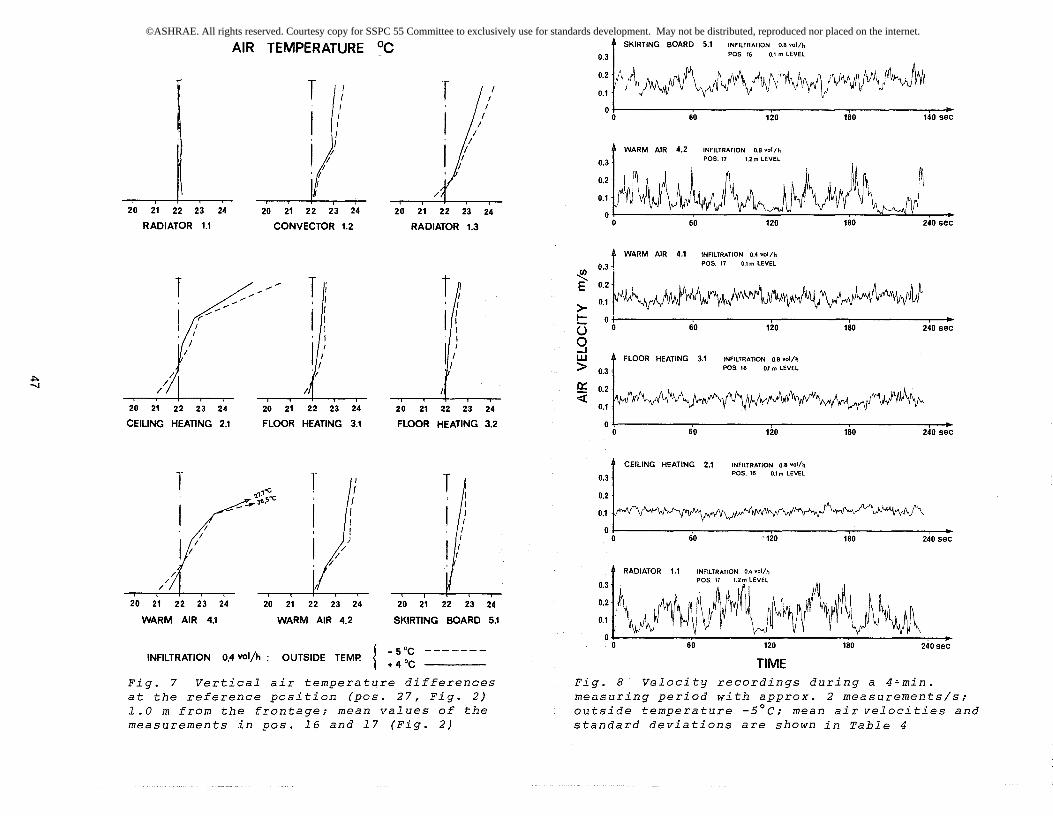
The mean air velocity is listed in Table 4 for the measurements 0.1 m and 1.2 m above the floor in positions 16 and 17 (see Fig. 2). Only mean air velocities higher than 0.05 m/s are listed. Additionally, the standard deviation, providing information on the velocity fluctuations, is shown in Table 4. The mean values and standard deviations were for a period of 4 min. with a measurement approx. every 0.5 sec. In pOSe 16 only the measurements in 0.1 m level are
37
©ASHRAE. All rights reserved. Courtesy copy for SSPC 55 Committee to exclusively use for standards development. May not be distributed, reproduced nor placed on the internet.

listed because no mean air velocities higher than 0.05 m/s at 1.2 m level were found.
Fig. 8 shows typical examples of velocity recordings to illustrate the fluctuations.
The main results of the analysis of the heat loss through the window and by infiltration are given in Table 5. A more detailed description is given by Olesen and Kjerulf-Jensen (22). In all tests the heat loss was lowest with a floor heating system and the results in Table 5 are estimated with a floor heating system as reference. The heat loss through the window is approx. 10% higher with a convector at the frontage (Convector 1.2) and a warm air system with outlets at the frontage (Warm air 4.2). This is due to the increased air velocity and air temperature along the window surface owing to the upward natural or forced convection from the heating system.
The heat loss by infiltration is highest with a warm air system with the outlet at the back wall near the ceiling (Warm air 4.1), approx. 20% higher than with a floor heating system, and with a heated ceiling (Ceiling 2.1) approx. 10% higher.
The differences between the heating methods vary with the different combinations of outside temperature and air infiltration. In general, the two floor heating (Floor 3.1, Floor 3.2) and the skirting board methods (Skirting board 5.1) have the lowest energy consumption, while a convector at the frontage (Convector 1.2) and the two warm air systems (Warm air 4.1 and Warm air 4.2) have the highest energy consumption, which is about 10% higher.
DISCUSSION
All nine heating systems proved in all tests to be capable of creating a remarkably uniform thermal environment (PPD ~ 5%) in the entire occupied zone (Fig. 4 and 5). Only for the radiator on the back wall (Radiator 1.3) was there a rise in the PPD-value to 12% near the radiator (Fig. 5).
The vertical air temperature difference (Fig. 6 and 7, Table 2) between 1.2 and 0.1 m level was less than 1.8K in the whole occupied zone in all tests. Olesen et al. (20) established in experiments with sedentary subjects a comfort limit equal to 3.0K below which less than 5% is predicted to be dissatisfied. According to this, there should be no risk of the present vertical air temperature differences to cause any local thermal discomfort for sedentary subjects. For standing persons there is no information in the literature on comfort limit. This limit would probably, owing to the increased activity, be greater than for sedentary persons. In the present tests the air temperature difference between 1. 8 m and 0.1 m level was always less than 2. 90 C, and this should not cause any local discomfort. The highest vertical air temperature differences were measured in the tests with a heated ceiling (Ceiling 2.1) and with a warm air system with outlet in the back wall near the ceiling (Warm air 4.1). In general, an increased air infiltration rate (Fig. 6) or a decreased outside temperature (Fig. 7) increased only the vertical air temperature difference slightly.
The vertical radiant temperature asymmetry at the window (pos. 27) expressed by the plane radiant temperature difference (Table 3) was always less than 3.5K, which is less than the 10K recommended by Olesen (24) and McIntyre (13) as a comfort limit (5% dissatisfied). For the horizontal asymmetry, the plane radiant temperature for the lower half of the room is always higher, except for ceiling heating, than the plane radiant temperature of the upper half of the room (Table 3). Recent (as yet unpublished) studies at the Technical University of Denmark indicate that man is much more sensitive to thermal asymmetry when exposed to overhead warm radiation (e.g. from heated ceilings) than when he is exposed to left/right or forward/backward asymmetry. Accepting 5% feeling uncomfortable (owing to warm head or cold feet), a radiant temperature asymmetry of maximum 4K is recommended.
The comfort limit for the opposite asymmetry (warm feet " cold head), will be higher according to Eriksson's experiments (3) with a lower air temperature at head level than at foot level. The maximum measured difference in the pre-
38
©ASHRAE. All rights reserved. Courtesy copy for SSPC 55 Committee to exclusively use for standards development. May not be distributed, reproduced nor placed on the internet.

sent experiments, 4.) - 7.0K for the two types of floor heating, will probably be inside the comfort limit.
The radiant temperature asymmetry increased as expected with increasing air infiltration rate or decreasing outside temperature.
Mean air velocities as shown in Table 4 are only shown for pos. 16 and 17, and only for 0.1 and 1.2 m level. Similar air velocities were measured in pos. 10 and 11. At the other measuring points in the occupied zone, the measured air velocities were equal to or less than 7 cmls with a few exceptions.
The highest air velocities at floor level (0.1 m above the floor) was measured in the tests with the two floor heating methods (14-18 cm/s). Also in some of the tests with a radiator at the back wall and with the skirting board system, mean air velocities higher than 10 cmls were measured. These air velocities are caused by the induced "outside" air around the window and the downdraft along the window. With a radiator, convector or a warm air system at the frontage, this down-draft is counteracted by the natural or forced upward convection from the heating system.
The measured mean air velocity at head level (1.2 m above the floor) was in most cases less than the air velocity at floor level. Only in the test with a radiator at the frontage, -5°C outside temperature and 0.4 air-changes/h infiltration rate, a mean air velocity higher than 10 cmls was measured. This air velocity (13 cm/s) was caused by a mixing of the down-draft and the natural convection from the radiator. The high standard deviation indicates a high degree of fluctuation which can cause a feeling of draft. Even though man is less sensitive to draft at the ankles (15), mean air velocities around I) cmls can cause a feeling of discomfort for the most sensitive persons. In the present tests the height of the window was 1.2 m. With even higher ~indows, which is not unusual in practice, higher air velocities can be expected. This could cause discomfort, especially with a floor heating system. Information in the literature on comfort limits for various air velocities as well as for velocity fluctuations is very limited (13,1)).
The floor temperature in the occupied zone with floor heating was always less than 27.5 v C. The comfort limit for sedentary person is 28°C (8% dissatisfied) recommended by Olesen (16).
In the present test conditions there is only a limited risk of thermal discomfort. All heating methods used in this well insulated room provide an acceptable thermal environment in the whole occupied zone. Later tests with 16 experimental subjects (1) confirmed that. These tests were performed only at one combination of outside temperature (-7oC) and air infiltration rate (0.4 h- l ) and with only four heating methods (Radiator 1.1, Ceiling 2.1, Floor 3.1, Warm air 4.2). The results indicate, however, that some of the subjects in the experiments with a large panel radiator (Radiator 1.1) at the frontage felt the conditions more uncomfortable than with the other heating methods. The uncomfortable conditions may be attributed to the difference between the cold radiation on the upper part of the body (from the window) and the warm radiation on the lower part (from the radiator) combined with the increased air velocity on the upper part caused by the mixing of down-draft, air infiltration and natural convection from the radiator.
The results of the present experiments are valid only for environmental conditions similar to those used in the experiments, i.e., steady-state conditions, and a room with one well insulated frontage including a double-glazed window and outside temperatures down to -5°c.
The influence of non-steady-state conditions has not been investigated in the present study, but for a large period of the heating season with slow changes in the heat load in the room the present results are valid.
More than one outside wall, bad insulation, larger windows, higher infiltration rates and lower outside temperatures will increase the risk for local thermal discomfort, especially near a window.
39
©ASHRAE. All rights reserved. Courtesy copy for SSPC 55 Committee to exclusively use for standards development. May not be distributed, reproduced nor placed on the internet.

CONCLUSION
The present experiments have shown that all nine heating methods investigated are able to create an acceptable thermal environment in a well insulated room with one frontage including a double-glazed window exposed to steady-state winter conditions (outside temperature down to -50 C, and air infiltration rates up to 0.8 air-changes/h).
When the temperature level in a room provides thermal neutrality (PMV=O) for a sedentary person near the frontage, there will be only a small likelihood of local discomfort and the thermal conditions will be acceptable in the entire occupied zone.
Only with a radiator at the back wall did the predicted percentage of dissatisfied (PPD-value) at a position near the radiator increase significantly from the optimal value (from 5 to 12%).
In all tests, vertical air temperature differences, radiant temperature asymmetry and floor temperatures were inside established comfort limits.
There was a risk of mean air velocities higher than 10 cm/s along the floor in the occupied zone nearest to the frontage when the down-draft along the window and from the air infiltration was not counteracted by an upward convection from the heating system. In general, the highest measured air velocities were in the test with the two floor heating systems (approx. 15 cm/s).
REFERENCES
1.
2.
3·
4.
5.
6.
7·
8.
9.
10.
11.
12.
BR-77. Building Regulation (in Danish). Boligministeriet, Copenhagen 1977.
Chrenko, F.A., "Heated Ceilings and Comfort". Journ. of the Inst. of Heating and Ventilating Engineers, 1953, 20:375-396 and 21:145-164.
Eriksson, H.-A., "Heating and Ventilating of Tractor Cabs". Presented at the 1975 Winter Meeting: American Society of Agricultural Engineers, Chicago, Dec. 1973.
Fanger, P.O., Thermal Comfort. McGraw-Hill Book Co., New York 1973, 244p.
Fanger, P.O. and Pedersen, C.J.K., "Discomfort Due to Air Velocities in Spaces". Proc. of the meeting of Commissions Bl, B2, El of the IIR, Belgrade 1977/4, pp.289-296.
Hannay, J., Laret, L., Lebrun, J., Marret, D. and Nusgens, P., "Thermal " Comfort and Energy Consumption in Winter Conditions. A new ExpE!rimental Approach". ASHRAE Trans., Vol. 84, Part 1, 1978.
Houghten, F.C., "Draft Temperatures and Velocities in Relation to Skin Temperature and Feeling of Warmth". ASHVE Trans., 44:289, 1938.
J¢rgensen, F., "An Omnidirectional Thin-Film Probe for Indoor Climate Research". DISA-Information, No. 24, 1979.
Lebrun, J. and Marret, D., "Heat Losses of Buildings with Different Heating Systems". Proc. of the International Conference on Energy Use Management. Tucson, Arizona, Oct. 1977.
Lebrun, J., "Differences in Comfort Sensations in Spaces Heated in Different Ways. Belgian Experiments". In P.O.Fanger and O.Valbj¢rn (eds.): Indoor Climate, Danish Building Research Institute, Copenhagen 1979.
Madsen, T. L., "Thermal Comfort Measurements". ASHRAE Trans., Vol. 82, Part 1, 1976.
1-1cIntyre, D.A., "The The~mal Radiation Field". Building Science, 9:247-262, 1974.
40
©ASHRAE. All rights reserved. Courtesy copy for SSPC 55 Committee to exclusively use for standards development. May not be distributed, reproduced nor placed on the internet.
13.
14.
16.
17.
18.
19.
20.
21.
22.
23·
24. '
McIntyre, D.A. and Griffiths, LD., "The Effect of Uniform and Asymmetric Thermal Radiation on Comfort". Proc. of the 6th International Congress of Climatistics "CLIMA 2000", Milan, March 1975.
McIntyre, D.A., "Overhead Radiation and Comfort". The Building Services Engineer, 44:226-232, 1976.
McIntyre, D.A., "The Effect of Air Movement on Thermal Comfort and Sensation". In P.O.Fanger and O.Valbj¢rn (eds.): Indoor Climate, Danish Building Research Institute, Copenhagen 1979.
McNair, H.P., "A Preliminary/Further Study of the Subjective Effects of Vertical Air Temperature Gradients". British Gas Corporation, 1973-74. Project 552, London.
McNall, P.E., Jr. and Biddison, R.E., "Thermal and Comfort Sensations of Sedentary Persons Exposed to Asymmetric Radiant Fields". ASHRAE Trans., Vol. 76, Part 1, 1970.
Olesen, B.W., "Thermal Comfort Requirements for Floors Occupied by People with Bare Feet". ASHRAE Trans., Vol. 83, Part 2, 1977.
Olesen, B.W., "Thermal Comfort Requirements for Floors". Proc. of the meeting of Commissions Bl, B2, El of the IIR, Belgrade 1977/4, pp.337-343.
Olesen, B.W., Sch¢ler,. M. and Fanger, P.O., "Vertical Air Temperature Differences and Comfort". In P.O.F'anger and O.Valbj¢rn (eds.): Indoor Climate, Danish Building Research Institute, Copenhagen 1979, pp.561-579.
Olesen, B.W. and Thorshauge, J., "Differences in Comfort Sensations in Spaces Heated in Different Ways. Danish Experiments". In P.O.Fanger and O.Valbj¢rn (eds.):, Indoor Climate, Danish Building Research Institute, Copenhagen 1979, pp.645-676.
Olesen, B.W. and Kjerulf-Jensen, P., "Energy Consumption in a Room Heated by Different Methods". Presented at the Second International CIB Symposium on Energy Conservation in the Built Environment, Copenhagen, May-June 1979.
Olesen, B.W., "Draught and Air Velocity Measurements". DISA-Information, No. 24, 1979.
Olesen, S., Fanger, P.O., Jensen, P.B. and Nielsen, O.J., "Comfort Limits for Man Exposed to Asymmetric Thermal Radiation". Proc. of CIB Symposium on Thermal Comfort, Building Research Stateion, London, 1972.
Pedersen, C.J.K., Komfortkrav til luftbevcegelser i rum ("Comfort Requirements to Air Movements in Spaces"). Ph.D.-Thesis, Laboratory of Heating & Air Conditioning, Technical University of Denmark, 1977. (In Danish with an English summary).
ACKNOWLEDGEMENTS
This work was supported by the Danish Government Fund for Scientific and Industrial Research (STVF).
41
©ASHRAE. All rights reserved. Courtesy copy for SSPC 55 Committee to exclusively use for standards development. May not be distributed, reproduced nor placed on the internet.
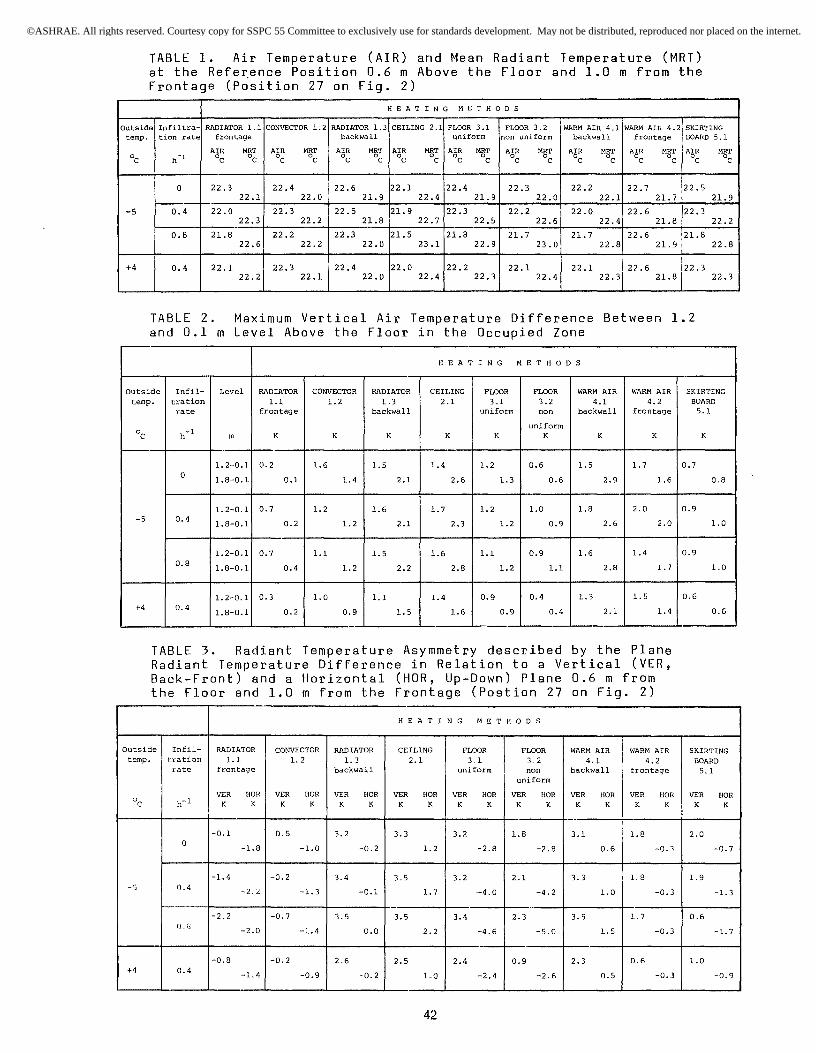
TABLE 1. Air Temperature (AIR) and Mean Radiant Temperature (MRT) at the Reference Position 0.6 m Above the Floor and 1.0 m from the Frontage (P~sition 27 on Fig. 2)
HEATING METHODS -
Outside Infiltra- RADIATOR 1.1 CONVECTOR 1. 2 RADIATOR 1. 3 CEILING 2.1 FLOOR 3.1 FLOOR 3.2 WARM AIR 4.1 WARM AIR 4.2 SKIRTING temp. tion rate frontage backwall uniform non uniform backwall frontage BOARD 5.1
AIR MRT AIR MRT AIR M§T AIR MRT AIR M§T AIR MRT AIR MRT AIR MRT AIR MRT DC h- 1 Dc DC DC Dc DC DC D DC D D DC DC DC DC D DC C C C C C C
0 22.3 22.4 22.6 22.1 22.4 22.3 22.2 22.7 22.5 22.1 22.0 21. 9 22.4 21.9 22.0 22.1 21.7 21. 9
-5 0.4 22.0 22.3 22.5 21. 9 22.3 22.2 22.0 22.6 22.3 22.3 22.2 21.8 22.7 22.5 22.6 22.4 21.8 22.2
0.8 21.8 22.2 22.3 21.5 21.8 21.7 21. 7 22.6 21.8 22.6 22.2 22.0 23.1 22.9 23.0 22.8 21. 9 22.8
+4 0.4 22.1 22.3 22.4 22.0 22.2 22.1 22.1 22.6 22.3 22.2 22.1 22.0 22.4 22.3 22.4 22.3 21.8 22.3
TABLE 2. Maximum Vertical Air Temperature Difference Between 1.2 and 0.1 m Level Above the Floor in the Occupied Zone
H EAT I N G MET HOD S
Outside Infil- Level RADIATOR CONVECTOR RADIATOR CEILING FLOOR FLOOR WARM AIR WARM AIR temp. tration 1.1 1.2 1.3 2.1 3.1 3.2 4.1 4.2
°c
-5
+4
rate frontage backwall uniform non backwall frontage
h-1 m K K K K uniform
K K K K
1. 2-0.1 0.2 1.6 1.5 1.4 1.2 0.6 1.5 1.7 0 1. 8-0.1 0.1 1.4 2.1 2.6 1.3 0.6 2.9 1.6
1.2-0.1 0.7 1.2 1.6 1.7 1.2 1.0 1.8 2.0 0.4
1.8-0.1 0.2 1.2 2.1 2.3 1.2 0.9 2.6 2.0
.. 1.2-0.1 0.7 1.1 1.5 1.6 1.1 0.9 1.6 1.4
0.8 1.8-0.1 0.4 1.2 2.2 2.8 1.2 1.1 2.8 1.7
1. 2-0.1 0.3 LO 1.1 1.4 0.9 0.4 1.3 1.5 0.4
1.8-0.1 0.2 0.9 1.5 1.6 0.9 0.4 2.1 1.4
TABLE 3. Radiant Temperature Asymmetry described by the Plane Radiant Temperature Difference in Relation to a Vertical (VER, Back-Front) and a Horizontal (HOR, Up-Down) Plane 0.6 m from the Floor and 1.0 m from the Frontage (Postion 27 on Fig. 2)
H EAT I N G MET HOD S
Outside Infil- RADIATOR CONVECTOR RADIATOR CEILING FLOOR FLOOR WARM AIR WARM AIR temp. tration 1.1 1.2 1.3 2.1 3.1 3.2 4.1 4.2
rate frontage backwall uniform non backwall frontage uniform
VER HOR VER HOR VER HOR VER HOR VER HOR VER HOR VER HOR VER HOR °c h- 1 K K K K K K K K K K K K K K K K
-0.1 0.5 3.2 3.3 3.2 1.8 3.1 1.8 0
-1.8 -1.0 -0.2 1.2 -2.8 -2.8 0.6 -0.3
-1.4 -0.2 3.4 3.5 3.2 2.1 3.3 1.8 -5 0.4 -2.2 -1. 3 -0.1 1.7 -4.0 -4.2 1.0 -0.3
-2.2 -0.7 3.5 3.5 3.4 2.3 3.5 1.7 0 .. 8 -2.0 -1.4 0.0 2.2 -4.6 -5.0 1.5 -0.3
-0.8 -0.2 2.6 2.5 2.4 0.9 2.3 0.6 +4 0.4 -1.4 -0.9 -0.2 1.0 -2.4 -2.6 0.5 -0.3
-
42
SKIRTING BOARD
5.1
K
0.7
0.8
0.9
1.0
0.9
1.0
0.6
0.6
SKIRTING BOARD
5.1
VER HOR K K
2.0
-0.7
1.9
-1. 3
0.6
-1. 7
1.0
-0.9
©ASHRAE. All rights reserved. Courtesy copy for SSPC 55 Committee to exclusively use for standards development. May not be distributed, reproduced nor placed on the internet.

TABLE 4. Mean Air Velocities and Standard Deviation in Position 16, 0.1 m Above the Floor and in Position 17, 0.1 m and 1.2 m Above the Floor; Mean of a 4-min. Measuring Period with Approx. 2 Measurements/s (*Mean of a 2-min. Measuring Period with 5 s Between Each Measurement)
HEATING METHODS
Outside 1nf11- Posi- Level RADIATOR CONVECTOR RADIATOR CEILING FLOOR FLOOR WARM AIR WARM AIR SKIRTING temp. tration tion 1.1 1.2 1.3 2.1 3.1 3.2 4.1 4.2 BOARD
rate frontage backwall uniform non backwall frontage 5.1 uniform
°c h-1 m cm/s cm/s cm/s cm/s cm/s cm/s cm/s cm/s em/s
16 0.1 - - 9(3) 7(1)" 13(2)* 9(2) 8(2) - 7 (3) 0
17 0.1 - - 12 (3) 11(3)" 14(4)" 15 (4) 13(3) 8(4) 8(3) 1.2 9(5) - - - - - - -
16 0.1 - - 6(1) 9(2) 14(4)" 13(2)* 9(1) - 9(3) -5 0.4 0.1 - - 11(4) 13 (3) 17(4)* 18(5)* 13 (3) 7(4) 8(3) 17 1.2 13(7) - - - - - - - 9(6)
16 0.1 6(2) - 7(2) 11(2) 14(2) 14(3) 10(2) - 16(4) 0.8 0.1 6(2) 7(3) 12(3) 9(3) 11(4) 9(4) -, - 10(3) 17
1.2 7(3) - 6(3) 7(2) 6(2) - 8(4) 9(6) 9(6) . 16 0.1 - - - - ? 13(3) 7(2) ? 10(3)
+4 0.4 17 0.1 - - - - ? 10(4) 8(3) ? -1.2 7(2) - - - - - - 8(4)
- mean air velocoty ~ 5 cm/s ? no measurement
TABLE 5. The Percentage Difference in Heat Loss Between the Heating Methods with Floor Heating (FLOOR 3.1) as Reference. The Difference is Calculated for the Heat Loss Through the Window, by Infiltration and the Total (Window & Infiltration),
H EAT I N G MET HOD S
Outside Infil- Heat loss RADIATOR CONVECTOR RADIATOR CEILING FLOOR FLOOR WARM AIR WARM AIR SKIRTING temp. tration source 1.1 1.2 1.3 2.1 3.1 3.2 4.1 4.2 BOARD
rate frontage backwall uniform non backwall frontage 5.1 uniform
0 h-1 C % % % % % % % % %
-5 0 window 2 11 6 4 0 0 7 11 0
window 0 12 4 2 0 0 3 11 0 -5 0.4 infilt. -2 2 5 8 (J 0 16 4 2
total 0 8 5 4 0 0 8 8 1
window 6 11 4 4 0 0 3 10 0 -5 0.8 infil t -2 2 7 10 0 0 21 6 1
total 2 6 6 7 0 0 13' 8 1
window 7 11 6 2 0 0 5 14 1 +4 0.4 infi1t. -3 3 5 8 0 -1 16 5 0
total 3 8 6 4 0 0 9 11 0
43
-
©ASHRAE. All rights reserved. Courtesy copy for SSPC 55 Committee to exclusively use for standards development. May not be distributed, reproduced nor placed on the internet.

w c:J ~ Z 0 0::: u..
10 .1
Ell
6
• 12
lIP
18
• 24
WARM AIR 4.1
AIR INFILTRATION
RADIATOR 1.3 ., ... ..:.-.. . ..;,....:..
FLOOR HEATING 3.1 AND 3.2
BOARD 5.1
I: 0.6 :1 4.8
Fig. I The test room with 9 different heating systems installed; all dimensions in meters
.. Ell III
5 4 3
;11 - -- -- -- - - - -- - .. ------
10 9
I
~ • • • 117 27 16 15 I I 60-
,- - --- - - - -- - .- - - - --23 22 21
I .. 50 ... 1 .. 40 .. 1 .. 80 ...1 .. 120 ... 1 ..
120
• 2
"1 ,8 I , T14 I I ..
20
...14
Fig. 2 Measuring points in the horizontal plane; all dimensions in em
44
-- EXHAUST
<:I .....
<:I in
<:I <C
<:I <C
<:I <C
60 ...I
©ASHRAE. All rights reserved. Courtesy copy for SSPC 55 Committee to exclusively use for standards development. May not be distributed, reproduced nor placed on the internet.
.j::,. U1
• ® /@ • •
0 CD • ~ • •
• .@) •
• • I. • I • .@ • I' • • •
• • •
~J • ; •
l: • :! • • • •
I • / '\. • I
® • I.
• •
• •
Fig. 3 Positions for surface temperature measurements and the sub-division of the room into 14 surfaces
,RADIATOR 1.1. FRONTAGE CONVECTOR 1.2, FRONTAGE
+ .... .... + ~
+ + + 1-
5.0 5.0 5.0 5.0 ~ 5.0 5.0 z 5.0 5.0 5.0 5.0 5.1 5.0 0 5.0 5.0 0:: 5.2 5.0 u.
RADIATOR 1.3. BACKWAlL CEILING HEATING 2.1
I 5.9 5.4 5.1 5.1 w + + 1- 1-
~ 7.1 5.6 5.1 5.1 ~ 5.2 5.2 5.0 5.1 8.3 6.0 5.2 5.1 5.1 5.0 u. 5.0 5.1
FLOOR HEATING 3.1 FLOOR HEATING 3.2
+ ... + 1- Iw + + + 1-
" is 5.2 5.2 5.1 5.1 I~
5.1 5.0 5.0 5.0
5.3 5.2 5.0 5.1 5.0 5.0 5.0 5.2
WARM AIR 4.1, BACKWAll WARM AIR 4.2, FRONTAGE
... + + + w + + + + " ~ 5.2 5.2 5.2 5.0 5.1 ~ 5.1 5.0 5.0
5.2 5.2 5.0 5.2 0:: 5.2 5.1 5.n 5.0 U.
SKIRTING BOARD 5.1
OUTSIDE TEMPERATURE - 5°C + ... .... + w AIR INFILTRATION o vol/h
" 5.2 5.1 5.0 5.0 ~ Z
5.2 5.1 5.0 5.0 ~ u.
Fig. 4 The predicted percentage of dissatisfied (PPD-va1ue) in the occupied zone
w
" ~ Z
~ u.
w
~ Z 0 0:: u.
w " ~ 0 0:: u.
w
" ~ ~ 0:: u.
©ASHRAE. All rights reserved. Courtesy copy for SSPC 55 Committee to exclusively use for standards development. May not be distributed, reproduced nor placed on the internet.

RADIATOR 1.1, FRONTAGE CONVECTOR 1.2, FRONTAGE AIR TEMPERATURE °c .. .. ... +
~ .. + + ..
UJ (!)
I! : 5.2 5.2 5.2 5.2 i! i! z 5.0 5.0 5.0 5.0 Z 5.2 5.3 5.2 5.1 0 0
It: 5.0 5.0 5.0 5.0 It:
1\ ... ...
, I
RADiATOR 1.3, BACKWAll CEILING HEATING 2.1 ,!i 1\ 6.7 5.S 5.1 5.2 Iw .. + + + UJ i
0 (!) 20 21 22 23 24 20 21 22 23 24 20 21 22 23 24 9.2 5.9 5.1 5.1 ~ 5.1 5.3 5.1 5.1 ~ RADIATOR 1.1 CONVECTOR 1.2 RADIATOR 1.3 I~ 0
11.6 6.2 5.1 5.1 5.3 5.2 5.1 5.2 0: ...
FLOOR HEATING 3.1 FLOOR HEATING 3.2
.. .. .. + L .. .. .. + UJ
~ 0 ~
5.6 5.4 5.0 5.1
I~ 5.3 5.2 5.0 5.1 Z
0 5.4 5.3 5.0 5.1 5.2 5.1 5.0 5.1
It: ... -'" C1> i
20 21 22 23 24 20 21 22 23 24 20 21 22 23 24
CEILING HEATING 2.1 FLOOR HEATING 3.1 FLOOR HEATING 3.2
WARM AIR 4.1, BACKWAll WARM AIR 4.2, FRONTAGE
.. + + + UJ .. .. + + w
" g 1.."oc 5.6 5.4 5.1 5.1
~
!/ ,...~ 33~OC
~ 5.2 5.1 5.0 5.0 z 0
5.6 5.4 5.1 5.6 0: 0: ... 5.1 5.0 5.0 5.0 ... / ,
I "
SKIRTING BOARD 5.1 i , ,/1 I ----.-------------.
OUTSIDE TEMPERATURE - 5°C 20 21 22 23 24 20 21 22 23 24 20 21 22 23 24
+ .. .. .. UJ c AIR INFILTRATION 0.8 vol/h WARM AIR 4.1 WARM AIR 4.2 SKIRTING BOARD 5.1
5.3 5.1 5.0 5.0 ~
5.3 5.2 5.0 5.0 ~ { 0 vol/h ------"- OUTSIDE TEMP. - 5"C ; INALTRATION
0,8 voI/h
Fig. S The predicted percentage of dis- Fig. 6 Vertical air temperature differences satisfied (PPD-val ue) in the occupied zone at the reference position (pos. 27, Fig. 2)
1.0 m trom the frontage; mean values of the measurements in pos. 16 and 17 (Fig. 2)
©ASHRAE. All rights reserved. Courtesy copy for SSPC 55 Committee to exclusively use for standards development. May not be distributed, reproduced nor placed on the internet.
.j:>.
"
AIR TEMPERATURE
T I I I
I
~ I r , r
11 i i I
20 21 22 23 24 20 21 22 23 24
RADIATOR 1.1 CONVECTOR 1.2
-- -- I t ---- -- , I
--
;/11 I{ 20 21 22 23 24 20 21 22 23 24
CEILING HEATING 2.1 FLOOR HEATING 3.1
20 21 22 23
WARM AIR 4.1
INFILTRATION
1.1;1~ :.-;.p- 30,~ C
T
I ,
I In
24 20 21 22 23 24
WARM AIR 4.2
0.4 vol/h OUTSIDE TEMP. {
°c
/
20 21 22 23 24
RADIATOR 1.3
20 21 22 23 24
FLOOR HEATING 3.2
20 21 22 23 24
SKIRTING BOARD 5.1
_ 5°C -------
+ 4 °C
Fig. 7 Vertical air temperature differences at the reference position (pos. 27, Fig. 2) 1.0 m from the frontage; mean values of the measurements in pos. 16 and 17 (Fig. 2)
~ E
> ..... ()
9 w > 0::: «
SKIRTING BOARD 5.1
0.3
INFILTRATiON 0.8 vol/h
POS. 16 0.1 m lEVEL
:::VA.~VI\AJ\i~\ryjV~'/~1 01 ~
0.3
0.2
0.1
o 60
WARM AIR 4.2
60
120
INFILTRATION O.B vol/h POS.17 102m lEVEL
120
180
180
140 sec
~\
240 sec
t WARM AIR 4.1 INFilTRATION 0.4 vollh
::~ ~.
o • o 60 120 180 240 sec
FLOOR HEATING 3.1 INFILTRATION 0.8 vol/h
0.3 J POS.16 0.1 m LEVEL
0.2
0.1
0
0.3
0.2
0.1
0 60
CEILING HEATING 2.1
60
120
INFILTRATION 0.8 vol/h POS.16 O.1m LEVEL
'120
RADIATOR 1.1 INFilTRATION 0.4 VOllh
180 240 sec
~,
180 240 sec
:~l\AJ~~Jffl\N\, . o 60 120 160 240 sec
TIME Fig. 8 Velocity recordings during a 4~min.
measuring period with approx. 2 measurements/s; outside temperature -SoC; mean air velocities and standard deviations are shown in Table 4
©ASHRAE. All rights reserved. Courtesy copy for SSPC 55 Committee to exclusively use for standards development. May not be distributed, reproduced nor placed on the internet.

DISCUSSION
G.B. GREEN, Prof., Dniv. of Sask., Saskatoon, Saskatchewan: What was the window constuction (i.e., single, double, or triple)?
B.W. OLESEN: The window construction was double.
GREEN: Were the window surfaces measured?
OLESEN: Yes. The values are listed in Ref 22.
DAVID T. BARRJE, Sr. Res. Engr. & Lecturer, Princeton Dniv., Princeton, NJ: Could you further clarify the choices of warm air temperature and flow in those systems you tested?
OLESEN: The values are listed on page 3 in the paper.
Outlet velocity = 1.2 mls in all tests.
Outlet air temp. = 34-43°C.
BARRJE: Do you contemplate any extension of the study to cooling comfort?
OLESEN: Not presently.
FRITZ W. STEIMLE, Prof. Dr., Dniv. Essen, Essen, Germany: In our own investigations with warm air heating systems in very well-insulated buildings having trip1eglassed windows, we found that warm air heating systems need less heat, since it is possible to use the heat input by solar radiation on the south side (through the window) to heat the north side. This is not possible with heating methods using water circulation and floor heating, panel heating, or ceiling heating.
48
©ASHRAE. All rights reserved. Courtesy copy for SSPC 55 Committee to exclusively use for standards development. May not be distributed, reproduced nor placed on the internet.


