Thermal coefficients of methyl groups within ubiquitin and ...
92
Thermal coefficients of methyl groups within ubiquitin and metabolic coupling of NAA and lactate in cortical neurons Dissertation for the award of the degree “Doctor rerum naturalium” of the Georg-August-Universität Göttingen within the doctoral program molecular physiology of brain (CMPB) of the Georg-August University School of Science (GAUSS) submitted by Davood Bakhtiari from Kermanshah Göttingen 2013
Transcript of Thermal coefficients of methyl groups within ubiquitin and ...

Thermal coefficients of methyl groups within ubiquitin and metabolic coupling of NAA and lactate in cortical neurons
Dissertation for the award of the degree
“Doctor rerum naturalium”
of the Georg-August-Universität Göttingen
within the doctoral program molecular physiology of brain (CMPB)
of the Georg-August University School of Science (GAUSS)
submitted by Davood Bakhtiari
from Kermanshah
Göttingen 2013
2
Members of Thesis Committee and Examination Board:
First Reviewer: Prof. Dr. Christian Griesinger
Department of NMR-based Structural Biology, Max Planck Institute for Biophysical Chemistry, Göttingen, Germany
Second Reviewer: Prof. Dr. Marina Bennati
Electron Spin Resonance Spectroscopy Group Max Planck Institute for Biophysical Chemistry, Göttingen, Germany
Prof. Dr. Dirk Görlich
Department of Cellular Logistics, Max Planck Institute for Biophysical Chemistry, Göttingen, Germany
Dr. Sebastian Kügler
Department of Neurology, Viral Vector Laboratory, Göttingen University Medical School, Germany
Members of Extended Thesis Committee and Examination Board:
Prof. Dr. Klaus-Armin Nave
Department of Neurogenetics, Max Planck Institute for Experimental Medicine, Göttingen, Germany
Prof. Dr. Kai Tittmann
Department of Bioanalytics, George-August-Universität Göttingen, Germany
Dr. Lars Kuhn
NMR spectroscopy group, European Neuroscience Institute, Göttingen, Germany
Date of the oral examination, 6th of September, 2013

3
Affidavit:
Hereby I declare that my thesis entitled: “Thermal coefficients of methyl groups within
ubiquitin and metabolic coupling of NAA and lactate in cortical neurons” has been
written independently and with no other sources and aids other quoted.
………………………… Davood Bakhtiari, Göttingen, 14th of July, 2013

4
Acknowledgement:
First of all I would like to express the deepest appreciation to my supervisor,
Prof. Dr. Christian Griesinger, who gave me the honor to work in his group with different
elegant and challenging projects. His way of approaching the problems and teaching style
made a magnificent impact on my scientific practice and understanding of biophysics and
NMR.
I would like to thank Prof. Dr. Dirk Görlich and Dr. Sebastian Kügler who accepted to be
member of my thesis committee and giving me helpful advices during this thesis. My special
thanks go to Prof. Dr. Marina Bennati who accepted to be the second reviewer of this thesis. I
also appreciate and thank my examination board Prof. Dr. Klaus-Armin Nave,
Prof. Dr. Kai Tittmann and Dr. Lars Kuhn, despite their tight schedule agreed to evaluate my
dissertation.
I am highly indebted to our collaborators Prof. Dr. Klaus-Armin Nave and Dr. Kathrin Kusch
for the outstanding biological question, tedious sample preparation work and hours of fruitful
discussion that pertain work that constitutes a large part of this thesis.
My special gratitude and thanks go to my colleague and mentor Dr. T. Micheal Sabo, without
his significant contribution, patience and kind help with respect to the first project in this
thesis would of made it impossible. Dr. Donghan Lee’s idea was the crucial point for the first
part of this thesis.
The colleagues of molecular biology and chemisty laboratory, Dr. Stefan Becker, Dr. Andrei
Leonov and Karin Giller supported my thesis with the preparation of precious samples.
Special thanks to Dr. Nasrollah (Hessam) Rezaei-Ghaleh, who was always open and patient to
my countless questions and never left any of them unanswered.
In addition I have to thank my best friends and colleagues, Drs. Luigi Russo, Adam Mazur,
Holger Schmidt, Stefan Bibow for all their helps and discussions during my Ph.D. period.
I had a great time together with my friends and fellow Ph.D . students of the NMR-based
structural biology department, David Ban, Jean-Phillip Demers, Hariandranath Kadavath,
Hannes Fasshuber and Sheng-Qi Xiang.

5
Table of Contents Abbreviations ............................................................................................................................ 7
Introduction .............................................................................................................................. 9
Theory: .................................................................................................................................... 14
Magnetic resonance phenomenon: ....................................................................................... 15
Measurement procedure in NMR spectroscopy ................................................................... 16
Equation of motion of magnetization: Bloch equation ........................................................ 17
Precession of transverse magnetization and rotating frame reference system ..................... 17
Continuous wave irradiation in rating frame to generate to transverse magnetization ........ 19
One pulse experiment ........................................................................................................... 20
Fourier transformation of FID .............................................................................................. 21
Relaxation ............................................................................................................................. 23
Spectral density function ...................................................................................................... 24
Internal motion ..................................................................................................................... 26
Double commutator .............................................................................................................. 26
Interaction Hamiltonian for dipolar and CSA interactions .................................................. 27
Cross correlated relaxation (CCR) ....................................................................................... 29
Results and Discussion ........................................................................................................... 32
Methyl group cross-correlated relaxation............................................................................. 32
Quantification of methyl group dynamics in ubiquitin ........................................................ 35
Analysis of the temperature dependence of in ubiquitin .............................................. 37
Insight into the thermal stability of ubiquitin from the distribution of thermal coefficients 44
Materials and Methods .......................................................................................................... 47
NMR spectroscopy and processing. ..................................................................................... 47
Methods for error determination. ......................................................................................... 48
Conclusion ............................................................................................................................... 50
Introduction ............................................................................................................................ 51
N-acetyl aspartate (NAA) in brain: ...................................................................................... 51
Metabolic coupling in central nervous system: .................................................................... 53
Aim of thesis: ....................................................................................................................... 55
Material and Methods: .......................................................................................................... 56
Sample preparation: .............................................................................................................. 56
Chemical synthesis of 13C2-NAA: ........................................................................................ 61
NMR Spectroscopy: ............................................................................................................. 61
Results and Discussion: .......................................................................................................... 64
Saxis2

6
Quantification of NAA using NMR ..................................................................................... 64
Determination of NAA in supernatant of neurons by 1H-NMR ........................................... 65
Quantification of NAA via labeling and 2D 13C, 1H-HSQC ................................................ 67
2D in cell spectrum of neurons and cell extracts ................................................................. 68
Neurons respond to different lactate treatments ................................................................... 70
Control experiments ............................................................................................................. 71
Conclusion: ............................................................................................................................. 75
References: .............................................................................................................................. 77
Appendix I ............................................................................................................................... 86
Appendix II ............................................................................................................................. 90
Personal information .............................................................................................................. 92
Education ................................................................................................................................ 92
Scientific skills ........................................................................................................................ 92
Computer skills ....................................................................................................................... 92
Languages ............................................................................................................................... 92
Publications ............................................................................................................................. 92

7
Abbreviations
1,3-BPG 1,3-Biphosphoglycerate
2-PG 2-Phosphoglycerate
3-PG 3-Phosphoglycerate
Ac-CoA Acetyl Coenzyme A
ASPA Aspartoacylase
CCR Cross Correlated Relaxation
CNS Central Nervous System
Cp Heat capacity (constant pressure)
CSF Cerebrospinal fluid
DAPI 4',6-diamidino-2-phenylindole
DHAP Dihydroxy acetone phosphate
DMEM Dulbecco’s modified Eagle Medium
DSS 4,4-dimethyl-4-silapentane-1-sulfonate
F-1,6-BP Fructose 1,6-biphosphate
F6P Fructose 6-phosphate
FCS Fetal Calf Serum
G6P Glucose 6-phosphate
GAP Glyceraldehyde phosphate
Glc Glucose

8
HSQC Heteronuclear Single Quantum Coherence
Lac Lactate
MRS Magnetic Resonance Spectroscopy
MS Multiple sclerosis
NAA N-Acetyl Aspartate
NAAG N-Acetyl Aspartyl Glutamate
NAGA N-Acetyl Glucoseamine
NAT-8L N-aspartoacetyl transferase 8L
NB Neurobasal medium
NMR Nuclear Magnetic Resonance
NOE Nuclear Overhauser Effect
PEP Phosphoenol pyruvate
Sconf Conformational entropy
T1 Longitudinal relaxation time
T2 Transverse relaxation time
TCA Tricarboxylic acid
TPPI Time Proportional Phase Incrementation

9
Part I Thermal Coefficients of methyl groups within ubiquitin Introduction
The complex relationship between structure, function and dynamics strongly influences such
fundamental physiological processes as protein folding, molecular recognition, and thermal
stability. All of these procedures take place with simultaneous changes in the thermodynamic
parameters of the system, specifically the enthalpy (H) and the entropy (S). Heat capacity (Cp)
represents the connection between the temperature dependence of H and S (Gomez et
al.,1995; Prabhu and Sharp, 2005).
Δ𝐻 = �𝐶𝑝𝑑𝑇
Δ𝑆 = �𝐶𝑝𝑑(ln(𝑇))
The Cp of a protein contributes in hydration of solvent exposed surface area, covalent bonds,
electrostatic interactions, and hydrogen bonds. Furthermore, the local conformational entropy
(Sconf) of residues within a protein must also be considered. The term Sconf is directly linked to
the degrees of freedom each residue possesses within the three-dimensional protein structure.
In order to have insights into the role of local dynamics in protein stability, interpretation of
Cp is needed. This covers the dependence of Sconf on temperature. Statistical mechanics is
widely used to connect the macroscopic properties of a system such as Helmholtz free energy,
A, or the entropy, S, with the microstates (Nash, 1974),
𝑆 = −�𝜕𝐴𝜕𝑇�𝑉
and
𝐴 = −𝑘𝐵𝑇 ln𝑍𝑇𝑂𝑇

10
Where T is the absolute temperature, kB is the Boltzmann’s constant and ZTOT indicates the
partition function of the system to evaluate all possible thermodynamic properties of the
system (Yang and Kay, 1996). If all molecules of the system are decoupled from each other,
ZTOT can be written in terms of molecular partition function, Z, and the number of identical
molecules, N, as
𝑍𝑇𝑂𝑇 =𝑍𝑁
𝑁!
Where the N! factor is for correction of over counting the number of distinguishable states in
the system (Nash, 1974). Z can be decomposed into two partition functions describing
contribution of bond vector fluctuations, ZO and the remaining contribution from all other
sources, ZU (Yang and Kay, 1996)
𝑍 = 𝑍𝑈𝑍𝑂
And assuming each fluctuating bond vector is independent of all others,
𝑍 = 𝑍𝑈�𝑧(𝑗)𝑗
𝑧(𝑗) = � exp{−𝐸𝑖(𝑗)/(𝑘𝐵𝑇)}𝑖
Where z(j) is the jth bond vector partition function (with quantum mechanical approach) and
the summation is over all i energy energy states (Ei) of the bond vector. It should be noted that
the assumption of independence of bond vector motion might result in an over estimation on
partition function calculation (Akke et al, 1993).
The total entropy of the system can be calculated by (Yang and Kay, 1996)
𝑆𝑇𝑂𝑇 = 𝑁(𝑆𝑈 + 𝑆𝑂) − 𝑘𝐵 ln𝑁!
𝑆𝑂 = �𝜕{𝑘𝐵𝑇 ln 𝑧(𝑗)}
𝜕𝑇𝑗
𝑆𝑂(𝑗) =𝜕{𝑘𝐵𝑇 ln 𝑧(𝑗)}
𝜕𝑇

11
Where SO and SU are the entropy contribution to the total entropy per molecule from motions
described above for the partition functions, ZO and ZU. SO(j) indicates the component of SO
originating from bond vector j. Using the well known Boltzmann equation and z(j), the
entropy for the jth bond can be written as(Yang and Kay, 1996)
𝑆𝑂(𝑗) = −𝑘𝐵�𝑝𝑖(𝑗) ln{𝑝𝑖(𝑗)}𝑖
Where,
𝑝𝑖(𝑗) =exp{−𝐸𝑖(𝑗)/(𝑘𝐵𝑇)}∑ exp{−𝐸𝑖(𝑗)/(𝑘𝐵𝑇)}𝑖
With the classical approach the energy difference between two successive states is assumed to
be much less than the thermal energy kBT and therefore there is a continuum of states. Under
this assumption the conformational entropy can be written as (Yang and Kay, 1996)
𝑆𝑐𝑜𝑛𝑓(𝑗) = −𝑘𝐵 �𝑝(𝑞) ln𝑝(𝑞)
𝑉𝑑𝑉
Where dV=sinθ dθ dφ and the probability density function, p(q), is
𝑝(𝑞) =exp{−𝑈(𝑞)/(𝑘𝐵𝑇)}
∫ exp{−𝑈(𝑞)/(𝑘𝐵𝑇)} 𝑉 𝑑𝑉
Later in this work it will be shown, how the conformational entropy can be estimated
experimentally by study of relaxation in nuclear magnetic resonance (NMR) spectroscopy.
NMR spectroscopy is a unique and powerful tool for characterizing such local
dynamics with atomic resolution on multiple time-scales. Analysis of spin-lattice relaxation
(T1), spin-spin relaxation (T2), and steady-state nuclear Overhauser enhancements (NOE) has
been studied (Kay et al., 1989) by the “model free” formalism introduced by Lipari and Szabo
(1981a and 1981b). This allows the extraction of a generalized order parameter (S2)1 that
characterizes the amplitude of the individual bond vector motions on the ps to ns time-scale(
1 It should be noticed that the notation “S” in the order parameter 𝑆𝑎𝑥𝑖𝑠2 and in the conformational enthropy Sconf is not indicating the same concept and in order to follow the notations in the literature were kept the same.

12
Lipari and Szabo, 1981a and 1981b). The generalized order parameters satisfy the inequalitiy,
0 ≤ 𝑆2 ≤ 1, where lower values describe larger magnitude of internal motion.
Conformational entropy can be described by S2 using the population distribution of bond
vector orientations (Akke et al., 1993; Li et al., 1996; Yang and Kay, 1996) Study of
temperature dependence of S2 is possible by measurement of relaxation parameters at multiple
temperature points. The local Cp for each bond vector can be extracted from temperature
dependence of S2 (Yang et al., 1997; Mandel et al., 1996; Vugmeister et al., 2002; Vinther et
al. 2011; Seewald et al. 2000).
Methyl groups are important probes for providing fundamental insight into protein
folding, stability, and recognition. The hydrophobic core of the proteins typically
accommodates many methyl groups, which are well dispersed throughout the core and show a
wide variety of motional amplitudes (Yang et al., 1997; Lee and Wand, 2001; Lee
et al., 1997; Sharp et al., 2002, Song et al., 2007). Hence, determination of the methyl group
order parameters ( Saxis2 ) disentangles the understanding how methyl dynamics on the ps to ns
time scale are related to protein stability. Principally the Saxis2 describes the motion for axis of
symmetry (c3-symmetry) within methyl group. This axis is along the bond connecting methyl
group carbon to its previous atom and the mobility of the C-C bond is reflected in the
amplitude of Saxis2 . Deuterium relaxation studies are typically employed for obtaining of Saxis
2
of methyl groups. For these measurement the methyl groups within the protein are mainly
deuterated (-CH2D or –CHD2) (Muhandiram et al., 1995; Liao et al., 2012; Miller
et al., 2002) Utilization of cross-correlated relaxation (CCR) rate between dipolar couplings
of two CH bonds, σ,) in the methyl group for extracting Saxis2 is an alternative method to 2H
relaxation approach(Liu et al., 2003; Zhang et al., 2006).

13
Determination of Saxis2 from σ versus deuterium relaxation is essentially advantageous
in the savings in measurement time, especially important for measuring Saxis2 at many different
temperatures. In previous studies, Saxis2 calculated at one temperature point with deuterium
relaxation studies could take up to one week. The time demand in such experiments is due to
the requirement of data being acquired at two fields (Muhandiram et al., 1995). Recently a
more rapid method was developed in determining Saxis2 from the measurement of 5 relaxation
rates for -CH2D (Millet et al., 2002) and 4 relaxation rates for –CHD2 (Liao et al., 2012) to
extract the same information to approximately one day. Here, Saxis2 derived from σ can require
as little as one hour of measurement time. This method is therefore perfectly suited for
studying the temperature dependence of Saxis2 .
The temperature dependence of the methyl group order parameters is reported here
within ubiquitin. The order parameters were derived from the cross-correlated relaxation
between dipolar couplings of two CH bonds. Thermal coefficients are calculated from these
experiments and characterizing this temperature dependence, specifically the characteristic
thermal coefficient Λ and the local heat capacity Cp. Furthermore, we analyze and compare
the distribution of methyl group thermal coefficients within ubiquitin, illustrating the
relatively high thermostability of the N-terminal region of this protein.

14
Theory:
NMR spectroscopy is a powerful tool for a variety of applications in chemistry, physics,
biology and many other disciplines. The area of application of NMR spectroscopy is divided
into three parts:
1. NMR-spectroscopy of liquids and solutions (high resolution NMR) in chemistry,
structural biology and metabolomics
2. Solid state NMR spectroscopy in chemistry, structural biology and material sciences
3. NMR spectroscopy and imaging of more or less intact living species (MRI: Magnetic
Resonance Imaging and MRS: Magnetic Resonance Spectroscopy) in medicine,
physiology and biology
The first approach is the main branch for study of the structure and dynamics of molecules in
atomic resolution. The second direction characterizes the molecules in solid state, which in
contrast with X-Ray crystallography need not be in crystalline form. The third area, especially
tomography, has a huge impact in medicine for investigation of soft tissue (brain, spinal cord
as widely used in diagnostics and other organs). In this thesis the high resolution NMR
spectroscopy was utilized to study the dynamics of proteins (Part I) and to study
metabolomics within cortical neurons (Part II).
Depending on which parameter (e.g. chemical shift, scalar coupling and relaxation etc.)
being investigated, different kind of information (e.g. constitution, stereochemistry and
dynamics etc.) can be extracted about the molecule of interest.

15
Magnetic resonance phenomenon:
There are almost 100 nuclei isotopes which possess magnetic moment and called nuclear spin.
For the Spin �� there is a proportional magnetic momentum µ� , and the gyromagnetic ratio, γ, is
the proportionality constant (µ� = γℏ��). The magnetic moment can orient itself along a
magnetic field like a bar magnet since the parallel orientation of 𝑩�� and µ� is energetically
favored. The nuclear spins are allowed to accept just limited number of orientations, namely
2I+1 states. For example a spin with I=1/2 there are 2*1/2+1=2 states available. If the energy
of one spin is observed in an external magnetic field along z axis, i.e. 𝑩�� =B0𝒆� z, then we have
𝐸 = −��𝐵� = −𝛾ℏ𝐼𝐵� = −𝛾ℏ𝐼𝑧𝐵0
where B, the external magnetic field, is conventionally set parallel to the z-axis. For spin 12 the
energy favored state is called α state with ⟨𝐼𝑧⟩ = 𝑚𝑧 = 12 and the higher energy level with
⟨𝐼𝑧⟩ = 𝑚𝑧 = −12 called β state (Fig. I). The NMR spectroscopy utilizes the energy difference
between these two energy levels to generate spectral transitions. The frequency of the
transition is given by
∆𝐸 = ℏ𝜔 = ℏ𝛾𝐵0 or 𝜈 = 𝛾𝐵02𝜋
This is the fundamental equation for resonance in the NMR spectroscopy. The NMR spectrum
consists of the frequencies of transitions and their intensities.
B0

16
For the proton 1H the energy difference in a magnetic field strength of 14.09 T and
gyromagnetic ratio of 2.6751×10⁸ Hz T-1 is given by Δ𝐸 = 𝑁𝐴𝛾𝐵0ℏ = 240 𝑚𝐽/𝑚𝑜𝑙. This
energy is in comparison with the thermal energy at the room temperature 𝑅𝑇 = 2.3 𝑘𝐽/𝑚𝑜𝑙,
four orders of magnitude smaller. Considering Boltzmann distribution, it can be calculated
that at room temperature just one molecule out of 20000 is being observed. This shows that
NMR is principally a rather non-sensitive technique. The sensitivity, however, can be
increased by measurement at higher external fields, using nuclei with high gyromagnetic
ratio, preparing probes with possible high concentration and lowering the noise level by
employing so called cryogenic probe heads.
Measurement procedure in NMR spectroscopy
According to the fundamental resonance condition in NMR spectroscopy: 𝜈 = 𝛾𝐵02𝜋
, an
irradiation of a fluctuating magnetic field, like a radio frequency, with the corresponding
frequency is absorbed by spins to equate the population of both energy states, which
corresponds to rotation of the magnetization from z-axis to the transverse plane. The
transverse magnetization, M+(t), in presence of the static magnetic field experiences a torque,
which is equal to the time derivative of the angular momentum (Cavangagh et al., 2007). This
torque leads the transverse magnetization, M+(t), to ratate about the z-axis and observability
of the signal.

17
Equation of motion of magnetization: Bloch equation
The interaction of the external magnetic fields,𝐵� ,on the generated magnetization from spins
in B0 has been studied by Felix Bloch, who developed equation of motion for magnetization
that is called Bloch equation after him:
���� =𝑑𝑀��𝑑𝑡
=𝑑𝑑𝑡�𝑀𝑥𝑀𝑦𝑀𝑧
� = 𝛾�𝑀�� × 𝐵� � − Γ(𝑀�� − 𝑀0𝑒𝑧)
The equation of motion for magnetization is an Euler circular motion equation, which is
extended with a relaxation term Γ. The relaxation tern describes the return of magnetization to
the Boltzmann equilibrium (M0),
Γ =
⎝
⎜⎛
1𝑇2� 0 0
0 1𝑇2� 0
0 0 1𝑇1� ⎠
⎟⎞
where T1 and T2 are longitudinal and transversal relaxation times respectively.
Precession of transverse magnetization and rotating frame reference system
For a Boltzmann magnetization in the external field along z axis, if we ignore the relaxation at
this point, we have
���� = 𝛾𝑀0𝑒𝑧 × 𝐵0𝑒𝑧 = 0
which means that the Boltzmann magnetization is time invariant and stays conserved. In case
of the transverse magnetization containing Mx and My, however, there are changes with the
time. Without relaxation we can write for the transverse magnetization (𝐵� = 𝐵0𝑒𝑧; 𝛾𝑀0 =
𝜔𝐿 = 2𝜋𝜈𝐿; ωL is Larmor circular frequency) in a component wise notation with 𝑀�� =
𝑀𝑥𝑒𝑥 + 𝑀𝑦𝑒𝑦 + 𝑀𝑧𝑒𝑧:
𝑑𝑀𝑥
𝑑𝑡= 𝛾[𝑀�� × 𝐵0𝑒𝑧]𝑥 = 𝛾𝐵0𝑀𝑦

18
𝑑𝑀𝑦
𝑑𝑡= 𝛾[𝑀�� × 𝐵0𝑒𝑧]𝑦 = −𝛾𝐵0𝑀𝑥
By differentiation of both equations and substitution we obtain
𝑑2𝑀𝑥
𝑑𝑡2= −(𝛾𝐵0)2𝑀𝑥
𝑑2𝑀𝑦
𝑑𝑡2= −(𝛾𝐵0)2𝑀𝑦
These equations are the classical oscillation equation and their solution is (with 𝜔𝐿 = 𝛾𝐵0),
𝑀𝑥(𝑡) = 𝑀𝑥(0) cos(𝜔𝐿𝑡) −𝑀𝑦(0)sin (𝜔𝐿𝑡)
𝑀𝑦(𝑡) = 𝑀𝑥(0) sin(𝜔𝐿𝑡) + 𝑀𝑦(0)cos (𝜔𝐿𝑡)
Both equations can be written in a matrix notation,
�𝑀𝑥(𝑡)𝑀𝑦(𝑡)� = �
cos(𝜔𝐿𝑡) −sin (𝜔𝐿𝑡)sin(𝜔𝐿𝑡) cos (𝜔𝐿𝑡)
� �𝑀𝑥(0)𝑀𝑦(0)�
The matrix which multiplied by the vector �𝑀𝑥(0)𝑀𝑦(0)�, is called rotation matrix with the rotation
angle of 𝜔𝐿𝑡. The magnetization rotates about the B0 field with 𝜔𝐿 = 𝛾𝐵0. This precession
with the Larmor frequency is valid for all types of nuclei in the same manner. Due to the
different chemical environment (electronic shielding) about the nuclei, they feel the external
magnetic field slightly different 𝐵0(1 − 𝜎𝑖𝑠𝑜𝑖 ) and their corresponding circular frequency
deviates from Larmor frequency, i.e. 𝜔𝑖 = 𝛾𝐵0(1 − 𝜎𝑖𝑠𝑜𝑖 ), where 𝜎𝑖𝑠𝑜𝑖 is the isotropic
chemical shift of nucleus i in ppm. In order to separate these small deviations from the
Larmor frequency in MHz order and to observer the small effects of chemical shift in clearly,
a rotating coordination system is introduced, which rotates with the constant circular
frequency of 𝜔0. The rotation frequency should be slightly different from precession
frequency of observed nuclei 𝜔𝑖 (i.e. 𝜔0 is in MHz and 𝜔𝑖 − 𝜔0 = Ω in kHz). The frequency
of rotating coordination system (rotating frame) is mainly not identical to the Larmor

19
frequency 𝜔𝐿 = 𝛾𝐵0), since the chemical shifts are distributed unsymmetrical about the 𝜔𝐿
and the 𝜔0should be in the centre of chemical shifts span.
The Bloch equation can be rewritten in the rotating frame (Cavanagh et al., 2007),
𝑑𝑀��𝑑𝑡
= 𝛾(𝐵0𝑒𝑧(1− 𝜎) −𝜔0
𝛾𝑒𝑧) × 𝑀�� − Γ(𝑀�� − 𝑀0𝑒𝑧)
And again in absence of relaxation we can write the solution for the Bloch equation in the
rotating frame of reference with analogy to the static laboratory frame as
�𝑀𝑥(𝑡)𝑀𝑦(𝑡)� = �
cos(Ω𝑖𝑡) −sin (Ω𝑖𝑡)sin(Ω𝑖𝑡) cos (Ω𝑖𝑡)
� �𝑀𝑥(0)𝑀𝑦(0)�
Continuous wave irradiation in rating frame to generate to transverse
magnetization
The precession of transverse magnetization was discussed in the previous section and now the
generation of transverse magnetization using a radio frequency (r.f.) irradiation will be
described. Here we observe the irradiation of a radiofrequency with the carrier frequency of
𝜔0and field strength of 2B1 during a finite time interval and in the transverse plane. In the
laboratory frame this corresponds to an additional field (2𝐵1𝑒𝑥 cosω0t, where irradiation is
applied along the x axis). This field can be separated into two components
2𝐵1𝑒𝑥𝐿 cosω0t = 𝐵1(𝑒𝑥𝐿 cosω0t + 𝑒𝑦𝐿 sinω0t ) + 𝐵1(𝑒𝑥𝐿 cos(−ω0t) + 𝑒𝑦𝐿 sin(−ω0t) )
The first and second components represent two vectors, which rotate with the 𝜔0and −𝜔0
about the z axis respectively. In the rotating frame the component that rotates with 𝜔0
represents a fixed component with the field strength of 𝐵1𝑒𝑥. The second component rotates
with −2𝜔0 in the rotating frame and the total B1 field can be described as
𝐵1𝑒𝑥 + 𝐵1(𝑒𝑥 cos(−2ω0t) + 𝑒𝑦 sin(−2ω0t))

20
The counter rotating component changes its sign at e.g. 𝜔02𝜋
=500 MHz each 0.5 ns and has no
significant effective on the magnetization. Therefore the remaining component is the static
component 𝐵1𝑒𝑥. The effective Bloch equation in the rotating frame is
𝑑𝑀��𝑑𝑡
= 𝛾 �𝐵0𝑒𝑧(1− 𝜎) −𝜔0
𝛾𝑒𝑧 + 𝐵1𝑒𝑥� × 𝑀�� − Γ�𝑀�� − 𝑀0𝑒𝑧�
= (Ω𝑒𝑧 + 𝛾𝐵1𝑒𝑥) × 𝑀�� − Γ�𝑀�� − 𝑀0𝑒𝑧�.
In the on-resonance case (𝜔0 = 𝜔𝑖; Ω𝑖 = 0) within a rotating coordinate system the z
components of the field vanishes. By neglecting relaxation we have
𝑀�� = 𝛾(𝐵1𝑒𝑥 × 𝑀�� ).
The magnetization rotates about the axis of the radiofrequency field. If the applied field is
along the x axis, the z magnetization starts to rotate about the x axis with 𝜔1 = 𝛾𝐵1,
𝑀𝑦(𝑡) = 𝑀𝑦(0) cos(𝜔1𝑡) −𝑀𝑧(0)sin (𝜔1𝑡)
𝑀𝑧(𝑡) = 𝑀𝑦(0) sin(𝜔1𝑡) + 𝑀𝑧(0)cos (𝜔1𝑡).
One pulse experiment
A 90° pulse is applied on a magnetization (e.g. Boltzmann magnetization 𝑀𝑧(0) =
𝑀0; 𝑀𝑥,𝑦(0) = 0), if the duration of applied field, τ , is set, so that the 𝜔1𝜏 = 𝜋2 . After the
pulse we have
𝑀𝑦(𝜏) = −𝑀𝑧(0) sin �𝜋2� = −𝑀0
𝑀𝑧(𝜏) = 𝑀𝑦(0) sin �𝜋2� = 0.
From now on in the real case of experiment the influence of relaxation cannot be ignored
anymore. It is important that 𝜔1 is much larger than 1 𝑇1� and 1 𝑇2� in order to have no
influence from relaxation during the pulse and the M0 is fully transferred onto the transverse
plane. After the applied field is turned off, this transverse magnetization generated by 90°
21
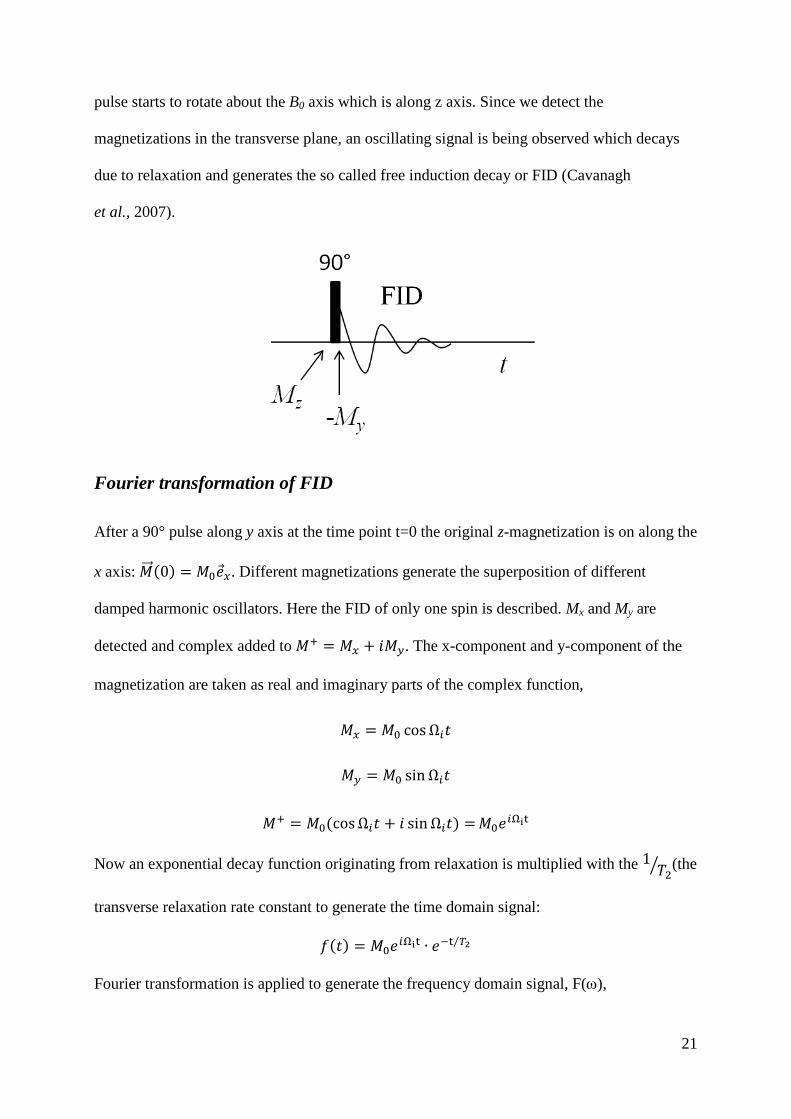
pulse starts to rotate about the B0 axis which is along z axis. Since we detect the
magnetizations in the transverse plane, an oscillating signal is being observed which decays
due to relaxation and generates the so called free induction decay or FID (Cavanagh
et al., 2007).
Fourier transformation of FID
After a 90° pulse along y axis at the time point t=0 the original z-magnetization is on along the
x axis: 𝑀�� (0) = 𝑀0𝑒𝑥. Different magnetizations generate the superposition of different
damped harmonic oscillators. Here the FID of only one spin is described. Mx and My are
detected and complex added to 𝑀+ = 𝑀𝑥 + 𝑖𝑀𝑦. The x-component and y-component of the
magnetization are taken as real and imaginary parts of the complex function,
𝑀𝑥 = 𝑀0 cosΩ𝑖𝑡
𝑀𝑦 = 𝑀0 sinΩ𝑖𝑡
𝑀+ = 𝑀0(cosΩ𝑖𝑡 + 𝑖 sinΩ𝑖𝑡) =𝑀0𝑒𝑖Ωit
Now an exponential decay function originating from relaxation is multiplied with the 1 𝑇2� (the
transverse relaxation rate constant to generate the time domain signal:
𝑓(𝑡) = 𝑀0𝑒𝑖Ωit ∙ 𝑒−t 𝑇2⁄
Fourier transformation is applied to generate the frequency domain signal, F(ω),

22
𝐹(𝜔) = � 𝑒−𝑖𝜔𝑡 ∙+∞
0𝑀0𝑒𝑖Ωit ∙ 𝑒−t 𝑇2⁄ 𝑑𝑡
= 𝑀0𝑒−𝑖(𝜔−Ω)𝑡−𝑡/𝑇2
−𝑖(𝜔 − Ω) − 1/𝑇2�0
+∞
= 𝑀01
𝑖(𝜔 − Ω) + 1/𝑇2
= 𝐿(𝜔) = 𝐴(𝜔) + 𝑖𝐷(𝜔)
The real part A(ω) and the imaginary part D(ω) of the Lorentz line are depicted below.
𝐴(𝜔) = 𝑀01/𝑇2
(𝜔 − Ωi)2 + ( 1𝑇2
)2
𝐷(𝜔) = −𝑀0𝜔 − Ωi
(𝜔 − Ωi)2 + ( 1𝑇2
)2
The absorption part has a maximum at the resonance frequency, i.e. Ωi.The intensity is scaled by
the initial magnetization 𝑀0 as well as T2. The line width at the half maximum is 2 𝑇2� ( 1 𝜋𝑇2� in
frequency). In NMR spectroscopy absorption lines are mainly used as they decay slower than
dispersion lines by distancing from resonance frequency. This leads to less overlapping when
more signals are being studied.

23
Here, in order to complete this section, the time variation of z magnetization is described.
Immediately after the 90° pulse there is no longitudinal magnetization: 𝑀𝑧(𝑡 = 0) = 0.
Substituting in the Bloch equation for the z-component in the rotating frame,
𝑑𝑀𝑧
𝑑𝑡= −Γz(𝑀𝑧 −𝑀0)
This differential equation can be solved easily:
𝑀𝑧(𝑡) = 𝑀0(1 − 𝑒−Γzt)
It means that the z magnetization returns to the Boltzmann equilibrium with a rate constant Γz
That is valid for the definition of the longitudinal T1 time: Γz = 1T1� .
Relaxation
The fluctuating magnetic interactions of the observed spin cause the relaxation and can have
various origins, e.g.
1. Paramagnetic particles in the sample (O2, salts etc.)
2. Intermolecular dipolar coupling (the most important mechanism of relaxation)
3. Chemical shift anisotropy (CSA), which is more pronounced in higher magnetic
fields (B0) and in specific nuclei (19F, 31P)
4. Quadrupolar coupling (particles with spin I=1 or coupled to spins with 𝐼 ≥ 1)
5. Scalar coupling
We assume that in a two level scheme there is a fluctuating magnetic interaction which affects
both energy levels. According to the Heisenberg uncertainty principle (∆𝐸 × ∆𝑡 ≤ ℏ) the
lifetime of a transition, ∆𝑡 ≤ ℏ∆𝐸
= 1∆𝜔
.It means that the lifetime is limited by the magnitude of
the fluctuation of magnetic interaction (Abragam, 1961).
To understand the relaxation phenomenon two central concepts, 1) spectral density function
and 2) double commutators, should be discussed here

24
Spectral density function
Transitions between the spin levels after a perturbation like an excitation pulse return to the
thermodynamically favored distribution. As described above this mechanism is characterized
by the longitudinal relaxation time, T1.The second process deals with the transverse
magnetization or coherences, which are absent in the Boltzmann equilibrium. The decay of
transverse magnetization is determined by the transversal relaxation time, T2- A transition
between the energy levels can be succeeded if there is a matched frequency with the energy
difference from an external time variant perturbation. Therefore a so called spectral power
density or spectral density function of the transition frequency is important for its relaxation.
It shows how much electromagnetic power for a specific frequency is available. Relaxation
can occur not only via detectable single quantum transitions, but also through non detectable
double or zero quantum transitions. For calculation of the spectral density function we need
first to define the correlation function, G(t), of time variant magnetic interactions h(t
(Abragam, 1961):
𝐺(𝑡) = ∫ ℎ1(𝑡′) ∙+∞−∞ ℎ2(𝑡′ + 𝑡)𝑑𝑡′.
Where the correlation function indicates the amplitude of the magnetic interaction h1(t’) with
itself (auto correlation; h1(t’)=h2(t’)) or with another magnetic interaction h2(t+t’) which
implicates the cross correlated relaxation. Since most the magnetic interactions such as the
chemical shift anisotropy and dipolar coupling are determined by the orientation of molecule
in the magnetic field, the correlation time which measures the decorrelation of the values of
those magnetic interactions is important for relaxation and is defined by the reorientation time
constant of the molecule (𝜏𝑐). The correlation function for all cases which being described
here has the form (Abragam, 1961; Cavanagh et al., 2007)
𝐺(𝜏) = � 𝑌2𝑚[Ω(𝜏)]𝑌2𝑚[Ω(𝑡 + 𝜏)]�����������������������������2
𝑚=−2

25
Where 𝑌20 is the modified second-order spherical harmonics (see table 1) and Ω(𝑡) =
{𝜃(𝑡),𝜙(𝑡)} are the polar angels. The correlation function for isotropic rotational diffusion
which we will use in all cases of the thesis has the form (Abragam, 1961; Cavanagh et al.,
2007)
𝐺(𝑡) =15𝑒−|𝑡| 𝜏𝑐⁄
where 𝜏𝑐 is the correlation time for the decaying function G(t). The Fourier transformation of
the correlation function, G(t) is the spectral density function, J(ω), which has a Lorentzian
line shape (Abragam, 1961),
𝐽(𝜔) =2𝜏𝑐
5(1 + 𝜔2𝜏𝑐2)
For the value of spectral density function it is important to know, with which frequency the
transitions can be generated (see table 1) in the spin system, e.g. (in system of I and S)
• 0 or 𝜔𝐼 − 𝜔𝑆 (zero quantum)
• 𝜔𝐼 or 𝜔𝑆 (single quantum)
• 2𝜔𝐼, 2𝜔𝑆 or 𝜔𝐼 + 𝜔𝑆 (double quantum)

26
Internal motion
There are several models to describe the internal motion of molecules. The most common
model developed by Lipari and Szabo (1981a and 1981b) assumes that each C-H or N-H
vector has a 𝜏𝑐 independent motion. This kind of motion assumed to be very fast and the
spectral density function can be changed into
𝐽(𝜔) = 𝑆2𝐽(𝜔, 𝜏𝑐) + (1 − 𝑆2)𝐽(𝜔, 𝜏𝑒′ )
1𝜏𝑒′
=1𝜏𝑒
+1𝜏𝑐
where 𝑆2 is the so called order parameter, 𝜏𝑐 is the global correlation time and 𝜏𝑒is the
correlation time for the fast motion. The order parameter, 𝑆2, takes the maximum value, 1, in
absence of local motion and is equal zero for freely mobile vector. We can also suppose that
𝜏𝑒′ is very small compared to 𝜏𝑐, therefore the 𝜔-dependence of 𝐽(𝜔, 𝜏𝑒′ ) vanishes and we have
1𝜏𝑒′
= 1𝜏𝑒
. To estimate the value of order parameter it is essential to experimentally measure
different relaxation parameters (e.g. T1, T2, NOE and cross correlated relaxation etc.).
Double commutator
The spectral density function gives the frequency of the transition in the spin system, which is
excited by the fluctuating magnetic interactions. Determination of transitions that are being
relaxed by fluctuating magnetic interaction can be described by perturbation theory. This
depends on the transition moment, which is generated by the perturbing operator between the
corresponding spin states. Using Liouville von Neumann equation, (�� = −𝑖ℏ[𝐻�,𝜌]; 𝜌 is
density matrix and 𝐻� is interaction Hamiltonian), the time evolution of density matrix can be
described. Here the time evolution of the density matrix and the transitions made by
relaxation arises from double commutation of the perturbing Hamiltonian operator. The

27
excitable transitions can be determined by substitution in the corresponding double
commutator. Thereby we obtain from the initial state ρ the final state ρ’ by creating of the
double commutator from ρ time dependent perturbing Hamiltonian 𝐻�𝑖𝑛𝑡(𝑡) and 𝐻�𝑖𝑛𝑡(𝑡′)
(Abragam, 1961; Cavanagh et al., 2007)
�� = −�𝐻�𝚤𝑛𝑡(𝑡),���������� �𝐻�𝚤𝑛𝑡(𝑡 − 𝑡′)���������������,𝜌�� = 𝜌′
Interaction Hamiltonian for dipolar and CSA interactions
The main magnetic interactions in relaxation in liquid state NMR are dipolar couplings and
chemical shift anisotropy, which can be utilized to extract structural as well as dynamic
information.
The Hamiltonian for the dipolar coupling is (Schwalbe et al., 2001)
𝐻�𝑘𝑙𝐷𝐷 = 𝑏𝑘𝑙 �31𝑟𝑘𝑙2
�𝐼𝑘 ∙ 𝑟𝑘𝑙��𝐼𝑙 ∙ 𝑟𝑘𝑙� − 𝐼𝑘𝐼𝑙�
= 𝑏𝑘𝑙 � 𝐹𝑘𝑙(−𝑞)(𝜃𝑘𝑙,𝜙𝑘𝑙)��𝑘𝑙
(𝑞)+2
𝑞=−2
�𝐼𝑘, 𝐼𝑙�
𝑏𝑘𝑙 = −𝜇0𝛾𝑘𝛾𝑙ℏ4𝜋𝑟𝑘𝑙3
Where 𝛾𝑘 and 𝛾𝑙 indicate the gyromagnetic ratio of the nuclei k and l, ℏ the reduced Planck
constant, and 𝑟𝑘𝑙 the distance between the two nuclei. The angles 𝜃𝑘𝑙 and 𝜙𝑘𝑙 describe the
orientations of the vector 𝑟𝑘𝑙 with respect to the magnetic field. Using table 1, 𝐹𝑘𝑙(−𝑞)(𝜃𝑘𝑙,𝜙𝑘𝑙),
the time dependent spherical harmonics function and ��𝑘𝑙(𝑞) denote the second rank tensor
operator can be substituted.

28
Tensor Operators for the Dipolar Interaction
304 kl
lkkl
rb
π
γγµ −=
Tensor Operators for the CSA Interaction
0||31 )( Bb kk γσσ ⊥−=
Modified Spherical Harmonics Frequency
ˆ A kl(q )( ˆ I k, ˆ I l) ˆ A k
(q )( ˆ I k ) ),(),,( )()( φθφθ qkl
qk FF ωq
-2 −−lk II ˆˆ
83 - ( )φθ i2expsin2
23 + )ˆ()ˆ( lk II ωω +
-1 −lzk II ˆˆ
,83 - ( )φθθ i+expcossin6 ω( ˆ I l)
-1 zlk II ,83 ˆˆ− −
kI83 ( )φθθ i+expcossin6 ω( ˆ I k )
0 ˆ I k ,z
ˆ I l, z ˆ I k ,z 1cos3 2 −θ 0
0 ( )+−−+ + lklk IIII ˆˆˆˆ41 - 1cos3 2 −θ ω( ˆ I k ) −ω ( ˆ I l)
1 zlk II ,83 ˆˆ+ +
kI83 ( )φθθ i−expcossin6 -ω( ˆ I k )
1 +lzk II ˆˆ
,83 - ( )φθθ i−expcossin6 -ω( ˆ I l)
2 ++lk II ˆˆ
83 - ( )φθ i2expsin2
23 − )ˆ()ˆ( lk II ωω −−
Table 1: Tensor Operators in the Rotating Frame and modified Spherical Harmonics for the dipolar and CSA Interaction (from Schwalbe et al., 2001). The calibration has been chosen such that
2( ) ( )
0 0
1 4sin ( , ) ( , )4 5
q qk kld d F F
π π
θ φ θ φ θ φπ
− =∫ ∫ and therefore q independent.
The Hamiltonian for the CSA of nucleus k in the principle axis frame (PAS) of chemical shift
anisotropy tensor is given by[t3]
𝐻�𝑘𝐶𝑆𝐴,𝑃𝐴𝑆 = 𝛾𝑘 � 𝐵𝑖𝜎��𝑖𝑖𝑘𝐼𝑘,𝑖
𝑖=𝑥,𝑦,𝑧
= 𝛾𝑘𝜎𝑥𝑥𝑘 + 𝜎𝑦𝑦𝑘 + 𝜎𝑧𝑧𝑘
3𝐵� 𝐼𝑘 +
13𝛾𝑘(𝜎𝑥𝑥𝑘 − 𝜎𝑧𝑧𝑘 ) × �2𝐼𝑘,𝑥𝐵𝑥 − 𝐼𝑘,𝑦𝐵𝑦 − 𝐼𝑘,𝑧𝐵𝑧�
+13𝛾𝑘�𝜎𝑦𝑦𝑘 − 𝜎𝑧𝑧𝑘 � × �2𝐼𝑘,𝑦𝐵𝑦 − 𝐼𝑘,𝑥𝐵𝑥 − 𝐼𝑘,𝑧𝐵𝑧�

29
Where 𝐵𝑖 indicate the components of the external static field 𝐵0in the PAS. In the laboratory
frame (LF) the CSA Hamiltonian can be written by spherical harmonics 𝐹𝑘𝑙(−𝑞)(𝜃𝑘𝑙 ,𝜙𝑘𝑙) and
spin tensor operators ��𝑘𝑙(𝑞). The corresponding expressions are listed in the table 1 and the
Hamiltonian in the LF is given by (Schwalbe et al., 2001)
𝐻�𝑘𝐶𝑆𝐴,𝐿𝐹 = 𝑏𝑘,𝑥�𝐹𝑘
(𝑞)�𝜃𝑘,𝑥,𝜙𝑘,𝑥���𝑘(𝑞)
+1
𝑞=1
�𝐼𝑘� + 𝑏𝑘,𝑦�𝐹𝑘(𝑞)�𝜃𝑘,𝑦,𝜙𝑘,𝑦���𝑘
(𝑞)+1
𝑞=1
�𝐼𝑘�
With
𝑏𝑘,𝑥 =13𝛾𝑘𝐵0(𝜎𝑥𝑥𝑘 − 𝜎𝑧𝑧𝑘 ) 𝑎𝑛𝑑 𝑏𝑘,𝑦 =
13𝛾𝑘𝐵0�𝜎𝑦𝑦𝑘 − 𝜎𝑧𝑧𝑘 �
And in case of an axially symmetric CSA tensor 𝜎𝑥𝑥𝑘 = 𝜎𝑦𝑦𝑘 , the equation is given by
𝐻�𝑘𝐶𝑆𝐴,𝐿𝐹 = 𝑏𝑘�𝐹𝑘
(𝑞)(𝜃𝑘,𝜙𝑘)��𝑘(𝑞)
+1
𝑞=1
�𝐼𝑘�
𝑏𝑘 =13𝛾𝑘𝐵0�𝜎∥𝑘 − 𝜎⊥𝑘�
Where 𝜃𝑘 and 𝜙𝑘 are the polar angles of the z(∥) principal axis of the CSA tensor in the
laboratory frame.
Cross correlated relaxation (CCR)
Cross correlated relaxation is originated from the interference of two anisotropic spin
interactions which are averaged in a correlated way by the reorientation of the molecule in the
solution (Schwalbe et al., 2001). Second rank tensors are used to describe the anisotropic
interactions quantitatively. The CCR rate describes the orientation of two interactions with
respect to each other and the dynamics of the investigated spin system in comparison with the

30
overall correlation time of molecule. One of the ways to study the CCR in the solution NMR
spectroscopy is to investigate the different line broadening of a multiplet signal.
As explained in the previous section the main magnetic interactions which cause relaxation in
the liquid NMR spectroscopy are dipolar coupling and CSA. The operator Γ��𝑠𝑝𝑖𝑛(𝑠),𝑠𝑝𝑖𝑛(𝑠)𝑖𝑛𝑡,𝑖𝑛𝑡
represents the cross correlated relaxation between two interactions of two spins or bonds. For
example Γ��𝐼𝑘𝐼𝑙,𝐼𝑚𝐼𝑛𝐷𝐷,𝐷𝐷 indicates the CCR between dipole-dipole interaction tensors for the vector
connecting 𝐼𝑘 and 𝐼𝑙 as well as the vector connecting 𝐼𝑚 and 𝐼𝑛, respectively.
Using the Liouville von Neumann equation and double commutation rule we have
�� = −𝑖�𝐻�0,𝜌(𝑡)� −�Γ��𝑉,𝑊𝑉,𝑊
(𝜌(𝑡) − 𝜌(0))
The general form of relaxation super operator is (Schwalbe et al., 2001)
Γ��𝑉,𝑊 𝜌(𝑡) = 𝑏𝑉𝑏𝑊����𝑉(−𝑞)
𝑞
, ���𝑊(+𝑞),𝜌(𝑡)�� 𝑗𝑉,𝑊
𝑞 (𝜔𝑞)
where magnetic interactions as source of relaxation are referred by V and W indices. The term
𝑗𝑉,𝑊𝑞 (𝜔𝑞) refers to the spectral density function (Schwalbe et al., 2001).
𝑗𝑉,𝑊𝑞 �𝜔𝑞� = � 𝑑𝜏
∞
0 𝐹𝑉
(𝑞)(𝑡)𝐹𝑊(−𝑞)(𝑡 + 𝜏)������������������������� exp(−𝑖𝜔𝑞𝜏)
CCR

31
In the next chapter we show how to measure CCR rate of two dipolar interactions between
two C-H bond vectors within a methyl group. Afterwards estimation of internal motion for
methyl groups will be describes using this CCR rates.

32
Results and Discussion2
Methyl group cross-correlated relaxation
Elimination of decoupling pulse on 1H during 13C-chemical shift evolution in 2D constant
time 13C, 1H HSQC measurements leads to splitting of the methyl group 13C signal into a
quartet(Kay et al., 1992; Müller et al., 1987). The peaks in the quartet are separated by the
scalar coupling constant (J) for C-H bonds in a methyl group (JCH ~ 125 Hz). The four
coherences are represented by each peak within the quartet, i.e. 1 2 3xC H H Hα α α ,
( )1 2 3 1 2 3 1 2 3xC H H H H H H H H Hβ α α α β α α α β+ + , ( )1 2 3 1 2 3 1 2 3xC H H H H H H H H Hβ β α α β β β α β+ +
and ( )1 2 3xC H H Hβ β β and their intensity ratio ( ) is 3:1:1:3 ignoring the
contribution of relaxation (Kay et al., 1992; Tugarinov et al., 2003). With the involvement of
the transverse relaxation rate ( ) (Kay and Torchia, 1991), the intensities can be expressed
as:
(1)
where ∆ is the length of the constant time period.
By considering the dipolar coupling and chemical shift anisotropy (CSA), can be
written as (Liu et al., 2003; Kay and Torchia, 1991):
2 This part was done partly by the author and partly by Dr. T. Michael Sabo. All measurements, processing, spectral analysis, calculation of CCR rates and corresponding errors were done by author. Extraction of order parameters (S2) and their error analysis were done together. All temperature dependence analysis, calculation of thermal coefficients and corresponding error estimation were done by Dr. T. M. Sabo.
Iα 3 : I
α 2 β: I
αβ2 : Iβ 3
R2, Ii
Iα 3 ∝ 3e
− R2,Iα 3
∆
Iα 2 β
∝ e− R2,I
α2β∆
Iαβ2 ∝ e
− R2,Iαβ2 ∆
Iβ 3 ∝ 3e
− R2,Iβ3 ∆
,
R2, Ii
33
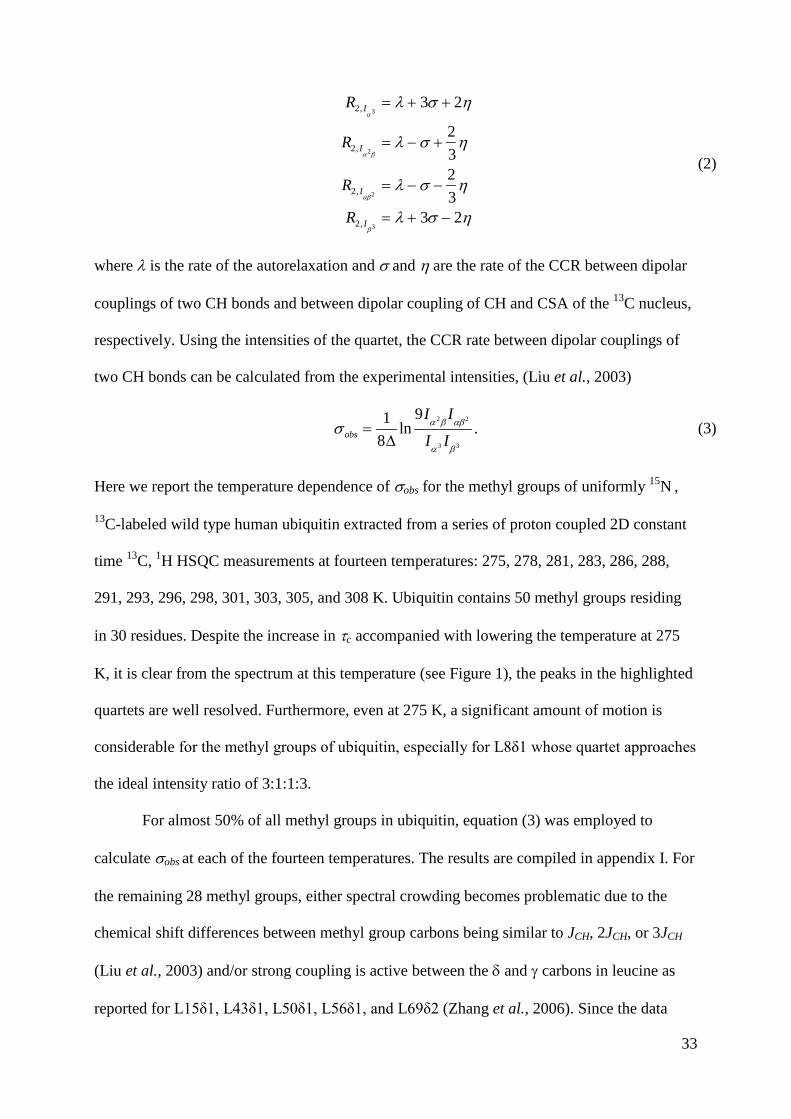
(2)
where λ is the rate of the autorelaxation and σ and η are the rate of the CCR between dipolar
couplings of two CH bonds and between dipolar coupling of CH and CSA of the 13C nucleus,
respectively. Using the intensities of the quartet, the CCR rate between dipolar couplings of
two CH bonds can be calculated from the experimental intensities, (Liu et al., 2003)
(3)
Here we report the temperature dependence of σobs for the methyl groups of uniformly 15N ,
13C-labeled wild type human ubiquitin extracted from a series of proton coupled 2D constant
time 13C, 1H HSQC measurements at fourteen temperatures: 275, 278, 281, 283, 286, 288,
291, 293, 296, 298, 301, 303, 305, and 308 K. Ubiquitin contains 50 methyl groups residing
in 30 residues. Despite the increase in τc accompanied with lowering the temperature at 275
K, it is clear from the spectrum at this temperature (see Figure 1), the peaks in the highlighted
quartets are well resolved. Furthermore, even at 275 K, a significant amount of motion is
considerable for the methyl groups of ubiquitin, especially for L8δ1 whose quartet approaches
the ideal intensity ratio of 3:1:1:3.
For almost 50% of all methyl groups in ubiquitin, equation (3) was employed to
calculate σobs at each of the fourteen temperatures. The results are compiled in appendix I. For
the remaining 28 methyl groups, either spectral crowding becomes problematic due to the
chemical shift differences between methyl group carbons being similar to JCH, 2JCH, or 3JCH
(Liu et al., 2003) and/or strong coupling is active between the δ and γ carbons in leucine as
reported for L15δ1, L43δ1, L50δ1, L56δ1, and L69δ2 (Zhang et al., 2006). Since the data
R2, Iα 3
= λ + 3σ + 2η
R2, Iα2β
= λ − σ +23
η
R2, Iαβ2
= λ − σ −23
η
R2, Iβ3
= λ + 3σ − 2η
σ obs =1
8∆ln
9Iα 2 β
Iαβ2
Iα 3 I
β 3
.

34
should be covered in all temperature points, we only analyzed methyl groups whose quartets
were not overlapped with other methyl group quartets over the entire temperature range (275
K to 308 K).
Figure 1. Constant time 13C,1H HSQC spectrum of
uniformly 15N,13C -labeled human wild type ubiquitin
measured at frequency of 700 MHz (for 1H) and a
temperature of 275 K. The ubiquitin concentration was 3.6
mM in 90%/10% H2O/D2O, with 50 mM sodium phosphate
at pH 6.8, 100 mM NaCl and 0.1% NaN3. The constant
time length and INEPT delays were set to 27.8 and 2 ms,
respectively. The spectrum was acquired with 1024 and
128 complex points in the direct (t2) and indirect (t1)
dimensions, respectively, with 8 scans per t1 increment. The
t1, max and t2, max were set to 24.3 ms and 113 ms,
respectively. Frequency discrimination for the indirectly
detected dimension was done with the States-TPPI scheme.
The raw data was processed with NMRPipe software.44 1D
slices of selected quartets are shown together with the
corresponding coherences for each peak in the multiplet
(Sabo et al., 2012).
It is clear from the range of σobs at each temperature that the methyl groups exist in a
wide array of environments. Changes in the mobility of the methyl groups contribute to the
apparent differences in σobs. It should be considered that studying the temperature dependence
of methyl group dynamics with deuterium relaxation studies (Muhandiram et al., 1995; Liao
et al., 2012; Millet et al., 2002; Lee et al., 1999), enables many more methyl groups to be
analyzed due to significantly less spectral overlap, despite the very long time demand for data
collection. Nevertheless, various techniques for specific labeling of methyl groups (Goto
et al., 1999; Godoy-Ruiz et al., 2010; Ruschak et al., 2010), which now even includes

35
stereospecific selection of methyl groups (Gans et al., 2010), we assume that this approach
might be applicable to proteins larger than ubiquitin.
Quantification of methyl group dynamics in ubiquitin
Methyl group order parameter ( ) can be used to extracted from experimental CCR rates
(σobs ) by comparing them with the theoretical value of the CCR (σrigid) in the absence of local
motions (Liu et al., 2003; Kay and Torchia, 1991; Lee et al., 2006):
(4)
σ rigid =145
µ0hγ Hγ C
8π 2rCH3
2
2τ c +3τ c
2(1+ (ω cτ c )2 )
(5)
where µ0 is the permeability of a vacuum, h is the Planck constant, γH and γC are the
gyromagnetic ratios of 1H and 13C, respectively, rCH is the CH bond length, ωC is the Larmor
frequency of 13C and τc is the rotational correlation time. is a dimensionless quantity for
describing the magnitude of mobility for the methyl group (Kay and Torchia, 1991). Values
for vary between 0 and 1, where 1 regards to a rigid methyl group and zero represents
unrestricted local motion.
For determination of σrigid with equation (5), the methyl group C-H bond length (rCH)
was set to 1.095 angstroms, tetrahedral geometry assumed and the τc of ubiquitin at each
temperature is reported in appendix I. Using σrigid, we calculated with equation (4) for all
fourteen temperatures, presented in the appendix I. Figure 2 shows the correlation of
calculated at a selected set of temperatures. From the figure a high degree of correlation
for over these temperatures is apparent. For all pair-wise combinations of , the
Pearson correlation coefficient is r ≥ 0.98. Due to the linear dependence of on T, the high
Saxis2
Saxis2 =
σ obs
σ rigid
Saxis2
Saxis2
Saxis2
Saxis2
Saxis2 Saxis
2
Saxis2

36
correlation between at every temperature suggests that uncertainties emerging from each
experimental measurement are consistent over the whole data set. Figure 3A illustrates the
correlation plot of values from CCR measurements versus calculated from the rates
of multiple spin coherences involving 2H in the methyl group, both at 303 K
(Lee et al., 1999). Figure 3B reveals the correlation plot of the from this study at 301 K
versus extracted from methyl group 13C spin-lattice (T1) relaxation rates and σ
modulated by the one bond C-H coupling constant (JCH) measured at 300 K
(Zhang et al., 2006). The Pearson correlation coefficient is high for both comparisons, 0.96
and 0.97 respectively. The high correlation between obtained by three independent
methodologies together with the high correlation for over the entire temperature range
provides strong confirmation that the temperature dependence of can be studied using the
present method. It should be noted that deviations from the diagonal is most likely an
evidence for small differences in experimental setup, such as sample conditions, slight
temperature variations, and/or uncertainty in measurements. Most importantly, the total
amount of time required to obtain this information is efficiently reduced. With approaches
involving 2H labeling of methyl groups (Muhandiram et al., 1995; Liao et al., 2012; Millet
et al., 2002), R1 and R2 relaxation rates are typically measured in order to calculate at one
temperature. As for σ modulated by the one bond C-H coupling constant (JCH),
determined at one temperature needs a series of 2D constant time 13C, 1H HSQC experiments
with increasing delay times (Zhang et al., 2006). However, with the introduced method, one
2D constant time 13C, 1H HSQC measurement is needed to acquire the same amount of
information at one temperature point.
Finally, the time-scale of motion covered by is faster than the τc of ubiquitin,
describing ps to ns dynamics. Lakomek et al (2009) has determined the methyl group RDC-
Saxis2
Saxis2 Saxis
2
Saxis2
Saxis2
Saxis2
Saxis2
Saxis2
Saxis2
Saxis2
Saxis2

37
based order parameters for ubiquitin, which encompasses time-scales from ps to ms. By
comparison of two sets of order parameters at 308 K, the average values of and are
0.59 ± 0.21 and 0.43 ± 0.25, respectively, with a Pearson correlation coefficient of r = 0.84. It
is obvious that additional dynamics on a slower time-scale for the methyl groups exist than
the motion encapsulated by .
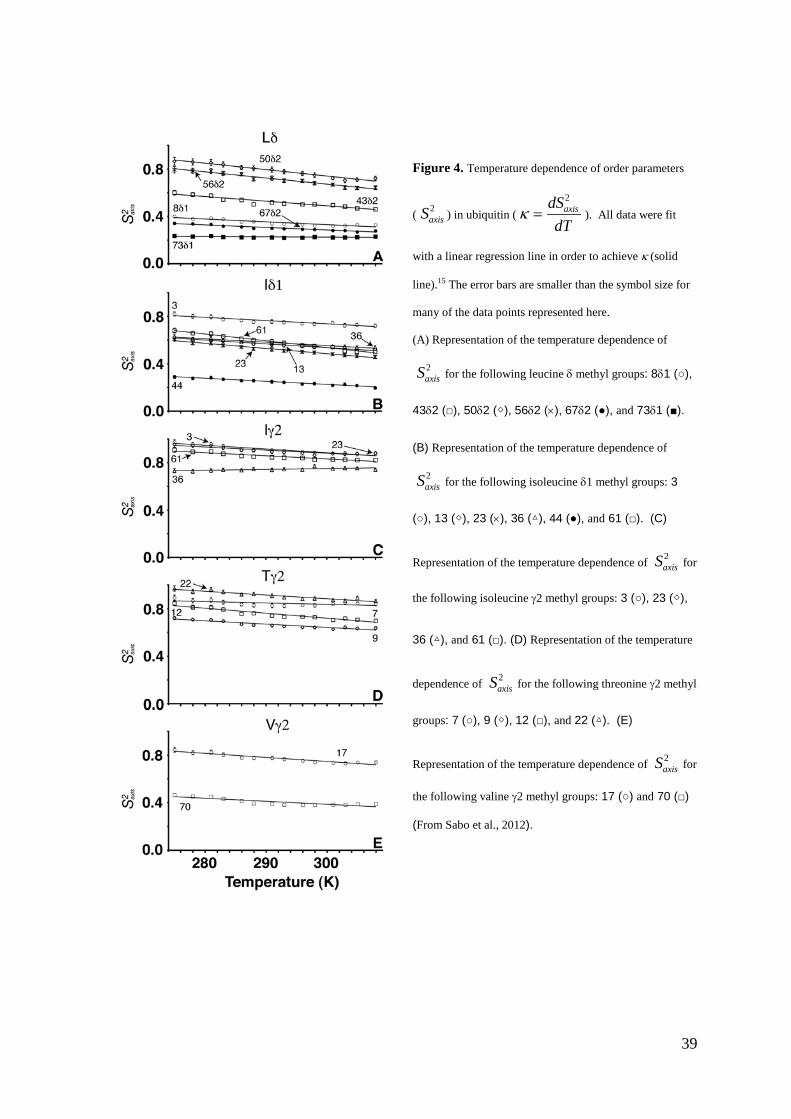
Analysis of the temperature dependence of in ubiquitin
Temperature dependencies of can be quantified by the thermal coefficient κ was taken
from the linear fit of versus temperature (Lee et al., 2002; ) Table 1 and
Figure 4 show the results of the fitting procedure. Decrease of as a general trend is
observed in the temperature range from 275 to 308 K. The average value of κ is –(2.9 ± 1.5) ×
10-3 K-1 which is in good agreement with the value of –(2.6 ± 1.1) × 10-3 K-1 reported
previously for ubiquitin over the larger temperature range of 278 to 328 K (Song et al., 2002).
In addition, similar trends in the deviation of with temperature can also be seen for
calmodulin bound to a peptide (Lee et al., 2002). Figure 5A presents the distribution of κ
within ubiquitin (1UBQ: Vijayakumar et al., 1987). The maximum κ values are grouped
around I61δ1, spatially near the N-terminus of ubiquitin, and progressively decrease toward
the C-terminus of the protein.
The characteristic thermal coefficient Λ = d ln 1− Saxis2( ) d lnT correlates the temperature
dependencies of the generalized order parameter, in this case , to the characteristic
temperature (T*) (Mandel et al., 1996; Vugmeyster et al., 2002). The term T* is a description
for the density of thermally accessible conformational states for the bond vector, here methyl
axis of symmetry (Mandel et al., 1996). Table 1 lists the results for the determination of Λ,
SRDC2
Saxis2 SRDC
2
Saxis2
Saxis2
Saxis2
Saxis2 κ =
dSaxis2
dT
Saxis2
Saxis2
Saxis2

38
which correlates with κ (Pearson coefficients of r = 0.7). The average value of Λ (3.4 ± 2.4
compared to 2.3 ± 1.0 previously reported for ubiquitin over the larger temperature range of
278 to 328 K (Song et al., 2007)) reveals significant contributions from rotameric jumps
within the side chains (Lee and Wand, 2001). In Figure 5B depicts the distribution of Λ on
the structure of ubiquitin. Similar to the magnitude of κ, the largest values of Λ are clustered
in the N-terminal region of ubiquitin. A successive decline of Λ towards the C-terminal
region is observed.
Figure 3. Comparison of in ubiquitin obtained from different methods. (A) Correlation between determined from
the present study using dipolar cross-correlated relaxation between CH bonds in the methyl group versus calculated from
the rates of multiple spin coherences involving 2H in the methyl group.26 In both cases, was estimated at 303 K. (B)
Correlation between determined at 301 K from the present study versus calculated at 300 K from methyl group 13C
spin-lattice (T1) relaxation rates and dipolar cross-correlated relaxation modulated by the one bond C-H coupling constant (JCH).21
In both figures, the dashed lines illustrate the best fit to the data. The error bars are shown in both dimensions. The Pearson
correlation r is also designated in the figures (Sabo et al., 2012)
Saxis2 Saxis
2
Saxis2
Saxis2
Saxis2 Saxis
2
39
Figure 4. Temperature dependence of order parameters
( ) in ubiquitin ( ). All data were fit
with a linear regression line in order to achieve κ (solid
line).15 The error bars are smaller than the symbol size for
many of the data points represented here.
(A) Representation of the temperature dependence of
for the following leucine δ methyl groups: 8δ1 (○),
43δ2 (□), 50δ2 (◇), 56δ2 (×), 67δ2 (●), and 73δ1 (■).
(B) Representation of the temperature dependence of
for the following isoleucine δ1 methyl groups: 3
(○), 13 (◇), 23 (×), 36 (△), 44 (●), and 61 (□). (C)
Representation of the temperature dependence of for
the following isoleucine γ2 methyl groups: 3 (○), 23 (◇),
36 (△), and 61 (□). (D) Representation of the temperature
dependence of for the following threonine γ2 methyl
groups: 7 (○), 9 (◇), 12 (□), and 22 (△). (E)
Representation of the temperature dependence of for
the following valine γ2 methyl groups: 17 (○) and 70 (□)
(From Sabo et al., 2012).
Saxis2 κ =
dSaxis2
dT
Saxis2
Saxis2
Saxis2
Saxis2
Saxis2

40
Table 2. Thermal coefficients extracted from methyl group order parameters ( ) within ubiquitina
κ (x 10-3 K-1)b Λc (J K-1mol-1)d
I3γ2 -2.9 ± 0.4 7.5 ± 1.4 52.7 ± 11.9e
I3δ1 -2.5 ± 0.4 3.2 ± 0.5 27.3 ± 4.5 T7γ2 -0.8 ± 0.5 1.0 ± 0.8 8.5 ± 7.9 L8δ1 -2.3 ± 0.2 1.4 ± 0.1 13.1 ± 1.1 T9γ2 -3.0 ± 0.3 2.7 ± 0.1 23.4 ± 2.8 T12γ2 -4.4 ± 0.4 4.8 ± 0.4 41.5 ± 4.9 I13δ1 -3.2 ± 0.3 2.5 ± 0.2 22.4 ± 2.3 V17γ2 -3.1 ± 0.4 4.0 ± 0.4 34.7 ± 4.3 T22γ2 -3.3 ± 0.5 8.1 ± 0.4 59.7 ± 14.1e
I23γ2 -2.3 ± 0.4 5.5 ± 1.1 43.9 ± 11.4f
I23δ1 -4.3 ± 0.4 3.1 ± 0.2 27.6 ± 2.6 I36γ2 0.1 ± 0.4 -0.8 ± 0.3 -6.9 ± 3.7 I36δ1 -2.8 ± 0.3 2.2 ± 0.2 19.8 ± 2.4 L43δ2 -3.6 ± 0.4 2.6 ± 0.2 23.4 ± 2.4 I44δ1 -2.6 ± 0.3 1.5 ± 0.2 14.8 ± 1.7 L50δ2 -5.4 ± 0.6 7.5 ± 0.6 64.5 ± 7.7 L56δ2 -5.2 ± 0.5 5.7 ± 0.4 49.3 ± 4.9 I61γ2 -2.5 ± 0.3 4.7 ± 0.6 39.5 ± 6.6 I61δ1 -5.7 ± 0.4 4.6 ± 0.3 40.4 ± 3.0 L67δ2 -2.1 ± 0.2 1.2 ± 0.1 11.8 ± 1.2 V70γ2 -2.3 ± 0.3 1.4 ± 0.1 13.4 ± 1.5 L73δ1 0.0 ± 0.1 0.2 ± 0.1 1.6 ± 0.7 Average -2.9 ± 1.5 3.4 ± 2.4 28.5 ± 18.9 aAll errors were calculated from 500 Monte Carlo simulation runs. bThe temperature dependencies of ( ) were achieved from the slope of a linear fit of
versus temperature (T) (Lee et al., 2002). cThe characteristic thermal coefficient Λ was estimated from the slope of a linear fit of
versus (Vugmeyster et al., 2002). dThe heat capacities ( ) were calculated from the slope of a linear fit of the conformational entropy ( ) versus (Privalov and Gill, 1988), where
(Yang and Kay, 1996 and 1997)Constants kB and NA are the
Boltzmann constant and Avogadro’s number, respectively. eFor these methyl groups, only from temperatures between 283 and 308 K were taken for the fitting procedure due to the requirement of < 0.95 for determining .(Yang and Kay, 1996) fFor this methyl group, only from temperatures between 278 and 308 K were taken for the
fitting procedure due to the requirement of < 0.95 for determining of . (Yang and Kay, 1996)
Saxis2
Cp
Saxis2 κ =
dSaxis2
dTSaxis
2
ln 1− Saxis2( ) lnT
Cp
Sconf lnT
Sconf = kB NA lnπ 3 − 1+ 8 Saxis2
.
Saxis2
Saxis2 Sconf
Saxis2
Saxis2 Sconf

41
Determination of the Cp from the temperature dependence of the conformational entropy
It has been shown that the equation, 𝑆𝑐𝑜𝑛𝑓(𝑗) = −𝑘𝐵 ∫ 𝑝(𝑞) ln𝑝(𝑞) 𝑉 𝑑𝑉, can be used for
calculation of conformational enthropy, where p(q)=p(θ,φ) and dV=sinθ dθ dφ. Considering
the model free formalism for order parameter (Lipari and Szabo, 1982a, b) the NMR
relaxation parameters can be deciphered in terms of generalized order parameter, S2. The
value of order parameter for a bond vector motion is defined as
𝑆2 =4𝜋5
� ��𝑝(𝜃𝑖 ,𝜙𝑖)𝑖
𝑌2𝑚(𝜃𝑖,𝜙𝑖)�22
𝑚=−2
Where 𝑌2𝑚(𝜃𝑖 ,𝜙𝑖)is the second rank spherical harmonic function and (𝜃𝑖 ,𝜙𝑖) are the polar
angels of the ith orientation of the vector in a molecular reference frame. This equation can be
rewritten assuming a normalized probability distribution function, p(q),
𝑆2 =4𝜋5
� ��𝑝(𝑞)
𝑉𝑌2𝑚(𝑞)𝑑𝑉�
22
𝑚=−2
Where 𝑝(𝑞) = 𝑝(𝜃 ,𝜙 ), 𝑌2𝑚(𝑞) = 𝑌2𝑚(𝜃 ,𝜙 ) and dV=sinθ dθ dφ. As the order parameter
like conformational entropy depends only on the probability distribution function, it is
possible to interconnect these two parameters. There are many models for description of
probability density function based on the type of motion of bond vector and the corresponding
potential energy (Yang and Kay, 1996). The most widely used model for internal motion is
the diffusion-in-a-cone (Brainard and Szabo, 1981).
𝑝(𝑞) = �1
{𝜙0(1 − cos𝜃0} 𝑓𝑜𝑟 0 ≤ 𝜃 ≤ 𝜃0, 0 ≤ 𝜙 ≤ 2𝜋
0 𝑓𝑜𝑟 𝜃 > 𝜃0
Using an extension of this model (Yang and Kay, 1996) by considering the free diffusion
within the boundary 0 ≤ 𝜙 ≤ 𝜙0 (p(q)=0; 𝜙 > 𝜙0), the values for S2 and Sconf can be written
as
𝑆𝑐𝑜𝑛𝑓 = 𝑘𝐵 ln{𝜙0(1 − cos𝜃0)}

42
𝑆2 = 14cos2 𝜃0 (1 + cos𝜃0)2 + 2
3
sin6 𝜃0(1 − cos𝜙0)(1 − cos 𝜃0)2 𝜙02
+
38
(cos𝜃0 − (13) cos3 𝜃0 − (2
3))2 (1 − cos 2𝜙0)
(1 − cos𝜃0)2 𝜙02
Now regarding this model Sconf and S2 can be connected analytically as
𝑆𝑐𝑜𝑛𝑓 = 𝑘𝐵 ln𝜋 �3 −��1 + 8�𝑆2�� , 0 ≤ 𝑆2 ≤ 1
It should be noted that for order parameters in range of 0 ≤ 𝑆2 ≤ 164
there are two Sconf values
to be calculated (Yang and Kay, 1996) as
𝑆𝑐𝑜𝑛𝑓 = 𝑘𝐵 ln𝜋 �3 ± ��1 + 8�𝑆2��
As all order parameters reported in this work are larger than 1/64 we ignore this case.
Using an approximation that describes the motion of axis of symmetry of methyl group by
diffusion-in-a-cone model (Tzeng and Kalodimos, 2012), the molar conformational entropy
(Sconf) can be related to ,
(6)
where kB is the Boltzmann constant and NA is Avogadro’s number (Yang and Kay, 1996). The
heat capacity (Cp) calculated from the temperature dependence of Sconf is defined as (Privalov
and Gill, 1988)
(7)
Cp for the methyl groups in ubiquitin are presented in Table 2 for the temperature range of
275 to 308 K. For 22 methyl groups in ubiquitin, an average Cp of 28.5 ± 18.9 J K-1mol-1 is
calculated using presented method. In another study for the drkN SH3 domain, similar values
for the methyl group Cp were obtained: 17 ± 12 J K-1mol-1 and 33 ± 23 J K-1mol-1 for the
Saxis2
Sconf = kBNA lnπ 3 − 1+ 8 Saxis2
,
Cp =dSconf
d lnT.

43
temperature intervals 287 to 303 K and 278 to 287 K, respectively (Yang et al., 1997). Using
data measured by differential scanning calorimetry, the global Cp for ubiquitin was ~12.6 kJ
K-1mol-1 at 298 K (Wintrode et al., 1995). In this dissertation I report, the summation of all
the individual methyl groups Cp equals 626 J K-1mol-1. This value, however, does not include
the contributions of 28 additional methyl groups where Cp could not be extracted, these results
suggest that the total methyl group Cp makes an approximately 10% contribution to the global
Cp of ubiquitin. It should be considered that a majority Cp can be determined from the primary
sequence of proteins (Gomez et al., 1995). Since atoms of the methyl groups in ubiquitin are
16% (200 out of 1231) of all atoms, the ~10% contribution for the methyl groups to the total
heat capacity of ubiquitin might be a reasonable estimate. Figure 5C illustrates the distribution
of Cp in ubiquitin. The methyl groups with largest values of Cp, similar to κ and Λ, are
accommodated spatially near the N-terminus of the protein, which is the part of the
hydrophobic core of ubiquitin.

44
Figure 5. Distribution of the calculated thermal coefficients for methyl groups in ubiquitin (1UBQ:
Vijaykumar et al., 1987). (A) Distribution of κ. (B) Distribution of the characteristic thermal coefficient Λ, which was
calculated from a linear fit of versus (Vugmeyster et al., 2002) (C) Distribution of the heat
capacity ( ), which was extracted from a linear fit of the conformational entropy ( ) versus (Privalov and
Gill, 1988), where (Yang and Kay, 1996 and 1997)Constants kB and
NA are the Boltzmann constant and Avogadro’s number, respectively. Spheres represent the methyl group carbon atom.
The color gradient is used to represent the magnitude of the specified thermal parameter. The figures were built with the
program MOLMOL (Koradi et al., 1996) (from Sabo et al., 2012).
Insight into the thermal stability of ubiquitin from the distribution of thermal
coefficients
The localization of large valued thermal coefficients near the N-terminal region of the
ubiquitin is the distinguished feature of this study. At the first glance it appears to be
counterintuitive that these methyl groups are clustered within the core region of the protein.
Larger than the average heat capacity values (Cp,average = 28.5 ± 18.9) in flexible regions could
be explained by tendency of these residues to populate additional states more readily and
mainly with respect to increase in thermal energy. Furthermore, other studies show that the α-
ln 1 − Saxis2( ) lnT
Cp Sconf lnT
Sconf = kBNA lnπ 3 − 1+ 8 Saxis2
.
45
helix and the turn between β-strands 1 and 2 located in the N-terminal region of ubiquitin, has
resilience to temperature fluctuations (Babu et al., 2004; Cordier and Grzesiek, 2002). (Went
and Jackson, 2005; Brutscher et al., 1997). The denaturation of ubiquitin in a mixture of
methanol and water has not shown complete unfolding but partially structured speciece called
A-state is formed, in which the N-terminal β-sheet and central α-helix remains native like
(Cordier and Grzesiek, 1997). Study of unfolding kinetic of many ubiquitin mutants revealed
a highly polarized transition state containing folding nucleus, which comprises the major α-
helix and the N-terminal β-hairpin (Went and Jackson, 2005). Taken together with the
observed high heat capacity in the N-terminal region (first and second β-sheet, excluding
T7γ2 and L8δ1 in the connecting loop) and α-helix by our method, it can be indicated that the
core structural elements has been formed earlier during the protein folding procedure.
The order parameters of backbone NH has been studied in several thermo-stable proteins and
results showed the NH vectors with larger Cp to be located within the more rigid regions of
secondary structure (Vugmeyster et al., 2002; Vinther et al., 2011; Seewald et al., 2000).
Additionally, the dependence of Cp magnitude on the change in Sconf (see equation (7)),
revealed by three independent groups,(Li et al., 1996; Yang and Kay, 1996;
Vugmeyster et al., 2002) that the largest fluctuation for Sconf is seen in groups possessing
high order parameter, S2 , varies between 0.7 to 0.95. High melting temperature of ~363 K for
ubiquitin (Wintrode et al., 1994) and other thermo-stabile proteins might be related in part to
the relatively large local Cp of the methyl groups and NH bonds in the folded proteins
reducing the magnitude of ∆Cp upon unfolding.
An exceptional slightly negative Cp for I36γ2 methyl group also resulted from our
calculation. Negative Cp for NH bonds located in secondary structural regions has been
reported in two other studies (Vinther et al., 2011; Lee et al., 2002). Negative heat capacity
describes a decrease in the conformational entropy with respect to temperature. If an effect

46
like a hydrophobic interaction is being enhanced at higher temperature, one would expect
more ordering and less entropy by increasing the temperature. As reported by Thomas and
Makhatadze (2000) there is a so- called helix-capping interaction at the end of α-helices,
which plays a central role in stability of ubiquitin. It has been shown by far-UV circular
dichroism (CD) spectroscopy and DSC that this important interaction is established between
side chains of I36 and I30 at the C-terminus of the ubiquitin α-helix (Thomas and
Makhatadze, 2000) Accordingly, the negative Cp imply a decrease in the mobility and a
reduction in the accessible conformational space for this methyl group. This can be explained
by enhancement of hydrophobic interaction between I36 and I30 with increasing temperature.

47
Materials and Methods
NMR spectroscopy and processing.
Uniformly wild type 15N,13C-labeled human ubiquitin was expressed and purified as described
previously in our molecular biology laboratory by Karin Giller (Handel et al., 1999). For the
NMR measurements, a 3.6 mM sample of the protein was prepared in 350 µl of 50 mM
sodium phosphate buffer, 100 mM NaCl, 0.1% NaN3, pH 6.8 in 10% D2O/90% H2O. A series
of 2D constant time 13C, 1H HSQCs without decoupling of 1H during 13C-chemical shift
evolution were acquired at 14 temperature points: 275, 278, 281, 283, 286, 288, 291, 293,
296, 298, 301, 303, 305, and 308 K. All NMR experiments were done in succession on a 700
MHz Avance-III Bruker spectrometer equipped with a triple resonance probe head. The
duration of constant time and INEPT delays were set to 27.8 and 2 ms, respectively. The
spectrum was measured with 1024 and 128 complex points in the direct (t2) and indirect (t1)
dimensions, respectively, with 8 scans per t1 increment. The t1, max and t2, max were set to 24.3
ms and 113 ms, respectively. Frequency discrimination in the indirectly detected dimension
was performed with the States-TPPI scheme (Marion et al., 1989). The duration of each
measurement was 59 minutes.
All time domain data processing were done in the same manner with NMRPipe
software (Delaglio et al., 1995). The data were zero-padded to 8 k and 16 k in t1 and t2,
respectively. After application of a time domain solvent correction, a sine-bell window
function was implemented in the direct dimension, followed by Fourier transformation of t2.
For the indirect dimension, a mirror image linear prediction algorithm was employed to
increase the resolution in t1. Next, a Gaussian window function was utilized followed by
Fourier transformation of t1. Finally, a polynomial baseline correction in the frequency
domain was employed in the direct dimension.
48
Methods for error determination.
The intensities of each peak in the quartet were extracted using the program CARA
(Keller, 2004) and the dipolar-dipolar cross-correlated relaxation rates (σobs) were calculated
applying to the equation(3). In order to estimate the errors in σobs, the noise levels (q) for each
measurement were was taken from NMRPipe and the error ( ) was propagated from the
following relation,
∆σ obs =q8∆
1I
α 3
+1
Iα 2 β
+1
Iαβ2
+1
Iβ 3
, (8)
where ∆ is the duration of the constant time period and Ii is the intensity of each peak in the
quartet ( ). For the methyl group order parameters ( ), the errors (
) were estimated by propagating the error from substituting in the equation,
(9)
where is calculated from equation (5). Finally, the errors in the conformational entropy
(∆Sconf) were extracted by propagating the error from ,
(10)
where
(11)
(12)
∆σ obs
i = α 3,α 2β,αβ 2 , or β 3 Saxis2 ∆Saxis
2
∆σ obs
∆Saxis2 =
∆σ obs
σ rigid
,
σ rigid
∆Saxis2
∆Sconf = 4kBNAA 13 − B( )B
,
A =∆Saxis
2
2 Saxis2
,
B = 1+ 8 Saxis2 ,
49
kB is the Boltzmann constant and NA is Avogadro’s number. For error estimation in the
temperature dependency of ( ), the characteristic thermal coefficient (
), and the heat capacity ( ), Monte Carlo simulations on 500
randomly generated data sets were done.
Saxis2 κ =
dSaxis2
dT
Λ =d ln 1− Saxis
2( )d lnT
Cp =dSconf
d lnT

50
Conclusion
In this part of thesis, the temperature dependence for the methyl group order parameters in
ubiquitin was analyzed together with Dr. T.M. Sabo. The total amount of experimental time
required to obtain the needed information were significantly reduced, with the requirement of
only one 2D constant time 13C, 1H HSQC measurement eliminating decoupling of 1H during
13C-chemical shift evolution. Using set of experiments at different temperature, the extracted
thermal coefficients provide a brief look into the location of ubiquitin thermo-stability near
the N-terminus of the protein. Significant contribution of methyl groups in the global heat
capacity of ubiquitin, as well as other proteins (Yang et al., 1997; Lee et al., 2002), can be
described through the regulation of local conformational entropy. Considering temperature
dependence of NH and methyl axis order parameters, local protein thermodynamics in
residual resolution offers a powerful supplement to the already well-established methods for
determining global thermodynamic parameters in proteins.
Here with the presented method using fast CCR rate measurements, the heat capacity for
methyl groups can be calculated as an alternative to the other existing methods more
accurately as many more temperature points can be sampled for the temperature dependence
study. To our knowledge the heat capacity of methyl groups within ubiquitin is reported here
for the first time. This way is a promising method for study of protein unfolding to investigate
the thermodynamic features of denaturation in an atomic resolution.

51
Part II Metabolic coupling of NAA and lactate in cortical neurons3 Introduction
N-acetyl aspartate (NAA) in brain:
NAA is the second most abundant metabolite in the brain after glutamate, which in neurons
has been measured by MRS (magnetic resonance spectroscopy) to be above 10mM
(Wiame et al., 2010; Moffet et al., 2007). This brain specific compound can be used as a
diagnostic marker for monitoring the health and neuronal density in various neurological
disorders, including Alzheimer’s disease, multiple sclerosis (MS) and AIDS
(Moffet et al., 2007). Biosynthesis of NAA is catalyzed by NAT8L (designated as Shati and
formerly as asp-NAT), an aspartate specific N-acetyltransferase transferring an acetyl residue
from acetyl-CoA to aspartate (Wiame et al., 2010; Tahay et al., 2012).
There are different reports about the subcellular localization of this membrane bound enzyme,
NAT8L, namely in mitochondria (Aryannur et al., 2008) , microsomes (Lu et al., 2004) and in
endoplasmic reticulum (Wiame et al., 2010) . NAA is not catabolized in neurons, but it is
3 In this part all stages in preparation of primary cell culture, treatments and cell imaging were done by our collaborator Dr. Kathrin Kusch in department of Neurogenetics (Prof. Klaus Armin Nave), MPI for experimental medicine. NMR sample preparation, measurements, data processing and analysis were done by the author.

52
secreted to periaxonal space and is then taken up by oligodendrocytes, where it is hydrolyzed
to aspartate and acetate by aspartoacylase (ASPA) (Moffet et al., 2007).
It has been shown that the acetate produced by the ASPA mediated hydrolysis, is used up as a
precursor for fatty acid synthesis which is required for the myelin lipids
(Chakraborty et al., 2001). NAA is also the precursor for the biosynthesis of NAAG (N-
acetylaspartoglutamate), the most abundant dipeptide present in the brain and is currently
assumed to be a neurotransmitter (Wroblewska et al., 1998).
The other suggested function for NAA is osmoregulation and acting as a housekeeping
compound by removal of large amounts of metabolic water produced after signaling activites
(Baslow, 2010; Moffet et al, 2007). Up to now it has been found that NAA is not a
neurotransmitter (Moffet et al., 2006), and its other proposed roles are still controversial
(Wiame et al., 2010). However, in two metabolic disorders the NAA level is directly affected.
Aspartoacylase (ASPA) deficiency followed by a mutation in ASPA gene causes a

53
leucodystrophy known as Canavans disease. The patients with raised NAA concentration in
brain and CSF (cerebrospinal fluid) are diagnosed in early infancy by dystonia, severe mental
defects, blindness, megalencephalo-pathy and death on average by 18 months
(Malaton et al., 2008). In the opposite case called ‘hypoacetylaspartia’, in which no NAA is
detectable in the brain, one patient has been reported to develop truncal ataxia, developmental
delay, seizure and secondary microcephaly (Wroblewska et al., 1998). This patient is
homozygous for many alleles, which might be causative for some of the symptoms and
additionally this disorder has been identified to be caused by a point mutation in NAT8L gene
(Wiame et al., 2010).
Metabolic coupling in central nervous system:
Neurons in the central nervous system (CNS) are in interaction with glia (Fig. 6). The axons
of neurons are wrapped with a myelin sheath that is provided by oligodendrocytes
(Nave, 2010). The required energy for neuronal communication is reduced as a consequence
of myelin evolution. The impulse propagation speed is also boosted due to the presence of the
myelin sheath that makes the complex operations of the nervous systems quick and efficient
(Nave, 2010; Zalc and Colman, 2000). The myelination however insulates long axons from
their environment and confines their access to extracellular metabolic substrates
(Nave, 2010).The Ranvier nodes are the only area exposed to the extracellular environment. If
the whole metabolic demand is supported via this small area, a very efficient and special
transporter have to be present at the nodes, but to date no observation supports this
hypothesis.
Lee et al recently showed that monocarboxylate transporter 1 (MCT1) is the main path for
lactate (or pyruvate) transport between oligodendroglia and neurons. Based on this they
suggest that the oligodendroglia provide support for the neurons for maintaining axon
function and neuron survival (Lee et al., 2012). It has been shown that MCT1, which is
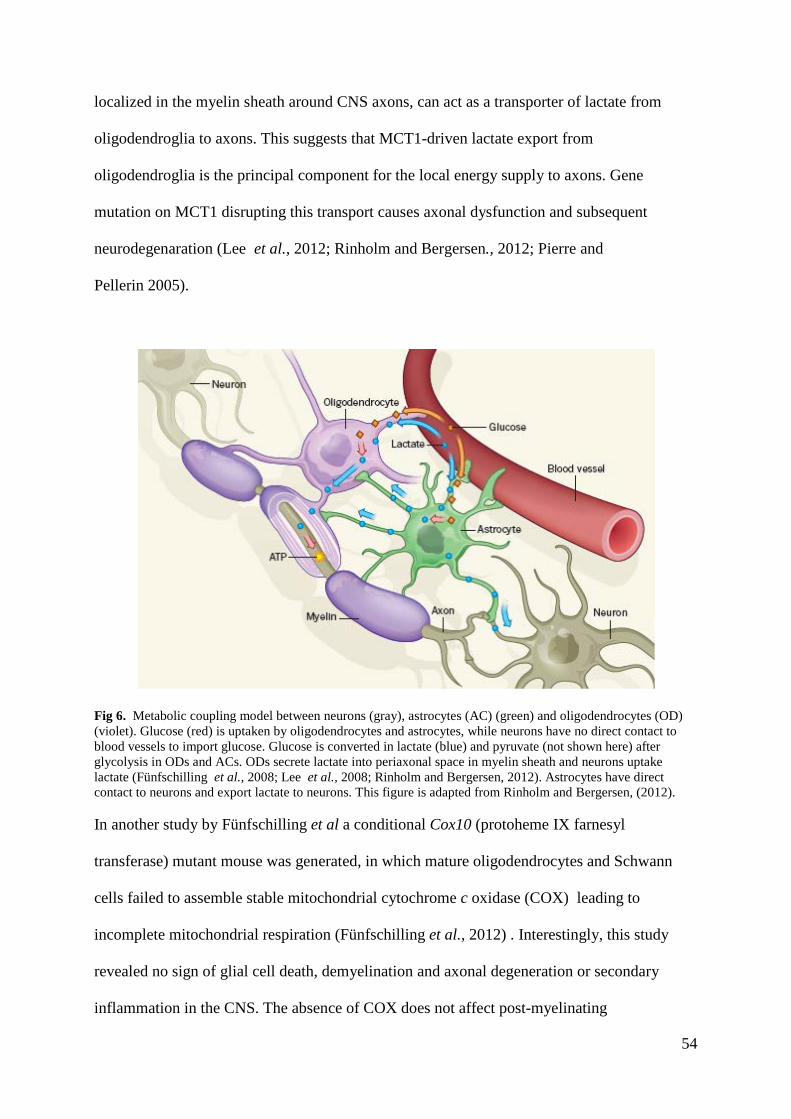
54
localized in the myelin sheath around CNS axons, can act as a transporter of lactate from
oligodendroglia to axons. This suggests that MCT1-driven lactate export from
oligodendroglia is the principal component for the local energy supply to axons. Gene
mutation on MCT1 disrupting this transport causes axonal dysfunction and subsequent
neurodegenaration (Lee et al., 2012; Rinholm and Bergersen., 2012; Pierre and
Pellerin 2005).
Fig 6. Metabolic coupling model between neurons (gray), astrocytes (AC) (green) and oligodendrocytes (OD) (violet). Glucose (red) is uptaken by oligodendrocytes and astrocytes, while neurons have no direct contact to blood vessels to import glucose. Glucose is converted in lactate (blue) and pyruvate (not shown here) after glycolysis in ODs and ACs. ODs secrete lactate into periaxonal space in myelin sheath and neurons uptake lactate (Fünfschilling et al., 2008; Lee et al., 2008; Rinholm and Bergersen, 2012). Astrocytes have direct contact to neurons and export lactate to neurons. This figure is adapted from Rinholm and Bergersen, (2012). In another study by Fünfschilling et al a conditional Cox10 (protoheme IX farnesyl
transferase) mutant mouse was generated, in which mature oligodendrocytes and Schwann
cells failed to assemble stable mitochondrial cytochrome c oxidase (COX) leading to
incomplete mitochondrial respiration (Fünfschilling et al., 2012) . Interestingly, this study
revealed no sign of glial cell death, demyelination and axonal degeneration or secondary
inflammation in the CNS. The absence of COX does not affect post-myelinating

55
oligodendrocyte survival. In vivo MRS studies of mice brains detected increased lactate
concentration in mutant brains compared to controls, but just in mice under volatile
anesthesia. This result indicates the rapid metabolism of aerobic glycolysis products (lactate
and pyruvate) derived from oligodendrocytes within white matter tracts (Fünfschilling et al,
2012).
Aim of thesis:
The very high concentration of NAA in the brain is the main motivation point to investigate
the connection of NAA to various CNS diseases and its enigmatic roll in the brain. This study
is focusing on the possible metabolic and vital function of this compound based on the
neuronal-oligodendroglial metabolic coupling (Fig. 6).The working hypothesis for this thesis
is, that the NAA production in neurons is responsive to high concentrations of lactate to avoid
lactic acidosis in energy rich situations.

56
Material and Methods:
Sample preparation:
Labeling:
One of the major problems in the analysis of crowded systems like the supernatant and cell
extracts is severe signal overlap. As NMR spectroscopy is sensitive only to specific isotopes
such as 1H, 13C, 15N and 31P, labeling of certain compounds within a pathway may provide a
potential method to avoid signal crowding by keeping other pathway products NMR silent
(Lindon and Nicholson, 2008). In our study, indeed, the 13C labeling could be twice
advantageous. First the peaks belonging to the compounds originating from unwanted
metabolic pathways are filtered out and second we can employ two-dimensional
spectroscopy, which provides a correlation between 1H and 13C nuclei and more resolution to
probe the exact metabolic products.
In this study we used the 13C6-glucose for the labeling and detection of NAA. All metabolites
originating from glucose will be 13C-labeled and therefore NMR visible (Fig. 7). In order to
investigate the effect of other compounds such as lactate and their contribution in the NAA
synthesis, the suitable labeled compound should be used, 13C2-Lactate has been also used for
labeling of NAA.

57
Cell culture:
The neurons for the primary cell culture were obtained by tryptic digestion of E18 embryonic
cortices of wild type (strain Wistar) rat. Cells were seeded in DMEM (Dulbecco’s modified
Eagle Medium) with 1% [w/v] Glucose supplemented with 10% [v/v] FCS (Fetal calf serum)
on PLL (Poly-L-lysine) coated coverslips or cell culture dishes. Per coverslip (diameter
13mm) 2x10⁵ cells in 0.5 ml DMEM were applied. Per 10cm cell culture dish 1.2x10⁷ cells in
10 ml DMEM were plated. At the consecutive day, media was exchanged to neurobasal
Fig 7. metabolic pathway of labeled 13C6-glucose in the neurons up to NAA synthesis. Red dots represent the NMR visible 13C and black dots indicate the NMR invisible 12C atoms. Abbreviations: Glc: glucose, G6P: glucose-6-phisphate, F6P: fructose-6-phosphate, F-1,6-BP: Fructose-1,6-diphosphate, DHAP: dihydroxy acetone phosphate, GAP: glyceraldehydes phosphate, 1,3-BPG: 1,3-diphosphoglycerate, 3PG: 3-phosphoglycerate, 2PG: 2-phosphoglycerate, PEP: phosphoenol pyruvate, Asp: Aspartate.

58
medium (Neurobasal-A, Invitrogen life technologies) containing penicillin, streptomycin, B27
supplement and 25mM 13C6- glucose (otherwise is stated). At the days 5 and 8 in vitro half of
the media was exchanged with neurobasal medium. At those days AraC4 (5 µM and 7.5 µM,
respectively) was also added in order to eliminate astrocytes and oligodendrocytes (Fig. 8
shows the live fixed neurons (labelled in green by anti-calbindin immunflourescence) and
nuclei (labelled in blue by DAPI) of neurons, non-viable astrocytes and oligodendrocytes).
Treatment with 13C2-L-lactate (otherwise is stated) is started at day 11 for 72 h. Different
treatments were performed in various conditions and controls, which are summarized in Table
1.
4 AraC (citarabin) is an antimitotic agent which has cytotoxic effects on proliferating cells, such as astrocytes and oligodenrocytes in our culture system, while has no toxic effects on post-mitotic cells e.g. neurons in this stage.
Fig 8. confocal microgram of the cell culture after treatment by the antimitotic agent AraC. The staining has been done using DAPIand anti-calbindin immunofluorescence. Living neurons are depicted by green, while dead oligodendrocytes and astrocytes were stained in blue. Picture by Dr. Kathrin Kusch (MPI-EM).

59
Sample Condition
1 25 mM 13C6-Glc1 in Glc free NB-A2 Medium, No additional lac or NaCl
2 25 mM 13C6-Glc, 10 mM NaCl in Glc free NB-A Medium
3 25 mM 13C6-Glc, 1 mM Na 13C2-L-Lac3 and 9 mM NaCl in Glc free NB-A Medium
4 25 mM 13C6-Glc, 5 mM Na 13C2-L-Lac and 5 mM NaCl in Glc free NB-A Medium
5 25 mM 13C6-Glc, 10 mM Na 13C2-L-Lac in Glc free NB-A Medium
6 25 mM 13C6-Glc, 20 mM Sucrose in Glc free NB-A Medium
7 30 mM 13C6-Glc in Glc free NB-A Medium
8 25 mM 13C6-Glc, 10 mM Na 12C2-L-Lac in Glc free NB-A Medium
9 25 mM 12C6-Glc, 10 mM Na 13C2-L-Lac in Glc free NB-A Medium
Table 3 1 Glucose 2 Neurobasal-A (Invitrogen life technologies, see Appendix II for details) 3 L-Lactate
NMR Samples for supernatant:
Samples for analyzing cell culture the supernatants were collected at day 14 (72 hours after
beginning of lactate treatment) from each well of a corresponding condition and kept frozen at
-80 °C until the measurement began. After defrosting, 5 % [v/v] D2O was added to 170 µl
supernatant and the samples were transferred into 3 mm NMR tubes for measurement.

60
NMR Samples for cell extract:
Cell extracts were prepared at day 14 (72 h after beginning of lactate treatment).Therefore, the
cover slips with the neurons were washed twice in PBS, (phosphate buffered saline), pH 7.4,
immersed in 300 µl PBS, placed in a pre-heated beaker with water and irradiated for 20 sec by
microwave (at 800 Watts). Boiling stops any enzymatic activity which might degrade the
NAA. The crude lysate was kept frozen at -80 °C until measurement. After thawing, cell and
glas debries were removed by centrifugation (2 min at 0.3g). 170 µl of cell extract of neurons
and were supplemented with 5 % [v/v] D2O and transferred to a 3 mm NMR tube.
NMR sample for in cell experiment:
For in cell detection of NAA cells of eight 10 cm plates were dissociated by scraping with a
silicone cell scrapper and pooled in a 2 ml Eppendorf tube, and were then centrifuged for 2
min at 300rpm. After separation of supernatant cells were suspended in 100 µl of NB medium
containing 10% [v/v] D2O. The cell suspension was transferred to a 3 mm NMR tube for
measurement. An example of how the sample appeared is presented in Fig 9.
Fig 9. In cell NMR sample made of eight 10 cm plates in a 3 mm NMR tube. The cells were suspended in 100 µM fresh NB medium and 10% D2O.
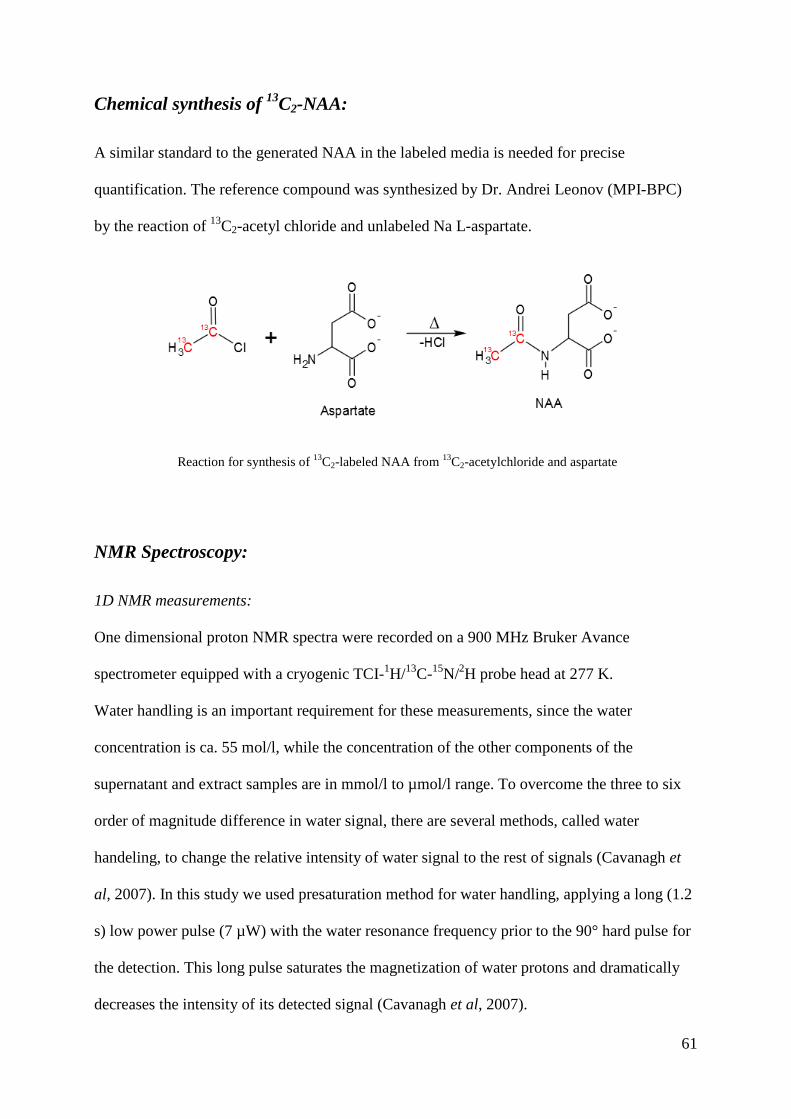
61
Chemical synthesis of 13C2-NAA:
A similar standard to the generated NAA in the labeled media is needed for precise
quantification. The reference compound was synthesized by Dr. Andrei Leonov (MPI-BPC)
by the reaction of 13C2-acetyl chloride and unlabeled Na L-aspartate.
Reaction for synthesis of 13C2-labeled NAA from 13C2-acetylchloride and aspartate
NMR Spectroscopy:
1D NMR measurements:
One dimensional proton NMR spectra were recorded on a 900 MHz Bruker Avance
spectrometer equipped with a cryogenic TCI-1H/13C-15N/2H probe head at 277 K.
Water handling is an important requirement for these measurements, since the water
concentration is ca. 55 mol/l, while the concentration of the other components of the
supernatant and extract samples are in mmol/l to µmol/l range. To overcome the three to six
order of magnitude difference in water signal, there are several methods, called water
handeling, to change the relative intensity of water signal to the rest of signals (Cavanagh et
al, 2007). In this study we used presaturation method for water handling, applying a long (1.2
s) low power pulse (7 µW) with the water resonance frequency prior to the 90° hard pulse for
the detection. This long pulse saturates the magnetization of water protons and dramatically
decreases the intensity of its detected signal (Cavanagh et al, 2007).

62
T2 Filtering:
Larger molecules in the sample have longer tumbling time and therefore they feature faster
transverse relaxation rate (green curve in fig. 10). Faster transverse relaxation rate of a time
domain signal leads to broader signal in the spectrum, which causes overlap and large
uncertainty in the intensity measurements. To discriminate and replace these signals from
spectra, the magnetization should be kept in the transverse plane by series of spin-echoes,
called T2-filtering, for a relatively short period. In this period the slowly tumbling molecules
lose their coherence more rapidly than the small molecules. The T2-filtering was implemented
by the CPMG-z pulse sequence from Rastelli et al (2009). This experiment uses the chemical
shift evolution refocusing during the wait period (shown as yellow box in Fig. 10) and Carr-
Purcell-Meiboom-Gill (CPMG) spin-echo trains of the kind (τ−πφ−τ)n as T2-filter.
Fig 10 T2-filtering is used to eliminate the signals arising from large molecules (green) with fast transverse relaxation rate, while keeping the magnetization of small molecules (black).
2D NMR measurements:
T2-Filter
Inte
nsit
Time
Slow decay: Small molecules
Fast decay: Large species

63
All 2D NMR measurements were done on a 700 MHz Bruker Avance spectrometer equipped
with a cryogenic TCI-1H/13C-15N/2H probe head at 277 K. For each sample a 13C, 1H-HSQC
spectrum was recorded with 13C decoupling during the acquisition. The spectra were recorded
with 2048 and 300 complex points in the direct (t2) and the indirect (t1) dimensions,
respectively with 32 scans per t1 increment. Frequency discrimination was achieved with the
States-TPPI scheme. Each experiment required 212 minutes.
All time domain data were processed in the same manner with TopSpin 1.2 ® software. The
data were zero filled to 4096 and 1024 point in t1 and t2, respectively. After implementing a
time domain solvent correction, a sine-bell window function was applied and subsequently
Fourier transformed in t2 and t1. Finally an automatic polynomial baseline correction in the
frequency domain was applied in both dimensions. The position of 13C-methyl signal of NAA
was confirmed based on its chemical shift in compare to the reference compound (13C2-NAA)
in supernatant and cell extract. The intensity of 13C,1H-methyl cross peak was taken to
estimate the concentration of NAA in each sample by comparison to a reference spectrum of
pure 13C2-NAA.

64
Results and Discussion:
Quantification of NAA using NMR
The first and easiest attempt to quantify the NAA (without any labeling) in a solution is 1D
proton NMR spectroscopy and comparison to an internal or external standard. In a 1D proton
spectrum of NAA we observed four peak sets for three methyl protons (2.01 ppm), two
methylene protons (2.49 and 2.67 ppm), one methine proton (4.37 ppm) and one amide proton
(7.91 ppm) (Fig. 11).
Fig 11. 1H-Spectrum of pure NAA (10mM) in PBS at pH=6.8 and 298 K on a Bruker Avance 900MHz Spectrometer, equipped with a cryogenic TCI 1H/13C-15N/2H probe head. Time domain contains 16384 complex data points taken from 16 scans of presaturation experiment and multiplied by a cosine-bell function and zero filled with 16384 points prior to Fourier transformation. After Fourier transformation frequency domain data went on a zeroth order phase correction and first order polynomial baseline correction.Chemical shifts of protons from high field to low field: 2.01, singlet, 3H, CH3 ; 2.48, doublet of doublets, 1H, CH(H); 2.68, doublet of doublets, 1H, CH(H); 4.38, multiplet, 1H, CH; 7.91, broad doublet, 1H, NH. (For clarity of multiplicity the spectrum extracts between 4.30-4.45 and 7.80-8.00 were scaled in a different manner.)
The quantification of NA in the sub-micromolar concentrations is possible, but the
experiments must be run long enough. The methyl protons signal as it is a singlet and has the

65
highest intensity. Therefore, we compared peaks belonging to this proton in order to measure
the amount of NAA. However, in principle other peaks could also be used.
Fig 12. Comparison between 1H-NMR spectrum of 10mM NAA (red) and 1µM NAA (blue) in the methyl region. The 10mM spectrum is scaled down by factor of 104. All conditions were the same in both spectra and the same as reported in Fig. 11. Else than number of scans (NS=1024).
Determination of NAA in supernatant of neurons by 1H-NMR
The 1D proton spectrum of supernatant of neurons cultured in neurobasal medium is crowded
at the chemical shift regions, where the NAA signal would arise (fig 13). Peak overlap is
caused by resonance from large molecular species in the supernatant and exchangeable
protons (like -OH groups). The only signal which is observed at a less crowded area is the
amide proton. However, this signal is not very suitable for quantitative analysis because of its
low intensity and line broadening.

66
Fig 13. 1H-Spectrum of supernatant at 277 K on a Bruker Avance 900MHz Spectrometer, equipped with a cryogenic TCI 1H/13C-15N/2H probe head. Time domain contains 16384 complex data points taken from 16 scans of presaturation experiment and multiplied by a cosine-bell function and zero filled with 16384 points prior to Fourier transformation. After Fourier transformation frequency domain data went on a zeroth order phase correction and first order polynomial baseline correction.
In order to remove the effect of large species and exchangeable protons which have a very
short transverse relaxation time we employed a T2-Filtering method (Fig. 10 discussed in the
previous chapter). The results show the exclusion of signals from large species (Fig. 13 and
14).Yet, the overlapping from the other small molecules is still hinders the separation of the
desired peaks, especially the methyl signal of NAA at 2.01 ppm, which potentially could be
used for quantification of NAA. The same for 1D in-cell spectra (spectrum in blue in fig. 14)
it was impossible to quantify the NAA level out of methyl proton signals despite using T2-
filtering.

67
Fig 14. T2-filtered 1H-Spectrum of neurons (in-cell) in blue and the supernatant in red at 277 K on a Bruker Avance 900MHz Spectrometer, equipped with a cryogenic TCI 1H/13C-15N/2H probe head. Time domain contains 16384 complex data points taken from 16 scans of CMPG-z experiment with 4 loops of 10 ms and multiplied by a cosine-bell function and zero filled with 16384 points prior to Fourier transformation. After Fourier transformation frequency domain data went on a zeroth order phase correction and first order polynomial baseline correction.
Quantification of NAA via labeling and 2D 13C, 1H-HSQC
As described in previous chapter the source of acetyl group of NAA is from the glycolysis
pathway and its products. The 2D 13C, 1H-HSQC spectrum of the supernatant of neurons
cultured in 13C6-Glc labeled neurobasal medium shows an isolated cross peak for methyl
group of NAA at 2.01 ppm in proton and 21.94 ppm in carbon dimension (Fig. 15a). This
signal is absent, if the medium contains unlabeled glucose, revealing that glucose is the
original source for the NAA acetyl group. The intensity of NAA-methyl cross peak was used
for determination of NAA concentration by comparison to an external standard of NAA in
NB medium at the same pH and temperature. In figure 15b you see 1D slices of supernatant
spectrum and the external NAA standard with the scaling factor, which was used to determine
the unknown concentration.

68
a)
b)
Fig 15. a. Extract of 1H, 13C –HSQC spectrum of supernatant in the NAA-methyl region (left panel), which measured at 277 K on a Bruker Avance 700MHz Spectrometer, equipped with a cryogenic TCI 1H/13C-15N/2H probe head. 13C, 1H-HSQC spectrum was recorded with 13C decoupling during the acquisition. The spectra were recorded with 2048 and 300 complex points in the direct (t2) and the indirect (t1) dimensions, respectively with 32 scans per t1 increment. Frequency discrimination was achieved with the States-TPPI scheme. Each experiment required 212 minutes. The time domain data were zero filled to 4096 and 1024 point in t1 and t2, respectively. After implementing a time domain solvent correction, a sine-bell window function was applied and subsequently and Fourier transformed in t2 and t1. Finally a polynomial baseline correction in the frequency domain was applied in both dimensions. b. Right panel shows a 1D slice in the 1H dimension for 13C-chemical shift at 22 ppm.
2D in cell spectrum of neurons and cell extracts
In the 2D 13C, 1H-HSQC spectrum of neurons harvested from 8 plates (corresponding to
9.6x10⁷ plated cells) we observe larger line broadening than in solution as expected due to
increased viscosity within the cells and subsequently slower tumbling of molecules and the
field inhomogeneity within the sample. This leads to a severe overlapping in the region,
where NAA signal is expected to occur (fig 16a). According to the literature
(Edden et al., 2007; Eldon et al., 2008) the other two peaks which were present at this area
belong to methyl groups of NAAG and NAGA (table 4). This problem was also identified by
MRS studies that attempted to quantify the amount of NAA in the brain (Edden et al., 2007).

69
1H chemical shift (ppm) 13C chemical shift (ppm)
NAA-methyl 2.01 21.94
NAAG-methyl 2.04 21.88
NAGA-methyl 2.07 22.13
Table 4. Chemical shifts of other methyl groups around the NAA methyl peak.. All chemical shifts arereferenced with respect to DSS at 277 K.
Using cell extracts helps us to overcome the overlapping issue as shown in figure 16b
compared to the in cell spectrum (fig 16c). Estimation of NAA content was performed in the
same manner as for the supernatant via an external standard.
Fig 16. Extract of 1H, 13C –HSQC spectrum of neurons (a) and cell extract (b) and overlay (c) in the NAA-methyl region, which measured at 277 K on a Bruker Avance 900MHz Spectrometer. Other experimental parameters were set as the same in the figure 10.

70
Neurons respond to different lactate treatments
The neurons were treated with 13C2-L-lactate with increasing concentrations of 0, 1, 5 and
10 mM to investigate the main hypothesis of lactic acidosis prevention by NAA production in
response to high lactate concentration. Each concentration measurement was repeated in
biological triplicate. In order to keep the osmotic pressure and ionic strength constant, all
samples contained 10, 9, 5 and 0 mM NaCl, respectively. For the analysis of data from
quantification of NAA in the samples we assume the number of cells was similar between
samples. Here we report for each treatment an average of concentrations and one standard
deviation as the uncertainty. The mean concentrations of NAA in supernatant and cell extract
are visualized in figure 17a and 17b. A rise in NAA concentration is observed linked with
increasing amount of lactate treatment. In absence of lactate a basic level of released NAA in
the supernatant can be observed ([NAA]0mM = 1.2±0.7 µM). The low level of NAA in the “no
lactate” experiment causes a low signal to noise ratio, which results in high uncertainty of 0.7
µM. As the medium is labeled with 13C-glucose we can conclude that the base level of NAA
is synthesized from glycolysis pathway. The results of treatment with 1mM lactate show a
slight but significant elevation of released NAA in comparison with non treated neurons
([NAA]1mM = 2.4±0.2 µM; pt-test=0.013 < 0.05). Although the values for 5 mM lactate
treatments indicate no significant change to 1 mM treatment ([NAA]5mM = 2.6±0.2 µM;
pt-test=0.12 > 0.05), it is still significantly higher than the samples without lactate treatment
(pt-test=0.017 < 0.05). The neurons treated by 10 mM of lactate released 3.9±0.3 µM, which is
larger than NAA concentration in absence of lactate (pt-test=0.004 < 0.05).
In contrast with the results from the supernatant, the NAA concentration in the cell extracts
stays constant at all different conditions. In absence of lactate the amount of NAA was
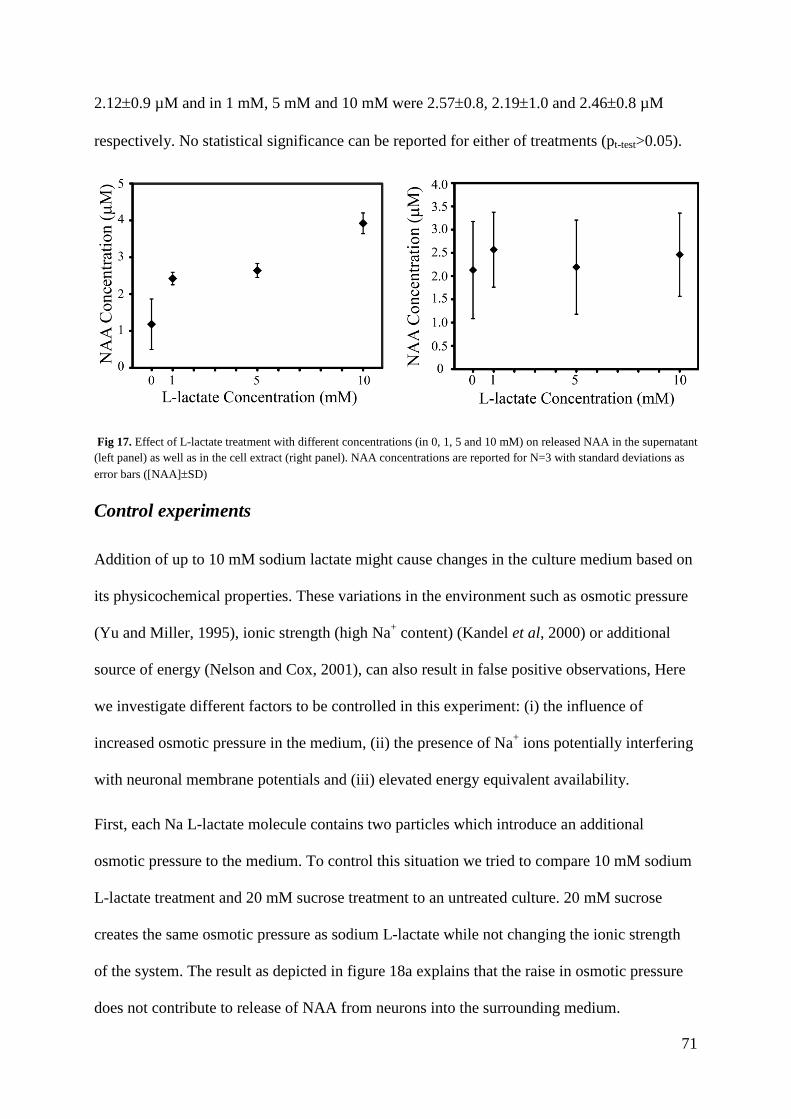
71
2.12±0.9 µM and in 1 mM, 5 mM and 10 mM were 2.57±0.8, 2.19±1.0 and 2.46±0.8 µM
respectively. No statistical significance can be reported for either of treatments (pt-test>0.05).
Fig 17. Effect of L-lactate treatment with different concentrations (in 0, 1, 5 and 10 mM) on released NAA in the supernatant (left panel) as well as in the cell extract (right panel). NAA concentrations are reported for N=3 with standard deviations as error bars ([NAA]±SD)
Control experiments
Addition of up to 10 mM sodium lactate might cause changes in the culture medium based on
its physicochemical properties. These variations in the environment such as osmotic pressure
(Yu and Miller, 1995), ionic strength (high Na+ content) (Kandel et al, 2000) or additional
source of energy (Nelson and Cox, 2001), can also result in false positive observations, Here
we investigate different factors to be controlled in this experiment: (i) the influence of
increased osmotic pressure in the medium, (ii) the presence of Na+ ions potentially interfering
with neuronal membrane potentials and (iii) elevated energy equivalent availability.
First, each Na L-lactate molecule contains two particles which introduce an additional
osmotic pressure to the medium. To control this situation we tried to compare 10 mM sodium
L-lactate treatment and 20 mM sucrose treatment to an untreated culture. 20 mM sucrose
creates the same osmotic pressure as sodium L-lactate while not changing the ionic strength
of the system. The result as depicted in figure 18a explains that the raise in osmotic pressure
does not contribute to release of NAA from neurons into the surrounding medium.

72
Second: addition of 10 mM sodium L-lactate increases the ionic strength of the culture
environment, esp. by addition of 10mM Na+. This could potentially act on neuronal
membrane potential, resulting in hyper polarization. In order to exclude Na+ mediated effects
on NAA release, we performed a control experiment in which the neurons were treated with
10 mM NaCl. The detected NAA contents in the NaCl sample do not vary when compared
with the untreated control sample (Fig. 18b). This observation indicates that the higher ionic
strength is not associated with NAA release into the supernatant.
Fig 18. Control experiments for osmotic pressure (left panel) and ionic strength (right panel) of 10 mM L-lactate treatment.
NAA concentrations are reported for N=2 with standard deviations as error bars ([NAA]±SD; * : p<0.05).
Third, L-lactate can be used by cells for catabolism via the tricarboxylic acid cycle and
subsequent oxidative phosphorylation. Considering the cellular energetic and metabolism of
glucose and lactate (Nelson and Cox, 2000) the number of ATPs produced from glucose is
approximately twice of ATP molecules generated from lactate. In order to check the
possibility that an increased energy load of the cells results in elevated NAA secretion, an
additional equivalent of glucose was added to the cultures (30 mM 13C6-glusoce instead of
25 mM 13C6 –glucose). NAA synthesis or release was not increased as we treated the neurons
with 30 mM 13C6-glusoce instead of 25 mM 13C6 -glucose in the control (Fig 19).
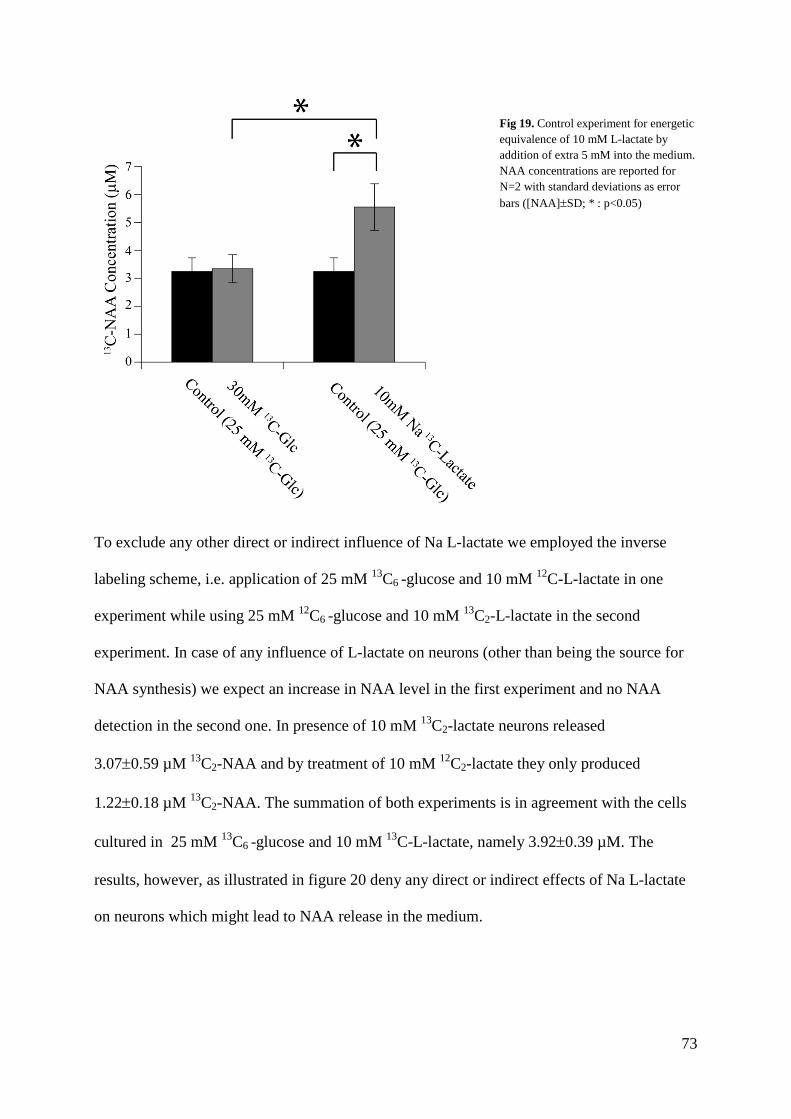
73
Fig 19. Control experiment for energetic equivalence of 10 mM L-lactate by addition of extra 5 mM into the medium. NAA concentrations are reported for N=2 with standard deviations as error bars ([NAA]±SD; * : p<0.05)
To exclude any other direct or indirect influence of Na L-lactate we employed the inverse
labeling scheme, i.e. application of 25 mM 13C6 -glucose and 10 mM 12C-L-lactate in one
experiment while using 25 mM 12C6 -glucose and 10 mM 13C2-L-lactate in the second
experiment. In case of any influence of L-lactate on neurons (other than being the source for
NAA synthesis) we expect an increase in NAA level in the first experiment and no NAA
detection in the second one. In presence of 10 mM 13C2-lactate neurons released
3.07±0.59 µM 13C2-NAA and by treatment of 10 mM 12C2-lactate they only produced
1.22±0.18 µM 13C2-NAA. The summation of both experiments is in agreement with the cells
cultured in 25 mM 13C6 -glucose and 10 mM 13C-L-lactate, namely 3.92±0.39 µM. The
results, however, as illustrated in figure 20 deny any direct or indirect effects of Na L-lactate
on neurons which might lead to NAA release in the medium.

74
Fig 20. Inverse labeling using non labeled glucose in presence of 13C-labeled L-lactate as well as 13C-labeled glucose in presence of non labeled L-lactate. NAA concentrations are reported for N=3 with standard deviations as error bars ([NAA]±SD; * : p<0.05)

75
Conclusion:
In this work we developed a method to directly detect and quantify the amount of NAA within
the supernatant of rat cortical neuron cultures, which is based on a specific isotope labeling
scheme and two dimensional NMR spectroscopy. As hypothesized the NAA production in the
neurons is dependent on lactate being present. The experiments presented here showed an
increasing level of secreted NAA in the supernatant as a function of elevated lactate
concentrations in the culture medium. Different control experiments revealed that the induced
osmotic pressure, ionic strength of sodium lactate or increased energy supply were not the
cause to promote NAA synthesis from glucose or the release of it. The internally produced
lactate as one of the products of the glycolysis pathway was not evident as the only source for
the NAA synthesis. The alternative hypothesis that assumes a stimulatory effect of lactate
molecules on neurons to induce the release of NAA without being involved in the NAA
synthesis, were not supported by the results using treatment of unlabeled lactate on neurons.
The intracellular concentration of NAA was estimated to be rather constant at different lactate
treatments. This might show that neurons are trying to keep the intracellular concentration of
NAA at the certain level, while the excess amount is released to the supernatant.
According to the work of Fünfschilling et al., oligodendrocytes remain intact in the absence of
complete glucose oxidation (like Warburg effect) (Fünfschilling et al., 2012) and stay
functional by means of glycolysis pathway. The products of this pathway such as pyruvate
and lactate are released into the periaxonal space, where neurons take up these compounds
(Lee et al., 2012). Putting together that neurons posses a transporter for lactate, namely MCT2
to import it from extracellular medium (Lee et al., 2012) and proof of a neurospecific enzyme
which transforms L-aspartate to NAA using Acetyl-CoA, called NAT8L as observed in
knockout mice (unpublished results) we can suggest that the synthesis of NAA is the primary
pathway to buffer the excess lactate to avoid acidosis at resting conditions.

76
Fig 21. Metabolic pathway model for NAA synthesis and release in the myelinated axons. Although all the steps are well
known, but the key function of NAA is still unclear, which was the main goal of this thesis.
The finding of this study is shedding light on the unknown function of NAA in the brain by
interconnecting the role of lactate in the myelinated neurons to the correlation of NAA
synthesis and present amount of lactate.For further investigation of NAA role as an well
feeding signal from neurons, treatment of oligondendoglia with different NAA concentration
is suggested to observe the lactate release profile of oligodendrocytes.

77
References:
Abragam, A. (1961) “Principles of nuclear magnetism”. pp. 1-599. Clarendon Press, Oxford.
Akke, M., Bruschweiler, R.,Palmer, A.G. (1993) Nmr Order Parameters and Free-Energy -
an Analytical Approach and Its Application to Cooperative Ca2+ Binding by
Calbindin-D(9k). J Am Chem Soc 115: 9832-9833.
Ariyannur, P. S., Madhavarao, C. N. and Namboodiri, A. M. (2008) N-acetylaspartate
synthesis in the brain: mitochondria vs. microsomes. Brain Res. 1227: 34–41.
Baldwin, R.L. (1986) Temperature-Dependence of the Hydrophobic Interaction in Protein
Folding. Proc Natl Acad Sci USA 83: 8069-8072.
Brainard, J.R. and Szabo, A. (1981) Theory for nuclear magnetic relaxation of probes in
anisotropic systems: application to cholesterol in phospholipid vesicles. Biochemistry
20, 4618-4628.
Brutscher, B., Bruschweiler, R. and Ernst, R.R. (1997) Backbone dynamics and structural
characterization of the partially folded A state of ubiquitin by H-1, C-13, and N-15
nuclear magnetic resonance spectroscopy. Biochemistry 36: 13043-13053.
Cavanagh, J., Fairbrother, W.J., Palmer III, A.G., Rance, M. and Skelton, N.J. (2007)
“Protein NMR Spectroscopy”. pp. 1-885. Academic Press, Elsevier Inc.
Chakraborty, G., Mekala, P., Yahya, D., Wu, G. and Ledeen, R. W. (2001) Intraneuronal N-
acetylaspartate supplies acetyl groups for myelin lipid synthesis: evidence for myelin-
associated aspartoacylase. J. Neurochem. 78, 736–45.
Cordier, F. and Grzesiek, S. (2002) Temperature-dependence properties as studied by of
protein hydrogen bond high-resolution NMR. J Mol Biol 317: 739-752.
78
Delaglio, F, Grzesiek, S, Vuister, GW, Zhu, G, Pfeifer, J,Bax, A (1995) Nmrpipe - a
Multidimensional Spectral Processing System Based on Unix Pipes. J Biomol NMR
6: 277-293.
Edden, R.A.E., Pomper, M.G., Barker, P.B. (2007) In vivo differentiation of N-acetyl
aspartyl glutamate from N-acetyl aspartate at 3-Tesla. Mag. Res. in Med. 57, 977-
982.
Eldon L. Ulrich; Hideo Akutsu; Jurgen F. Doreleijers; Yoko Harano; Yannis E. Ioannidis;
Jundong Lin; Miron Livny; Steve Mading; Dimitri Maziuk; Zachary Miller; Eiichi
Nakatani; Christopher F. Schulte; David E. Tolmie; R. Kent Wenger; Hongyang Yao;
John L. Markley;(2008) "BioMagResBank", Nucleic Acids Research 36, D402-D408
Fares, C., Lakomek, N.A., Walter, K.F.A., Frank, B.T.C., Meiler, J.,Becker, S., Griesinger,
C. (2009) Accessing ns-mu s side chain dynamics in ubiquitin with methyl RDCs. J
Biomol NMR 45: 23-44.
Fünfschilling U., Supplie LM., Mahad ,D., Boretius, S., Saab AS., Edgar ,J. , Brinkmann
GB., Kassmann CM., Tzvetanova ID., Möbius, W., Diaz, F., Meijer, D., Suter, U.,
Hamprecht, B., Sereda, MW., Moraes, CT., Frahm, J., Goebbels, S. and Nave, K,-A.
(2012) Glycolytic oligodendrocytes maintain myelin and long-term axonal integrity.
Nature 485, 517-521.
Gans, P., Hamelin, O., Sounier, R., Ayala, I., Dura, M.A., Amero, C.D., Noirclerc-Savoye,
M., Franzetti, B., Plevin, M.J.,Boisbouvier, J. (2010) Stereospecific isotopic labeling
of methyl groups for NMR spectroscopic studies of high-molecular-weight proteins.
Angew Chem Int Ed Engl 49: 1958-1962.
Godoy-Ruiz, R., Guo, C.,Tugarinov, V. (2010) Alanine methyl groups as NMR probes of
molecular structure and dynamics in high-molecular-weight proteins. J Am Chem Soc

79
132: 18340-18350.
Gomez, J., Hilser, V.J., Xie, D.,Freire, E. (1995) The Heat-Capacity of Proteins. Proteins 22:
404-412.
Goto, N.K., Gardner, K.H., Mueller, G.A., Willis, R.C.,Kay, L.E. (1999) A robust and cost-
effective method for the production of Val, Leu, Ile (delta 1) methyl-protonated 15N-,
13C-, 2H-labeled proteins. J Biomol NMR 13: 369-374.
Handel, T.M., Johnson, E.C., Lazar, G.A., Desjarlais, J.R. (1999) Solution structure and
dynamics of a designed hydrophobic core variant of ubiquitin. Struct Fold Des 7:
967-976.
Kay, LE, Bull, TE, Nicholson, LK, Griesinger, C, Schwalbe, H, Bax, A,Torchia, DA (1992)
The Measurement of Heteronuclear Transverse Relaxation-Times in Ax3 Spin
Systems Via Polarization-Transfer Techniques. J Magn Reson 100: 538-558.
Kay, LE, Torchia, DA,Bax, A (1989) Backbone Dynamics of Proteins as Studied by N-15
Inverse Detected Heteronuclear Nmr-Spectroscopy - Application to Staphylococcal
Nuclease. Biochemistry 28: 8972-8979.
Kay, LE,Torchia, DA (1991) The Effects of Dipolar Cross-Correlation on C-13 Methyl-
Carbon T1, T2, and Noe Measurements in Macromolecules. J Magn Reson 95: 536-
547.
Keller, R (2004) Computer Aided Resonance Assignment. http://caranmrch/.
Koradi, R, Billeter, M,Wuthrich, K (1996) MOLMOL: A program for display and analysis of
macromolecular structures. J Mol Graphics 14: 51-55.
Lee, A.L. and Wand, A.J. (2001) Microscopic origins of entropy, heat capacity and the glass
transition in proteins. Nature 411: 501-504.

80
Lee, AL, Flynn, PF,Wand, AJ (1999) Comparison of H-2 and C-13 NMR relaxation
techniques for the study of protein methyl group dynamics in solution. J Am Chem
Soc 121: 2891-2902.
Lee, AL, Sharp, KA, Kranz, JK, Song, XJ,Wand, AJ (2002) Temperature dependence of the
internal dynamics of a calmodulin-peptide complex. Biochemistry 41: 13814-13825.
Lee, D., Hilty, C., Wider, G. and Wuthrich, K. (2006) Effective rotational correlation times
of proteins from NMR relaxation interference. J Magn Reson 178: 72-76.
Lee, Y., Morrison, BM., Li, Y., Lengacher, S., Farah MH., Hoffman, PN., Liu, Y., Tsingalia,
A., Jin, L., Zhang, PW., Pellerin, L., Magistretti, PJ. and Rothstein, JD. (2012)
Oligodendroglia metabolically support axons and contribute to neurodegeneration.
Nature 487, 443-448.
Li, ZG, Raychaudhuri, S,Wand, AJ (1996) Insights into the local residual entropy of proteins
provided by NMR relaxation. Protein Science 5: 2647-2650.
Liao, X, Long, D, Li, DW, Bruschweiler, R,Tugarinov, V (2012) Probing side-chain
dynamics in proteins by the measurement of nine deuterium relaxation rates per
methyl group. J Phys Chem B 116: 606-620.
Lipari, G,Szabo, A (1982a) Model-Free Approach to the Interpretation of Nuclear Magnetic-
Resonance Relaxation in Macromolecules .1. Theory and Range of Validity. J Am
Chem Soc 104: 4546-4559.
Lipari, G,Szabo, A (1982b) Model-Free Approach to the Interpretation of Nuclear Magnetic-
Resonance Relaxation in Macromolecules .2. Analysis of Experimental Results. J Am
Chem Soc 104: 4559-4570.
Liu, WD, Zheng, Y, Cistola, DP,Yang, DW (2003) Measurement of methyl C-13-H-1 cross-

81
correlation in uniformly C-13-, N-15-, labeled proteins. J Biomol NMR 27: 351-364.
Lu, Z. H., Chakraborty, G., Ledeen, R. W., Yahya, D. and Wu, G. (2004) N-acetylaspartate
synthase is bimodally expressed in microsomes and mitochondria of brain. Mol.
Brain Res. 122: 71–78.
Malaton, R., Michals, K., Sebeta, D., Deanching, M. Gashkoff, P. and Casanova, J. (1988)
Aspartoacylase deficiency and N-acetylaspartatic aciduria in patients with Canavan
disease. Am. J. Med. Genet. 29, 463-471.
Mandel, AM, Akke, M,Palmer, AG (1996) Dynamics of ribonuclease H: Temperature
dependence of motions on multiple time scales. Biochemistry 35: 16009-16023.
Marion, D, Ikura, M, Tschudin, R,Bax, A (1989) Rapid Recording of 2d Nmr-Spectra
without Phase Cycling - Application to the Study of Hydrogen-Exchange in Proteins.
J Magn Reson 85: 393-399.
Millet, O, Muhandiram, DR, Skrynnikov, NR,Kay, LE (2002) Deuterium spin probes of side-
chain dynamics in proteins. 1. Measurement of five relaxation rates per deuteron in
(13)C-labeled and fractionally (2)H-enriched proteins in solution. J Am Chem Soc
124: 6439-6448.
Moffett, J. R. and Namboodiri, A. M. (2006) Preface: a brief review of N-acetylaspartate.
Adv. Exp. Med. Biol. 576, vii–xiii.
Moffett, J.R., Ross, B., Arun, P., Madhavarao, C.N., Namboodiri, A.M.A. (2007) N-
Acetylaspartate in the CNS: From neurodiagnostics to neurobiology. Progress in
Neurobiology 81: 89-131.
Muhandiram, DR, Yamazaki, T, Sykes, BD,Kay, LE (1995) Measurement of H-2 T-1 and T-
1p Relaxation-Times in Uniformly C-13-Labeled and Fractionally H-2-Labeled

82
Proteins in Solution. J Am Chem Soc 117: 11536-11544.
Müller, N, Bodenhausen, G,Ernst, RR (1987) Relaxation-Induced Violations of Coherence
Transfer Selection-Rules in Nuclear-Magnetic-Resonance. J Magn Reson 75: 297-
334.
Nash, L.K. (1974) “Elements of Statistical Thermodynamics”, Addison-Wesley, Reading,
MA.
Nave K,-A. (2010) Myelination and the trophic support of long axons. Nat. Rev. 11, 275-
283.
Pierre, K. and Pellerin, L. (2005) Monocarboxylate transporters in the central nervous
system: distribution, regulation and function. J. Neurochem. 94, 1–14.
Prabhu, NV,Sharp, KA (2005) Heat capacity in proteins. Annual Review of Physical
Chemistry 56: 521-548.
Privalov, PL,Gill, SJ (1988) Stability of Protein-Structure and Hydrophobic Interaction. Adv
Protein Chem 39: 191-234.
Rasterilli, F., Jhu, Satadru and Mancin, F. (2009) Seeing through Macromolecules: T2-
Filtered NMR for the purity assay of functionalized nanosystems and the screening of
biofluids. J. Amer. Chem. Soc. 131, 14222-14224.
Rinholm, JE. and Bergersen, LH. (2012) The wrap that feeds the neurons. Nature 487, 435-
436.
Ruschak, AM, Velyvis, A,Kay, LE (2010) A simple strategy for (1)(3)C, (1)H labeling at the
Ile-gamma2 methyl position in highly deuterated proteins. J Biomol NMR 48: 129-
135.
Sabo, T. M., Bakhtiari, D., Walter, K.F.A., McAllaister, R., Giller, K., Becker, S.,

83
Griesinger, C., Lee, D. (2012) Thermal coefficients of methyl groups within
ubiquitin. Protein Science, 21: 562–570.
Schwalbe, H., Carlomagno, T., Henning, M., Junker, J., Reif, B., Richter, C. and Griesinger,
C. (2001) Cross-Correlated Relaxation for Measurement of Angels between Tensorial
Interactions. Methods in Enzymology 388, 35-81.
Seewald, MJ, Stone, MJ, Seewald, MJ, Pichumani, K, Stowell, C, Tibbals, BV,Regan, L. and
Stone, MJ. (2000) The role of backbone conformational heat capacity in protein
stability: Temperature dependent dynamics of the B1 domain of Streptococcal protein
G. Protein Science 9: 1177-1193.
Tahay G., Wiame, E., Tyteca, D., Pierre Courtoy, P.J., and Van Schaftingen, E. (2012)
Determinants of the enzymatic activity and the subcellular localization of aspartate N-
acetyltransferase. Biochem. J. 441: 105–112.
Thomas, ST,Makhatadze, GI (2000) Contribution of the 30/36 hydrophobic contact at the C-
terminus of the alpha-helix to the stability of the ubiquitin molecule. Biochemistry
39: 10275-10283.
Tugarinov, V, Hwang, PM, Ollerenshaw, JE,Kay, LE (2003) Cross-correlated relaxation
enhanced 1H[bond]13C NMR spectroscopy of methyl groups in very high molecular
weight proteins and protein complexes. J Am Chem Soc 125: 10420-10428.
Vijaykumar, S, Bugg, CE,Cook, WJ (1987) Structure of Ubiquitin Refined at 1.8 a
Resolution. J Mol Biol 194: 531-544.
Vinther, J.M., Kristensen, SM and Led, JJ. (2011) Enhanced Stability of a Protein with
Increasing Temperature. J Am Chem Soc 133: 271-278.
Vugmeyster, L, Trott, O, McKnight, CJ, Raleigh, DP,Palmer, AG (2002) Temperature-

84
dependent dynamics of the villin headpiece helical subdomain, an unusually small
thermostable protein. J Mol Biol 320: 841-854.
Wand, AJ, Babu, C.R.,Hilser, V.J. and Wand, A.J. (2004) Direct access to the cooperative
substructure of proteins and the protein ensemble via cold denaturation. Nat Struct
Mol Biol 11: 352-357.
Wand, AJ, Song, X.J., Flynn, P.F.,Sharp, K.A. and Wand, A.J. (2007) Temperature
dependence of fast dynamics in proteins. Biophys J 92: L43-L45.
Went, H.M. and Jackson, S.E. (2005) Ubiquitin folds through a highly polarized transition
state. Protein Eng Des Sel 18: 229-237.
Wiame, E., Tyteca, D., Pierrot, N., Collard, F., Amyere, M., Noel, G., Desmedt, J.,
Nassogne, M.-C., Vikkula, M., Octave, J.-N., Vincent, M.-F., Courtoy, P.J.,
Bolthauser, E. and Van Schaftingen, E. (2010) Molecular identification of aspartate
N-acetyltransferase and its mutation in hypoacetylaspartia. Biochem. J. 425:127-136.
Wintrode, PL, Makhatadze, GI,Privalov, PL (1994) Thermodynamics of Ubiquitin
Unfolding. Proteins 18: 246-253.
Wroblewska, B., Santi, M. R. and Neale, J. H. (1998) N-acetylaspartylglutamate activates
cyclic AMP-coupled metabotropic glutamate receptors in cerebellar astrocytes. Glia
24, 172–179.
Yang, DW and Kay, LE (1996) Contributions to conformational entropy arising from bond
vector fluctuations measured from NMR-derived order parameters: Application to
protein folding. J Mol Biol 263: 369-382.
Yang, DW, Mok, YK, FormanKay, JD, Farrow, NA and Kay, LE (1997) Contributions to
protein entropy and heat capacity from bond vector motions measured by NMR spin

85
relaxation. J Mol Biol 272: 790-804.
Zalc, B. and Colman, DR. (2000) Orgins of vertebrate success. Science 288, 271-272.
Zhang, X, Sui, XG,Yang, DW (2006) Probing methyl dynamics from C-13 autocorrelated
and cross-correlated relaxation. J Am Chem Soc 128: 5073-5081.

86
Appendix I
Table SI. Cross-correlated relaxation (CCR) rates between dipolar couplings of two CH bonds (σobs) in the methyl groups of ubiquitin measured at fourteen temperatures a
σ obs275K (s-1) σ obs
278K ( s-1) σ obs281K ( s-1) σ obs
283K ( s-1) σ obs286K ( s-1) σ obs
288K ( s-1) σ obs291K ( s-1)
I3γ2 10.67 ± 0.21 9.36 ± 0.16 8.41 ± 0.14 7.69 ± 0.12 6.80 ± 0.09 6.28 ± 0.10 5.69 ± 0.09 I3δ1 8.97 ± 0.20 7.83 ± 0.15 6.99 ± 0.14 6.35 ± 0.12 5.68 ± 0.09 5.23 ± 0.10 4.77 ± 0.10 T7γ2 9.66 ± 0.27 8.36 ± 0.20 7.58 ± 0.18 6.90 ± 0.15 6.09 ± 0.11 5.64 ± 0.12 5.11 ± 0.12 L8δ1 4.47 ± 0.09 3.80 ± 0.08 3.46 ± 0.07 3.16 ± 0.06 2.68 ± 0.05 2.53 ± 0.05 2.20 ± 0.05 T9γ2 7.58 ± 0.16 6.61 ± 0.13 5.96 ± 0.12 5.46 ± 0.10 4.74 ± 0.08 4.38 ± 0.09 3.95 ± 0.09 T12γ2 9.06 ± 0.23 7.78 ± 0.18 6.97 ± 0.16 6.35 ± 0.13 5.45 ± 0.10 5.13 ± 0.11 4.53 ± 0.11 I13δ1 6.76 ± 0.17 5.97 ± 0.13 5.27 ± 0.12 4.86 ± 0.10 4.34 ± 0.08 3.94 ± 0.09 3.54 ± 0.09 V17γ2 9.27 ± 0.23 8.03 ± 0.17 7.24 ± 0.15 6.59 ± 0.12 5.77 ± 0.09 5.38 ± 0.10 4.90 ± 0.10 T22γ2 10.59 ± 0.26 9.18 ± 0.20 8.42 ± 0.18 7.67 ± 0.14 6.76 ± 0.11 6.37 ± 0.12 5.68 ± 0.12 I23γ2 10.45 ± 0.25 9.27 ± 0.18 8.29 ± 0.16 7.59 ± 0.13 6.72 ± 0.09 6.28 ± 0.10 5.63 ± 0.10 I23δ1 6.67 ± 0.20 5.65 ± 0.15 5.06 ± 0.14 4.56 ± 0.12 4.02 ± 0.09 3.66 ± 0.10 3.29 ± 0.10 I36γ2 8.03 ± 0.21 7.11 ± 0.16 6.44 ± 0.14 6.06 ± 0.12 5.45 ± 0.09 5.17 ± 0.09 4.66 ± 0.09 I36δ1 6.91 ± 0.16 5.97 ± 0.13 5.43 ± 0.12 4.94 ± 0.10 4.33 ± 0.08 4.10 ± 0.09 3.63 ± 0.09 L43δ2 6.63 ± 0.22 5.77 ± 0.16 5.09 ± 0.15 4.48 ± 0.12 4.04 ± 0.09 3.53 ± 0.11 3.31 ± 0.09 I44δ1 3.18 ± 0.14 2.71 ± 0.12 2.48 ± 0.11 2.20 ± 0.09 1.91 ± 0.07 1.79 ± 0.08 1.57 ± 0.08 L50δ2 9.47 ± 0.35 8.43 ± 0.25 7.51 ± 0.22 6.89 ± 0.18 6.04 ± 0.13 5.61 ± 0.15 5.03 ± 0.14 L56δ2 8.70 ± 0.29 7.72 ± 0.20 6.89 ± 0.18 6.28 ± 0.15 5.63 ± 0.11 4.99 ± 0.12 4.58 ± 0.12 I61γ2 9.93 ± 0.21 8.72 ± 0.15 7.85 ± 0.14 7.18 ± 0.11 6.36 ± 0.08 5.91 ± 0.09 5.34 ± 0.09 I61δ1 7.47 ± 0.22 6.45 ± 0.17 5.75 ± 0.16 5.19 ± 0.13 4.55 ± 0.10 4.18 ± 0.11 3.72 ± 0.11 L67δ2 3.83 ± 0.11 3.39 ± 0.09 2.99 ± 0.08 2.68 ± 0.07 2.38 ± 0.05 2.14 ± 0.06 1.95 ± 0.06 V70γ2 5.09 ± 0.14 4.44 ± 0.11 3.95 ± 0.10 3.55 ± 0.08 3.06 ± 0.06 2.74 ± 0.07 2.46 ± 0.07 L73δ1 2.69 ± 0.05 2.35 ± 0.04 2.15 ± 0.04 1.94 ± 0.03 1.73 ± 0.03 1.61 ± 0.03 1.47 ± 0.03
aσobs was calculated using σ obs =1
8∆ln
9 Iα 2 β
Iαβ 2
Iα 3 I
β 3
. All errors (∆σobs) were determined from ∆σ obs =q
8∆
1
Iα 3
+1
Iα 2 β
+1
Iαβ 2
+1
Iβ 3
, where q is the noise estimation from NMRPipe, ∆
is the constant time evolution and Ii is the intensity of each peak in the quartet ( i = α 3 ,α 2β ,αβ 2 , β 3).

87
Table SI. Cross-correlated relaxation (CCR) rates between dipolar couplings of two CH bonds (σobs) in the methyl groups of ubiquitin measured at fourteen temperatures a (Continued)
σ obs293K ( s-1) σ obs
296K ( s-1) σ obs298K ( s-1) σ obs
301K ( s-1) σ obs303K ( s-1) σ obs
305K ( s-1) σ obs308K ( s-1)
I3γ2 5.34 ± 0.07 4.84 ± 0.06 4.52 ± 0.07 4.15 ± 0.05 3.94 ± 0.06 3.69 ± 0.05 3.42 ± 0.05 I3δ1 4.46 ± 0.08 4.02 ± 0.07 3.77 ± 0.07 3.52 ± 0.05 3.24 ± 0.06 3.09 ± 0.05 2.83 ± 0.05 T7γ2 4.80 ± 0.09 4.43 ± 0.08 4.16 ± 0.08 3.90 ± 0.06 3.74 ± 0.07 3.52 ± 0.06 3.23 ± 0.06 L8δ1 2.04 ± 0.04 1.84 ± 0.04 1.70 ± 0.04 1.55 ± 0.03 1.49 ± 0.04 1.44 ± 0.03 1.32 ± 0.03 T9γ2 3.67 ± 0.07 3.32 ± 0.06 3.11 ± 0.07 2.79 ± 0.05 2.72 ± 0.06 2.54 ± 0.05 2.36 ± 0.05 T12γ2 4.20 ± 0.09 3.85 ± 0.07 3.60 ± 0.08 3.20 ± 0.06 3.09 ± 0.07 2.89 ± 0.06 2.63 ± 0.06 I13δ1 3.29 ± 0.07 2.97 ± 0.06 2.76 ± 0.07 2.54 ± 0.05 2.35 ± 0.06 2.17 ± 0.05 2.04 ± 0.05 V17γ2 4.55 ± 0.07 4.09 ± 0.06 3.79 ± 0.06 3.46 ± 0.04 3.26 ± 0.06 3.13 ± 0.04 2.90 ± 0.04 T22γ2 5.26 ± 0.09 4.74 ± 0.08 4.48 ± 0.08 4.06 ± 0.06 3.82 ± 0.07 3.74 ± 0.06 3.35 ± 0.06 I23γ2 5.27 ± 0.08 4.79 ± 0.06 4.42 ± 0.07 4.13 ± 0.05 3.89 ± 0.06 3.71 ± 0.05 3.45 ± 0.05 I23δ1 3.03 ± 0.08 2.73 ± 0.06 2.54 ± 0.07 2.28 ± 0.05 2.11 ± 0.06 1.97 ± 0.05 1.79 ± 0.05 I36γ2 4.42 ± 0.07 4.02 ± 0.06 3.94 ± 0.06 3.54 ± 0.04 3.36 ± 0.05 3.19 ± 0.04 2.91 ± 0.04 I36δ1 3.41 ± 0.07 3.04 ± 0.06 2.82 ± 0.06 2.58 ± 0.05 2.44 ± 0.06 2.29 ± 0.05 2.12 ± 0.05 L43δ2 3.06 ± 0.07 2.76 ± 0.06 2.60 ± 0.07 2.37 ± 0.05 2.19 ± 0.06 2.01 ± 0.05 1.83 ± 0.05 I44δ1 1.45 ± 0.07 1.24 ± 0.06 1.19 ± 0.06 1.03 ± 0.04 1.01 ± 0.06 0.92 ± 0.05 0.77 ± 0.05 L50δ2 4.64 ± 0.11 4.16 ± 0.09 3.85 ± 0.10 3.43 ± 0.07 3.16 ± 0.09 3.02 ± 0.07 2.84 ± 0.07 L56δ2 4.19 ± 0.09 3.82 ± 0.08 3.50 ± 0.08 3.17 ± 0.06 2.89 ± 0.07 2.73 ± 0.06 2.54 ± 0.06 I61γ2 5.01 ± 0.07 4.57 ± 0.06 4.24 ± 0.06 3.91 ± 0.04 3.69 ± 0.06 3.49 ± 0.04 3.22 ± 0.05 I61δ1 3.44 ± 0.09 3.03 ± 0.07 2.82 ± 0.08 2.56 ± 0.05 2.27 ± 0.07 2.13 ± 0.06 1.96 ± 0.06 L67δ2 1.81 ± 0.05 1.64 ± 0.04 1.53 ± 0.04 1.37 ± 0.03 1.30 ± 0.04 1.18 ± 0.03 1.12 ± 0.03 V70γ2 2.27 ± 0.05 2.07 ± 0.05 1.95 ± 0.05 1.80 ± 0.04 1.70 ± 0.04 1.64 ± 0.04 1.53 ± 0.04 L73δ1 1.36 ± 0.03 1.25 ± 0.02 1.21 ± 0.03 1.10 ± 0.02 1.04 ± 0.02 1.00 ± 0.02 0.94 ± 0.02
aσobs was calculated using σ obs =1
8∆ln
9 Iα 2 β
Iαβ 2
Iα 3 I
β 3
. All errors (∆σobs) were determined from ∆σ obs =q
8∆
1
Iα 3
+1
Iα 2 β
+1
Iαβ 2
+1
Iβ 3
, where q is the noise estimation from NMRPipe, ∆
is the constant time evolution and Ii is the intensity of each peak in the quartet ( i = α 3 ,α 2β ,αβ 2 , β 3).

88
Table SII. Methyl group order parameters ( ) calculated at fourteen temperatures a
275 K 278 K 281 K 283 K 286 K 288 K 291 K
τc (ns) 11.45 τc (ns) 10.23 τc (ns) 9.17 τc (ns) 8.55 τc (ns) 7.72 τc (ns) 7.22 τc (ns) 6.55 σrigid ( s-1) 10.95 σrigid ( s-1) 9.80 σrigid ( s-1) 8.79 σrigid ( s-1) 8.21 σrigid ( s-1) 7.42 σrigid ( s-1) 6.95 σrigid ( s-1) 6.32
Saxis2 Saxis
2 Saxis2 Saxis
2 Saxis2 Saxis
2 Saxis2
I3γ2 0.97 ± 0.02 0.96 ± 0.02 0.96 ± 0.02 0.94 ± 0.01 0.92 ± 0.01 0.90 ± 0.01 0.90 ± 0.01 I3δ1 0.82 ± 0.02 0.80 ± 0.02 0.80 ± 0.02 0.77 ± 0.01 0.77 ± 0.01 0.75 ± 0.01 0.75 ± 0.02 T7γ2 0.88 ± 0.02 0.85 ± 0.02 0.86 ± 0.02 0.84 ± 0.02 0.82 ± 0.01 0.81 ± 0.02 0.81 ± 0.02 L8δ1 0.41 ± 0.01 0.39 ± 0.01 0.39 ± 0.01 0.38 ± 0.01 0.36 ± 0.01 0.36 ± 0.01 0.35 ± 0.01 T9γ2 0.69 ± 0.01 0.68 ± 0.01 0.68 ± 0.01 0.67 ± 0.01 0.64 ± 0.01 0.63 ± 0.01 0.63 ± 0.01 T12γ2 0.83 ± 0.02 0.79 ± 0.02 0.79 ± 0.02 0.77 ± 0.02 0.73 ± 0.01 0.74 ± 0.02 0.72 ± 0.02 I13δ1 0.62 ± 0.02 0.61 ± 0.01 0.60 ± 0.01 0.59 ± 0.01 0.58 ± 0.01 0.57 ± 0.01 0.56 ± 0.01 V17γ2 0.84 ± 0.02 0.82 ± 0.02 0.82 ± 0.02 0.80 ± 0.01 0.78 ± 0.01 0.77 ± 0.01 0.78 ± 0.02 T22γ2 0.97 ± 0.02 0.94 ± 0.02 0.96 ± 0.02 0.93 ± 0.02 0.91 ± 0.01 0.92 ± 0.02 0.90 ± 0.02 I23γ2 0.95 ± 0.02 0.94 ± 0.02 0.94 ± 0.02 0.92 ± 0.02 0.90 ± 0.01 0.90 ± 0.01 0.89 ± 0.02 I23δ1 0.61 ± 0.02 0.58 ± 0.02 0.58 ± 0.02 0.56 ± 0.01 0.54 ± 0.01 0.53 ± 0.01 0.52 ± 0.02 I36γ2 0.73 ± 0.02 0.73 ± 0.02 0.73 ± 0.02 0.74 ± 0.01 0.73 ± 0.01 0.74 ± 0.01 0.74 ± 0.01 I36δ1 0.63 ± 0.02 0.61 ± 0.01 0.62 ± 0.01 0.60 ± 0.01 0.58 ± 0.01 0.59 ± 0.01 0.57 ± 0.01 L43δ2 0.60 ± 0.02 0.59 ± 0.02 0.58 ± 0.02 0.55 ± 0.01 0.54 ± 0.01 0.51 ± 0.02 0.52 ± 0.02 I44δ1 0.29 ± 0.01 0.28 ± 0.01 0.28 ± 0.01 0.27 ± 0.01 0.26 ± 0.01 0.26 ± 0.01 0.25 ± 0.01 L50δ2 0.87 ± 0.03 0.86 ± 0.03 0.85 ± 0.03 0.84 ± 0.02 0.81 ± 0.02 0.81 ± 0.02 0.80 ± 0.02 L56δ2 0.79 ± 0.03 0.79 ± 0.02 0.78 ± 0.02 0.77 ± 0.02 0.76 ± 0.01 0.72 ± 0.02 0.73 ± 0.02 I61γ2 0.91 ± 0.02 0.89 ± 0.02 0.89 ± 0.02 0.87 ± 0.01 0.86 ± 0.01 0.85 ± 0.01 0.85 ± 0.01 I61δ1 0.68 ± 0.02 0.66 ± 0.02 0.65 ± 0.02 0.63 ± 0.02 0.61 ± 0.01 0.60 ± 0.02 0.59 ± 0.02 L67δ2 0.35 ± 0.01 0.35 ± 0.01 0.34 ± 0.01 0.33 ± 0.01 0.32 ± 0.01 0.31 ± 0.01 0.31 ± 0.01 V70γ2 0.46 ± 0.01 0.45 ± 0.01 0.45 ± 0.01 0.43 ± 0.01 0.41 ± 0.01 0.39 ± 0.01 0.39 ± 0.01 L73δ1 0.25 ± 0.01 0.24 ± 0.00 0.24 ± 0.00 0.24 ± 0.00 0.23 ± 0.00 0.23 ± 0.00 0.23 ± 0.01 aGiven at each temperature are the rotational correlation time (τc ) and the CCR rate between dipolar couplings of two CH bonds in the absence of local motion (σrigid). σrigid is calculated using
σ rigid =1
45τ c
µ0 hγ H γ C
8π2rCH
3
2
2 +3
2(1 + (ω cτ c )2
)
, where µo is the permeability of a vacuum, h is the Planck constant, γH and γC are the gyromagnetic ratios of 1H and 13C, respectively, rCH is the
CH bond length, ωC is the Larmor frequency of 13C and τc is the rotational correlation time. Saxis2 is derived from Saxis
2=
σ obs
σ rigid
. The error ( ∆Saxis2 ) is determined using ∆Saxis
2=
∆σ obs
σ rigid
.
Saxis2

89
Table SII. Methyl groups order parameters ( ) calculated at fourteen different temperatures a (continued)
293 K 296 K 298 K 301 K 303 K 305 K 308 K
τc (ns) 6.15 τc (ns) 5.61 τc (ns) 5.28 τc (ns) 4.84 τc (ns) 4.57 τc (ns) 4.32 τc (ns) 3.98
σrigid ( s-1) 5.95 σrigid ( s-1) 5.44 σrigid ( s-1) 5.13 σrigid ( s-1) 4.72 σrigid ( s-1) 4.47 σrigid ( s-1) 4.24 σrigid ( s-1) 3.93
Saxis2 Saxis
2 Saxis2 Saxis
2 Saxis2 Saxis
2 Saxis2
I3γ2 0.90 ± 0.01 0.89 ± 0.01 0.88 ± 0.01 0.88 ± 0.01 0.88 ± 0.01 0.87 ± 0.01 0.87 ± 0.01 I3δ1 0.75 ± 0.01 0.74 ± 0.01 0.73 ± 0.01 0.74 ± 0.01 0.72 ± 0.01 0.73 ± 0.01 0.72 ± 0.01 T7γ2 0.81 ± 0.02 0.81 ± 0.01 0.81 ± 0.02 0.82 ± 0.01 0.84 ± 0.02 0.83 ± 0.01 0.82 ± 0.01 L8δ1 0.34 ± 0.01 0.34 ± 0.01 0.33 ± 0.01 0.33 ± 0.01 0.33 ± 0.01 0.34 ± 0.01 0.34 ± 0.01 T9γ2 0.62 ± 0.01 0.61 ± 0.01 0.61 ± 0.01 0.59 ± 0.01 0.61 ± 0.01 0.60 ± 0.01 0.60 ± 0.01 T12γ2 0.71 ± 0.01 0.71 ± 0.01 0.70 ± 0.02 0.68 ± 0.01 0.69 ± 0.02 0.68 ± 0.01 0.67 ± 0.02 I13δ1 0.55 ± 0.01 0.55 ± 0.01 0.54 ± 0.01 0.54 ± 0.01 0.53 ± 0.01 0.51 ± 0.01 0.52 ± 0.01 V17γ2 0.76 ± 0.01 0.75 ± 0.01 0.74 ± 0.01 0.73 ± 0.01 0.73 ± 0.01 0.74 ± 0.01 0.74 ± 0.01 T22γ2 0.88 ± 0.02 0.87 ± 0.01 0.87 ± 0.02 0.86 ± 0.01 0.85 ± 0.02 0.88 ± 0.01 0.85 ± 0.02 I23γ2 0.88 ± 0.01 0.88 ± 0.01 0.86 ± 0.01 0.88 ± 0.01 0.87 ± 0.01 0.88 ± 0.01 0.88 ± 0.01 I23δ1 0.51 ± 0.01 0.50 ± 0.01 0.49 ± 0.01 0.48 ± 0.01 0.47 ± 0.01 0.46 ± 0.01 0.46 ± 0.01 I36γ2 0.74 ± 0.01 0.74 ± 0.01 0.77 ± 0.01 0.75 ± 0.01 0.75 ± 0.01 0.75 ± 0.01 0.74 ± 0.01 I36δ1 0.57 ± 0.01 0.56 ± 0.01 0.55 ± 0.01 0.55 ± 0.01 0.55 ± 0.01 0.54 ± 0.01 0.54 ± 0.01 L43δ2 0.52 ± 0.01 0.51 ± 0.01 0.51 ± 0.01 0.50 ± 0.01 0.49 ± 0.01 0.47 ± 0.01 0.47 ± 0.01 I44δ1 0.24 ± 0.01 0.23 ± 0.01 0.23 ± 0.01 0.22 ± 0.01 0.23 ± 0.01 0.22 ± 0.01 0.20 ± 0.01 L50δ2 0.78 ± 0.02 0.76 ± 0.02 0.75 ± 0.02 0.73 ± 0.01 0.71 ± 0.02 0.71 ± 0.02 0.72 ± 0.02 L56δ2 0.70 ± 0.02 0.70 ± 0.01 0.68 ± 0.02 0.67 ± 0.01 0.65 ± 0.02 0.64 ± 0.01 0.65 ± 0.02 I61γ2 0.84 ± 0.01 0.84 ± 0.01 0.83 ± 0.01 0.83 ± 0.01 0.82 ± 0.01 0.82 ± 0.01 0.82 ± 0.01 I61δ1 0.58 ± 0.01 0.56 ± 0.01 0.55 ± 0.02 0.54 ± 0.01 0.51 ± 0.02 0.50 ± 0.01 0.50 ± 0.01 L67δ2 0.30 ± 0.01 0.30 ± 0.01 0.30 ± 0.01 0.29 ± 0.01 0.29 ± 0.01 0.28 ± 0.01 0.29 ± 0.01 V70γ2 0.38 ± 0.01 0.38 ± 0.01 0.38 ± 0.01 0.38 ± 0.01 0.38 ± 0.01 0.39 ± 0.01 0.39 ± 0.01 L73δ1 0.23 ± 0.01 0.23 ± 0.00 0.24 ± 0.01 0.23 ± 0.00 0.23 ± 0.01 0.24 ± 0.00 0.24 ± 0.01 aGiven at each temperature are the rotational correlation time (τc ) and the CCR rate between dipolar couplings of two CH bonds in the absence of local motion (σrigid). σrigid is calculated
using σ rigid =1
45τ c
µ0 hγ H γ C
8π2rCH
3
2
2 +3
2(1 + (ω cτ c )2
)
, where µo is the permeability of a vacuum, h is the Planck constant, γH and γC are the gyromagnetic ratios of 1H and 13C, respectively, rCH
is the CH bond length, ωC is the Larmor frequency of 13C and τc is the rotational correlation time. Saxis2 is derived from Saxis
2=
σ obs
σ rigid
. The error ( ∆Saxis2 ) is determined using ∆Saxis
2=
∆σ obs
σ rigid
.
Saxis2

90
Appendix II5 Technical Resources - Media Formulations Neurobasal™-A Medium (1X) liquid Neurobasal™ Media are basal media formulated to meet the neuronal cells special requirements.
Components Molecular Weight
Concentration (mg/L) mM
Amino Acids
Glycine 75 30 0.4
L-Alanine 89 2 0.0225
L-Arginine hydrochloride 211 84 0.398
L-Asparagine-H2O 150 0.83 0.00553
L-Cysteine 121 31.5 0.26
L-Histidine hydrochloride-H2O 210 42 0.2
L-Isoleucine 131 105 0.802
L-Leucine 131 105 0.802
L-Lysine hydrochloride 183 146 0.798
L-Methionine 149 30 0.201
L-Phenylalanine 165 66 0.4
L-Proline 115 7.76 0.0675
L-Serine 105 42 0.4
L-Threonine 119 95 0.798
L-Tryptophan 204 16 0.0784
L-Tyrosine 181 72 0.398
L-Valine 117 94 0.803
Vitamins
Choline chloride 140 4 0.0286
D-Calcium pantothenate 477 4 0.00839
Folic Acid 441 4 0.00907
5 From Invitrogen ® with modification used in this work from website: http://de-de.invitrogen.com/site/de/de/home/support/Product-Technical-Resources/media_formulation.253.html

91
Niacinamide 122 4 0.0328
Pyridoxine hydrochloride 204 4 0.0196
Riboflavin 376 0.4 0.00106
Thiamine hydrochloride 337 4 0.0119
Vitamin B12 1355 0.0068 0.000005
i-Inositol 180 7.2 0.04
Inorganic Salts
Calcium Chloride (CaCl2) (anhyd.) 111 200 1.8
Ferric Nitrate (Fe(NO3)3"9H2O) 404 0.1 0.000248
Magnesium Chloride (anhydrous) 95 77.3 0.814
Potassium Chloride (KCl) 75 400 5.33
Sodium Bicarbonate (NaHCO3) 84 2200 26.19
Sodium Chloride (NaCl) 58 4000 68.97
Sodium Phosphate monobasic (NaH2PO4-H2O)
138 125 0.906
Zinc sulfate (ZnSO4-7H2O) 288 0.194 0.000674
Other Components
D-Glucose 13C6 or 12C6 180 4500 25
HEPES 238 2600 10.92
Phenol Red 110 8.1 0.0736
Sodium Pyruvate 110 25 0.227
B27® supplement (2%)
Glutamax® 2
Penicillin (100 IU)
Streptomycin 100

92
Curriculum Vitae Davood Bakhtiari
Personal information Address Philipp-Reis-Str. 3, 37075 Göttingen Phone Fax
+49-551-2012250 +49-551-2012202
E-Mail [email protected] Date and place of Birth September 17, 1981 in Kermanshah Education 07/2009 – present Ph.D. student in Max Planck Institute for Biophysical
Chemistry, Göttingen, Germany 04/2007 – 02/2009 M.Sc. Medicinal Chemistry, Leibniz University Hannover,
Germany/EMBL Heidelberg
10/1999 – 03/2005 Pharm.D., Pharmacy, Tehran University of medical sciences Scientific skills NMR spectroscopy, Cell biology, Organic synthesis Computer skills Python, Matlab, Mathematica, NMRPipe, CARA, Topspin, XPlOR-NIH , CYANA, Gromacs
Languages Persian Native English Fluent German Fluent Publications Sabo, TM., Bakhtiari D., Walter KFA., McFeeters RL., Giller, K., Becker S., Griesinger C., Lee, D. (2012) Thermal coefficient of methyl groups within ubiquitin. Protein Science 21: 562-570. Almasirad, A., Tajik, M., Bakhtiari, D., Shafiee, A., Abdollahi, M., Zamani, MJ., Khorasani, R., Esmaily H. (2005) Synthesis and analgesic activity of N-Arylhydrazone derivatives of mefenamic acid. Journal of pharmacy & pharmaceutical sciences 8(3):419-25.


![Ubiquitin and Ubiquitin-like Modifications in Viral ...1].pdf · Ubiquitin and Ubiquitin-like Modifications in Viral Infection and Immunity Abstracts of papers presented at the AUGUST](https://static.fdocuments.in/doc/165x107/5e2d68ba2a69b505b71e58fa/ubiquitin-and-ubiquitin-like-modifications-in-viral-1pdf-ubiquitin-and-ubiquitin-like.jpg)