Thermal coefficient of expansion - UA Hydrology and ... · PDF filefractional change in the...
6
ATMO 551a Fall 08 1 Kursinski 10/03/08 Coefficient of Thermal expansion Since we have just discussed heat capacity at constant volume, it is worth discussing the closely related coefficient of thermal expansion. When objects are heated, they expand. The fractional change in the volume of a material expands as its temperature increases is called the V = 1 V V T = ln V ( ) T Note that the expansion in any single dimension can be found from V = 1 V V T = 1 L 3 L 3 T = 3L 2 L 3 L T = 3 L L T So if we define a linear coefficient of thermal expansion, L as L = 1 L L T then V = 3 L . Coefficient of thermal expansion written in terms of density V = 1 V V ( ) T = 1 1 1 T = 1 ( ) T = 2 () T = 1 () T = ln () T Coefficient of thermal expansion of a gas For an ideal gas we have P = n R* T = T R*/m . So = m P/(T R*). If we hold pressure constant, then the volume coefficient of thermal expansion of an ideal gas is V = 1 () T = R * T mP mP R * T 1 ( ) T =+ T T 2 T () T = 1 T Examples of the volume coefficient of thermal expansion In units of ppm/ o C Water 207 Mercury 182 Ethanol 750 Glass 25.5
Transcript of Thermal coefficient of expansion - UA Hydrology and ... · PDF filefractional change in the...

ATMO 551a Fall 08
1 Kursinski 10/03/08
Coefficient of Thermal expansion
Since we have just discussed heat capacity at constant volume, it is worth discussing the
closely related coefficient of thermal expansion. When objects are heated, they expand. The
fractional change in the volume of a material expands as its temperature increases is called the
V =1
V
V
T=ln V( )T
Note that the expansion in any single dimension can be found from
V =1
V
V
T=1
L3L3
T=3L2
L3L
T=3
L
L
T
So if we define a linear coefficient of thermal expansion, L as
L =1
L
L
T
then V = 3 L .
Coefficient of thermal expansion written in terms of density
V =1
V
V( )T
=11
1
T=
1( )T
= 2
( )T
=1 ( )
T=
ln( )T
Coefficient of thermal expansion of a gas
For an ideal gas we have P = n R* T = T R*/m . So = m P/(T R*). If we hold pressure
constant, then the volume coefficient of thermal expansion of an ideal gas is
V =1 ( )
T=
R*T
mP
mP
R*
T 1( )T
= +T
T 2T( )T
=1
T
Examples of the volume coefficient of thermal expansion
In units of ppm/oC
Water 207 Mercury 182 Ethanol 750 Glass 25.5
ATMO 551a Fall 08
2 Kursinski 10/03/08
Mercury and alcohol thermometers
Mercury and alcohol thermometers are based on thermal expansion of these liquids. The
idea is to use a large reservoir of the liquid and force the thermal expansion into a small volume
with a small cross section such that its height change is maximum.
The initial volume is V. So the increase (or decrease) in volume is v V T. The
thermometer design is such that this volume increase moves into a chamber with a small
crossectional area, A, such that the height of the liquid in the chamber, L, is amplified.
A L = v V T
L = vV T
A
So to make L as large as possible, we want to use a liquid with as large thermal expansion
coefficient as possible as well as making the V/A ratio as large as possible meaning as large a
reservoir as possible and as small a crosssection as possible.
The advantage of ethanol is it has a very large thermal expansion coefficient of 750
ppm/K. Mercury has a different advantage. In the volume above the liquid, there is in theory a
vacuum. In reality, a small number of gas molecules exists in the volume. This causes a
pressure pushing down on the liquid surface which suppresses a bit of the thermal expansion.
The advantage of mercury is its very low saturation vapor pressure which minimizes the pressure
pushing down on the mercury liquid surface.
There is a combination that is particularly effective which is to put alcohol in the volume
and put a small amount of mercury above the alcohol in the narrow tube. This takes advantage
of the large thermal expansion coefficient of alcohol AND the small vapor pressure of mercury.
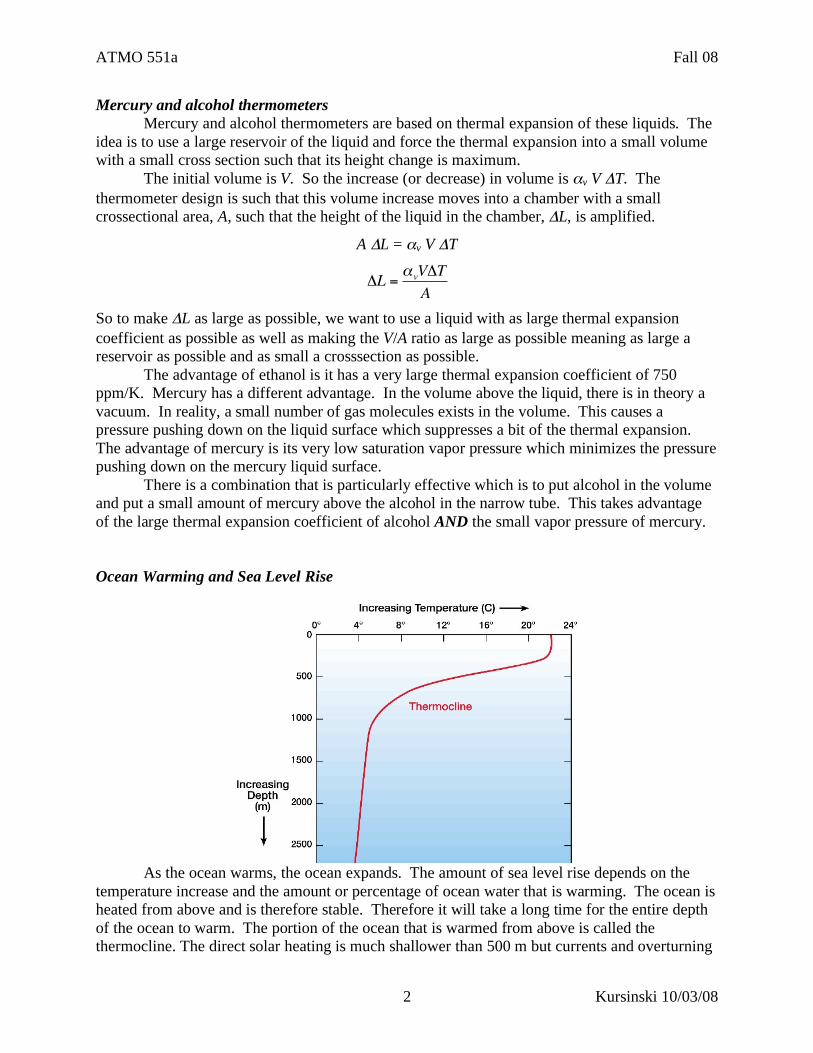
Ocean Warming and Sea Level Rise
As the ocean warms, the ocean expands. The amount of sea level rise depends on the
temperature increase and the amount or percentage of ocean water that is warming. The ocean is
heated from above and is therefore stable. Therefore it will take a long time for the entire depth
of the ocean to warm. The portion of the ocean that is warmed from above is called the
thermocline. The direct solar heating is much shallower than 500 m but currents and overturning

ATMO 551a Fall 08
3 Kursinski 10/03/08
mix the warming through the depth of the thermocline. We assume the depth that experienced
the enhanced warming is the depth of the thermocline.
The increase in greenhouse gas concentrations has caused reduced the IR emission to
space. It has also increased the IR emission from the atmosphere into the surface. This will
cause the surface to warm. Some of this absorbed energy will be stored in the surface and some
will be released from the surface into the atmosphere and space by increased evaporation,
increased conductive transfer to the atmospheric molecules in contact with the ocean surface and
increased IR radiation emitted by the surface.
The net amount of heating that remains in the surface is difficult to estimate. We can
simply use measurements of the rise in ocean temperature to determine the net heating of the
ocean. We can also work backwards to estimate the net heat flowing into the oceans.

ATMO 551a Fall 08
4 Kursinski 10/03/08
The figure above indicates SST has increased by ~0.5 K over the past 40 years which is a rate of
~0.0125 K/year.
The NET energy flux into the ocean
We know the measured change in the ocean surface temperature. To calculate the
corresponding net (In minus Out) energy flux into the ocean we need to know how much energy
storage capacity is associated with this rise in temperature.
The heat capacity of liquid water is 4,181 J/kg/K. We assume the depth of the heating is
about 500 m to correspond with the thermocline. So a column of heated liquid water with cross
sectional area of 1 m2 and a depth of 500 m has a volume of 500 m
3. The mass of that water
column with a density of 1000 kg/m3 is 5x10
5 kg. The rate of increase in the internal energy of
the column is related to the rate of change of the temperature of the column as
dU
dt= mC
dT
dt
where m is the mass of the column and C is the heat capacity or specific heat of liquid water. The
answer is
5x10⁵ kg 4.2x10
3 J/kg/K 1.25x10
-2 K/year = 0.8 W
The 4 W/m2 we used in the homework was the decrease in IR to space resulting from an
instantaneous doubling of CO2. This 0.8 W/m2 flux is the downward increase in IR minus the
increase in the fluxes cooling the ocean due to dry convection, evaporation, and radiative fluxes
at the top of the ocean.
Thermal expansion of the ocean
Assuming the top 500 m of the ocean surface is warming at a rate of 0.0125 K/year
suggests that that layer should be expanding and the sea level rising. Assume that the layer of
ocean that is warming has an area, A, and a depth, L, and a volume,
V = AL
Therefore the change in volume due to thermal expansion is
V = A L
Therefore the fractional change in volume is
V
V=A L
AL=
L
L
The resulting change in sea level is
L = L V/V = L v T
and the rate of change of sea level is
L
t= L v
T
t
Plugging in values, we get that the change in the height of the ocean due to thermal expansion of
the top 500 m of the ocean is approximately

ATMO 551a Fall 08
5 Kursinski 10/03/08
5x10² m 2x10
-4/K 1.25x10
-2 K/year = 1.25 mm/year
The measured rise in sea level is about 20 cm = 200 mm in 100 years or about 2 mm/year. If the
depth to which the warming extends were greater than 500 m, then our calculated rate of sea
level rise would be higher and closer to the observed rate. Alternatively, a factor contributing to
the discrepancy is the fact that the observed rate also includes the contribution of land ice melt.
Direct estimates of land ice melt are VERY uncertain.

ATMO 551a Fall 08
6 Kursinski 10/03/08
The figure above shows the sea level rise measured by the TOPEX and JASON satellites. The
average rate is about 37 mm in 12.5 years or about 3 mm/year. This is about 50% faster than the
non-satellite estimate over the past 100 years. Note that in the previous figure, the slope of the
satellite data is indeed larger than the tide gauge-based slope.
The figure above shows the regional change in sea level observed by altimetry satellites. Note
how inhomogeneous this is. This is in large part due to ocean current. Warm water is piling up
in the tropical western Pacific because the easterly low latitude winds push the surface water
there. Water in the tropical eastern Pacific remains cooler because of upwelling water from
depth there. The water at depth is cooler because it is below the thermocline and has not been
affected by solar and IR radiation for a long time.