Thermal Behavior of Aerospace Spur Gears in Normal and Loss-of ... · Conclusions...
29
1 National Aeronautics and Space Administration www.nasa.gov Dr. Robert F. Handschuh Chief, Rotating and Drive Systems Branch NASA Glenn Research Center Cleveland, Ohio 2015 AHS Forum 71 May 5-7, 2015 Virginia Beach, VA Thermal Behavior of Aerospace Spur Gears in Normal and Loss-of-Lubrication Conditions https://ntrs.nasa.gov/search.jsp?R=20160001342 2020-01-25T05:51:12+00:00Z
Transcript of Thermal Behavior of Aerospace Spur Gears in Normal and Loss-of ... · Conclusions...

1
National Aeronautics and Space Administration
www.nasa.gov
Dr. Robert F. Handschuh Chief, Rotating and Drive Systems Branch
NASA Glenn Research Center Cleveland, Ohio
2015 AHS Forum 71 May 5-7, 2015 Virginia Beach, VA
Thermal Behavior of Aerospace Spur Gears in Normal and Loss-of-Lubrication Conditions!
https://ntrs.nasa.gov/search.jsp?R=20160001342 2020-01-25T05:51:12+00:00Z

Abstract!
2
Testing of instrumented spur gears operating at aerospace rotorcraft conditions was conducted. The instrumented gears were operated in a normal and in a loss-of-lubrication environment. Thermocouples were utilized to measure the temperature at various locations on the test gears and a test utilized a full-field, high-speed infrared thermal imaging system. Data from thermocouples was recorded during all testing at 1 Hz. One test had the gears shrouded and a second test was run without the shrouds to permit the infrared thermal imaging system to take date during loss-of-lubrication operation. Both tests using instrumented spur gears were run in normal and loss-of-lubrication conditions. Also the result from four other loss-of-lubrication tests will be presented. In these tests two different torque levels were used while operating at the same rotational speed (10000 rpm).

Presentation Topics!
• Background!
• Test Facility!
• Test Gear Information!
• Test Methodology!
• Test Results!
• Conclusions!
3

Background!
• Requirement for 30 minutes of operation after primary lubrication system failure is a qualification requirement!
• High speed and / or load can lead to lubrication
starvation conditions!
• Lubrication starvation leads to high friction conditions,
high heat generation, tooth profile wear, and finally tooth failure due to loss of load carrying capability!
4

Background!
Speed
Load
No Failure
Wear
Scoring
Pitting
Breakage
5

Test Facility!
6 !
Operational Capabilities: 10000 RPM 630 in*lb

Gearbox Configuration!
7 !

Gear Design!
8
28 tooth gear
Module (mm), diameteral pitch (1/in.)) 3.175 (8) Pressure angle (deg.) 20 Pitch diameter, mm (in.) 88.9 (3.5) Addendum, mm (in.) 3.175 (0.125) Whole depth, mm (in.) 7.14 (0.281) Chordal tooth thickness, mm (in.) 4.85 (0.191) Face width, mm (in.) 6.35 (0.25)

Test Methodology!
• Break-in gear set for at least 1 hour at 10000 RPM and lighter torque!
• Operate facility at test conditions (rotational speed and
torque) to steady state conditions!
• Turn off primary lubrication system that lubricates the
gears (test time start)!
• Operate facility until failure occurs or is imminent!
!
9

Test Facility Static Instrumentation!
10 !

11
Loss-of-Lubrication Test – Top Exit Shrouds!
!Loss-of-lubrication data for 1.72 kPa (250 psi) load pressure ~ 59.3 N*m (540 in*lb) torque tested at 10000 rpm.

12
Loss-of-Lubrication Test (Gears Failed)!

Typical Post-Test Condition (Failed Gears)!
13 !

Increased Torque Loss-of-Lubrication Test!
14
!Loss-of-lubrication data from higher load test 83.6 N*m (740 in*lb).

Baseline Test Results!
15
Torque Maximum Contact Stress
Maximum Bending Stress
LOL Elapsed Time
N*m (in*lb) GPa (ksi) GPa (ksi) Minutes
59.3 (525) 1.67 (242) 0.214 (30.9) 40.8
59.3 (525) 1.67 (242) 0.214 (30.9) 43.1
83.6 (740) 1.88 (272) 0.296 (43.0) 7.9
83.6 (740) 1.88 (272) 0.296 (43.0) 9.2
10000 RPM, ~ 225 deg F oil inlet temperature
16
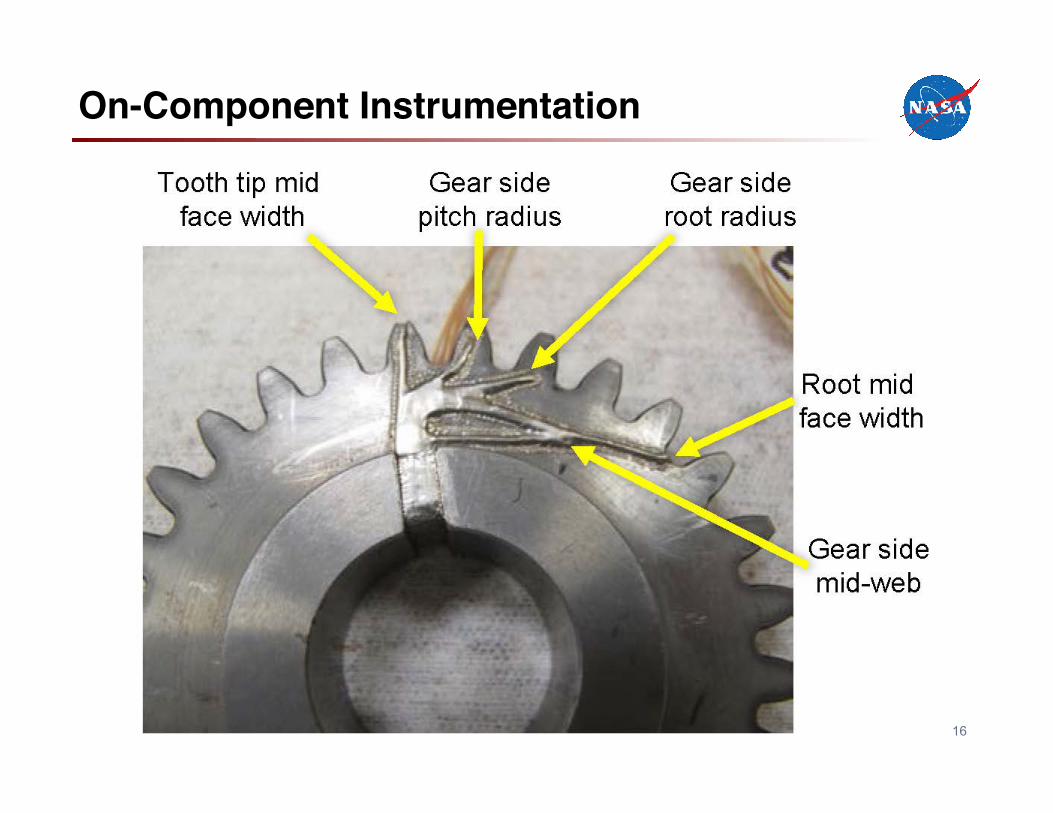
On-Component Instrumentation !
!

17
On-Component Instrumentation !
!

18
On-Component Instrumentation Test Setup !
!

19
On-Component Setup with FLIR!
!
20
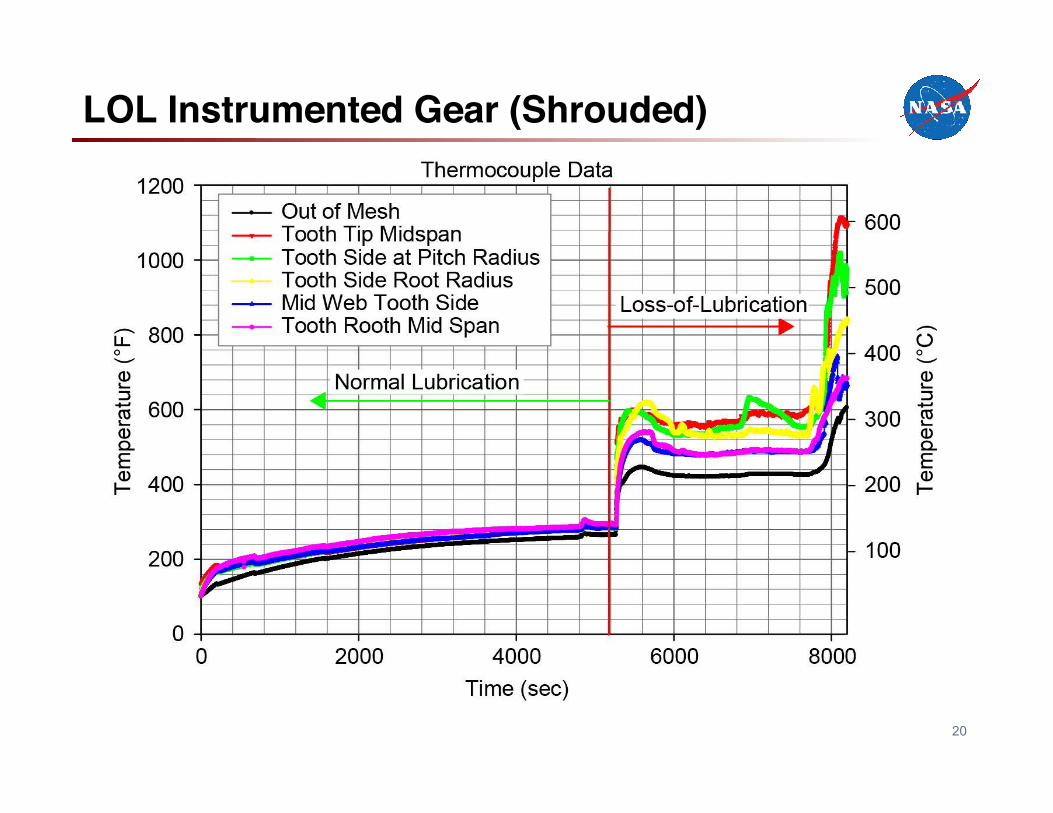
LOL Instrumented Gear (Shrouded)!
!

21
LOL Test Static Instrumentation (Shrouded)!
!

22
LOL Instrumented Gear (Shrouded)!
!

23
LOL Instrumented Gear (Unshrouded)!
!

24
LOL Test Static Instrumentation (Unshrouded)!
!

25
LOL Instrumented Test Hardware (Unshrouded)!
! !
!

26
LOL Test FLIR Data (Unshrouded)!
!

27
LOL Test FLIR Data (Unshrouded)!
!

Conclusions
Loss-of-lubrication tests were conducted in an aerospace simulated environment using consistent sets of test hardware. The following is a summary of the test results: 1. Applied torque can have a drastic effect on loss-of-lubrication time. An increase of
torque by 40%, 59.3 to 83.6 N*m (525 to 740 in.-lb) resulted in a decrease in average loss-of-lubrication operation time by 75% (42 to 8 min).
2. Operation in loss-of-lubrication mode at lower torque produced an elevated steady state temperature condition. The higher torque level did not have this operating time at an elevated steady state temperature condition. During the higher torque tests, the temperature continued to increase until failure of the teeth.
3. On-component thermocouple data for shrouded or unshrouded gears revealed that the gear under normal conditions have bulk temperatures that are 11 to 22 °C (20 to 40 °F) higher than the fling-off temperatures measured by the static shroud thermocouples.
4. On-component thermocouple data for shrouded or unshrouded gears indicated that during loss-of-lubrication, conditions bulk temperatures on the gear are from 80 to 275 °C (150 to 500 °F) higher at certain times during this test when compared to the static shroud temperatures.
5. A comparison between instrumented shrouded and unshrouded gears was made. Unshrouded gears operated at slightly lower temperature ~ 45 °C (80 °F) than shrouded during the “steady state” elevated portion of the loss-of-lubrication tests.
6. A high-speed, full-field, infrared thermal imaging system was utilized in the unshrouded and instrumented gear test. The results attained agreed with that found using thermocouples. Full field thermal data provides information that will be necessary for validating future modeling efforts.

29 Your Title Here 29
SignOffPage!