Theoretical Analysis of the Influence of the Thermal ...
20
Communications in Applied Sciences ISSN 2201-7372 Volume 1, Number 2, 2013, 210-229 © Copyright 2013 the authors. 210 Theoretical Analysis of the Influence of the Thermal Diffusivity of Ceramic Tile on the Thermal Energy Distribution Eze Stephen 1 , Ugwu Emmanuel I 1 , Amah Alexander N. 2 and Agbo P.E 1 1 Depart. OfIdustrial Physics Ebonyi State University, Abakaliki, Nigeria 2 Depart. Of Physics, Unversity of Agric., Makurdi Nigeria Corresponding author: Ugwu, Emmanuel I, Depart. Of Idustrial Physics Ebonyi State University, Abakaliki, Nigeria Abstract. The influence of the thermal diffusivity of the ceramic tile on the thermal energy distribution was analysed using one dimensional heat equation, which was solved by using method of separation of variables. In the analysis, heat was assumed to be propagated along a rectangular moulded ceramic tile with length (l) and the width being considered negligible with different temperatures ranging from 300 0 c to 1300 0 c, within a specified time frame. Some parameters such as thermal conductivity, specific heat and mass per unit length of the material were specified. The variation of thermal conductivity and diffusivity with temperature were analysed while that of thermal energy flux u(x,t) variation with position and time for different lengths werealso take into consideration. The distribution of temperature as a function of time for different values of thermal diffusivity was also considered. Keywords: Thermal diffusivity, thermal energy distribution, heat, ceramic tile, thermal conductivity.Temperature. INTRODUCTION The study of the thermophysical properties of engineering materials such as ceramic has been the concern of engineers and scientists as ceramics are gradually dominating in engineering and technology today. Ceramics apart from being used in producing domestic and industrial products such as ceramic wares, pottery, bricks, roofing mica industries, refractories, rocketry; carbides of silicon, boro, tungsten and brought to you by CORE View metadata, citation and similar papers at core.ac.uk provided by InfinityPress
Transcript of Theoretical Analysis of the Influence of the Thermal ...

Communications in Applied Sciences
ISSN 2201-7372
Volume 1, Number 2, 2013, 210-229
© Copyright 2013 the authors. 210
Theoretical Analysis of the Influence of the Thermal Diffusivity of
Ceramic Tile on the Thermal Energy Distribution
Eze Stephen1, Ugwu Emmanuel I1, Amah Alexander N.2 and Agbo P.E1
1Depart. OfIdustrial Physics Ebonyi State University, Abakaliki, Nigeria
2Depart. Of Physics, Unversity of Agric., Makurdi Nigeria
Corresponding author: Ugwu, Emmanuel I, Depart. Of Idustrial Physics Ebonyi State University,
Abakaliki, Nigeria
Abstract. The influence of the thermal diffusivity of the ceramic tile on the thermal energy
distribution was analysed using one dimensional heat equation, which was solved by using method
of separation of variables. In the analysis, heat was assumed to be propagated along a rectangular
moulded ceramic tile with length (l) and the width being considered negligible with different
temperatures ranging from 3000c to 13000c, within a specified time frame. Some parameters such as
thermal conductivity, specific heat and mass per unit length of the material were specified. The
variation of thermal conductivity and diffusivity with temperature were analysed while that of
thermal energy flux u(x,t) variation with position and time for different lengths werealso take into
consideration. The distribution of temperature as a function of time for different values of thermal
diffusivity was also considered.
Keywords: Thermal diffusivity, thermal energy distribution, heat, ceramic tile, thermal
conductivity.Temperature.
INTRODUCTION
The study of the thermophysical properties of engineering materials such as
ceramic has been the concern of engineers and scientists as ceramics are gradually
dominating in engineering and technology today. Ceramics apart from being used in
producing domestic and industrial products such as ceramic wares, pottery, bricks,
roofing mica industries, refractories, rocketry; carbides of silicon, boro, tungsten and
brought to you by COREView metadata, citation and similar papers at core.ac.uk
provided by InfinityPress

Communications in Applied Sciences 211
other elements are used as abrasives and cutting tool materials [1]. The study of the
thermal property of the ceramic tile is necessitated by the numerous application
area which ceramic materials enjoy such as mining, aero-space, medicine, refinery,
food and chemical industries, packaging science, electronics, industrial and
transmission electricity, and guided light wave transmission [2].
Thermal conductivity is generated by the movement of electrons and the
transfer of lattice vibrations. From the foregoing, it is understood that this property
differs for different materials, owing to the atomic structure of the material. In clay
soil this property is dependent upon the following factors: texture and mineralogical
composition of the soil, water content of the soil. For ceramics, thermal conductivity
is affected by factors such as internal porosity, grain boundary and impurities.In
heat transfer analysis, thermal diffusivity denoted [3] is the thermal conductivity
divided by density and specific heat capacity at constant pressure.It has the S.I.
unit of m2/s
where is called volumetric heat capacity (J/m3.k). In a sense,
thermal diffusivity is the measure of thermal inertia[4].In a substance with high
thermal diffusivity, heat moves rapidly through because the substance conducts
heat quickly relative to its volumetric heat capacity or thermal bulk. Thermal
diffusivity is often measured with the flash method [5].It involves heating a strip or
cylindrical sample with a short change (reduction in amplitude and phase shift of
the pulse) a short distance away (Blumm and [6,7].
Thermal conductivity and diffusivity which are the rate at which heat is
dissipated and the measure of transient thermal response of a material to a change
in temperature [8], respectively were analyzed by [9] with reference to Abakaliki
clay soil and was found that the thermal conductivity of molded clay model affects
the energy distribution which was inferred to have resulted from the influence of
the density of soil, which is highly affected by the porous nature of the soil. Thermal
diffusion (Heat transfer) through materials or substances is studied using heat
equation which is a parabolic partial differential equation which describes the
distribution of heat or variation in temperature in a given region over time [10]. The

212 Communications in Applied Sciences
transfer equation for thermal energy (Fourier’s law), mechanical moment Newton’s
law of fluid and mass transfer Filck’s law of diffusion are similar [11], and analogies
among these three processes have been developed to facilitate prediction of
conversion from anyone to the other [12].
MATERIALS AND METHOD
Theoretical Method: Consider the schematic representation of idealized physical
setting for heat diffusing in a rectangular mould ceramic tile with equation in which
the boundary conditions as indicated in the diagram is applied.
u(x, 0) = f(x) (initial temperature distribution)
Fig. 1: Model of mould ceramic tile with a negligible width
This equation is solved using the method of separation of variables.
The method applied here for the analysis is the heat equation, which is an
important partial differential equation that describes the distribution of heat or
variation in temperature, given by
=
(1)
Where
c2 = Thermal diffusivity of the material (m2s-1)
k = Thermal conductivity of the material (Js-1k-1m-1)
122 smc
x = l x = 0
u (l, t) = 0
u (0, t) = 0
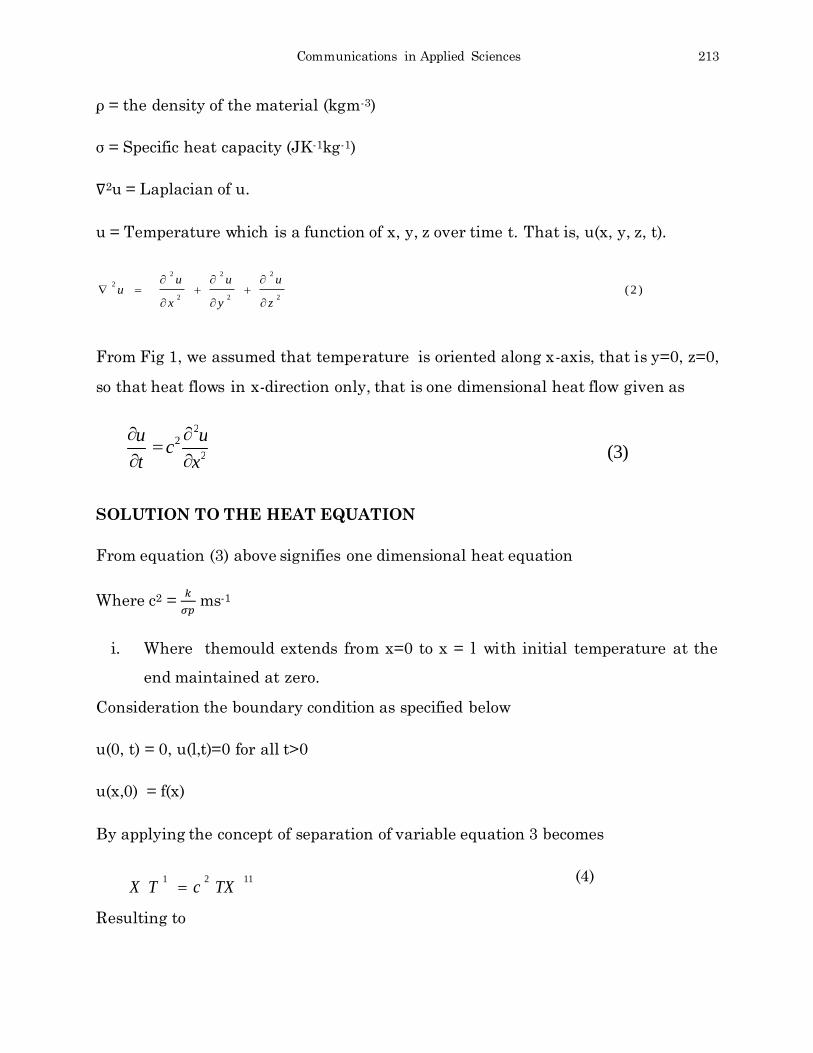
Communications in Applied Sciences 213
ρ = the density of the material (kgm-3)
σ = Specific heat capacity (JK-1kg-1)
∇2u = Laplacian of u.
u = Temperature which is a function of x, y, z over time t. That is, u(x, y, z, t).
From Fig 1, we assumed that temperature is oriented along x-axis, that is y=0, z=0,
so that heat flows in x-direction only, that is one dimensional heat flow given as
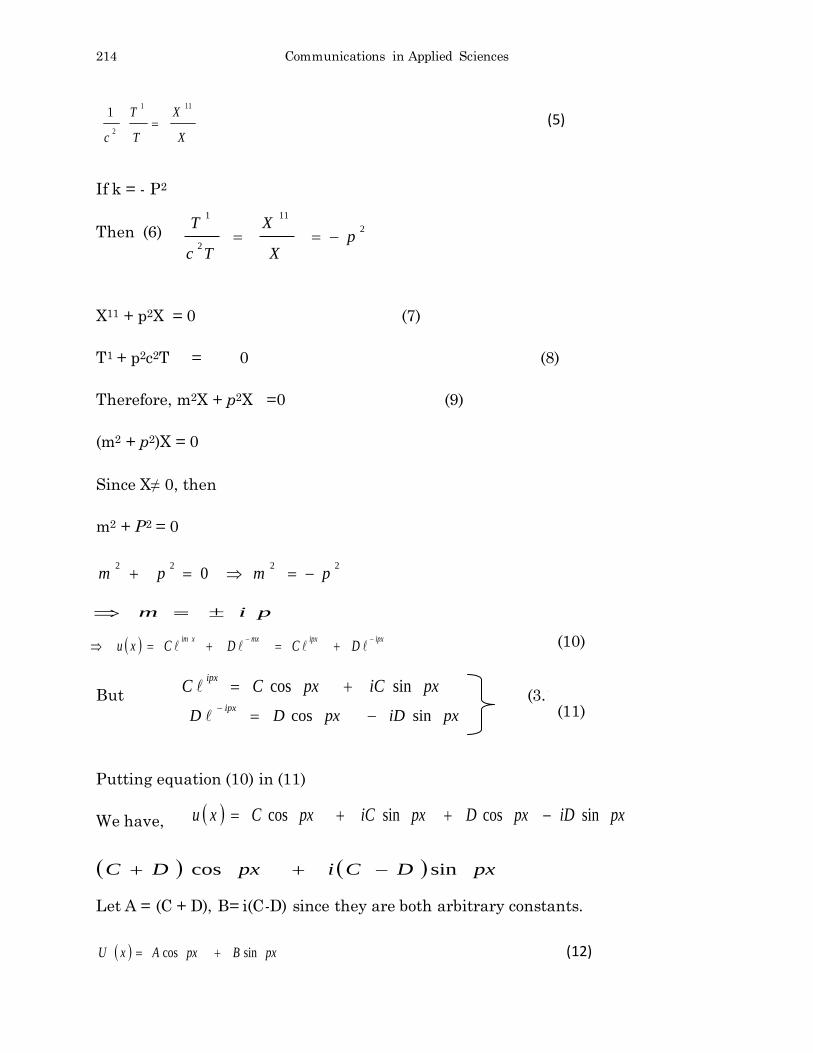
SOLUTION TO THE HEAT EQUATION
From equation (3) above signifies one dimensional heat equation
Where c2 =
ms-1
i. Where themould extends from x=0 to x = l with initial temperature at the
end maintained at zero.
Consideration the boundary condition as specified below
u(0, t) = 0, u(l,t)=0 for all t>0
u(x,0) = f(x)
By applying the concept of separation of variable equation 3 becomes
(4)
Resulting to
)2(2
2
2
2
2
2
2
z
u
y
u
x
uu
(3) 2
2 2
x
u c
t
u
1121TXcTX
214 Communications in Applied Sciences
If k = - P2
Then (6)
X11 + p2X = 0 (7)
T1 + p2c2T = 0 (8)
Therefore, m2X + p2X =0 (9)
(m2 + p2)X = 0
Since X≠ 0, then
m2 + P2 = 0
But (3.15)
Putting equation (10) in (11)
We have,
Let A = (C + D), B= i(C-D) since they are both arbitrary constants.
2
11
2
1
pX
X
Tc
T
22220 pmpm
)13.3(pim
pxiDpxDDipx
sincos
pxiDpxDpxiCpxCxu sincossincos
pxDCipxDC sincos
)9.3(1
111
2X
X
T
T
c (5)
)16.3(sincos pxBpxAxU (12)
pxiCpxCCipx
sincos
)14.3(ipxipxmxxim
DCDCxu
(14a)
(14b)
(10)
(11)

Communications in Applied Sciences 215
For that of equation 8 the solution become
T(t) (13)
But is constant, therefore,
thus, the general solution becomes
If we let , we now obtain
( ) {
} t
2 (16)
Using our earlier specified boundary conditions,
(18)
To get Bn, we use Fourier series technique (B. S. Rajput, 2010).
Which results in
Where n= 1, 2, 3,….
k c
k
cpPc
,
l
cn
)21.3(sin,2
1
t
n
n l
xnBtxu
l
nc
n
)17.3(22tPc
CtT
(14)
)18.3(sincos,22tcP
CpxBpxAXTtxU
(15)
(17)
10
sin)(sin2
,2
n
tl
l
xndxxf
l
xn
ltxu
(19)
ktPc
.22

216 Communications in Applied Sciences
RESULTS AND DISCUSSION
The general solution of the heat equation that was obtained is given in equation (19)
That is
From this equation, the analysis on ceramic tile modeled as depicted in figure 1 was
carried out.
Considering the temperature ranging from 300oC to 1300oC using 100oC interval, at
time ranging from 0 to 120 seconds. The analysis was carried on the thermal
diffusivity(c) measured in (m2s-1).
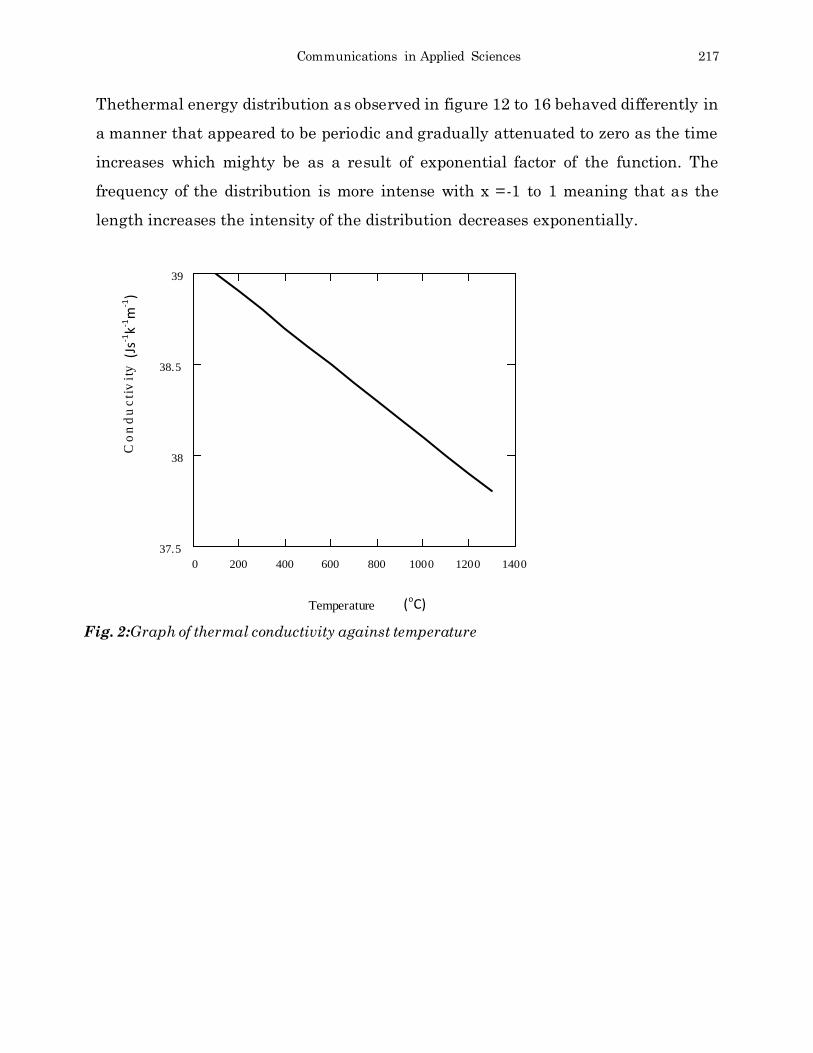
Figure 2 represents graph of thermal conductivity against temperature. While
figure3 represents thermal diffusivity against temperature. These graphs have
decrease in values of both thermal conductivity and diffusivity with increase in
temperature. That is at room temperature, the value of thermal conductivity of the
ceramic tile is 39w/mk and/or slightly above. While that of thermal diffusivity is
0.12x10⁻⁴m2/s.
Figure 4 depicts the graph of temperature distribution against time when
thermal diffusivity (c) = 0.12m2s-1 and length of the material (l) = 0.18m, while
Figure 5 is the graph of temperature distribution against time when thermal
diffusivity (c) = 0.15m2s-1 and length of the material (l) = 0.18m.
The two graphs clearly depicted exponential decay of temperature as the time
increases. This shows that length and time determine the temperature distribution
on ceramic tile which in turn affects the thermal diffusivity of the material.
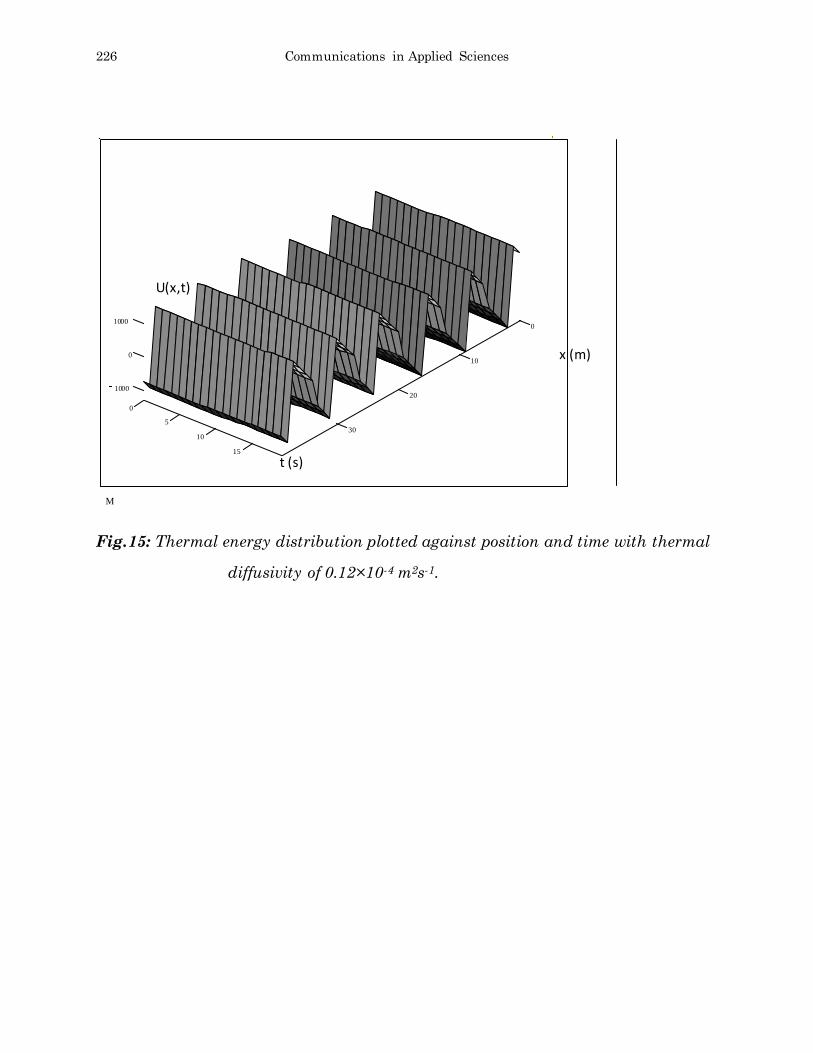
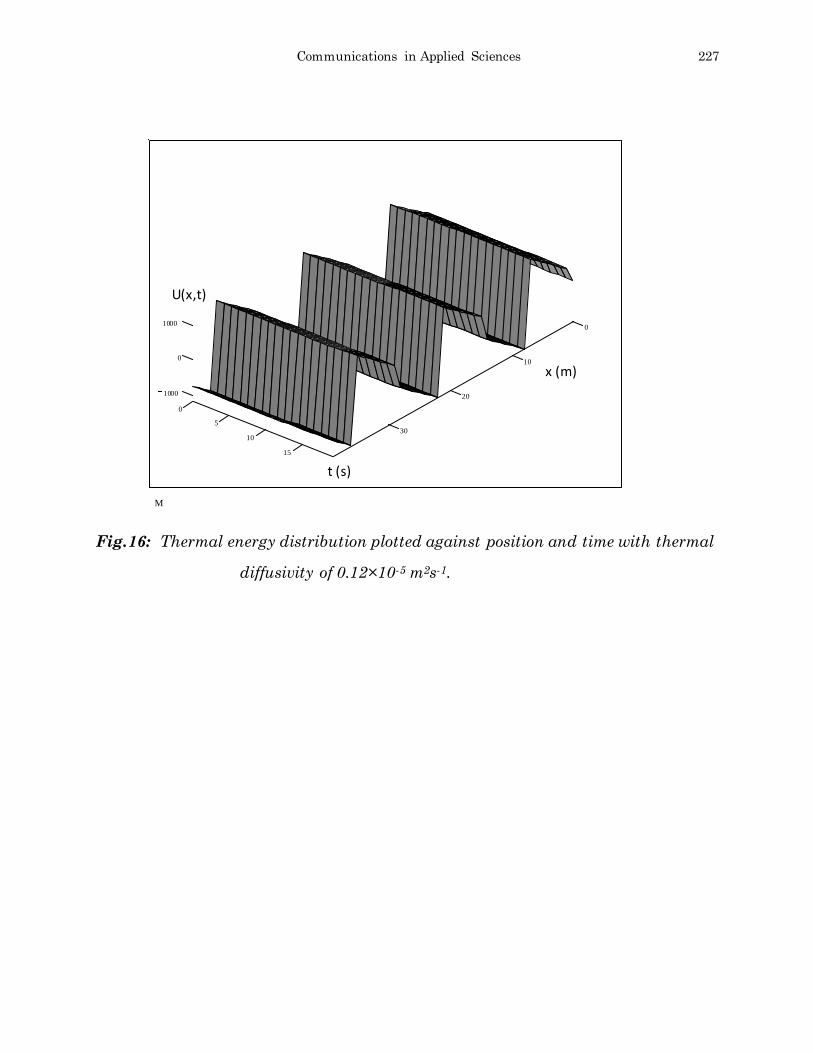
Figure 6 to 11 showed the graph of energy distribution as a function of time. In
figures 6, 7, 8 and 9, there is an exponential decrease in energy distribution as the
time increases. While10 and 11 showed exponential increase of the thermal energy
distribution.
10
sin)(sin2
,2
n
tl
l
xndxxf
l
xn
ltxu
Communications in Applied Sciences 217
Thethermal energy distribution as observed in figure 12 to 16 behaved differently in
a manner that appeared to be periodic and gradually attenuated to zero as the time
increases which mighty be as a result of exponential factor of the function. The
frequency of the distribution is more intense with x =-1 to 1 meaning that as the
length increases the intensity of the distribution decreases exponentially.
0 200 400 600 800 1000 1200 1400
37.5
38
38.5
39
Temperature
Co
nd
uc
tiv
ity
(oC)
(Js-1
k-1m
-1)
Fig. 2:Graph of thermal conductivity against temperature

218 Communications in Applied Sciences
Fig. 4: Graph of temperature distribution against time when
c = 0.12 m2s-1 L = 0.18m
0 200 400 600 800 1000 1200
0.108
0.11
0.112
0.114
0.116
0.118
0.12
Temperature
Dif
fusiv
ity
T t( )
t
0 20 40 60 80 100 120
0
0.5
1
1.5
2
t (s)
(oC)
(m2s-1
)
Fig. 3: Graph of thermal diffusivity against temperature
θ(oC)x103

Communications in Applied Sciences 219
Fig. 5: Graph of temperature distribution against time when
c = 0.15 m2s-1 L = 0.18m
Fig.6: Graph of energy distribution as a function of time for
c = 1.10×10⁻⁵m2s-1
T t( )
t
0 20 40 60 80 100 1200
0.5
1
1.5
2
U t( )
t
10 5 0 5 10
855.45
855.5
855.55
855.6
t(s)
θ(oC)x103
(s)

220 Communications in Applied Sciences
Fig.7:Graph of energy distribution as a function of time for
c = 1.2×10⁻⁵ m2s-
Fig.8: Graph of energy distribution as a function of time when
c = 1.10×10⁻⁵ m2s-1and x = 0.132m
U t( )
t
10 5 0 5 10
855.45
855.5
855.55
855.6
855.65
855.7
U t( )
t
10 5 0 5 10
1033.4
1033.6
1033.8
1034
1034.2
(s)
(s)

Communications in Applied Sciences 221
Fig.9:Graph of energy distribution as a function of time when
c = 1.2×10⁻⁵m2s-1and L= 0.18m x = 0.132m
Fig. 10:Graph of energy distribution as a function of time when
c = 1.10×10⁻⁵m2s-1and x = 0.116m
U t( )
t
10 5 0 5 10
1033.4
1033.6
1033.8
1034
1034.2
U t( )
t
10 5 0 5 10
943.6
943.7
943.8
943.9
944
(s)
(s)

222 Communications in Applied Sciences
Fig. 11:Graph of energy distribution as a function of time when
c = 1.2×10⁻⁵ m2s-1and x = 0.116m
U t( )
t
10 5 0 5 10
943.6
943.7
943.8
943.9
944
(s)

Communications in Applied Sciences 223
Fig.12: Thermal energy distribution plotted against position and time with thermal
diffusivity of 0.12 m2s-1.
M
0
5
10
15
0
10
20
30
1000
0
1000
x (m)
t (s)
U(x,t)

224 Communications in Applied Sciences
Fig.13: Thermal energy distribution plotted against position and time with thermal
diffusivity of 0.12 m2s-1.
M
0
5
10
15
0
10
20
30
1000
0
1000
x (m)
t (s)
U(x,t)

Communications in Applied Sciences 225
Fig .14: Thermal energy distribution plotted against position and time with thermal
diffusivity of 0.12 m2s-1.
M
0
5
10
15
0
10
20
30
1000
0
1000
U(x,t)
t (s)
x (m)
226 Communications in Applied Sciences
Fig.15: Thermal energy distribution plotted against position and time with thermal
diffusivity of 0.12×10⁻⁴ m2s-1.
M
0
5
10
15
0
10
20
30
1000
0
1000
U(x,t)
t (s)
x (m)
Communications in Applied Sciences 227
Fig.16: Thermal energy distribution plotted against position and time with thermal
diffusivity of 0.12×10⁻⁵ m2s-1.
M
0
5
10
15
0
10
20
30
1000
0
1000
t (s)
x (m)
U(x,t)
228 Communications in Applied Sciences
CONCLUSION
The concept of one dimensional heat equation was used in the analysis of the
influence of the thermal diffusivity of ceramic tile on the energy distribution profile.
It was found that the energy distribution along modeled ceramic tile is affected by
thermal diffusivity of the material. It was also observed that energy distribution
maintained periodic profile along the length and showed highest peak when the
time was minimal (zero) but as the time increased, the energy distribution started
flattening to zero which is in accordance. Thus, thermal energy distribution is a
function of time with unique behaviour as a result of variation in thermal diffusivity
as considered in our analysis.
References
[1] Idenyi, N. E and Nwajagu, C. O. (2003), Non-metallic Materials Technology, 1st ed. Olicon
publication, Enugu.
[2] Kingery, W.D.; Bowen, H.K. and Uhmann, D.R. (2006). Introduction to ceramics, Wiley-
Interscience, 2nd edition.
[3] James, Glyn (1993), Advance Modern Engineering Mathematics, Addison Wesley publishing
company.
[4] Venkanna, B.K. (2010). Fundamental of heat and mass transfer New Delh: PHI Learning. P. 38
ISBN 978-81-203-4031-2.
[5] Parker, W.J.; Jenkins, R.J.; Butter, C.P. and Abbott, G.L. (1961). Method of Determining
Thermal Diffusivity, Heat Capacity and Thermal Conductivity. Journal of Applied Physics
32(9) : 1679pdoi:10.1063/1.1728417.
[6] Blumm, J. and Opfermann, J. (2002). Improvement of the Mathematical modeling of flesh
measurements; high temperatures – High pressures 34; 515.doi:10.1068/htjr06.
[7] Thermitus, M.A. (October, 2010). “New beam size correction for thermal diffusivity measurement
with the flash method”. In Gaal, Daniela D.; Gaal, peter S. (eds) Thermal Conductivity
Conference/18th International Thermal Expansion Synposion. Lancaster P.A: Destech
Publications p. 217.
[8] Salazar, A. (2003), “On Thermal Diffusivity”, European Journal of Physics 24.

Communications in Applied Sciences 229
[9] Nwadibia, N. O., E. I. Ugwu, K. A. Aduloju (2010), Research Journal of Applied Science,
Engineering and Technology, 2(3): 216-221.
[10] Rajput, B. S. (2010), Mathematical Physics,22nd edition, K. K. vital for propagation prakashan,
meerut-25000l, pp. 656-661.
[11] Welty, James R., Wicks, Charles E., and Wilson, Robert Elliot (1976). Fundamentals of
Momentum, Heat, and Mass Transfer (2nded.) New York, Wiley.
[12] Faghri, Amir; Zhang, Yuwen; and Howell, John (2010). Advanced Heat and Mass Transfer.
Columbia, MO: Global Digital Press.