
TheNorthAmerican GreenhouseVegetable Industry Other... · Update of the North American Greenhouse...
60
Updated by Zbeetnoff Agro-Environmental Consulting, August 13, 2006 The North American GreenhouseVegetable Industry
-
Upload
vuongkhuong -
Category
Documents
-
view
215 -
download
0
Transcript of TheNorthAmerican GreenhouseVegetable Industry Other... · Update of the North American Greenhouse...

Updated by Zbeetnoff Agro-EnvironmentalConsulting,August 13, 2006
The North AmericanGreenhouseVegetable
Industry

Remember whenMomused to say, “Eat yourvegetables, they’re good for you?” Youmight haveturned up your nose at the broccoli, nibbled awayat the carrots and watched while the peas rolledaround on your plate. And cooked beets had noappeal, whatsoever.
Enter the age of health-conscious consumers whopay attention to what they eat. Suddenly, they’refresh, they’re healthy and they’re everywhere!Every variety, shape and size of vegetable you canpossibly imagine grows in Canadian greenhouses,marking the success of an industry that hasdramatically expanded over the past 15 years.
According to the Statistics Canada 2006agriculture census, in the last five yearsgreenhouse growing space has increased by21 per cent across the country. And vegetablessurpassed flowers as themain product beinggrown under glass.
Given the Canadian climate, knowledgeableproducers grow a wide array of blemish-free,delicious and aesthetically pleasing vegetablesunder glass. Greenhouse operators have 22.2million squaremetres under production acrossthe country.
Sweet corn is the top vegetable grown in Canada,followed by green peas, beans and carrots.
When it comes to fruit, the blueberry leads allothers in popularity with Quebec producingmorethan any other province, followed by Nova ScotiaandNew Brunswick.
Ontario and B.C. account for some 90 per cent ofall Canadian production with Ontario contributing66 per cent and B.C. contributing 24 per cent.There has been broadmarket penetration byCanadian products throughout North America.Although there is significant competition withdomestic producers,Mexico and Europe, the U.S.still accounts for approximately 75 per cent of allproduct sales.
With sophisticated, demanding palates, consumerswant fresh peppers, tomatoes and cucumbers nomatter how cold the weather is in February. Andthey’re willing to pay for it. In part, it is thisdemand that drives the greenhouse industry.
In 2006, FarmCredit Canada commissionedZbeetnoff Agro-Environmental Consulting toupdate a study of the North American greenhousevegetable industry. While some of the informationcontained in the studymay be dated as the industryhas evolved,many of the findings are as relevanttoday as they were when they were first written.
FCC harnesses the power of knowledge to helpguide successful decision-making and advancethe business of agriculture. If you’re thirsty forinformation that will help you build a boomingoperation, give us a call. Our relationshipmanagers and subjectmatter experts from coastto coastmake it easy for you to discover whereyou stand.
Is the market ripefor vegetables?
KnowledgeInsights from FCC
DisclaimerThis study is for educational and general reference purposes only. The authors attempted to provide accurate and useful informationand analysis. However, FCC/AgriSuccess cannot and does not guarantee the accuracy of the information contained in this study.FCC/AgriSuccess assume no responsibility for any actions or decisions taken by any reader of this report based on the informationprovided. It is not intended to be used as a substitute for specific professional advice.
1 British Columbia Ministry of Agriculture, Food and Fisheries- An overview of the B.C. Greenhouse Vegetable Industry Factsheet
Update of the North American Greenhouse Vegetable Industry | i
Executive Summary1.0 North American Greenhouse (GH) production
1.1 Area
In 2006, Mexico was the largest supplier to the North American market, possessing about 60 percent of production area.
Since 2002, Mexican production area has continued to increase at a rate of about 20 per centper year meaning that its total area has doubled in the period. Growth in greenhouse productionarea has also increased in Canada and the U.S. since 2002, however, more modestly at 39 per centand 25 per cent, respectively. There is no indication that rate of growth in Mexico will ease in thenear term, although there is speculation that a financial shakeout is inevitable.
1.2 Production dynamics
The seasonality of Canadian production has been called the Achilles heel of the Canadian GHindustry. Technically, this seasonality could be counteracted except for the economic infeasibilityof year-round production, especially with recent spikes in GH energy costs.The U.S. advantage isrelated to its ability to produce year-round and in the southern states, to take advantage of lowerenergy requirements, Mexican labour andample sunlight. Mexico has traditionallyproduced for the U.S. winter season, howeverhas a wide variety of climes and altitudes thatpermit year-round production. Mexico faceschallenges related to the higher cost of capital,energy and infrastructure.
1.3 Value of production
The value of GH vegetable production inOntario and B.C. in 2005 was actually belowthe value of production in 2002.
1.4 North American crop mix
Mexico dominates each of the three main GHcrops in terms of area of production. In theNorth American industry, tomatoes representabout 67 per cent of area, followed by peppersat 17 per cent and cucumbers at 17 per cent.Since 2002, there has been an incrementaldrop in the proportion of tomato and pepperarea and an increase in cucumber area.

ii | Update of the North American Greenhouse Vegetable Industry
However, the area of all crops has continued to increase.While new GH crops are being considered,most developments have been related to:
• specialty GH tomatoes, peppers and cucumbers for niche markets
• licensing of new proprietary varieties
• organic GH vegetables
2.0 Market dynamics
The market for GH vegetables has become even more continental. About 80 per cent of Canadianproduction enters the U.S. during the northern hemisphere growing season.While most MexicanGH production used to enter the U.S. and Canada counter-seasonally, now rapidly increasingvolumes are appearing in the shoulder seasons, where price have traditionally been higher. Since2002, price peaks have become lower as year-round supply becomes more readily available and in-season prices have declined.
2.1 GH tomato markets
Following trends noted in 2002, beefsteak tomato volume has dropped and tomatoes on the vine(TOV) and specialty tomatoes have increased in significance.The GH tomato market is maturing,meaning that most growth is being created through continued displacement of field-grown varietiesby competing on price and development of new varieties. A significant challenge to GH productmarket expansion is that the food service market, representing 50 per cent of the total fresh market,continues to be largely inaccessible to GH varieties. However, newer GH varieties, with improvedfirmness and slicing characteristics, have potential to enter this market. In 2006, GH tomatoesaccounted for about 37 per cent of the U.S. fresh tomato market. Canadian consumption of GHtomatoes accounts for 54 per cent of the retail fresh market.
2.2 GH bell pepper markets
GH bell pepper imports into the U.S. increased by 62 per cent between 2002 and 2005.The volumeof European-origin GH peppers has continued to decline due to market displacement by improvedCanadian production and the increased cost of transportation to access North American markets. In2004, Canadian exports of GH bell peppers to the U.S. exceeded the volume of European pepperexports for the first time and, in 2005, Mexican exports to the U.S. also exceeded European exportsfor the first time. Nonetheless, European GH pepper exports to the U.S. and Canada are stillsubstantial. GH pepper consumption rose to 31 per cent and 18 per cent of fresh bell pepper retailsales in Canada and the U.S., respectively.
2.3 GH cucumber markets
GH cucumber imports into the U.S. increased by 2.3 per cent between 2002 and 2005.While thevolume of European-origin GH cucumbers imported into the U.S. and Canada is negligible,European and U.S. exports to Canada are increasing in the December to January period.WhileMexican exports to the U.S. and Canada dominate trade in the December to April period, Canadianexport volume of GH cucumbers to the U.S. continues to exceed that of Mexico. GH cucumberconsumption rose to 61 per cent and 11 per cent of fresh cucumber retail sales in Canada and the

Update of the North American Greenhouse Vegetable Industry | iii
U.S., respectively. As such, the potential of the U.S. GH cucumber market remains essentiallyuntapped.
3.0 Market pricing
With the increasing production originating out of Mexico, the U.S. and Canada, several supplydynamics are affecting GH vegetable pricing.
• Mexican investment in higher-technology facilities is resulting in the growth of supply in periodswhen Canadian products are used to obtaining price premiums. Shoulder-season price premiumshave dissolved as seasonality is no longer a market factor and adequate supplies are available to theNorth American GH vegetable markets year round.
• Mexican supply is also appearing when Canadian production comes on stream, resulting in lowerlows in the northern hemisphere crop season.
• European GH peppers continue to hold their premiums in relation to Mexican and Canadianproducts in both Canadian and U.S. markets.This indicates there’s room for growers targetinghigh-end peppers to displace European product.
• With the exception of TOV tomatoes, average annual prices have trended lower since 2002 for allGH vegetables.
• However, prices are responding to year-to-year changes in crop area, indicating that demand andsupply are growing in lock-step.
• Ontario grower pricing is not transparent and there is a suggestion that, since 2002, shippers arecompeting very aggressively for market share.
4.0 Industry developments
Since 2002, the B.C. greenhouse sector is considering significant changes to its regulatory structure.The net impact will be to make market entry easier for new marketing agencies in the province.Nevertheless, the regulatory agency is making a strong case for continued regulation of quotaexpansion and quota transfers. In 2004, the B.C.Vegetable Marketing Commission (BCVMC) issueda minimum price for tomatoes in order to protect grower returns.
Marketing alliances between growers and distributors have increased for at least three reasons: a) todevelop the supply capacity and mix to access large retailers, b) to market exclusive new products,and c) to develop year-round supply
Retailers continue to grow in size and are making more demands on suppliers. Categorymanagement is an important service provided. Scanning technology is providing the means tomonitor and manage returns by the stock keeping unit (SKU) category.
5.0 Competitive factors
Labour and energy comprise upwards of two-thirds of total operating costs for greenhouseoperations.
5.1 Labour
Because of the booming economy, labour availability in Canada andWestern Canada haveramifications for the GH vegetable industry. Since 2004, a Mexican Seasonal AgriculturalWorkers

iv | Update of the North American Greenhouse Vegetable Industry
Program has operated in B.C.This is an unskilled foreign-worker recruiting program modeled onthe Ontario program that has been in operation for at least 25 years.The program is widely used inthe Ontario GH industry and is being rapidly adopted in B.C.A large scale GH feasibility study inAlberta is finding that labour availability will be a critical factor there as well. Alberta farmers haveused the Caribbean Commonwealth and Mexican Seasonal AgriculturalWorkers Program for sometime1.
Most recently, a tight labour market has lead to the recruitment of foreign workers, not only to fillvacant positions of Canadian farm workers drawn to the oil patch, but also for temporary foreignskilled and semi-skilled positions in various other industries in western Canada’s strong economy.
There are suggestions that Mexico as a source of GH labour may be tapping out, in part because ofthe demand within its own GH sector.There is discussion about whether foreign worker programsto access workers from other countries, such as India and China, should be developed.
5.2 Energy
The cost of energy is of paramount concern to Canadian GH operators. Continental natural gaspolicy has lead to spikes in Canadian natural gas costs that are related to consumption eventsin the U.S.
A number of wood waste fired boilers are being installed in B.C.While fuel quality wood waste isavailable in northern B.C. and northern Alberta, the conversion of energy systems to biomass inindustries other than GH has put a strain on wood waste supply. Ontario wood waste supply maynot be adequate to meet existing demand.Wood pellet availability and pricing is being determinedby demand for wood pellets in Europe. B.C.’s harvesting program for pine beetle infested wood willincrease supplies.The ability to recover carbon dioxide from wood waste flue gas would bode wellfor the GH industry.
While Canada has ample supplies of coal, coal prices are rising rapidly in the internationalmarketplace as the Chinese economy continues to sizzle.The technology to burn coal withoutenvironmental impacts is available.The demonstrated ability to derive carbon dioxide from flue gaswould provide a significant boost to coal-fired GH boiler systems.
Ontario has created an alternative energy policy to promote independent green energy production.This program allows for facilities to be constructed for the sale of power to the grid, with theopportunity for the waste heat to be used in greenhouse operations. Similarly, Alberta oil and gasfield facilities hold the potential to attract GH operations utilizing the waste heat.
5.3 Exchange rates
The Canadian dollar has appreciated against the Mexican peso and the U.S. dollar since 2002.Thisexchange rate effect has been shared in the U.S. GH vegetable markets, meaning that Canadian GHproducts are price-takers and that price slippage has occurred. Continued strengthening of theCanadian dollar will force operators to consider larger scale operations, cost-cutting practices, newtechnology to reduce energy input costs, new crops and varieties and labour-saving techniques justto maintain competitiveness with Mexico.
1. In 1997,Alberta used approximately 150 temporary Mexican workers and a larger contingency (over 900 workers) of seasonal Mexican Mennonites,many of whom were Canadian citizens or landed immigrants. See article by Smart, J. 1997. Borrowed men on borrowed time: Globalization, labourmigration and local economies in Alberta. Prairie Centre of Excellence for Research on Immigration and Integration.

Update of the North American Greenhouse Vegetable Industry | v
Table of ContentsExecutive Summary . . . . . . . . . . . . . . . . . . . . . . . . . . . . . . . . . . . . . . . . . . . . . . . . . . . . . . . . . . . . . . .i
1.0 North American GH Production . . . . . . . . . . . . . . . . . . . . . . . . . . . . . . . . . . . . . . . . . . . . . . . .i1.1 Area . . . . . . . . . . . . . . . . . . . . . . . . . . . . . . . . . . . . . . . . . . . . . . . . . . . . . . . . . . . . . . . . . . . . . .i1.2 Production Dynamics . . . . . . . . . . . . . . . . . . . . . . . . . . . . . . . . . . . . . . . . . . . . . . . . . . . . . . . .i1.3 Value of Production . . . . . . . . . . . . . . . . . . . . . . . . . . . . . . . . . . . . . . . . . . . . . . . . . . . . . . . . . .i1.4 North American Crop Mix . . . . . . . . . . . . . . . . . . . . . . . . . . . . . . . . . . . . . . . . . . . . . . . . . . . .i2.0 Market Dynamics . . . . . . . . . . . . . . . . . . . . . . . . . . . . . . . . . . . . . . . . . . . . . . . . . . . . . . . . . . .ii2.1 GHTomato Markets . . . . . . . . . . . . . . . . . . . . . . . . . . . . . . . . . . . . . . . . . . . . . . . . . . . . . . . . .ii2.2 GH Bell Pepper Markets . . . . . . . . . . . . . . . . . . . . . . . . . . . . . . . . . . . . . . . . . . . . . . . . . . . . . .ii2.3 GH Cucumber Markets . . . . . . . . . . . . . . . . . . . . . . . . . . . . . . . . . . . . . . . . . . . . . . . . . . . . . .ii3.0 Market Pricing . . . . . . . . . . . . . . . . . . . . . . . . . . . . . . . . . . . . . . . . . . . . . . . . . . . . . . . . . . . . .iii4.0 Industry Developments . . . . . . . . . . . . . . . . . . . . . . . . . . . . . . . . . . . . . . . . . . . . . . . . . . . . . .iii5.0 Competitive Factors . . . . . . . . . . . . . . . . . . . . . . . . . . . . . . . . . . . . . . . . . . . . . . . . . . . . . . . . .iii5.1 Labour . . . . . . . . . . . . . . . . . . . . . . . . . . . . . . . . . . . . . . . . . . . . . . . . . . . . . . . . . . . . . . . . . . .iii5.2 Energy . . . . . . . . . . . . . . . . . . . . . . . . . . . . . . . . . . . . . . . . . . . . . . . . . . . . . . . . . . . . . . . . . . .iv5.3 Exchange Rates . . . . . . . . . . . . . . . . . . . . . . . . . . . . . . . . . . . . . . . . . . . . . . . . . . . . . . . . . . . .iv
Table of Contents . . . . . . . . . . . . . . . . . . . . . . . . . . . . . . . . . . . . . . . . . . . . . . . . . . . . . . . . . . . . . . . . .vList of Tables . . . . . . . . . . . . . . . . . . . . . . . . . . . . . . . . . . . . . . . . . . . . . . . . . . . . . . . . . . . . . . . . . . . .viList of Figures . . . . . . . . . . . . . . . . . . . . . . . . . . . . . . . . . . . . . . . . . . . . . . . . . . . . . . . . . . . . . . . . . .vii
1.0 Configuration of the GreenhouseVegetable Industry . . . . . . . . . . . . . . . . . . . . . . . . . . . . . . . .11.1 Production Area . . . . . . . . . . . . . . . . . . . . . . . . . . . . . . . . . . . . . . . . . . . . . . . . . . . . . . . . . . . .11.2 Crop Mix . . . . . . . . . . . . . . . . . . . . . . . . . . . . . . . . . . . . . . . . . . . . . . . . . . . . . . . . . . . . . . . . .31.3 Crop Mix by Producing Area . . . . . . . . . . . . . . . . . . . . . . . . . . . . . . . . . . . . . . . . . . . . . . . . . .41.4 Location of New Development . . . . . . . . . . . . . . . . . . . . . . . . . . . . . . . . . . . . . . . . . . . . . . . .62.0 Markets . . . . . . . . . . . . . . . . . . . . . . . . . . . . . . . . . . . . . . . . . . . . . . . . . . . . . . . . . . . . . . . . . . .72.1 Continued Displacement of Field-GrownVarieties . . . . . . . . . . . . . . . . . . . . . . . . . . . . . . . . . .72.1.1 Tomatoes . . . . . . . . . . . . . . . . . . . . . . . . . . . . . . . . . . . . . . . . . . . . . . . . . . . . . . . . . . . . . . . . .72.1.2 Peppers . . . . . . . . . . . . . . . . . . . . . . . . . . . . . . . . . . . . . . . . . . . . . . . . . . . . . . . . . . . . . . . . . . .82.1.3 Cucumbers . . . . . . . . . . . . . . . . . . . . . . . . . . . . . . . . . . . . . . . . . . . . . . . . . . . . . . . . . . . . . . . .82.1.4 New Crops . . . . . . . . . . . . . . . . . . . . . . . . . . . . . . . . . . . . . . . . . . . . . . . . . . . . . . . . . . . . . . . .82.2 Volume of Production . . . . . . . . . . . . . . . . . . . . . . . . . . . . . . . . . . . . . . . . . . . . . . . . . . . . . . .92.3 Value of Production . . . . . . . . . . . . . . . . . . . . . . . . . . . . . . . . . . . . . . . . . . . . . . . . . . . . . . . . .92.4 Returns per Kilogram . . . . . . . . . . . . . . . . . . . . . . . . . . . . . . . . . . . . . . . . . . . . . . . . . . . . . . . .92.5 Supplying the U.S. Market . . . . . . . . . . . . . . . . . . . . . . . . . . . . . . . . . . . . . . . . . . . . . . . . . . .102.5.1 U.S. GHTomato Imports . . . . . . . . . . . . . . . . . . . . . . . . . . . . . . . . . . . . . . . . . . . . . . . . . . . . .102.5.2 U.S. GH Bell Pepper Imports . . . . . . . . . . . . . . . . . . . . . . . . . . . . . . . . . . . . . . . . . . . . . . . . .122.5.3 U.S. GH Cucumber Imports . . . . . . . . . . . . . . . . . . . . . . . . . . . . . . . . . . . . . . . . . . . . . . . . . .132.6 Supplying the Canadian Market . . . . . . . . . . . . . . . . . . . . . . . . . . . . . . . . . . . . . . . . . . . . . . .152.6.1 Canadian GHTomato Imports . . . . . . . . . . . . . . . . . . . . . . . . . . . . . . . . . . . . . . . . . . . . . . . .15
vi | Update of the North American Greenhouse Vegetable Industry
2.6.2 Canadian GH Bell Pepper Imports . . . . . . . . . . . . . . . . . . . . . . . . . . . . . . . . . . . . . . . . . . . . .162.6.3 Canadian GH Cucumber Imports . . . . . . . . . . . . . . . . . . . . . . . . . . . . . . . . . . . . . . . . . . . . . .172.7 Per CapitaVegetable Consumption . . . . . . . . . . . . . . . . . . . . . . . . . . . . . . . . . . . . . . . . . . . . .182.8 GH Products Market Share . . . . . . . . . . . . . . . . . . . . . . . . . . . . . . . . . . . . . . . . . . . . . . . . . . .193.0 Canadian GHVegetableValues . . . . . . . . . . . . . . . . . . . . . . . . . . . . . . . . . . . . . . . . . . . . . . . .213.1 Canadian GHTomatoValue . . . . . . . . . . . . . . . . . . . . . . . . . . . . . . . . . . . . . . . . . . . . . . . . . .213.2 Canadian GH Bell PepperValue . . . . . . . . . . . . . . . . . . . . . . . . . . . . . . . . . . . . . . . . . . . . . . .253.3 Canadian GH CucumberValue . . . . . . . . . . . . . . . . . . . . . . . . . . . . . . . . . . . . . . . . . . . . . . . .274.0 U.S. GHVegetableValues . . . . . . . . . . . . . . . . . . . . . . . . . . . . . . . . . . . . . . . . . . . . . . . . . . . . .304.1 U.S. GHTomatoValue . . . . . . . . . . . . . . . . . . . . . . . . . . . . . . . . . . . . . . . . . . . . . . . . . . . . . . .304.2 U.S. GH Bell PepperValue . . . . . . . . . . . . . . . . . . . . . . . . . . . . . . . . . . . . . . . . . . . . . . . . . . . .314.3 U.S. GH CucumberValue . . . . . . . . . . . . . . . . . . . . . . . . . . . . . . . . . . . . . . . . . . . . . . . . . . . .325.0 Competitive Factors . . . . . . . . . . . . . . . . . . . . . . . . . . . . . . . . . . . . . . . . . . . . . . . . . . . . . . . .335.1 Industry Developments . . . . . . . . . . . . . . . . . . . . . . . . . . . . . . . . . . . . . . . . . . . . . . . . . . . . .335.1.1 British Columbia . . . . . . . . . . . . . . . . . . . . . . . . . . . . . . . . . . . . . . . . . . . . . . . . . . . . . . . . . .335.1.2 Ontario . . . . . . . . . . . . . . . . . . . . . . . . . . . . . . . . . . . . . . . . . . . . . . . . . . . . . . . . . . . . . . . . . .345.1.3 Alberta . . . . . . . . . . . . . . . . . . . . . . . . . . . . . . . . . . . . . . . . . . . . . . . . . . . . . . . . . . . . . . . . . .355.2 Continuing Changes in Marketing . . . . . . . . . . . . . . . . . . . . . . . . . . . . . . . . . . . . . . . . . . . . .355.2.1 Alliances . . . . . . . . . . . . . . . . . . . . . . . . . . . . . . . . . . . . . . . . . . . . . . . . . . . . . . . . . . . . . . . . .355.2.2 Consolidations . . . . . . . . . . . . . . . . . . . . . . . . . . . . . . . . . . . . . . . . . . . . . . . . . . . . . . . . . . . .365.2.3 Changing Purchasing Policies . . . . . . . . . . . . . . . . . . . . . . . . . . . . . . . . . . . . . . . . . . . . . . . .375.3 Labour Issues . . . . . . . . . . . . . . . . . . . . . . . . . . . . . . . . . . . . . . . . . . . . . . . . . . . . . . . . . . . . .375.3.1 Mexico . . . . . . . . . . . . . . . . . . . . . . . . . . . . . . . . . . . . . . . . . . . . . . . . . . . . . . . . . . . . . . . . . .375.3.2 U.S. . . . . . . . . . . . . . . . . . . . . . . . . . . . . . . . . . . . . . . . . . . . . . . . . . . . . . . . . . . . . . . . . . . . . .375.3.3 Canada . . . . . . . . . . . . . . . . . . . . . . . . . . . . . . . . . . . . . . . . . . . . . . . . . . . . . . . . . . . . . . . . . .385.4 Energy Issues . . . . . . . . . . . . . . . . . . . . . . . . . . . . . . . . . . . . . . . . . . . . . . . . . . . . . . . . . . . . .395.4.1 Coal Pricing . . . . . . . . . . . . . . . . . . . . . . . . . . . . . . . . . . . . . . . . . . . . . . . . . . . . . . . . . . . . . .395.4.2 Natural Gas Pricing . . . . . . . . . . . . . . . . . . . . . . . . . . . . . . . . . . . . . . . . . . . . . . . . . . . . . . . .405.4.3 Wood Pellets Pricing . . . . . . . . . . . . . . . . . . . . . . . . . . . . . . . . . . . . . . . . . . . . . . . . . . . . . . .415.4.4 WoodWaste Pricing . . . . . . . . . . . . . . . . . . . . . . . . . . . . . . . . . . . . . . . . . . . . . . . . . . . . . . . .415.4.5 Alternative Energy Programs . . . . . . . . . . . . . . . . . . . . . . . . . . . . . . . . . . . . . . . . . . . . . . . . .425.4.6 Energy Summary . . . . . . . . . . . . . . . . . . . . . . . . . . . . . . . . . . . . . . . . . . . . . . . . . . . . . . . . . .435.5 Impact of Exchange Rate Changes . . . . . . . . . . . . . . . . . . . . . . . . . . . . . . . . . . . . . . . . . . . . .435.6 GH CropYields and Quality . . . . . . . . . . . . . . . . . . . . . . . . . . . . . . . . . . . . . . . . . . . . . . . . . .44
List of Tables
Table 1: Production Area, North America, 2002 to 2006 . . . . . . . . . . . . . . . . . . . . . . . . . . . . . . . . . .1Table 2:Value andVolume of BC and Ontario GH Products, 2002 to 2005 . . . . . . . . . . . . . . . . . . .10Table 3: Per Capita Consumption of Selected FreshVegetables, Canada and the U.S., 2002 to 2006 19Table 4: Retail Market Share of GHVegetables, Canada and the U.S., 2003 to 2005 . . . . . . . . . . . .20Table 5:Average Monthly FOB Pricing, BC, 2000 to 2005 . . . . . . . . . . . . . . . . . . . . . . . . . . . . . . . .21

Update of the North American Greenhouse Vegetable Industry | vii
List of Figures
Figure 1: North American GH Production Area by Country, 2002 to 2006 . . . . . . . . . . . . . . . . . . . .1Figure 2: Percent of North American GH Production Area by Country, 2002 to 2006 . . . . . . . . . . .2Figure 3: Change in North American Production Area, 2002 to 2006 . . . . . . . . . . . . . . . . . . . . . . . .3Figure 4: Change in North American GH Crop Mix, 2002 to 2006 . . . . . . . . . . . . . . . . . . . . . . . . .3Figure 5: Change in North American GH Crop Mix, 2002 to 2006 . . . . . . . . . . . . . . . . . . . . . . . . .4Figure 6: North American GH Crop Mix, 2002 . . . . . . . . . . . . . . . . . . . . . . . . . . . . . . . . . . . . . . . . .4Figure 7: North American GH Crop Mix, 2006 . . . . . . . . . . . . . . . . . . . . . . . . . . . . . . . . . . . . . . . . .5Figure 8: North American Change in GH Crop Mix, 2002 - 2006 . . . . . . . . . . . . . . . . . . . . . . . . . .5Figure 9: North American GH Crop Mix by Country, 2006 . . . . . . . . . . . . . . . . . . . . . . . . . . . . . . . .6Figure 10: Seasonal Pattern of U.S. Imports of GHTomatoes, 2003 to Apr 2006(Source: USITCTrade Database) . . . . . . . . . . . . . . . . . . . . . . . . . . . . . . . . . . . . . . . . . . . . . . . . . . . .11Figure 11: U.S. Imports of GHTomatoes, 2003 to 2005 (Source: USITCTrade Database) . . . . . . . .12Figure 12: Seasonal Pattern of U.S. Imports of GH Peppers, 2003 to Apr 2006(Source: USITCTrade Database) . . . . . . . . . . . . . . . . . . . . . . . . . . . . . . . . . . . . . . . . . . . . . . . . . . . .13Figure 13: U.S. Imports of GH Bell Peppers, 2003 to 2005 (Source: USITCTrade Database) . . . . .13Figure 14: Seasonal Pattern of U.S. Imports of GH Cucumbers, 2003 to Apr 2006(Source: USITCTrade Database) . . . . . . . . . . . . . . . . . . . . . . . . . . . . . . . . . . . . . . . . . . . . . . . . . . . .14Figure 15: U.S. Imports of GH Cucumbers, 2003 to 2005 (Source: USITCTrade Database) . . . . . .14Figure 16: Seasonal Pattern of CDN Imports of GHTomatoes, 2003 to Apr 2006(Statistics Canada, International Trade Statistics) . . . . . . . . . . . . . . . . . . . . . . . . . . . . . . . . . . . . . . . .15Figure 17: CDN Imports of GHTomatoes, 2003 to 2005(Statistics Canada, International Trade Statistics) . . . . . . . . . . . . . . . . . . . . . . . . . . . . . . . . . . . . . . . .16Figure 18: Seasonal Pattern of CDN Imports of GH Bell Peppers, 2003 to Apr 2006(Statistics Canada, International Trade Statistics) . . . . . . . . . . . . . . . . . . . . . . . . . . . . . . . . . . . . . . . .16Figure 19: CDN Imports of GH Bell Peppers, 2003 to 2005(Statistics Canada, International Trade Statistics) . . . . . . . . . . . . . . . . . . . . . . . . . . . . . . . . . . . . . . . .17Figure 20: Seasonal Pattern of CDN Imports of GH Cucumbers, 2003 to Apr 2006(Statistics Canada, International Trade Statistics) . . . . . . . . . . . . . . . . . . . . . . . . . . . . . . . . . . . . . . . .17Figure 21: CDN Imports of GH Cucumbers, 2003 to 2005(Statistics Canada, International Trade Statistics) . . . . . . . . . . . . . . . . . . . . . . . . . . . . . . . . . . . . . . . .18Figure 22: Beefsteak GHTomato Production Area and FOB Prices, B.C. 2000 to 2006(Source: B.C.Vegetable Marketing Commission) . . . . . . . . . . . . . . . . . . . . . . . . . . . . . . . . . . . . . . .22Figure 23: Monthly Average GH BeefsteakTomato Prices, FOB, B.C. 2004-2005(Source: B.C.Vegetable Marketing Commission) . . . . . . . . . . . . . . . . . . . . . . . . . . . . . . . . . . . . . . .22Figure 24: Monthly Average Ontario GH BeefsteakTomato Prices, ChicagoTerminal, 2003 to 2006(Source: USDA Agricultural Marketing Service, Market News Service Reports) . . . . . . . . . . . . . . . .23Figure 25:TOV GHTomato Production Area and FOB Prices, B.C. 2000 to 2006(Source: B.C.Vegetable Marketing Commission) . . . . . . . . . . . . . . . . . . . . . . . . . . . . . . . . . . . . . . .23Figure 26: Monthly Average GHTOVTomato Prices, FOB, B.C. 2004-2005(Source: B.C.Vegetable Marketing Commission) . . . . . . . . . . . . . . . . . . . . . . . . . . . . . . . . . . . . . . .24Figure 27: Monthly Average Ontario GHTOVTomato Prices, ChicagoTerminal, 2003 to 2006(Source: USDA Agricultural Marketing Service, Market News Service Reports) . . . . . . . . . . . . . . . .24Figure 28: GH Bell Pepper Production Area and FOB Prices, B.C. 2000 to 2006(Source: B.C.Vegetable Marketing Commission) . . . . . . . . . . . . . . . . . . . . . . . . . . . . . . . . . . . . . . .25Figure 29: Monthly Average GH Bell Pepper Prices, FOB, B.C. 2004-2005(Source: B.C.Vegetable Marketing Commission) . . . . . . . . . . . . . . . . . . . . . . . . . . . . . . . . . . . . . . .26

viii | Update of the North American Greenhouse Vegetable Industry
Figure 30: Monthly Average Ontario GH Red Bell Pepper Prices, ChicagoTerminal, 2003 to 2006(Source: USDA Agricultural Marketing Service, Market News Service Reports) . . . . . . . . . . . . . . . .26Figure 31: Canadian Imports of GH Bell Peppers – Average Monthly CustomsValue, 2003 toApr 2006 (Statistics Canada, International Trade Statistics) . . . . . . . . . . . . . . . . . . . . . . . . . . . . . . . .27Figure 32: GH Cucumbers Production Area and FOB Prices, B.C. 2000-2006(Source: B.C.Vegetable Marketing Commission) . . . . . . . . . . . . . . . . . . . . . . . . . . . . . . . . . . . . . . .27Figure 33: Monthly Average Ontario GH Cucumber Prices, ChicagoTerminal, 2003 to 2006(Source: USDA Agricultural Marketing Service, Market News Service Reports) . . . . . . . . . . . . . . . .28Figure 34: CDN Imports of GH Cucumbers – Average Monthly CustomsValue, 2003 to Apr 2006(Statistics Canada, International Trade Statistics) . . . . . . . . . . . . . . . . . . . . . . . . . . . . . . . . . . . . . . . .28Figure 35: Monthly Average GH Cucumber Prices, FOB, B.C. 2004-2005(Source: B.C.Vegetable Marketing Commission) . . . . . . . . . . . . . . . . . . . . . . . . . . . . . . . . . . . . . . .29Figure 36: Ontario Shipper Price of Cucumbers in Relation to Canadian ImportValues, 2003 to2005 (Source: Confidential) . . . . . . . . . . . . . . . . . . . . . . . . . . . . . . . . . . . . . . . . . . . . . . . . . . . . . . .29Figure 37: Ontario Grower Shipper GH Cucumber Returns, 2003 to 2005 (Source: Confidential) 30Figure 38: U.S. Monthly FreshTomato Imports – Average CustomsValue, 2003 to Apr 2006(Source: USITCTrade Database) . . . . . . . . . . . . . . . . . . . . . . . . . . . . . . . . . . . . . . . . . . . . . . . . . . . .31Figure 39: U.S. Monthly FreshTomato Imports – Average U.S. CustomsValue (US$) and Average CDNExportValue (CDN$), 2003 to Apr 2006 (Sources: USITCTrade Database; Statistics Canada,International Trade Statistics) . . . . . . . . . . . . . . . . . . . . . . . . . . . . . . . . . . . . . . . . . . . . . . . . . . . . . .31Figure 40: U.S. Monthly GH Bell Pepper Imports – Average U.S. CustomsValue, 2003 to Apr 2006(Source: USITCTrade Database) . . . . . . . . . . . . . . . . . . . . . . . . . . . . . . . . . . . . . . . . . . . . . . . . . . . .32Figure 41: U.S. Monthly GH Cucumber Imports – Average U.S. CustomsValue, 2003 to Apr 2006(Source: USITCTrade Database) . . . . . . . . . . . . . . . . . . . . . . . . . . . . . . . . . . . . . . . . . . . . . . . . . . . .32Figure 42: Japan – Australia Contract Thermal Coal PriceTrends . . . . . . . . . . . . . . . . . . . . . . . . . . .39Figure 43:Weekly Natural Gas Prices in 2005 and 2006 . . . . . . . . . . . . . . . . . . . . . . . . . . . . . . . . .40Figure 44: Monthly Natural Gas Prices, 1998-2005 . . . . . . . . . . . . . . . . . . . . . . . . . . . . . . . . . . . . .41Figure 45:Value of Selected North American Currencies in CDN Dollars . . . . . . . . . . . . . . . . . . . .43Figure 46:Value of the Euro and U.S. Dollar in CDN Dollars . . . . . . . . . . . . . . . . . . . . . . . . . . . . . .44

Update of the North American Greenhouse Vegetable Industry | 1
1.0 Configuration of the Greenhouse Vegetable Industry
1.1 Production area
The configuration of the greenhouse (GH) vegetable sector has continued to change according totrends identified in 2002. In 2006, Mexico at 60 per cent is now clearly the largest production areain North America (NA), followed by Canada at28 per cent and the U.S. at 12 per cent.
Figure 1: North American GH Production Area by Country, 2002 to 2006
Overall, NA production area grew by 70 per cent between 2002 and 2006.This growth was notevenly distributed among producing countries. Mexico increased production area by 105 per centin the period, while Canada increased by 39 per cent and the U.S. by 25 per cent.
Table 1: Production Area, North America, 2002 to 2006
Source: Solymosi, A. 2006. B.C.Vegetable Marketing Commission
Hect
ares

2 | Update of the North American Greenhouse Vegetable Industry
New B.C. facilities are all glasshouses. In 2004, about 47 per cent of new Ontario facilities wereglasshouses. It is unclear whether glasshouses will become the construction trend in Ontario inlight of several factors:
• pressure on the industry to extend production into the winter months
• rising energy costs
• effectiveness of energy curtains to conserve energy
• innovative developments in greenhouse plastic covers2.
About 94 per cent of Mexican GH area is covered in plastic and only 4 per cent in glass.The growthof Mexican GH area is anticipated to continue to at 20 per cent annually, and the bulk of this willconsist of higher technology facilities.The current overall level of technological adoption in MexicanGH facilities has been estimated at about 40 per cent3.
Because GH production area in B.C. is regulated through quota allocation and transfers, futuregrowth in production is determined through a process that coordinates B.C. production and cropmix with agency demands for product, grower returns and assessment of competitors. As such,future growth depends on applications for new production and annual assessments of marketdemand for products. Decisions on expansions in any given year are made two years previous. Forexample, while the Ontario sector grew by 110 acres in 2006, the BCVMC denied expansions andtransfers in 2006 crop allocations in 20044.
Growth in Ontario GH area is not regulated and new production area is not subject to regulatoryapproval except that all production facilities must be licensed with the OntarioVegetableGreenhouse Growers (OVGG).As such, production area may respond more aggressively than B.C. inresponse to perceived market opportunities.
Figure 2: Percent of North American GH production area by country, 2002 to 2006
2. Papadopoulos, Dr. A. 2005. Highlights of current production practices in Ontario: greenhouse tomatoes. Paper presented to the New EnglandVegetable and Berry Growers and Massachusetts Fruit Growers Association 14th conference andTrade Show. Manchester, New Hampshire, USA. Dec13-15.
3. Steta, M. 2004. Perspectivas de la produccion de hortalizas de invernadero en Mexico. IV Foro de Expectativas del Sector Agroalimentario yPesquero.April http://www.siap.sagarpa.gob.mx/ForoIV/panel4/MarioSteta.pdf
4. See http://www.fcc-fac.ca/newsletters/en/express/articles/20041029_e.asp#5
Perc
ent

Update of the North American Greenhouse Vegetable Industry | 3
Figure 3: Change in North American production area, 2002 to 2006
1.2 Crop mix
In 2002, GH tomatoes accounted for almost 68 per cent of the total NA production area, followedby peppers at 17 per cent and cucumbers at 14 per cent. In 2006, crop mix has adjusted slightly toconsist of proportionately less tomato and peppers area and more cucumbers. About 5 per cent ofMexican GH area is used for herb production and other crops.
Figure 4: Change in North American GH crop mix, 2002 to 2006
Hect
ares
Perc
ento
fAre
a

4 | Update of the North American Greenhouse Vegetable Industry
Figure 5: Change in North American GH crop mix, 2002 to 2006
1.3 Crop mix by producing area
The dominant crop in all producing areas continues to be tomatoes.The U.S. has relatively smallareas of GH peppers and cucumbers. Between 2002 and 2006, the strongest growth in productionarea occurred for peppers in Canada, tomatoes in the U.S. and cucumbers in Mexico.
Figure 6: North American GH crop mix, 2002
Hect
ares
Hect
ares

Update of the North American Greenhouse Vegetable Industry | 5
Figure 7: North American GH crop mix, 2006
Figure 8: North American change in GH crop mix, 2002 - 2006
Hect
ares
%Ch
ange

6 | Update of the North American Greenhouse Vegetable Industry
Figure 9: North American GH crop mix by country, 2006
Canadian growers are growing new varieties of tomatoes, peppers and cucumbers and usingdifferent production protocols in an effort to access market niches and to differentiate their productsfrom mainstream products.These products include organic, Campari tomato, strawberry tomato,sweet chili pepper, yellow cherry tomatoes, yellow and orange cluster tomatoes, yellow beefsteaktomatoes, Zebra and Amorosa cocktail tomatoes and mini- and midi-cucumbers. Nonetheless,specialty GH products represent only a small proportion of total production and marketing alliancesare especially important in gaining market access.
1.4 Location of new development
The location of the Canadian greenhouse sector remains in Ontario, B.C., Quebec and Alberta, inthat order of size. Alberta is currently undertaking a study to determine if it has a competitiveadvantage in pursuing the NA GH vegetable market. A favourable outcome of this study would leadto efforts to attract a potential investor.
Canadian growth in production area was relatively stagnant in 2003 to 2004, before increasing in2005 and 2006. Growth is expected to be marginal in 2007.
New U.S. GH vegetable production area has grown modestly near the locations of existing southernoperations, like Eurofresh in Arizona. Location considerations that have pushed the sector south haveincluded the availability of labour, which tends to be of Mexican origin, increased light and reducedenergy costs.
Mexican production has expanded aggressively out of coastal, sea-level locations into higherelevations, where temperatures are less extreme.This has entailed the greater use of technology tobuild facilities that provide a protected environment for vegetable production in more variableclimates. At the same time, low technology, including shade cloth operations, are adoptingtechnology to maintain their access to export markets.
Perc
ent

Update of the North American Greenhouse Vegetable Industry | 7
2.0 MarketsEssentially, the NA GH vegetable market continues as a continental market with the U.S. as thedominant consumer market. GH production from Mexico, the U.S. and Canada compete in theCanadian and U.S. markets. Although Mexican GH vegetable consumption is increasing, it does notpresent an opportunity for either Canadian or U.S. greenhouse growers at this time. Europeanproduction enters North America during periods when supply drops or is unavailable, as in thewinter and shoulder months of crop seasons.The North American consumer expects year-roundavailability of high quality tomatoes, peppers and cucumbers.
The North American greenhouse industry continues to mature with steady growth in marketdemand. Since 2002, growth of the markets for North American-grown GH products is beingcreated through:
• continued replacement of U.S. field grown fresh produce
• displacement of European imports
• increasing population
• production of specialty products
• increased per capita consumption of vegetables
Overall, most of the Canadian greenhouse industry participants feel that their industry has goodopportunities.They agree that the markets have matured over the past few years with slow, steadymarket growth being experienced in both Canada and the U.S.The growth appears to be comingfrom both increases in fresh product consumption with current emphasis on healthier eatingcombined with some further movement from field to greenhouse products.
2.1 Continued displacement of field-grown varieties
2.1.1 Tomatoes
Greenhouse tomatoes account for about 37 per cent of the quantity sold of fresh tomatoes5. Its maincompetitor, the green tomato, is now more important in the food service market than in the freshmarket.The field tomato is preferred in food service because of its greater firmness and betterslicing characteristics, although GH varieties with less juiciness are being developed. Even with theimproved quality of field grown products through the cultivation of vine-ripe and extended shelflife varieties, GH tomatoes have continued to increase market share through the development ofnew varieties, colours, shapes and tastes.
A substantial portion of Florida field tomato production has shifted to Mexico and other states.While total U.S. fresh field tomato production has increased due to increasing yields, the area offresh tomatoes has declined since 2000.The U.S. mature green tomato has experienced significantcompetition from other field varieties, such as the extended shelf life (ESL) vine ripe varieties,romas and specialty. All field varieties have been confronted with an expanding supply of GHtomatoes6.
The pricing for tomatoes has changed over the past three years withTOV production increasingalong with the speciality product while production of beefsteak declined to some extent.The resultis that the beefsteak market is in equilibrium with pricing very similar toTOV pricing, sometimes
5. Cook, R. and L. Calvin. 2005. Greenhouse tomatoes change the dynamics of the North American fresh tomato industry. USDA Economic ResearchReport Number 2.April. http://www.ers.usda.gov/publications/err2/err2.pdf
6. Ibid.

8 | Update of the North American Greenhouse Vegetable Industry
higher and sometimes lower. Industrymembers feel that 2006 will produce pricingsimilar to 2005 although it could be slightlylower.
The Amarosa tomato is a patented productsimilar to campari that is licensed to selectedgrowers, as is campari.These varieties areshowing market growth along with astrawberry tomato and grape tomatoes on thevine that are proving popular. Cherry tomatoesare being forced out of the market by the newtypes.
2.1.2 Peppers
The quality of GH peppers exceeds that offield grown peppers and GH productionprovides a much wider season of availabilitycompared to field grown. In addition, theconsumer demand for high-quality red,orange and yellow bell peppers has beenincreasing dramatically over the past decade.
The loss of methyl bromide for use as a soilfumigant7 for field grown crops including peppers, is considered a market opportunity for growersof greenhouse peppers in Florida8.
2.1.3 Cucumbers
The market penetration of GH cucumbers in the U.S. continues to be well below the Canadianmarket share. Nonetheless, that share is increasing due to the superior quality of the GH cucumberand the availability of new varieties.
The Canadian industry has conducted numerous in-store demos and has educated some U.S.consumers as to the benefits of the long English cucumber. Some of the producers believe thatwhere the industry has fallen down is in not putting money into advertising in order to keep thelong English in front of the consumers and continue the education as to their value. Long Englishcucumbers do not have the same exposure at retail in the U.S. as they do in Canada and retailersneed to be educated as to how regular specializing can assist in moving the volumes.
2.1.4 New crops
Canadian growers are concerned about the increasing market power of Mexico in GH crops that arebecoming commodities such as beefsteak andTOV tomatoes where lowest price is the maindeterminant of market success.
7. Use of methyl bromide by developed countries was phased out as of January 1, 2005.The U.S. Clean Air Act and the Montreal Protocol havedetermined that methyl bromide damages the stratospheric ozone.
8. Jovicich, E., J.J.VanSickle, D.J. Cantliffe and P.J. Stoffella. 2005. Market of Colored Bell Peppers and an Estimated Profitability for the Production inGreenhouses in Florida. HortTechnology 15(2):355–369.

Update of the North American Greenhouse Vegetable Industry | 9
Other greenhouse crops that are starting to show up are eggplant, a product that was tried a fewyears ago and is coming back, along with the mini-sweet-bell peppers. Mini-cucumbers, althougha small market overall, are very popular this year with demand currently outstripping supply. Itappears that the trend toward mini-products continues to build in virtually all crops.
Other growers are looking for new crops and technologies that will give them competitiveadvantages longer than just the current year, after which new entrants will flood the market.Theseapproaches tend to consider exclusive licensing agreements respecting patented varieties,proprietary production protocols, adoption of new technologies and grower funded research.
2.2 Volume of production
The total volume of GH production increased in both Ontario and B.C. between 2002 and 2005.
The volume of GH tomato production in B.C. declined marginally and dropped by 18 per centin Ontario.
The volume of pepper production in Ontario increased 22 per cent, while in B.C. volume increasedby 13 per cent.
The volume of cucumber production increased in both GH vegetable growing regions: by 31 percent in Ontario and by 62 per cent in B.C.
2.3 Value of production
The value of B.C. greenhouse vegetable production in 2005 was $225 million, actually lower than2002 at $231 million by 2.6 per cent. In the same period, Ontario value of production decreasedby 10 per cent from $431 million to $387million.This situation mostly reflectedsignificant switches in crops in both provinces.Ontario switched to peppers and B.C. switchedto cucumbers.
In both regions, the value of tomatoproduction dropped about the samepercentage. However, Ontario showedincreases in farm gate revenues from GHpepper production while B.C. revenuesdeclined marginally. B.C. increased its value ofGH cucumber production because of asignificant increase in production area.
2.4 Returns per kilogram
The table below presents average annualreturns per kilogram in Ontario and B.C.
Ontario growers experienced an increase intomato revenues per kg between 2002 and2005, while per kg revenues for B.C. growersdropped. However, B.C. returns were
10 | Update of the North American Greenhouse Vegetable Industry
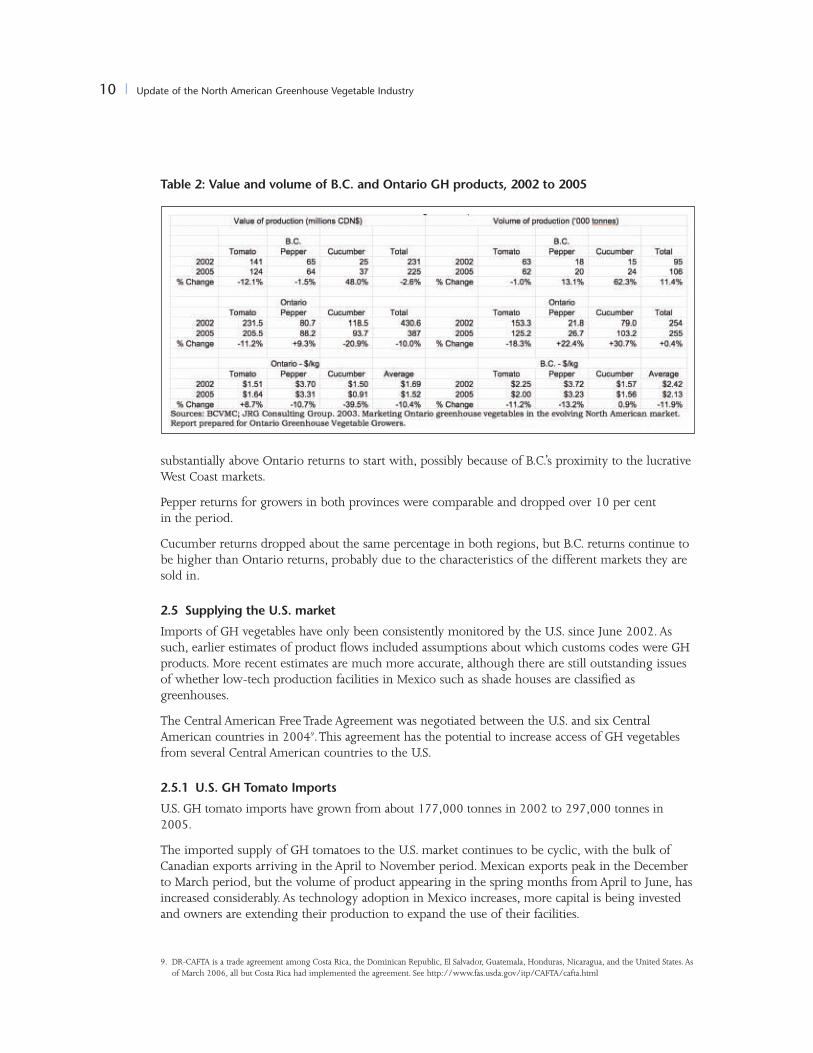
Table 2: Value and volume of B.C. and Ontario GH products, 2002 to 2005
substantially above Ontario returns to start with, possibly because of B.C.’s proximity to the lucrativeWest Coast markets.
Pepper returns for growers in both provinces were comparable and dropped over 10 per centin the period.
Cucumber returns dropped about the same percentage in both regions, but B.C. returns continue tobe higher than Ontario returns, probably due to the characteristics of the different markets they aresold in.
2.5 Supplying the U.S. market
Imports of GH vegetables have only been consistently monitored by the U.S. since June 2002.Assuch, earlier estimates of product flows included assumptions about which customs codes were GHproducts. More recent estimates are much more accurate, although there are still outstanding issuesof whether low-tech production facilities in Mexico such as shade houses are classified asgreenhouses.
The Central American FreeTrade Agreement was negotiated between the U.S. and six CentralAmerican countries in 20049.This agreement has the potential to increase access of GH vegetablesfrom several Central American countries to the U.S.
2.5.1 U.S. GH Tomato Imports
U.S. GH tomato imports have grown from about 177,000 tonnes in 2002 to 297,000 tonnes in2005.
The imported supply of GH tomatoes to the U.S. market continues to be cyclic, with the bulk ofCanadian exports arriving in the April to November period. Mexican exports peak in the Decemberto March period, but the volume of product appearing in the spring months fromApril to June, hasincreased considerably. As technology adoption in Mexico increases, more capital is being investedand owners are extending their production to expand the use of their facilities.
9. DR-CAFTA is a trade agreement among Costa Rica, the Dominican Republic, El Salvador, Guatemala, Honduras, Nicaragua, and the United States. Asof March 2006, all but Costa Rica had implemented the agreement. See http://www.fas.usda.gov/itp/CAFTA/cafta.html
Update of the North American Greenhouse Vegetable Industry | 11
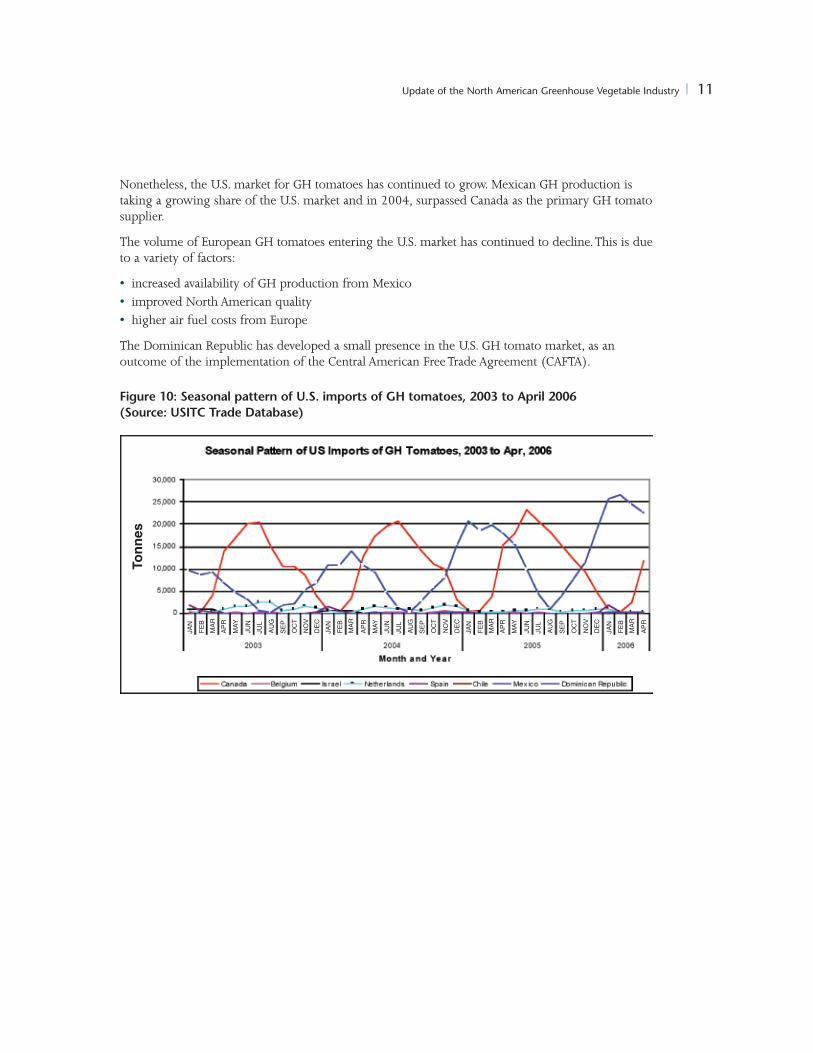
Nonetheless, the U.S. market for GH tomatoes has continued to grow. Mexican GH production istaking a growing share of the U.S. market and in 2004, surpassed Canada as the primary GH tomatosupplier.
The volume of European GH tomatoes entering the U.S. market has continued to decline.This is dueto a variety of factors:
• increased availability of GH production from Mexico• improved North American quality• higher air fuel costs from Europe
The Dominican Republic has developed a small presence in the U.S. GH tomato market, as anoutcome of the implementation of the Central American FreeTrade Agreement (CAFTA).
Figure 10: Seasonal pattern of U.S. imports of GH tomatoes, 2003 to April 2006(Source: USITC Trade Database)
Tonn
es
FEB
JAN
MAR
APR
MAY
JUN
JUL
AUG
SEP
OCT
NOV
DEC
FEB
JAN
MAR
APR
MAY
JUN
JUL
AUG
SEP
OCT
NOV
DEC
FEB
JAN
MAR
APR
FEB
JAN
MAR
APR
MAY
JUN
JUL
AUG
SEP
OCT
NOV
DEC
12 | Update of the North American Greenhouse Vegetable Industry
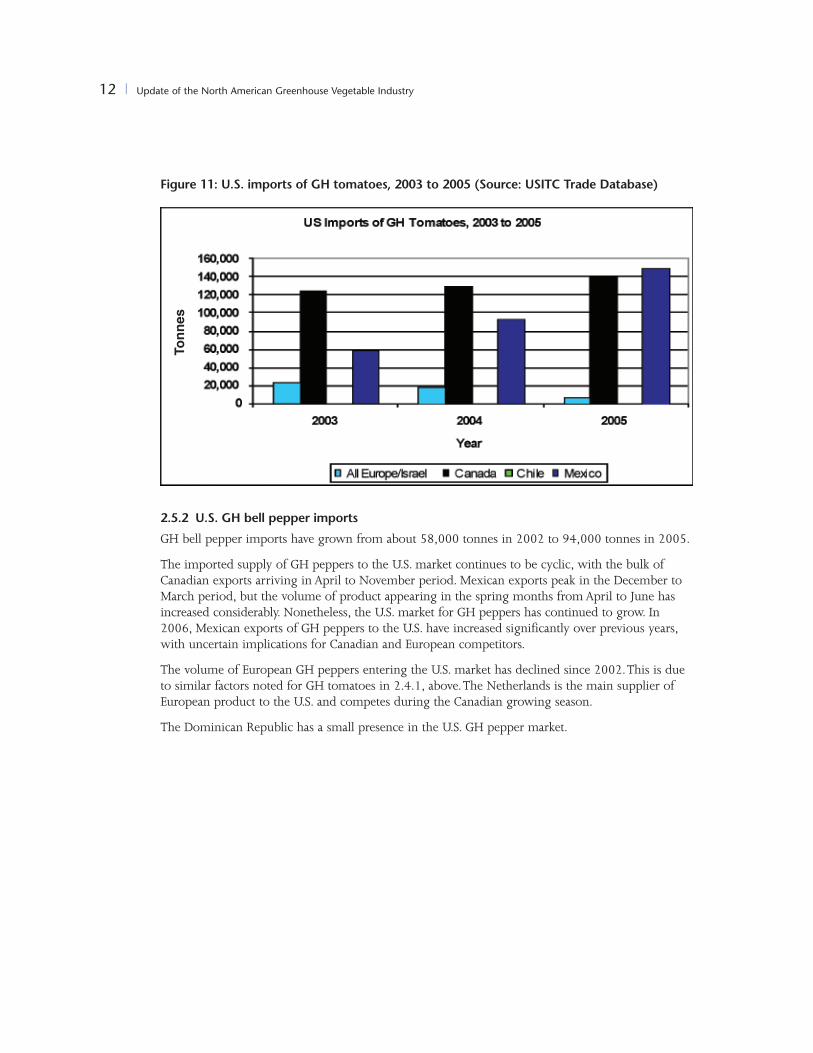
Figure 11: U.S. imports of GH tomatoes, 2003 to 2005 (Source: USITC Trade Database)
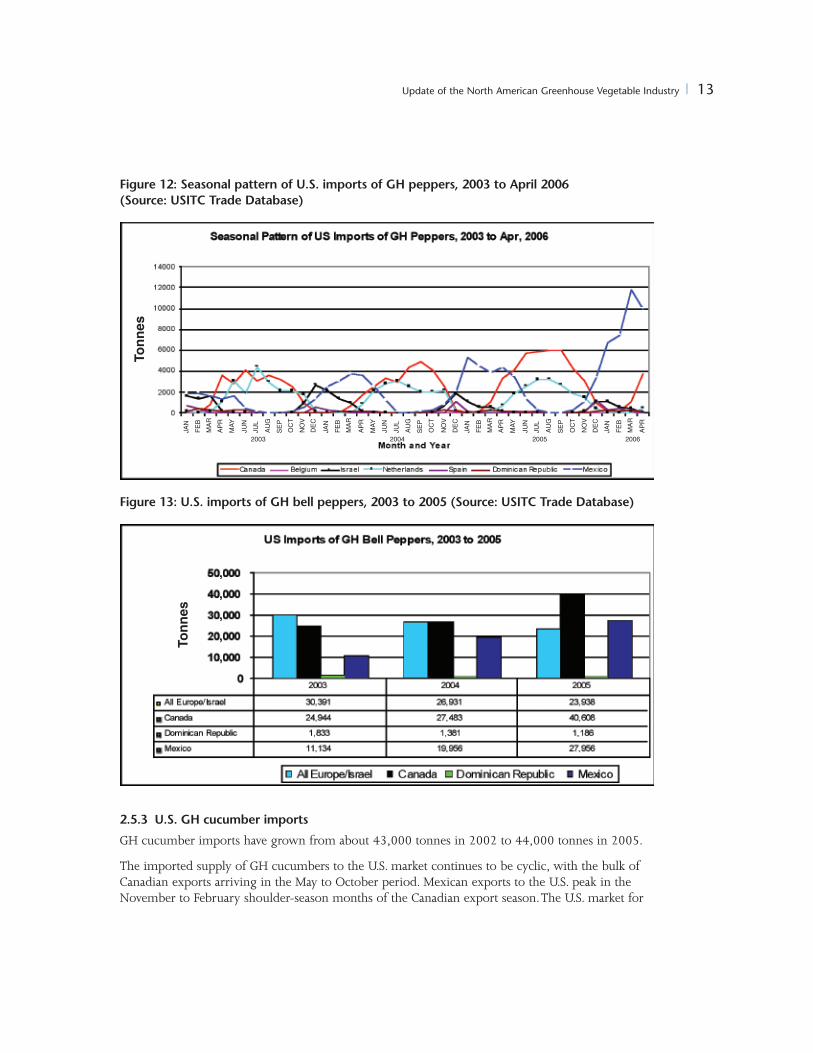
2.5.2 U.S. GH bell pepper imports
GH bell pepper imports have grown from about 58,000 tonnes in 2002 to 94,000 tonnes in 2005.
The imported supply of GH peppers to the U.S. market continues to be cyclic, with the bulk ofCanadian exports arriving in April to November period. Mexican exports peak in the December toMarch period, but the volume of product appearing in the spring months fromApril to June hasincreased considerably. Nonetheless, the U.S. market for GH peppers has continued to grow. In2006, Mexican exports of GH peppers to the U.S. have increased significantly over previous years,with uncertain implications for Canadian and European competitors.
The volume of European GH peppers entering the U.S. market has declined since 2002.This is dueto similar factors noted for GH tomatoes in 2.4.1, above.The Netherlands is the main supplier ofEuropean product to the U.S. and competes during the Canadian growing season.
The Dominican Republic has a small presence in the U.S. GH pepper market.
Tonn
es
Update of the North American Greenhouse Vegetable Industry | 13
Figure 12: Seasonal pattern of U.S. imports of GH peppers, 2003 to April 2006(Source: USITC Trade Database)
Figure 13: U.S. imports of GH bell peppers, 2003 to 2005 (Source: USITC Trade Database)
2.5.3 U.S. GH cucumber imports
GH cucumber imports have grown from about 43,000 tonnes in 2002 to 44,000 tonnes in 2005.
The imported supply of GH cucumbers to the U.S. market continues to be cyclic, with the bulk ofCanadian exports arriving in the May to October period. Mexican exports to the U.S. peak in theNovember to February shoulder-season months of the Canadian export season.The U.S. market for
Tonn
es
Tonn
esFEB
JAN
MAR
APR
MAY
JUN
JUL
AUG
SEP
OCT
NOV
DEC
FEB
JAN
MAR
APR
MAY
JUN
JUL
AUG
SEP
OCT
NOV
DEC
FEB
JAN
MAR
APR
FEB
JAN
MAR
APR
MAY
JUN
JUL
AUG
SEP
OCT
NOV
DEC
2003 2004 2005 2006

14 | Update of the North American Greenhouse Vegetable Industry
GH cucumbers has continued to grow slowly and Mexican exports are capturing most of thatincrease. Canadian exports of GH cucumbers to the U.S. declined marginally in 2005.
The volume of European GH cucumbers entering the U.S. market has remained relatively static since2002. Israel is the main supplier of European product to the U.S. when Canadian and Mexicansupply is limited.
Dominican Republic and Honduras have developed a limited presence in the U.S. GH cucumbermarket since 2002.
Figure 14: Seasonal pattern of U.S. imports of GH cucumbers, 2003 to April 2006 (Source:USITC Trade Database)
Figure 15: U.S. imports of GH cucumbers, 2003 to 2005 (Source: USITC Trade Database)
Tonn
esTo
nnes
FEB
JAN
MAR
APR
MAY
JUN
JUL
AUG
SEP
OCT
NOV
DEC
FEB
JAN
MAR
APR
MAY
JUN
JUL
AUG
SEP
OCT
NOV
DEC
FEB
JAN
MAR
APR
FEB
JAN
MAR
APR
MAY
JUN
JUL
AUG
SEP
OCT
NOV
DEC
2003 2004 2005 2006

Update of the North American Greenhouse Vegetable Industry | 15
2.6 Supplying the Canadian market
2.6.1 Canadian GH tomato imports
Canada is facing increasing competition in its domestic markets for GH vegetables. Mexico hasdeveloped a major presence in the Canadian GH tomato market. Since 2003, this presence hasincreased in volume as well as the length of season in which Mexican products are available.
U.S. exports to Canada have remained relatively static in the 2003 to 2005 period and a proportionconsists of product from the Oxnard operation in California that is allied with B.C. Hot HouseFoods Inc.
Spain has the largest presence in the Canadian GH tomato market in the winter season.TheNetherlands no longer has a significant position in the in-season Canadian GH tomato market. In2005, GH tomato imports from Europe and Israel were at the lowest levels in the 2003-2005period.
Figure 16: Seasonal pattern of CDN imports of GH tomatoes, 2003 to April 2006(Statistics Canada, International Trade Statistics)
Tonn
es
FEB
JAN
MAR
APR
MAY
JUN
JUL
AUG
SEP
OCT
NOV
DEC
FEB
JAN
MAR
APR
MAY
JUN
JUL
AUG
SEP
OCT
NOV
DEC
FEB
JAN
MAR
APR
FEB
JAN
MAR
APR
MAY
JUN
JUL
AUG
SEP
OCT
NOV
DEC

16 | Update of the North American Greenhouse Vegetable Industry
Figure 17: CDN imports of GH tomatoes, 2003 to 2005(Statistics Canada, International Trade Statistics)
2.6.2 Canadian GH bell pepper imports
Canadian imports of GH peppers from Mexico increased rapidly since 2002.
European GH peppers still dominate Canadian imports.The Netherlands is a significant exporter toCanada during Canadian peak production. Spanish production enters in the winter season.
U.S. exports to Canada are losing ground to imports from other locations. A small quantity ofCentral American GH tomato production is starting to appear in Canada in the winter season.
Figure 18: Seasonal pattern of CDN imports of GH bell peppers, 2003 to April 2006(Statistics Canada, International Trade Statistics)
Tonn
esTo
nnes
FEB
JAN
MAR
APR
MAY
JUN
JUL
AUG
SEP
OCT
NOV
DEC
FEB
JAN
MAR
APR
MAY
JUN
JUL
AUG
SEP
OCT
NOV
DEC
FEB
JAN
MAR
APR
FEB
JAN
MAR
APR
MAY
JUN
JUL
AUG
SEP
OCT
NOV
DEC
2003 2004 2005 2006

Update of the North American Greenhouse Vegetable Industry | 17
Figure 19: CDN imports of GH bell peppers, 2003 to 2005(Statistics Canada, International Trade Statistics)
2.6.3 Canadian GH cucumber imports
Canadian imports of GH cucumbers from Mexico dominate imports, but the amounts imported aresmall relative to the Canadian market and remain strictly a winter season product.
European GH cucumbers still dominate Canadian imports.The Netherlands is a significant exporterto Canada during Canadian peak production. Spanish production enters in the winter season. Smallquantities of U.S. and Spanish GH cucumber production enter Canada in the winter season.
Figure 20: Seasonal pattern of CDN imports of GH cucumbers, 2003 to April 2006(Statistics Canada, International Trade Statistics)
Tonn
esTo
nnes
FEB
JAN
MAR
APR
MAY
JUN
JUL
AUG
SEP
OCT
NOV
DEC
FEB
JAN
MAR
APR
MAY
JUN
JUL
AUG
SEP
OCT
NOV
DEC
FEB
JAN
MAR
APR
FEB
JAN
MAR
APR
MAY
JUN
JUL
AUG
SEP
OCT
NOV
DEC
2003 2004 2005 2006

18 | Update of the North American Greenhouse Vegetable Industry
Figure 21: CDN imports of GH cucumbers, 2003 to 2005(Statistics Canada, International Trade Statistics)
2.7 Per capita vegetable consumption
Per capita fresh vegetable consumption has levelled off in the last four years in both the U.S. andCanada. In Canada, consumption of fresh tomatoes may have declined since 2002. Cucumber andpepper consumption has shown only the most modest of increases.
While U.S. consumption of fresh tomatoes exceeds Canadian per capita consumption, U.S.consumption of fresh cucumbers and peppers continues to lag behind Canadian per capitaconsumption.
A recent report10 on Canadian consumer trends to 2020 suggests that fresh vegetable consumptionin Canada will increase 3 per cent over the next 15 years.This would suggest that opportunities forGH market share expansion in Canada will be highly dependent on displacement of field grownproduction and imports and natural increase in population.
10. Serecon Management Consulting Inc. 2005. Canadian food trends to 2020:A long range consumer outlook. Report prepared for Agriculture andAgri-food Canada. Ottawa. http://www.agr.gc.ca/misb/fb-ba/pdf/ft-ta_e.pdf
Tonn
es

Update of the North American Greenhouse Vegetable Industry | 19
Table 3: Per capita consumption of selected fresh vegetables, Canada and the U.S.,2002 to 2006
2.8 GH products market share
Based on retail sales information, GH vegetable consumption continues to steadily increase, but atdifferent rates in Canada and the U.S. GH products hold larger shares of the vegetable markets inCanada in all categories, raising the ever-present question of “Why?” in light of the culinarysimilarities between the two countries.
GH beefsteak tomatoes retain a significantly large share of the retail market in Canada, while in theU.S. market share was low to start with and has been slowly declining. In contrast,TOV large tomatomarket share is substantial in both countries. It should be noted that specialty GH tomatoes whichare not indicated also contribute to overall GH tomato market share.
While GH bell peppers hold almost twice the market share in Canada as compared to the U.S., GHmarket share has grown faster in Canada than the U.S.
GH cucumber retail market share in Canada is the highest among all categories at 61 per cent ofretail sales. In contrast, GH cucumber market share in the U.S. has increased to a modest 11 percent, indicating potential for significant growth with effective marketing.
The fresh market is about evenly split between the retail and food service markets.While GHtomatoes have made significant inroads into the fresh retail market11, the food service marketremains almost completely dominated by mature green field tomatoes.There continues to be moreopportunity for GH peppers and cucumbers in the food service markets.
The maturing North American GH tomato market may be a good indicator of how the markets forother GH products will evolve.The North American GH tomato industry may be characterized interms of three factors12:
• seasonality
• product differentiation
• rapid growth in production and decline in prices
11. Most recently, Eurofresh Farms,Arizona, is collaborating with an executive chef of the Hilton Hotels chain to feature new recipes for the use of GHvegetables and complimentary stays at the Arizona Biltmore Resort & Spa.The Packer, August 03, 2006.
12. See Cook, R. and L. Calvin. 2005. Greenhouse tomatoes change the dynamics of the North American fresh tomato industry. USDA Economic ResearchReport Number 2.April. http://www.ers.usda.gov/publications/err2/err2.pdf
20 | Update of the North American Greenhouse Vegetable Industry
Ability to provide year round supply continues to be a significant factor in accessing retailers andgrowing market share.This is one of the key strengths of the U.S. GH industry. Canadian andMexican suppliers must establish alliances to accomplish this goal.
Ability to differentiate products for the fresh tomato market is fuelling growth. Productdifferentiation consists of shape, size, colour, degree of ripeness and variety.These attributes areenhanced by capability to address consistency, food safety and pesticide-free concerns.
Mainstream GH tomatoes have become commoditized products in that competitive position is nowprimarily determined by price.This means that only the most efficient growers are likely to survive.Specialty product growers will command higher prices until competitors follow into themarketplace.
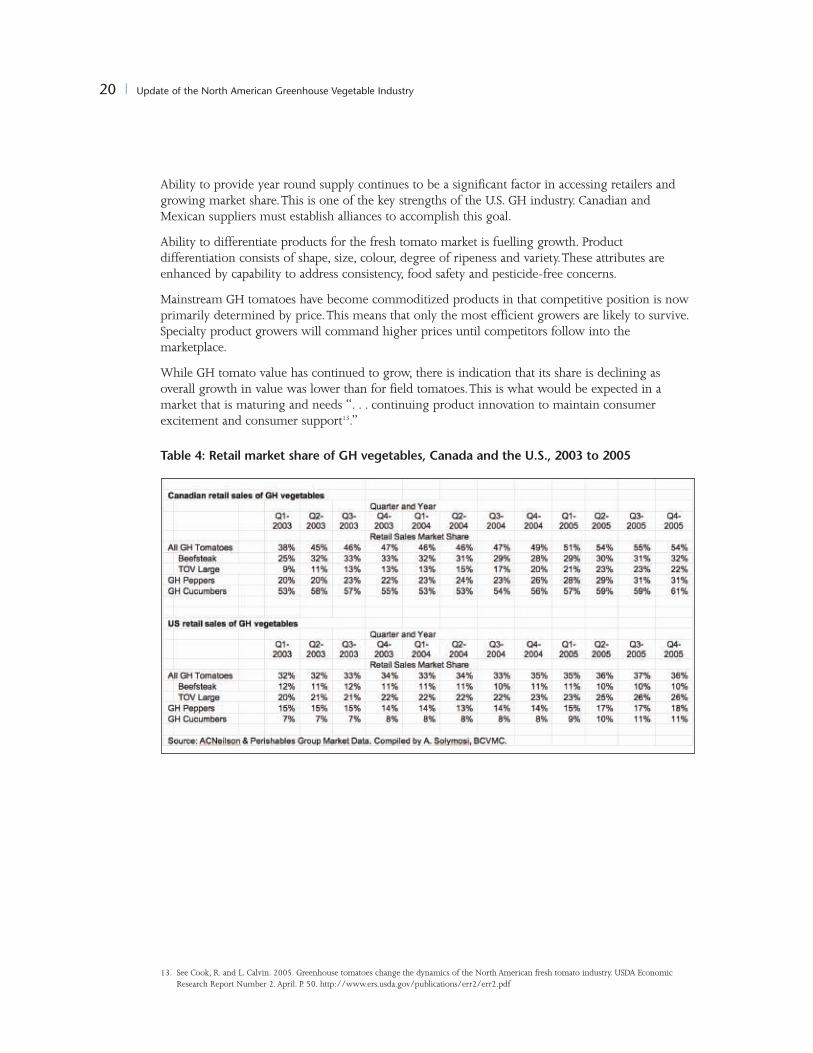
While GH tomato value has continued to grow, there is indication that its share is declining asoverall growth in value was lower than for field tomatoes.This is what would be expected in amarket that is maturing and needs “. . . continuing product innovation to maintain consumerexcitement and consumer support13.”
Table 4: Retail market share of GH vegetables, Canada and the U.S., 2003 to 2005
13. See Cook, R. and L. Calvin. 2005. Greenhouse tomatoes change the dynamics of the North American fresh tomato industry. USDA EconomicResearch Report Number 2.April. P. 50. http://www.ers.usda.gov/publications/err2/err2.pdf

Update of the North American Greenhouse Vegetable Industry | 21
3.0 Canadian GH vegetable valuesGH vegetable pricing is essentially continental, responsive to North American supply withdifferentials attributable to location and access. As such, average annual BCVMC prices are presentedbelow as proxies for price behaviour over the last six years.
In B.C., weighted average monthly FOB pricing is calculated by the BCVMC from informationsubmitted by B.C. marketing agencies. In Ontario, there are no FOB prices for domestic GHvegetables available.
In response to very low GH vegetable prices in July of 2004, the BCVMC instituted a minimumprice order for tomatoes in August 2004.The purpose was multifold: a) to protect returns togrowers, b) to prevent disruptive competition in the marketplace and c) to eliminate the chance thatproduct would be sold below its cost of production in the U.S., creating the basis for new tradeaction. In Ontario, the Ontario GreenhouseVegetable Growers (OGVG) began generating weeklybenchmark prices in mid-2005 to assist smaller growers trying to determine the value of theirproduction. However, the OGVG does not set minimum prices.
In general, it appears that Ontario grower prices have been subject to more pressure than B.C.grower prices.This observation may indicate increased competition. More aggressive marketing orsome other factor was beyond the scope of this report to investigate.
Table 5: Average monthly FOB pricing, B.C., 2000 to 2005
3.1 Canadian GH tomato value
B.C. GH beefsteak tomatoes have declined in area and marginally in price in the period. Ontariobeefsteak prices, basis ChicagoTerminal in U.S. dollars, show a similar but more pronounced declinein prices in the period. Prices in 2006 are the lowest since 2002.

22 | Update of the North American Greenhouse Vegetable Industry
Figure 22: Beefsteak GH tomato production area and FOB prices, B.C., 2000 to 2006(Source: B.C. Vegetable Marketing Commission)
Figure 23: Monthly average GH beefsteak tomato prices, FOB, B.C., 2004-2005(Source: BC Vegetable Marketing Commission)
Num
bero
fAcr
esCD
N$/k
g

Update of the North American Greenhouse Vegetable Industry | 23
Figure 24: Monthly average Ontario GH beefsteak tomato prices, Chicago Terminal, 2003 to 2006(Source: USDA Agricultural Marketing Service, Market News Service Reports)
B.C.TOV large tomatoes have retained their value as area of production has risen. Prices have risenfrom lows in 2004.
Figure 25: TOV GH tomato production area and FOB prices, B.C., 2000 to 2006(Source: B.C. Vegetable Marketing Commission)
US$
perk
gNu
mbe
rofA
cres CDN$/case
24 | Update of the North American Greenhouse Vegetable Industry
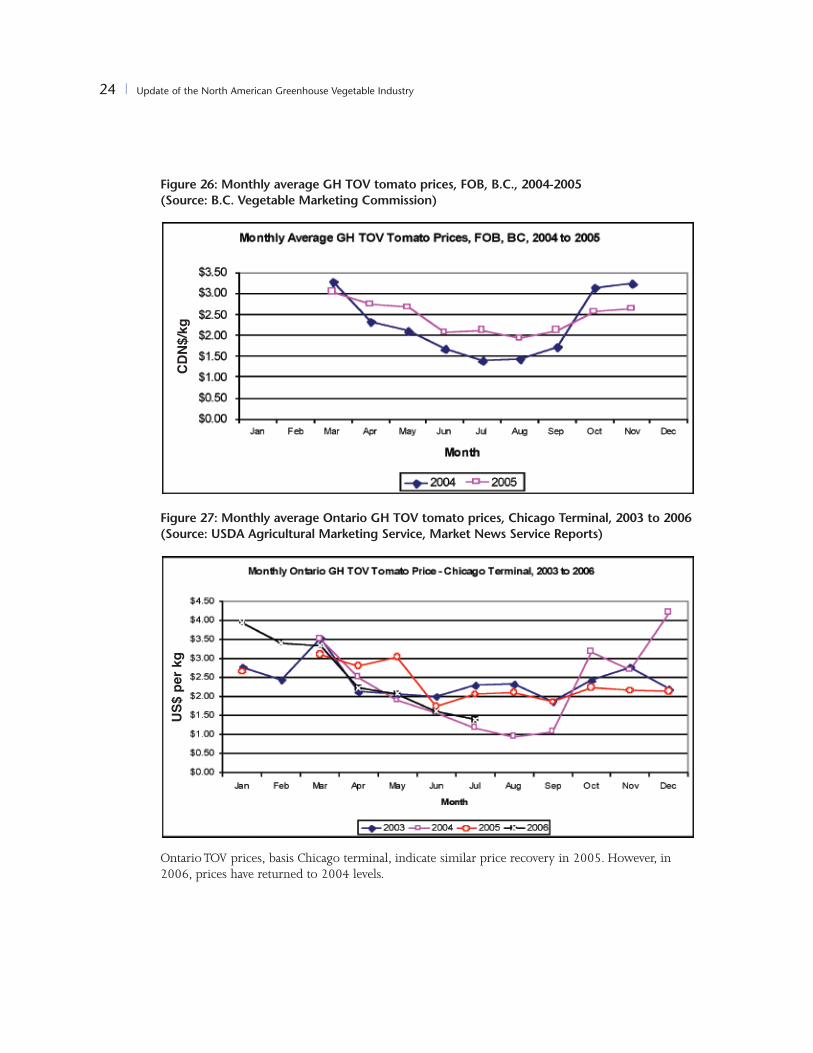
Figure 26: Monthly average GH TOV tomato prices, FOB, B.C., 2004-2005(Source: B.C. Vegetable Marketing Commission)
Figure 27: Monthly average Ontario GH TOV tomato prices, Chicago Terminal, 2003 to 2006(Source: USDA Agricultural Marketing Service, Market News Service Reports)
OntarioTOV prices, basis Chicago terminal, indicate similar price recovery in 2005. However, in2006, prices have returned to 2004 levels.
CDN$
/kg
US$
perk
g

Update of the North American Greenhouse Vegetable Industry | 25
3.2 Canadian GH bell pepper value
While B.C. GH bell peppers have undergone a significant increase in production area, average pricehas declined modestly over the period. Nevertheless, average prices in 2005 were lower in everymonth in comparison to 2004.
Ontario GH red bell peppers, basis Chicago terminal, also exhibited severe price declines from2004. In the first part of 2006, prices are much improved.
Higher priced European GH peppers are imported into Canada, particularly in the spring and earlysummer of the Canadian growing season. Lower priced Mexican imports are also targeting thewinter and spring seasons, in competition with European products.
Figure 28: GH bell pepper production area and FOB prices, B.C., 2000 to 2006(Source: B.C. Vegetable Marketing Commission)
Num
bero
fAcr
es CDN$/case

26 | Update of the North American Greenhouse Vegetable Industry
Figure 29: Monthly average GH bell pepper prices, FOB, B.C., 2004-2005(Source: B.C. Vegetable Marketing Commission)
Figure 30: Monthly average Ontario GH red bell pepper prices, Chicago Terminal, 2003 to 2006(Source: USDA Agricultural Marketing Service, Market News Service Reports)
CDN$
/kg
US$
perk
g

Update of the North American Greenhouse Vegetable Industry | 27
Figure 31: Canadian imports of GH bell peppers – average monthly customs value, 2003 toApril 2006 (Statistics Canada, International Trade Statistics)
3.3 Canadian GH cucumber value
Average monthly cucumber prices to growers have trended downwards since 2001, at the sametime as Canadian production has increased significantly. In addition, more Mexican product ispresent in Canadian markets.The price trend is also reflected in the customs value of imports.However, the volume of imported GH cucumbers is small, relative to the total Canadian market.
Figure 32: GH cucumbers production area and FOB prices, B.C., 2000-2006(Source: B.C. Vegetable Marketing Commission)
CDN$
/kg
Num
bero
fAcr
es CDN$/caseFEB
JAN
MAR
APR
MAY
JUN
JUL
AUG
SEP
OCT
NOV
DEC
FEB
JAN
MAR
APR
MAY
JUN
JUL
AUG
SEP
OCT
NOV
DEC
FEB
JAN
MAR
APR
FEB
JAN
MAR
APR
MAY
JUN
JUL
AUG
SEP
OCT
NOV
DEC
2003 2004 2005 2006

28 | Update of the North American Greenhouse Vegetable Industry
Figure 33: Monthly average Ontario GH cucumber prices, Chicago Terminal, 2003 to 2006(Source: USDA Agricultural Marketing Service, Market News Service Reports)
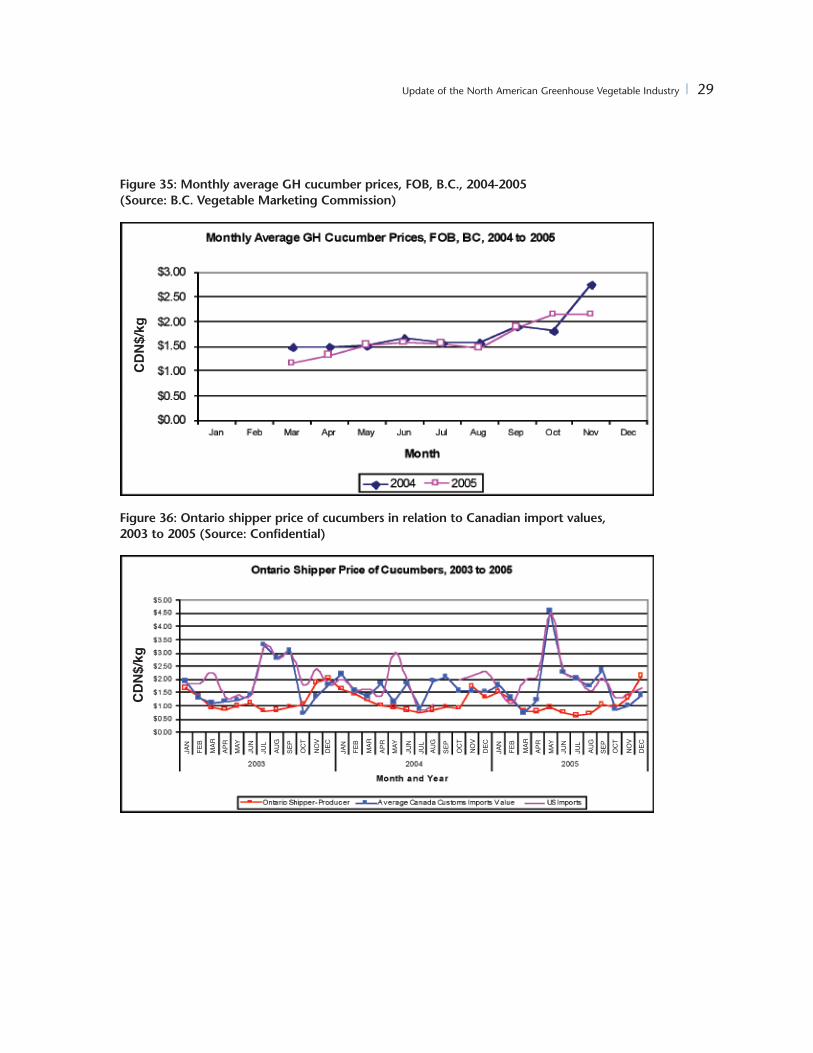
Ontario grower returns for GH cucumbers are lower in relation to Canadian imports and have beendropping throughout the period, particularly during the summer when production peaks.Thecurrent information does not explain why the Ontario grower-shipper series is so much lower thanimports, but it may be attributable to difficulty for some shippers to price their products in themarketplace. In 2006, however, Chicago terminal prices have been significantly improved overprevious years.
Figure 34: CDN imports of GH cucumbers – average monthly customs value, 2003 to April 2006(Statistics Canada, International Trade Statistics)
US$
perk
gCD
N$/k
g
FEB
JAN
MAR
APR
MAY
JUN
JUL
AUG
SEP
OCT
NOV
DEC
FEB
JAN
MAR
APR
MAY
JUN
JUL
AUG
SEP
OCT
NOV
DEC
FEB
JAN
MAR
APR
FEB
JAN
MAR
APR
MAY
JUN
JUL
AUG
SEP
OCT
NOV
DEC
Update of the North American Greenhouse Vegetable Industry | 29
Figure 35: Monthly average GH cucumber prices, FOB, B.C., 2004-2005(Source: B.C. Vegetable Marketing Commission)
Figure 36: Ontario shipper price of cucumbers in relation to Canadian import values,2003 to 2005 (Source: Confidential)
CDN$
/kg
CDN$
/kg
FEB
JAN
MAR
APR
MAY
JUN
JUL
AUG
SEP
OCT
NOV
DEC
FEB
JAN
MAR
APR
MAY
JUN
JUL
AUG
SEP
OCT
NOV
DEC
FEB
JAN
MAR
APR
MAY
JUN
JUL
AUG
SEP
OCT
NOV
DEC

30 | Update of the North American Greenhouse Vegetable Industry
Figure 37: Ontario grower shipper GH cucumber returns, 2003 to 2005(Source: Confidential)
4.0 U.S. GH vegetable valuesU.S. GH vegetable pricing has been derived from the USITC database, which contains the landedvalue of GH vegetables from various countries.There are still some problems in identifying GHproducts in the database but significant improvements have been made since 2002.
4.1 U.S. GH tomato value
In the period, GH tomato prices have shown typical seasonality with highest prices occurring in thenorthern hemisphere winter. Netherlands imports continue to command a premium in the market.
Average monthly customs value of Canadian GH tomato product has retained its level in the period.Mexican product is valued most cheaply and is discounted to Canadian production.
Canadian prices have lost most of their differential as a result of the more favourable Canadianexchange rate in relation to American currency.
CDN$
/kg

Update of the North American Greenhouse Vegetable Industry | 31
Figure 38: U.S. monthly fresh tomato imports – average customs value, 2003 to April 2006(Source: USITC Trade Database)
Figure 39: U.S. monthly fresh tomato imports – average U.S. customs value (US$) andaverage CDN export value (CDN$), 2003 to April 2006(Sources: USITC Trade Database; Statistics Canada, International Trade Statistics)
4.2 U.S. GH bell pepper value
In-season Canadian GH bell peppers values were comparable to those of the Netherlands in customsvalue. Mexican GH peppers are valued at point of entry considerably below Canadian product,especially on the April to July. Pepper values are cyclical but do not indicate erosion of pricebetween 2002 and 2005.
US$
perk
ilogr
amCD
N$/k
g US$/kgFEB
JAN
MAR
APR
MAY
JUN
JUL
AUG
SEP
OCT
NOV
DEC
FEB
JAN
MAR
APR
MAY
JUN
JUL
AUG
SEP
OCT
NOV
DEC
FEB
JAN
MAR
APR
FEB
JAN
MAR
APR
MAY
JUN
JUL
AUG
SEP
OCT
NOV
DEC
FEB
JAN
MAR
APR
MAY
JUN
JUL
AUG
SEP
OCT
NOV
DEC
FEB
JAN
MAR
APR
MAY
JUN
JUL
AUG
SEP
OCT
NOV
DEC
FEB
JAN
MAR
APR
FEB
JAN
MAR
APR
MAY
JUN
JUL
AUG
SEP
OCT
NOV
DEC

32 | Update of the North American Greenhouse Vegetable Industry
Figure 40: U.S. monthly GH bell pepper imports – average U.S. customs value, 2003 to April 2006(Source: USITC Trade Database)
4.3 U.S. GH cucumber value
Imported cucumber customs value fluctuates considerably through the year. Canadian values in thewinter are strongest, while mid-summer values are weakest. Canadian cucumbers have a clearquality advantage and command the highest prices throughout the year.
Figure 41: U.S. monthly GH cucumber imports – average U.S. customs value, 2003 to April 2006(Source: USITC Trade Database)
US$
perk
ilogr
amUS
$pe
rkilo
gram
FEB
JAN
MAR
APR
MAY
JUN
JUL
AUG
SEP
OCT
NOV
DEC
FEB
JAN
MAR
APR
MAY
JUN
JUL
AUG
SEP
OCT
NOV
DEC
FEB
JAN
MAR
APR
FEB
JAN
MAR
APR
MAY
JUN
JUL
AUG
SEP
OCT
NOV
DEC
FEB
JAN
MAR
APR
MAY
JUN
JUL
AUG
SEP
OCT
NOV
DEC
FEB
JAN
MAR
APR
MAY
JUN
JUL
AUG
SEP
OCT
NOV
DEC
FEB
JAN
MAR
APR
FEB
JAN
MAR
APR
MAY
JUN
JUL
AUG
SEP
OCT
NOV
DEC

Update of the North American Greenhouse Vegetable Industry | 33
5.0 Competitive factorsThe major change in the market over the pastthree years has been the reduction inseasonality. If not for the cost of energy,virtually all Canadian producers would beproducing year round.As it is, Canadiancucumber producers are in the market over11 months of the year and tomato productionis extending at both ends of the season.Mexico is also producing much further intothe summer as facilities come into operationthat are located in areas where it is possible toproduce into the northern hemisphereshoulder seasons. As a consequence, earlyseason and late season price premiums areshrinking and are less able to financially bailout less efficient main season operations. Netreturns to the Canadian grower have levelled
out considerably over the past three years with most growers continuing to be profitable, but someof the less efficient starting to fall by the wayside.
The biggest challenge for the industry today is increased and rising energy costs.
A bright side to the energy situation is that these rising energy costs also increase the cost oftransportation of product to retail markets. Canadian, primarily Ontario, production is much closerto the large U.S. markets than Mexico or Europe so there is some comparative cost benefit there.
5.1 Industry developments
5.1.1. British Columbia
The B.C. sector has changed significantly since 2002.Although the BCVMC continues to regulatequota transfers and quota expansion in the province, the number of agencies has grown from one(B.C. Hot House Foods Inc. [BCHHFI]) to four in 2006 (BCHHFI, Global Greenhouse Produce,Gourmet Greenhouse Foods and Country Fresh Produce).
The Farm Industry Review Board has been active in the sector in its supervisory role for variousreasons including:
• litigation associated with the administration of the Commission, including dispute over theallocation of levies charged to growers to pay for legal costs related to the anti-dumping actionof the U.S.
• claims of excessive administration charges• challenges to Commission authority• dissatisfaction with decisions relating to expansion and new crops• denial of agency status to new applicants

34 | Update of the North American Greenhouse Vegetable Industry
In September 2005, the BCVMC initiated a review of the regulatory structure of the greenhouseindustry. In May 200614, the FIRB issued a directive for the Commission to amend its general ordersby focusing on the following changes:
• lift the moratorium on new agency applications
• examine more streamlined and business-supportive processes for approving agency applications• re-classify producers currently exempt from shipping through an agency as producer-shippers• provide greater freedom for producers to move between agencies based on commercial contractobligations
• retain the authority to direct product but only use these powers in exceptional circumstances• provide that crop changes within a commodity such as tomatoes only require reporting notCommission approval
• retain the requirement to obtain Commission approval to change between commodities, such astomatoes and cucumbers, but remove time constraints and establish effective criteria toassess applications
• remove timing restrictions and change the criteria for issuing new or additional productionallocations or quota to the ability to demonstrate a business plan
• remove the requirement for agency sponsorship of crop mix changes and new production area.
By January 2007, the BCVMC must complete any additional measures that would make its operationmore market responsive.
5.1.2 Ontario
In 2003, the Ontario GreenhouseVegetable Growers commissioned a study15 to evaluate the positionof the Ontario GH vegetable sector and to make recommendations on how to improve itscompetitiveness.The study was in direct response to turmoil in the aftermath of the anti-dumpingtrade action and the rapid development of Mexico as a major presence in the continentalmarketplace.The report recommends several strategies:
• develop capacity to provide 12 month supply, through technologies, alliances or joint ventures• develop new greenhouse products• reduce rivalry between shippers• utilize the potential market power available to Ontario industry• develop a more complete industry cluster in Ontario• minimize the threat of future trade action• position Ontario product relative to Mexican production
In 2003,The Ontario Greenhouse Alliance (TOGA)16 was formed between GH vegetable, pepperand flower growers in an effort to integrate greenhouse stakeholders into a community andinternational marketplace cluster to be a world leader in greenhouse operations.The new alliancewill focus on barriers to greenhouse growth, new skills training opportunities and a best practicesprogram to monitor enhanced standards of excellence for greenhouse products.
Released in June 2006, the first major order of business has been to produce a report on theeconomic contribution of the greenhouse industry to the economy of Ontario.
14. See letter from Mr. Leroux, Chair of the BCVMC to Mr. Bullock, BC Farm Industry Review Board, May 06, 2006.
15. JRG Consulting Group. 2003. Marketing Ontario GreenhouseVegetables in the Evolving North American Market.
16. See www.theontariogreenhousealliance.com

Update of the North American Greenhouse Vegetable Industry | 35
5.1.3 Alberta
The Alberta government has engaged a consultant to explore the business opportunity for a largescale vegetable greenhouse in the province. Alberta currently has about 92 acres in GH vegetableproduction. If a large-scale greenhouse is indicated to have competitive advantages in Alberta, thereis the likelihood that investors will be encouraged to locate in the province.
5.2 Continuing changes in marketing
Forward contracting and pricing for greenhouse products continues to grow with a number ofchain stores joining Costco andWal-Mart in using this method.Although most distributors willprice this way if necessary, many prefer the old method of spot pricing, moving with the dailysupply and demand.This is also true for many of the chain stores that feel they can get price dealsbuying this way.When forward contracting and pricing are employed, the retails are looking for theabsolute top quality for the price.
5.2.1 Alliances
Strategic alliances among major shippers and distributors were developing in 2002. In 2006, manyof these alliances have continued, others have formed and others have collapsed. It is a characteristicof strategic alliances that they often outlast their usefulness or end up with one partner taking overthe other.
Various producers and handlers of greenhouse products have developed international marketingalliances with large distributors and wholesalers to improve access to consolidated retailers andsecure a 12 month supply to retain their customers.
• Hot House Growers Income Fund accounts for 35 per cent of B.C’s product volume. In June2006,Village Farms (Agro-Power Development Inc.-APDI) entered into a non-binding term sheetagreement with Hot House Growers Income (HHGI) Fund to acquire a majority interest in thefund, that will create a production and marketing unit with 10 production centres located in B.C.,Texas and Pennsylvania.The fund and APDI have also entered into a marketing agreement underwhichVillage Farms will market the greenhouse vegetables produced by HHGI followingexpiration of its 2006 arrangement with B.C. Hot House Foods Inc.Village Farms also hasexclusive marketing arrangements with greenhouse producers in Mexico, under itsVillage Farms®
and Home Choice® brand names, primarily to retail supermarkets and dedicated fresh fooddistribution companies.Village Farms distributes throughout the U.S., Canada and Mexico, andoperates five distribution centres located across the U.S.
• Global Greenhouse Produce Inc. has licensed a proprietary variety of tomato from Enza ZadenB.V., one of Holland’s largest vegetable seed producers and is marketing the product through DoleFood Company.
• In 2004, B.C. Hot House Food Inc. formed a marketing alliance with a major Nogales, Arizonagreenhouse grower-shipper, whose produce accounts for over15 per cent of BCHHFI’s business.
• Mastronardi Produce Ltd., with distribution facilities in the U.S. and joint ventures tried inMexico, Quebec operations with ventures in Mexico, to secure 12 month supply.
• Mastronardi Produce Inc. and BCHHFI have rights to produce the proprietary variety, Camparitomato.

36 | Update of the North American Greenhouse Vegetable Industry
• Silver Brands Partners and Swander PaceCapital have investments in Market Fare,Desert Glory, Nonni’s Biscuits and OrvalKent Food Co. Inc., offering fresh and frozenhand-held convenience prepared foods.
• South Alder Greenhouses, Delta, B.C. growsthe O-Sardinia cocktail tomato, O-tomato,O-pepper and O-cucumber Japanese stylemidi under certified organic protocols. In2005, they started marketing its productthrough Oppenheimer Group, aninternational food marketer. South Alder usesa proprietary organic fertilizer and microbialand nutrient enhanced soil media.Thetheory related to the O-Sardinia variety isthat reproducing the soil nutrient conditionsof Sardinia will re-create the taste of thetomato in that country. In addition,agricultural waste is processed on site and100 per cent compostable EarthcyclePackaging back the company’s claim that it isenvironmentally friendly and sustainable.
• Grupo Batiz, with 115 hectares of greenhouses in production, had a joint marketing agreementwith the failed Colorado Greenhouses in the late 1990s and is now one of the few Mexicangreenhouse producers that market its product in the U.S. through its own company,Wilson Batiz.
5.2.2 Consolidations
Retail consolidations and mega-trends continue17. Most notably:
• In January 2006, Supervalu, the third-largest food retailing company in the United States,CVS/pharmacy and an investment group led by Cerberus Capital Management announced theyhad agreed to acquire Albertsons for $17.4 billion in cash, stock and debt assumption.
• Wal-Mart is now the largest grocery chain in the U.S., with 14 percent of all grocery sales, nearlytwice the sales of Kroger. Wal-Mart sells $95 billion to Kroger's $51 billion.
• In September 2005,Wal-Mart acquired 33.3 per cent of the Central American Retail HoldingCompany (CARHCO) and in March 2006, increased its holdings to 51 per cent.Wal-Mart CentralAmerica was formed from the 375 supermarkets and other store formats, operating in fiveCentral American countries: Guatemala, El Salvador, Honduras, Nicaragua and Costa Rica.
• In 2004,Wal-Mart de Mexico reported sales of $139.8 billion pesos (U.S. $12.5 billion), a15.8 per cent increase over the previous year. Comparable stores sales registered an increase of8.7 per cent. In 2005,Wal-Mart de Mexico will open 70 units with an expected investment ofU.S. $736 million.
• As of April 2006, Costco has 473 locations: 346 in the United States and Puerto Rico, 68 inCanada, 28 in Mexico, 17 in the United Kingdom, five in South Korea, five in Japan, and fourinTaiwan.
17. Some information fromWikipedia http://en.wikipedia.org/wiki/Main_Page

Update of the North American Greenhouse Vegetable Industry | 37
• Safeway Inc., a Fortune 500 company, is North America’s third largest supermarket chain withover 1,800 stores located throughout the central and western United States and Canada. It alsooperates some stores in the mid-Atlantic region of the eastern seaboard. On April 18, 2005,Safeway began a $100 million brand re-positioning campaign labeled Ingredients for Life.This was done in an attempt to differentiate itself from its competitors and to increasebrand involvement.
5.2.3 Changing purchasing policies
In February 2006, McDonald’s decided not to purchase tomatoes from suppliers that do not paytheir growers directly, following the lead of Socially Accountable Farm Employers (SAFE), a groupin Florida.
5.3 Labour Issues
5.3.1 Mexico
Despite the size of labour market in Mexico, recruitment of workers for technological greenhousesis not easy, as the range of skills needed to carry out functions must be taught. As such, the Mexicanindustry as a whole is characterized by significant variation in production protocols andmanagement with implications for GH vegetable standards, food safety and quality. For example,Mexican greenhouse produce is routinely stopped at the U.S. border for the presence of pesticideresidues.
The demand for Mexican GH agricultural labour is generated, not only by Mexican GH operations,but also American and Canadian foreign seasonal worker programs. U.S. and Canadian minimumwage rates are enticing. For example, an unskilled Mexican can earn one year’s Mexican salary inCanada in three months.
5.3.2 U.S.
As an outcome of homeland security issues and desire to control illegal immigration, the U.S. isconsidering fencing the entire 2,000-mile U.S.-Mexico border and stationing border guards toprevent illegal entry.The impact of immigration developments on future labour supply for Americangreenhouse businesses is uncertain. About 15 per cent of Mexico’s total labour force18 works in theU.S., and Mexicans make up almost four per cent of the total U.S. labour force and about 30 percent of America’s agricultural labour force. Much of the labour requirement of American agriculturehas been based on access to immigrant labour for at least the last 50 years.
The U.S. H-2A program is a guest workerprogram that allows agricultural employers toimport foreign workers on a temporary basiswhen labour shortage can be demonstrated.This program has become more popular inrecent years as illegal immigrants, who used to
18. http://www.migrationinformation.org/USfocus/display.cfm?ID=206

38 | Update of the North American Greenhouse Vegetable Industry
work on farms, are now taking non-agricultural jobs. As a result, the supply of domestic migrantagricultural labour has been tightening up.
Most temporary agricultural workers to the U.S. now come from Mexico. In fiscal year 2005, requestswere made for over 50,000 workers under the program, of which 98 per cent were approved19.Although it is not known what portion of the temporary labour force may be used in the greenhousesector, clearly U.S. agriculture is a significant competitor for foreign agricultural workers in the NorthAmerican unskilled labour pool.
5.3.3 Canada
Provincial greenhouse associations have ongoing initiatives to maintain and develop relationships withvarious government departments and agencies to further initiatives in the secondary schools, collegesand universities to maintain a continuous supply of quality personnel for the industry. More problematichas been the recruitment of low and unskilled labourers in the sector.
Ontario
In 2005, the Ontario vegetable greenhouse operators employed almost 3,000 foreign seasonal workers,an increase of 25 per cent over 2004.The vegetable greenhouse sector accounted for about 19.4 per centof all migrant workers brought to Ontario in 2005 and 73 per cent of the operators utilize foreignseasonal labour.The minimum wage has been set at $8.30 per hour in 200620.
British Columbia
Traditionally, agricultural labourers have been obtained from recent immigrants, notably theIndo-Canadian community, but this supply has been steadily dwindling in B.C. In 2004, B.C. introducedthe Mexican Seasonal AgriculturalWorker Program (SWAP) in coordination with the Mexicangovernment and HRSDC. SAWP functions in a way similar to the Mexican component of the program inOntario except that B.C. has not established a central agency to manage the program.
The 2004 program was a pilot. In 2005, the industry attempted to establish an agency similar to ForeignAgricultural Resource Management Services (FARMS) in Ontario21, but implementation problems havebeen experienced as operators in various sectors have pursued their labour needs directly with theMexican Consulate. Demand for Mexican seasonal workers has increased rapidly in all agriculturalsectors, including vegetable greenhouse operations and there is an expectation that in due course, B.C.will have its own FARMS-type organization to administer its foreign labour needs.The absence of acentral agency structure has contributed to some disparity in living and working conditions for workers.
The B.C. agriculture industry is hopeful that an agreement will be negotiated that would allowseasonal agricultural workers into the province from places such as India and the Caribbean, asoccurs in Ontario.There is growing concern that:
• it may be unwise to source all workers from one country, such as Mexico, as it can lead to over-dependence
• the supply of the type of workers needed from Mexico is depleting• workers available elsewhere may not speak English which has human resource managementimplications that could potentially be solved by hiring multilingual managers or team leads
Alberta
Alberta is experiencing a shortage of unskilled labourers, where there is neither a supply of recentimmigrants nor an adequate population of local labour. Foreign guest workers have been recruited from
19. See the Rural Migration News. http://migration.ucdavis.edu/rmn/more.php?id=1134_0_4_0
20. http://www.farmsontario.ca/
21. The Ontario program is managed by the agricultural industry under the sanction of Human Resources and Skill Development Canada (HRSDC)by an agency called Foreign Agricultural Resource Management Services (FARMS).

Update of the North American Greenhouse Vegetable Industry | 39
various countries such as Mexico andThailand, in small numbers for farming labour, includinggreenhouses. B.C. is interested in providing recruitment and travel services to western Canadianprovinces once their program is up and running.A regional “FARMS-type” organization would beanticipated to reduce per-employee costs to growers.
5.4 Energy issues
Elevated natural gas costs have driven Canadian growers to seek lower cost energy alternatives in order tomaintain their competitiveness in the continental market. U.S. growers have expanded in the southernU.S. to take advantage of a warmer climate, more intense sunshine and less intense heat (at higherelevations). Mexican growers are expanding into higher elevation locations that have advantages in termsof more moderate heat, but with an increased need for temperature supplementation.
Alternatives to natural gas for energy include coal, wood pellets, wood waste, wind power, solar andgeothermal energy. However, the concomitant need for CO2 in vegetable greenhouses means that anothersource of CO2 must be provided, unless natural gas boilers are retained. For existing facilities this isfeasible, but for new operations, liquid CO2, CO2 generators or the adoption of technology to extractCO2 from exhaust gases is necessary.
A typical greenhouse in B.C. uses about 18,500 and 22,500 GJ22 per hectare per year for heat and CO2,depending on crop and need for CO2. Natural gas combustion for CO2 can exceed 40 per cent of totaluse in B.C. In Ontario, with a harsher climate, a typical greenhouse would be expected to use more,although poly greenhouse structures are more effective at retaining heat. A direct comparison iscomplicated since the yield and length of growing season need to be taken into account to determine auseful energy cost parameter, such as energy cost per kilogram.
5.4.1 Coal pricing
The price of thermal coal is set at the world market. After a long decline in prices, the prices have beenincreasing rapidly since 2003.This increase is mainly due to the high demand in Asia.The Japan-Australia Thermal Coal prices reflect the increase.
Figure 42: Japan – Australia contract thermal coal price trends
22. A gigajoule of natural gas is about 25.5 cubic metres at standard conditions. One gigajoule of natural gas is equal to 27 litres of fuel oil, 39 litresof propane and 26 litres of gasoline or 277 kilowatt hours of electricity.
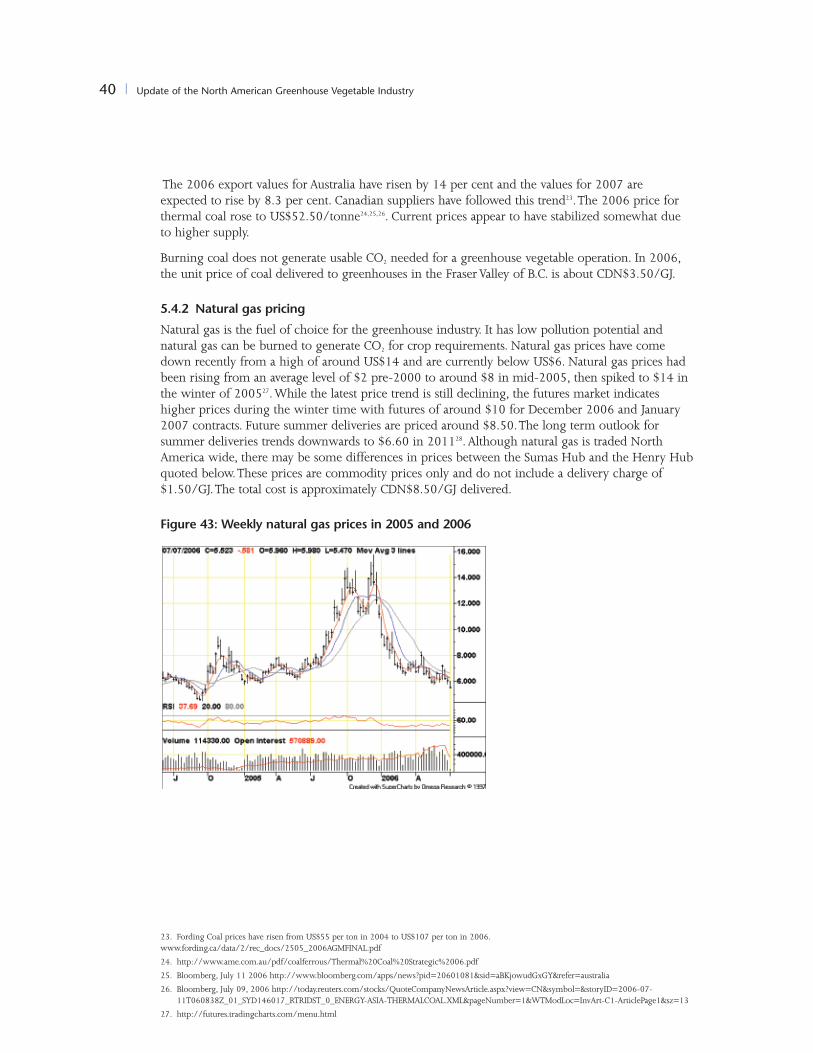
40 | Update of the North American Greenhouse Vegetable Industry
The 2006 export values for Australia have risen by 14 per cent and the values for 2007 areexpected to rise by 8.3 per cent. Canadian suppliers have followed this trend23.The 2006 price forthermal coal rose to US$52.50/tonne24,25,26. Current prices appear to have stabilized somewhat dueto higher supply.
Burning coal does not generate usable CO2 needed for a greenhouse vegetable operation. In 2006,the unit price of coal delivered to greenhouses in the FraserValley of B.C. is about CDN$3.50/GJ.
5.4.2 Natural gas pricing
Natural gas is the fuel of choice for the greenhouse industry. It has low pollution potential andnatural gas can be burned to generate CO2 for crop requirements. Natural gas prices have comedown recently from a high of around US$14 and are currently below US$6. Natural gas prices hadbeen rising from an average level of $2 pre-2000 to around $8 in mid-2005, then spiked to $14 inthe winter of 200527.While the latest price trend is still declining, the futures market indicateshigher prices during the winter time with futures of around $10 for December 2006 and January2007 contracts. Future summer deliveries are priced around $8.50.The long term outlook forsummer deliveries trends downwards to $6.60 in 201128. Although natural gas is traded NorthAmerica wide, there may be some differences in prices between the Sumas Hub and the Henry Hubquoted below.These prices are commodity prices only and do not include a delivery charge of$1.50/GJ.The total cost is approximately CDN$8.50/GJ delivered.
Figure 43: Weekly natural gas prices in 2005 and 2006
23. Fording Coal prices have risen from US$55 per ton in 2004 to US$107 per ton in 2006.www.fording.ca/data/2/rec_docs/2505_2006AGMFINAL.pdf
24. http://www.ame.com.au/pdf/coalferrous/Thermal%20Coal%20Strategic%2006.pdf
25. Bloomberg, July 11 2006 http://www.bloomberg.com/apps/news?pid=20601081&sid=aBKjowudGxGY&refer=australia
26. Bloomberg, July 09, 2006 http://today.reuters.com/stocks/QuoteCompanyNewsArticle.aspx?view=CN&symbol=&storyID=2006-07-11T060838Z_01_SYD146017_RTRIDST_0_ENERGY-ASIA-THERMALCOAL.XML&pageNumber=1&WTModLoc=InvArt-C1-ArticlePage1&sz=13
27. http://futures.tradingcharts.com/menu.html

Update of the North American Greenhouse Vegetable Industry | 41
Figure 44: Monthly natural gas prices, 1998-2005
5.4.3 Wood pellets pricing
Wood pellets can be used to heat greenhouses. However, burning wood pellets does not presentlygenerate CO2 for use in greenhouses and this is a critical consideration if a new facility is beingconstructed. In 2006, a test will be conducted in B.C. to test whether the recovery of CO2 fromwood pellets flue gases is feasible. Flue gases of both fuels contain CO2, but wood pellet flue gasalso contains other harmful gases.
Wood pellets are derived from waste wood in the form of fine sawdust and shaving from mills.As B.C. has an increased harvesting program for pine beetle infected wood, there will be a largesupply of raw materials lasting for at least 15 years, if not longer. Several saw mills dedicated toprocessing pine beetle wood have been constructed in the two years29.
The supply of wood pellets is market driven.With an improvement in prices and an ample supply,the investment climate is positive to allow construction of new pellet mills. It is expected that newpellet mills will be operational in early 2007.The main market for wood pellets is in Europe, withan apparent deficit of one million tonnes of pellets.The eastern seaboard of the U.S. also appears tohave a deficit of 250,000 tonnes. Prices FOBVancouver are $140/tonne and prices in Rotterdam are$180-$200/tonne over the last two years.
Currently approximately 15,000 tonnes of wood pellets are sold to greenhouses in B.C.Virtually nosales take place in Alberta or Ontario.The delivered price in B.C. is the equivalent of $7.50/GJ, thedelivered price in Alberta is $7/GJ and in Ontario, $8.50/GJ.
5.4.4 Wood waste pricing
Wood waste, consisting of hogged bark and hogged white wood, is currently used as a fuel in thegreenhouse industry in B.C.Wood waste has a low caloric value compared to coal and wood pellets,due to its moisture content.The use of wood waste as a fuel requires sophisticated burningtechnology and a large wood waste storage facility.
29. John Swaan,Wood Pellet Association of Canada, July, 2006.

42 | Update of the North American Greenhouse Vegetable Industry
Only limited quantities of fuel quality wood waste or hog fuel, is available in the Lower Mainlandand Alberta. In the agricultural areas, good quality wood waste is used in the horse sector calledshavings, the berry sector and greenhouses as growing medium such as sawdust and the pulp andpaper industry which uses chips. Cedar hog fuel and log yard debris is still available30.
Low quality wood waste is provided within the Lower Mainland for trucking costs, the equivalentof $20 per unit (200 cubic feet), likely on the basis of a two-hour round trip. Better qualitymaterials are sold for $30–$40 per unit. It is expected that the prices will increase by 10 per centthis year due to low availability, high transportation costs and high demand for fuel.
Ample supply of wood waste may be available in Northern B.C. and Northern Alberta. Conversionof power boilers to biofuels in many parts of B.C. has put a strain on the wood waste supply.
The closure of many sawmills in Northern Ontario during the last five years has greatly diminishedthe supply of wood waste in the area. Currently, demand for biofuels of all kinds outstrips thesupply31. Other opportunities are being developed which will attract wood waste, such as theethanol plants near Hearst, Ontario32, competing with the use of wood waste as boiler fuel.
5.4.5 Alternative energy programs
Ontario recently created a new alternative energy policy offering incentives to permit independentsto produce green energy33.This is the first jurisdiction in Canada to allow the sale of alternativepower to the grid, from wind, photovoltaic, biomass and small run-of-the-river hydro.Thefollowing conditions apply:
• Ontario’s Standard Offer program will offer $0.11/kWh (kilowatt-hour) to producers of wind,biomass and small hydro energy.
• It will offer $0.42/kWh for solar photovoltaic energy.• The term of the contracts will be 20 years, and there will be an inflation adjustment.
The residential retail price for electricity in Ontario is under $0.06/kWh.
There is no limit to the number of projects that may apply for a contract, but the size of eachproject is capped at 10 MW.The contracts are available to anyone, including homeowners,businesses and commercial energy producers.The electricity produced would be fed into theelectricity grid.The contracts are expected to be available by June 2006.
This would allow Ontario greenhouse operators to install biomass boilers as co-gen facilities,generating electricity for the grid while using all waste heat in the greenhouse as a source of heat.It would also allow the installation of natural gas fired CHP units.
B.C. allows sale of power to the grid in minimum quantities of one MW. Such sales must competeon a tender and will be allowed for the lowest price. Power sales to the B.C. grid are approximately$0.065/kWh.The 2006 call for projects yielded 53 different projects, the majority beinghydro-based, four biomass projects based on wood waste, and three wind power with a total of1,600 MW capacity.
Alberta buys electricity from independent power producers. In 2007, approximately 4,000 MWwill come on stream.The 2005 pool price was $0.054/kWh.
30. Bill Boesterd, DenbowTransport Chilliwack. July 2006.
31. Ross, Ian; 2006.Wood waste technology way ahead of supply http://www.nob.on.ca/industry/forestry/06-06-tech.asp
32. Clutchy, C. January 2006. U.S. Firm to build ethanol plant near Hearst –The Chronicle Journal,Thunder Bay.
33. http://66.244.236.251/cgi-bin/cj/exec/view.pl?archive=5&num=3317
34. http://www.renewableenergyaccess.com/rea/news/story?id=44408
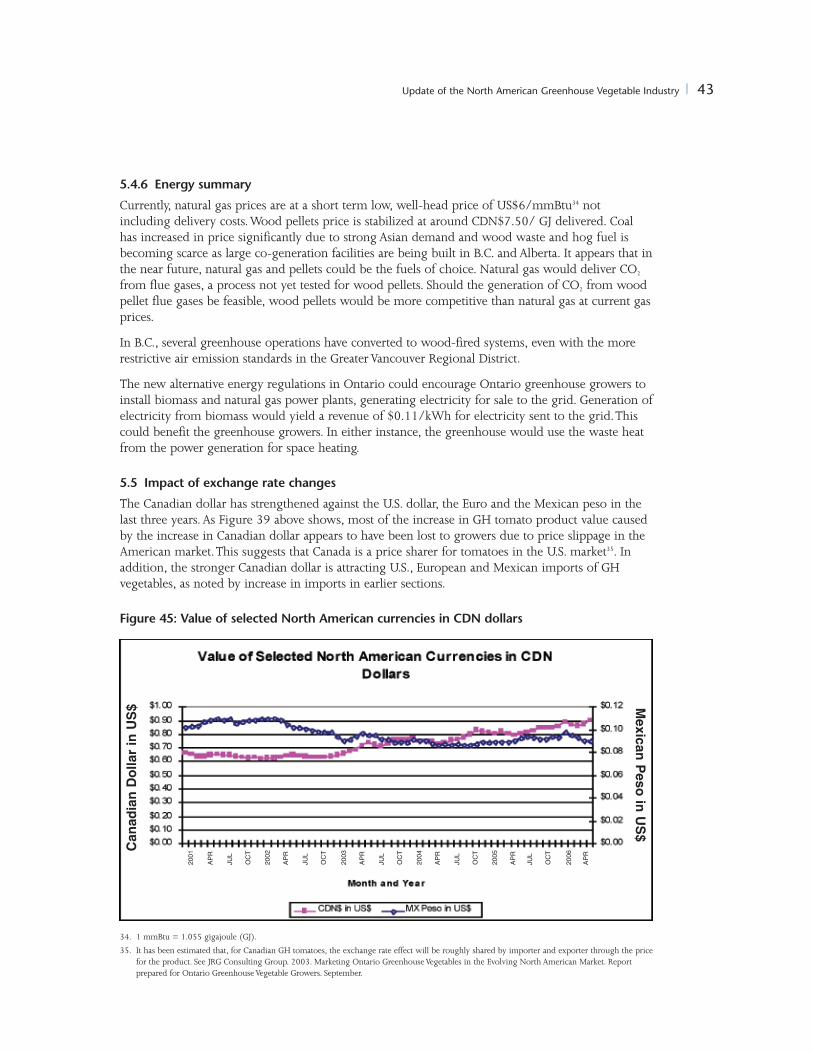
Update of the North American Greenhouse Vegetable Industry | 43
5.4.6 Energy summary
Currently, natural gas prices are at a short term low, well-head price of US$6/mmBtu34 notincluding delivery costs.Wood pellets price is stabilized at around CDN$7.50/ GJ delivered. Coalhas increased in price significantly due to strong Asian demand and wood waste and hog fuel isbecoming scarce as large co-generation facilities are being built in B.C. and Alberta. It appears that inthe near future, natural gas and pellets could be the fuels of choice. Natural gas would deliver CO2
from flue gases, a process not yet tested for wood pellets. Should the generation of CO2 from woodpellet flue gases be feasible, wood pellets would be more competitive than natural gas at current gasprices.
In B.C., several greenhouse operations have converted to wood-fired systems, even with the morerestrictive air emission standards in the GreaterVancouver Regional District.
The new alternative energy regulations in Ontario could encourage Ontario greenhouse growers toinstall biomass and natural gas power plants, generating electricity for sale to the grid. Generation ofelectricity from biomass would yield a revenue of $0.11/kWh for electricity sent to the grid.Thiscould benefit the greenhouse growers. In either instance, the greenhouse would use the waste heatfrom the power generation for space heating.
5.5 Impact of exchange rate changes
The Canadian dollar has strengthened against the U.S. dollar, the Euro and the Mexican peso in thelast three years. As Figure 39 above shows, most of the increase in GH tomato product value causedby the increase in Canadian dollar appears to have been lost to growers due to price slippage in theAmerican market.This suggests that Canada is a price sharer for tomatoes in the U.S. market35. Inaddition, the stronger Canadian dollar is attracting U.S., European and Mexican imports of GHvegetables, as noted by increase in imports in earlier sections.
Figure 45: Value of selected North American currencies in CDN dollars
34. 1 mmBtu = 1.055 gigajoule (GJ).
35. It has been estimated that, for Canadian GH tomatoes, the exchange rate effect will be roughly shared by importer and exporter through the pricefor the product. See JRG Consulting Group. 2003. Marketing Ontario GreenhouseVegetables in the Evolving North American Market. Reportprepared for Ontario GreenhouseVegetable Growers. September.
Cana
dian
Dolla
rin
US$ M
exicanPeso
inUS$
APR
2001
JUL
OCT
APR
2002
JUL
OCT
APR
2003
JUL
OCT
APR
2004
JUL
OCT
APR
2005
JUL
OCT
APR
2006

44 | Update of the North American Greenhouse Vegetable Industry
In the longer term, a stronger Canadian dollar will make inputs sourced from Canada cheaper toCanadian producers.This will include energy where, even with continental pricing policy, deliveredcosts to growers will be less in Canada than elsewhere in North America. Greenhouse inputssourced outside of Canada would be less expensive.
A stronger Canadian dollar could also lead to lucrative labour rates for foreign workers working inCanada under seasonal agricultural worker programs, as their wages are pegged in relation to whatdomestic labour in similar jobs earns.This situation could be problematic if Canadian GH productsin the U.S. market face extreme price pressure from competitors before structural changes in theNorth American industry occur. Recent commentary notes that there is the likelihood of a majorshakeout in the Mexican GH vegetable sector as it has been growing with a highly dubious rateof financial return36.
Figure 46: Value of the Euro and U.S. dollar in CDN dollars
5.6 GH crop yields and quality
Canadian GH crops have continued to improve in yield. Over the last eight to 10 years inOntario, tomato yields are reported to have increased 120-150 per cent and cucumber yieldsby 80-100 per cent37.
While Mexican yields are improving, productivity is below Canadian levels and since mid-leveltechnology predominates, quality and consistency of product are generally lower38. In addition,pesticide use is more widespread in Mexico with implications for perceived food safety.
36. Steta, M. 2004. Steta, M. 2004. Perspectivas de la produccion de hortalizas de invernadero en Mexico. IV Foro de Expectativas del SectorAgroalimentario y Pesquero.April http://www.siap.sagarpa.gob.mx/ForoIV/panel4/MarioSteta.pdf
37. Papadopoulos, Dr. A. 2005. Highlights of current production practices in Ontario: greenhouse tomatoes. Paper presented to the New EnglandVegetable and Berry Growers and Massachusetts Fruit Growers Association 14th conference andTrade Show. Manchester, New Hampshire, USA.Dec 13- 15.
38. Cook, R. and L. Calvin. 2005. Greenhouse tomatoes change the dynamics of the North American fresh tomato industry. USDA Economic ResearchReport Number 2.April. Cook, R. and L. Calvin. 2005. Greenhouse tomatoes change the dynamics of the North American fresh tomato industry.USDA Economic Research Report Number 2.April. http://www.ers.usda.gov/publications/err2/err2.pdf
Cana
dian
$
APR
2001
JUL
OCT
APR
2002
JUL
OCT
APR
2003
JUL
OCT
APR
2004
JUL
OCT
APR
2005
JUL
OCT
APR
2006

Update of the North American Greenhouse Vegetable Industry | 45
Prepared for:
Farm Credit Canada1800 Hamilton StreetP.O. Box 4320Regina, SK S4P 4L3Phone: 1-888-332-3301E-mail: [email protected]
Prepared by:
Disclaimer
This study is for educational and general reference purposes only.The information contained in thisreport is solely the opinion of the research partners. FCC and its research partners assume noresponsibility for any actions or decisions taken by any reader of this report based on theinformation provided. It is not intended to be used as a substitute for specific professional advice.
The North AmericanGreenhouseVegetableIndustry
The FCC value proposition – what you can expect from us
FCC proudly serves Canadian agriculture as the leading provider of financing to the industry since 1959.
We focus on the primary producer as well as suppliers and processors along the agricultural valuechain.We provide our customers with flexible competitively priced financing, equity, insurance,management software, information and learning.
These services help our customers make sound business decisions and experience greater success.
We take time to get to know our customers, their individual needs, goals and vision for the future.We work with them through challenges and help them pursue opportunities.
We’re easy to do business with.
Agriculture.We know it.We love it.We’re in it for the long run.

46 | Update of the North American Greenhouse Vegetable Industry
Notes

Update of the North American Greenhouse Vegetable Industry | 47
Notes

48 | Update of the North American Greenhouse Vegetable Industry
Notes

Update of the North American Greenhouse Vegetable Industry | 49
Notes

08-067-013-18E02/04/08
AS
1-888-332-3301 www.fcc.ca
Cette publication est aussi offerte en français.


![Greenhouse Gas Emissions and Emissions Trading in North … · 2020. 2. 23. · 2002] Stephenson-Greenhouse Gas Emissions, Kyoto and U.S. Response 45 greenhouse gas molecules. This](https://static.fdocuments.in/doc/165x107/60facf56e286b02f9b10de99/greenhouse-gas-emissions-and-emissions-trading-in-north-2020-2-23-2002-stephenson-greenhouse.jpg)


