
Then/Now You recognized arithmetic sequences and related them to linear functions. (Lesson 3–5)...
16
You recognized arithmetic sequences and related them to linear functions. (Lesson 3–5) • Write an equation for a proportional relationship. • Write a relationship for a nonproportional relationship.
-
Upload
anastasia-bell -
Category
Documents
-
view
223 -
download
0
Transcript of Then/Now You recognized arithmetic sequences and related them to linear functions. (Lesson 3–5)...

You recognized arithmetic sequences and related them to linear functions. (Lesson 3–5)
• Write an equation for a proportional relationship.
• Write a relationship for a nonproportional relationship.
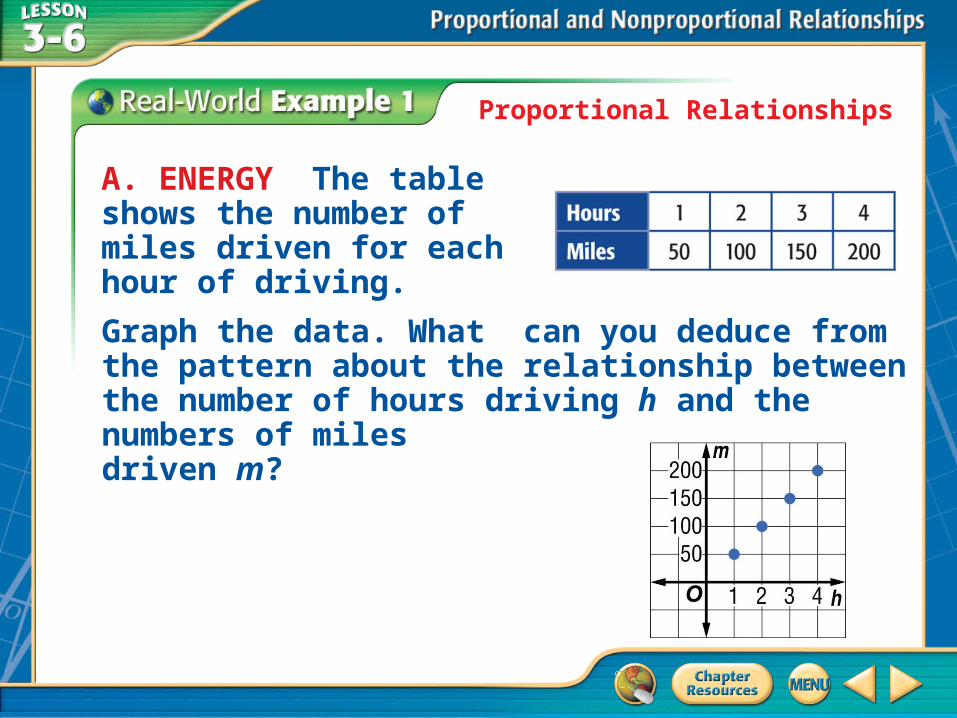
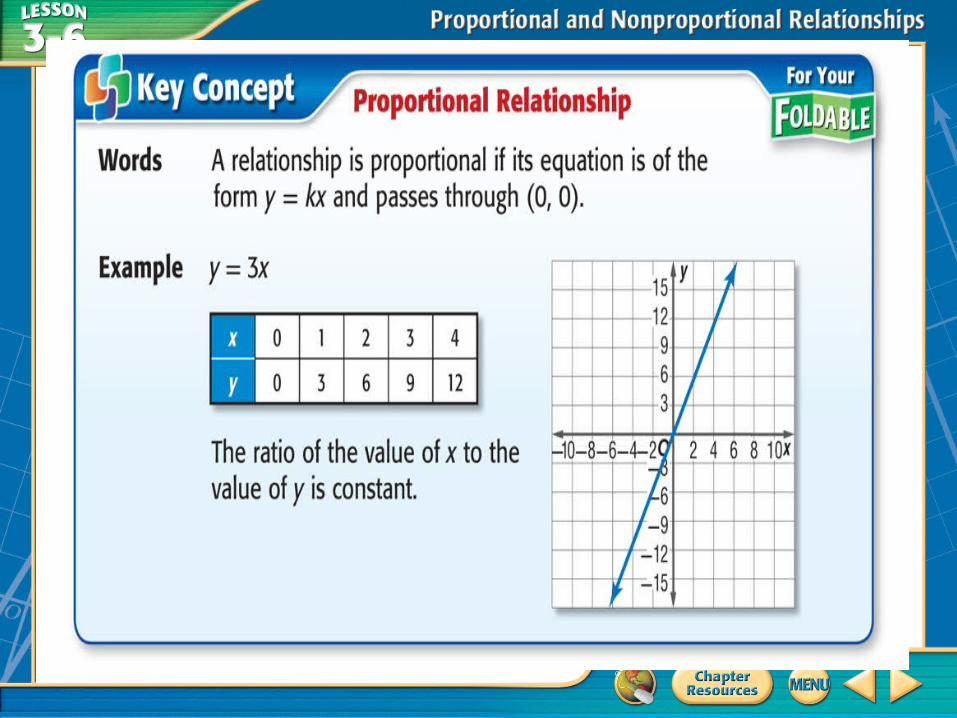
Proportional Relationships
Graph the data. What can you deduce from the pattern about the relationship between the number of hours driving h and the numbers of miles driven m?
A. ENERGY The table shows the number of miles driven for each hour of driving.

Proportional Relationships
Look at the relationship between the domain and the range to find a pattern that can be described as an equation.
B. Write an equation to describe this relationship.
Proportional Relationships
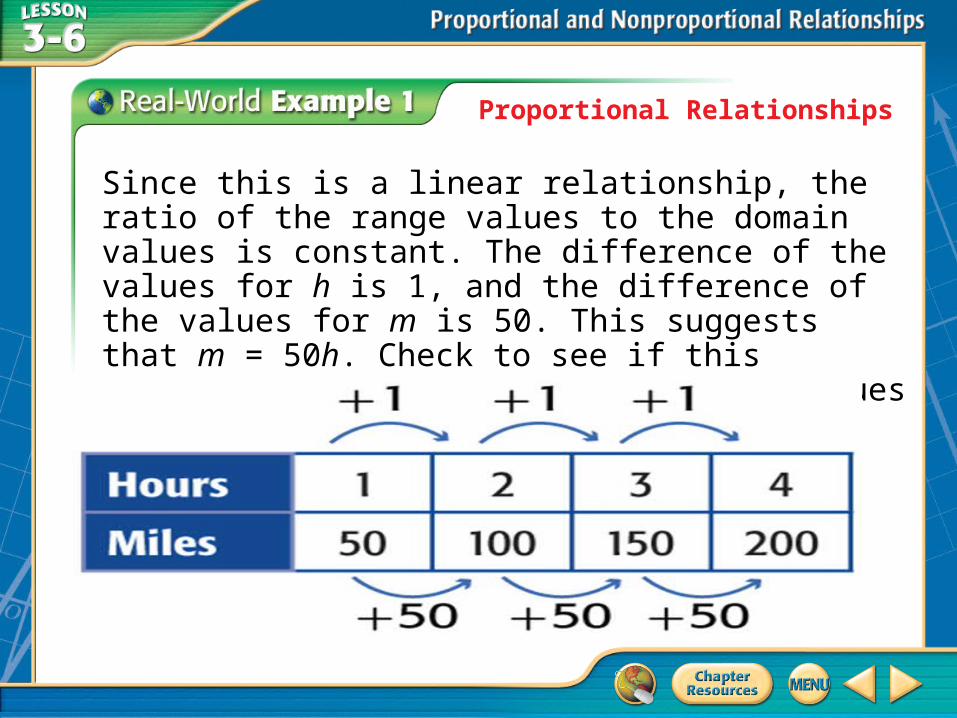
Since this is a linear relationship, the ratio of the range values to the domain values is constant. The difference of the values for h is 1, and the difference of the values for m is 50. This suggests that m = 50h. Check to see if this equation is correct by substituting values of h into the equation.
Proportional Relationships
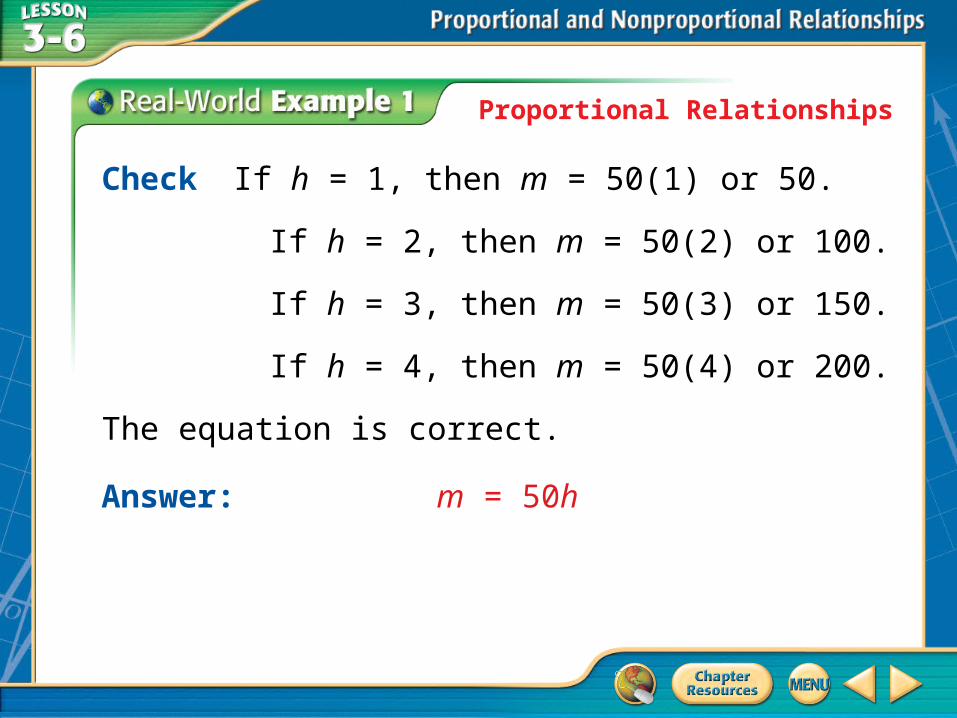
Check If h = 1, then m = 50(1) or 50.
If h = 2, then m = 50(2) or 100.
If h = 3, then m = 50(3) or 150.
If h = 4, then m = 50(4) or 200.
The equation is correct.
Answer: m = 50h

Proportional Relationships
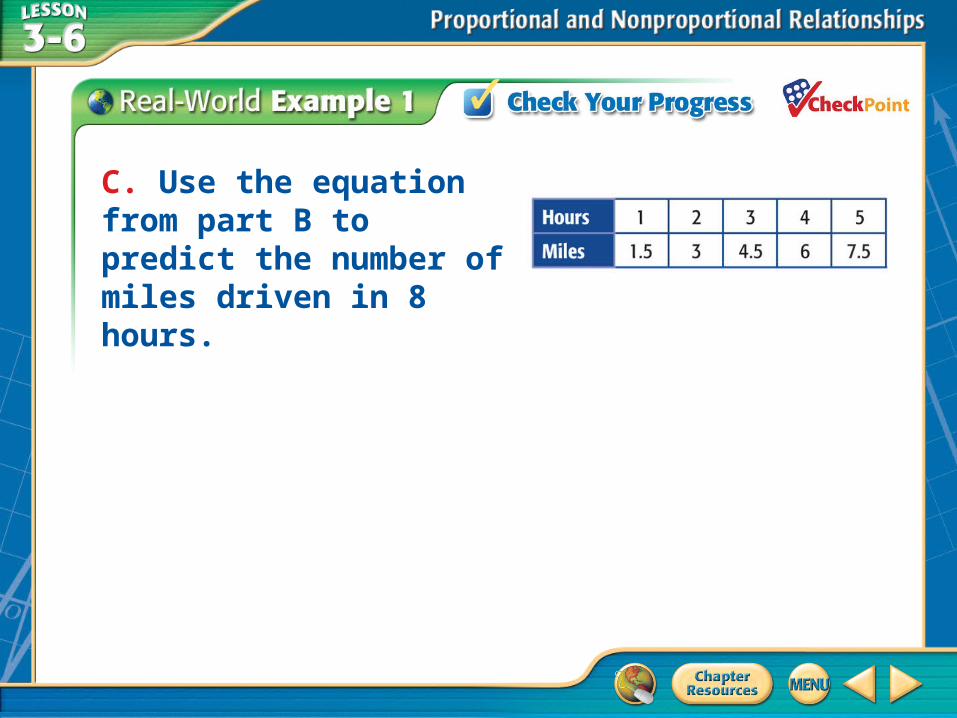
C. Use this equation to predict the number of miles driven in 8 hours of driving.
m = 50h Original equation
m = 50(8) Replace h with 8.
m = 400 Simplify.
Answer: 400 miles

A. A
B. B
C. C
D. D
A. Graph the data in the table. What conclusion can you make about the relationship between the number of miles walked and the time spent walking?
A. A
B. B
C. C
D. D
C. Use the equation from part B to predict the number of miles driven in 8 hours.

Nonproportional Relationships
Write an equation in function notation for the graph.

Nonproportional Relationships
Solve Select points from the graph and place them in a table
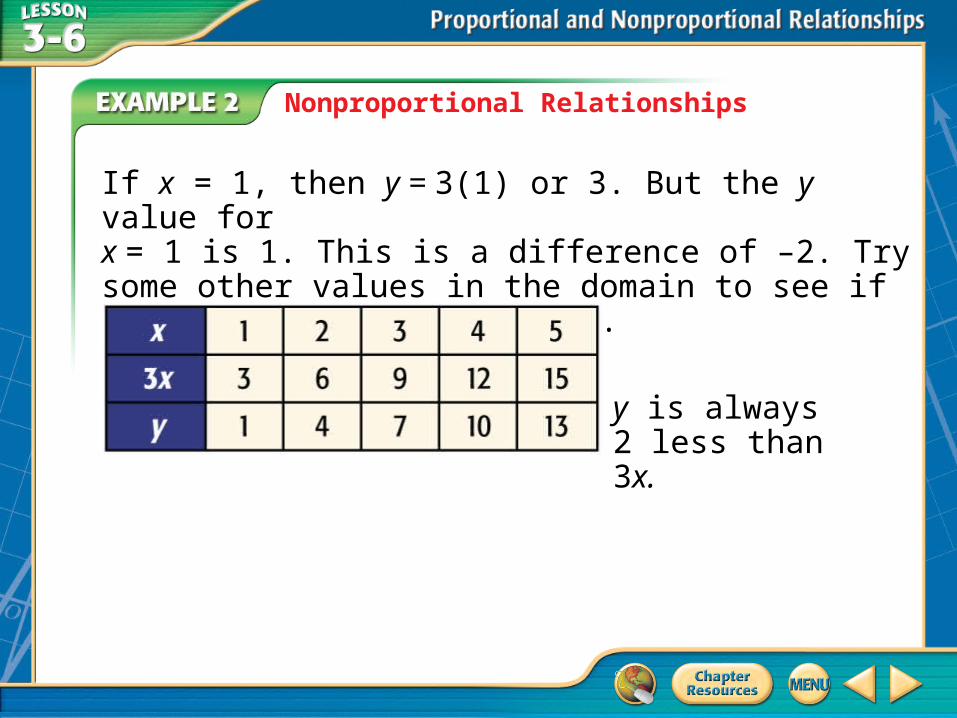
The difference in the x values is 1, and the difference in the y values is 3. The difference in y values is three times the difference of the x values. This suggests that y = 3x. Check this equation.
Nonproportional Relationships
If x = 1, then y = 3(1) or 3. But the y value forx = 1 is 1. This is a difference of –2. Try some other values in the domain to see if the same difference occurs.
y is always 2 less than 3x.

Nonproportional Relationships
This pattern suggests that 2 should be subtracted from one side of the equation in order to correctly describe the relation. Check y = 3x – 2.
If x = 2, then y = 3(2) – 2 or 4.
If x = 3, then y = 3(3) – 2 or 7.
Answer: y = 3x – 2 correctly describes this relation. Since the relation is also a function, we can write the equation in function notation as f(x) = 3x – 2.
Check Compare the ordered pairs from the table to the graph. The points correspond.

A. A
B. B
C. C
D. D
Write an equation in function notation for the relation that is graphed.


![SYSTEMS PROGRAMMING LABORATORY … PROGRAMMING LABORATORY [10MCA36] ... Write a LEX program to recognize a valid arithmetic ... The LEX program to recognize valid arithmetic expression](https://static.fdocuments.in/doc/165x107/5aa911f97f8b9a86188c4e41/systems-programming-laboratory-programming-laboratory-10mca36-write-a.jpg)