Theme park experience: Factors explaining amount of ...
30
University of Central Florida University of Central Florida STARS STARS Faculty Scholarship and Creative Works 2019 Theme park experience: Factors explaining amount of pleasure Theme park experience: Factors explaining amount of pleasure from a theme park visit, time allocation for theme park activities, from a theme park visit, time allocation for theme park activities, perceived value, queuing quality, satisfaction, and loyalty perceived value, queuing quality, satisfaction, and loyalty Maksim Godovykh University of Central Florida, [email protected] Ady Milman University of Central Florida Alsi D.A. Tasci University of Central Florida Part of the Other Social and Behavioral Sciences Commons Find similar works at: https://stars.library.ucf.edu/ucfscholar University of Central Florida Libraries http://library.ucf.edu This Paper is brought to you for free and open access by STARS. It has been accepted for inclusion in Faculty Scholarship and Creative Works by an authorized administrator of STARS. For more information, please contact [email protected]. Original Citation Original Citation Godovykh, M., Milman, A., & Tasci, A. D. A. (2019). Theme park experience: Factors explaining amount of pleasure from a visit, time allocation for activities, perceived value, queuing quality, satisfaction, and loyalty. Journal of Tourism and Leisure Studies, 4(2), 1-21.
Transcript of Theme park experience: Factors explaining amount of ...

University of Central Florida University of Central Florida
STARS STARS
Faculty Scholarship and Creative Works
2019
Theme park experience: Factors explaining amount of pleasure Theme park experience: Factors explaining amount of pleasure
from a theme park visit, time allocation for theme park activities, from a theme park visit, time allocation for theme park activities,
perceived value, queuing quality, satisfaction, and loyalty perceived value, queuing quality, satisfaction, and loyalty
Maksim Godovykh University of Central Florida, [email protected]
Ady Milman University of Central Florida
Alsi D.A. Tasci University of Central Florida
Part of the Other Social and Behavioral Sciences Commons
Find similar works at: https://stars.library.ucf.edu/ucfscholar
University of Central Florida Libraries http://library.ucf.edu
This Paper is brought to you for free and open access by STARS. It has been accepted for inclusion in Faculty
Scholarship and Creative Works by an authorized administrator of STARS. For more information, please contact
Original Citation Original Citation Godovykh, M., Milman, A., & Tasci, A. D. A. (2019). Theme park experience: Factors explaining amount of pleasure from a visit, time allocation for activities, perceived value, queuing quality, satisfaction, and loyalty. Journal of Tourism and Leisure Studies, 4(2), 1-21.
1
Factors explaining amount of pleasure from a theme park visit, time allocation for
theme park activities, perceived value, queuing quality, satisfaction, and loyalty
Abstract
A considerable amount of literature describes concepts that predict theme park visitor
behavior. Although previous studies made an effort to measure the impact of several
variables on theme park visitors’ loyalty, there is a lack of empirical attention on the
impact of some consumption variables such as previous experience, perceived
queuing quality, waiting time, using of virtual queuing, and the role of anticipating
and remembering the visit. The current study introduces several new experience
concepts that were not previously discussed in the literature: the amount of pleasure
from anticipation, visiting, and remembering the experience, and time allocation for
waiting in lines, amusement activities, and food consumption. Factors that explain
these variables, as well as factors that explain perceived value, queuing quality,
satisfaction, and loyalty were investigated through survey data from a cross-sectional
study. The results demonstrate that previous theme park experience has significant
influence on customer loyalty, and explains the amount of pleasure visitors receive
from anticipation, remembering, and the actual visiting experience. Another important
finding is related to the role of virtual queuing, which has relationships with perceived
value, perceived waiting time, perceived queuing quality, satisfaction, loyalty, as well
as the amount of pleasure from anticipation, visiting, and remembering the theme park
visit. Theoretical and managerial implications and future research directions are
discussed.
Keywords: Theme Parks, Satisfaction, Loyalty, Virtual Queuing
To cite this article:
Godovykh, M., Milman, A., & Tasci, A. D. A. (2019). Theme park experience: Factors
explaining amount of pleasure from a visit, time allocation for activities, perceived value,
queuing quality, satisfaction, and loyalty. Journal of Tourism and Leisure Studies, 4(2), 1-21.
2
Introduction
Theme parks are multi-dimensional landscapes of popular culture that provide a space of
objects, images, and ideas, both real and imaginary (Browne & Browne, 2000; King, 2002).
These contemporary entertainment attractions attempt to create a fantasy-atmosphere of
another place and time, concentrate on a dominant theme with likely sub-themes, and have
closed geographical boundaries with admission price at the gate. Theming is typically
reflected in architecture, landscaping, costumed personnel, rides, shows, food services,
merchandising, and any other guest experiences (Milman, 2009). The theme is mainly
communicated through visual and vocal statements, but also through other senses and other
experiential consumption variables (Milman, 2009). These symbolic landscapes of cultural
narratives typically feature follow-ups on stories, books, plays, films, and other intellectual
property in which the guests immerse themselves (King, 2002).
In the past several decades, the global theme park industry has grown considerably. In 2018,
attendance at top themed attraction operators like Walt Disney Attractions, Merlin
Entertainment Group and Universal Parks and Resorts have exceeded half a billion visitors
for the first time, equivalent to almost 7% of the world population (Rubin, 2019). While these
major operators experienced 5.4% overall growth in 2018, the increase in attendance was
mainly led by theme park operators in China like OCT Park China, Chimelong Group and
Fantawild, where attendance increased by 15.1%, 9.6%, and 9.3%, respectively (Rubin,
2019). Attendance at the top 20 North American theme parks increased in 2018 by 4%, a
substantial increase for this market, representing growth of 6.1 million visits (Rubin, 2019).
According to Technavio (2018), the industry is expected to grow at a compound annual
growth rate (CAGR) of over 8% during the 2017-2022 period, from $53.12 billion in 2017 to
$79 billion by 2022. Projections also suggest that sustained growth would be due to the rise
in urban population, growth in GDP-per-capita, the rise in the middle-class population, and
the increase in international tourism expenditure (Rubin, 2016).
With the current continued development, well-known theme park brands have become
destinations that feature hotels, campgrounds, entertainment zones, convention centers,
restaurants, and retail establishments (Rubin, 2018, 2019). This trend is accelerating
worldwide as many theme parks are now facing competition with other entertainment
businesses, and therefore integrate their experience offerings with harmonizing leisure and
hospitality sectors to increase their market share and generate auxiliary economic impacts
(Clavé, 2007, Milman et al., 2012). The new integrated business encourages visitors to
3
remain in the operator’s territory and experience other facilities that are linked to the theme
park’s brand (Rubin, 2016).
The global theme park industry has become a staple of consumers’ leisure activities reflected
by its continuous growth, even in mature markets. Theme park experiences occupy a “sweet
spot” among consumers as they incorporate elements of the various realms of consumer
experience (Pine and Gilmore, 2011). These entertainment complexes have become a
playground for consumers’ leisure activities and visitation numbers are expected to grow as
the global industry continues to offer a high-quality core product that generates positive
emotions, coupled with the esthetic physical environment (Torres et al., 2018). The theme
park playground not only offers experiences for passive patrons who are expected to be
entertained, but also provides opportunities for human interactions to complete the overall
experience. For example, Ali et al.’s (2018) structural model to quantify customer satisfaction
at theme parks concluded that the physical environment, interaction with customers, and
interaction with staff significantly influenced customer satisfaction.
Nonetheless, increasing consumer expectations is a major challenge in the theme park
industry. Therefore, it is imperative to better understand the diverse drivers of consumers’
satisfaction and loyalty in the context of theme park visits to stay competitive in the
marketplace. While several studies made an effort to measure the impact of a variety of
variables on theme park visitors’ satisfaction and loyalty (Fotiadis, 2016; Manthiou et al.,
2016; Milman & Tasci, 2017; Fu, Kang, & Tasci, 2017), there is a gap in the literature on the
impact of guest experience prior, during, and after the visit on theme park’s satisfaction and
loyalty. Furthermore, as the industry evolves, new consumption variables such as prior visit
experiences, perceived queuing quality, and the role of anticipation and remembering the visit
may also impact visitors’ overall outcomes. Hence, the goal of this study is to analyze the
influence of prior visit experience, queuing quality, visit anticipation, as well as perceived
value and sociodemographic characteristics on theme park visitor satisfaction and loyalty.
Hence, the aim of this study is to analyze new experience concepts including the amount of
pleasure from anticipation, visiting, and remembering the experience, and time allocation for
waiting in lines, amusement activities, and food consumption and investigate the factors

4
influencing these new experience variables as well as perceived value, queuing quality,
satisfaction, and loyalty.
Literature Review
Predictors of Theme Park Visitor Behaviors
The literature points out to several concepts that predict theme park visitor behavior,
especially the levels of satisfaction and loyalty. Examples of these predictors include theme
park visitors’ sociodemographics; past visit experience; theme park visit quality related to the
physical environment, parking, thrill rides, rest areas, crowding, cleanliness; human
interactions with staff and other visitors; and intangible aspects related to visitor attitude and
perception (Ali et al., 2018; Fotiadis 2016; Geissler & Rucks, 2011; Hsing et al., 2014; Jin et
al., 2015; Milman et al., 2012).
Sociodemographic Characteristics
Sociodemographic variables have traditionally been the basic predictors of human behavior
(Kim, Lehto, & Morrison, 2007; Sheth, 1977; Swanson & Horridge, 2004; Trinh et al. 2014;
Wilkins, 2011; Wolin & Korgaonkar, 2003). However, many empirical studies did not find
sociodemographic variables as reliable predictors on theme park visitors’ level of satisfaction
(Ryan et al., 2010; Geissler & Rucks, 2011; Milman et al., 2012; Jin et al., 2015). Recently,
Milman and Tasci (2017) investigated the influence of age, gender, education, marital status,
ethnicity, and income on theme parks’ levels of satisfaction and loyalty, and the results did
not reveal any influence from these sociodemographic variables. On the other hand, Spinks et
al. (2005) concluded that the level of theme park visitor satisfaction might vary according to
demographic characteristics such as visitors’ origins, gender, and age groups. Considering the
ongoing interest in sociodemographics as instrumental segmentation variables, their influence
on theme park consumption behavior is tested in the current study. Sociodemographic
variables included age, gender, education, income, and race, and consumption behavior
variables included the amount of pleasure from anticipation prior to the visit, from the actual
visit, and from recollection of the theme park visit, perceived amount of time spent on
waiting in lines, on amusement activities (rides and shows), and on food and beverage
consumption, perceived value for money, perceived queuing quality, satisfaction, and loyalty.
5
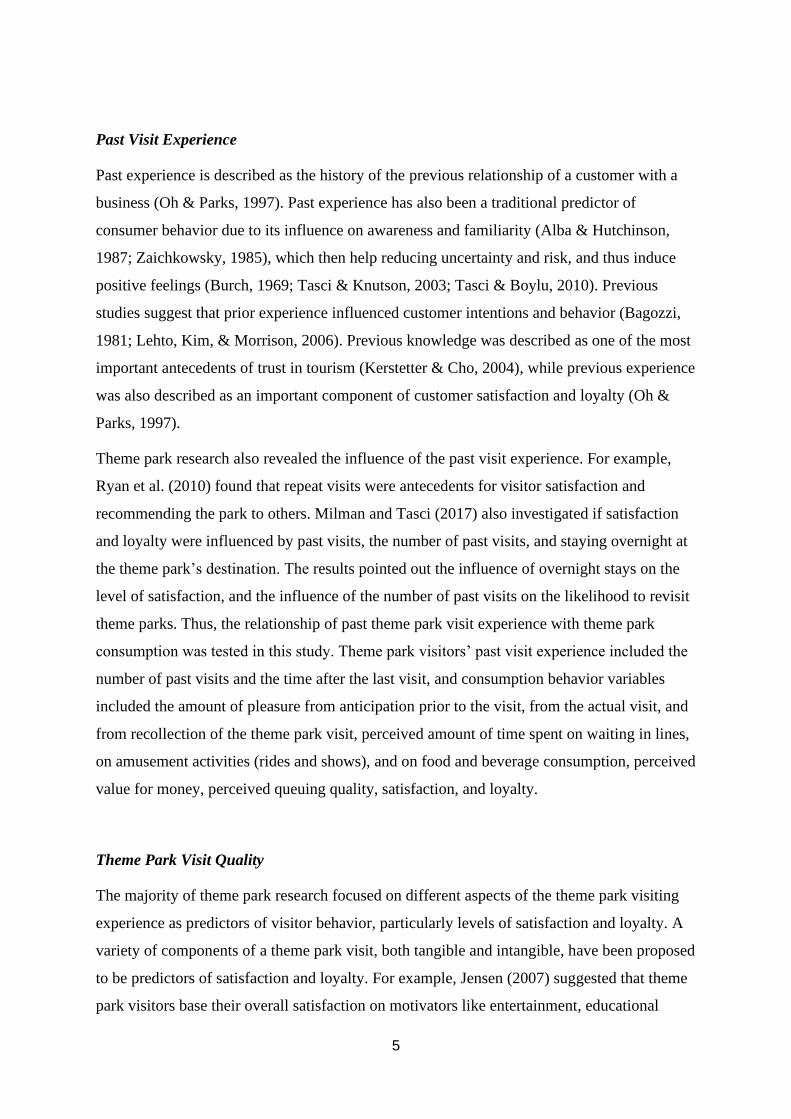
Past Visit Experience
Past experience is described as the history of the previous relationship of a customer with a
business (Oh & Parks, 1997). Past experience has also been a traditional predictor of
consumer behavior due to its influence on awareness and familiarity (Alba & Hutchinson,
1987; Zaichkowsky, 1985), which then help reducing uncertainty and risk, and thus induce
positive feelings (Burch, 1969; Tasci & Knutson, 2003; Tasci & Boylu, 2010). Previous
studies suggest that prior experience influenced customer intentions and behavior (Bagozzi,
1981; Lehto, Kim, & Morrison, 2006). Previous knowledge was described as one of the most
important antecedents of trust in tourism (Kerstetter & Cho, 2004), while previous experience
was also described as an important component of customer satisfaction and loyalty (Oh &
Parks, 1997).
Theme park research also revealed the influence of the past visit experience. For example,
Ryan et al. (2010) found that repeat visits were antecedents for visitor satisfaction and
recommending the park to others. Milman and Tasci (2017) also investigated if satisfaction
and loyalty were influenced by past visits, the number of past visits, and staying overnight at
the theme park’s destination. The results pointed out the influence of overnight stays on the
level of satisfaction, and the influence of the number of past visits on the likelihood to revisit
theme parks. Thus, the relationship of past theme park visit experience with theme park
consumption was tested in this study. Theme park visitors’ past visit experience included the
number of past visits and the time after the last visit, and consumption behavior variables
included the amount of pleasure from anticipation prior to the visit, from the actual visit, and
from recollection of the theme park visit, perceived amount of time spent on waiting in lines,
on amusement activities (rides and shows), and on food and beverage consumption, perceived
value for money, perceived queuing quality, satisfaction, and loyalty.
Theme Park Visit Quality
The majority of theme park research focused on different aspects of the theme park visiting
experience as predictors of visitor behavior, particularly levels of satisfaction and loyalty. A
variety of components of a theme park visit, both tangible and intangible, have been proposed
to be predictors of satisfaction and loyalty. For example, Jensen (2007) suggested that theme
park visitors base their overall satisfaction on motivators like entertainment, educational
6
events, socializing or more peripheral elements like parking, seating areas, and restrooms.
Ryan et al. (2010) identified six dimensions to measure visitor satisfaction: The park’s
atmosphere, thrill rides, degree of crowding, rest areas, and reasonable admission prices.
Geissler and Rucks (2011) concluded that visitors evaluate their theme park visits primarily
on their overall park experiences like food quality and variety, the park’s cleanliness, and
atmosphere, as well as visitors’ perception of admission price value. Milman et al. (2012)
pointed out to the staff’s knowledge of the theme park, roller coasters’ safety, the park’s
security, and ticket prices as the most important attributes impacting visitors’ satisfaction, and
Cheng et al. (2016) suggested that recreation experience, park services, park environment,
guidance information, or amusement consumption are the key drivers of customer
satisfaction.
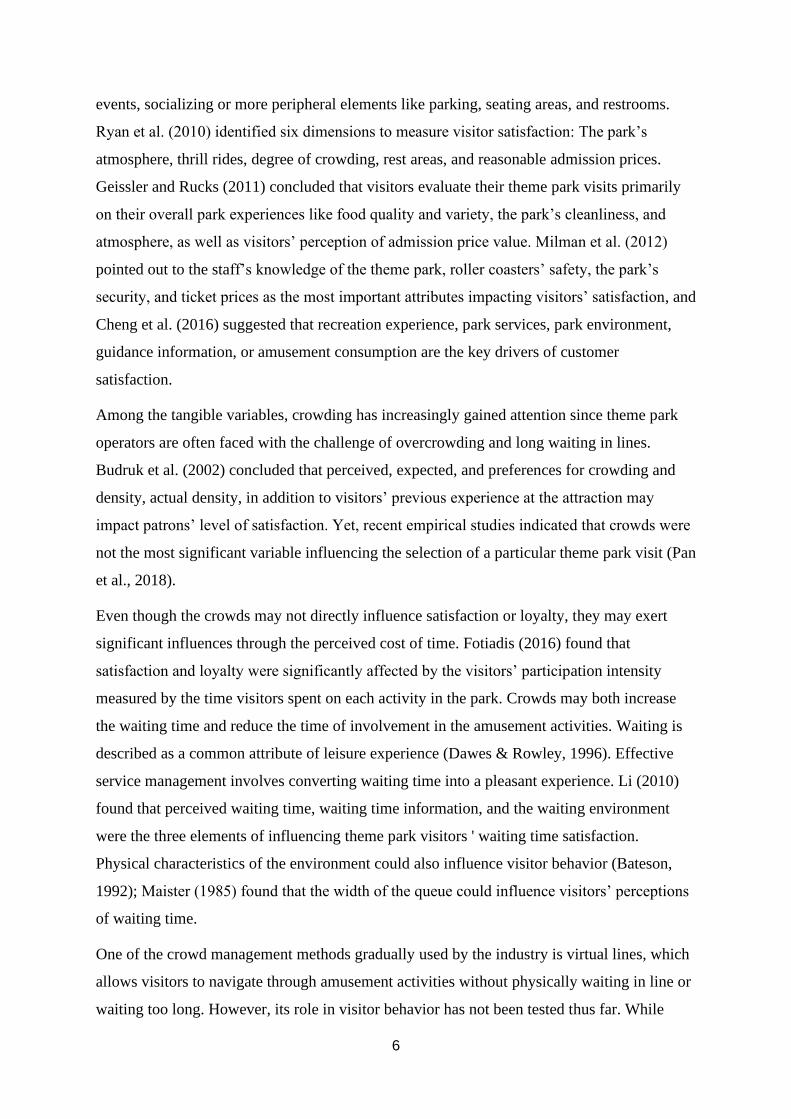
Among the tangible variables, crowding has increasingly gained attention since theme park
operators are often faced with the challenge of overcrowding and long waiting in lines.
Budruk et al. (2002) concluded that perceived, expected, and preferences for crowding and
density, actual density, in addition to visitors’ previous experience at the attraction may
impact patrons’ level of satisfaction. Yet, recent empirical studies indicated that crowds were
not the most significant variable influencing the selection of a particular theme park visit (Pan
et al., 2018).
Even though the crowds may not directly influence satisfaction or loyalty, they may exert
significant influences through the perceived cost of time. Fotiadis (2016) found that
satisfaction and loyalty were significantly affected by the visitors’ participation intensity
measured by the time visitors spent on each activity in the park. Crowds may both increase
the waiting time and reduce the time of involvement in the amusement activities. Waiting is
described as a common attribute of leisure experience (Dawes & Rowley, 1996). Effective
service management involves converting waiting time into a pleasant experience. Li (2010)
found that perceived waiting time, waiting time information, and the waiting environment
were the three elements of influencing theme park visitors ' waiting time satisfaction.
Physical characteristics of the environment could also influence visitor behavior (Bateson,
1992); Maister (1985) found that the width of the queue could influence visitors’ perceptions
of waiting time.
One of the crowd management methods gradually used by the industry is virtual lines, which
allows visitors to navigate through amusement activities without physically waiting in line or
waiting too long. However, its role in visitor behavior has not been tested thus far. While
7
several contributions addressed the impact of the quality of waiting experience on perceived
service quality and customer satisfaction (Katz, Larson, & Larson, 1991; Bitran & Lojo,
1993, Lee & Lambert, 2005; Li, 2010), the influence of virtual lines on perceived waiting
time, the impact of perceived queuing time, and queuing quality on visitors’ satisfaction and
loyalty received very little attention in theme parks context. Considering the potential
influence of waiting in lines and virtual lines, their relationship with theme park consumption
variables including satisfaction and loyalty was tested in this study.
In addition, the theme park visit quality is dependent on the individual theme parks’ products
and services. Each theme park is unique in its infrastructure, amenities, services, as well as
the core amusement products. Therefore, theme park consumption can be expected to be
influenced by the theme park visited as well. Thus, the brand name’s influence on theme park
consumption variables was tested in this study.
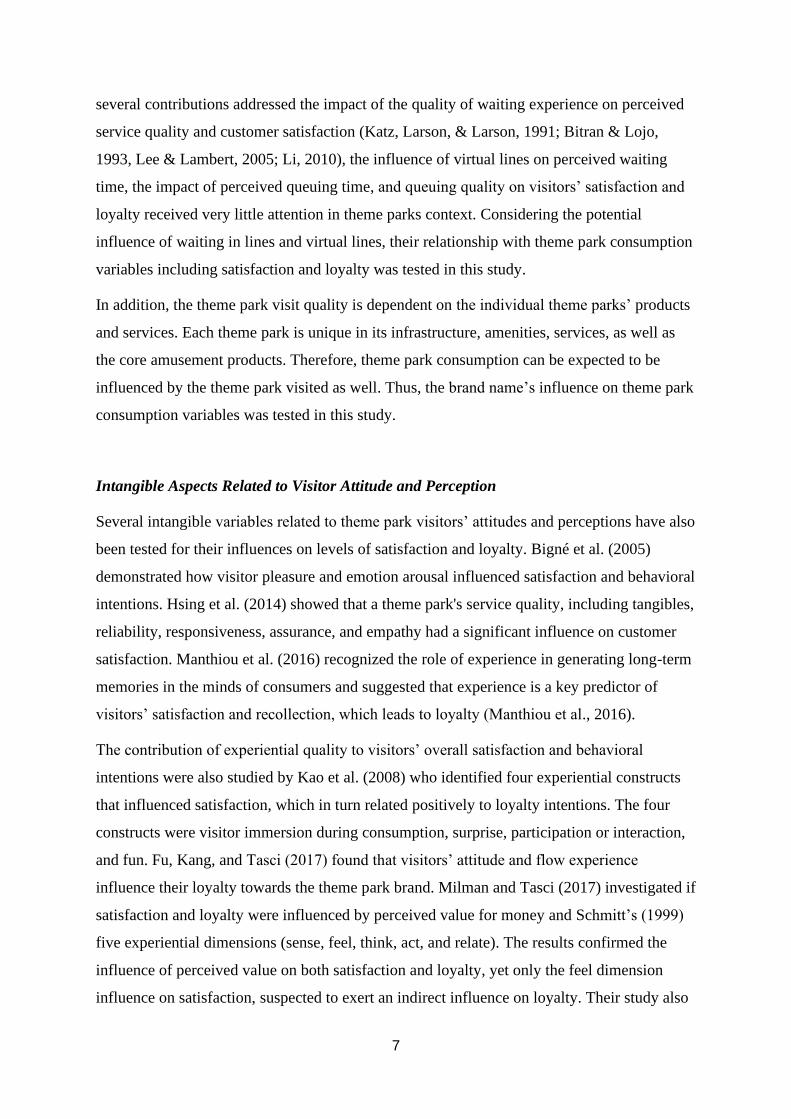
Intangible Aspects Related to Visitor Attitude and Perception
Several intangible variables related to theme park visitors’ attitudes and perceptions have also
been tested for their influences on levels of satisfaction and loyalty. Bigné et al. (2005)
demonstrated how visitor pleasure and emotion arousal influenced satisfaction and behavioral
intentions. Hsing et al. (2014) showed that a theme park's service quality, including tangibles,
reliability, responsiveness, assurance, and empathy had a significant influence on customer
satisfaction. Manthiou et al. (2016) recognized the role of experience in generating long-term
memories in the minds of consumers and suggested that experience is a key predictor of
visitors’ satisfaction and recollection, which leads to loyalty (Manthiou et al., 2016).
The contribution of experiential quality to visitors’ overall satisfaction and behavioral
intentions were also studied by Kao et al. (2008) who identified four experiential constructs
that influenced satisfaction, which in turn related positively to loyalty intentions. The four
constructs were visitor immersion during consumption, surprise, participation or interaction,
and fun. Fu, Kang, and Tasci (2017) found that visitors’ attitude and flow experience
influence their loyalty towards the theme park brand. Milman and Tasci (2017) investigated if
satisfaction and loyalty were influenced by perceived value for money and Schmitt’s (1999)
five experiential dimensions (sense, feel, think, act, and relate). The results confirmed the
influence of perceived value on both satisfaction and loyalty, yet only the feel dimension
influence on satisfaction, suspected to exert an indirect influence on loyalty. Their study also

8
revealed the influence of satisfaction on loyalty, however, perceived value’s influence on
loyalty was greater than that of satisfaction. Based on this discussion, the influence of
perceived value for money on satisfaction and loyalty, and the influence of satisfaction on
loyalty were tested in this study.
Despite the increasing attention in the literature to theme park experience, some key
experiential consumption variables have been neglected so far. Experience is described by
Kahneman, Wakker, and Sarin (1997) as an amount of pleasure or displeasure evoked from
an event from anticipating, experiencing, or remembering it. Every moment of an experience
which influence pleasure and displeasure can be described as an instant utility, or the basic
unit of experience, which is “the hedonic value of a moment of experience as immediately
reported or recorded” (Kahneman et al., 1997, p. 388). The remembered or recollected utility
refers to retrospective evaluations of the previous experience, while the anticipated utility is
related to the amount of pleasure evoked from savoring the future experience (Morewedge,
2016). Carmon and Kahneman (1996) investigated the experience of queuing and found that
a long line that ended with a positive emotional state led to a higher level of remembered
experience than a shorter queue. Cutler and Carmichael (2010) advanced the idea that
anticipation and recollection phases are important components of the tourism experience.
Barnes, Mattsson, and Sorensen (2016) investigated the remembered experience of safari
park visitors and concluded that longer-term remembered experiences have stronger effects
on customers’ revisit intentions than satisfaction after the visit. Hence, splitting visitor
experience into its components (i.e., anticipated experience, remembered experience, etc.)
makes it possible to analyze the relationship between these variables and their individual
effects on outcomes.
The effects of anticipated and remembered experience were described in previous studies.
Anticipation theory has shown that levels of anticipation would initially be high after the
purchase, then decrease, rising again before the event takes place (Sharples, 2018). A few
papers addressed the impact of anticipation on consumer choice and satisfaction (Shiv &
Huber, 2000; Harrison & Beatty, 2011; Godovykh, 2019; Koenig-Lewis & Palmer, 2014).
One more interesting correlate is related to the influence of the level of anticipation on
remembered experience (Kahneman, Fredrickson, Schreiber, & Redelmeier, 1993). Witz,
Kruger, Scollon, and Diener (2003) described the influence of predicted and remembered
experience on people’s desire to repeat the experience. There is a lack of empirical attention
on the impact of anticipation and remembering the theme park visits which are characterized

9
by the highest level of visitors’ experiential consumption on levels of satisfaction and loyalty.
Hence, the influence of the amount of pleasure from anticipation and remembering both
satisfaction and loyalty were tested in this study.
Research Methods
Study Context
Orlando’s most popular theme parks (Walt Disney World, Universal Orlando, Sea World)
were chosen as the context of this study. More than 50 million patrons visited the Walt
Disney World’s four theme parks in 2017 (Magic Kingdom: 20.4 million guests; Disney's
Animal Kingdom: 12.5 million; Epcot: 12.2 million; Disney's Hollywood Studios: 10.7
million), Universal Orlando’s two theme parks welcomed about 20 million visitors, while Sea
World Orlando hosted about 4 million visitors in 2017 (Bilbao, 2018).
Research Instrument
The purpose of the study was to analyze the amount of pleasure from anticipation, visiting,
and remembering the experience, and time allocation for waiting in lines, amusement
activities, and food consumption as well as investigate factors that explain these variables
besides perceived value, queuing quality, satisfaction, and loyalty. Multiple-item scales of the
different constructs were included in the questionnaire. Based on the literature, satisfaction
was measured using Oliver’s (1997) 5-item 7-point Likert scale (1=strongly disagree,
7=strongly agree), including the following items: “This is one of the best parks I visited,” “I
am satisfied with my decision to visit the park,” “my choice to visit the park was a wise one,”
“I have really enjoyed myself in the park,” and “I am sure it was the right thing to visit the
park.”
Visitor loyalty was measured by a 7-item 7-point Likert scale (1=strongly disagree,
7=strongly agree) established in previous research (Bigne et al., 2005; Yoon & Uysal, 2005;
Tasci, 2017), by asking respondents to rate their agreement on the following statements: “I
would like to say positive things about the park to other people,” “I would like to recommend
the park to someone who seeks my advice,” “I would like to encourage friends and relatives
to visit the park,” “I would consider the park as my first choice to visit,” “I would like to

10
revisit the park in the next few years,” “I would choose the park for my vacation even if it
costs more than other attractions,” and “I would promote the park in social media.”
Perceived value was measured by using a 3-item 7-point Likert scale (1=strongly disagree,
7=strongly agree) that was developed by Petrick (2002) and applied in the theme park context
by Jin, Lee, and Lee (2015). The latter version was adopted in the current study and included
the following statements: “Fees were fairly priced at the park,” “The quality of service at this
park has a good reputation,” and “Overall quality of the service at the park was valuable.”
Perceived queuing quality was measured by using three items based on a previous study by
Li (2010) on a 7-point Likert scale (1=strongly disagree, 7=strongly agree) by asking
respondents to rate their agreement on the following statements: “I spend less time for staying
in lines than I expected,” “Theme park provided comprehensive waiting information,” and
“Waiting environment was organized on a good level.” The question about the relative
contribution (out of 100%) of anticipation, consumption, and memory to the total pleasure
was adopted from Morewedge (2015). Questions about the previous experience, time of the
last visit, using virtual lines, and typical demographic characteristics (age, gender, education,
income, and race/ethnicity) were also included in the questionnaire. Furthermore, a screening
question about the name of their favorite attraction in the visited theme park was included to
ascertain an actual visit to the theme park.
Data Collection & Analysis
The survey was designed in Qualtrics software (Qualtrics Labs, 2011) and applied to a
sample of visitors who visited Orlando’s major theme parks during the past six months.
Amazon’s Mechanical Turk was used to collect the data. Previous studies reported no
significant difference between MTurk data compared to other modes (Bartneck, Duenser,
Moltchanova, & Zawieska, 2015). A total of 148 surveys were collected from respondents
who visited at least one of Orlando’s major theme parks (Walt Disney World, Universal
Orlando, Sea World).
11
Several analysis tools of IBM’s SPSS version 24.0 were applied to the data. Descriptive
statistics and frequency distribution were generated to check the respondents’ profile, missing
data, and normality of the data. Principal Component Analysis (PCA) was used to reduce
multi-item measures into meaningful factors. Pearson correlation, t-test, and one-way
ANOVA tests were used to test the relationships between sociodemographics and theme park
consumption variables and the relationships between past theme park visit experience and
theme park consumption variables. To understand the impact of pleasure from anticipation
and remembering, time spent waiting in lines and waiting for amusement activities on
satisfaction and loyalty, Ordinary Least Squares (OLS) multiple regression analysis was
conducted.
Data were checked for multicollinearity through inspection of Tolerance values and VIFs
(variance inflation factors). All tolerance values were higher than .25 threshold (Huber and
Stephens, 1993). VIF is defined as 1/tolerance, and is always greater than 1; a VIF value
greater than 10 strongly indicates high multicollinearity (Ott & Longnecker, 2010). VIF
values for all independent variables in the current study were smaller than three (3).
Results
Sample Characteristics
Respondents’ sociodemographic profile and experience characteristics are presented in
Tables 1 and 2. Respondents were 32.45 years old (SD=9.79) on average, with a slight
dominance of female respondents (57.4%). The majority of the participants have College or
University education (58.1%), majority having an annual income of less than USD 50,000,
and more than 70% being White/Caucasians. As for the time of their visit to the theme park,
19,6% of respondents visited less than one month ago, 39.2% had their visit one to three
months ago, and 41.2% visited six months ago. 31.8% of the respondents reported that it was
their first theme park visit, 31.1% visited theme park once before, and 37.2% visited theme
parks multiple times before. Almost one half (48.6%) of respondents used virtual lines, (e.g.,
fast pass, express pass) during their visit. The majority of respondents visited the Walt Disney
World theme parks (53.4%).

12
Table 1: Sociodemographic Characteristics of the Sample
Sociodemographic characteristics N % or Mean Age (mean) 32.4
Gender (n = 148)
Male 63 42.6
Female 85 57.4
Household income (n = 148)
Under $30,000 37 25
$30,000–$49,999 38 25.7
$50,000–$79,999 47 31.8
More than $80,000 26 17.5
Education (n = 148)
High school 24 16.2
Vocational School/Associate 18 12.2
College/University 86 58.1
Master’s or PhD 19 12.8
Other 1 0.7
Ethnicity (n = 148)
White/Caucasian 106 71.6
African American 7 4.7
Hispanic 10 6.8
Asian 19 12.8
Native American 5 3.4
Other 1 0.7
Table 2: Past Theme Park Experience of the Sample
Characteristics N %
Time of the visit (n=148)
Less than one month ago 29 19.6
From one to three months ago 58 39.2
From three to six months ago 61 41.2
Previous experience (n=148)
First visit 47 31.8
Visited once before 46 31.1
Visited more than one time before 55 37.2
Virtual queuing (e.g., fast pass, express pass) (n=148)
Yes 72 48.6
No 76 51.4
Park visited (n=148)
Walt Disney World 79 53.4
Universal Orlando 52 35.1
Sea World 15 10.1
Other theme parks 2 1.4
Table 3 displays the theme park consumption variables, measurement items, and factors
assessed using Principal Component Analysis. The amount of pleasure the respondents
received from the whole experience was measured as the relative contribution of three
components, namely anticipation, visiting, and remembering. The combined amount of
pleasure from anticipation (30.9%) and from remembering the visit (24.6%) surpassed their
pleasure from the visit itself. Some respondents reported no pleasure (0%) from anticipating

13
(2 respondents), visiting (5 respondents), or remembering (7 respondents). Only anticipation
component received the maximum value of 100%, while the maximum amounts of pleasure
from visiting the theme park and remembering the experience were 97% and 55%,
respectively. The average amount of time they spent waiting in lines (out of 100%) was
38.2%, for amusement activities (i.e., rides, shows) was 38.80%, and for consuming food and
beverage was 22.6%.
Table 3: Theme Park Consumption Variables, Measurement Items, and PCA Results
Variables & Measurement Items N Min. Max. Mean
Std.
Dev.
Factor
Loadings
% of
Variance
Explained
Cronbach
Alpha
Factor
Grand
Mean
Amount of pleasure from anticipation
(savoring) of the theme park visit
148 .00 100 30.89 17.784
Amount of pleasure from visiting the
theme park
148 .00 97 44.519 19.722
Amount of pleasure from remembering
of your theme park visit
148 .00 55 24.609 12.951
Time Allocation
Time spent waiting in lines 148 .00 100 38.23 19.423
Time spent with amusement activities 148 .00 80 38.80 17.354
Time spent taking food 148 .00 56 22.63 12.383
Perceived valuea
Fees were fairly priced at the park 148 1 7 4.02 1.576 .906 65.181 .70 4.92
Quality of service at this park has a
good reputation
148 1 7 5.36 1.278 .897
Overall quality of the service at the
park was valuable
148 1 7 5.37 1.316 .574
Queuing qualitya
I spend less time for staying in lines
than I expected
148 1 7 4.26 1.734 .860 69.113 .76 4.81
Theme park provided comprehensive
waiting information
148 1 7 5.00 1.409 .848
Waiting environment was organized
on a good level
148 1 7 5.16 1.299 .784
Satisfactiona
This is one of the best parks I visited 148 1 7 5.41 1.480 .919 81.100 .94 5.61
I am satisfied with my decision to visit 148 1 7 5.59 1.339 .916
My choice to visit was a wise one 148 1 7 5.61 1.291 .916
I have really enjoyed myself in 148 1 7 5.68 1.320 .909
I am sure it was the right thing to visit 148 1 7 5.72 1.239 .841
Loyaltya
I would like to say positive things
about to other people
148 1 7 5.74 1.213 .885 68.037 .91 5.38
I would like to recommend to someone
who seeks my advice
148 1 7 5.68 1.225 .865
I would like to encourage friends and
relatives to visit
148 1 7 5.72 1.266 .862
I would consider as my first choice to
visit
148 1 7 5.31 1.470 .840
I would like to revisit in the next few
years
148 1 7 5.57 1.530 .839
I would choose for my vacation even if
it costs more than other destinations
148 1 7 4.59 1.733 .756
I would promote in my social media 148 1 7 5.03 1.538 .711
a: 1=Strongly Disagree, 7=Strongly Agree

14
PCA revealed that perceived value explained about 65% of the total variation with an
acceptable level of reliability (Cronbach’s alpha= 0.70) and a factor grand mean of 4.92 on
the 7-point Likert scale. The retained measurement items explained 69% of the variation in
queuing quality with a high level of reliability (Cronbach alpha= 0.76) and a factor grand
mean of 4.81 on the 7-point Likert scale. The retained measurement items explained about
81% of variation in satisfaction with a high level of reliability (Cronbach’s alpha= 0.94) and a
factor grand mean of 5.61 on the 7-point Likert scale, while those for loyalty explained 68%
of the total variance with a high level of reliability (Cronbach’s alpha= 0.91) and a factor
grand mean of 5.38 on the 7-point Likert scale.
A variety of statistical tests was applied to analyze the influence of socio-demographic and
experience variables on theme park visitor experience, perceived value, quality, satisfaction,
and loyalty (Table 4 and 5). First, the variables influencing the relative contribution of
anticipating, visiting, and remembering the theme park experience and perceived time spent
for waiting in lines, amusement activities (i.e., rides, shows), and food and beverage
consumption were analyzed. First-time visitors had significantly higher perceived levels of
pleasure from anticipation (40% vs. 22%) and significantly lower levels of pleasure from
visiting (34% vs. 55%) than those who visited before. One-way ANOVA did not reveal any
significant differences in the level of pleasure from remembering the experience for first-time
visitors (25%) and repeat visitors (26% for visiting once before and 23% for multiple prior
visits).
Table 4: Test of Influence of Socio-Demographic and Experience Variables on the Amount
of Pleasure from Phases of Theme Park Visit and Time Allocation for Different Activities Amount of pleasure from
the theme park visit
Time allocation
Sociodemographic and experience
antecedents
anticipating
(mean
percent.)
visiting
(mean
percent.)
rememberi
ng (mean
percent.)
waiting
in lines
(mean)
amusement
activities
(mean)
taking
food
(mean)
Age (Years, mean) Correlation -.034 .062 -.048 .047 .085 -.168
Correlation significance .677 .451 .565 .568 .305 .042*
Gender (%) Mean Mean Mean Mean Mean Mean
Female 29.48 47.15 23.36 27.78 40.41 22.16
Male 32.78 40.95 26.27 28.84 36.63 23.25
t-test significance .262 .054 .184 .737 .182 .598
Level of Education (%) Mean Mean Mean Mean Mean Mean
Less than College 33.33 44.52 22.14 41.55 37.98 20.71
College/University 29.94 44.43 25.63 37.13 38.87 23.30
Graduate level 28.74 45.63 25.63 35.79 41.32 22.89
One-way ANOVA test significance .523 .971 .342 .411 .786 .535

15
Family’s annual income (%)
Under $30,000 30.27 49.62 20.10 42.42 36.57 20.27
$30,000–$49,999 32.71 39.95 27.34 40.34 37.53 22.13
$50,000–$79,999 31.81 42.64 25.55 33.72 39.47 25.53
More than $80,000 27.42 25.27 25.27 35.88 42.65 21.46
One-way ANOVA test significance .673 .140 .089 .110 .542 .240
Race/Ethnicity (%) Mean Mean Mean Mean Mean Mean
White/Caucasian 31.06 43.96 24.98 38.38 38.97 21.90
Others 30.45 45.90 23.64 37.85 38.38 24.48
t-test significance .855 .595 .592 .885 .851 .312
Visit Experience Mean Mean Mean Mean Mean Mean
First visit 40.46 34.04 25.49 40.28 33.64 24.38
Visited once before 31.80 42.19 26.00 38.15 37.22 25.28
Visited more than one time before 21.92 55.40 22.67 36.55 44.55 18.91
One-way ANOVA test
significance
.000** .000* .375 .629 .004** .017*
Using skip the line access (e.g., fast
pass, express pass)
Mean Mean Mean Mean Mean Mean
No 31.76 45.55 22.68 42.14 37.88 20.37
Yes 29.96 43.42 26.63 34.10 39.78 25.01
t-test significance .537 .511 .063 .011** .508 .022*
Park visited Mean Mean Mean Mean Mean Mean
Walt Disney 29.68 46.02 24.29 40.08 38.67 21.38
Universal 32.52 44.73 22.75 37.31 38.65 22.88
SeaWorld 31.47 36.82 31.71 32.47 39.88 27.65
One-way ANOVA test significance .667 .218 .043* .315 .964 .164
Of all the sociodemographic variables, only age was found to be significant in explaining the
perceived time spent on food and beverage consumption. As age increases, the amount of
time spent on dining during the visit decreases. On the other hand, family income and
ethnicity were significant in explaining theme park consumption variables (Table 5).
Respondents with income USD 50,000-$79,999 rated their perceived theme park value
significantly higher (5.38 on the 7-point Likert scale) than other income groups. They also
reported significantly higher levels of satisfaction from their visit (6.04) than all other
respondents. White/Caucasian respondents who visited theme parks reported significantly
higher levels of perceived queuing quality (4.94), level of satisfaction (5.75), and loyalty
(5.52) than all other categories of ethnicity. Age influences the time spent on food and
beverage consumption, while income influences the perceived value and satisfaction, and
race influences perceived queuing quality, satisfaction, and loyalty.
Prior theme park visit experience explained the amount of pleasure from anticipation and the
actual visiting experience. First-time visitors reported a significantly higher amount of
pleasure from anticipation (40.46%), compared to the pleasure from the actual visit (34.04%).
Prior visitors, on the other hand, reported a significantly higher amount of pleasure from their
visiting experience than first-time visitors. Prior experience also explained the time spent on
16
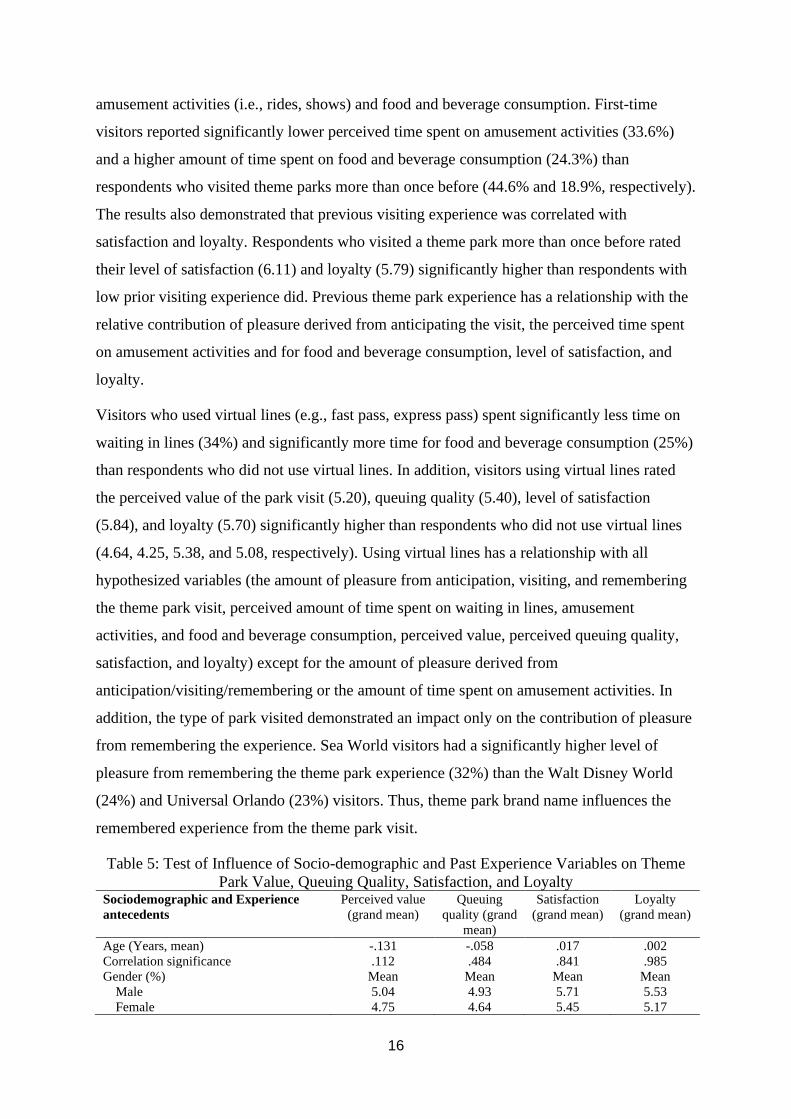
amusement activities (i.e., rides, shows) and food and beverage consumption. First-time
visitors reported significantly lower perceived time spent on amusement activities (33.6%)
and a higher amount of time spent on food and beverage consumption (24.3%) than
respondents who visited theme parks more than once before (44.6% and 18.9%, respectively).
The results also demonstrated that previous visiting experience was correlated with
satisfaction and loyalty. Respondents who visited a theme park more than once before rated
their level of satisfaction (6.11) and loyalty (5.79) significantly higher than respondents with
low prior visiting experience did. Previous theme park experience has a relationship with the
relative contribution of pleasure derived from anticipating the visit, the perceived time spent
on amusement activities and for food and beverage consumption, level of satisfaction, and
loyalty.
Visitors who used virtual lines (e.g., fast pass, express pass) spent significantly less time on
waiting in lines (34%) and significantly more time for food and beverage consumption (25%)
than respondents who did not use virtual lines. In addition, visitors using virtual lines rated
the perceived value of the park visit (5.20), queuing quality (5.40), level of satisfaction
(5.84), and loyalty (5.70) significantly higher than respondents who did not use virtual lines
(4.64, 4.25, 5.38, and 5.08, respectively). Using virtual lines has a relationship with all
hypothesized variables (the amount of pleasure from anticipation, visiting, and remembering
the theme park visit, perceived amount of time spent on waiting in lines, amusement
activities, and food and beverage consumption, perceived value, perceived queuing quality,
satisfaction, and loyalty) except for the amount of pleasure derived from
anticipation/visiting/remembering or the amount of time spent on amusement activities. In
addition, the type of park visited demonstrated an impact only on the contribution of pleasure
from remembering the experience. Sea World visitors had a significantly higher level of
pleasure from remembering the theme park experience (32%) than the Walt Disney World
(24%) and Universal Orlando (23%) visitors. Thus, theme park brand name influences the
remembered experience from the theme park visit.
Table 5: Test of Influence of Socio-demographic and Past Experience Variables on Theme
Park Value, Queuing Quality, Satisfaction, and Loyalty Sociodemographic and Experience
antecedents
Perceived value
(grand mean)
Queuing
quality (grand
mean)
Satisfaction
(grand mean)
Loyalty
(grand mean)
Age (Years, mean) -.131 -.058 .017 .002
Correlation significance .112 .484 .841 .985
Gender (%) Mean Mean Mean Mean
Male 5.04 4.93 5.71 5.53
Female 4.75 4.64 5.45 5.17

17
t-test significance .113 .146 .192 .070
Level of Education (%) Mean Mean Mean Mean
Less than College 4.76 4.49 5.33 5.18
College/University 5.05 4.95 5.75 5.51
Graduate level 4.74 4.84 5.61 5.30
One-way ANOVA test significance .284 .146 .189 .315
Family’s annual income (%) Mean Mean Mean Mean
Under $30,000 4.64 4.47 5.31 5.06
$30,000–$49,999 4.63 4.66 5.31 5.23
$50,000–$79,999 5.38 5.15 6.04 5.69
More than $80,000 4.90 4.88 5.66 5.48
One-way ANOVA test significance .004** .067 .012* 0.075
Race/Ethnicity (%) Mean Mean Mean Mean
White/Caucasian 5.00 4.94 5.75 5.52
Others 4.71 4.46 5.23 5.02
t-test significance .182 .046* .029* .026*
Visit Experience Mean Mean Mean Mean
First visit 5.0213 4.7872 5.30 5.14
Visited once before 4.7391 4.6594 5.31 5.13
Visited more than one time before 4.9758 4.9455 6.11 5.79
One-way ANOVA test significance .413 .506 .000** .004**
Using skip the line access (e.g., fast pass,
express pass)
Mean Mean Mean Mean
No 4.64 4.25 5.38 5.08
Yes 5.20 5.40 5.84 5.70
t-test significance .002** .000** .017** .001**
Park visited Mean Mean Mean Mean
Walt Disney 4.82 4.82 5.61 5.41
Universal 5.00 4.79 5.75 5.42
SeaWorld 5.12 4.80 5.14 5.12
One-way ANOVA test significance .477 .991 .196 .620
In addition, OLS multiple regression was employed to measure the relative influences of the
amount of pleasure from anticipation and remembering, time spent waiting in lines and on
amusement activities, perceived value, and perceived queuing quality on the level of visiting
satisfaction on loyalty. The results indicated in Table 6 show that different variables exert
different levels of influence on the level of visiting satisfaction and loyalty. Satisfaction is
explained by the amount of pleasure from anticipation (β= -.273), remembering (β= -.211),
perceived value (β= .554), and perceived queuing quality (β= .257).
While the influences of perceived value and queuing quality are positive, the influences of
the amount of pleasure from anticipation and remembering are negative. With an R2 value
(.592), these four variables explain about 59% of the variance in the level of visiting
satisfaction. The amount of pleasure from anticipation and remembering as well as perceived
queuing quality and perceived value of the theme park experience influence theme park
visitor satisfaction. On the other hand, loyalty was explained by only the perceived queuing
quality (β= .178) and the level of visiting satisfaction (β= .713), explaining 80% of the
variance in loyalty (R2= .800). Hence, perceived queuing quality and satisfaction have effects
18
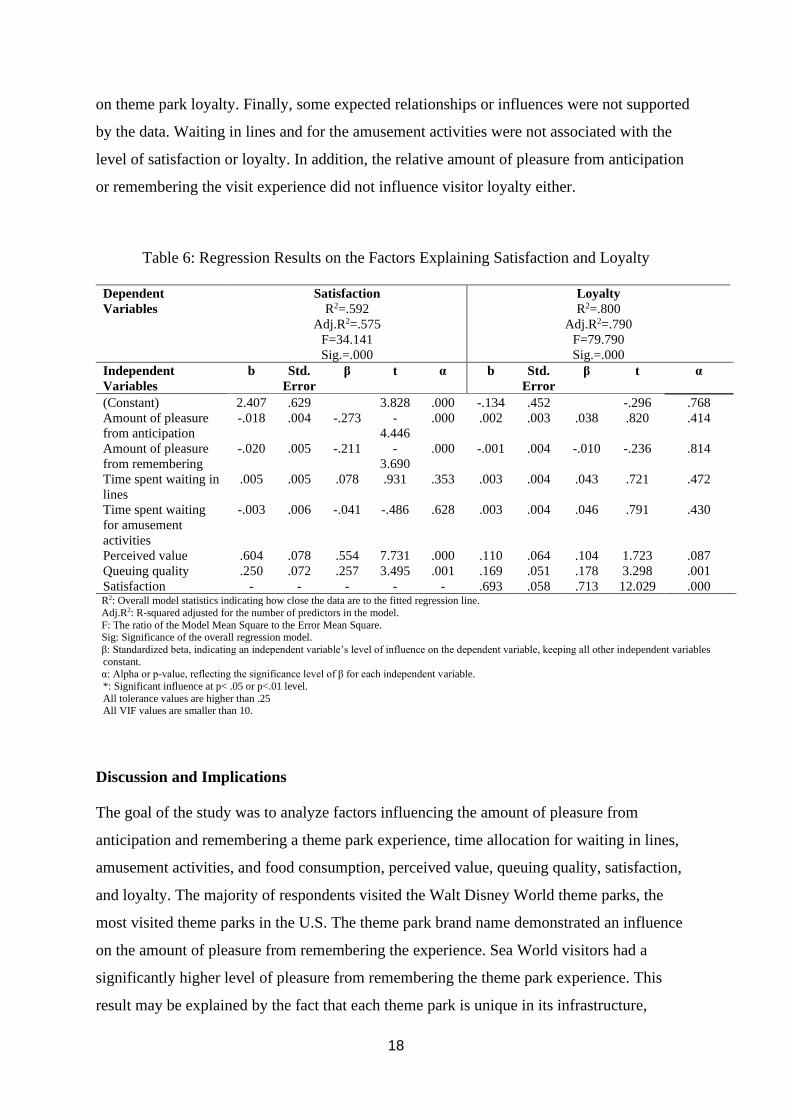
on theme park loyalty. Finally, some expected relationships or influences were not supported
by the data. Waiting in lines and for the amusement activities were not associated with the
level of satisfaction or loyalty. In addition, the relative amount of pleasure from anticipation
or remembering the visit experience did not influence visitor loyalty either.
Table 6: Regression Results on the Factors Explaining Satisfaction and Loyalty
Dependent
Variables
Satisfaction
R2=.592
Adj.R2=.575
F=34.141
Sig.=.000
Loyalty
R2=.800
Adj.R2=.790
F=79.790
Sig.=.000
Independent
Variables
b Std.
Error
β t α b Std.
Error
β t α
(Constant) 2.407 .629 3.828 .000 -.134 .452 -.296 .768
Amount of pleasure
from anticipation
-.018 .004 -.273 -
4.446
.000 .002 .003 .038 .820 .414
Amount of pleasure
from remembering
-.020 .005 -.211 -
3.690
.000 -.001 .004 -.010 -.236 .814
Time spent waiting in
lines
.005 .005 .078 .931 .353 .003 .004 .043 .721 .472
Time spent waiting
for amusement
activities
-.003 .006 -.041 -.486 .628 .003 .004 .046 .791 .430
Perceived value .604 .078 .554 7.731 .000 .110 .064 .104 1.723 .087
Queuing quality .250 .072 .257 3.495 .001 .169 .051 .178 3.298 .001
Satisfaction - - - - - .693 .058 .713 12.029 .000 R2: Overall model statistics indicating how close the data are to the fitted regression line.
Adj.R2: R-squared adjusted for the number of predictors in the model.
F: The ratio of the Model Mean Square to the Error Mean Square. Sig: Significance of the overall regression model.
β: Standardized beta, indicating an independent variable’s level of influence on the dependent variable, keeping all other independent variables
constant. α: Alpha or p-value, reflecting the significance level of β for each independent variable.
*: Significant influence at p< .05 or p<.01 level.
All tolerance values are higher than .25 All VIF values are smaller than 10.
Discussion and Implications
The goal of the study was to analyze factors influencing the amount of pleasure from
anticipation and remembering a theme park experience, time allocation for waiting in lines,
amusement activities, and food consumption, perceived value, queuing quality, satisfaction,
and loyalty. The majority of respondents visited the Walt Disney World theme parks, the
most visited theme parks in the U.S. The theme park brand name demonstrated an influence
on the amount of pleasure from remembering the experience. Sea World visitors had a
significantly higher level of pleasure from remembering the theme park experience. This
result may be explained by the fact that each theme park is unique in its infrastructure,
19
amenities, services, and experiences and possibly interaction with animals in Sea World led
to the higher level of remembered experience. The findings are surprising as Sea World and
other marine mammal theme parks featuring entertaining marine mammals in captivity have
gone through social responsibility scrutiny in the past decade or so (Rose & Parsons, 2019).
Nevertheless, the results could be explained by the level of involvement intensity experienced
by patrons at the different Orlando’s mega-theme parks. Unlike the Walt Disney World or
Universal Orlando theme parks, Sea World is a smaller, compact park that does not require
overstimulation of senses, compared to its rivals. Visitors are likely to be less stressed in Sea
World than its competing theme parks to consume all rides, shows, and other entertainment
experiences, and therefore are able to take a slower pace, a more focused visit, and
consequently, remember their experiences better than in its competitors where the experience
is intensive and exhaustive. This may imply future theme park development to focus on
smaller regional theme parks that will tell the local stories in a less intensive and less stressful
pace, thus yield better memorable experiences.
All the significant consumer behavior variables (namely satisfaction, queuing quality,
perceived value, and loyalty) received above the mid-point ratings. The high ratings for the
theme parks may suggest that visiting theme parks constitute hedonistic experiential
consumption activity (Crompton & Van Doren, 1976), where visitors respond more vividly to
emotional content rather than traditional elements of service delivery (Johns & Gyimothy,
2002). Theme parks are also creators of the emerging experience economy and remain
leaders in innovative design, marketing, and delivery of memorable experiences (Geissler &
Rucks, 2011). The new integrated theme park business model reinforces theme parks to
become destinations by encouraging visitors to remain in the operator’s territory and
experience hotels, restaurants, retail outlets, and other facilities linked to the theme park’s
brand (Rubin, 2016). The industry continues to invest in its infrastructure and experience
design to meet consumer demand. For example, in late 2018, Six Flags signed more
agreements for parks in China, Disney announced plans to invest $2.5 billion to expand its
Paris property; and Universal reportedly doubled the budget for its upcoming Beijing Park
(Sampson, 2018).
The study findings demonstrate that past experience could influence visitor perception of the
amount of time spent for waiting in lines, amusement activities, and food and beverage
consumption, and that previous visit experience could have significant effects on both
satisfaction and loyalty. These results complement previous findings underlining the
20
influence of past experience on consumer behavior due to familiarity (Alba & Hutchinson,
1987; Tasci & Boylu, 2010; Tasci & Knutson, 2004; Zaichkowsky, 1985). Interestingly, the
time after the last visit does not have significant effects on visitor satisfaction or loyalty,
while several previous studies suggested that the influence of prior attitudes on customer
evaluations changed by time (Bolton & Drew, 1991; Mittal, Katrichis, & Kumar, 2001).
Large theme park repeat visitors have become experts in the park’s landscapes and attractions
and are not stressed to consume all the park’s attractions. Therefore, they can be selective of
the experiences they choose, including waiting in lines, the amusement activities they select,
and the time they spend on food consumption.
Almost one-half of the respondents used virtual lines. A possible explanation for these results
is related to the increasing popularity of the theme park industry resulting in increasing
crowds and long waiting lines. Attendance at the top 25 global theme parks increased by
4.7% in 2017 in comparison with the previous year. Theme park crowding is unique, as the
parks provide multi-focus resources like attractions and rides, shows, restaurants, retail
stores, and more. Guests make decisions regarding their visit path and the time they allocate
for each resource, according to their personal preferences. The study’s respondents reported
that they are spending almost the same time for waiting in lines and for amusement activities,
and therefore, they are seeking strategies to reduce their waiting time by utilizing virtual
lines. Virtual lines are the latest evolution in theme parks’ efforts to cut or eliminate waits for
rides and attractions by using sophisticated technology.
In addition, the study’s results showed that using visual lines significantly influenced visitors’
outcomes. Expectedly, visitors who used virtual lines spent significantly less time waiting in
lines and significantly more time for consuming food and beverage than those who did not
use virtual lines. Furthermore, visitors using the virtual lines rated the perceived value of the
park visit, the queuing quality, level of satisfaction, and loyalty significantly higher than
people who did not use virtual lines. These findings support previous research on the
influence of the crowds on visitor outcomes through the time cost. Long lines increase the
waiting time and reduce the time of involvement in amusement activities (Li, 2010; Fotiadis,
2016), which is inherently connected with positive consumer outcomes. The findings call for
theme park informational technology teams to continue developing innovative virtual line
strategies.
Some research suggests that sociodemographic variables influence consumers’ perceptions
and decision-making (Spinks et al., 2005; Wilkins, 2011; Trinh et al., 2014). However, some

21
studies did not reveal a significant influence of sociodemographic characteristics on theme
park satisfaction and loyalty (Geissler & Rucks, 2011; Jin et al., 2015). The results of the
current study demonstrate that sociodemographic characteristics could influence theme park
consumption variables; family income and ethnicity were significant in explaining theme
park consumption outcomes. These results support sociodemographic-based segmentation for
targeted marketing of theme parks.
One unanticipated finding of the study is that the amount of participants’ consequential
pleasure from anticipation and remembering the visit surpassed their pleasure form the visit
itself. This means that for some theme park visitors, anticipation and remembering the
experience can be more important than the visit itself. Moreover, respondents who reported
more pleasure from anticipating their theme park experience reported significantly lower
levels of satisfaction and loyalty. These results support the findings of previous psychological
research on the negative correlation between anticipation and satisfaction (Kahneman et al.,
1993). These relationships deserve further investigation in the context of theme parks and
attractions. Theme park decision-makers should carefully consider their product portfolios
and develop pre-visit experiences that may unrealistically enhance guests’ anticipation
associated with their forthcoming visit. Furthermore, in the experience economy, businesses
intentionally stage memorable encounters, thus the experience becomes the product where
memories become transformations (Pine & Gilmore, 2011). Therefore, theme parks should
develop customized experiences that will be inherently personal, embedded in the mind of
their individual guests who have been engaged on an emotional, physical, intellectual, or
even spiritual level (Pine & Gilmore, 2011). These memorable experiences may lead to
transformations and consumer loyalty. The Walt Disney Company already develops
anticipated experiences through online and mobile tools that make it easy to plan, manage
and share vacation details at home prior to departure (Walt Disney World, 2019a). However,
they complement this with onsite customized experiences while visiting their theme parks.
For example, the Bibbidi Bobbidi Boutique at Disney’s Magic Kingdom, an enchanted beauty
salon, offers magical makeovers for young princesses and knights (Walt Disney World,
2019b).
Another interesting finding is that the amount of pleasure from anticipation and remembering
the experience, as well as perceived value and perceived queuing quality influenced visitor
satisfaction. Satisfaction was explained by the amount of pleasure from anticipation,
remembering, perceived queuing quality, and perceived value for money, perceived value’s
22
effect being double as much as the others. It is somewhat surprising that anticipated and
remembered experience negatively influenced satisfaction, which can be explained by the
fact that a higher level of anticipation leads to a lower level of positive disconfirmation,
which is intimately related to satisfaction.
Limitations
First, the study was conducted in Orlando, Florida, the largest theme park destination in the
world. Since every theme park offers different spatial environments, services, atmospheres,
and experiences, the results may vary in different geographical locations around the U.S. or
globally. Second, collecting data from an online sample rather than an onsite sample of theme
park visitors may have revealed results not applicable to the typical U.S. theme park visitors.
Third, the data were collected from consumers who had visited their favorite theme park
within a specific time frame, which may have influences on their memory recollection related
to their visiting experience (Manthiou et al., 2016). Fourth, other explanatory variables could
better explain some of the dependent variables addressed in this study. Future research may
check the ramifications of these four limitations by applying and comparing the findings in
different types of theme parks, both in the U.S. and around the world.
Future Research
Theme parks becoming more luxury products coupled with consumers’ experiential
consumption expectations; it would be interesting to investigate other drivers for consumers’
motivation to continue visiting these hedonistic entertainment complexes. The study
introduced several new concepts in the context of theme park experiential consumption that
were not previously discussed in the literature and should be studied further. First, the three
sequential stages of anticipation, the consumption, and the post-visit remembered experiences
should be examined more carefully, including the relative contribution of each of the
consumption stages. Second, the visitors’ time allocation for the different aspects of their
visit, including planning, traveling to, queuing, food and beverage consumption, shopping,
and other experiential activities should be evaluated in relation to their impact on satisfaction
and loyalty. Third, the role of virtual lines and crowding and their impact on the overall
visiting experience should be addressed from different theoretical perspectives such as
psychology, sociology, and geography. Fourth, the concept of pleasure from anticipation and
23
remembering the experience was introduced in this study. Future research is needed to delve
into the other sources of pleasure.
REFERENCES
Alba, J.W. & Hutchinson, J.W. (1987). Dimensions of consumer expertise. Journal of
Consumer Research, 13(4), 411-454.
Ali, F., Kim, W.G., Li, J. and Jeon, H.M. (2018), "Make it delightful: Customers' experience,
satisfaction and loyalty in Malaysian theme parks", Journal of Destination Marketing
& Management, 7, 1-11, available at: https://doi.org/10.1016/j.jdmm.2016.05.003.
Bagozzi, R. P. (1981). Attitudes, intentions, and behavior: A test of some key
hypotheses. Journal of Personality and Social Psychology, 41(4), 607.
Barnes, S. J., Mattsson, J., & Sorensen, F. (2016). Remembered experiences and revisit
intentions: A longitudinal study of safari park visitors. Tourism Management, 57, 286-
294.
Bartneck, C., Duenser, A., Moltchanova, E., & Zawieska, K. (2015). Comparing the
similarity of responses received from studies in Amazon’s Mechanical Turk to studies
conducted online and with direct recruitment. PloS One, 10(4), 1-23.
Bateson, J. E. (1989). Managing services marketing. London, GB: Dryden Press.
Bigné, J. E., Andreu, L., & Gnoth, J. (2005). The theme park experience: An analysis of
pleasure, arousal and satisfaction. Tourism Management, 26(6), 833-844.
Bitran, G., & Lojo, M. (1993). A framework for analyzing the quality of the customer
interface. European Management Journal, 11(4), 385-396.
Braun B.M & Soskin M.D. (2010). Disney’s return to theme park dominance in Florida.
Tourism Economics, 16(1): 235-250.
Browne, R.B. & Browne, P., (eds.). (2000). Guide to United States Popular Culture. Bowling
Green, OH: Popular Press.
Budruk, M., Schneider, I. E., Andreck, K. L., & Virden, R. J. (2002). Crowding and
Satisfaction among Visitors to A Built Desert Attraction. Journal of Park &
Recreation Administration, 20(3), 1-17.
24
Burch W. (1969). The social circles of leisure: competing explanations. Journal of Leisure
Research 1, 125-147.
Carmon, Z., & Kahneman, D. (1996). The experienced utility of queuing: Real time affect and
retrospective evaluations of simulated queues. Working paper, Duke University.
Cheng, Q., Guo, J., & Ling, S. (2016). Fuzzy importance-performance analysis of visitor
satisfaction for theme park: the case of Fantawild Adventure in Taiwan, China.
Current Issues in Tourism, 19(9), 895-912.
Cheung, M. Y., Luo, C., Sia, C. L., & Chen, H. (2009). Credibility of electronic word-of-
mouth: Informational and normative determinants of on-line consumer
recommendations. International Journal of Electronic Commerce, 13(4), 9-38.
Chu, L., Hung, F.Y, Cheng, Y.L. (2014). Analysis and Simulation of Theme Park Queuing
System. Tenth International Conference on Intelligent Information Hiding and
Multimedia Signal Processing, 9-12.
Clavé, S.A. (2007). The global theme park industry. Cambridge, MA, CABI, 2007.
Crompton, J. L., & Van Doren, C. (1976). Amusement parks, theme parks, and municipal
leisure services: Contrasts in adaption to cultural change. Journal of Physical
Education and Recreation, 47(8), 42-46.
Cutler, S. Q., & Carmichael, B. A. (2010). The dimensions of the tourist experience. In J.R.
Ritchie, p. Lugosi, & M. Morgan (Eds.), The tourism and leisure experience:
Consumer and managerial perspectives (3-26). Bristol, UK: Channel View
Publications.
Fotiadis, A. K. (2016). Modifying and applying time and cost blocks: The case of E-Da
theme park, Kaohsiung, Taiwan. Tourism Management, 5, 434-442.
Fu, X., Kang, J., & Tasci, A.D.A. (2017). Self-congruity and flow as antecedents of attitude
and loyalty towards a theme park brand. Journal of Travel & Tourism Marketing,
34(9): 1261-1273.
Geissler, G. L., & Rucks, C. T. (2011). The overall theme park experience: A visitor
satisfaction tracking study. Journal of Vacation Marketing, 17(2), 127-138.
Godovykh, M. (2019). Event experience. Ekaterinburg, RU: Ridero.

25
Harrison, M. P., & Beatty, S. E. (2011). Anticipating a service experience. Journal of
Business Research, 64(6), 579–585.
Hsing Ping, K., & Kang Li, W. (2014). The Influence of Service Quality on Customer
Satisfaction in Theme Parks Design of Taiwan. Advanced Materials Research, 1008,
1543-1547.
Huber, E., & Stephens, J. D. (1993). Political parties and public pensions: A quantitative
analysis. Acta Sociologica, 36(4), 309-325.
Jensen, J. M. (2007). An empirical investigation of the relationships between hygiene factors,
motivators, satisfaction, and response among visitors to zoos and aquaria. Tourism
Review International, 11(3), 307-316.
Jin, N., Lee, S., & Lee, H. (2015). The effect of experience quality on perceived value,
satisfaction, image and behavioral intention of water park patrons: New versus repeat
visitors. International Journal of Tourism Research, 17(1), 82-95.
Jin, N., Line, N. D., & Merkebu, J. (2016). The effects of image and price fairness: A
consideration of delight and loyalty in the waterpark industry. International Journal
of Contemporary Hospitality Management, 28(9), 1895-1914.
Kahneman, D., Fredrickson, B. L., Schreiber, C. A., & Redelmeier, D. A. (1993). When more
pain is preferred to less: Adding a better end. Psychological Science, 4(6), 401-405.
Kahneman, D., Wakker, P. P., & Sarin, R. (1997). Back to Bentham? Explorations of
Experienced Utility. The Quarterly Journal of Economics, 112(2), 375-406.
Kao, Y., Huang, L., & Wu, C. (2008). Effects of Theatrical Elements on Experiential Quality
and Loyalty Intentions for Theme Parks. Asia Pacific Journal of Tourism Research,
13(2), 163-174.
Kerstetter, D., & Cho, M. H. (2004). Prior knowledge, credibility and information
search. Annals of Tourism Research, 31(4), 961-985.
Kim, D.Y., Lehto, X.Y., & Morrison, A.M. (2007). Gender differences in online travel
information search: Implications for marketing communications on the internet.
Tourism Management, 28(2), 423-433.
King, M. J. (2002). The Theme Park: Aspects of Experience in a Four-Dimensional
Landscape. Material Culture, 34(2), 1-15.

26
Koenig-Lewis, N., & Palmer, A. (2014). The effects of anticipatory emotions on service
satisfaction and behavioral intention. Journal of Services Marketing, 28(6), 437–451.
Laaksonen, P. (1994). Consumer involvement: Concepts and research. London, GB:
Routledge.
Larson, R. C., Larson, B. M., & Katz, K. L. (1991). Prescription for waiting–in line blues:
Entertain, enlighten and engage. Sloan Management Review, 32(2), 44-55.
Lee, W. & Lambert, C.U. (2005). The effect of waiting time and affective reactions on
customers’ evaluation of service quality in a cafeteria. Journal of Foodservice
Business Research, 8 (2), 19-37.
Lehto, X. Y., Kim, D. Y., & Morrison, A. M. (2006). The effect of prior destination
experience on online information search behaviour. Tourism and Hospitality
Research, 6(2), 160-178.
Lewison, M. (2017). Demand-based pricing in the US theme park industry. International
Journal of Leisure and Tourism Marketing, 5 (3), 271-293.
Li, W. L. (2010, December). Impact of waiting time on tourists satisfaction in a theme park:
An empirical investigation. In 2010 IEEE International Conference on Industrial
Engineering and Engineering Management (434-437).
Maister, D. H. (1985). The Psychology of Waiting Lines. In J.A. Czepiel (Ed.), The service
encounter (pp. 113-123). Lexington, MA: Lexington Books, 113-123.
Manthiou, A., Kang, J., Chiang, L., & Tang, L. (. (2016). Investigating the Effects of
Memorable Experiences: An Extended Model of Script Theory. Journal of Travel &
Tourism Marketing, 33(3), 362-379.
Milman A, Li X, Wang Y, Yu Q. (2012). Examining the guest experience in themed
amusement parks: Preliminary evidence from China. Journal of Vacation Marketing,
18(4), 313-325.
Milman, A. (2009). Evaluating the guest experience at theme parks: an empirical
investigation of key attributes. International Journal of Tourism Research, 11(4),
373-387.

27
Milman, A., & Tasci, A. D. (2018). Exploring the experiential and sociodemographic drivers
of satisfaction and loyalty in the theme park context. Journal of Destination
Marketing & Management, 8, 385-395.
Mittal, V., Katrichis, J. M., & Kumar, P. (2001). Attribute performance and customer
satisfaction over time: evidence from two field studies. Journal of Services
Marketing, 15(5), 343-356.
Morewedge, C. K. (2016). Utility: Anticipated, Experienced, and Remembered. In G. Keren
and G. Wu (Eds.), Wiley Blackwell handbook of judgment and decision making (pp.
295-330). Malden, MA: Blackwell Press.
Oliver, R. L. (1997). Satisfaction: A behavioral perspective on the consumer. New York, NY:
McGraw-Hill.
Ott, R.L., & Longnecker, M.T. (2010). An introduction to statistical methods and data
analysis. Boston, MA: Brooks/Cole Publishing.
Pan, H., Bahja, F., & Cobanoglu, C. (2018). Analysis of U.S. theme park selection and
international implications. Journal of Transnational Management, 23(1), 22-38.
Petrick, J. F. (2002). Development of a multi-dimensional scale for measuring the perceived
value of a service. Journal of Leisure Research, 34(2), 119-134.
Pine, B.J. & Gilmore, J.H. (2011). The experience economy: Work is theater and every
business is a stage. Boston, MA: Harvard Business School Press.
Rose, N.A. & Parsons E.C.M (2019). The Case Against Marine Mammals In Captivity. (5th
edition). Washington, DC: Animal Welfare Institute and World Animal Protection.
Retrieved on May 31, 2019, from
https://d31j74p4lpxrfp.cloudfront.net/sites/default/files/ca_-
_en_files/cammic_5th_edition_2019_final_lo_rez_-_canada.pdf
Rubin, J. (ed.) (2016). 2015 Theme Index: The Global Attractions Attendance Report.
Themed Entertainment Association/Economics Research Associates. Retrieved on
10/14/16 from http://www.aecom.com/content/wp-
content/uploads/2016/05/2015_Theme_Index__Museum_Index.pdf
Rubin, Judith (ed.) (2018). 2017 Theme Index: The Global Attractions Attendance Report.
Themed Entertainment Association/Economics Research Associates. Retrieved on
6/23/18 from http://www.teaconnect.org/images/files/TEA_268_653730_180517.pdf

28
Rubin, Judith (ed.) (2019). 2018 Theme Index: The Global Attractions Attendance Report.
Themed Entertainment Association/Economics Research Associates. Retrieved on
11/8/19 from http://www.teaconnect.org/images/files/328_381804_190528.pdf
Ryan, C., Yeh (Sam) Shih, S., & Tzung-Cheng, H. (2010). Theme parks and a structural
equation model of determinants of visitor satisfaction -Janfusan Fancyworld, Taiwan.
Journal of Vacation Marketing, 16(3), 185-199.
Sampson, H. (2018). 6 Top Theme Park Industry Developments of 2018. Skift. Published on
Dec 26, 2018. Retrieved on 5/31/2019 from https://skift.com/2018/12/26/6-top-theme-
park-industry-developments-of-2018/
Schmitt, B. (1999). Experiential marketing: how to get customers to sense, feel, think, act,
and relate to your company and brands. New York: Free Press.
Sharples, L. (2018). All Aboard for “Sam”: A New Anticipatory Conceptual Model for
Passenger Preconsumption in Cruise Tourism. Tourism in Marine Environments,
13(4), 243–251.
Sheth, J.N. (1977). Demographics in consumer behavior. Journal of Business Research, 5(2),
129-138.
Shiv, B., & Huber, J. (2000). The Impact of Anticipating Satisfaction on Consumer Choice.
Journal of Consumer Research, 27(2), 202–216.
Spinks, W., Lawley, M., & Richins, H. (2005). Satisfaction with Sunshine Coast tourist
attractions: the influence of individual visitor characteristics. Journal of Tourism
Studies, 16(1), 12-24.
Swanson, K.K. & Horridge, P.E. (2004). A structural model for souvenir consumption, travel
activities and tourist demographics. Journal of Travel Research, 42(4), 372-380.
Tasci, A. D. (2017). A quest for destination loyalty by profiling loyal travelers. Journal of
Destination Marketing & Management, 6(3), 207-220.
Tasci, A.D.A. and Boylu, Y. (2010). Cultural comparison of tourists’ safety perception in
relation to trip satisfaction. International Journal of Tourism Research, 12, 179-192.
Tasci, A.D.A. and Knutson, B.J. (2004). An argument for providing authenticity and
familiarity in tourism destinations. Journal of Hospitality Marketing & Management,
11(1), 85-109.
29
Tauber, E.M. (1988). Brand Leverage: Strategy for Growth in a Cost Controlled World.
Journal of Advertising Research, 28(August/September), 26-30.
Technavio (2018). Global amusement park market 2018-2022. Retrieved on 11/6/2018 from
https://www.technavio.com/report/global-amusement-park-market-analysis-share-
2018?utm_source=promotional%20interlinks&utm_medium=remarketing_week_12&
utm_campaign=re-marketing
Torres, E., Milman, A. & Park, S. (2018). Delighted or outraged? Uncovering key drivers of
exceedingly positive and negative theme park guest experiences. Journal of
Hospitality and Tourism Insights. 1 (1), 65-85.
Trinh, T.T., Ryan, C. and Cave, J. (2014). Souvenir sellers and perceptions of authenticity –
the retailers of Hôi An, Vietnam. Tourism Management, 45(1), 275-283.
Walt Disney World (2019a). Let My Disney Experience Be Your Guide. Retrieved on
6/1/2019 from https://disneyworld.disney.go.com/en-eu/plan/my-disney-experience/
Walt Disney World (2019b). Bibbidi Bobbidi Boutique - Magic Kingdom. Retrieved on
11/1/2019 from https://disneyworld.disney.go.com/en-eu/shops/magic-kingdom/bibbidi-
bobbidi-boutique-park/
Wilkins, H. (2011). Souvenirs: what and why we buy. Journal of Travel Research, 50(3),
239-247.
Wirtz, D., Kruger, J., Scollon, C. N., & Diener, E. (2003). What to do on spring break?
The role of predicted, on-line, and remembered experience in future choice.
Psychological Science, 14(5), 520-524.
Wolin, L.D., & Korgaonkar, P. (2003). Web advertising: Gender differences in beliefs,
attitudes and behavior. Internet Research: Electronic Networking Applications and
Policy, 13, 375-385.
Yoon, Y., & Uysal, M. (2005). An examination of the effects of motivation and satisfaction
on destination loyalty: A structural model. Tourism Management, 26(1), 45-56.
Zaichkowsky, J.L. (1985). Familiarity: Product Use, Involvement or Expertise? In E. C.
Hirschman and M. B. Holbrook (Eds.), Advances in Consumer Research Volume 12
(296-299). Provo, UT: Association for Consumer Research.


![Explaining the Difference between the 2011 Census ...Type text] Date: 16 July 2012 Coverage: England and Wales Theme: Population Explaining the Difference between the 2011 Census Estimates](https://static.fdocuments.in/doc/165x107/5af9f75e7f8b9a2d5d8da490/explaining-the-difference-between-the-2011-census-type-text-date-16-july-2012.jpg)