The$Makingof$the$Fittest:$$ The Making of the Fittest...
12
The Making of the Fittest: Natural Selection and Adaptation The Making of the Fittest: Natural Selection and Adaptation The Virtual Stickleback Evolution Lab Published January 2013 www.BioInteractive.org Page 1 of 12 ADVANCED WORKSHEET TEACHER MATERIALS The Making of the Fittest: Evolving Switches, Evolving Bodies THE VIRTUAL STICKLEBACK EVOLUTION LAB OVERVIEW This worksheet was developed to support use of The Virtual Stickleback Evolution Lab. It is meant to provide students with structure and guidance as they perform the tutorials, experiments, and quizzes in the lab. LEARNING OBJECTIVES The lab emphasizes quantitative measurement of phenotypic diversity in related stickleback populations and encourages inquiry into the role of natural selection and the underlying genetic mechanisms. After completing the lab, students will be able to: • Assess phenotypic diversity among stickleback populations, focusing on the structure of the pelvis. • Formulate hypotheses about how environments, each with potentially different predators, food sources, or resource limitations, apply different selective pressures on the shape of animal bodies. • Examine fossilized specimens and identify the same trait as seen in fish from living populations. • Learn what the fossil record can tell us about phenotypic change over time. • Explain how natural selection can drive the evolution of complex traits like the size and shape of skeletons. • Perform simple statistical calculations like the chi-square test to gauge confidence in conclusions drawn from population data. KEY TERMS Stickleback, fossil, evolution, natural selection, variation, adaptation APPROPRIATE LEVELS The Virtual Stickleback Evolution Lab is appropriate for high school biology as an excellent companion to an evolution unit. Because the trait under study is fish pelvic morphology, the lab can also be used for lessons on vertebrate form and function. In an ecology unit, the lab could be used to illustrate predator-prey relationships and environmental selection pressures. The sections on graphing, data analysis, and statistical significance make the lab a good fit for addressing the "science as a process" or "nature of science" aspects of the curriculum. PRIOR KNOWLEDGE Students should know that some traits provide organisms with a greater chance to survive and reproduce. Inherited traits that are advantageous in a particular environment are more likely to be passed on from generation to generation. TEACHING TIPS • A link on the opening “Introduction” page of the virtual lab directs teachers to information about how to use the lab in the classroom. This information contains notes to teachers, a description of the virtual lab, links to key concepts, connections to various curricula, and time requirements for classroom implementation. • Before doing the virtual lab, students would benefit from watching the HHMI short film The Making of the Fittest: Evolving Switches, Evolving Bodies, which is available at http://www.biointeractive.org/shortfilms/index.html. • Students should complete specific sections of the virtual lab worksheet assigned by their teachers as they go through the lab. Teachers may choose to grade the worksheets or just use them to gauge students’ understanding of the key concepts presented in the lab.
Transcript of The$Makingof$the$Fittest:$$ The Making of the Fittest...

The Making of the Fittest: Natural Selection and Adaptation The Making of the Fittest: Natural Selection and Adaptation
The Virtual Stickleback Evolution Lab Published January 2013 www.BioInteractive.org Page 1 of 12
ADVANCED WORKSHEET TEACHER MATERIALS
The Making of the Fittest: Evolving Switches, Evolving Bodies
THE VIRTUAL STICKLEBACK EVOLUTION LAB
OVERVIEW This worksheet was developed to support use of The Virtual Stickleback Evolution Lab. It is meant to provide students with structure and guidance as they perform the tutorials, experiments, and quizzes in the lab.
LEARNING OBJECTIVES The lab emphasizes quantitative measurement of phenotypic diversity in related stickleback populations and encourages inquiry into the role of natural selection and the underlying genetic mechanisms.
After completing the lab, students will be able to: • Assess phenotypic diversity among stickleback populations, focusing on the structure of the pelvis. • Formulate hypotheses about how environments, each with potentially different predators, food sources, or
resource limitations, apply different selective pressures on the shape of animal bodies. • Examine fossilized specimens and identify the same trait as seen in fish from living populations. • Learn what the fossil record can tell us about phenotypic change over time. • Explain how natural selection can drive the evolution of complex traits like the size and shape of skeletons. • Perform simple statistical calculations like the chi-square test to gauge confidence in conclusions drawn from
population data.
KEY TERMS Stickleback, fossil, evolution, natural selection, variation, adaptation
APPROPRIATE LEVELS The Virtual Stickleback Evolution Lab is appropriate for high school biology as an excellent companion to an evolution unit. Because the trait under study is fish pelvic morphology, the lab can also be used for lessons on vertebrate form and function. In an ecology unit, the lab could be used to illustrate predator-prey relationships and environmental selection pressures. The sections on graphing, data analysis, and statistical significance make the lab a good fit for addressing the "science as a process" or "nature of science" aspects of the curriculum.
PRIOR KNOWLEDGE Students should know that some traits provide organisms with a greater chance to survive and reproduce. Inherited traits that are advantageous in a particular environment are more likely to be passed on from generation to generation.
TEACHING TIPS • A link on the opening “Introduction” page of the virtual lab directs teachers to information about how to use
the lab in the classroom. This information contains notes to teachers, a description of the virtual lab, links to key concepts, connections to various curricula, and time requirements for classroom implementation.
• Before doing the virtual lab, students would benefit from watching the HHMI short film The Making of the Fittest: Evolving Switches, Evolving Bodies, which is available at http://www.biointeractive.org/shortfilms/index.html.
• Students should complete specific sections of the virtual lab worksheet assigned by their teachers as they go through the lab. Teachers may choose to grade the worksheets or just use them to gauge students’ understanding of the key concepts presented in the lab.
www.BioInteractive.org Page 2 of 12
ADVANCED WORKSHEET TEACHER MATERIALS
The Making of the Fittest: Evolving Switches, Evolving Bodies
ANSWER KEY INTRODUCTION 1. Define model organism.
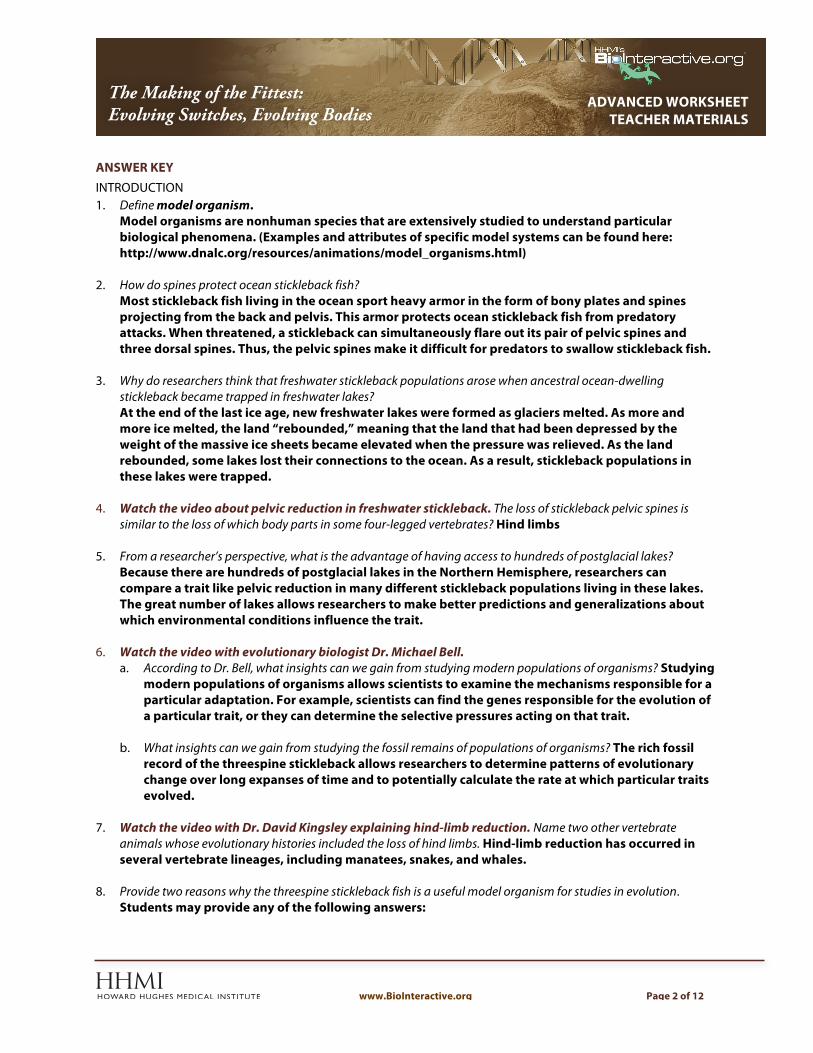
Model organisms are nonhuman species that are extensively studied to understand particular biological phenomena. (Examples and attributes of specific model systems can be found here: http://www.dnalc.org/resources/animations/model_organisms.html)
2. How do spines protect ocean stickleback fish? Most stickleback fish living in the ocean sport heavy armor in the form of bony plates and spines projecting from the back and pelvis. This armor protects ocean stickleback fish from predatory attacks. When threatened, a stickleback can simultaneously flare out its pair of pelvic spines and three dorsal spines. Thus, the pelvic spines make it difficult for predators to swallow stickleback fish.
3. Why do researchers think that freshwater stickleback populations arose when ancestral ocean-dwelling
stickleback became trapped in freshwater lakes? At the end of the last ice age, new freshwater lakes were formed as glaciers melted. As more and more ice melted, the land “rebounded,” meaning that the land that had been depressed by the weight of the massive ice sheets became elevated when the pressure was relieved. As the land rebounded, some lakes lost their connections to the ocean. As a result, stickleback populations in these lakes were trapped.
4. Watch the video about pelvic reduction in freshwater stickleback. The loss of stickleback pelvic spines is
similar to the loss of which body parts in some four-legged vertebrates? Hind limbs
5. From a researcher’s perspective, what is the advantage of having access to hundreds of postglacial lakes? Because there are hundreds of postglacial lakes in the Northern Hemisphere, researchers can compare a trait like pelvic reduction in many different stickleback populations living in these lakes. The great number of lakes allows researchers to make better predictions and generalizations about which environmental conditions influence the trait.
6. Watch the video with evolutionary biologist Dr. Michael Bell.
a. According to Dr. Bell, what insights can we gain from studying modern populations of organisms? Studying modern populations of organisms allows scientists to examine the mechanisms responsible for a particular adaptation. For example, scientists can find the genes responsible for the evolution of a particular trait, or they can determine the selective pressures acting on that trait.
b. What insights can we gain from studying the fossil remains of populations of organisms? The rich fossil record of the threespine stickleback allows researchers to determine patterns of evolutionary change over long expanses of time and to potentially calculate the rate at which particular traits evolved.
7. Watch the video with Dr. David Kingsley explaining hind-limb reduction. Name two other vertebrate
animals whose evolutionary histories included the loss of hind limbs. Hind-limb reduction has occurred in several vertebrate lineages, including manatees, snakes, and whales.
8. Provide two reasons why the threespine stickleback fish is a useful model organism for studies in evolution. Students may provide any of the following answers:
www.BioInteractive.org Page 3 of 12
ADVANCED WORKSHEET TEACHER MATERIALS
The Making of the Fittest: Evolving Switches, Evolving Bodies
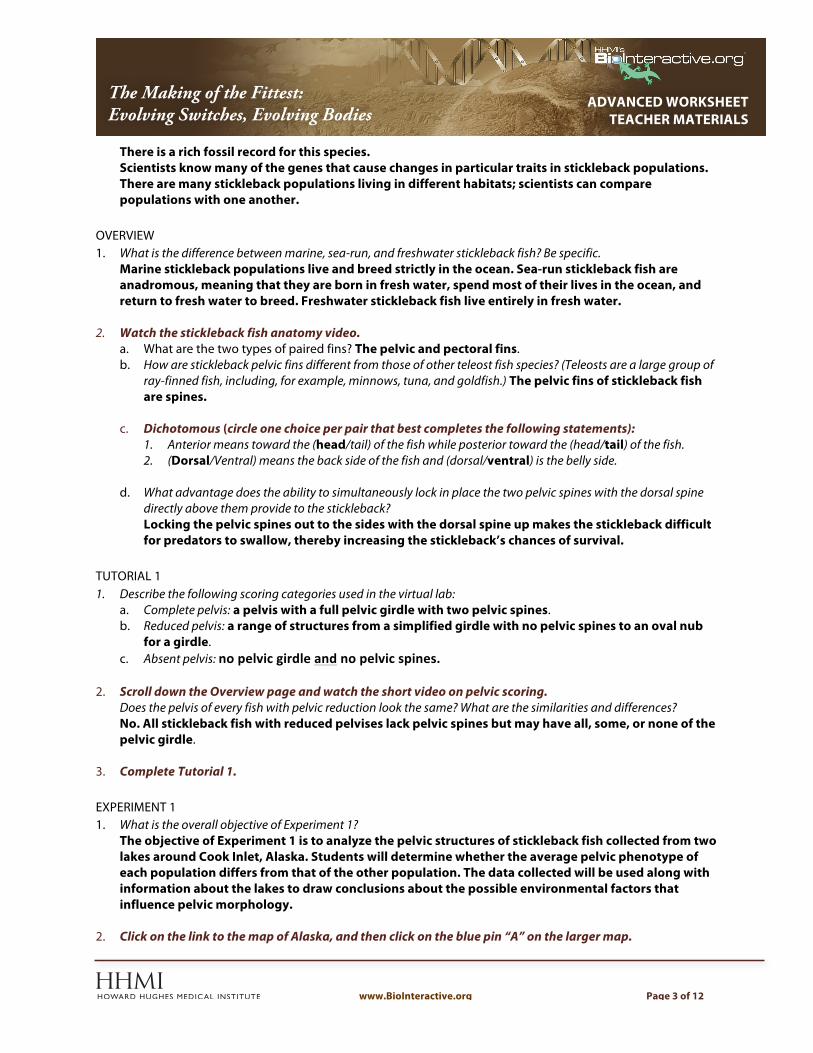
There is a rich fossil record for this species. Scientists know many of the genes that cause changes in particular traits in stickleback populations. There are many stickleback populations living in different habitats; scientists can compare populations with one another.
OVERVIEW 1. What is the difference between marine, sea-run, and freshwater stickleback fish? Be specific.
Marine stickleback populations live and breed strictly in the ocean. Sea-run stickleback fish are anadromous, meaning that they are born in fresh water, spend most of their lives in the ocean, and return to fresh water to breed. Freshwater stickleback fish live entirely in fresh water.
2. Watch the stickleback fish anatomy video. a. What are the two types of paired fins? The pelvic and pectoral fins. b. How are stickleback pelvic fins different from those of other teleost fish species? (Teleosts are a large group of
ray-finned fish, including, for example, minnows, tuna, and goldfish.) The pelvic fins of stickleback fish are spines.
c. Dichotomous (circle one choice per pair that best completes the following statements): 1. Anterior means toward the (head/tail) of the fish while posterior toward the (head/tail) of the fish. 2. (Dorsal/Ventral) means the back side of the fish and (dorsal/ventral) is the belly side.
d. What advantage does the ability to simultaneously lock in place the two pelvic spines with the dorsal spine
directly above them provide to the stickleback? Locking the pelvic spines out to the sides with the dorsal spine up makes the stickleback difficult for predators to swallow, thereby increasing the stickleback’s chances of survival.
TUTORIAL 1 1. Describe the following scoring categories used in the virtual lab:
a. Complete pelvis: a pelvis with a full pelvic girdle with two pelvic spines. b. Reduced pelvis: a range of structures from a simplified girdle with no pelvic spines to an oval nub
for a girdle. c. Absent pelvis: no pelvic girdle and no pelvic spines.
2. Scroll down the Overview page and watch the short video on pelvic scoring.
Does the pelvis of every fish with pelvic reduction look the same? What are the similarities and differences? No. All stickleback fish with reduced pelvises lack pelvic spines but may have all, some, or none of the pelvic girdle.
3. Complete Tutorial 1.
EXPERIMENT 1 1. What is the overall objective of Experiment 1?
The objective of Experiment 1 is to analyze the pelvic structures of stickleback fish collected from two lakes around Cook Inlet, Alaska. Students will determine whether the average pelvic phenotype of each population differs from that of the other population. The data collected will be used along with information about the lakes to draw conclusions about the possible environmental factors that influence pelvic morphology.
2. Click on the link to the map of Alaska, and then click on the blue pin “A” on the larger map.

www.BioInteractive.org Page 4 of 12
ADVANCED WORKSHEET TEACHER MATERIALS
The Making of the Fittest: Evolving Switches, Evolving Bodies
Which lake is located between Bear Paw Lake and Frog Lake just to the north? Prator Lake
3. In a population, what happens to organisms that are better adapted to the environment in which they live? At the population level, individuals that are better adapted for a particular environment are more likely to live longer and reproduce more and pass on their genetic variants to the next generation. Over many generations, these genetic variants and the associated traits increase in frequency in the population.
4. Watch the short video on how postglacial lakes form. What do researchers think is one of the selective pressures for the complete pelvis trait in ocean-dwelling threespine stickleback fish? In the ocean, a threespine stickleback with a complete pelvis is less likely to be eaten by larger fish that prey on it. Thus, the presence of predatory fish in the ocean is likely to be one of the factors that favor stickleback fish having a complete pelvis.
5. Watch the short video on the Cook Islet scenery.
What features in the various habitats might be selecting for either a reduced or complete pelvis? Student answers will vary. Students may mention any of the following: the presence or absence of other types of predators; the mineral content of the water (since calcium and other minerals are needed to build bones); and the presence or absence of vegetation that may allow stickleback fish to hide from predators.
6. In the virtual lab window, complete Part 1: Staining the Fish. 7. Why do you think it is important to empty the used stain, destaining solution, and water under a fume hood?
The hood has a built-in vacuum, which helps limit a scientist’s exposure to potentially toxic or hazardous fumes from the different chemicals used in the staining procedure.
8. In the virtual lab window, proceed to Part 2: Scoring the Fish. 9. In the window on the right, click on the Random Sampling link. What is a population?
A population consists of all the individuals of a single species that live in a limited geographic region, such as all the stickleback fish in a lake.
10. Why are random samples used to study populations?
In most cases it would take too much time and money to study all individuals in a population. As a result, scientists study randomly collected subsets of individuals from a population, or random samples. Scientists study random samples to estimate properties of that population and to infer conclusions about that population as a whole.
11. What is one advantage of studying larger-sized samples?
Larger samples should be more representative of the population as a whole than smaller samples. 12. Give an example of sampling bias.
Answers will vary. One example of sampling bias would be that if researchers collected fish in shallow water simply because it was easier to place traps there, they might miss individuals living in deeper water that have different traits because of different predators there. Another example would be that by using traps to catch fish, you might only get individuals that are more daring or inquisitive, and if you planned to study behavior, this sample would be biased toward more bold individuals than is representative of the population as a whole.
13. Watch the video of Dr. Bell explaining sampling in Bear Paw Lake.

www.BioInteractive.org Page 5 of 12
ADVANCED WORKSHEET TEACHER MATERIALS
The Making of the Fittest: Evolving Switches, Evolving Bodies
a. Why is variation in a population critical to evolution? Variation in a population is critical to evolution because natural selection will act on that variation by favoring individuals with some traits and not others.
b. From his 20 years of studying Bear Paw Lake, is there evidence that stickleback pelvic structures have changed in this population within this time period? No
c. Is Bear Paw Lake similar to other lakes Dr. Bell has studied?
The Bear Paw Lake stickleback population is very different from most Alaskan stickleback lake populations that Dr. Bell has studied.
14. Complete Part 1 of the lab in the window on the left. 15. Why is it important that the labels included in the specimen jars be made of special paper that does not
disintegrate in alcohol over time? The labels record critical information about the specimens, such as the location (e.g., “Bear Paw Lake”) and date of collection. If the label disintegrates in the jar (the fish are stored in 50% isopropyl alcohol, which disintegrates most types of paper), scientists would not know what population they are studying, and the data they collect on this sample would then be useless.
16. Examine the pelvic score data you just collected. Does pelvic phenotype differ between Bear Paw Lake and Frog
Lake fish? Explain. Yes, it appears that Bear Paw Lake contains mostly stickleback fish that lack pelvic spines, and Frog Lake contains stickleback fish that have pelvic spines.
17. Complete the graphing exercise as instructed by your teacher. 18. After graphing, verify your data. How do your data compare to those obtained by Dr. Bell’s lab?
Answers will vary, but if students scored the fish accurately, their data should be fairly similar to Dr. Bell’s data.
19. Complete Experiment 1 Quiz. Take time to read the explanation for each correct choice provided
following each question. 20. Explain why the stickleback fish in Frog Lake are more similar to ocean and sea-run stickleback than they are to
the stickleback fish in Bear Paw Lake. Fish in marine and sea-run populations have complete pelvises; the pelvic spines protect stickleback fish from larger fish that prey on them in the ocean. Most stickleback fish in Bear Paw Lake have either a reduced or absent pelvis, whereas those in Frog Lake have a complete pelvis. Thus, the stickleback population in Frog Lake is more similar to marine and sea-run stickleback populations.
21. In addition to predators, can you think of other environmental factors that might be responsible for the
differences between Bear Paw Lake and Frog Lake stickleback populations? How would you test your prediction? Answers will vary. For example, students could mention fresh water is not as rich in calcium and other minerals needed to form pelvic spines. Students could test this prediction by measuring the mineral content of freshwater and comparing it to that of ocean water. Another example would be that unlike the open ocean, freshwater lakes have more vegetation and more places where stickleback can hide, in which case having less armor may make stickleback more agile and better able to quickly dart into hiding places. Students will come up with other ideas.
22. Upon completion of the quiz, click on Experiment 1 Analysis.

www.BioInteractive.org Page 6 of 12
ADVANCED WORKSHEET TEACHER MATERIALS
The Making of the Fittest: Evolving Switches, Evolving Bodies
23. In this chi-square analysis, what is your null hypothesis? The null hypothesis is that a random sample of stickleback from a population should contain roughly the same number of individuals with and without pelvic spines.
24. Complete the following tables as you perform the chi-square calculations in the lab.
Bear Paw Lake Phenotype Observed (o) Expected (e) (o-e) (o-e)2 (o-e)2/e
Pelvic Spines Present 0 10 10 100 10
Pelvic Spines Absent 20 10 10 100 10
Total = 20 Total = 20 χ2 = 20
Frog Lake
Phenotype Observed (o) Expected (e) (o-e) (o-e)2 (o-e)2/e Pelvic Spines
Present 0 10 10 100 10
Pelvic Spines Absent 20 10 10 100 10
Total = 20 Total = 20 χ2 = 20
Morvoro Lake
Phenotype Observed (o) Expected (e) (o-e) (o-e)2 (o-e)2/e Pelvic Spines
Present 8 10 2 4 0.4
Pelvic Spines Absent 12 10 2 4 0.4
Total = 20 Total = 20 χ2 = 0.8
25. For each lake’s chi-square calculation, how many degrees of freedom are there? df=1
How did you arrive at this number? df = Number of phenotypes – 1 = 2 − 1 = 1
26. What are the p values for each lake? a. Bear Paw Lake 0.01 b. Frog Lake 0.01 c. Morvoro Lake 0.5
27. Do you reject or fail to reject your null hypothesis for each lake?
a. Bear Paw Lake Reject b. Frog Lake Reject c. Morvoro Lake Fail to reject

www.BioInteractive.org Page 7 of 12
ADVANCED WORKSHEET TEACHER MATERIALS
The Making of the Fittest: Evolving Switches, Evolving Bodies
28. Complete the Chi-Square Analysis Quiz. Take time to read the explanation for each correct choice provided following each question.
29. Explain what it means to reject the null hypothesis. The null hypothesis was that there would be a roughly equal number of fish with and without pelvic spines (an expectation of 50:50). If this null hypothesis can be rejected that means that any difference between the observed data (the data you collected) and the expected data distribution of 50:50 is unlikely to be due to chance.
30. Explain what it means to fail to reject the null hypothesis. If the null hypothesis cannot be rejected, the chi-square test was unable to detect a difference between the observed data and expected data.
31. Explain the difference between the results of the chi-square calculations for Bear Paw Lake and Morvoro
Lake. Our null hypothesis for each lake was that we expected about equal frequencies of stickleback with and without pelvic spines. The null hypothesis was rejected for the Bear Paw Lake population. This test result together with our data tells us that, in this population, there are more fish with pelvic reduction than fish with pelvic spines. Further studies can be conducted to determine if there are ecological or other explanations for this pattern. In Morvoro Lake, we cannot reject the null hypothesis. This may or may not mean that the null hypothesis is true.
32. Proceed to Tutorial 2. TUTORIAL 2 1. What score would you assign to a fossil specimen that has only one pelvic spine visible? Complete
2. Some stickleback fossils show no signs of pelvic structures. What are some possible sources of error associated
with scoring a stickleback fossil “absent”? Animals that are preserved as fossils may have been damaged by decay or by physical processes. As a result, certain body structures may have been lost and not be visible in the fossil.
3. Watch the video about scoring stickleback fish fossils. 4. Complete Tutorial 2.
EXPERIMENT 2 1. What is the overall objective of Experiment 2? Explain what the information collected in Experiment 2 will allow
you to estimate. In this experiment, I will characterize the pelvic structures of fossil stickleback fish from the Truckee Formation in Nevada—the site of a lake that existed about 10 million years ago. The fossils I will analyze represent fish that lived in the lake during a 15,000-year period. The data collected in this experiment will allow me to estimate the rate of change in the frequency of the complete pelvic phenotype over time for this population.
2. Watch the short video on the Truckee Formation in Nevada.
What does each sedimentary rock layer of the Truckee Formation represent? Each rock layer presents about a year of deposition. When the Truckee Formation was a lake, diatoms (microscopic algae) died each year, and their skeletal remains sank to the bottom. There, they mixed with clay and silt, forming annual layers of thick sediments. Over time, the lake dried up and these

www.BioInteractive.org Page 8 of 12
ADVANCED WORKSHEET TEACHER MATERIALS
The Making of the Fittest: Evolving Switches, Evolving Bodies
sediments became sedimentary rock layers that are like growth rings in a tree. (Note that in this la, students examine fossils from rock samples spaced about 3,000 years apart.)
3. What is one type of information that researchers can gain from fossils that they cannot get from living
populations? Studying fossils can tell us about long-term patterns (i.e., on the time scale of thousands to millions of years) of evolutionary change and possibly allow researchers to calculate the rate of change.
4. Begin the Experiment in the window on the left. Watch the video showing Dr. Bell preparing a fossil. 5. In the virtual lab window, complete Part 1: Preparing Fossils. 6. Proceed to Part 2: Scoring Fossils.
In this virtual lab, you will graph fossil data from six rock layers (your data come from two of these layers). Approximately how many years apart are any two adjacent samples? For this exercise, we graphed and analyzed data from six rock layers, each one spaced 3,000 years from the next, for a total of 15,000 years. (Note that students only scored pelvic structures of fossils from layers 2 and 5. They were provided with the scores of fossils from layers 1, 3, 4, and 6, which were used to generate the graph.)
7. You collected data on pelvic structures using fossils from rock layers 2 and 5. Approximately how many years of
deposition separate these two layers? 9,000 years 8. Which layer is older, 2 or 5? Explain your answer.
Layer 2 is older than 5. The layers are numbered from oldest (1) on the bottom to youngest on the top (6); therefore, 2 is older than 5.
9. Complete Part 2 of the lab in the window on the left. 10. When you obtained your pelvic phenotype totals, do the fossils in layer 2 differ from those in layer 5? Explain how.
Yes, it appears that pelvic spines were more prevalent in fossil stickleback from rock layer 2 than from rock layer 5. Layer 5 contained mostly fish without pelvic spines.
11. Complete the graphing Experiment as instructed by your teacher. 12. After graphing, verify your data. How do your data compare to those collected by Dr. Bell and colleagues?
Answers will vary. An example of a response might be: My results are exactly the same as the results Dr. Bell’s lab obtained.
13. Complete Experiment 2 Quiz. Take time to read the explanations for each correct choice provided
following each question. 14. What can be inferred about the presence or absence of predatory fish when the Truckee Formation was a lake?
Explain the evidence for your inference. Because the frequency of fossil stickleback with pelvic spines decreased over the 15,000 year time span, we can infer that pelvic spines did not provide an advantage to fish that had them. Because pelvic spines in living threespine stickleback populations provide a defense against large predatory fish, we can infer that there probably were no predatory fish in the ancient lake. If there were large predatory fish in the ancient lake, one should be able to find their fossils. Dr. Michael A. Bell and colleagues have found fossils of other fishes in the quarry, but most of them were small species that could not eat stickleback fish.
15. After completing the quiz, click on Experiment 2 Analysis. 16. Complete the tables below as you perform the rate calculations. (The link to the instructions is very helpful.)

www.BioInteractive.org Page 9 of 12
ADVANCED WORKSHEET TEACHER MATERIALS
The Making of the Fittest: Evolving Switches, Evolving Bodies
Sample Layer Number of Fish with a Complete Pelvis
Total Number of Fish Sampled
Relative Frequency of Complete Pelvis Trait in
Population Sampled 1 20 20 1.00 2 18 20 0.90 3 3 20 0.15 4 1 20 0.05 5 0 20 0.00 6 0 20 0.00
Time Decrease in Percentage of Complete
Pelvis Trait per Thousand Years (Rate of Change)
First 3,000 years (Layer 1 to Layer 2)
-0.033 = -3.3%
Next 3,000 years (Layer 2 to Layer 3)
-0.25 = -25%
Next 3,000 years (Layer 3 to Layer 4)
-0.033 = -3.3%
Next 3,000 years (Layer 4 to Layer 5)
-0.017 = -1.7%
Next 3,000 years (Layer 5 to Layer 6)
0.00
Total 15,000 years (Layer 1 to Layer 6)
-0.067 = -6.7%
17. What does it mean when the rate of change is a negative number?
A negative number indicates a decrease in frequency of individuals with the trait being studied. In this case, there was a decrease in the relative frequency of fossil fish with pelvic spines over time.
18. Complete the Analysis Quiz. Take time to read the explanation for each correct choice provided following each question.
19. Describe the trend in the data over time. The relative frequency of the presence of pelvic spines decreased over time. This decrease was rapid in the first 9,000 years and then slowly leveled off toward the end of the 15,000-year period, after which point no fish with a complete pelvis were found in the fossil record.
20. Why is it important to calculate the rate of change over time? Calculating rates of change in fossil fish can be used to infer some aspects of the evolution of traits in living fish. It is not usually possible to study the rates of change of traits in living populations because of the long time scale of most evolutionary processes.
21. In what ways is the change in the complete pelvis phenotype in the fossils from the Nevada lakebed similar to
what might have occurred in Bear Paw Lake from Experiment 1? The reduced pelvic phenotype has never been observed in marine and sea-run populations. Most stickleback fish in Bear Paw Lake have either a reduced or absent pelvis, suggesting that the frequency of the pelvic spine phenotype in Bear Paw decreased over time, just as the fossil data

www.BioInteractive.org Page 10 of 12
ADVANCED WORKSHEET TEACHER MATERIALS
The Making of the Fittest: Evolving Switches, Evolving Bodies
suggest happened in the ancient Nevada lake. We cannot study how the pelvic phenotype changed over time in Bear Paw Lake (because this event happened before researchers discovered this population), but we can study this change in the Nevada lake because it has been recorded in the rock layers.
22. Proceed to Experiment 3.
EXPERIMENT 3 1. What is the overall objective of Experiment 3?
In this experiment, I will analyze the reduced pelvis trait in more detail by scoring stickleback fish from two lake populations. We will focus on pelvic asymmetry: whether the reduced pelvis is consistently larger on one (the left or right) side in a given population.
2. What is one function of the Pitx1 gene? Pitx1 is a major gene involved in the development of the pelvic girdle and pelvic spines of stickleback fish and of the hind limbs of some four-legged terrestrial vertebrates.
3. Watch the video segment from the HHMI short film, “Evolving Switches, Evolving Bodies.”
a. What is the relationship between changes in body form, the process of development, and genes? Changes in the physical forms of all animals arise from changes in development. Because genes control development, changes in forms are ultimately due to changes in genes.
b. Why did Dr. Kingsley do genetic crosses with stickleback fish? Dr. Kingsley performed genetic crosses between marine and freshwater stickleback fish in order to pinpoint which gene(s) are responsible for pelvic reduction in freshwater fish.
4. In the virtual lab window, click on the blue gloves and perform Part 1: Staining the Fish (you can skip the
staining if you completed it in Experiment 1). Proceed to Part 2: Scoring Pelvic Asymmetry. Which one of the three pelvic phenotypes is analyzed in more detail in this Experiment? The reduced pelvis phenotype
5. What is the difference between left-biased and right-biased pelvic asymmetry?
When a pelvis is reduced, the remaining lateral pelvic vestiges are rarely the same length. After careful measurement, there are usually two outcomes: the pelvic vestige is larger on the left (left bias), or the pelvic vestige is larger on the right (right bias).
6. In the virtual lab window, complete Part 2: Scoring Pelvic Asymmetry. 7. Complete the graphing exercise as instructed by your teacher. 8. After graphing, verify your data. How do your data compare to those collected by Dr. Bell and colleagues?
Answers will vary. An example: My results are exactly the same as the results Dr. Bell’s lab obtained. 9. Complete Experiment 3 Quiz. Take time to read the explanation for each correct choice provided
following each question. 10. The pelvic asymmetry observed in stickleback fish from Bear Paw Lake and in Coyote Lake is biased toward which
side? Left 11. Based on previous research with mice, what do the findings on pelvic asymmetry from Bear Paw Lake and Coyote
Lake stickleback suggest about the genetic mechanisms underlying pelvic reduction?

www.BioInteractive.org Page 11 of 12
ADVANCED WORKSHEET TEACHER MATERIALS
The Making of the Fittest: Evolving Switches, Evolving Bodies
Experiments showed that mice lacking Pitx1 gene function did not develop complete hind limbs. These animals just had the remnants of a pelvis and hind limbs, and what was left of these structures was larger on the left than on the right side. Therefore, the observed left bias in Bear Paw and Coyote lake stickleback suggests that pelvic reduction in these two populations is associated with mutations that affect function of the same gene: Pitx1.
12. When you are finished with question 5 of the quiz, watch the video of Dr. Bell explaining his findings. (If
you have already clicked to the summary page, you can simply click the “back” arrow at the top of the computer window and see the link to this video.)
13. After completing the quiz, click on Experiment 3 Analysis. 14. For this chi-square analysis, what is the null hypothesis?
The null hypothesis is that in a given population with pelvic reduction, you would expect roughly an equal number of fish with left bias as fish with right bias.
15. Complete the following tables as you perform the chi-square calculations.
Bear Paw Lake Phenotype Observed (o) Expected (e) (o-e) (o-e)2 (o-e)2/e
Left Bias 18 10 8 64 6.4
Right Bias 2 10 8 64 6.4
Total = 20 Total = 20 χ2 = 12.8
Coyote Lake
Phenotype Observed (o) Expected (e) (o-e) (o-e)2 (o-e)2/e
Left Bias 20 10 10 100 10
Right Bias 0 10 10 100 10
Total = 20 Total = 20 χ2 = 20
16. For each lake’s chi-square calculation, how many degrees of freedom are there? df = 2-1 =1
17. What are the p values for each lake?
a. Bear Paw Lake 0.01 b. Coyote Lake 0.01
18. Do you reject or fail to reject your null hypothesis for each lake?
a. Bear Paw Lake Reject b. Coyote Lake Reject
19. Complete the Chi-Square Analysis Quiz. Take time to read the explanation for each correct choice following each question.
www.BioInteractive.org Page 12 of 12
ADVANCED WORKSHEET TEACHER MATERIALS
The Making of the Fittest: Evolving Switches, Evolving Bodies
20. What does it mean to reject the null hypothesis? Rejecting the null hypothesis indicates that the deviation between the observed and expected data is statistically significant.
21. Name two factors that could contribute to left bias in a stickleback with pelvic reduction.
Answers may vary. A biological factor, such as mutations in particular genes, might be responsible for the observed left bias.
22. Complete the Final Quiz.
23. Print the final Summary page if instructed to do so by your teacher. 24. Listed below are the key concepts of this virtual lab. Write a short essay explaining how this virtual lab provides
evidence for EACH of the key concepts. • Natural selection can drive the evolution, not just of simple traits like coat color or body size, but also of
complex traits like the size and shape of skeletons. • Different environments with different predators, food sources, or resource limitations apply different
selective pressures on the shape of animal bodies. • Important evolutionary insights can be gained by making comparisons among fossils of different ages and
locations and among living populations under different selective pressures, and by comparing fossils to living populations.
• Careful quantitative analysis of the traits of living populations can tell us about mechanisms of selection, including genetic mechanisms, whereas quantitative analysis of populations of fossilized specimens can provide a record of change over time and even the pace of specific adaptive changes.
• Statistical analysis is essential for gauging confidence in conclusions drawn from population data, which can include natural variation, populations in transition, and measurement error by the researcher.
Essays will vary depending on the academic level of students conducting the virtual lab. When grading these essays, teachers should emphasize that each key concept needs to be explained with supporting evidence from the Virtual Stickleback Evolution Lab.
AUTHOR Ann Brokaw
AP Biology Teacher
Rocky River High School
Rocky River, Ohio