TheDEMAND NURSING PROFESSIONALS Oregon IN
18
Oregon The DEMAND NURSING PROFESSIONALS IN 2018 for
Transcript of TheDEMAND NURSING PROFESSIONALS Oregon IN

Oregon
The DEMANDNURSING
PROFESSIONALSIN
2018
for
1
Introduction
Because of the impact nurses have on the delivery of healthcare, the supply and demand for nurses garners much attention at a state and national level. In Oregon, and in other states, there are increased concerns about a nursing shortage, as well as an increased demand for healthcare because of an aging population. While recent projections suggest Oregon may have a nurse surplus, albeit small, by 2030 (U.S. Department of Health and Human Services, 2017), many believe the current maldistribution of nurses will leave some areas of the state with an inadequate number of qualified nurses and therefore inadequate access to healthcare services.
Since 2004, the Oregon Center for Nursing (OCN) has evaluated employer demand for nurses as part of its foundational research. OCN has released four reports on the demand for nurses in Oregon, and tracks key metrics that indicate the stability of the nursing workforce and the difficulty recruiting and hiring an adequate, qualified nursing workforce. Utilizing these data and comparing it with data related to supply and educational capacity gives a meaningful picture of the nursing workforce in Oregon.
The purpose of this report is to present the findings of the Survey of Nurse Employers conducted by OCN in the spring of 2018, and to provide insight into the current environment of the nurse workforce in Oregon as seen from the employer’s lens. Many studies examine the supply of nurses from a health care delivery perspective (MacLean, Hassmiller, Shaffer, Rohrbaugh, Collier, & Fairman, 2014), but not through the eyes of employers who are faced with recruiting and hiring nurses in an ever-changing health care landscape.
While this study did not examine geographic variability, there is strong evidence that rural communities across the state face increasing pressure to recruit and retain qualified nurses (Oregon Office of Rural Health, 2017). Thus, it is reasonable to suspect that even if there is a small surplus of nurses statewide, there will likely be shortages in many communities within Oregon.
These data show that employers face difficulties in recruiting, hiring, and retaining qualified nursing professions across the spectrum of health care. High vacancy rates and even higher turnover rates show that many employers are facing problems maintaining an adequate nursing workforce. Employers specifically state they have great difficulty hiring certain nurse specialties, and in many instances, do not plan to grow their workforce with these types of nurses. Considering these difficulties, employers in home health/hospice, for example, have increased recruiting for new graduates to reduce their vacancy rates. This also presented new graduates with an opportunity for jobs in a sector of the health care workforce that was not previously available.
In addition, data suggest that employers may be relying on contract labor (i.e., traveling and agency nurses) to fill some vacant positions. Data from employers in hospital and health systems show an increase in the use of contract labor in 2018, while showing a drop in their vacancy rates. This tactic may help establish more stability in the nursing workforce at hospitals; however, this strategy may not work in all settings. Employers in long term care reported an increase in the utilization of contract labor, but the vacancy rate among long term care employers continued to rise. This utilization of contract labor among employers may solve short-term problems, but it unclear at this time if its use leads to issues of retention among other nurse employees.
Given the diversity of the types of nurses needed to fill current vacancies, the many different settings in which nurses work, and the diverse communities where nurses work and live, a single strategy to help employers recruit and retain nurses is likely to be met with limited success. Instead, Oregon should adopt multiple strategies to avoid shortages of qualified nurses. These strategies must be adapted to the specific needs of the employer, health care setting, and community.

2
Hospital55.4%
Long Term Care6.1%
Home Health/Hospice5.6%
Public Health3.0%
Other29.9%
Figure 1: Registered Nurses by Work Setting, 2016
Method
The 2018 Survey of Nurse Employers was sent to 340 employers of nurses in Oregon. The distribution of the survey was limited to health care sectors previously surveyed including hospitals and health systems, long term care, home health/hospice, and public health entities (OCN, 2005, 2011, 2016). These sectors of the health care workforce represent about 70 percent of the nurses working in Oregon (see Figure 1). Thus, the findings of this study should be representative of employers of the majority of nurses in Oregon.
The survey instrument was distributed and returned electronically. Several follow-up surveys and communications were sent to non-responding employers to improve the response rate and the generalizability of the results. Each health care sector received separate survey instruments to allow for queries about specific clinical services and the type of nursing professionals unique to each sector.
Employers were asked to provide data on nurse vacancies, turnover, the use of contract labor, and the proportion of job openings available to newly licensed nurses. Employers were also asked to identify the degree of difficulty recruiting and hiring various types of nurses and subspecialties within the nursing workforce. Lastly, employers were asked to evaluate the future nursing workforce needs within their organization over the next two years.
To assess the relative difficulty in hiring various nursing positions within each sector, a Difficulty Index was created. This index accounts for responses from employers in each sector on how difficult it is to hire certain positions and is weighted to responses indicating great difficulty. The index is then ranked to show which positions are more difficult to hire than others.
The key metrics examined in this study were vacancy and turnover rates. While these measures do not directly assess need, they do provide indirect evidence of the difficulty employers have in recruiting and hiring particular personnel, and employers’ ability to retain staff as an indicator of the overall stability of the workforce (Reiner, Val Palumbo, McIntosh, Rambur, Kolodinsky, Hurowitz, & Ashikaga, 2005; Cox, Willis, & Coustasse, 2014). Other metrics, such as the use of contract labor, the relative difficulty in hiring specific types of nurses, and anticipated staffing needs were aggregated by health care sector. These measures may also shed light on the overall stability of the nursing workforce and highlight specific types of nurses that are relatively difficult to recruit.
Source: Oregon Center for Nursing, 2017
Hospital & Health Systems Long Term Care Home Health &
Hospice Public Health
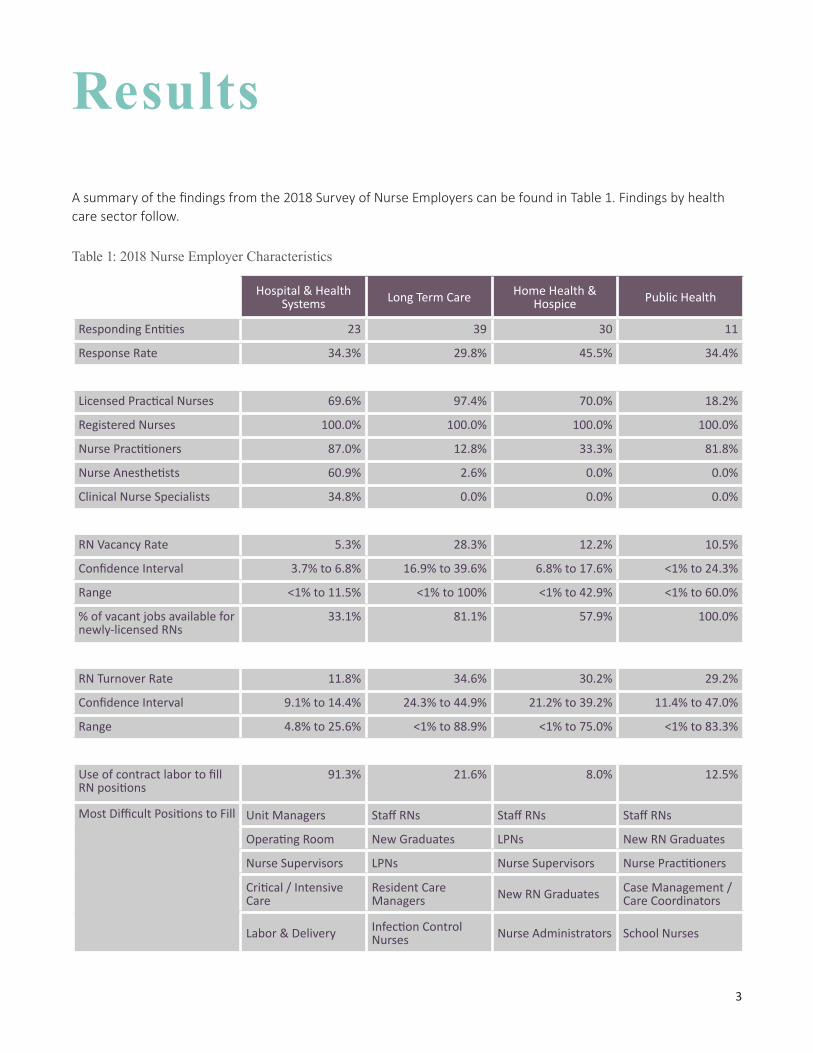
Responding Entities 23 39 30 11
Response Rate 34.3% 29.8% 45.5% 34.4%
Types of Nurses Employed
Licensed Practical Nurses 69.6% 97.4% 70.0% 18.2%
Registered Nurses 100.0% 100.0% 100.0% 100.0%
Nurse Practitioners 87.0% 12.8% 33.3% 81.8%
Nurse Anesthetists 60.9% 2.6% 0.0% 0.0%
Clinical Nurse Specialists 34.8% 0.0% 0.0% 0.0%
RN Vacancy Rate 5.3% 28.3% 12.2% 10.5%
Confidence Interval 3.7% to 6.8% 16.9% to 39.6% 6.8% to 17.6% <1% to 24.3%
Range <1% to 11.5% <1% to 100% <1% to 42.9% <1% to 60.0%
% of vacant jobs available for newly-licensed RNs
33.1% 81.1% 57.9% 100.0%
RN Turnover Rate 11.8% 34.6% 30.2% 29.2%
Confidence Interval 9.1% to 14.4% 24.3% to 44.9% 21.2% to 39.2% 11.4% to 47.0%
Range 4.8% to 25.6% <1% to 88.9% <1% to 75.0% <1% to 83.3%
Use of contract labor to fill RN positions
91.3% 21.6% 8.0% 12.5%
Most Difficult Positions to Fill Unit Managers Staff RNs Staff RNs Staff RNs
Operating Room New Graduates LPNs New RN Graduates
Nurse Supervisors LPNs Nurse Supervisors Nurse Practitioners
Critical / Intensive Care
Resident Care Managers New RN Graduates Case Management /
Care Coordinators
Labor & Delivery Infection Control Nurses Nurse Administrators School Nurses
Table 1: 2018 Nurse Employer Characteristics
A summary of the findings from the 2018 Survey of Nurse Employers can be found in Table 1. Findings by health care sector follow.
3Source: Oregon Center for Nursing, 2017
Results

4
Hospitals and Health Systems
More than half of Oregon nurses work in hospitals and health systems (OCN, 2017), which is similar to national trends. Of all the work settings, the nursing workforce in hospitals and health systems is the most stable. The vacancy rate was about five percent in 2018, and represented a slight decrease from 2015, but was still higher than the vacancy rate in 2010. It is likely that the increase in the utilization of contract labor, which was used in more than 90 percent of hospitals and health systems, could play a role in the decrease in the vacancy rate. Turnover increased slightly, but not significantly in 2018.
Almost all hospitals and health systems used some sort of contract labor. While the use of traveling nurses rose in 2018, the proportion of hospitals and health systems that used agency nurses declined. However, since the overall use of contract labor increased, it seems reasonable this increase played some role in the decline of the nurse vacancy rate.
New graduates were readily available with more than 78 percent of hospitals stating recruitment of new RN
graduates was not difficult. However, nurse specialists were harder to find. Employers reported unit-level nurse managers, operating room nurses, nurse supervisors, critical/intensive care nurses, labor and delivery nurses, and nurse practitioners were the most difficult positions to fill.
Even though nurse practitioners were one of the nurse specialists hospitals found difficult to recruit, about 74 percent of hospitals and health systems reported plans to increase the number of nurse practitioners in the next two years. It is possible that this increased demand for nurse practitioners is due to the changing roles of nurse practitioners in hospital settings, such as serving as hospitalists.
Almost 83 percent of hospitals and health systems also planned to increase the number of registered nurses with a baccalaureate degree. This desire follows recommendations from national organizations (IOM, 2010) and literature describing better patient outcomes tied to baccalaureate-educated nurses.
2015 2018
Traveling Nurses 79.3% 91.3%
Agency Nurses 73.9% 56.5%
Contract Labor 82.6% 91.3%
Table 2: Use of Contract Labor in Hospitals and Health Systems
Figure 2: Hospitals and Health Systems Nurse Vacancy and Turnover 11.8%10.8%10.6%10.6%
5.3%6.2%
3.9%4.5%
2004 20042010 20102015Vacancy Rate
20152018 2018Turnover Rate

5
Number of Hospitals and Health Systems Difficulty Index
Not Difficult Somewhat Difficult Very Difficult Index Score Rank
Unit-Level Nurse Managers 1 11 10 53 1
Operating Room 2 4 14 52 2
Nurse Supervisors 5 8 10 51 3
Critical / Intensive Care 0 6 11 45 4
Labor & Delivery 1 6 10 43 5
Nurse Practitioners 2 8 7 39 6
Emergency Care 5 8 6 39 6
Pre / Post Surgical Care 10 9 2 34 8
Case Management / Discharge Planning 7 4 6 33 9
Medical / Surgical 11 8 1 30 10
New RN Graduates 18 2 2 28 11
Executive / Administration 0 7 4 26 12
Cardiac Care 2 5 4 24 13
LPNs 6 3 3 21 14
Oncology 6 5 1 19 15Certified Registered Nurse Anesthetists 2 7 1 19 15
Psychiatric / Mental Health 0 6 2 18 17
Dialysis 1 2 4 17 18
Pediatric / Neonatal Critical Care 0 3 3 15 19
Pediatrics 1 4 2 15 19
Clinical Nurse Leaders 0 1 4 14 21
Trauma 0 2 2 10 22
Clinical Nurse Specialists 1 1 2 9 23
Certified Nurse Midwives 0 4 0 8 24
Table 3: Difficult to Hire Positions in Hospitals and Health Systems
Hospitals and Health Systems

6
0% 10% 20% 30% 40% 50% 60% 70% 80% 90% 100%
RNs with Baccalaureate degree
Nurse Practitioners
RNs with Master's degree in Management orAdministration
RNs with Doctorate of Nursing Practice
New RN graduates
RNs with Master's degree in Nursing
Certified Registered Nurse Anesthetists
Clinical Nurse Leaders
LPNs
Clinical Nurse Specialists
RNs with Associate or Diploma degree
Increase Decrease No Change
Figure 3: Expected Change in Budgeted Positions - Hospitals and Health Systems
Hospitals and Health Systems
82.6% 17.4%
14.3%
40.9%
47.1%
52.4%
52.4%
68.8%
69.2%
50.0%
78.6%
18.2%
4.8%81.0%
59.1%
52.9%
47.6%
47.6%
31.3%
30.8%
25.0%
21.4%
18.2% 63.6%
25.0%
0% 10% 20% 30% 40% 50% 60% 70% 80% 90% 100%
RNs with Baccalaureate degree
Nurse Practitioners
RNs with Master's degree in Management orAdministration
RNs with Doctorate of Nursing Practice
New RN graduates
RNs with Master's degree in Nursing
Certified Registered Nurse Anesthetists
Clinical Nurse Leaders
LPNs
Clinical Nurse Specialists
RNs with Associate or Diploma degree
Increase Decrease No Change
0% 10% 20% 30% 40% 50% 60% 70% 80% 90% 100%
RNs with Associate or Diploma degree
RNs with Master's degree in Management orAdministration
New RN graduates
RNs with Baccalaureate degree
RN with Master's degree in Nursing
Certified Registered Nurse Anesthetists
RNs with Doctorate of Nursing Practice
LPNs
Clinical Nurse Specialists
Clinical Nurse Leaders
Nurse Practitioners
Increase Decrease No Change

7
While only about six percent of nurses work in long term care (OCN, 2017), the demand for long term care nurses is expected to grow. In the 2015 report “The Demand for Nursing Professionals,” OCN estimated the long term sector would experience the greatest growth of nursing workforce, with a total expected growth of about 42 percent by 2025 (OCN, 2015). Of all the sectors examined, the long term care nursing workforce seems to be the most volatile.
The average vacancy for registered nurses in long term care in 2018 increased to 28.3 percent in 2018, up from about 17 percent in 2015. Vacancy rates for long term care nurses have risen each year since 2010, but the increase between 2015 and 2018 is far larger. Nurse turnover rates did not change significantly from 2015, but were still very high at almost 35 percent. This means more than one-third of the long term care nursing workforce changed over in a one year period of time. There is some evidence nurses use employment in long term care setting as a transitional job to gain needed experience before attempting to find employment in acute care settings. This idea would also account for the high, but steady, turnover rate, as many nurses employed in long term care setting stay for a limited time.
Employers in long term care did not utilize contract labor in the same way as hospitals and health systems.
Anecdotal conversations indicate that the complexity of the regulations within this industry makes the use of contract labor more difficult than in other health care sectors.
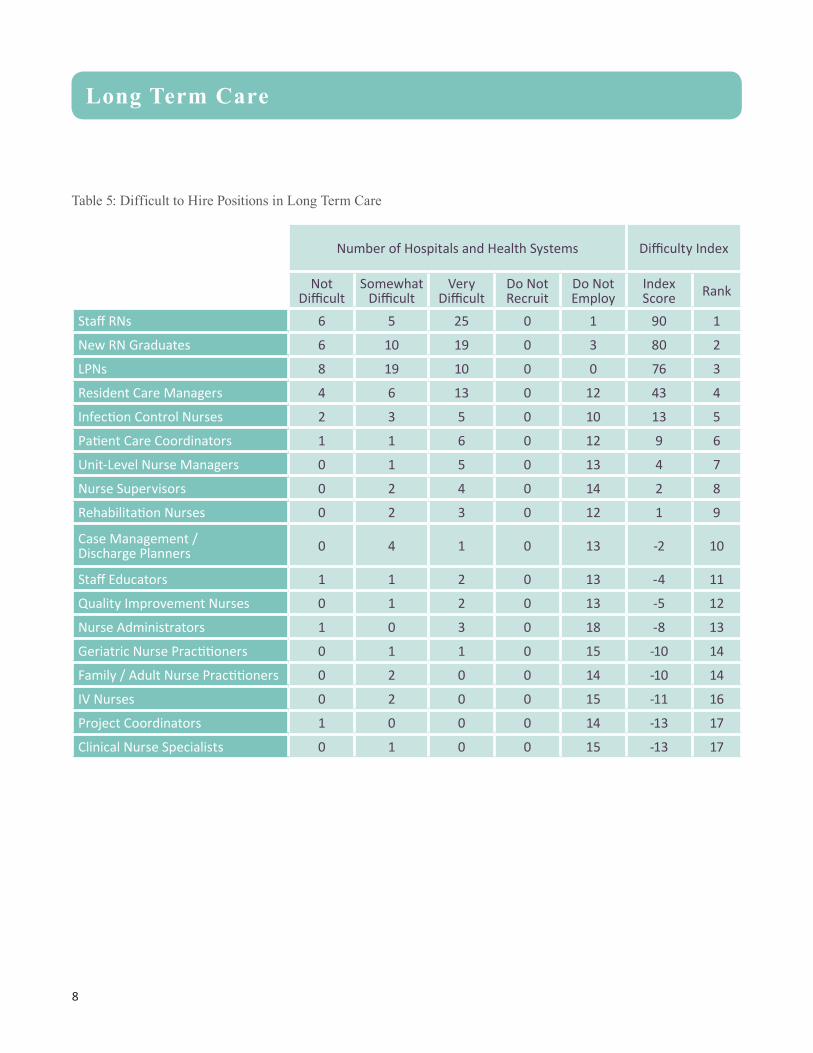
Long term care employers did not tend to hire nurse specialists, such as infection control nurses, staff educators or project coordinators. Employers found it difficult to hire new RN graduates, and yet they indicated an intent to increase hiring of new graduates in the next two years, including an increase in nurses with associate degrees. Given that employers in hospitals and health systems find new RN graduates to be the least difficult to hire and hospitals intend to reduce hiring of nurses with associate degrees, potential collaboration between employers and nursing education programs might be a solution to help steer new graduates toward long term care careers.
2015 2018
Traveling Nurses 5.2% 2.7%
Agency Nurses 21.1% 21.6%
Contract Labor 22.8% 21.6%
Table 4: Use of Contract Labor in Long Term Care
Figure 4: Long Term Care Nurse Vacancy and Turnover
Long Term Care
2004 20042010 20102015
Vacancy Rate
20152018 2018
Turnover Rate
14.6%
10.3%
17.3%
28.3% 29.0%
21.2%
33.0%34.6%
8
Number of Hospitals and Health Systems Difficulty Index
Not Difficult
Somewhat Difficult
Very Difficult
Do Not Recruit
Do Not Employ
Index Score Rank
Staff RNs 6 5 25 0 1 90 1
New RN Graduates 6 10 19 0 3 80 2
LPNs 8 19 10 0 0 76 3
Resident Care Managers 4 6 13 0 12 43 4
Infection Control Nurses 2 3 5 0 10 13 5
Patient Care Coordinators 1 1 6 0 12 9 6
Unit-Level Nurse Managers 0 1 5 0 13 4 7
Nurse Supervisors 0 2 4 0 14 2 8
Rehabilitation Nurses 0 2 3 0 12 1 9
Case Management / Discharge Planners 0 4 1 0 13 -2 10
Staff Educators 1 1 2 0 13 -4 11
Quality Improvement Nurses 0 1 2 0 13 -5 12
Nurse Administrators 1 0 3 0 18 -8 13
Geriatric Nurse Practitioners 0 1 1 0 15 -10 14
Family / Adult Nurse Practitioners 0 2 0 0 14 -10 14
IV Nurses 0 2 0 0 15 -11 16
Project Coordinators 1 0 0 0 14 -13 17
Clinical Nurse Specialists 0 1 0 0 15 -13 17
Table 5: Difficult to Hire Positions in Long Term Care
Long Term Care

9
0% 10% 20% 30% 40% 50% 60% 70% 80% 90% 100%
RNs with Associate or Diploma degree
RNs with Master's degree in Management or Administration
New RN graduates
RNs with Baccalaureate degree
RN with Master's degree in Nursing
Certi fied Registered Nurse Anesthetists
RNs with Doctorate of Nursing Practice
LPNs
Clinical Nurse Specialists
Clinical Nurse Leaders
Nurse Practitioners
Increase Decrease No Change
Figure 5: Expected Change in Budgeted Positions - Long Term Care
Long Term Care
44.7%
41.7%
39.5%
31.4%
25.0%
25.0%
24.3%
24.3%
16.7%
16.7%
12.5%
50.0%
50.0%
55.3%
65.7%
68.8%
67.6%
83.3%
83.3%
87.5%
75.0%
75.0%
8.3%
5.3%
5.3%
2.9%
6.3%
8.1%
0% 10% 20% 30% 40% 50% 60% 70% 80% 90% 100%
RNs with Baccalaureate degree
Nurse Practitioners
RNs with Master's degree in Management orAdministration
RNs with Doctorate of Nursing Practice
New RN graduates
RNs with Master's degree in Nursing
Certified Registered Nurse Anesthetists
Clinical Nurse Leaders
LPNs
Clinical Nurse Specialists
RNs with Associate or Diploma degree
Increase Decrease No Change
0% 10% 20% 30% 40% 50% 60% 70% 80% 90% 100%
RNs with Associate or Diploma degree
RNs with Master's degree in Management orAdministration
New RN graduates
RNs with Baccalaureate degree
RN with Master's degree in Nursing
Certified Registered Nurse Anesthetists
RNs with Doctorate of Nursing Practice
LPNs
Clinical Nurse Specialists
Clinical Nurse Leaders
Nurse Practitioners
Increase Decrease No Change
0% 10% 20% 30% 40% 50% 60% 70% 80% 90% 100%
RNs with Associate or Diploma degree
RNs with Master's degree in Management orAdministration
New RN graduates
RNs with Baccalaureate degree
RN with Master's degree in Nursing
Certified Registered Nurse Anesthetists
RNs with Doctorate of Nursing Practice
LPNs
Clinical Nurse Specialists
Clinical Nurse Leaders
Nurse Practitioners
Increase Decrease No Change
0% 10% 20% 30% 40% 50% 60% 70% 80% 90% 100%
RNs with Associate or Diploma degree
RNs with Master's degree in Management orAdministration
New RN graduates
RNs with Baccalaureate degree
RN with Master's degree in Nursing
Certified Registered Nurse Anesthetists
RNs with Doctorate of Nursing Practice
LPNs
Clinical Nurse Specialists
Clinical Nurse Leaders
Nurse Practitioners
Increase Decrease No Change

10
Home health/hospice is another sector that, while only six percent of the workforce (OCN, 2017), is expected to increase demand for nurses as Oregonians grow older.
The average vacancy rate for registered nurse positions in 2018 decreased by 4.5 percent to 12.2 percent. In 2015, the vacancy rate for home health/hospice employers rose markedly, and it unclear at this time if the drop observed in 2018 will continue in future years.
While the vacancy rate for home health/hospice nurses was less than half that of long term care, (12.2 percent vs. 28.3 percent), the turnover rate is similar (30.2 percent vs. 34.6 percent). Turnover among nurses in home health/hospice, while relatively high, has been fairly stable since 2010. One explanation of the high turnover rate among these nurses could be nurses employed in home health/hospice are older and nearing the end of their nursing careers. This would suggest that the high turnover rate could be, in part, due to the number of nurses retiring. Additional analyses show that nurses working in home health/hospice are, on average, seven years older than nurses working in hospital settings, with mean ages of 52 years in home health/hospice and 45 years in hospital settings. Also, more than 12 percent of home health/hospice nurses are older than 65, compared to only five percent in hospitals (OCN, 2017).
Use of contract labor for nurses rose slightly across home health/hospice settings from 2015 to 2018, but only two home health/hospice employers reported using contract labor in 2018.
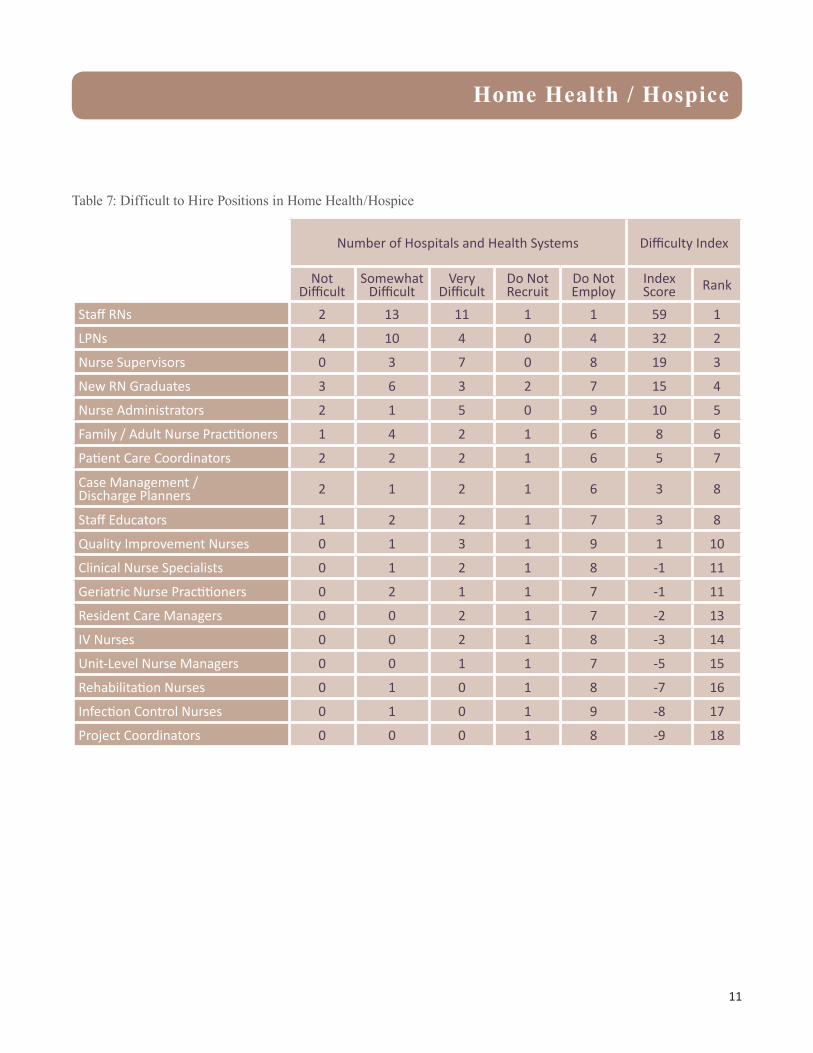
Home health/hospice sector employers reported a high level of difficulty recruiting staff nurses and nurse supervisors. More than half of employers said LPNs were either somewhat difficulty or very difficult to hire.
Despite the difficulty in hiring, almost 80 percent of home health/hospice employers indicated the number of LPN positions will increase or remain unchanged over the next two years. Additionally, about 64 percent of home health/hospice employers indicated they will increase the number of positions for RNs with an associate or diploma degree, while 63 percent will increase positions for baccalaureate educated RNs.
Figure 6: Home Health/Hospice Nurse Vacancy and Turnover
2015 2018
Traveling Nurses 0.0% 8.0%
Agency Nurses 5.3% 8.0%
Contract Labor 5.3% 8.0%
Table 6: Use of Contract Labor in Home Health/Hospice
Home Health / Hospice
Vacancy Rate Turnover Rate
2004 20042010 20102015 20152018 2018
9.3%6.3%
16.7%
12.2%
19.3%
30.8%27.7%
30.2%
11
Home Health / Hospice
Number of Hospitals and Health Systems Difficulty Index
Not Difficult
Somewhat Difficult
Very Difficult
Do Not Recruit
Do Not Employ
Index Score Rank
Staff RNs 2 13 11 1 1 59 1
LPNs 4 10 4 0 4 32 2
Nurse Supervisors 0 3 7 0 8 19 3
New RN Graduates 3 6 3 2 7 15 4
Nurse Administrators 2 1 5 0 9 10 5
Family / Adult Nurse Practitioners 1 4 2 1 6 8 6
Patient Care Coordinators 2 2 2 1 6 5 7
Case Management / Discharge Planners 2 1 2 1 6 3 8
Staff Educators 1 2 2 1 7 3 8
Quality Improvement Nurses 0 1 3 1 9 1 10
Clinical Nurse Specialists 0 1 2 1 8 -1 11
Geriatric Nurse Practitioners 0 2 1 1 7 -1 11
Resident Care Managers 0 0 2 1 7 -2 13
IV Nurses 0 0 2 1 8 -3 14
Unit-Level Nurse Managers 0 0 1 1 7 -5 15
Rehabilitation Nurses 0 1 0 1 8 -7 16
Infection Control Nurses 0 1 0 1 9 -8 17
Project Coordinators 0 0 0 1 8 -9 18
Table 7: Difficult to Hire Positions in Home Health/Hospice

12
Home Health / Hospice
Figure 7: Expected Change in Budgeted Positions - Home Health / Hospice0% 10% 20% 30% 40% 50% 60% 70% 80% 90% 100%
Nurse Practitioners
RNs with Baccalaureate degree
RNs with Associate or Diploma degree
New RN graduates
LPNs
RNs with Master's degree in Management or Administration
Clinical Nurse Leaders
RN with Master's degree in Nursing
RNs with Doctorate of Nursing Practice
Clinical Nurse Specialists
Certi fied Registered Nurse Anesthetists
Increase Decrease No Change
83.0% 16.7%
68.0% 28.0%
11.1% 22.2%66.7%
65.0% 35.0%
54.5% 45.5%
62.5%
63.6%
68.4%
83.3%
100.0%
100.0%
37.5%
36.4%
31.6%
16.7%
4.0%
0% 10% 20% 30% 40% 50% 60% 70% 80% 90% 100%
RNs with Baccalaureate degree
Nurse Practitioners
RNs with Master's degree in Management orAdministration
RNs with Doctorate of Nursing Practice
New RN graduates
RNs with Master's degree in Nursing
Certified Registered Nurse Anesthetists
Clinical Nurse Leaders
LPNs
Clinical Nurse Specialists
RNs with Associate or Diploma degree
Increase Decrease No Change
0% 10% 20% 30% 40% 50% 60% 70% 80% 90% 100%
Nurse Practitioners
RNs with Baccalaureate degree
RNs with Associate or Diploma degree
New RN graduates
LPNs
RNs with Master's degree in Management orAdministration
Clinical Nurse Leaders
RN with Master's degree in Nursing
RNs with Doctorate of Nursing Practice
Clinical Nurse Specialists
Certified Registered Nurse Anesthetists
Increase Decrease No Change
0% 10% 20% 30% 40% 50% 60% 70% 80% 90% 100%
RNs with Associate or Diploma degree
RNs with Master's degree in Management orAdministration
New RN graduates
RNs with Baccalaureate degree
RN with Master's degree in Nursing
Certified Registered Nurse Anesthetists
RNs with Doctorate of Nursing Practice
LPNs
Clinical Nurse Specialists
Clinical Nurse Leaders
Nurse Practitioners
Increase Decrease No Change

13
Public health accounts for about three percent of the nursing workforce in Oregon (OCN, 2017).
Vacancy and turnover rates for registered nurses working in public health are be found in Figure 11. The average vacancy rate for registered nurses in public health was 10.5 percent in 2018. This represents a decline of almost five percent points from those reported in 2015. The vacancy rates for nurses in public health has been stable since 2004, with a spike occurring in 2015.
The average turnover rate for registered nurses working in public health rose in 2018 to 29.2 percent; an increase of about eight percent points since 2015. The turnover rate among public health nurses has been rising since OCN first started collecting this data in 2004. Similar to home health/hospice, nurses employed in public health settings tend to be older and potentially nearing the end of their nursing careers, so it would be expected to see higher retirements among nurses
in public health. The average age of a nurse working in public health is 51 years, and over 15 percent are older than 65 years (OCN, 2017).
Public health agencies reported clinical staff nurses were the most difficult nurses to hire, as well as new RN graduates and nurse practitioners. More than half said they expect to increase the number of nurses with a baccalaureate in the next two years.
It appears opportunities for newly licensed nurses have increased in public health since 2015. In the 2015 survey, more than 57 percent of employers reported a decrease in hiring new nurse graduates. However, in 2018, no public health employers reported plans for decreasing positions for new graduates. Instead, almost 82 percent said there would be no change in the number of positions available to new graduates, and about 18 percent said they would increase the number of positions in the next two years.
2015 2018
Traveling Nurses 0.0% 0.0%
Agency Nurses 11.8% 12.5%
Contract Labor 11.8% 12.5%
Table 8: Use of Contract Labor in Public Health
Figure 8: Public Health Nurse Vacancy and Turnover
Public Health
Vacancy Rate Turnover Rate
2004 20042010 20102015 20152018 2018
9.1%7.6%
15.2%
10.5% 9.6%
18.6%21.5%
29.2%

14
Table 9: Difficult to Hire Positions in Public Health
Number of Hospitals and Health Systems Difficulty Index
Not Difficult Somewhat Difficult
Very Difficult Index Score Rank
Clinic Staff RNs 0 7 4 26 1
New RN Graduates 3 4 4 23 2
Nurse Practitioners 0 2 4 16 3
Case Management / Care Coordinators 0 2 2 10 4
School Nurses 1 1 2 9 5
Nurse Supervisors 1 1 2 9 5
Mental/Behavioral Health 0 1 2 8 7
Community Outreach 1 2 1 8 7
Nurse Administrators 1 0 1 4 9
Epidemiology 0 0 1 3 10
In-Service Educators 0 0 1 3 10
Certified Nurse Midwives 0 0 1 3 10
LPNs 0 1 0 2 13
Nurse Managers 1 0 0 1 14
Quality Control 0 0 0 0 15
Infection Control 0 0 0 0 15
Public Health

15
Figure 9: Expected Change in Budgeted Positions - Public Health
Public Health
0% 10% 20% 30% 40% 50% 60% 70% 80% 90% 100%
RNs with Baccalaureate degree
RNs with Associate or Diploma degree
Nurse Practitioners
RN with Master's degree in Nursing
New RN Graduates
LPNs
RNs with Master's degree in Management or Administration
Clinical Nurse Specialists
Clinical Nurse Leaders
Increase Decrease No Change
54.5% 9.1% 36.4%
77.8%
66.7%
80.0%
81.8%
100.0%
100.0%
100.0%
100.0%
22.2%
22.2%
20.0%
18.2%
11.1%
0% 10% 20% 30% 40% 50% 60% 70% 80% 90% 100%
RNs with Baccalaureate degree
RNs with Associate or Diploma degree
Nurse Practitioners
RN with Master's degree in Nursing
New RN Graduates
LPNs
RNs with Master's degree in Management orAdministration
Clinical Nurse Specialists
Clinical Nurse Leaders
Increase Decrease No Change
0% 10% 20% 30% 40% 50% 60% 70% 80% 90% 100%
RNs with Baccalaureate degree
Nurse Practitioners
RNs with Master's degree in Management orAdministration
RNs with Doctorate of Nursing Practice
New RN graduates
RNs with Master's degree in Nursing
Certified Registered Nurse Anesthetists
Clinical Nurse Leaders
LPNs
Clinical Nurse Specialists
RNs with Associate or Diploma degree
Increase Decrease No Change
0% 10% 20% 30% 40% 50% 60% 70% 80% 90% 100%
RNs with Associate or Diploma degree
RNs with Master's degree in Management orAdministration
New RN graduates
RNs with Baccalaureate degree
RN with Master's degree in Nursing
Certified Registered Nurse Anesthetists
RNs with Doctorate of Nursing Practice
LPNs
Clinical Nurse Specialists
Clinical Nurse Leaders
Nurse Practitioners
Increase Decrease No Change

16
References
To view previous reports on the demand for nursing professionals in Oregon, please visit www.oregoncenterfornursing.org.
Cox, P., Willis, W.K., and Coustasse, A. (2014). The American epidemic: The US nursing shortage and turnover problem. Paper presented at BHAA 2014, Chicago, IL.
MacLean, L., Hassmiller, S., Shaffer, F., Rohrbaugh, K., Collier, T., and Fairman, J. (2014). Scale, causes, and implications of the primary care nursing shortage. Annual Review of Public Health, 35, 443-457.
Oregon Center for Nursing (2005). When, not if… A report on Oregon’s registered nurse workforce. Portland, OR.
Oregon Center for Nursing (2011). Nurses wanted: The changing demand for registered nurses in Oregon. Portland, OR.
Oregon Center for Nursing (2016). The demand for nursing professionals in Oregon, 2016. Portland, OR.
Oregon Center for Nursing (2017). Characteristics of the nursing workforce in Oregon, 2016. Portland, OR.
Oregon Office of Rural Health (2017). Oregon rural and frontier health facility listening tour, 2017. Portland, OR.
Reiner, K., Val Palumbo, M., McIntosh, B., Rambur, B., Kolodinsky, J., Hurowitz, L., and Ashikaga, T. (2005). Measuring the nursing workforce: clarifying the definitions. Medical Care Research and Review, 62, 741-755.
U.S. Department of Health and Human Services, Health Resources and Services Administration (2017). Supply and demand projections of the nursing workforce: 2014-2030, Rockville, MD.
This work was made possible by the Oregon Nursing Advancement Fund, supported by Oregon’s licensed practical and registered nurses.
Suggested Citation:Oregon Center for Nursing. (2018). The Demand for Nursing Professionals in Oregon - 2018. Portland, OR: Oregon Center for Nursing.

5000 N Willamette Blvd., MSC 192 · Portland, OR 97203www.oregoncenterfornursing.org