The Zoomers Are Reinventing Everything. Are You? · ZoomerMedia Ltd. The Zoomers Are Reinventing...
35
Copyright © 2012 The Nielsen Company. Confidential and proprietary. David Cravit ZoomerMedia Ltd. The Zoomers Are Reinventing Everything. Are You?
Transcript of The Zoomers Are Reinventing Everything. Are You? · ZoomerMedia Ltd. The Zoomers Are Reinventing...

Copyright © 2012 The Nielsen Company. Confidential and proprietary.
David CravitZoomerMedia Ltd.
The Zoomers Are Reinventing Everything. Are You?

Copyright © 2010 The Nielsen Company. Confidential and proprietary.Copyright © 2012 The Nielsen Company. Confidential and proprietary.
Overview
What impact can this have on your clients?– Opportunities– Threats
What can do you about it?
Who are the Zoomers and how are they behaving?
Copyright © 2010 The Nielsen Company. Confidential and proprietary.Copyright © 2012 The Nielsen Company. Confidential and proprietary.
Who Are The Zoomers?
14.5 million people age 45+ represent 57% of adult population
57%
12%
17%
14%
Zoomers
18-24
25-34
35-44

Copyright © 2010 The Nielsen Company. Confidential and proprietary.Copyright © 2012 The Nielsen Company. Confidential and proprietary.
Domination Will Continue
1971(22.0 million)
2006(32.5 million)
2041(40.8 million)
Breakdown per 100,000 Population Breakdown per 100,000 Population Breakdown per 100,000 Population

Copyright © 2010 The Nielsen Company. Confidential and proprietary.Copyright © 2012 The Nielsen Company. Confidential and proprietary.
Only Group To Increase As % Of Population
0
10
20
30
40
50
60
2011 2016 2021 2026 203115-24
25-44
Zoomers

Copyright © 2010 The Nielsen Company. Confidential and proprietary.Copyright © 2012 The Nielsen Company. Confidential and proprietary.
Not Just More Older People, They’re Not The Same Older People
THE OLD OLD THE NEW OLD
Work is overWork goes on (and a
whole new career mightjust be beginning)
Planning for the future is over
Planning for the future is active,and may take you in surprising
new directions
Sex is over Sex is never over
Brand choices and shoppinghabits are set in stone
There is no brand loyalty;everything is up for grabs
The modern world isengaged only slightly
The modern world is still a playground, and guess who’s
boss
Copyright © 2010 The Nielsen Company. Confidential and proprietary.Copyright © 2012 The Nielsen Company. Confidential and proprietary.
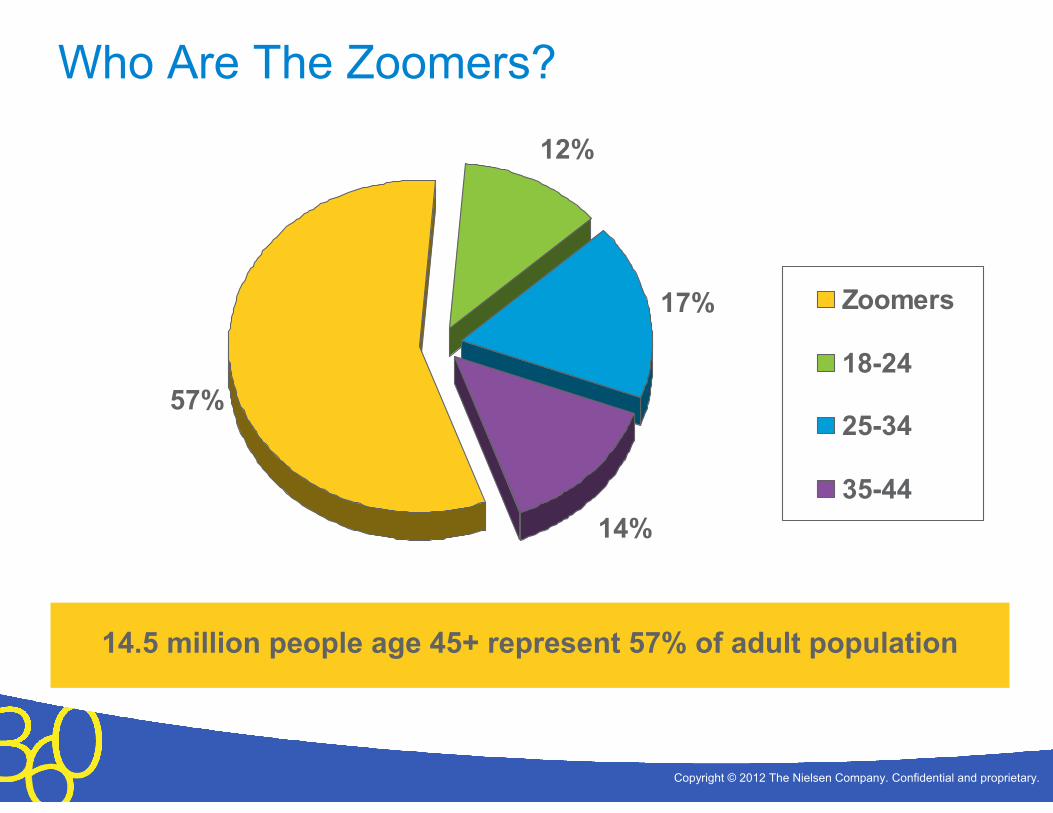
Why Is This Happening?
SandwichGeneration
Attitude
Size OfThe
Population ScienceAnd
Technology
BlurringOf
Generations
TheRevolution
InAging
Copyright © 2010 The Nielsen Company. Confidential and proprietary.Copyright © 2012 The Nielsen Company. Confidential and proprietary.
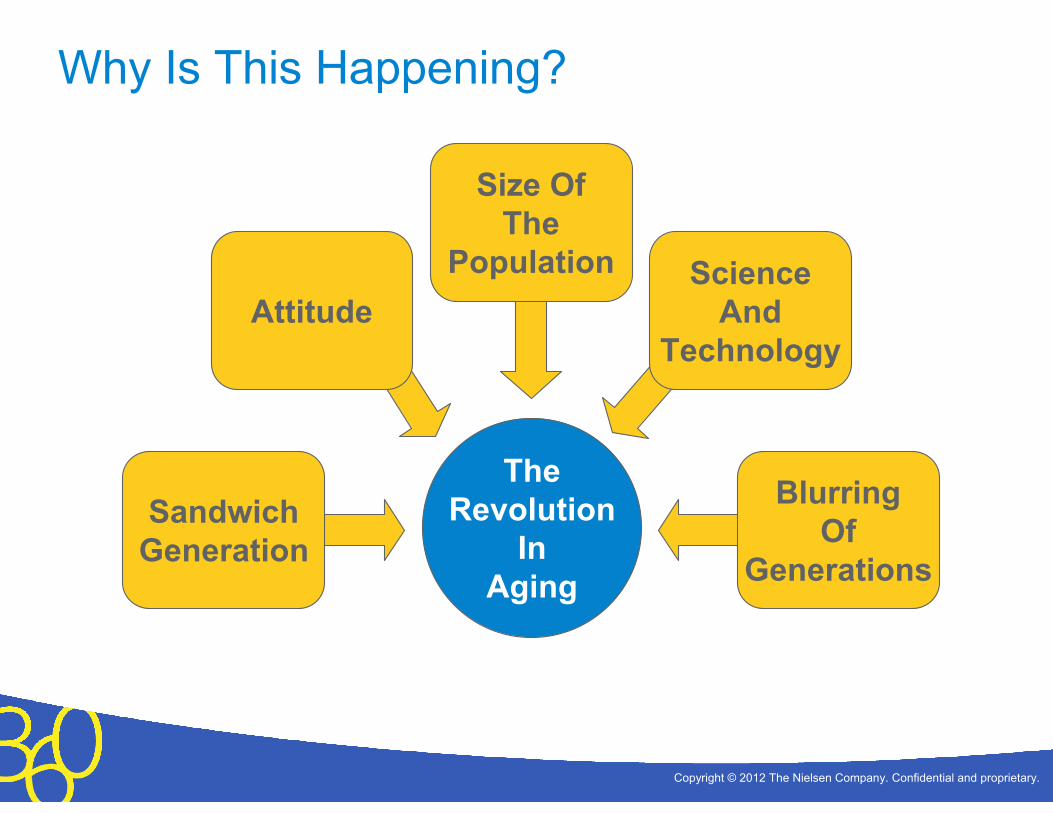
Attitudes and Behaviours That Shatter Traditional Expectations
Number reporting, top 2 boxes, agreement:“I am interested in understanding how society is evolving”
45-54 4,049,000
55-64 2,716,000
65-74 1,943,000
Over 8 million are interested in understanding how society is evolving

Copyright © 2010 The Nielsen Company. Confidential and proprietary.Copyright © 2012 The Nielsen Company. Confidential and proprietary.
Attitudes and Behaviours That Shatter Traditional Expectations
Number reporting, top 2 boxes, agreement:“I often do something
just to prove to myself I am able”
45-54 3,379,000
55-64 2,243,000
65-74 1,701,000
Over 7 million do something just to prove to themselves they are able
Copyright © 2010 The Nielsen Company. Confidential and proprietary.Copyright © 2012 The Nielsen Company. Confidential and proprietary.
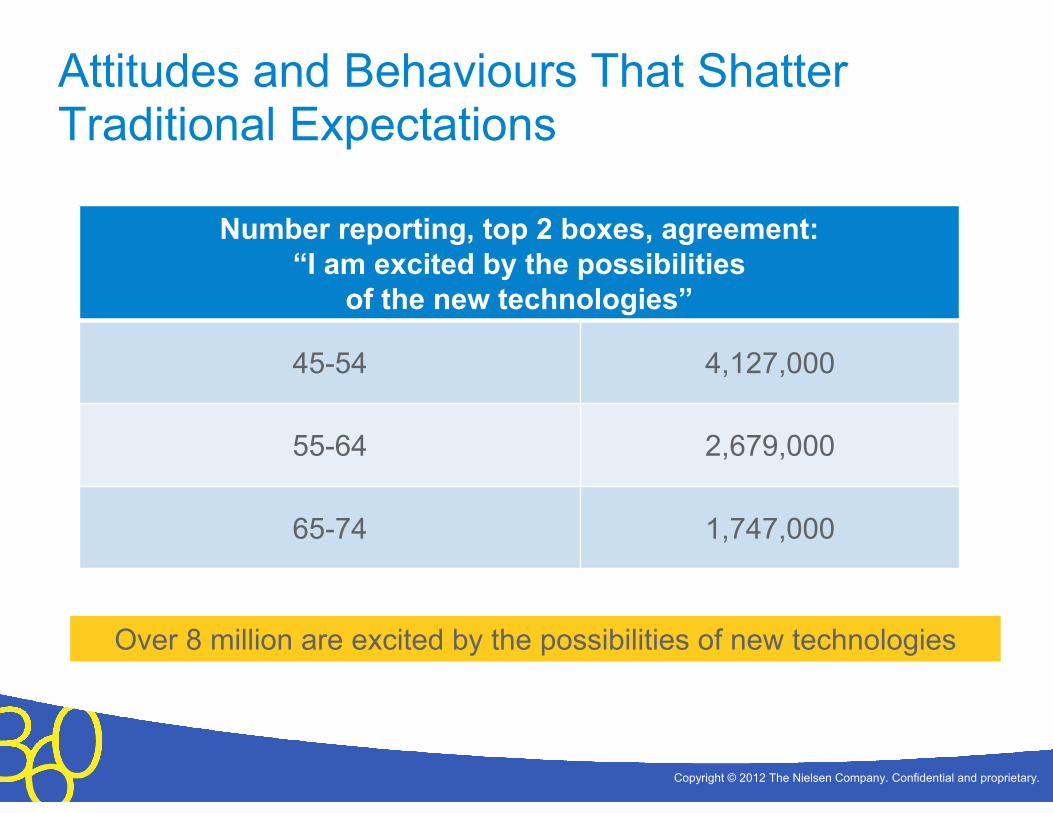
Attitudes and Behaviours That Shatter Traditional Expectations
Number reporting, top 2 boxes, agreement:“I am excited by the possibilities
of the new technologies”
45-54 4,127,000
55-64 2,679,000
65-74 1,747,000
Over 8 million are excited by the possibilities of new technologies

Copyright © 2010 The Nielsen Company. Confidential and proprietary.Copyright © 2012 The Nielsen Company. Confidential and proprietary.
Attitudes and Behaviours That Shatter Traditional Expectations
Number reporting, top 2 boxes, agreement:“From time to time, I like to do things that are dangerous”
45-54 457,000
55-64 379,000
65-74 226,000
Over 1 million like to do things that are dangerous from time to time
Copyright © 2010 The Nielsen Company. Confidential and proprietary.Copyright © 2012 The Nielsen Company. Confidential and proprietary.
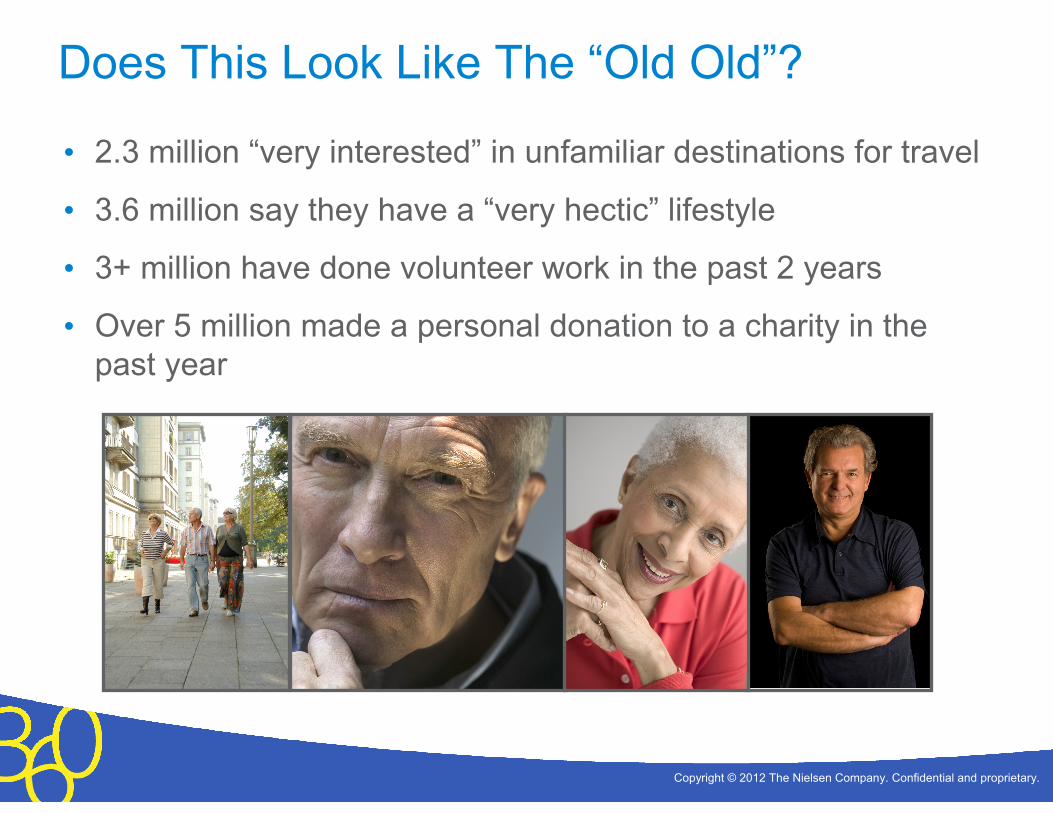
Does This Look Like The “Old Old”?
• 2.3 million “very interested” in unfamiliar destinations for travel
• 3.6 million say they have a “very hectic” lifestyle
• 3+ million have done volunteer work in the past 2 years
• Over 5 million made a personal donation to a charity in the past year

Copyright © 2010 The Nielsen Company. Confidential and proprietary.Copyright © 2012 The Nielsen Company. Confidential and proprietary.
Is There A Common Theme Here?
• The operative word: ENGAGEMENT
• They are not ‘retiring’ on schedule
• They perceive they have plenty of time left
• They want to / intend to remain active, involved
• They are interested in exploring, discovering, reinventing
Copyright © 2010 The Nielsen Company. Confidential and proprietary.Copyright © 2012 The Nielsen Company. Confidential and proprietary.
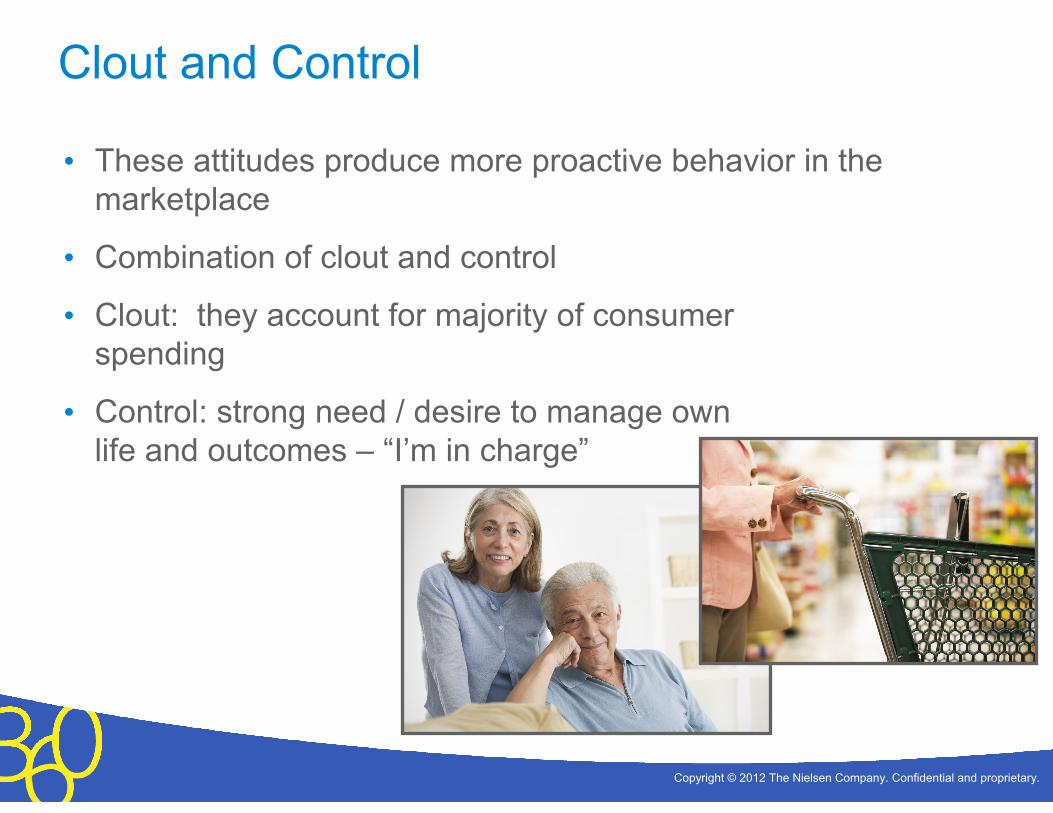
Clout and Control
• These attitudes produce more proactive behavior in the marketplace
• Combination of clout and control
• Clout: they account for majority of consumerspending
• Control: strong need / desire to manage ownlife and outcomes – “I’m in charge”

Copyright © 2010 The Nielsen Company. Confidential and proprietary.Copyright © 2012 The Nielsen Company. Confidential and proprietary.
Market Clout: Home Ownership
• 65% of all homeowners
• 83% of all mortgage-free homeowners
• Largest share of home owners at every resale price point
• Largest spenders on home improvement and renovation

Copyright © 2010 The Nielsen Company. Confidential and proprietary.Copyright © 2012 The Nielsen Company. Confidential and proprietary.
Market Clout: Financial Products and Services
• 66% of all those who personally hold stocks, RRSPs, mutual funds
• 83% of those with total securities and savings over $500,000
• 69% of those who own investment real estate
• 71% of those who have investments outside of RRSPs

Copyright © 2010 The Nielsen Company. Confidential and proprietary.Copyright © 2012 The Nielsen Company. Confidential and proprietary.
Market Clout:Automotive
• Own 60% of all cars
• Buy more new cars than any other age group
– #1 – owning a vehicle valued at more than $50,000
• Buy more used cars than any other age group

Copyright © 2010 The Nielsen Company. Confidential and proprietary.Copyright © 2012 The Nielsen Company. Confidential and proprietary.
Market Clout:Travel
• Largest market for travel to all destinations
– #1 – Travel within Canada
– #1 – Travel to USA
– #1 – Travel to Mexico, Caribbean
– #1 – Travel to Europe
– #1 – Cruises
– #1 – Exotic destinations

Copyright © 2010 The Nielsen Company. Confidential and proprietary.Copyright © 2012 The Nielsen Company. Confidential and proprietary.
Market Clout:Health, Wellness, Beauty
• Totally dominate the market
• Account for 80% of all health care product purchases
• 70% of all OTC purchases
• 74% of all prescriptions
• Leading cosmetics manufacturers have identified this as biggest growth market, have hired “Boomer”spokespeople (e.g. Diane Keaton, Jane Fonda)

Copyright © 2010 The Nielsen Company. Confidential and proprietary.Copyright © 2012 The Nielsen Company. Confidential and proprietary.
The Need / Desire To Control Own Destiny
Three examples:
• Changing the health care system
• Changing the definition of retirement
• Changing the political power equation

Copyright © 2010 The Nielsen Company. Confidential and proprietary.Copyright © 2012 The Nielsen Company. Confidential and proprietary.
Wiping Out The “Traditional”Health Care Model
“Traditional” Health Care Model Emerging Health Care Model
PATIENT• Passive or reactive• Cedes authority to doctor and health
care system• May complain but accepts treatments,
outcomes• Rarely seeks alternatives
CONSUMER• Proactive• Respects doctor, system but sees
self as director of own health• Unwilling to accept bad outcomes• Actively seeks alternatives

Copyright © 2010 The Nielsen Company. Confidential and proprietary.Copyright © 2012 The Nielsen Company. Confidential and proprietary.
Changing The Definition Of Retirement
• Combination of three factors– Longevity (living longer = need
more money for longer)– Need (underfunded for
retirement)– Attitude (work = validation)
• End result – not retiring “on schedule”
• Continuing in the workforce on a full or part-time basis
• This only furthers their degree of being proactive and engaged – as consumers
Employment Rate Of Canadians Age 55+
Employment Rate
20
22
24
26
28
30
32
34
36
1976 1980 1984 1988 1992 1996 2000 2004 2008

Copyright © 2010 The Nielsen Company. Confidential and proprietary.Copyright © 2012 The Nielsen Company. Confidential and proprietary.
Controlling The Ballot Box2008 Canadian Federal Election
• Combination of higher population and higher voter turnout rate
• End result – Zoomers represent about 60% of all votes cast
• Similar percentages apply in the USA
Zoomers59%
35-4419%
25-3414%
18-248%
1,036,8651,913,043
2,553,397
7,843,650
18-24 25-34 35-44 Zoomers

Copyright © 2010 The Nielsen Company. Confidential and proprietary.Copyright © 2012 The Nielsen Company. Confidential and proprietary.
Implications
• Short-term
– Dominant market in key categories – health, travel, money
– Challenging the conventional life-cycle consumer model
– More years of activity, more years of purchasing power
– Brand choices not “locked in”
• Medium- and long-term
– Upsetting the entire life-cycle model
– “Revolution in aging” impacts younger generations, and is changing their behavior as well
Let’s take a closer look…
Copyright © 2010 The Nielsen Company. Confidential and proprietary.Copyright © 2012 The Nielsen Company. Confidential and proprietary.
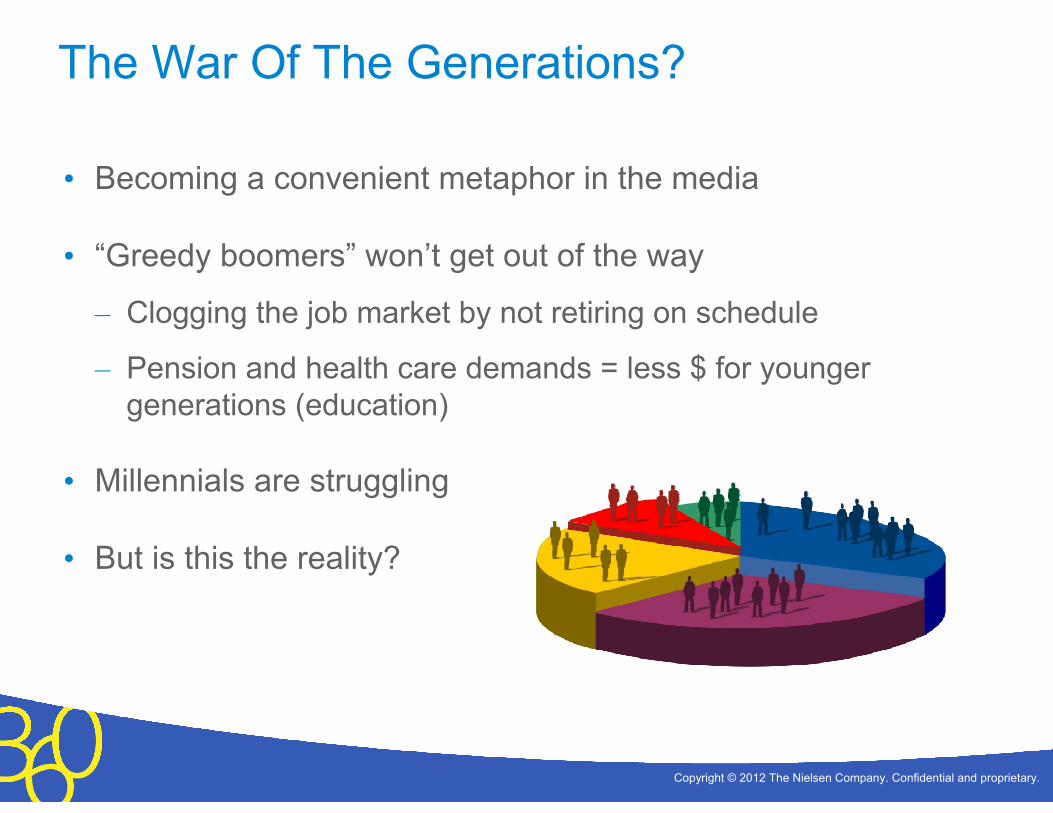
The War Of The Generations?
• Becoming a convenient metaphor in the media
• “Greedy boomers” won’t get out of the way
– Clogging the job market by not retiring on schedule
– Pension and health care demands = less $ for younger generations (education)
• Millennials are struggling
• But is this the reality?
Copyright © 2010 The Nielsen Company. Confidential and proprietary.Copyright © 2012 The Nielsen Company. Confidential and proprietary.
Yes, The Millennials Are Struggling…
• Higher unemployment rates –lower participation in the labourforce
– 15-24 unemployment: Canada, 14%; USA – 18%
• Student debt load in the USA = $1 trillion (higher than the total of credit card debt)
• Youth unemployment rates in Europe much higher (Spain = almost 50%)
Copyright © 2010 The Nielsen Company. Confidential and proprietary.Copyright © 2012 The Nielsen Company. Confidential and proprietary.
…But The Boomers And Seniors Are Solving The Problem
• Funding adult children
• Delaying retirement so as to produce the needed $
• Delaying downsizing of homes
• New trends in family formation and even physical housing

Copyright © 2010 The Nielsen Company. Confidential and proprietary.Copyright © 2012 The Nielsen Company. Confidential and proprietary.
Adult Children Living At Home
Late Boomers, Gen X and Millennials At Similar Stage
Late Boomers (1957-1966)
Generation X (1969-1978)
Millennials(1981-1990)
Number (000) 4,552 4,186 4,663
% age 20-24 50 48 49
% living at home 43 46 73
% age 25-20 50 52 51
% living at home 12 17 30

Copyright © 2010 The Nielsen Company. Confidential and proprietary.Copyright © 2012 The Nielsen Company. Confidential and proprietary.
Financial Assistance From Boomers, Seniors
• Canada (Investors Group, 2010)– 60% of boomers providing financial assistance to adult children no
longer in school– Average $3,675 per year– 10% also providing assistance to aging parents
• USA (VibrantNation.com, 2011)– 59% of boomers providing financial assistance to adult children no
longer in school– 50% were providing housing, 48% were helping with living
expenses– 80% said they were paying more bills than their parents had paid
for them
Copyright © 2010 The Nielsen Company. Confidential and proprietary.Copyright © 2012 The Nielsen Company. Confidential and proprietary.
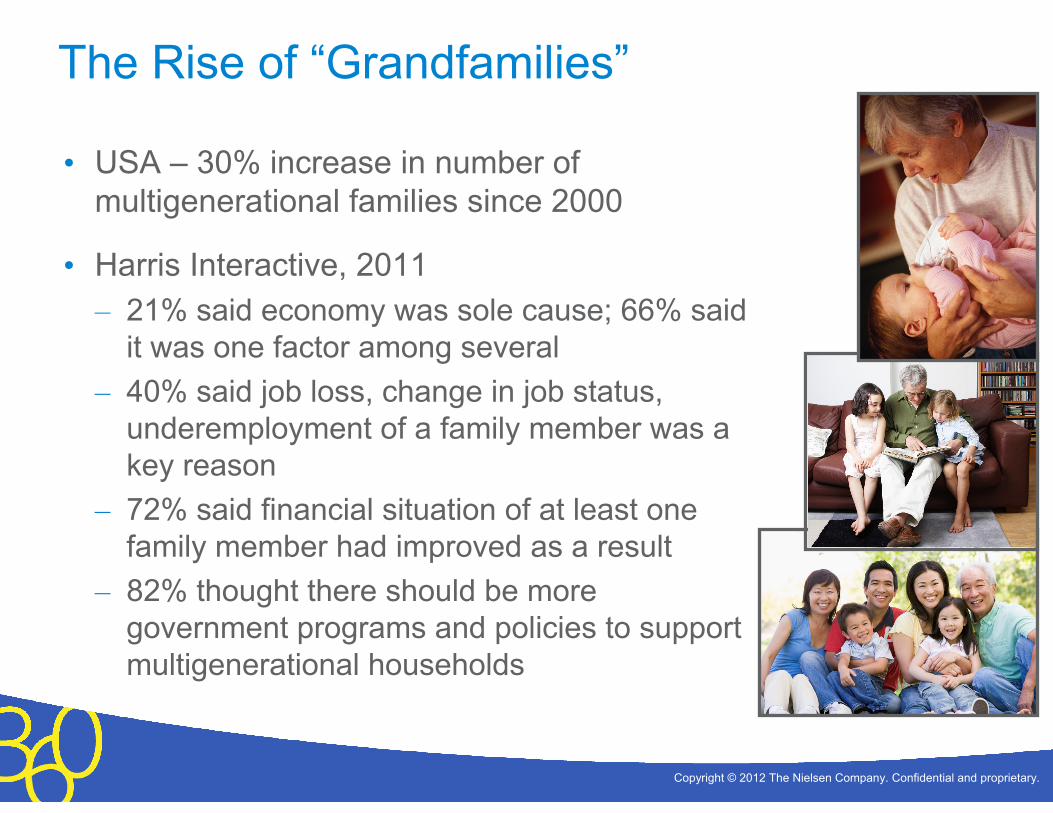
The Rise of “Grandfamilies”
• USA – 30% increase in number of multigenerational families since 2000
• Harris Interactive, 2011– 21% said economy was sole cause; 66% said
it was one factor among several– 40% said job loss, change in job status,
underemployment of a family member was a key reason
– 72% said financial situation of at least one family member had improved as a result
– 82% thought there should be more government programs and policies to support multigenerational households

Copyright © 2010 The Nielsen Company. Confidential and proprietary.Copyright © 2012 The Nielsen Company. Confidential and proprietary.
Dedicated Housing
• Builders starting to recognize this as a niche
• Housing designed from the start for “Grandfamilies” – as opposed to retrofitted “granny flat”

Copyright © 2010 The Nielsen Company. Confidential and proprietary.Copyright © 2012 The Nielsen Company. Confidential and proprietary.
Delayed Adulthood…or The New Norm?
“What makes Generation Y different from all other generations?
They’re getting married later.
They’re having babies later.
They’re buying fewer homes, and living with their parents.”
Copyright © 2010 The Nielsen Company. Confidential and proprietary.Copyright © 2012 The Nielsen Company. Confidential and proprietary.
Implications touch every aspect of marketing and marketing communications
• Consumer life cycle – “expected” behaviors and attitudes, and resultant “expected” purchases may now occur at different times
• Household purchasing patterns and who the “influencers” are
• Size of basket and make-up of basket
• Non-traditional niches and opportunities
THE REVOLUTION IN AGING =
A REVOLUTION IN EVERYTHING

Copyright © 2010 The Nielsen Company. Confidential and proprietary.Copyright © 2012 The Nielsen Company. Confidential and proprietary.
David Cravit
(647) 280-8163
www.davidcravit.com
Copyright © 2010 The Nielsen Company. Confidential and proprietary.Copyright © 2012 The Nielsen Company. Confidential and proprietary.
ZoomerMedia can help!
• Portfolio of online and offline media properties deliver most cost-effective reach
• We understand this market better than anyone, and can work with you to design custom programs that go beyond media solutions and include marketing, messaging and merchandising strategies