The Zacks Rank - Zacks Investment Research estimate revisions are the most powerful force impacting...
21
The Zacks Rank Harnessing the Power of Earnings Estimate Revisions
-
Upload
vuongxuyen -
Category
Documents
-
view
220 -
download
1
Transcript of The Zacks Rank - Zacks Investment Research estimate revisions are the most powerful force impacting...

TheZacksRank
Harnessing the Power ofEarnings Estimate Revisions
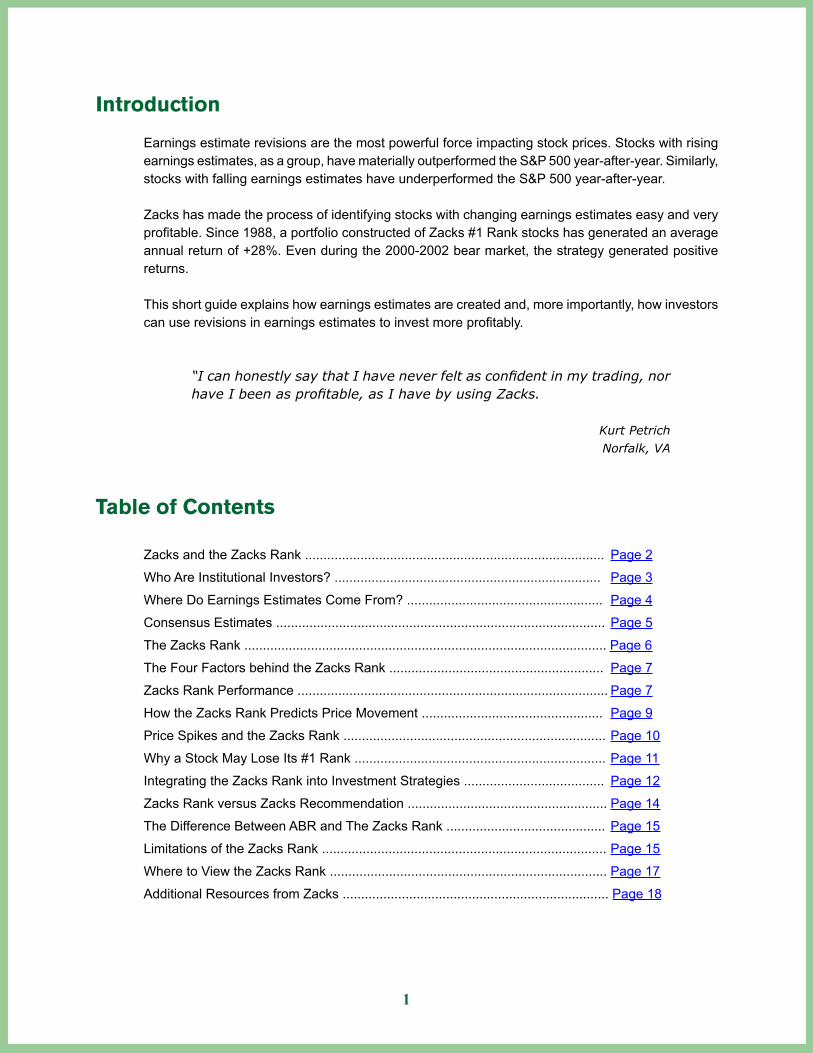
Introduction
Earnings estimate revisions are the most powerful force impacting stock prices. Stocks with rising earnings estimates, as a group, have materially outperformed the S&P 500 year-after-year. Similarly, stocks with falling earnings estimates have underperformed the S&P 500 year-after-year.
Zacks has made the process of identifying stocks with changing earnings estimates easy and very profitable. Since 1988, a portfolio constructed of Zacks #1 Rank stocks has generated an average annual return of +28%. Even during the 2000-2002 bear market, the strategy generated positive returns.
This short guide explains how earnings estimates are created and, more importantly, how investors can use revisions in earnings estimates to invest more profitably.
“I can honestly say that I have never felt as confident in my trading, nor have I been as profitable, as I have by using Zacks.
Kurt PetrichNorfalk, VA
Table of Contents
Zacks and the Zacks Rank ................................................................................. Page 2
Who Are Institutional Investors? ........................................................................ Page 3
Where Do Earnings Estimates Come From? ..................................................... Page 4
Consensus Estimates ......................................................................................... Page 5
The Zacks Rank .................................................................................................. Page 6
The Four Factors behind the Zacks Rank .......................................................... Page 7
Zacks Rank Performance .................................................................................... Page 7
How the Zacks Rank Predicts Price Movement ................................................. Page 9
Price Spikes and the Zacks Rank ....................................................................... Page 10
Why a Stock May Lose Its #1 Rank .................................................................... Page 11
Integrating the Zacks Rank into Investment Strategies ...................................... Page 12
Zacks Rank versus Zacks Recommendation ...................................................... Page 14
The Difference Between ABR and The Zacks Rank ........................................... Page 15
Limitations of the Zacks Rank ............................................................................. Page 15
Where to View the Zacks Rank ........................................................................... Page 17
Additional Resources from Zacks ........................................................................ Page 18
1
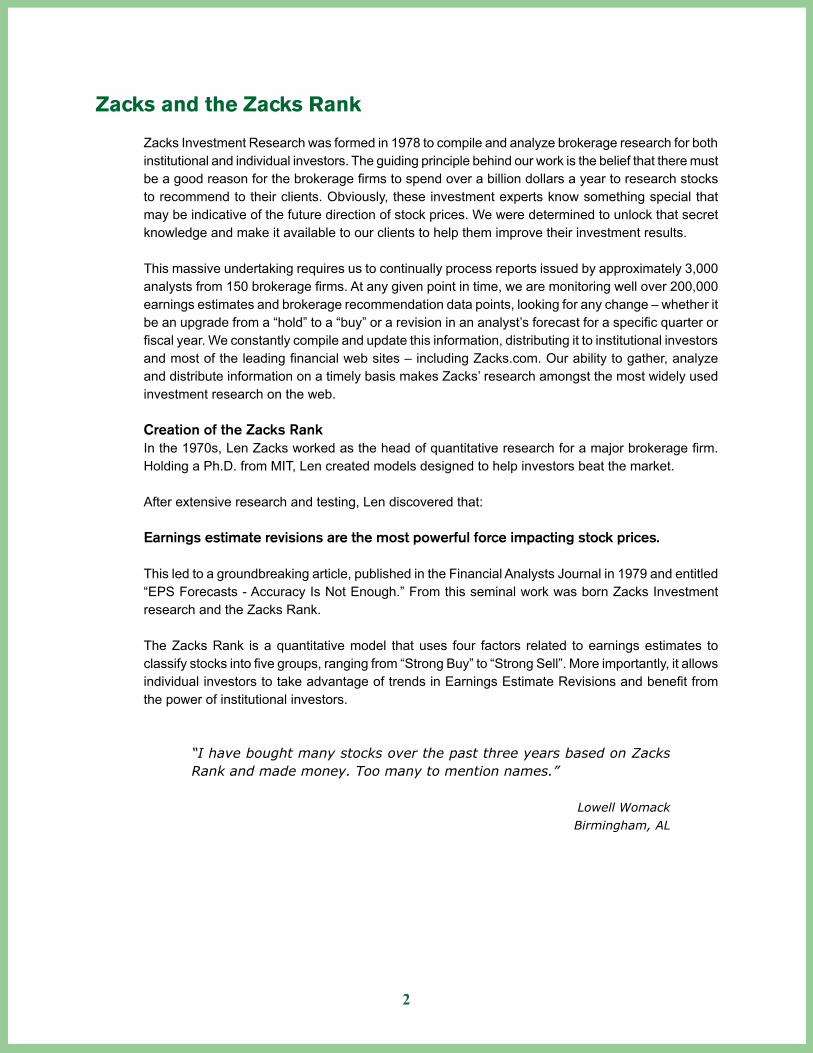
Zacks and the Zacks Rank
Zacks Investment Research was formed in 1978 to compile and analyze brokerage research for both institutional and individual investors. The guiding principle behind our work is the belief that there must be a good reason for the brokerage firms to spend over a billion dollars a year to research stocks to recommend to their clients. Obviously, these investment experts know something special that may be indicative of the future direction of stock prices. We were determined to unlock that secret knowledge and make it available to our clients to help them improve their investment results.
This massive undertaking requires us to continually process reports issued by approximately 3,000 analysts from 150 brokerage firms. At any given point in time, we are monitoring well over 200,000 earnings estimates and brokerage recommendation data points, looking for any change – whether it be an upgrade from a “hold” to a “buy” or a revision in an analyst’s forecast for a specific quarter or fiscal year. We constantly compile and update this information, distributing it to institutional investors and most of the leading financial web sites – including Zacks.com. Our ability to gather, analyze and distribute information on a timely basis makes Zacks’ research amongst the most widely used investment research on the web.
Creation of the Zacks RankIn the 1970s, Len Zacks worked as the head of quantitative research for a major brokerage firm. Holding a Ph.D. from MIT, Len created models designed to help investors beat the market.
After extensive research and testing, Len discovered that:
Earnings estimate revisions are the most powerful force impacting stock prices.
This led to a groundbreaking article, published in the Financial Analysts Journal in 1979 and entitled “EPS Forecasts - Accuracy Is Not Enough.” From this seminal work was born Zacks Investment research and the Zacks Rank.
The Zacks Rank is a quantitative model that uses four factors related to earnings estimates to classify stocks into five groups, ranging from “Strong Buy” to “Strong Sell”. More importantly, it allows individual investors to take advantage of trends in Earnings Estimate Revisions and benefit from the power of institutional investors.
“I have bought many stocks over the past three years based on Zacks Rank and made money. Too many to mention names.”
Lowell WomackBirmingham, AL
2

Who Are Institutional Investors?
People who trade stocks are broadly defined into one of two groups: institutional investors and individual investors. Institutional investors are the professionals who manage the trillions of dollars invested in mutual funds, pension plans, hedge funds, etc. Individual investors, also referred to as “retail investors,” are people who independently invest for their own private accounts.
Institutional investors have a considerably greater ability to influence prices than individual investors. The reason is that institutional investors come to the market with millions of dollars to trade and often buy and sell tens of thousands of shares of a single stock over the course of a trading day. This financial muscle has a material impact on the movement and direction of stock prices.
As an individual investor, you can benefit from the power of institutional investors to increase your investment returns. In order to do this, it is important to understand what motivates institutional investors’ buy/sell decisions.
Stock Valuation ModelsMost institutional investors attended prestigious business schools where they were taught a number of financial models. Many of these models are used to calculate the fair value of a company and of its shares. Almost without exception, these valuation models focus on earnings generated by these companies historically and into the future. The only way to run these models based upon future earnings is through the use of earnings estimates. On the simplest level, it can be understood that if you raise the earnings estimates used in the model (input), then it will create a higher fair value for the company and its stock (output).
For example, an analyst could determine that a stock is worth a multiple of 20 times next year’s earnings (a P/E of 20). If his current estimate calls for earnings of $1 per share, he would recommend buying the stock for any price below $20 (20 x $1 = $20). If the analyst changes his forecast and believes the company will instead earn $1.10 per share, he would then recommend buying the stock for any price below $22 ($20 x $1.10 = $22). As you can see, an increase in the earnings estimates can translate into a higher price for the stock. Thus, it is imperative to learn more about earnings estimates.
3
Where Do Earnings Estimates Come From?
The most widely used source of earnings estimates comes from brokerage or “sell-side” analysts. The term “sell-side” refers to the fact that these analysts’ employers — brokerage firms, are in the business of trying to get investors to trade stocks. When a broker calls a client, he is trying to use the research produced by his arm’s analysts to “sell” the client on trading a stock, thereby generating a commission.
Brokerage analysts typically specialize in a sector or industry, such as software. They are expected to be objective experts for the industries that they cover. However, their earnings forecasts tend to err in being overly conservative because of the influence of corporate executives and pressure from brokerage firm clients, as is explained below.
Company Management:Public companies create financial projections of their future earnings to properly plan for and manage operations. Corporate executives also use these projections to provide a basis to explain to brokerage analysts how they anticipate their company performing in the future. From there, the analysts will layer in some of their own assumptions in order to create an independent earnings estimate (more on brokerage analysts below).
It is not in the best interest of corporate executives to share the most optimistic projections with brokerage analysts, however. A large percentage of executive compensation comes from company stock and stock option plans. Executives realize that if their company reports earnings that are below analysts’ forecasts, almost without exception, the stock price will tumble. This in turn costs them money. Therefore, it is more advantageous for executives to provide brokerage analysts with conservative earnings estimates.
Brokerage Analysts:The job of a brokerage analyst is to issue buy, sell and hold stock recommendations on behalf of their employer. Brokerage firms, in turn, use this research to get clients to buy and sell stocks. To justify their recommendations, analysts usually forecast what companies are expected to earn in the future.
Clients will only act on a brokerage analyst’s recommendation if they think the recommendation will help them make money. The more money a firm’s clients make from a particular analyst’s recommendations, the more valuable the analyst is to the firm. Since analysts issue far more “buy” recommendations than “sell” recommendations, they want to avoid making earnings forecasts that are overly optimistic. The incentive for issuing conservative earnings estimates is that the company has a better chance of reporting earnings that exceed forecasts. In turn, clients will be happy to see the stock’s price rise. Conversely, there is no incentive to issue an earnings forecast that is overly optimistic.
4

Consensus Estimates
For any given stock there may be from 1 to 40 brokerage analysts following the company and making EPS estimates. For more than 25 years, Zacks has been tracking these individual sell-side analyst estimates and creating consensus EPS estimates. The consensus estimate is the average of all the current estimates made available by brokerage analysts. Consensus estimates are more advantageous because they reduce the risk of any single analyst making an incorrect forecast.
Zacks Consensus Estimate = the average of all current EPS estimates
Zacks calculates a consensus estimate for the current quarter, the next quarter, the current fiscal year, the next fiscal year and as a long-term growth rate. These consensus estimates are the benchmark by which the company will be judged by the investment community. A company can:
Meet — report the same earnings as forecast �Beat — report better earnings than forecast �Miss — report worse earnings than forecast �
Missing a forecast is the most dreaded outcome, since it suggests that a company is not performing as well as investors thought. A stock’s price will often tumble in response to an earnings miss.
Estimate RevisionsAlthough the consensus estimate provides a useful measure by which to gauge a company’s performance, changes to earnings estimates may provide even greater value to investors. Leonard Zacks’ 1979 study proved that the stocks most likely to outperform are the ones whose earnings estimates are being raised. Similarly, the stocks most likely to underperform are the ones whose earnings estimates are being lowered.
Individual and institutional investors can (and do) use Zacks Investment Research to find this important information. Every day, Zacks receives research reports from approximately 150 brokerage firms, with many of these firms providing data on a daily or intraday basis. The earnings data and stock recommendations are promptly entered into our database.
5

The Zacks Rank
Given the sheer number of Earnings Estimate Revisions made on daily basis, it can be very difficult to determine which stocks to buy and which ones to avoid. The Zacks Rank solves this problem by helping investors harness the power of earnings estimate revisions to invest more successfully.
The Zacks Rank is a proprietary quantitative model that uses trends in earnings estimate revisions and EPS surprises to classify stocks into five groups:
#1 = Strong Buy #2 = Buy#3 = Hold#4 = Sell#5 = Strong Sell
At all times, the Zacks Rank is proportionately applied to the approximate 4,400 stocks for which sell-side analyst estimates are available. In other words, regardless of how strong the economy is, only the very top 5% of stocks receive the coveted designation of Zacks #1 Rank. More importantly, at all times, approximately the same number of stocks are assigned a Zacks #5 Rank as are assigned a Zacks #1 Rank.
This equality between “Strong Buy” and “Strong Sell” recommendations makes the Zacks Rank a much more reliable indicator than brokerage recommendations. Brokerage recommendations are biased towards buy ratings, with many sell-side analysts reluctant to issue a “sell” recommendation.
Zacks Rank % of Stock UniverseApproximate #
of StocksRecommendation
1 5% 220 Strong Buy2 15% 660 Buy3 60% 2640 Hold4 15% 660 Sell5 5% 220 Strong Sell
The majority of stocks are assigned Zacks Rank #3, meaning their trend in Earnings Estimate Revisions is inline with the overall market.
“I don’t buy a stock unless Zacks says it’s a Strong Buy”
Tim MallyMadison, WI
6

The Four Factors behind the Zacks Rank
The Zacks Rank is calculated from four primary inputs: Agreement, Magnitude, Upside and Surprise.
AgreementThe extent to which all brokerage analysts are revising their EPS estimates in the same direction. The more analysts that are revising estimates upward, the higher the Zacks Rank.
MagnitudeThe size of recent changes in the consensus estimate for the current fiscal year and the next fiscal year. For example, an earnings estimate revision that causes the consensus estimate to increase by 6% is a more powerful signal than an earnings estimate revision that causes a 2% rise in the consensus estimate.
UpsideThe difference between the most accurate estimate and the consensus estimate.
SurpriseWhen the earnings reported in a company’s quarterly or annual report are above or below analysts’ earnings estimates. A company that reports a positive surprise for the most recent quarter is more likely to have a positive earnings surprise in the next quarter as well (and visa versa). The Zacks Rank calculations factor in the last quarter’s EPS surprise.
Every night we recalculate these four factors for the universe of stocks covered by the brokerage analyst community (approximately 4,400 stocks). The four measures are combined into a composite score, which is then used to assign a Zacks Rank.
“The Zacks #1 Rank leads me to stronger stocks.”
Clarence FeinourReading, PA
Zacks Rank Performance
Following the Zacks Rank has proved to be very profitable. Since 1988, a portfolio constructed of Zacks #1 Rank stocks has generated an average annual return of +28%. Comparatively, the S&P 500 has only returned +9% over the same period.
7

Zacks Rank - Annual Returns
Year #1 Rank #2 Rank #3 Rank #4 Rank #5 Rank S&P 5001988 37.46% 29.69% 20.79% 19.13% 18.39% 16.20%
1989 36.09% 26.84% 15.85% 9.55% -5.10% 31.70%
1990 -2.97% -13.69% -21.32% -23.85% -34.71% -3.10%
1991 79.79% 56.80% 45.98% 36.60% 34.35% 30.40%
1992 40.65% 29.63% 18.04% 12.24% 17.31% 7.51%
1993 44.41% 26.86% 14.78% 8.59% 9.54% 10.07%
1994 14.34% 5.15% -3.56% -11.14% -10.90% 0.59%
1995 54.99% 46.84% 30.63% 17.35% 9.11% 36.31%
1996 40.93% 28.60% 16.07% 7.71% 8.02% 22.36%
1997 43.91% 33.87% 22.93% 10.17% 3.05% 33.25%
1998 19.52% 12.92% -3.47% -8.77% -14.84% 28.57%
1999 45.92% 35.53% 31.02% 18.46% 17.69% 21.03%
2000 14.31% -1.47% -17.75% -19.52% -3.95% -9.10%
2001 24.27% 11.70% 14.09% 17.93% 20.20% -11.88%
2002 1.22% -14.51% -19.39% -23.50% -17.59% -22.10%
2003 74.74% 71.02% 66.69% 57.34% 55.99% 28.69%
2004 28.79% 23.26% 18.51% 11.92% 16.63% 10.87%
2005 17.97% 12.01% 6.54% -1.31% -5.08% 4.90%
2006 23.69% 26.63% 18.09% 15.17% 16.88% 15.80%
2007 19.91% 5.42% -4.34% -13.06% -23.90% 5.49%
2008 -41.13% -43.48% -48.70% -45.75% -50.95% -37.00%
2009 66.87% 82.46% 78.42% 59.91% 49.18% 26.46%
2010* 28.15% 35.04% 27.89% 29.28% 27.18% 15.06%
Annual Average 28.07% 19.61% 10.73% 5.09% 2.75% 9.65% *2010 results are for the period of Jan 1 - Dec 31, 2010
8
Zacks #1 Rank vs. S&P 500$10,000 Starting Equity
Results are through December 31, 2010
Zacks #1 Rank$2.9 Million
S&P 500$83,261
$10,000Initial Investment
$0
$500,000
$1,000,000
$1,500,000
$2,000,000
$2,500,000
$3,000,000

How the Zacks Rank Predicts Price Movement
The Zacks Ranks does not influence price movement, it simply alerts investors to changes in expectations that may result in price movement. To better understand how the Zacks Rank can identify stocks likely to experience price movements in the next 1-3 months, consider the imaginary company XYZ Corporation.
Step 1: Brokerage Analysts Upwardly Revise Earnings EstimatesAnalysts sense positive momentum in XYZ’s business. Perhaps the analysts saw bullish trends in the latest earnings report or perhaps the company’s management was unusually upbeat in a recent meeting. Regardless of the reason, the analysts are convinced that earnings in future quarters are going to be higher than they previously anticipated. As a result, the analysts issue new reports with upwardly revised profit expectations. This new information is sent to institutional investors, individual brokerage clients and to Zacks.
Step 2: Daily Updating of the Zacks Rank - Your Personal SignalEvery night, the Zacks Rank is recalculated for the entire universe of stocks covered by analysts. A value is assigned to every stock based on the scores of the four factors described above and a new rank is assigned. This process takes into account the upward revision in XYZ’s earnings expectations and, as a result, XYZ is assigned a #1 Rank. Zacks Premium subscribers can see the most current signal before market open every morning.
Step 3: Institutional Money Starts Flowing into the StockInstitutional investors (mutual funds, pension plans, money managers, etc.) have the greatest buying power to influence a stock’s price. Most of these institutional investors employ valuation models that use earnings estimates as a prime component. Thus, when they receive new research from the sell-side brokerage analysts stating that EPS estimates are going up for XYZ, their opinion of XYZ improves. (The higher earnings estimate makes the stock appear to be more of a bargain). As result, institutional investors want to purchase more shares of XYZ for their portfolios. However, since they have so much money to spend and do not want to run up the price on themselves, they end up accumulating shares over the coming weeks and months. This can give the individual investor time to sneak in ahead of the institutions to reap the rewards of the rising share price.
Step 4: Momentum & Technical Analysis Investors BuyThere is a vast legion of investors who employ charting and quantitative models that look for trends like a rising share price and a corresponding increase in daily trading activity to spot winning stocks. In general, they believe that a stock on the rise will continue its ascent over the short-term. Therefore, given the impetus in the stock price and volume from the institutional investors in Step 3, these momentum and technical analysis investors may jump on board XYZ for a short-term profit and drive the price even further.
Step 5: Earnings SurpriseNothing catapults a stock faster than a strong earnings surprise and the Zacks #1 Rank helps to identify those stocks that are most likely to issue a positive earnings surprise. The reason is that two of the four factors used in the Zacks Rank look for stocks with the strongest potential to post a positive earnings surprise (Upside and Surprise). In the case of XYZ, a very bullish earnings report could send the stock’s price even higher.
9
Step 6: Rinse and RepeatIf indeed XYZ Corporation posted an upside earnings surprise and gave solid guidance for the future, then it is very likely that this positive cycle will start all over again at Step 1. This “earnings momentum” effect is how the short-term benefits of the Zacks Rank begins to carry over into a major benefit for long-term investors.
“Most of the stocks I bought as ones or twos I’m still holding.”
Jerome ‘Skip’ GarrisonCadiz, KY
Negative Earnings RevisionsIf earnings estimates are declining, a six step process resulting in potential downward price movement occurs:
An analyst senses negative business momentum and lowers his estimates. 1. A Zacks Rank of #4 or #5 is assigned, alerting investors, such as yourself, that earnings 2. estimates are declining. Institutional investors enter in the new information into their valuation models and view 3. the stock as being less attractive. As a result, they sell their shares. Active traders, who rely on technical analysis, notice the weakness in the price and sell 4. the stock short. The company issues a disappointing earnings report, causing even more investors to 5. sell the stock. If the company provides more bearish information, analysts lower their forecasts, 6. restarting the process again.
Price Spikes and the Zacks Rank
Quite often stocks are designated Zacks #1 Rank after a run up in price. Although, price changes are not calculated as part of the Zacks Rank, events that typically cause a rise in share price also spur increases to the Zacks Rank.
When positive earnings news is released for a company, whether it be a bullish earnings report or a favorable news announcement, a stock can immediately jump in price. Depending on how quickly brokerage analysts revise their estimates, the Zacks Rank may not improve until a day or more after the news was released. This may make it seem that the Zacks Rank is a lagging indicator. Yet even with this slight time delay, we have proven since the inception of the Zacks Rank that these stocks continue to outperform the market over the next 1-3 months.
Here’s why.
10

If a company announces a strong earnings outlook, then speculative investors often quickly react by bidding up the stock price. At the same time, analysts speak with the company’s executives and revise their earnings estimates based on the new information. It may take the analysts up to a week to release their new estimates. Since the Zacks Rank is based on analysts’ estimates, the Zacks Rank does not change until the new estimates are released by the analysts and added to Zacks’ database.
Institutional investors receive the new brokerage reports at the same time as Zacks and factor the revised earnings estimates data into their valuation models. Based on the new data, these large investors perceive the stock as being undervalued relative to its revised growth prospects and decide to buy more shares. However, since institutional investors have so much money to spend, they gradually purchase the stock over a period of several weeks and months. (This is often described as “Accumulation”).
Traders who rely on technical analysis (charting) notice the upward price movement and increase in volume for the stock caused by strong demand among institutional investors. These traders spot the trend and begin buying shares in hopes of generating short-term profits.
Our research and the +28% average annual return generated by Zacks #1 Rank stocks (many of which were upgraded to #1 Rank after the initial spike in price) shows that positive earnings revisions are often more than just one-time events. Rather, a company that reports a positive earnings surprise and experiences positive Earnings Estimate Revisions is likely to continue to do so in the future. And since the Earnings Estimate Revisions are the most powerful force impacting stock prices, the stock has a good chance of appreciating even more in the future.
Why a Stock May Lose Its #1 Rank
The Zacks Rank is a timeliness indicator that is assigned in constant proportions across the coverage universe. Only 5% of stocks can have a Zacks #1 Rank Strong Buy rating at any given time. Furthermore, the Zacks Rank is calculated on a daily basis, to ensure the most current information is evaluated. This combination of exclusivity and constant updates means that a stock can lose its #1 Rank.
Most investors understand why negative estimate revisions will lower the Zacks Rank of a stock. However, it is not so obvious why a company with positive estimate revisions may lose its #1 ranking. The key to understanding this concept is to realize that the Zacks Rank is a relative indicator. A stock’s rank is determined by how it compares to all other stocks in the Zacks Rank universe. This comparison is based on both the size and timing of Earnings Estimate Revisions. Specifically, a stock’s Zack Rank can change based on any of the following factors:
More positive revisions to other stocks – Remember that only 5% of stocks can have a �Zacks Rank of #1 at any given time (approximately 220 stocks). Let’s say that yesterday stock XYZ had a Zacks Rank of #1. If today there are 220 or more stocks with stronger earnings estimate revisions, then XYZ will be bumped from its #1 standing and become a #2 Rank stock. Note that a Zacks Rank of #2 is still a Buy that has historically outperformed the market.
11

Timeliness of Data – two of the four factors used to calculate the Zacks Rank employ a �60-day window to review changes in estimates (Agreement and Magnitude). Suppose that analysts revise their earnings estimates for stock XYZ and the consensus moves up from $1.00 to $1.20 per share. The Magnitude piece of the equation would show a positive revision of 20% when comparing the current estimate to the estimate from 60 days ago. This will most likely prompt the stock to rise to a Zacks Rank of #1. If no other revisions are made over the next two months, then the current and 60-day old consensus will both read $1.20 per share, which equals no change in Magnitude. This, in turn, should lower a stock’s rank, especially if estimates are being revised upwards for other stocks.
No Earnings Surprise – If a company meets expectations then it will not score very high �on the Surprise element of the Zacks Rank. Although meeting estimates is something shareholders should be pleased about, merely reporting earnings that are inline with forecasts often is not enough to sustain a Zacks Rank of #1 or #2. This is particularly the case if there are multiple other companies that are exceeding earnings expectations.
Integrating the Zacks Rank into Investment Strategies
The Zacks Rank works well with all investment strategies and can even help improve performance. Here are suggestions on how to use the Zacks Rank with growth, value, buy and hold and momentum/short-term strategies.
Growth InvestingGrowth investors are generally more aggressive in nature. They are looking for companies with high earnings growth potential, which should propel their stock price in the future.
By concentrating on Zacks #1 Rank stocks, growth investors can easily screen for companies exhibiting these stellar growth rates. The best part of the Zacks Rank is its ability to alert investors, at the earliest stages, that a company’s prospects are looking very bright. And getting in early on an emerging growth story generally leads to strong investment returns. Just as importantly, the Zacks Rank notifies investors at the first sign of weakness (Zacks Rank of #4 or #5), providing the opportunity to lock-in profits and avoid unnecessary losses.
Value InvestingValue investors seek out stocks selling at prices below “fair value”. Many value investors rely on earnings measures like the P/E (price/earnings) multiple or the PEG ratio (PE divided by growth rate) to determine whether a stock is trading at an attractive valuation.
The key for value investors is earnings, which is the basis of most valuation models. When the Zacks Rank signals a “strong buy” or “buy” (#1 or #2), earnings estimates for a stock are rising. Given this new information, other investors will likely view the stock as being undervalued relative to its future prospects. So, they jump in to run up the price of the stock. The beauty of the Zacks Rank is that it is also a timeliness indicator, meaning that value investors can use it to identify precisely when
12
company’s prospects are beginning to improve as opposed to waiting and waiting for business conditions to improve.
Value investors should plan on holding onto a stock as long as its Zacks Rank remains #3 or higher, and other characteristics remain attractive, to maximize the upside returns.
Buy and Hold/Long-Term InvestingInvestors following a buy-and-hold strategy seek to limit portfolio turnover by holding onto a stock for a year or longer. They seek a company of value and virtue, which they believe will consistently report solid earnings that will continue to push the share price ever higher. The key ingredients for a buy-and-hold investor are the fundamentals such as earnings growth, strong management/leadership, excellent products and competitive strategy.
What is the most tangible proof that a company is worth holding for the long-term? Earnings and earnings growth. A company that has strong management and excellent products should be producing a steady stream of positive Earnings Estimate Revisions. Here again earnings estimate revisions are the cornerstone of the Zacks Rank. Whenever you find positive earnings revisions, you will generally find a company moving in the right direction that is a candidate for long-term ownership. Therefore, buy-and-hold investors should seek out attractively priced Zacks #1 or Zacks #2 Rank stocks. A decline in the Zacks Rank to #4 or #5 can be an early warning that business conditions are worsening and therefore that it is time to take profits.
Momentum/Short-Term TradingThe Zacks Rank is the best friend to folks who rely on technical analysis and momentum because it can tip them off before most other systems. Rather than simply looking for price trends, the Zacks Rank is about “cause and effect”. The cause of the move is positive revisions in earnings estimates. This upward shift in earnings estimates prompts more and more investors to take an interest in the company with the effect being that the shares in the company start on a bull run. Volume increases, as does the stock price.
Simply relying on technical analysis often doesn’t alert investors until after the move has already begun, costing active traders opportunities to maximize profits. Conversely, by focusing on Earnings Estimate Revisions, the Zacks Rank alerts can identify stocks that are likely to move upward in the future – before the breakout has occurred! In other words, the Zacks Rank helps traders get in ahead of the action. (To see why this is the case, reread Step 4 of “Zacks Rank in Action - What Causes Stocks to Rise”).
Momentum and Technical Analysis investors should concentrate on Zacks #1 Rank stocks with the intention of selling any stock that drops to Zacks Rank #2 or lower.
“I pay a lot of attention to sell recommendations from Zacks to dump stocks before they go bad.”
LeRoy L. LynnLaramie, WY
13

Zacks Rank versus Zacks Recommendation
Zacks Investment Research has two powerful stock rating systems: the Zacks Rank, which you have been reading about, and the Zacks Recommendation. Each provides valuable insights into the future profitability of a stock and can be used separately or in combination with each other depending on your investment style.
As you now know, the Zacks Rank is a short-term rating system designed to predict price movements over the next 1-3 months. The Zacks Rank universe covers approximately 4,400 stocks.
The Zacks Recommendation was created as a system to provide superior long-term recommendations on the same group of 4,400 stocks. The Zacks Recommendation compliments the Zacks Rank by effectively predicting price movements over periods of six months or longer.
The philosophy at Zacks is that quantitative models, like the Zacks Rank, can predict stock prices more accurately than individual analysts. However, we recognize that quantitative models are most effective when they are employed by analysts who have deep fundamental knowledge of the company and its industry. Zacks Recommendations provide that best of both worlds approach given the usage of both a quantitative model and equity analysts.
Quantitative Recommendations: � The Zacks Recommendations are built on top of the Zacks Rank. This new quantitative model that has proven to be extremely profitable for long-term stock selection. For all stocks covered by the Zacks Rank, a quantitative Zacks Recommendation is also calculated. Zacks Premium subscribers can see the quantitative Zacks Recommendation for all stocks not covered by Zacks Equity Research analysts on Zacks.com.
Analyst Recommendations: � The Zacks Equity Research division employs a team of 50 analysts to make hand-picked stock recommendations (aka Analyst Recommendations). These analysts are fully versed in the benefits of earnings estimate revisions and how that is harnessed through the Zacks Rank and the new long-term quantitative model. Each analyst has the ability to override the quantitative recommendations for the 1150 stocks that they follow. Analyst recommendations, and their commentary, are available to Zacks.com subscribers.
Why allow the analysts to override the quantitative model? First, because there are often factors such as valuation, industry conditions and management effectiveness that a trained investment professional can spot better than a quantitative model. Second, and most importantly, Zacks Equity Research analyst recommendations have overall outperformed the model in the cases where they have overridden the quantitative recommendations.
The Zacks Recommendation is broken down into three Levels; Outperform, Neutral and Underperform. Unlike most Wall Street firms we have an excellent balance between the number of Outperform and Underperform recommendations. More importantly, our performance is stellar.
14
Which Stock Rating is Right for You?The short answer is that it depends on your investment time horizon. If you are a short term trader, then the Zacks Rank with its 1-3 month outlook is most appropriate. If you are a long-term investor, then best for you to turn to the Zacks Recommendations that is meant for a 6+ month time horizon. You might also want to search for stocks that are highly rated by both systems.
The Difference between Average Brokerage Recommendation (ABR) and the Zacks Rank
Zacks provides the average brokerage recommendation (ABR) for thousands of stocks for most of the leading investment web sites. The ABR is the calculated average of the actual recommendations (strong buy, hold, sell etc) made by the brokerage firms for a given stock. The ABR is typically displayed with decimals (e.g. 1.52) versus the Zacks Rank, which is only shown in whole numbers (e.g. 1, 2, 3, etc.)
Although the ABR is displayed in a range of 1-5, it should not be confused as having any similarity to the Zacks Rank. The ABR is solely based on brokerage recommendations. Analysts employed by brokerage firms have been and continue to be overly optimistic with their recommendations. For every “Strong Sell” recommendation, brokerage firms assign FIVE “Strong Buy” recommendations. Although brokerage recommendations may have some value, on average, they have not proven to be successful in directing investors to the stocks with the highest probabilities of rising in price.
In comparison, the Zacks Rank is applied proportionately across the universe of all stocks for which brokerage analysts provide earnings estimates for the current year. At all times, the same number of Zacks #1 (“Strong Buy”) and Zacks #5 (“Strong Sell”) rankings are assigned. Further, Zacks #1 Rank stocks have generated an average annual return of +28% since 1988 versus just +1% for the Zacks #5 Rank stocks. In other words, the Zacks Rank will help you identify the winners and avoid the losers in all market conditions.
“I bought several stocks that appeared in the Number 1 listing that I continue to hold as ‘core holdings’”
Robert TaylorEdisto Island, SC
Limitations of the Zacks Rank
For as powerful an investment tool as the Zacks Rank is, it is by no means fool proof. Below are listed the main limitations of the Zacks Rank. Without considering these potential shortfalls, it is possible to make investment decisions that are not suitable for your long-term goals or risk tolerance. Please make sure that you understand this section fully before using the Zacks Rank to enhance your investment returns.
15

Performance Relative to the MarketThe movement of the overall market plays a large role in determining how stocks will perform. As such it is very difficult for a stock to rise in the face of a bear market. We can see countless examples of this happening during the market downdraft since 2000. Thus, it is better to think of the Zacks Rank as an indication of a stocks relative performance to the overall market. For example, if the market is tumbling down then a #1 Rank stock will most likely be down, but not as much as the overall market. And when the overall market is up, then a #5 Rank stock may very well be up, but not to the same degree as the average stock. Yet it is interesting to note that the Zacks #1 Rank stocks overall did produce profits in 2000, 2001 and 2002 (+14.3%, +24.3% and +1.2% respectively during this bear market stretch.)
Short-Term IndicatorWith approximately two decades of data behind us we know conclusively that the effects of earnings estimate revisions are good for a 1-3 month time frame. This makes sense when you consider that every three months a company will provide a new round of earnings that wipes the slate clean on any previous announcements. Yet, even long-term investors get caught up with the fever for wanting to own just #1 Rank stocks. Unfortunately being long-term and a #1 Rank zealot are not compatible. Remember that only the top 5% of companies receiving positive estimate revisions in the last 60 days will be a Zacks #1 Rank stock. There is pretty stiff competition for those slots in the top 5% and a company can be on today and be off tomorrow if another company receives stronger estimate revisions. However, that company that slipped out of the #1 Rank position may still be an excellent investment. So, long-term investors should be comfortable with ownership of shares that have Zacks Ranks between 1-3. Then use any slippages to #4 or #5 to trim or completely sell your position in the stock. Market Cap BiasThe larger the company, the more analysts are likely to cover the stock. The more analysts cover the stock, the tougher it is for the stock to score big on any of the four measures of the Zacks Rank. Thus, the list of Zacks #1 Rank stocks will be over represented by small- to mid-cap stocks. That is why a Zacks #2 Rank large-cap stock is actually a very good thing and one with a Zacks #3 Rank may still provide excellent upside potential relative to the overall market. Remember to keep a diversified portfolio that includes a mix of stocks by market cap and by industry.
Too Many Speculative StocksEarnings for speculative stocks (such as technology, internet and bio-tech) are the hardest to predict. That’s because small companies make up the bulk of the speculative stock universe and due to their size they do not get as much coverage by brokerage analysts. Further the uniqueness of their product lines makes revenue and profit predictions very difficult. When things go well for these companies, then the above attributes lead to exceptionally high scoring for the Zacks Rank. So, those who strictly adhere to buying #1 Rank stocks may end up having a disproportionate number of small growth companies in the tech, internet and bio-tech industries. This creates a lot of volatility depending on how the market likes these sectors at any given time. Here again, the need to keep a diversified portfolio should always outweigh an investors desire to blindly invest in #1 Rank stocks because you do not want to be severely over-weighted in any one sector. Blind to Everything, But Four MeasuresThere are only four measures used to calculate the Zacks Rank. Three of the four measures look at analyst earnings estimate revisions; Agreement, Magnitude and Upside. The fourth measure
16

considers the size of the most recent earnings surprise. You will note there is no accommodation for other fundamental metrics such as P/E, book value, ROE, ROA, debt ratios, growth rates, etc. Nor does it consider technical attributes such as recent changes in price or volume. Thus, in reality the Zacks Rank acts as an initial filter that provides a raw list of potentially successful investment candidates. With these raw lists you can do additional research according to your own investment criteria.
Where to View the Zacks Rank
In many cases, the Zacks Rank is the earliest possible signal investors will receive about the future potential of a stock. This profitable signal allows investors to focus on companies with the most positive earnings momentum and avoid those companies whose future earnings and share price, may be disappointing. Zacks offers multiple ways to both track the Zacks Rank on individual stocks and use this valuable indicator to find new investment opportunities.
Tracking the Zacks Rank for Individual StocksStock Quotes – Find the Zacks Rank for your stocks at any time through our quote page.
Portfolio Tracker and Daily Email Updates – Want to track changes in the Zacks Rank for your stocks? Then set up a personal portfolio on Zacks.com. Once you are registered you will also start receiving our Daily Email Updates giving you all the vital information you need to monitor your stocks including:
Zacks Rank Changes �Zacks Recommendation Changes �Earnings Estimate Revisions �Brokerage Recommendation Changes �More �
To get started go to Zacks.com and click on the “Portfolio” tab. In the upper left hand corner is the link to register.
17

Using the Zacks Rank to Find Investment IdeasZacks #1 Rank List – See the entire listing of all Zacks #1 Rank stocks with positive earnings estimate revisions and earnings surprise details.
Zacks #5 Rank List – See the entire listing of all Zacks #5 Rank stocks with negative earnings estimate revisions and earnings surprise details.
Zacks Industry Rank – Identify the industry groups with the most positive earnings estimate momentum and find the best stocks within those groups.
Zacks Rank Buys – Each day, the analysts at Zacks.com highlight Zacks Rank stocks for each of four primary investment strategies: Aggressive Growth, Growth & Income, Momentum and Value.
Custom Screener – This online screening tool allows investors to search for stocks using the Zacks Rank plus any combination of over 130 attributes.
Profit Tracks – These are pre-built stock picking strategies designed to outperform the markets in the years ahead. Several of these strategies use the Zacks Rank, including Recent Price Strength and PEG Ratio, which generated compounded returns of +28.8% and +21.2% in 2007, respectively.
Zacks Rank Home – Get access to all of these tools and more at the Zacks Rank Home page: http://at.zacks.com/?id=2958.
Additional Resources from Zacks
The Zacks Rank is just one of the many powerful tools that Zacks offers to help investors profit. Here is a sampling of some of our most popular tools.
Profit From the ProsZacks “Profit from the Pros” e-mail newsletter offers continuous coverage of Zacks #1 Rank stocks and highlights those stocks poised to outperform the market. In addition, you’ll receive market insight from those few experts who can truly help you be more successful. Subscribe to this free newsletter today.
Research WizardThis powerful screening and backtesting software puts you in control of your investment strategy. Use the same tool professional stock pickers use to find winning stocks in any market. Learn more...
Chart Patterns Trader Stock screening and chart patterns expert Kevin Matras combs through the best Zacks stock-picking strategies averaging +50%, +60%, and even higher yearly gains. He finds stocks with charts showing they are ready to skyrocket. Learn precisely when to buy and sell.
18

Home Run Investor (NEW)Zacks’ long-term investor service targets under-the-radar companies with over-the-top +50%, +100%, +200% potential. But it’s ever watchful to prevent strike-outs by cutting losers and providing diversity. The key is pinpointing strong Zacks Rank companies with potential to grow past the normal one-to-three-month profit zone. Learn more...
Momentum TraderMomentum strategy blends Zacks Rank fundamental with technical analysis to find almost unstoppable stocks. Institutions are just beginning to pour money into these surging companies, and backtesting shows such stocks gain even when the market loses. Learn more...
Options TraderKevin Matras infuses options trading with the +28% yearly gain power of the Zacks Rank plus his own market-beating stock screens. This creates the potential for steady and substantial returns using only a fraction of the money you would have risked on regular stock purchases. Learn more...
Reitmeister Trading Alert The Reitmeister Trading Alert is Zacks’ answer to the recession. It uses the power of the Zacks Rank, combined with value trading and a dash of market timing, to generate profits no matter what the market has to offer. Learn more...
Small Cap TraderA research breakthrough identified the small fraction of Zacks #1 Rank stocks that nearly DOUBLES the performance of those Strong Buys as a whole. Only a few investors can be admitted to Zacks’ most exclusive service, and share these relatively low-volume stock picks. Learn more...
Turnaround Trader No stocks are harder to find. No strategy was harder to develop. But Zacks researchers can now detect true turnarounds that have suddenly leapfrogged from low Zacks Ranks to the highest #1 Strong Buys. When this signal is filtered with valuation and growth factors. It unearths rare gems that outgain the full #1 list by more than 2 ½ times. Learn more...
Ultimate TraderZacks is unlocking the Vault, allowing full access to our most coveted secrets. This opportunity reveals Zacks’ exclusive stock picks and insights, from trading services that, during 2010’s volatile market, have already produced 84 double-digit winners. Learn more...
Value TraderCombines traditional value investing signals with Zacks Rank timeliness to drive striking performance in both Bull and Bear markets. Learn more...
Whisper TraderZacks has discovered the Stock-Picker’s Holy Grail. Whisper Trader is the long-sought way to take the surprise out of earnings reports. Using only the most accurate analyst whispers, this model targets positive surprises with 77.96% accuracy. Tests show that over the past ten years, through two recessions, its signals would have averaged a yearly gain of +62.1%. Learn more...
19

Zacks Method for Trading Learn how to use the Zacks Rank even more effectively than professional fund managers, with simple step-by-step instruction. Learn more...
Zacks Top 10 Stocks This annual stock portfolio provides the best group of 10 stocks to invest in during the year. The list is announced in January each year. We start with the Zacks Recommendation – a market-crushing measurement for long-term success – and use a nine-step process to hand-pick the 10 stocks you should buy and hold all year for effortless profits.
The 2010 edition is now available: click here.
“Thank you for the paramount work.”
Pierre van GALENMons, Belgium
Performance information for Zacks’ portfolios and strategies is available at: http://www.zacks.com/performance.
The S&P 500 Index is a well-known, unmanaged index of the prices of 500 large-company common stocks, mainly blue-chip stocks, selected by Standard & Poor’s. The S&P 500 Index assumes reinvestment of dividends but does not reflect advisory fees. An investor cannot invest directly in an index.
20